Embed Size (px)
Citation preview
SimBuild2010
Fourth National Conference of IBPSA-USANew York City, New York
August 11 – 13, 2010
160
EXPERIMENTAL AND NUMERICAL COMPARISON OF HEAT TRANSFER IN ANATURALLY VENTILATED ROOF CAVITY
Adrien Brun1, Etienne Wurtz1, and Daniel Quenard2
1LOCIE,CNRS FRE 3220, INES-RDI, Universite de Savoie, Le Bourget du Lac, France2Centre Scientifique et Technique du Batiment (CSTB), 38400 St-Martin dHeres, France
ABSTRACTTimber-frame structures can be built with a closed ca-
vity or an open naturally ventilated cavity (Open Cavity,OC). An open cavity reduces the risk of moisture dama-ging the structure. OCs are generally not considered inthermal behavior simulation software, although there ismuch research that shows it can improve thermal com-fort. The aim of this work is to develop a numerical mo-del for a naturally ventilated cavity that is also sufficientlyaccurate for year-long thermal simulation in buildings. Tothis end, we built a full-scale experimental setup consis-ting of two identical rooms (the same dimensions, orien-tation, material etc.) in order to compare, under real cli-matic conditions, an unventilated cavity (Closed Cavity)with a naturally ventilated one (OC). The experimentalsetup was installed at the scientific and technical buil-ding research center (CSTB) in Grenoble (France). Theexperimental results were used to validate and improvea simple mathematical model. The numerical simula-tions were carried out with SPARK (Lawrence-Berkeley-National-Laboratory and Ayres-Sowell-Associates 2003).
INTRODUCTIONIn the literature, a number of works demonstrate the im-
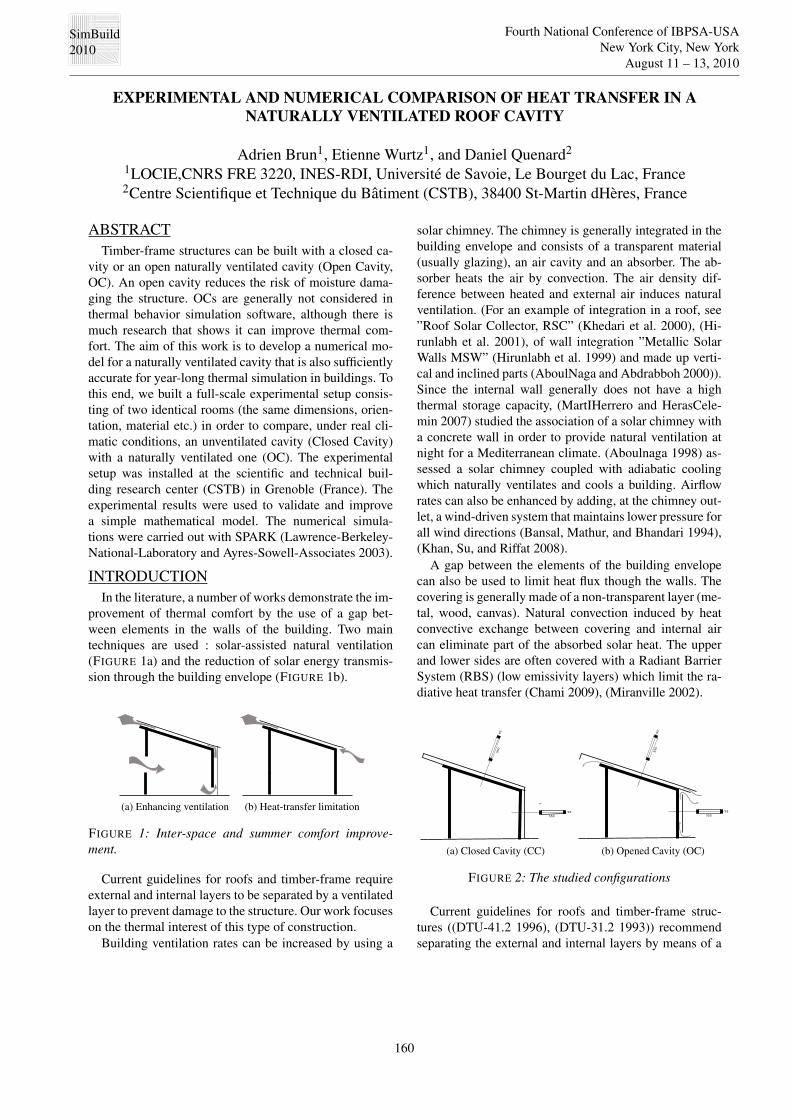
provement of thermal comfort by the use of a gap bet-ween elements in the walls of the building. Two maintechniques are used : solar-assisted natural ventilation(FIGURE 1a) and the reduction of solar energy transmis-sion through the building envelope (FIGURE 1b).
(a) Enhancing ventilation (b) Heat-transfer limitation
FIGURE 1: Inter-space and summer comfort improve-ment.
Current guidelines for roofs and timber-frame requireexternal and internal layers to be separated by a ventilatedlayer to prevent damage to the structure. Our work focuseson the thermal interest of this type of construction.
Building ventilation rates can be increased by using a
solar chimney. The chimney is generally integrated in thebuilding envelope and consists of a transparent material(usually glazing), an air cavity and an absorber. The ab-sorber heats the air by convection. The air density dif-ference between heated and external air induces naturalventilation. (For an example of integration in a roof, see”Roof Solar Collector, RSC” (Khedari et al. 2000), (Hi-runlabh et al. 2001), of wall integration ”Metallic SolarWalls MSW” (Hirunlabh et al. 1999) and made up verti-cal and inclined parts (AboulNaga and Abdrabboh 2000)).Since the internal wall generally does not have a highthermal storage capacity, (MartIHerrero and HerasCele-min 2007) studied the association of a solar chimney witha concrete wall in order to provide natural ventilation atnight for a Mediterranean climate. (Aboulnaga 1998) as-sessed a solar chimney coupled with adiabatic coolingwhich naturally ventilates and cools a building. Airflowrates can also be enhanced by adding, at the chimney out-let, a wind-driven system that maintains lower pressure forall wind directions (Bansal, Mathur, and Bhandari 1994),(Khan, Su, and Riffat 2008).
A gap between the elements of the building envelopecan also be used to limit heat flux though the walls. Thecovering is generally made of a non-transparent layer (me-tal, wood, canvas). Natural convection induced by heatconvective exchange between covering and internal aircan eliminate part of the absorbed solar heat. The upperand lower sides are often covered with a Radiant BarrierSystem (RBS) (low emissivity layers) which limit the ra-diative heat transfer (Chami 2009), (Miranville 2002).
550
95
550
95
(a) Closed Cavity (CC) (b) Opened Cavity (OC)
FIGURE 2: The studied configurations
Current guidelines for roofs and timber-frame struc-tures ((DTU-41.2 1996), (DTU-31.2 1993)) recommendseparating the external and internal layers by means of a
SimBuild2010
Fourth National Conference of IBPSA-USANew York City, New York
August 11 – 13, 2010
161
ventilated gap particularly to avoid damage to the struc-ture, while the present work focuses on the thermal conse-quences of this type of system.
For this purpose, thermal evaluation of the naturallyventilated cavity was assessed using a full-scale experi-mental setup consisting of two identical rooms which in-clude in their south facade either an open (FIGURE 2b) ora closed cavity (FIGURE 2a).
The experimental comparison is based on a 48-hour re-cording sample. A simple mathematical model, alreadyused in previous works ((Bansal, Mathur, and Bhandari1994),(Brinkworth, Marshall, and Ibarahim 2000) ) is pre-sented. Finally, the numerical and experimental results arecompared.
EXPERIMENTAL SET-UP
FIGURE 3: Experimental setup under construction
PrototypeThe experimental study was conducted at the CSTB
(The French Scientific and Technical Research Cen-ter). The CSTB is located at 45˚11’7.52” North and5˚46’24.97” East, in Grenoble (France).
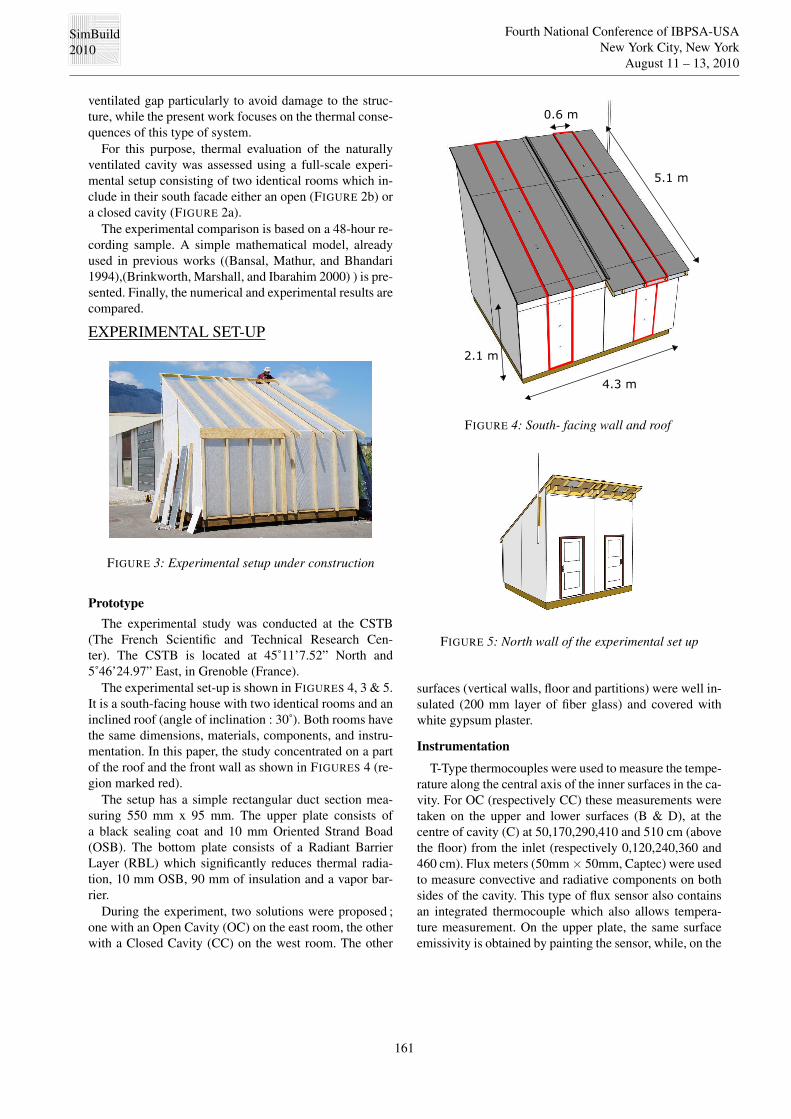
The experimental set-up is shown in FIGURES 4, 3 & 5.It is a south-facing house with two identical rooms and aninclined roof (angle of inclination : 30˚). Both rooms havethe same dimensions, materials, components, and instru-mentation. In this paper, the study concentrated on a partof the roof and the front wall as shown in FIGURES 4 (re-gion marked red).
The setup has a simple rectangular duct section mea-suring 550 mm x 95 mm. The upper plate consists ofa black sealing coat and 10 mm Oriented Strand Boad(OSB). The bottom plate consists of a Radiant BarrierLayer (RBL) which significantly reduces thermal radia-tion, 10 mm OSB, 90 mm of insulation and a vapor bar-rier.
During the experiment, two solutions were proposed ;one with an Open Cavity (OC) on the east room, the otherwith a Closed Cavity (CC) on the west room. The other
4.3 m
5.1 m
2.1 m
0.6 m
FIGURE 4: South- facing wall and roof
FIGURE 5: North wall of the experimental set up
surfaces (vertical walls, floor and partitions) were well in-sulated (200 mm layer of fiber glass) and covered withwhite gypsum plaster.
Instrumentation
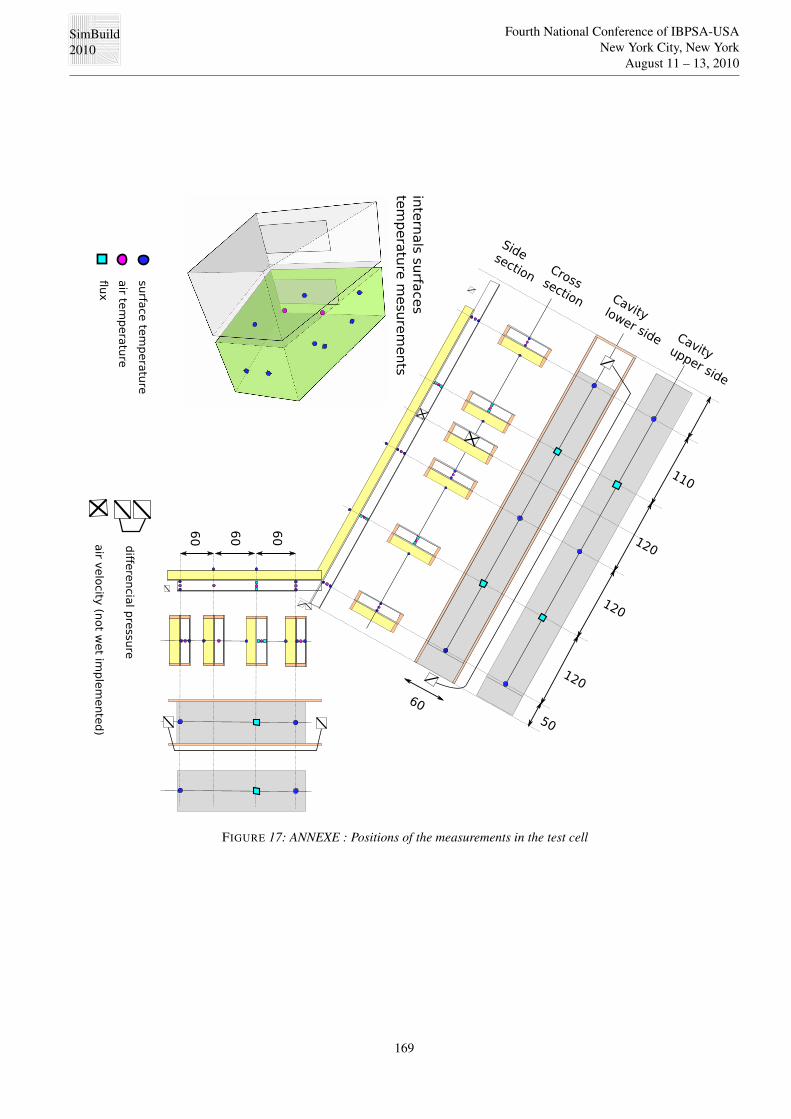
T-Type thermocouples were used to measure the tempe-rature along the central axis of the inner surfaces in the ca-vity. For OC (respectively CC) these measurements weretaken on the upper and lower surfaces (B & D), at thecentre of cavity (C) at 50,170,290,410 and 510 cm (abovethe floor) from the inlet (respectively 0,120,240,360 and460 cm). Flux meters (50mm × 50mm, Captec) were usedto measure convective and radiative components on bothsides of the cavity. This type of flux sensor also containsan integrated thermocouple which also allows tempera-ture measurement. On the upper plate, the same surfaceemissivity is obtained by painting the sensor, while, on the
SimBuild2010
Fourth National Conference of IBPSA-USANew York City, New York
August 11 – 13, 2010
162
Exterior
environment
Interior
environment
Black seal coat + OSBCavity 95mm
OSBIsulation 90mm
Low emissivity layer (lel)
vapor barrier
ABCDE F
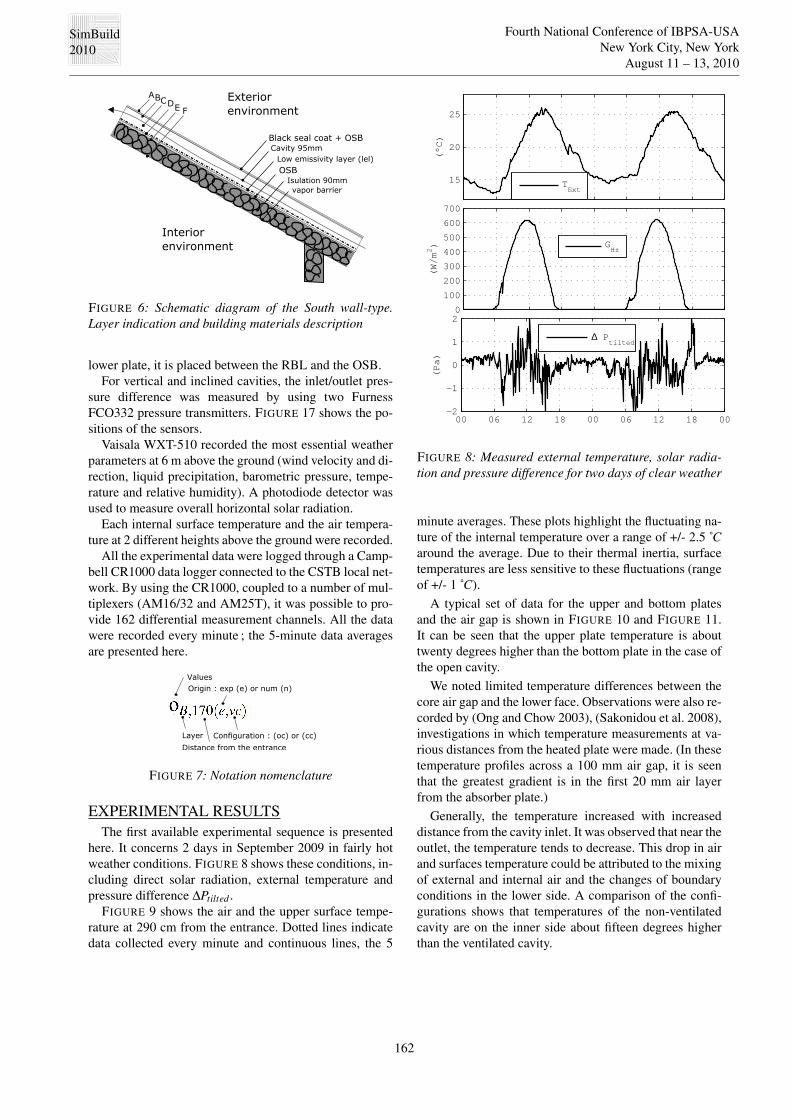
FIGURE 6: Schematic diagram of the South wall-type.Layer indication and building materials description
lower plate, it is placed between the RBL and the OSB.For vertical and inclined cavities, the inlet/outlet pres-
sure difference was measured by using two FurnessFCO332 pressure transmitters. FIGURE 17 shows the po-sitions of the sensors.
Vaisala WXT-510 recorded the most essential weatherparameters at 6 m above the ground (wind velocity and di-rection, liquid precipitation, barometric pressure, tempe-rature and relative humidity). A photodiode detector wasused to measure overall horizontal solar radiation.
Each internal surface temperature and the air tempera-ture at 2 different heights above the ground were recorded.
All the experimental data were logged through a Camp-bell CR1000 data logger connected to the CSTB local net-work. By using the CR1000, coupled to a number of mul-tiplexers (AM16/32 and AM25T), it was possible to pro-vide 162 differential measurement channels. All the datawere recorded every minute ; the 5-minute data averagesare presented here.
Values
Layer
Distance from the entrance
Configuration : (oc) or (cc)
Origin : exp (e) or num (n)
FIGURE 7: Notation nomenclature
EXPERIMENTAL RESULTSThe first available experimental sequence is presented
here. It concerns 2 days in September 2009 in fairly hotweather conditions. FIGURE 8 shows these conditions, in-cluding direct solar radiation, external temperature andpressure difference ∆Ptilted .
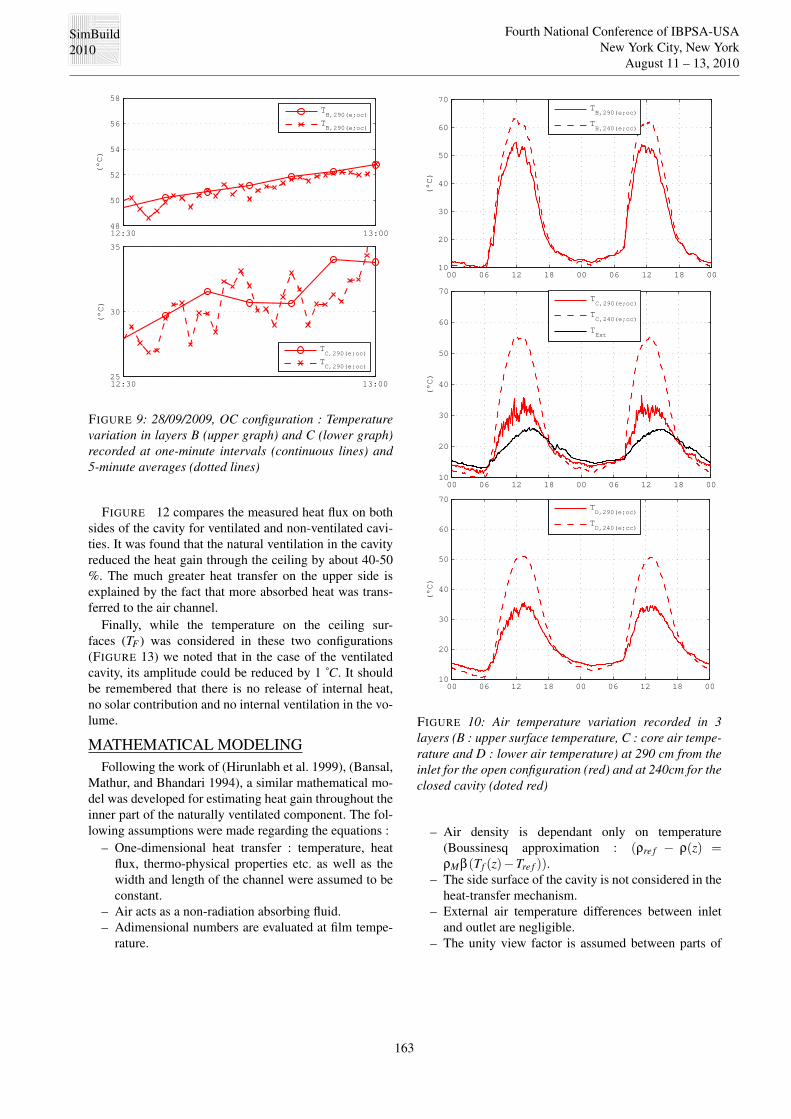
FIGURE 9 shows the air and the upper surface tempe-rature at 290 cm from the entrance. Dotted lines indicatedata collected every minute and continuous lines, the 5
15
20
25
(°C
)
0
100
200
300
400
500
600
700
(W/m
2)
00 06 12 18 00 06 12 18 00−2
−1
0
1
2
(Pa
)
∆ Ptilted
GHz
TExt
FIGURE 8: Measured external temperature, solar radia-tion and pressure difference for two days of clear weather
minute averages. These plots highlight the fluctuating na-ture of the internal temperature over a range of +/- 2.5 ˚Caround the average. Due to their thermal inertia, surfacetemperatures are less sensitive to these fluctuations (rangeof +/- 1 ˚C).
A typical set of data for the upper and bottom platesand the air gap is shown in FIGURE 10 and FIGURE 11.It can be seen that the upper plate temperature is abouttwenty degrees higher than the bottom plate in the case ofthe open cavity.
We noted limited temperature differences between thecore air gap and the lower face. Observations were also re-corded by (Ong and Chow 2003), (Sakonidou et al. 2008),investigations in which temperature measurements at va-rious distances from the heated plate were made. (In thesetemperature profiles across a 100 mm air gap, it is seenthat the greatest gradient is in the first 20 mm air layerfrom the absorber plate.)
Generally, the temperature increased with increaseddistance from the cavity inlet. It was observed that near theoutlet, the temperature tends to decrease. This drop in airand surfaces temperature could be attributed to the mixingof external and internal air and the changes of boundaryconditions in the lower side. A comparison of the confi-gurations shows that temperatures of the non-ventilatedcavity are on the inner side about fifteen degrees higherthan the ventilated cavity.
SimBuild2010
Fourth National Conference of IBPSA-USANew York City, New York
August 11 – 13, 2010
163
12:30 13:0048
50
52
54
56
58(°
C)
12:30 13:0025
30
35
(°C
)
TB,290(e;oc)
TB,290(e;oc)
TC,290(e;oc)
TC,290(e;oc)
FIGURE 9: 28/09/2009, OC configuration : Temperaturevariation in layers B (upper graph) and C (lower graph)recorded at one-minute intervals (continuous lines) and5-minute averages (dotted lines)
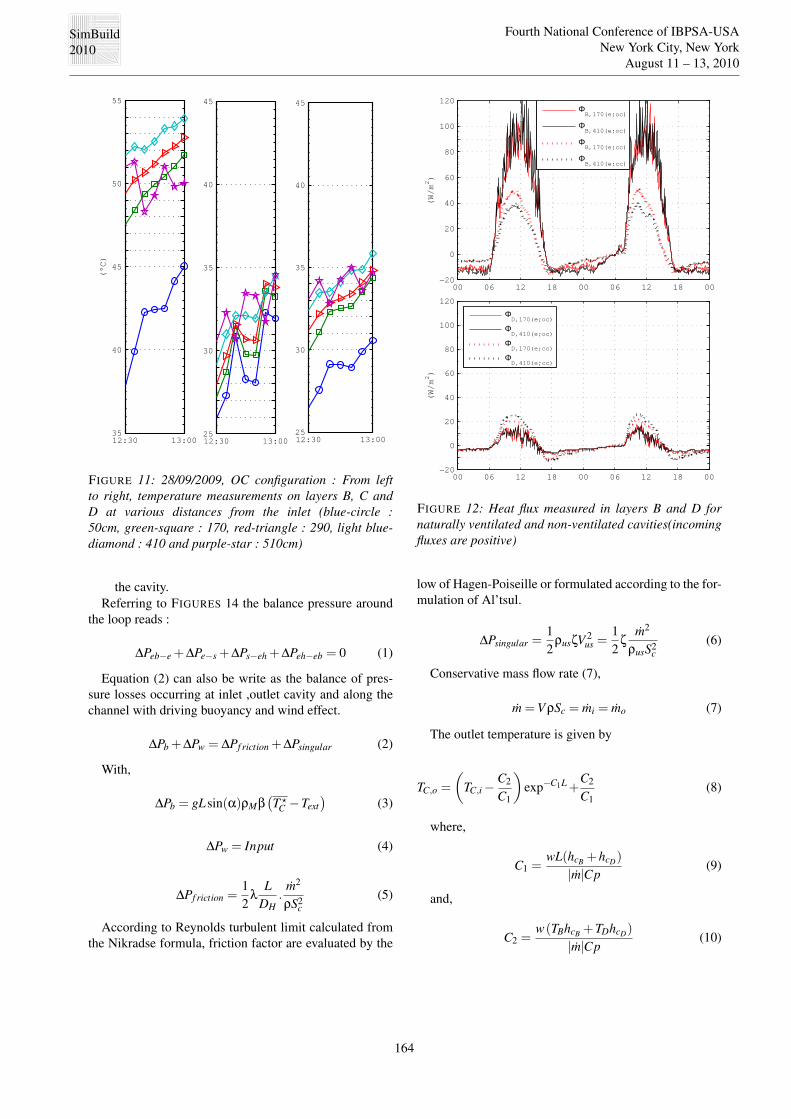
FIGURE 12 compares the measured heat flux on bothsides of the cavity for ventilated and non-ventilated cavi-ties. It was found that the natural ventilation in the cavityreduced the heat gain through the ceiling by about 40-50%. The much greater heat transfer on the upper side isexplained by the fact that more absorbed heat was trans-ferred to the air channel.
Finally, while the temperature on the ceiling sur-faces (TF ) was considered in these two configurations(FIGURE 13) we noted that in the case of the ventilatedcavity, its amplitude could be reduced by 1 ˚C. It shouldbe remembered that there is no release of internal heat,no solar contribution and no internal ventilation in the vo-lume.
MATHEMATICAL MODELINGFollowing the work of (Hirunlabh et al. 1999), (Bansal,
Mathur, and Bhandari 1994), a similar mathematical mo-del was developed for estimating heat gain throughout theinner part of the naturally ventilated component. The fol-lowing assumptions were made regarding the equations :
– One-dimensional heat transfer : temperature, heatflux, thermo-physical properties etc. as well as thewidth and length of the channel were assumed to beconstant.
– Air acts as a non-radiation absorbing fluid.– Adimensional numbers are evaluated at film tempe-
rature.
00 06 12 18 00 06 12 18 0010
20
30
40
50
60
70
(°C
)
00 06 12 18 00 06 12 18 0010
20
30
40
50
60
70
(°C
)
00 06 12 18 00 06 12 18 0010
20
30
40
50
60
70
(°C
)
TB,290(e;oc)
TB,240(e;cc)
TC,290(e;oc)
TC,240(e;cc)
TExt
TD,290(e;oc)
TD,240(e;cc)
FIGURE 10: Air temperature variation recorded in 3layers (B : upper surface temperature, C : core air tempe-rature and D : lower air temperature) at 290 cm from theinlet for the open configuration (red) and at 240cm for theclosed cavity (doted red)
– Air density is dependant only on temperature(Boussinesq approximation : (ρre f − ρ(z) =ρMβ(Tf (z)−Tre f )).
– The side surface of the cavity is not considered in theheat-transfer mechanism.
– External air temperature differences between inletand outlet are negligible.
– The unity view factor is assumed between parts of
SimBuild2010
Fourth National Conference of IBPSA-USANew York City, New York
August 11 – 13, 2010
164
12:30 13:0035
40
45
50
55(°
C)
12:30 13:0025
30
35
40
45
12:30 13:0025
30
35
40
45
FIGURE 11: 28/09/2009, OC configuration : From leftto right, temperature measurements on layers B, C andD at various distances from the inlet (blue-circle :50cm, green-square : 170, red-triangle : 290, light blue-diamond : 410 and purple-star : 510cm)
the cavity.Referring to FIGURES 14 the balance pressure around
the loop reads :
∆Peb−e +∆Pe−s +∆Ps−eh +∆Peh−eb = 0 (1)
Equation (2) can also be write as the balance of pres-sure losses occurring at inlet ,outlet cavity and along thechannel with driving buoyancy and wind effect.
∆Pb +∆Pw = ∆Pf riction +∆Psingular (2)
With,
∆Pb = gLsin(α)ρMβ(T ?
C −Text)
(3)
∆Pw = Input (4)
∆Pf riction =12
λL
DH.
m2
ρS2c
(5)
According to Reynolds turbulent limit calculated fromthe Nikradse formula, friction factor are evaluated by the
00 06 12 18 00 06 12 18 00−20
0
20
40
60
80
100
120
(W/m
2)
00 06 12 18 00 06 12 18 00−20
0
20
40
60
80
100
120
(W/m
2)
ΦD,170(e;oc)
ΦD,410(e;oc)
ΦD,170(e;cc)
ΦD,410(e;cc)
ΦB,170(e;oc)
ΦB,410(e;oc)
ΦB,170(e;cc)
ΦB,410(e;cc)
FIGURE 12: Heat flux measured in layers B and D fornaturally ventilated and non-ventilated cavities(incomingfluxes are positive)
low of Hagen-Poiseille or formulated according to the for-mulation of Al’tsul.
∆Psingular =12
ρusζV 2us =
12
ζm2
ρusS2c
(6)
Conservative mass flow rate (7),
m =V ρSc = mi = mo (7)
The outlet temperature is given by
TC,o =
(TC,i − C2
C1
)exp−C1L+
C2
C1(8)
where,
C1 =wL(hcB +hcD)
|m|Cp(9)
and,
C2 =w(TBhcB +TDhcD)
|m|Cp(10)
SimBuild2010
Fourth National Conference of IBPSA-USANew York City, New York
August 11 – 13, 2010
165
00 06 12 18 00 06 12 18 0018
19
20
21
22
23
24(°
C)
T
F,170(e;oc)
TF,290(e;oc)
TF,170(e;cc)
TF,290(e;cc)
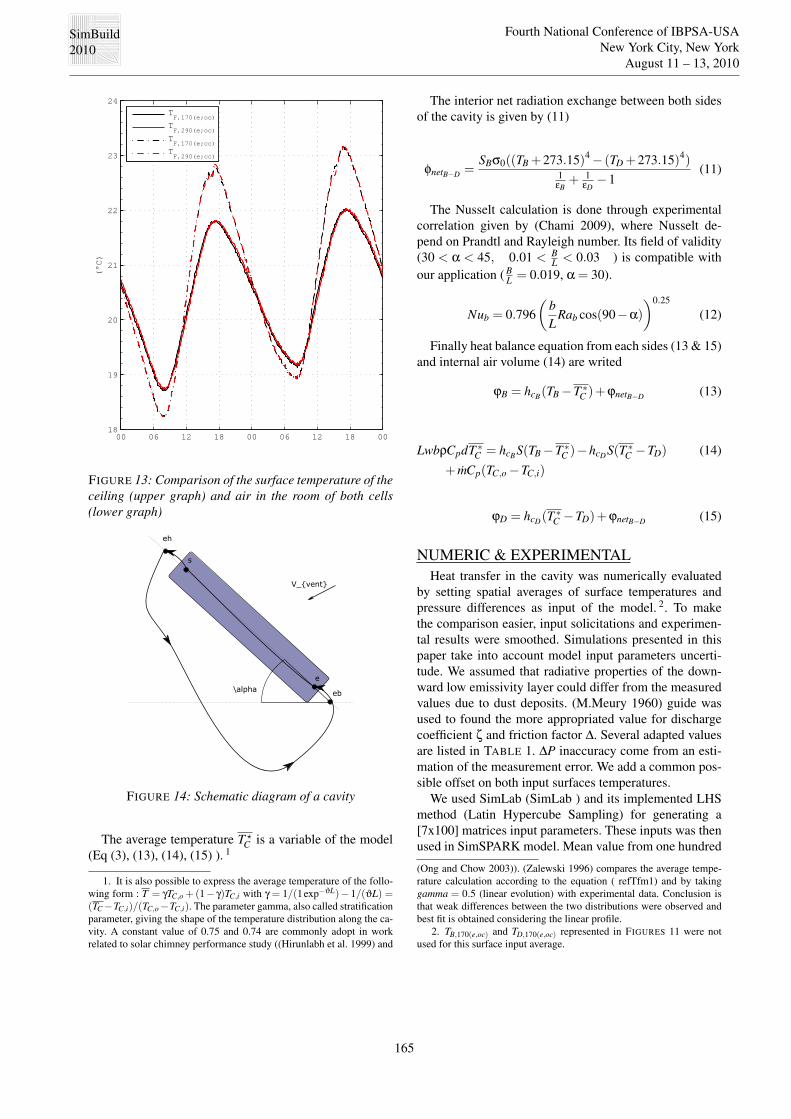
FIGURE 13: Comparison of the surface temperature of theceiling (upper graph) and air in the room of both cells(lower graph)
FIGURE 14: Schematic diagram of a cavity
The average temperature T ?C is a variable of the model
(Eq (3), (13), (14), (15) ). 1
1. It is also possible to express the average temperature of the follo-wing form : T = γTC,o +(1− γ)TC,i with γ = 1/(1exp−ϑL)− 1/(ϑL) =(TC −TC,i)/(TC,o−TC,i). The parameter gamma, also called stratificationparameter, giving the shape of the temperature distribution along the ca-vity. A constant value of 0.75 and 0.74 are commonly adopt in workrelated to solar chimney performance study ((Hirunlabh et al. 1999) and
The interior net radiation exchange between both sidesof the cavity is given by (11)
φnetB−D =SBσ0((TB +273.15)4 − (TD +273.15)4)
1εB
+ 1εD
−1(11)
The Nusselt calculation is done through experimentalcorrelation given by (Chami 2009), where Nusselt de-pend on Prandtl and Rayleigh number. Its field of validity(30 < α < 45, 0.01 < B
L < 0.03 ) is compatible withour application ( B
L = 0.019, α = 30).
Nub = 0.796(
bL
Rab cos(90−α))0.25
(12)
Finally heat balance equation from each sides (13 & 15)and internal air volume (14) are writed
ϕB = hcB(TB −T ∗C )+ϕnetB−D (13)
LwbρCpdT ∗C = hcBS(TB −T ∗
C )−hcDS(T ∗C −TD) (14)
+ mCp(TC,o −TC,i)
ϕD = hcD(T∗
C −TD)+ϕnetB−D (15)
NUMERIC & EXPERIMENTALHeat transfer in the cavity was numerically evaluated
by setting spatial averages of surface temperatures andpressure differences as input of the model. 2. To makethe comparison easier, input solicitations and experimen-tal results were smoothed. Simulations presented in thispaper take into account model input parameters uncerti-tude. We assumed that radiative properties of the down-ward low emissivity layer could differ from the measuredvalues due to dust deposits. (M.Meury 1960) guide wasused to found the more appropriated value for dischargecoefficient ζ and friction factor ∆. Several adapted valuesare listed in TABLE 1. ∆P inaccuracy come from an esti-mation of the measurement error. We add a common pos-sible offset on both input surfaces temperatures.
We used SimLab (SimLab ) and its implemented LHSmethod (Latin Hypercube Sampling) for generating a[7x100] matrices input parameters. These inputs was thenused in SimSPARK model. Mean value from one hundred
(Ong and Chow 2003)). (Zalewski 1996) compares the average tempe-rature calculation according to the equation ( refTfm1) and by takinggamma = 0.5 (linear evolution) with experimental data. Conclusion isthat weak differences between the two distributions were observed andbest fit is obtained considering the linear profile.
2. TB,170(e,oc) and TD,170(e,oc) represented in FIGURES 11 were notused for this surface input average.
SimBuild2010
Fourth National Conference of IBPSA-USANew York City, New York
August 11 – 13, 2010
166
simulations and 95 % confident bound for each time stepwere plotted. The uncertainty range is set voluntary wide.If measured values were inside numerical bounds then thisresults were used by mean of an optimization technique inorder to found the values that best fit the experimental re-sults. If there not, we could assumed that the adopted mo-del was not appropriate or some measurement error occur.
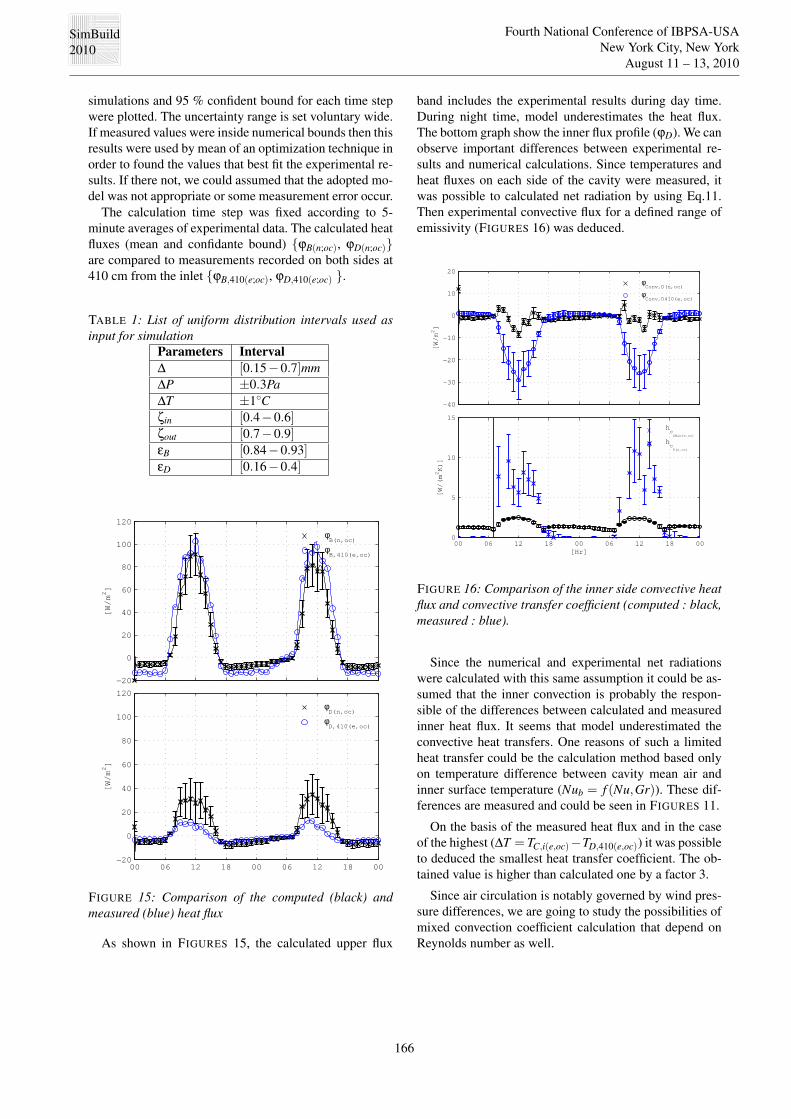
The calculation time step was fixed according to 5-minute averages of experimental data. The calculated heatfluxes (mean and confidante bound) {ϕB(n;oc), ϕD(n;oc)}are compared to measurements recorded on both sides at410 cm from the inlet {ϕB,410(e;oc), ϕD,410(e;oc) }.
TABLE 1: List of uniform distribution intervals used asinput for simulation
Parameters Interval∆ [0.15−0.7]mm∆P ±0.3Pa∆T ±1◦Cζin [0.4−0.6]ζout [0.7−0.9]εB [0.84−0.93]εD [0.16−0.4]
−20
0
20
40
60
80
100
120
[W/m
2]
φB(n,oc)
φB,410(e,oc)
00 06 12 18 00 06 12 18 00−20
0
20
40
60
80
100
120
[W/m
2]
φD(n,oc)
φD,410(e,oc)
FIGURE 15: Comparison of the computed (black) andmeasured (blue) heat flux
As shown in FIGURES 15, the calculated upper flux
band includes the experimental results during day time.During night time, model underestimates the heat flux.The bottom graph show the inner flux profile (ϕD). We canobserve important differences between experimental re-sults and numerical calculations. Since temperatures andheat fluxes on each side of the cavity were measured, itwas possible to calculated net radiation by using Eq.11.Then experimental convective flux for a defined range ofemissivity (FIGURES 16) was deduced.
−40
−30
−20
−10
0
10
20
[W/m
2]
φConv,D(n,oc)
φConv,D410(e,oc)
00 06 12 18 00 06 12 18 000
5
10
15
[Hr]
[W/(
m2K
)]
h
cDMin(e,oc)
hc
D(n,oc)
FIGURE 16: Comparison of the inner side convective heatflux and convective transfer coefficient (computed : black,measured : blue).
Since the numerical and experimental net radiationswere calculated with this same assumption it could be as-sumed that the inner convection is probably the respon-sible of the differences between calculated and measuredinner heat flux. It seems that model underestimated theconvective heat transfers. One reasons of such a limitedheat transfer could be the calculation method based onlyon temperature difference between cavity mean air andinner surface temperature (Nub = f (Nu,Gr)). These dif-ferences are measured and could be seen in FIGURES 11.
On the basis of the measured heat flux and in the caseof the highest (∆T = TC,i(e,oc)−TD,410(e,oc)) it was possibleto deduced the smallest heat transfer coefficient. The ob-tained value is higher than calculated one by a factor 3.
Since air circulation is notably governed by wind pres-sure differences, we are going to study the possibilities ofmixed convection coefficient calculation that depend onReynolds number as well.
SimBuild2010
Fourth National Conference of IBPSA-USANew York City, New York
August 11 – 13, 2010
167
CONCLUSIONHeat transfer in timber-frame building envelopes was
experimentally assessed under real climatic conditions. Afull-scale experimental setup, consisting of two identicalrooms, was a roof naturally ventilated interspace coupledwith a 90 mm insulated building envelope which couldreduce heat-flux transmission by up to fifty percent. As aconsequence, the ceiling surface decreases by up to onedegree.
A simple mathematical model based on pressure loopanalysis was presented ; it was implemented under Sim-Spark. As well as many others works related to naturallyventilated inter-space, upper and inner side convectiontransfer coefficients were calculated according to corre-lation using Grashof and Prandtl number. Considering theinner part of the cavity that has reduced temperature dif-ference with air. Correlation only based on the Grashofnumber lead to 3 times differences with its deduced valuefrom experimental measure.
Further works are in progress to improve the numericalside to side heat transfer prediction notably by substitutingthe natural convection coefficient by a mixed one depen-ding on Grashof, Prandtl and Reynolds numbers.
ACKNOWLEDGMENTThis research was possible thanks to the contribution
from the French Environment and Energy ManagementAgency (ADEME) and the Scientific and Technical Cen-ter Centre for Building (CSTB). The authors gratefullyacknowledge their support on this project and also extendtheir thanks to as well as Francois-Dominique Menneteau,Hebert Sallee and Xavier Faure (Faure 2007).
ReferencesAboulNaga, M. M., and S. N. Abdrabboh. 2000. “Im-
proving night ventilation into low-rise buildings inhot-arid climates exploring a combined wall-roof so-lar chimney.” Renewable Energy 19 (1-2) : 47 – 54.
Aboulnaga, Mohsen M. 1998. “A roof solar chimneyassisted by cooling cavity for natural ventilation inbuildings in hot arid climates : An energy conserva-tion approach in Al-Ain city.” Renewable Energy14 (1-4) : 357 – 363. 6th Arab International SolarEnergy Conference : Bringing Solar Energy into theDaylight.
Bansal, N.K., Rajesh Mathur, and M.S. Bhandari. 1994.“A study of solar chimney assisted wind tower sys-tem for natural ventilation in buildings.” Buildingand Environment 29 (4) : 495 – 500.
Brinkworth, B. J., R. H. Marshall, and Z. Ibarahim.2000. “A validated model of naturally ventilated PVcladding.” Solar Energy 69 (1) : 67 – 81.
Chami, Nada. 2009. “Evaluation de l’impact des isolants
minces reflechissants dans le batiment.” Ph.D. diss.,Universite de Cergy Pontoise, Mines ParisTech.
DTU-31.2. 1993. “Construction de maison et batimentsa ossature en bois.” Technical Report NFP21-204-1,AFNOR.
DTU-41.2. 1996. “Revetements exterieurs en bois.”Technical Report NFP65-210-1, AFNOR.
Faure, Xavier. 2007, Novembre. “Optimisation d’enve-loppe hybride pour le batiment a haute performanceenergetique.” Ph.D. diss., Universite Joseph Fourrier.
Hirunlabh, J., W. Kongduang, P. Namprakai, and J. Khe-dari. 1999. “Study of natural ventilation of housesby a metallic solar wall under tropical climate.” Re-newable Energy 18 (1) : 109 – 119.
Hirunlabh, Jongjit, Sopin Wachirapuwadon, Naris Pra-tinthong, and Joseph Khedari. 2001. “New configu-rations of a roof solar collector maximizing naturalventilation.” Building and Environment 36 (3) : 383– 391.
Khan, Naghman, Yuehong Su, and Saffa B. Riffat. 2008.“A review on wind driven ventilation techniques.”Energy and Buildings 40 (8) : 1586 – 1604.
Khedari, Joseph, Weerapong Mansirisub, SompongChaima, Naris Pratinthong, and Jongjit Hirunlabh.2000. “Field measurements of performance of roofsolar collector.” Energy and Buildings 31 (3) : 171 –178.
Lawrence-Berkeley-National-Laboratory, and Ayres-Sowell-Associates. 2003. SPARK 2.0 referencemanual.
MartIHerrero, J., and M.R. HerasCelemin. 2007. “Dy-namic physical model for a solar chimney.” SolarEnergy 81 (5) : 614 – 622.
Miranville, Frederic. 2002, decembre. “Contribu-tion a l’etude des parois complexes en physique dubatiment.” Ph.D. diss., Universite de la Reunion.
M.Meury. 1960. “I.E IDEL’CIK, Memento des pertesde charge.” traduction francaise.
Ong, K. S., and C. C. Chow. 2003. “Performance of asolar chimney.” Solar Energy 74 (1) : 1 – 17.
Sakonidou, E.P., T.D. Karapantsios, A.I. Balouktsis, andD. Chassapis. 2008. “Modeling of the optimum tiltof a solar chimney for maximum air flow.” SolarEnergy 82 (1) : 80 – 94.
SimLab. SimLab site : http ://simlab.jrc.ec.europa.eu/.
Zalewski, Laurent. 1996. “Etudes thermiquesexperimentale et simulation numerique d’un mursolaire composite, optimisation des performancesenergetiques.” Ph.D. diss., Universite d’Artois.
SimBuild2010
Fourth National Conference of IBPSA-USANew York City, New York
August 11 – 13, 2010
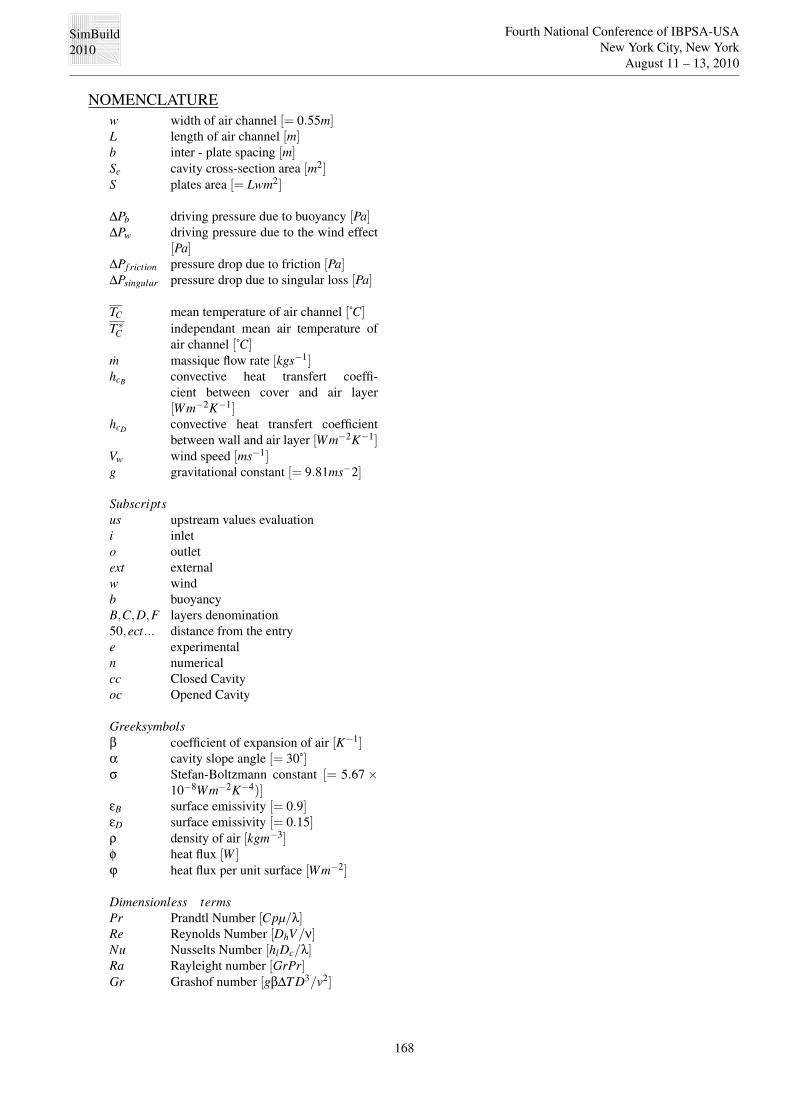
168
NOMENCLATUREw width of air channel [= 0.55m]L length of air channel [m]b inter - plate spacing [m]Sc cavity cross-section area [m2]S plates area [= Lwm2]
∆Pb driving pressure due to buoyancy [Pa]∆Pw driving pressure due to the wind effect
[Pa]∆Pf riction pressure drop due to friction [Pa]∆Psingular pressure drop due to singular loss [Pa]
TC mean temperature of air channel [˚C]
T ∗C independant mean air temperature of
air channel [˚C]m massique flow rate [kgs−1]hcB convective heat transfert coeffi-
cient between cover and air layer[Wm−2K−1]
hcD convective heat transfert coefficientbetween wall and air layer [Wm−2K−1]
Vw wind speed [ms−1]g gravitational constant [= 9.81ms−2]
Subscriptsus upstream values evaluationi inleto outletext externalw windb buoyancyB,C,D,F layers denomination50,ect... distance from the entrye experimentaln numericalcc Closed Cavityoc Opened Cavity
Greeksymbolsβ coefficient of expansion of air [K−1]α cavity slope angle [= 30˚]σ Stefan-Boltzmann constant [= 5.67 ×
10−8Wm−2K−4)]εB surface emissivity [= 0.9]εD surface emissivity [= 0.15]ρ density of air [kgm−3]φ heat flux [W ]ϕ heat flux per unit surface [Wm−2]
Dimensionless termsPr Prandtl Number [Cpµ/λ]Re Reynolds Number [DhV/ν]Nu Nusselts Number [hlDc/λ]Ra Rayleight number [GrPr]Gr Grashof number [gβ∆T D3/v2]
SimBuild2010
Fourth National Conference of IBPSA-USANew York City, New York
August 11 – 13, 2010
169
inte
rnals
surfa
ces
tem
pera
ture
mesure
ments
Cavitylower side Cavity upper side
Cross section
Side section
50
120
120
120
110
60
60
60
60
surfa
ce te
mpera
ture
air te
mpera
ture
diffe
rencia
l pre
ssure
air v
elo
city
(not w
et im
ple
mente
d)
flux
FIGURE 17: ANNEXE : Positions of the measurements in the test cell