Embed Size (px)
Citation preview
Emil Veg1, Aleksandar Sedmak1, Nenad Gubeljak2
EXPERIMENTAL AND NUMERICAL CROSS-CORRELATED MODAL ANALYSIS OF THE FLOOR STRUCTURE DYNAMICS IN A THERMAL POWER PLANT
EKSPERIMENTALNA I NUMERIČKA UPOREDNA MODALNA ANALIZA KONSTRUKCIJE PODA U TERMOELEKTRANI
Originalni naučni rad / Original scientific paper UDK /UDC: 624.012.45.042 Rad primljen / Paper received: 20.05.2015
Adresa autora / Author's address: 1) University of Belgrade, Faculty of Mechanical Engineer-ing, email: [email protected] 2) University of Maribor, Faculty of Mechanical Engineer-ing, Maribor, Slovenia
Keywords • finite element method • modal analysis • vibrations
Abstract
This article presents search methodology after the cause of excessive floor vibrations in a thermal power plant control room. The floor structure is a composition of a steel grillage and concrete slabs at 12 m level above soil. It was detected that floor vibration severity exceeds the threshold of the permitted rate. After full scale measurements are conducted on site, the results are arranged versus time and frequency domain. In parallel to site measurements a 3D modal analysis is performed in ANSYS. The outcome is a set of modal frequencies and modal shapes. Cross-corre-lated analytical and experimental analysis formed a true picture of the excitation, response and their mutual interac-tion. The obtained results and appropriate conclusions had profiled a remedy strategy to mitigate the severity of the floor vibration.
Ključne reči • metoda konačnih elemenata • modalna analiza • vibracije
Izvod
U ovom članku je opisana metodologija detekcije uzroka povišenih vibracija u kontrolnoj sobi termoelektrane. Podna struktura je formirana od armirano betonske ploče izlivene na 12 m visokoj rešetkastoj čeličnoj konstrukciji. Ustanov-ljeno je da intenzitet vibracija poda prevazilazi standardom dopušteni nivo vezano za minimum radnih uslova. Pristupilo se ispitivanju dinamičke slike poda u frekventnom i vremen-skom domenu. Uporedo je u ANSYS-u formiran 3D model u vidu konačnih elemenata. Na 3D modelu izvedena je modalna analiza. Rezultat ove analize je spektralna slika sa frekvencijama i modovima oscilovanja uz grafički prikaz. Poređenjem analitičkog i eksperimentalnog ispitivanja došlo se do jasne slike o pobudnim silama, njihovoj dinamici i obimu međusobne interakcije. Na osnovu prikaza dinamič-ke pobude i odziva napravljena je strategija za sanaciju prekomernih vibracija.
INTRODUCTION
Redesign of working space in a thermal power plant at the 12 m height level has shifted of a former stockroom into a new control room. A set of instruments and devices for permanent condition monitoring of the turbine and genera-tor set as well for other accessories is installed in the new control room. Severe vibrations of the floor, beyond the permissible threshold, disturbed a normal operation, /1/. A similar problem has not yet been recognized in available scientific literature. Floor vibrations of the room, occupied by individuals, are usually treated as human induced vibra-tions, /2-11/. The same approach is recognized with labora-tory modal testing of concrete plates, /12, 13/. Very few papers deal with detection of machine induced vibration on civil structures. Lack of published research in this field justifies the complexity of the problem. In order to solve the described problem, it is necessary to have a true case study of increased vibration intensity. Substantial dilemma that arose in this case is whether the severe vibration is a reflection of excessive excitation from the turbine set and associated equipment, or it is a resonant response of the floor structure, or else the problem is a mixture of both.
This thermal power plant is of vital importance for the national power supply grid. Therefore it is absolutely out of the question that any experiments should be performed as a start-stop operation in order to reveal the main source of severe vibration. Recognizing the true cause of excessive vibrations would ease the further steps in rehabilitation.
Essentially there are two possible sources of excessive vibrations: • Resonance of the floor structure triggered by surrounding
machinery (turbines, generators, pumps, mills...). • A transfer of excessive vibrations from the surrounding
machinery throughout the floor structure (without its resonance). The steam lines were focused as the measurement sites.
Mostly, they differ in size, ranging within 200-800 mm in diameter. Steam flow pressure varies significantly in each pipeline. Pipelines are suspended to the underside of the floor structure, either directly or via dampers. Vibrations on the pipelines are mostly caused by the swirling steam flow or the pulsating operation of related machinery. In order to find the clue to solving excessive vibrations, two spectral images are established: image of the pipeline excitation and
INTEGRITET I VEK KONSTRUKCIJA Vol. 15, br. 1 (2015), str. 31–37
STRUCTURAL INTEGRITY AND LIFEVol. 15, No 1 (2015), pp. 31–37
31
Experimental and numerical cross-correlated modal analysis of … Eksperimentalna i numerička uporedna modalna analiza …
the response spectrum of the floor. Selective comparison of these two spectral signatures crystallizes a clear picture of the dynamic behaviour of the floor structure. Rehabilitation methodology will depend a lot on the nature of the detected vibration source.
Site description
The control room floor is a rebar concrete plate on a grillage steel structure. Welded steel bars (cross section I 400), form a grill at 12 m high steel columns (rectangular cross section, 50 mm wall thickness, shown in Fig. 1).
Figure 1. 3D model of the grillage structure.
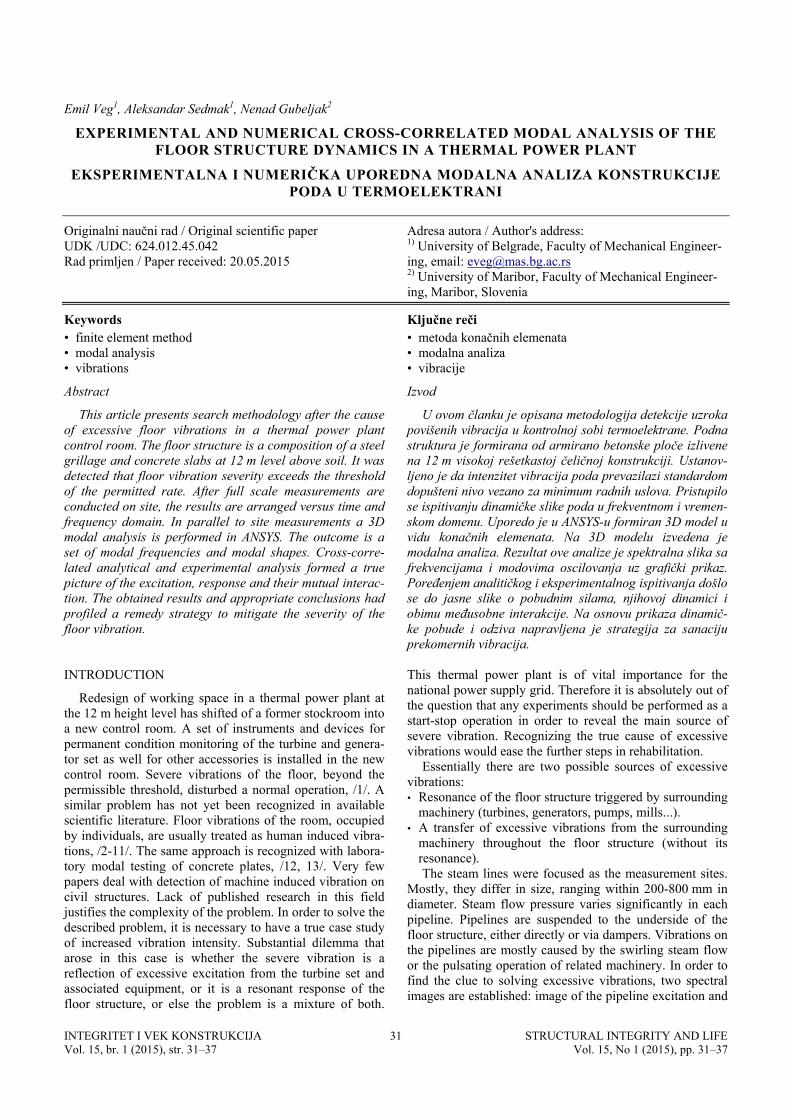
The bundle of steam pipelines is suspended to the under-structure of the control room steel grillage, shown in Fig. 2.
Figure 2. Suspended pipelines.
TEST INSTRUMENTATION
Two 8-channel acquisition devices are deployed for the site measurements. Complete data files from the acquisition devices are delivered to a laptop computer serving as a data
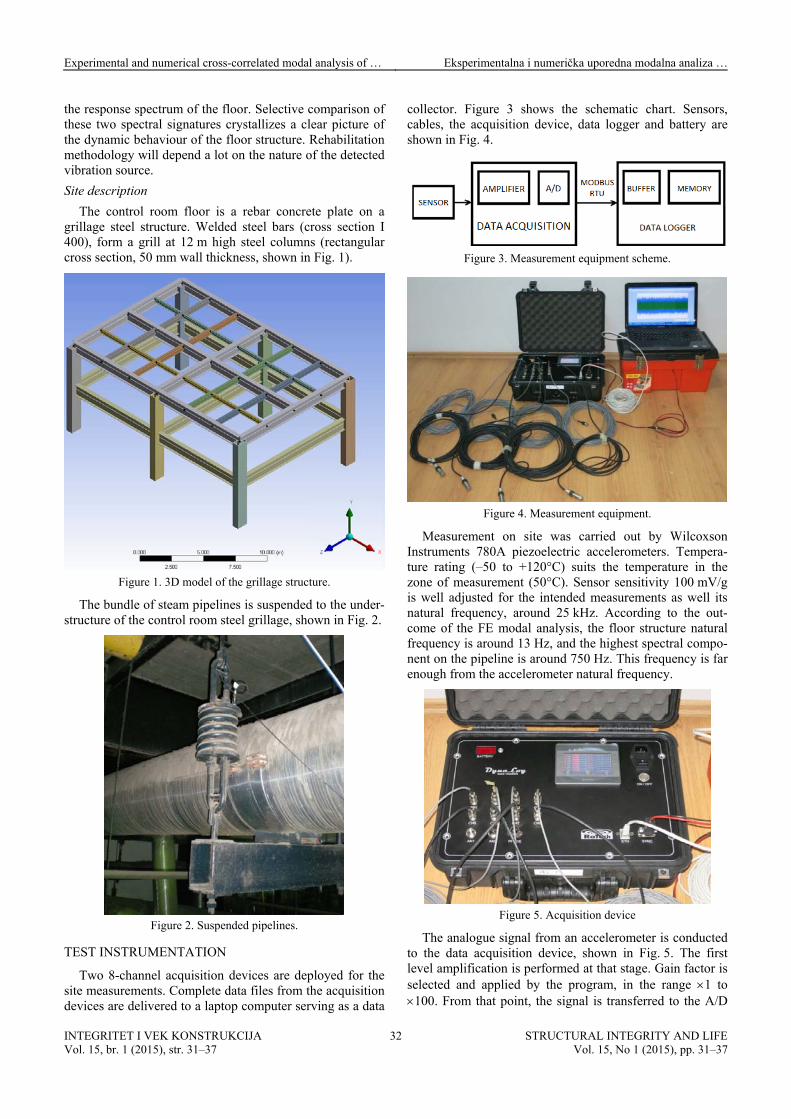
collector. Figure 3 shows the schematic chart. Sensors, cables, the acquisition device, data logger and battery are shown in Fig. 4.
Figure 3. Measurement equipment scheme.
Figure 4. Measurement equipment.
Measurement on site was carried out by Wilcoxson Instruments 780A piezoelectric accelerometers. Tempera-ture rating (–50 to +120°C) suits the temperature in the zone of measurement (50°C). Sensor sensitivity 100 mV/g is well adjusted for the intended measurements as well its natural frequency, around 25 kHz. According to the out-come of the FE modal analysis, the floor structure natural frequency is around 13 Hz, and the highest spectral compo-nent on the pipeline is around 750 Hz. This frequency is far enough from the accelerometer natural frequency.
Figure 5. Acquisition device
The analogue signal from an accelerometer is conducted to the data acquisition device, shown in Fig. 5. The first level amplification is performed at that stage. Gain factor is selected and applied by the program, in the range 1 to 100. From that point, the signal is transferred to the A/D
INTEGRITET I VEK KONSTRUKCIJA Vol. 15, br. 1 (2015), str. 31–37
STRUCTURAL INTEGRITY AND LIFEVol. 15, No 1 (2015), pp. 31–37
32
Experimental and numerical cross-correlated modal analysis of … Eksperimentalna i numerička uporedna modalna analiza …
converter (LTC 1864, 16-bit). The conversion process and the characteristics of the A/D converter are explained in detail, /14/. Modbus RTU binary protocol is deployed for data transfer from acquisition box to the PC “logger”. The ‘master’ role is dedicated to the PC, while the acquisition device is the ‘slave’.
After completing data acquisition, the numeric values are written into the buffer. The PC buffer size is 2MB, and is a necessary component in the measuring system in order to avoid data loss at higher sampling rates.
Along with the data collection, some data are also displayed on the PC monitor. This feature is very important for the operator’s insight into the character of the sampled data. In this way, possible irregularities in the measurement process are detected and rectified instantly.
Dictated by the optimal use of available resources (PC CPU), no on-line analysis is performed during measure-ment. The collected data packages are processed after recording (‘off-line’ analysis). Raw data is stored in binary form. For further processing and analysis, the archived values are converted into CSV (Coma Separated Values) or MAT (Matlab file) format.
High capacity batteries provide a respectful, few hour autonomy for the measuring system.
Specification of the Data Logger is given in the Table 1.
Table 1. Data Logger properties.
monitor 15.6'' WXGA LED HD processor Intel Celeron Dual Core 1.8 GHz chipset Intel HM75 chipset memory 4GB DDR3 1600 MHz
memory slots 4 x DDR3 1600 MHz graphics Intel HD Graphics - Ivy Bridge hard disc 500GB SATA II, 5400 rpm
wi-fi WLAN b/g/n, Bluetooth 4.0 + EDR slots HDMI, VGA D-sub, USB 3.0, USB 2.0
battery 6-cell Li-Ion
MEASURING CONCEPT
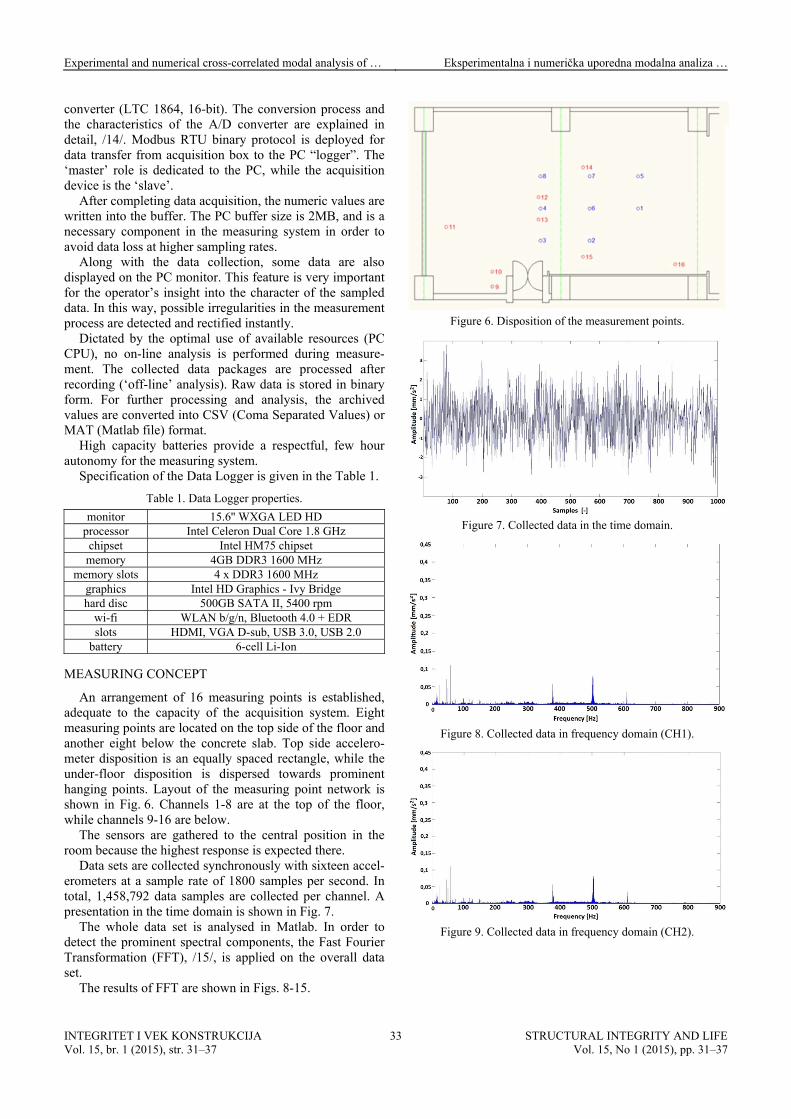
An arrangement of 16 measuring points is established, adequate to the capacity of the acquisition system. Eight measuring points are located on the top side of the floor and another eight below the concrete slab. Top side accelero-meter disposition is an equally spaced rectangle, while the under-floor disposition is dispersed towards prominent hanging points. Layout of the measuring point network is shown in Fig. 6. Channels 1-8 are at the top of the floor, while channels 9-16 are below.
The sensors are gathered to the central position in the room because the highest response is expected there.
Data sets are collected synchronously with sixteen accel-erometers at a sample rate of 1800 samples per second. In total, 1,458,792 data samples are collected per channel. A presentation in the time domain is shown in Fig. 7.
The whole data set is analysed in Matlab. In order to detect the prominent spectral components, the Fast Fourier Transformation (FFT), /15/, is applied on the overall data set.
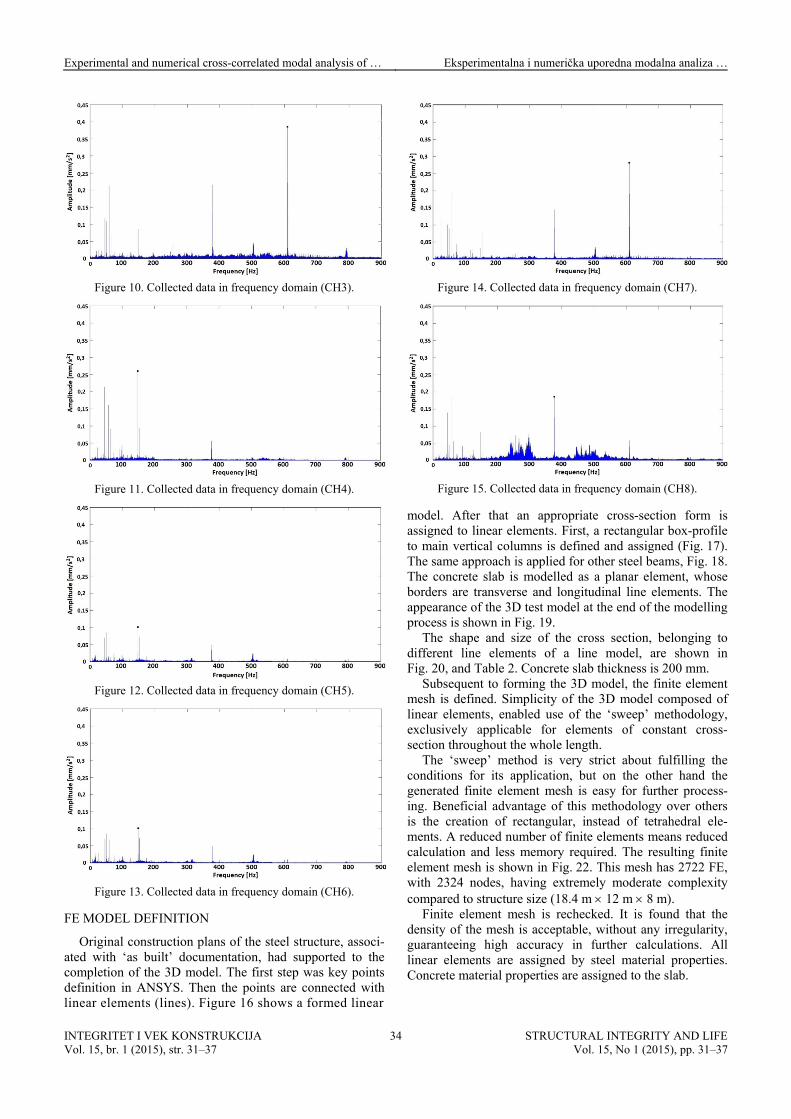
The results of FFT are shown in Figs. 8-15.
Figure 6. Disposition of the measurement points.
Figure 7. Collected data in the time domain.
Figure 8. Collected data in frequency domain (CH1).
Figure 9. Collected data in frequency domain (CH2).
INTEGRITET I VEK KONSTRUKCIJA Vol. 15, br. 1 (2015), str. 31–37
STRUCTURAL INTEGRITY AND LIFEVol. 15, No 1 (2015), pp. 31–37
33
Experimental and numerical cross-correlated modal analysis of … Eksperimentalna i numerička uporedna modalna analiza …
Figure 10. Collected data in frequency domain (CH3).
Figure 11. Collected data in frequency domain (CH4).
Figure 12. Collected data in frequency domain (CH5).
Figure 13. Collected data in frequency domain (CH6).
FE MODEL DEFINITION
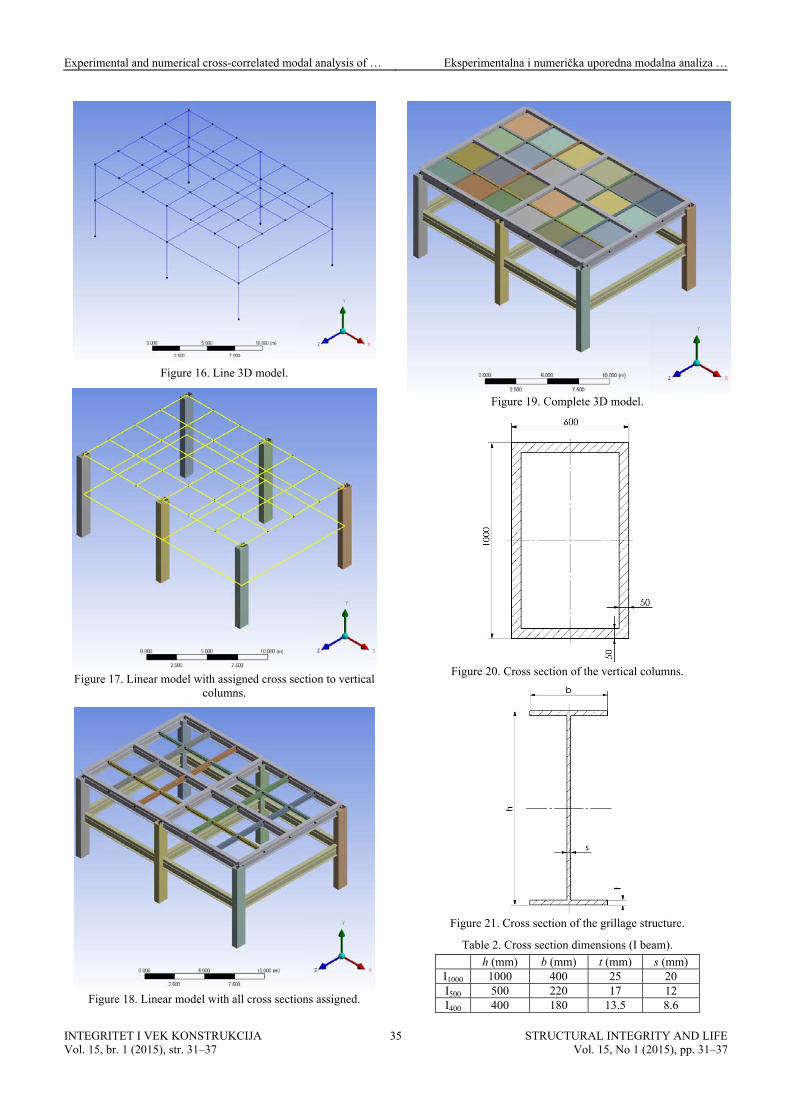
Original construction plans of the steel structure, associ-ated with ‘as built’ documentation, had supported to the completion of the 3D model. The first step was key points definition in ANSYS. Then the points are connected with linear elements (lines). Figure 16 shows a formed linear
Figure 14. Collected data in frequency domain (CH7).
Figure 15. Collected data in frequency domain (CH8).
model. After that an appropriate cross-section form is assigned to linear elements. First, a rectangular box-profile to main vertical columns is defined and assigned (Fig. 17). The same approach is applied for other steel beams, Fig. 18. The concrete slab is modelled as a planar element, whose borders are transverse and longitudinal line elements. The appearance of the 3D test model at the end of the modelling process is shown in Fig. 19.
The shape and size of the cross section, belonging to different line elements of a line model, are shown in Fig. 20, and Table 2. Concrete slab thickness is 200 mm.
Subsequent to forming the 3D model, the finite element mesh is defined. Simplicity of the 3D model composed of linear elements, enabled use of the ‘sweep’ methodology, exclusively applicable for elements of constant cross-section throughout the whole length.
The ‘sweep’ method is very strict about fulfilling the conditions for its application, but on the other hand the generated finite element mesh is easy for further process-ing. Beneficial advantage of this methodology over others is the creation of rectangular, instead of tetrahedral ele-ments. A reduced number of finite elements means reduced calculation and less memory required. The resulting finite element mesh is shown in Fig. 22. This mesh has 2722 FE, with 2324 nodes, having extremely moderate complexity compared to structure size (18.4 m 12 m 8 m).
Finite element mesh is rechecked. It is found that the density of the mesh is acceptable, without any irregularity, guaranteeing high accuracy in further calculations. All linear elements are assigned by steel material properties. Concrete material properties are assigned to the slab.
INTEGRITET I VEK KONSTRUKCIJA Vol. 15, br. 1 (2015), str. 31–37
STRUCTURAL INTEGRITY AND LIFEVol. 15, No 1 (2015), pp. 31–37
34
Experimental and numerical cross-correlated modal analysis of … Eksperimentalna i numerička uporedna modalna analiza …
Figure 16. Line 3D model.
Figure 17. Linear model with assigned cross section to vertical
columns.
Figure 18. Linear model with all cross sections assigned.
Figure 19. Complete 3D model.
Figure 20. Cross section of the vertical columns.
Figure 21. Cross section of the grillage structure.
Table 2. Cross section dimensions (I beam).
h (mm) b (mm) t (mm) s (mm) I1000 1000 400 25 20 I500 500 220 17 12 I400 400 180 13.5 8.6
INTEGRITET I VEK KONSTRUKCIJA Vol. 15, br. 1 (2015), str. 31–37
STRUCTURAL INTEGRITY AND LIFEVol. 15, No 1 (2015), pp. 31–37
35
Experimental and numerical cross-correlated modal analysis of … Eksperimentalna i numerička uporedna modalna analiza …
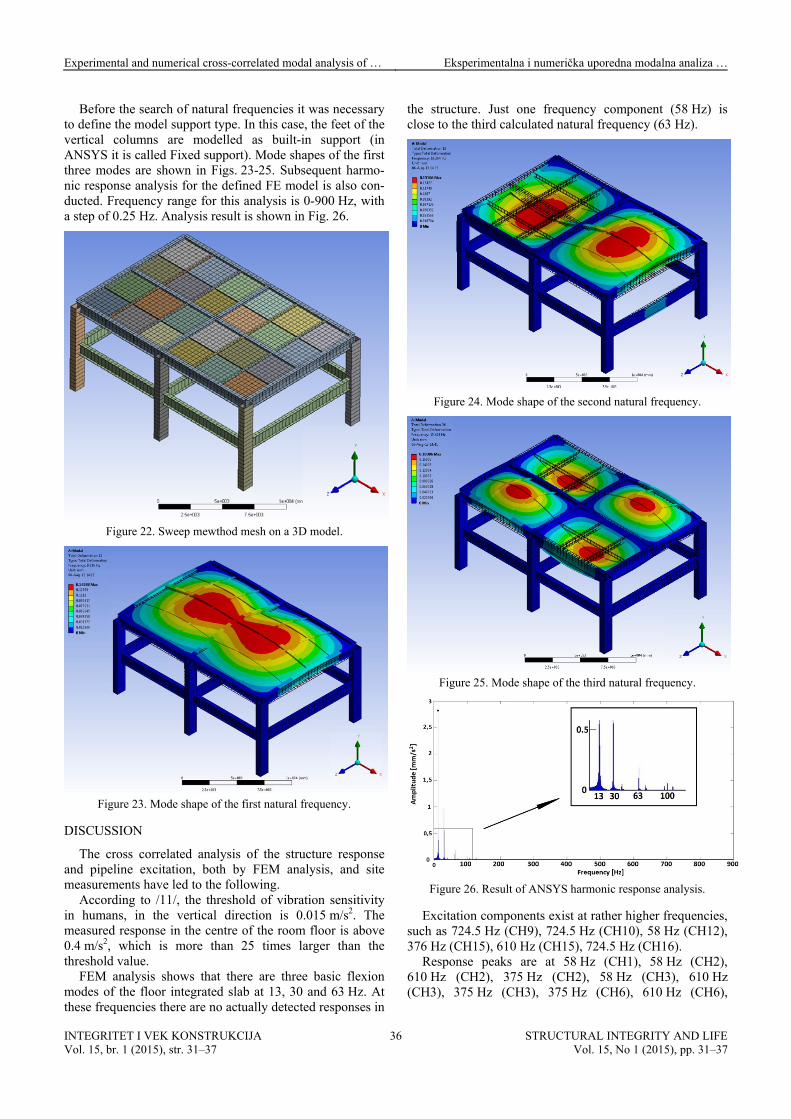
Before the search of natural frequencies it was necessary to define the model support type. In this case, the feet of the vertical columns are modelled as built-in support (in ANSYS it is called Fixed support). Mode shapes of the first three modes are shown in Figs. 23-25. Subsequent harmo-nic response analysis for the defined FE model is also con-ducted. Frequency range for this analysis is 0-900 Hz, with a step of 0.25 Hz. Analysis result is shown in Fig. 26.
Figure 22. Sweep mewthod mesh on a 3D model.
Figure 23. Mode shape of the first natural frequency.
DISCUSSION
The cross correlated analysis of the structure response and pipeline excitation, both by FEM analysis, and site measurements have led to the following.
According to /11/, the threshold of vibration sensitivity in humans, in the vertical direction is 0.015 m/s2. The measured response in the centre of the room floor is above 0.4 m/s2, which is more than 25 times larger than the threshold value.
FEM analysis shows that there are three basic flexion modes of the floor integrated slab at 13, 30 and 63 Hz. At these frequencies there are no actually detected responses in
the structure. Just one frequency component (58 Hz) is close to the third calculated natural frequency (63 Hz).
Figure 24. Mode shape of the second natural frequency.
Figure 25. Mode shape of the third natural frequency.
Figure 26. Result of ANSYS harmonic response analysis.
Excitation components exist at rather higher frequencies, such as 724.5 Hz (CH9), 724.5 Hz (CH10), 58 Hz (CH12), 376 Hz (CH15), 610 Hz (CH15), 724.5 Hz (CH16).
Response peaks are at 58 Hz (CH1), 58 Hz (CH2), 610 Hz (CH2), 375 Hz (CH2), 58 Hz (CH3), 610 Hz (CH3), 375 Hz (CH3), 375 Hz (CH6), 610 Hz (CH6),
INTEGRITET I VEK KONSTRUKCIJA Vol. 15, br. 1 (2015), str. 31–37
STRUCTURAL INTEGRITY AND LIFEVol. 15, No 1 (2015), pp. 31–37
36
Experimental and numerical cross-correlated modal analysis of … Eksperimentalna i numerička uporedna modalna analiza …
INTEGRITET I VEK KONSTRUKCIJA Vol. 15, br. 1 (2015), str. 31–37
STRUCTURAL INTEGRITY AND LIFEVol. 15, No 1 (2015), pp. 31–37
37
58 Hz (CH6), 610 Hz (CH7), 58 Hz (CH7), 375 Hz (CH7), 375 Hz (CH8), 58 Hz (CH8), 610 Hz (CH8).
The identified structure response does not coincide with the calculated natural frequencies of the structure. On the other hand, the response is evident at characteristic frequen-cies of excitation (58 Hz, 375 Hz and 610 Hz). Finding upon this compliance would be that the vibrations of the control room floor are mainly caused by transmitted pipe-line vibrations. In other words, the vibrations of the pipeline do not excite the natural frequency of the floor, but trans-pose itself to the structure.
Measurement points on the excitation side CH9, CH10 and CH11 are located far from measurement points on the response side. Some excitation components occur at higher frequencies (724.5 Hz) and are mainly absorbed by the structure, since not a single channel at the top of the slab had identified this frequency.
Vibration amplitudes at CH15 are ten times larger than those at CH13 and CH14. Vibration amplitudes at CH15 are five times larger than at CH16, and two times larger than at CH12
Measurement results show the presence of vibrations at 58 Hz, which is very close to one of the natural frequencies of the structure (63 Hz). The difference is approximately 10 %. It is reasonable to conclude that it is not a resonance, but a simple transfer of excitation vibrations. The same frequency component (58 Hz) exists on channel CH12. If it were the resonant frequency of the concrete slab, a compo-nent of 58 Hz would have been dominant at all response measurement points, which has not been the case. It is dominant only at measurement point CH2 that is physically close to the attaching point of the excitation sling CH12.
CONCLUSION
It was necessary to determine the source of high intensity floor vibrations in a control room of a power plant. Those excessive vibrations may be solely a reflection of dynamic impulses coming from the turbine plant, or the resonant response of the floor structure, or either the prob-lem is coupled with both phenomena. The analysis of the FE model is conducted and the natural frequencies of the concrete floor have been obtained. The full scale site meas-urement defined the characteristics of the excitation on the pipeline and the response of the floor. Cross correlated analysis of these two bundles of results directed the conclu-sion towards the vibration in the control room to be a pure reflection of dynamic excitation, delivered by two distinct pipelines. Future activities are to be focused on the pipeline suspension modification, in order to eliminate the cause of vibrations on the control room floor. The testing methodol-ogy described here, has already been justified with a variety of mechanical and civil engineering structures, and this work has moreover approved its universality.
ACKNOWLEDGEMENTS
This work has been performed within projects TR35040 and 174004, supported by the Ministry of Education, Science and Technological Development of the Republic of
Serbia, whose financial involvement has been gratefully acknowledged.
REFERENCES
1. British Standard, Guide to evaluation of human exposure to vibration in buildings, 2008.
2. Chanaka, M.A., David, P.T, Nimal, J.P., Dynamic performance characteristics of an innovative hybrid composite floor plate system under human-induced loads, Composite Structures 96 (2) (2013): 590-600.
3. Mello, A.V.A., Silva, J.G.S., Vellasco, P.C.G., Andrade, S.A. L., Lima, L.R.O., Dynamic analysis of composite systems made of concrete slabs and steel beams, J of Constructional Steel Research, 64(10), (2008): 1142-1151.
4. Arya, E., Ronald, L.S., A review of vibration serviceability criteria for floor structures, Computers & Structures, 83(11), (2005): 2488-2494.
5. Iván, M.D., Paul, R., Acceleration feedback control of human-induced floor vibrations, Engineering Structures, 32(1), (2010): 163-173.
6. Silva, J.G.S., Vellasco, P.C.G., Andrade, S.A.L., Lima, L.R.O., Figueiredo, F.P., Vibration analysis of footbridges due to verti-cal human loads, Computers & Structures, 85(11), (2007): 1693-1703.
7. Costa-Neves, L.F., Silva, J.G.S., Lima, L.R.O., Jordão, S., Multi-storey, multi-bay buildings with composite steel-deck floors under human-induced loads: The human comfort issue, Computers & Structures, 136(5), (2014): 34-46.
8. Lee, S.H., Lee, K.K., Woo, S.S., Cho, S.H., Global vertical mode vibrations due to human group rhythmic movement in a 39 story building structure, Engng Structures, 57(12), (2013): 296-305.
9. Varella, W., Battista, R., Control of vibrations induced by people walking on large span composite floor decks, Engng. Structures, 33(11), (2011): 2485-2494.
10. Allen, D.E., Building vibration from human activities, Concrete Int.: Design and Construction, 12(6), (2011): 66-73.
11. Murray, T., Allen, D., Ungar, E., Floor Vibrations Due to Human Activity, American Institute for Steel Construction, 1997.
12. Pavic, A., Reynolds, P., Modal testing and dynamic FE model correlation and updating of a prototype high-strength concrete floor, Cement and Concrete Composites, 25(10), (2003): 787-799.
13. Pavic, A., Reynolds, P., Waldron, P., Bennett, K.J, Critical review of guidelines for checking vibration serviceability of post-tensioned concrete floors, Cement and Concrete Compos-ites, 23(2), (2001): 21-31.
14. Demler, M., High Speed Analog to Digital Conversion, Aca-demic Press Limited, London, 1991.
15. Hongwei, W., FFT Basics and Case Study Using Multi-Instrument, Virtins Technology, 2009.


![Flexible cross-correlated (C2) imaging method for the modal ......erties is the spatially and spectrally resolved imaging technique (S2) [6]. There currently exist two approaches for](https://img.pdfslide.net/doc/110x75/5f8f0ada49ea5464db5e7943/flexible-cross-correlated-c2-imaging-method-for-the-modal-erties-is-the.jpg)