Embed Size (px)
Citation preview

1
Experimental Determination of Convective Heat Transfer Coefficient
of Tissue Mimicking Gel
A thesis submitted in partial fulfillment of the requirement for a degree of
Bachelor of Technology
in
Biomedical Engineering
by
Seeta Hembram
Department of Biotechnology and Medical Engineering
National Institute of Technology
Rourkela
2013

2
EXPERIMENTAL DETERMINATION OF CONVECTIVE HEAT
TRANSFER COEFFICIENT OF TISSUE MIMICKING GEL
A thesis submitted in partial fulfillment
of the requirements for the degree of
Bachelor of Technology
in
Biomedical Engineering
by
SEETA HEMBRAM
(109BM0006)
Under the guidance of
Dr. AMITESH KUMAR

3
NATIONAL INSTITUTE OF TECHNOLOGY
ROURKELA
CERTIFICATE
This is to certify that the thesis entitled “Experimental Determination of
Convective Heat Transfer Coefficient of Tissue Mimicking Gel” submitted by Ms.
Seeta Hembram in partial fulfillment of the requirements for the award of Bachelor
of Technology Degree in Biomedical Engineering at National Institute of
Technology, Rourkela (Deemed University) is an authentic work carried out by her
under my guidance.
To the best of my knowledge the matter embodied in the thesis has not been
submitted to any University/Institute for the award of any Degree or Diploma.
Date: Prof. Amitesh Kumar
Dept. of Biotechnology and Medical Engg.
National Institute of Technology
Rourkela-769008

4
ACKNOWLEDGEMENT
I avail this opportunity to extend my sincere appreciation and gratitude to my guide
Prof. Amitesh Kumar, Biotechnology and Medical Engineering Department, for
his invaluable academic and professional guidance, constant encouragement and
kind help at different stages for the execution of this project.
I also express my sincere gratitude to all the faculty members, Department of
Biotechnology and Medical Engineering, for providing valuable departmental
facilities and for constantly evaluating me and providing me with insightful
suggestion.
Submitted by:
Seeta Hembram
Roll No: 109BM0006
Dept. of Biotechnology and Medical Engg.
National Institute of Technology,
Rourkela

5
DECLARATION BY THE CANDIDATE
I Seeta Hembram, a student of Department of Biotechnology and Medical Engineering,
National Institute of Technology Rourkela bearing Roll No: 109BM0006 hereby certify that my
B.Tech Project Report entitled “Experimental Determination of Convective Heat transfer
Coefficient of Tissue Mimicking Gel”, under the guidance of Prof. Amitesh Kumar at National
Institute of Technology Rourkela, Rourkela is being submitted in partial fulfilment of the
requirements for the Degree of Bachelor of Technology in Biomedical Engineering. This is a
record of bonafide work carried out by me and the results embodied in the Project Report have
not been copied from any source. The results embodied in this Project Report have not been
submitted to any other University or Institute for the Award of any other certificate or degree.
Date:
Name: Seeta Hembram
Roll No: 109BM0006
Dept of Biotechnology and Medical Engg.
NIT Rourkela.

6
List of Figures
Figure 2.1.Schematic of K-type thermocouple wrapped with thread suspended in cubical
shaped Agarose Gel …………………………………………………………13
Figure 2.2.Connection of Bread board circuit to Portable Data Acquisition
Module (USB-4704) ……………………………………………………….. 14
Figure 2.3 Experimental setup consisting of K-type thermocouple dipped in gel media
on one end and connected to DAQ module (USB-470) on other end …..15
Figure 3.1 Temperature profile of Agarose gel at concentration 0.6% (w/v) exposed to
temperature at Twb = 60°C…………………………………………………..21
Figure 3.2.Temperature profile of Agarose gel at concentration 0.6% (w/v) exposed to
temperature at Twb = 70°C ………………………………………………….22
Figure 3.3 Temperature profile of Agarose gel at concentration 0.6% (w/v) exposed to
temperature at Twb = 80°C …………………………………………………23
Figure 3.4.Temperature profile of Agarose gel at concentration 1.4% (w/v) exposed to
temperature at Twb = 60°C………………………………………………….25
Figure 3.5 Temperature profile of Agarose gel at concentration 1.4% (w/v) exposed to
temperature at Twb = 70°C………………………………………………...26
Figure 3.6.Temperature profile of Agarose gel at concentration 1.4% (w/v) exposed to
temperature at Twb = 80°C ………………………………………………..27

7
List of Tables
Table 3.1.Variation of time to attend steady-state temperature with increasing
temperature at concentration 0.6% …………………………………………………….24
Table 3.2.Variation of time to attend steady-state temperature with increasing
temperature at concentration 1.4% ……………………………………………………..28

8
Contents
Certificate
Acknowledgement
Declaration by Candidate
List of Figures
List of Tables
Abstract
1 Introduction ………………………………………………………………………11
1.1. Introduction …………………………………………………………………..12
1.2. Literature Review ……………………………………………………………..14
1.2.1. Literature Review on Agarose Gel Properties ………………………………14
1.2.2. Literature Review on Convective Heat Transfer Coefficent ……………….. 15
2. Materials and Methods…………………………………………………………………19
2.1. Materials ………………………………………………………………………20
2.2. Methodology …………………………………………………………………..21
2.2.1. Gel Preparation ……………………………………………………………..21

9
2.2. Experimental Setup ………………………………………………………………21
2.2.2. Model Description …………………………………………………………21
2.2.3. Temperature measurement using Advantech Portable
Data Acquisition Module (USB-4704) …………………………………24
2.2.4. Calibration of thermocouple ………………………………………………..25
2.3. Experimental procedure …………………………………………………....26
2.3.1. Analytical Analysis …………………………………………………………26
2.4.2. Mathematical Modelling …………………………………………………...27
3. Results and Discussion ……………………………………………………………..28
3.1. When 0.6% (w/v) of Agarose Gel is exposed to water at temperature Twb = 60°C,
70°C and 80°C respectively…………………………………………………………29
3.2. Comparison of Temperature profile of 0.6% Agarose Gel when exposed to
different temperature ……………………………………………………………….33
3.3. When 1.4% (w/v) of Agarose Gel is exposed to water at temperature Twb = 60°C,
70°C and 80°C respectively…………………………………………………………33
3.4. Comparison of Temperature profile of 1.4% Agarose Gel when exposed to
different temperature ………………………………………………………………. 37
CONCLUTION ………………………………………………………………………. 37
REFERENCES………………………………………………………………………..38
10
Abstract
The present study deals with finding the convective heat transfer coefficient of agarose gel
prepared at two different concentrations of 0.6 % w/v and 1.4% w/v. It is carried out with the
help of very simple and easily available laboratory apparatus designed specifically for the
determination of convective heat transfer coefficient of tissue mimicking gel. This paper
demonstrates an experimental study on three reference temperatures corresponding to 60°C,
70°C and 80°C maintained in the water bath. The sample is designed in such a way that it
behaves as a lumped parameter system characterized by a uniform temperature distribution
within the system. The variation of temperature with time is recorded with the help of data
acquisition system and LabView. The convective heat transfer coefficient of tissue mimicking
gel is predicted by fitting the analytical result with the experimental result which ensures a
goodness of fit in the range of 97% - 99%. The predicted value of convective heat transfer
coefficient lies between 400-450 W/m2 K.
Keywords: Convection, Lumped parameter Analysis, Agarose gel, Tissue-mimicking gel,
Convective heat transfer coefficient.

11
Chapter 1
INTRODUCTION

12
1.1 INTRODUCTION
Agarose is one of the major components of polygalactoside agar, a neutral and non-toxic linear
polysaccharide fraction extracted from marine red algae. Agarose is a linear copolymer
composed of alternating 1,3-linked β-Dgalactopyranose and 1,4-linked 3,6-anhydro-α-L-
galactopyranose. These units are joined by (α-1,3) glycosidic link to form a polymer of 600-700
residue long. Agarose has a remarkable gel forming property. When suspension of agarose in
water is heated and cooled, the agarose forms a double helix: two molecules in parallel
orientation twist together with a helix repeat of three residues; water molecules are trapped in the
central cavity.
The setting and melting temperature for agarose gel is close to 40°C and 90°C
respectively. Agarose gels have high elastic moduli at low concentrations and they are brittle and
turbid [1]. The agarose at varying concentrations in the range of 0.5-1.0% w/w and at
temperature of 30-40°C showed a characteristic values of space variable h=6 -5
A -1
for the
light scattering system. Four different grades of agarose are available that is low Electro
Endosmosis (EEO), intermediate EEO, high EEO and very high EEO. Low EEO agarose powder
is the most common grade of purified agarose ideally used in routine electrophoresis of DNA
and RNA due to its wider range of resolution and high gel strength.
The term ‘gel’ had originated from the Latin word "gelare" which means to cause
creation of gel [2]. Gel refers to a semisolid condition of a precipitated or coagulated colloid. It
may also be called as a jelly or a jelly-like colloid which contains a large amount of water. The
term ‘gel’ should be able to define those systems which fulfill the following phenomenological
characteristics that is they should consists of two or more components one of which is a liquid,
present in substantial quantity and they need to be a soft, solid, or solid-like materials [3]. The
process of a gel formation is known as gelation. Generally gels possess the following four
properties: (1) Hydration (2) Swelling (3) Syneresis (4) Thixotropy. Due to these properties of
gels it has found a widespread clinical application in medical and research industries such as
saline gels are widely used for diagnostic images in ultrasound scanning (sonography).

13
Beside these, most recently many gelatin-based phantoms (also called tissue-mimicking
phantom) have been investigated out that mimics specific tissue acoustical and optical properties
for the purpose of photo acoustic and ultrasonic (PAUS) imaging studies that is finding
importance in more clinically realistic imaging environment. The tissue-mimicking phantom is
found to be similar to that of human soft tissue [4].
Agarose has widespread applications in separation of proteins ,enzymes and
nucleic acid, immune diffusion technology, Gel and Affinity chromatography, crystallographic
study, preparation of culture media, tissue typing, cell line verification, paternity determination,
forensic testing, finger printing, immune electrophoresis and electro focusing. It is a powerful
tool in Molecular Biology, Microbiology, Biochemistry, Cell and Structural Biology because of
its high hysteresis greater than hydrocolloid. They are used in medicine and pharmacy, and they
served as a thickening and gelling agent in food industry.
Convection is one of the distinct modes of heat transfer, it is a transfer of heat
between a relatively hot and cold portion of the fluid by mixing. Convection is restricted to the
flow of heat in fluids. If the fluid motion is caused by differences in density resulting from
temperature difference in a fluid, the heat transfer is said to be natural convection. If the fluid is
artificially fitted then the heat transfer is known as forced convection. The heat transfer
coefficient can be defined as the quantity of heat transferred in unit time through unit area at a
temperature difference of one degree between surface and surrounding. Heat transfer coefficient
will increase with increase in heat transfer and decrease in temperature difference. It is a
measuring parameter which indicates heat transfer will be larger with high heat transfer
coefficient value. The study reveals that even small geometrical changes can result in distinct
coefficients. Convective heat transfer rate is calculated from Newton’s law of cooling. The
natural convection of air has a value of convective heat transfer coefficient as 5 W/m2
K and
natural convection of water in a pipe is given as 570 W/m2K. The phase change occurring at the
surface during convection may also affect the value of convective heat transfer coefficient.
Thus it can be noted that it is important to calculate the various thermal properties
of gels which mimic tissues. According to the author’s best knowledge, no study has been
conducted until now which deals with the convective heat transfer coefficient of agarose gel.
Here we have investigated the thermal properties of gels mimicking tissues containing 0.6%

14
(w/v) and 1.4% (w/v) of agarose gel that possess similar thermal properties as that of human
tissues. This study aims at calculating heat transfer coefficient for two different concentrations of
agarose gel (0.6 and 1.4%).
1.2 LITERATURE REVIEW
1.2.1. LITERATURE REVIEW ON AGAROSE GEL PROPERTIES
Fernandez et al. [5] studied the rheological and thermal properties of agarose aqueous solution.
The agarose (D-1-LE) solution of different concentrations (0.5, 1.5, 3, 4, 5, 6, 7 and 8%, g/mL)
were prepared by mixing it in 20 mL of distilled water at 100°C and poured in cylindrical
moulds (20 mm in diameter, 2 mm thickness). The viscosity curves of agarose solution of
different concentrations obtained at 46°C, this experiment is done with the help of flow
experiment (TA Instruments AR1000 Rheometer). The results were obtained as the viscosity get
increase with the concentration of agarose solution at low concentrations up to (4% g/mL) there
is no effect of viscosity with decreasing temperature for 38-40°C, beyond this temperature, the
agarose solutions turns into gel and viscosity cannot be measured further. As the concentration
has been increased to above 4%, the viscosity has more complex behavior with decreasing
temperature but up to 60°C the viscosity does not change with temperature. As it reaches in
between 60 and 50°C, the viscosity increases with decrease in temperature. The gelation
temperature and time for the concentration of (3, 5, 6, 7 and 8%) is (34.3, 36.6, 37.0, 37.3 and
38.5°C) and (2742, 2600, 2600, 2560 and 2490 seconds) respectively.
The structure of the agarose solution and gels has been obtained with the help of
small -angle X-ray scattering (SAXS). Time dependence of the optical rotation measured at
wavelength of 436 nm for hot agarose solution initially at 90°C and cooled to temperatures of 38,
36 and 34 °C (agarose concentration 0.5%). There is no change occurred at 38°C at lower
temperature the overall change is very small that is -0.4 to -0.5° as it reaches to lower
temperature. The angular dependence of SAXS intensity from solution state at temperature 90°C
and for gel states at temperature 25°C measured for same agarose concentration (2.4% w/w).The
exposure time is 2 hour for solution and 1 hour for gel. There is a large scattering difference
between solution and gel.

15
Chen [6] studied the dynamic mechanical properties of agarose gel. The functional derivative
model used for characterization of elastic and viscous modulus with the function of frequency.
The gel with agarose concentration (2, 3, 4 and 5% w/v). The sample of 5 mm in thickness is
used for testing. The mechanical properties of gel were tested with dynamic mechanical analyzer
(DMA 2980, TA instruments) over a frequency range of 1-20 Hz with constant amplitude of
2mm. It will help in measuring the complex modulus, elastic modulus and viscous modulus of
gel and functional derivative model used to model the stress-strain relationship. The elastic
modulus of agarose gel is usually 1-2 orders of magnitude larger than viscous modulus.
Thermal and physical properties of agarose of different composition resemble to
the human tissue. Many experimental works has been conducted so far. Duck [7] had revealed
that 0.2% concentration of agarose gel that has properties similar to that of human tissue. Cooper
and Petrovic [8] investigate the distribution of temperature for the application of cryosurgery on
a clear gel made of 1.5% gelatin and 98.5% water resembles the tissue phantom. Budman et al.
[9] also used gel composition of 2% gelatin and 98% water as a tissue phantom. Rabin
performed experiment with 2.5% gelatin and 97.5% water resembling prostate. Juan et al. [10]
made the skin phantom preparation with highly purified agar powder dissolved in the mixture of
deionized water (90%) and glycerol (10%) to achieve 1% concentration.
1.2.2 LITERATURE REVIEW ON HEAT TRANSFER COEFFICIENT
The Convective heat transfer Coefficient is an important physical parameter in heat transfer
equations that is determined by experiments. Cancillo [11] had determined in his work about the
heat transfer coefficient of solid copper bar in air at constant temperature by measuring the
cooling curves with excesses of metal over the surrounding air in the range of 11-74°C and then
comparison of the data to those calculated using a mathematical model to solve the equation for
the heat flow in the bar. Gultekin and Gore [12] determine an experimental method to measure
the heat transfer coefficient for fluid system by magnetic resonance imaging. This technique
monitors the temporal variation of thermally induced nuclear shielding and measures the average
heat transfer coefficient as a function of fluid velocity. Carson et al. [13] performed four
different techniques to measure the apparent heat transfer coefficients within a typical domestic
fan oven and commercial batch oven to reveal the time–variation in heat transfer coefficient.

16
Duangthongsuk and Wongwises [14] studied the convective heat transfer behaviors of nanofluids
to predict the thermal and physical properties of nanofluids. Diller and Van den Berge [15] had
designed a method to minimize experimental uncertainties and error due to heat losses in
constant-wall-temperature convection measurement system.
Gracia et al. [16] provides an entirely new correlation to find out the heat transfer
coefficient between an air flow and a plate made up of phage change material (PCM) to present a
better stimulation of PCM heat storage systems. The application has also been extended to the
field of food processing technology to ensure the safest modes of food preservation using
mathematical models for heat transfer in food process designs. Augusto et al. [17] uses two
methods that is conductive and convective heating inside packages to determine the convective
heat transfer coefficient values for both heating and cooling using 2% agar (m/m) and pure
water taken as medium respectively.
Adam et al. [18] had predicted and determined the heat transfer surface
coefficient successfully using Computational Fluid Dynamics (CFD) for measurement of
different geometry and flows with an accuracy of 0.5% in analytical values of convective heat
transfer coefficient for laminar forced convection whereas the results shows good agreement
with universal law-of-the-wall theory and correlations from literature for turbulent forced
convection.
The reported value of heat transfer coefficient based on tissue phantom varies
from 1600-60000 W/m2 K [19]. Ruan et al. [20] studied the fluid particulate heat transfer
coefficient for two sample system consisting of cylindrical heating device, cylindrical potato
particle and a salt solution with sodium carboxy methyl solutes. The real time temperature maps
were obtained for ohmically heated solution with the help of proton-resonance frequency shift
method. The holding period, Magnetic Resonance Imaging (MRI) temperature map and
numerical solution with the help of Fourier’s Second Law can be used for determination of time-
dependent interface heat transfer coefficient. The calculated value of fluid particulate heat
transfer coefficient obtained in the range from 30-105 W/m2
K.
Hossan et al. [21] analyze the effects of cylinder radius, heat transfer coefficient
and incident frequency for the different length of cylindrical food stuffs in order to avoid the
uneven heating in the food processed product. A closed form of analytical solution is used for the
determination of temperature variation using energy equation and integral transform technique in

17
the 3D cylindrical shape food. The radius of the food remains constant at 0.5 and 1.0 cm, but the
length of the cylinder is varied from 1.25 to 5.0 cm for different study. In small cylinder,
maximum electrical field strength is obtained at the middle of the cylinder but for longer
cylinder, maximum field is obtained at the both ends of the food. Temperature variation is more
like 1D as the cylindrical length decreases except near the top or bottom surface. The variation of
radius has very small effect on temperature distribution. For higher heat transfer coefficients the
temperature distribution becomes one dimensional while the temperature difference between
maximum and minimum temperature decreases as the convective heat transfer coefficient
increase from 1.5 to 50 W/m2K.
Etheridge et al. [22] predict the temperature dependent thermal properties for
ultrasound gel. These data will help in determination of Cryprobes behavior in phantoms. The
experimental data were fit with finite element method and cosmol version 4a use for numerical
modelling. Martin et al. provided analytical expression use for the prediction of convective heat
transfer coefficient. The predicted value of heat transfer coefficient was in the order of
20kW/m2K.
Christae et al. [23] determine the time- temperature profile which will help in
determination of convective heat transfer coefficient at the fluid and solid particulate boundary
for different flow condition. This will help in continuous sterilization of liquid foods containing
solid particulate. Convective heat transfer coefficients were compared for two configuration of
holding tubes, one is having circular cross section and other one is having noncircular cross
section. A fluid that is water is inserted with immobilized sphere of vegetative cells of Bacillus
stearothermophilus. The explicit difference scheme is used for the calculation of heat transfer
equation, which will help in the determination of in activation of microorganism. Mean effective
value for the circular cross section is 350 to 1700W/m2K and for the non circular cross section is
400 to 2500 W/m2K. With increase in flow rate and temperature for this two configuration, it
will affect convective heat transfer coefficient. The presence of large number of solid particle
will affect the convective heat transfer coefficient value.
Miguel et al. [24] developed an instrument for the measurement of convective
heat transfer coefficient in large blood vessels .This work developed a mechanical simulator and
they validate an equation which analytically determines the value of h which was developed by

18
Consiglierli. The mechanical simulator that produces the flow conditions and geometry of large
blood vessels in the liver, this will help in testing the instrument.
The average value of h using the instrument obtained as 2130( W/m2K
(mean sd). This instrument helps in measuring the value of convective heat transfer coefficient
in vitro and the recurrence rate which is obtained in heptacellular carcinoma due to the high
convective loss in the vessel, these data will help in prevention of carcinoma.
Sun [25] explained the experimental approach for the determination of the surface
heat transfer coefficient of egg with the help of CFD. Empty egg shells were filled with
convective heating materials, thermal processing carried out by immersing egg filled with agar
gel in water bath. During this process temperature is recorded with the help of T-type needle
thermocouple at three different locations. The eggs were fixed in a vertical position in a holder
and the geometry of egg and accurate determination of Cartesian coordinates of the
thermocouple hot junction was determined by CFD. The water circulation with rate of 50 L/min.
and average velocity of 0.01m/s forced in a vertical direction of the egg. The initial temperature
of processed egg is (19.4 0.2°C). Using the appropriate initial and boundary condition they
predicted temperature distribution for three positions using different surface heat transfer
coefficient. An average surface heat transfer coefficient obtained as 490 82 W/m2K.

19
Chapter 2
MATERIALS AND METHODS

20
2.1. MATERIALS
Agarose powder (HIMEDIA, Low EEO): Agarose gel is taken in different
concentrations, which is used to resemble different tissue.
Petri dish: Container used in biological laboratories to culture cells. It is used in those
experiments where cross-contamination is a major problem.
K-type thermocouple: It is the most common type of thermocouple with the most widely
operating temperature range. Generally preferred for laboratory work mainly because its
nickel based and corrosion resistance. Its thermal sensitivity is approximately 41µV/° C.
Distilled water: To carry out different experimental works in physical and biological
laboratories.
Advantech portable data acquisition module (USB-4704): It is a 48kS/s, 14-bit, 8-channel
multi-functional module with analog I/O, digital I/O and counter function specifically
recommended for laboratory experiments. It measures the temperature recorded by
transducer and converts it into corresponding voltage signal in mV.
Water bath: Vessel containing water which can be kept at a desired temperature under
constant monitoring of temperature.
Analytical Laboratory Balance: Used for measuring the quantity of substance.
Bread Board: Used in electronics laboratories to test circuits. A complete circuit consists
of wires and components simply pushed into the holes which are freely movable to any
position on bread board template.
Lab View Software: It is a system design platform and development environment for a
visual programming language from National Instruments. This software is commonly
used for data acquisition, instrument control, and industrial automation on a variety of
platforms.

21
2.2. METHODOLOGY
2.2.1. Gel Preparation:
For this experiment, different concentrations of agarose media with 0.6% w/v and 1.4% w/v
respectively are used. Different concentrations of agarose gel are used to know the effect of
convective heat transfer coefficient values with regard to analytical values. To study the variation
of temperature with increasing time, even a small quantity of agarose powder is sufficient. So, it
is customary to take about 0.3 and 0.7 gram of agarose powder (HIMEDIA) in 50 mL of distilled
water respectively. For our requirement, 50-100 mL of beaker is used. Add powder slowly in the
beaker whilst stirring to avoid clumping. The agarose powder is allowed to hydrate in solution
for few minutes before heating to allow for quick and easier dissolution. The time and power
settings are adjusted in accordance to microwave output strength. To prevent overheating of
solution, the beaker is removed after one minute of interval from microwave oven and swirl
gently and carefully to ensure uniform homogeneous mixing of all the particles. Precautions
should be taken to avoid over boiling as it may cause agarose hydrolysis and lower gel strength.
During heating process, sufficient care should to be taken to avoid any water loss due to
evaporation, which may adversely affect the composition of concentration.
Also, it is advisory to continue heating with regular stirring at a regular time
interval to ensure uniform heat distribution over the whole surface area and check uniform
mixing of solution free from any suspended particle. The purpose of using the gel concentration
of 0.6% m/v and 1.4%m/v respectively for our experimental work is to mimic different tissues in
human body which is determined by different thermal conductivity of gel concentration as
worked by Zhange et al. [26].
2.3. EXPERIMENTAL SETUP
2.3.1. Model Description
This experiment aims at measuring the convective heat transfer coefficient (h) for heating of
different concentrations of agarose gel (0.6% & 1.4%) using water as surrounding media which
is maintained at temperature of 60°C, 70°C and 80°C .

22
This experiment makes use of simple and convenient techniques of sample
preparation and setup for experiment. The apparatus consists of a K-type thermocouple dipped in
agarose gel to such a position that it just lies at the mid-point of designed geometry. We prefer
here the cubical shape of gel having equal dimensions of 7 mm along all the dimensions (in
length, breadth and height) as shown in Figure 1.1 so that it behaves as a lumped parameter
system. For a system to be in lumped parameter its Biot Number must be less than one (Bi < 1).
The advantage of using such system being approximating the thermal conductivity to infinity as
stated by Fourier’s Law that assumes the temperature at the thermocouple tip to be equal to the
temperature at the sample surface. It minimizes the temperature gradient within the system so
that the temperature at every point inside the system is read out to be uniformly distributed. This
implies the resistance to conduction within the system being apparently small compared to
resistance to heat transfer at its interface.
Figure:2.1. Schematic of K-type thermocouple wrapped with thread suspended in cubical
shaped Agarose Gel
23
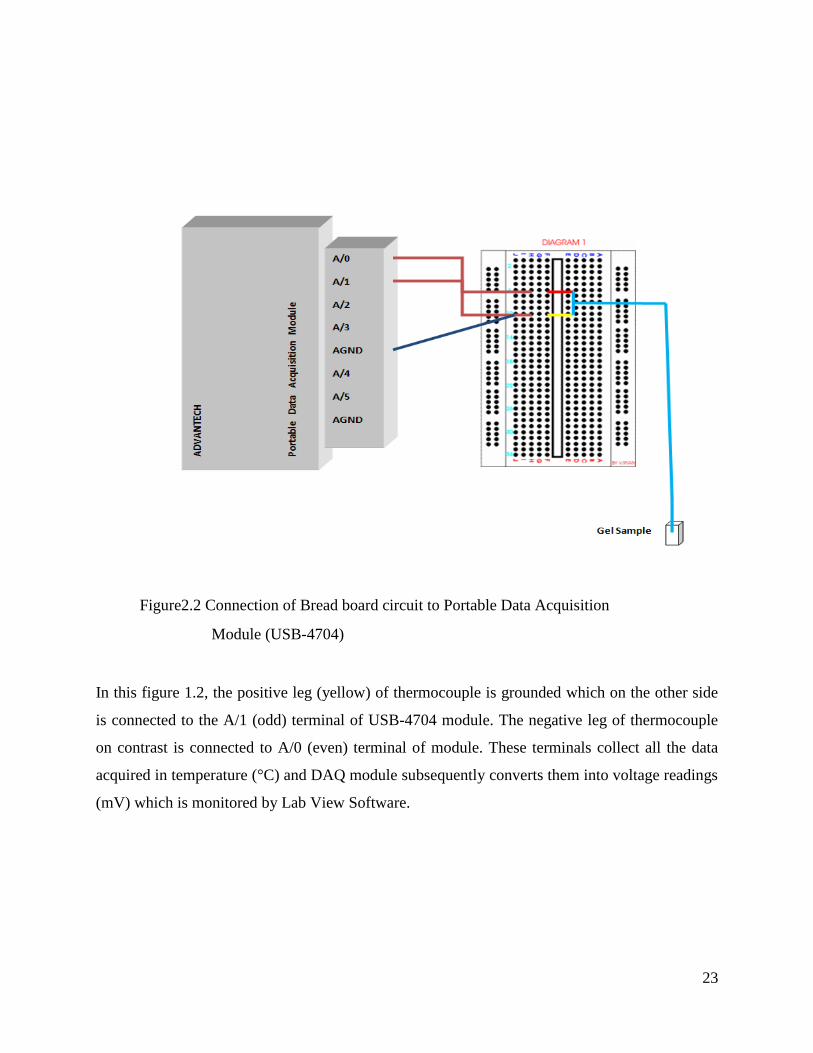
Figure2.2 Connection of Bread board circuit to Portable Data Acquisition
Module (USB-4704)
In this figure 1.2, the positive leg (yellow) of thermocouple is grounded which on the other side
is connected to the A/1 (odd) terminal of USB-4704 module. The negative leg of thermocouple
on contrast is connected to A/0 (even) terminal of module. These terminals collect all the data
acquired in temperature (°C) and DAQ module subsequently converts them into voltage readings
(mV) which is monitored by Lab View Software.

24
Figure 2.3. Experimental setup consisting of K-type thermocouple dipped in gel
medium on one end and connected to DAQ module (USB-470) on other end.
2.3.2. Temperature measurement using Advantech Portable Data Acquisition
Module (USB-4704)
K-type thermocouple acts as a transducer to convert the temperature variations to variations in
the voltage. The variation in voltage is received via Advantech portable data acquisition module
(USB-4704) mainly in the range of millivolt (mV).The data received in this process is highly
susceptible to noise pollution.
Hence, the most easy, effective and accurate way to find the voltage value is by
finding the Arithmetic mean by effectively calculating the mean of 1500 samples. For the
purpose we sampled the data at the rate of 1500 samples/sec.

25
If N is the number of samples taken in one second, then the arithmetic mean is given by
The precision of voltage value largely depends on the more number of samples. The voltage
values are then stored by using write measurement files.
2.3.3. Calibration of Thermocouple
Calibration is the most important task in the whole procedure. The thermocouple is calibrated to
avoid any temperature variations due to resistance of thermocouple wire showing the precise
temperature with an error of 5°C.
2.4. EXPERIMENTAL PROCEDURE
2.4.1. Analytical Analysis:
The gel sample is cut out with accurate precision in cubical shape as the value of h is largely
dependent on surface area and volume of sample as governed by Equation 1.3.
During heating process, the loss is due to convection. As learnt from daily observation that any
hot object when left by its own begins to cool or heated gradually until it attains the temperature
of the surrounding. This phenomenon can be explained from Newton’s Law of Cooling which
states that the rate of cooling/heating of an object is approximately proportional to the
temperature difference ΔT. This leads to the formulation of governing rate Equation 1.1 i.e.
Q = h A (T – Twb) (1.1)
where Q is heat flow(in J/s = W) , A is heat transfer surface area (in m²) ,T is the temperature of
system surface , Twb is the temperature of fluid far from the surface maintained in water bath and
h is the heat transfer coefficient (in W/(m²K)).
The water bath is first maintained at a temperature of Twb = 60°C. The sample piece is initially at
a uniformly temperature of Ti at (t<0) and then immersed into the water bath of temperature Twb
(>Ti).

26
The quenching is said to begin at time t=0, so the temperature of the system begins to rise for
time t>0 exponentially as governed by Equation 1.9.
Every sample is kept for 2 minutes (120 seconds) in hot water until heat transfer takes place at
the interface to balance the transient process. The sample is then carefully taken out and water
droplets suspended on the surface is gently removed using tissue paper to avoid cooling effect.
2.4.2. Mathematical Modelling:
Once the temperature gradients within the system are neglected, there is no problem from within
the framework of the heat equation. Therefore the transient temperature response is determined
by formulating an overall energy balance which relates the rate of heat loss at the surface to rate
of change of internal energy given in Equation 1.2.
h A (T – Twb) = ρ V C (1.2)
or
= (Twb – T) (1.3)
Introducing the temperature difference
θ = T – Twb (1.4)
and recognizing that = follows that
or
= θ (1.5)
Separating variables and integrating from the initial condition, for which t=0 and T (0)=Ti,
it follows that
= ∫ ∂t (1.6)
27
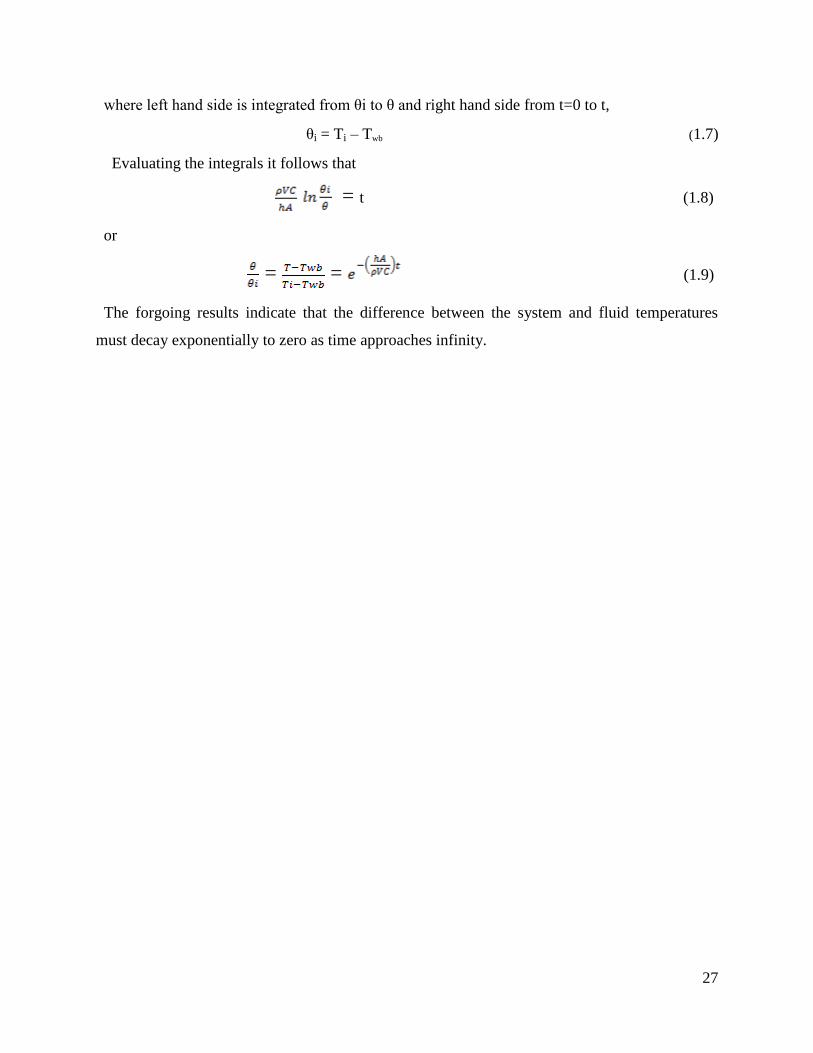
where left hand side is integrated from θi to θ and right hand side from t=0 to t,
θi = Ti – Twb (1.7)
Evaluating the integrals it follows that
= t (1.8)
or
= = (1.9)
The forgoing results indicate that the difference between the system and fluid temperatures
must decay exponentially to zero as time approaches infinity.

28
Chapter 3
RESULTS AND DISCUSSION

29
When the gel sample is exposed to different media, heat transfer takes place from the gel surface
via convection. An inquiry is conducted to study the heat transfer coefficient of the gel sample.
The gel sample is allowed to absorb heat at a temperature of 60°C, 70°C and 80°C sequentially
from the room temperature of 37°C by immersing it in water bath containing water at respected
temperature; the gel sample is then allowed to cool by its own in room air. The temperature
response is recorded using data acquisition system and Lab View. Numerical modelling is done
to study the heat transfer coefficient when the gel sample is immersed in hot water with
respected temperature and then the numerical and experimental results are compared. The heat
transfer coefficient numerically predicted to the temperature profile closely fits to the
experimental observation taken for the heat transfer coefficient for the given system.
3.1. When 0.6% (w/v) of Agarose Gel is exposed to water maintained at temperature
Twb= 60°C, 70°C and 80°C respectively
Figure 3.1, Figure 3.2 and Figure 3.3 shows the temperature profile of gel sample when exposed
to water at temperature Twb=60°C, 70°C and 80°C respectively. The initial temperature of gel
sample is at temperature Ti= 20°C with gel concentration of 0.6% (w/v). It is then immersed in
hot water and is allowed to heat until it attends a steady-state condition. A steady-state condition
in thermodynamics is when any property of the system is unchanging with time. The time taken
to reach the steady state temperature is recorded and is given in Table 3.1 for different gel
concentrations and temperature exposure.

30
Figure 3.1. Temperature profile of agarose gel at concentration 0.6% (w/v) exposed to
temperature at Twb = 60°C

31
Figure:3.2. Temperature profile of Agarose gel at concentration 0.6% (w/v) exposed to
temperature at Twb = 70°C

32
Figure:3.3. Temperature profile of Agarose gel at concentration 0.6% (w/v) exposed to
temperature at Twb = 80°C

33
The numerical analysis is also plotted, shown by broken lines. The graphs obtained by numerical
analysis indicate that the results obtained by Mathematical Modelling have a closer fit to
maximum accuracy with the values obtained by experimental results. The heat transfer
coefficient was thus found out to be 400 (W/m² K).
3.2. Comparison of Temperature profile of 0.6% agarose gel when exposed to different
Temperature
Table 3.1. Variation of time to attend steady-state temperature with increasing temperature at
concentration 0.6%
Concentration of Agarose-Gel
(w/v in %)
Temperature maintained in
Water Bath, Twb (°C)
Time to attend steady-state
temperature (t in sec.)
0.6 % 60°C 50 sec.
0.6 % 70°C 55 sec.
0.6 % 80°C 60 sec.
3.3. When 1.4% (w/v) of agarose gel is exposed to water maintained at temperature
Twb= 60°C, 70°C and 80°C respectively
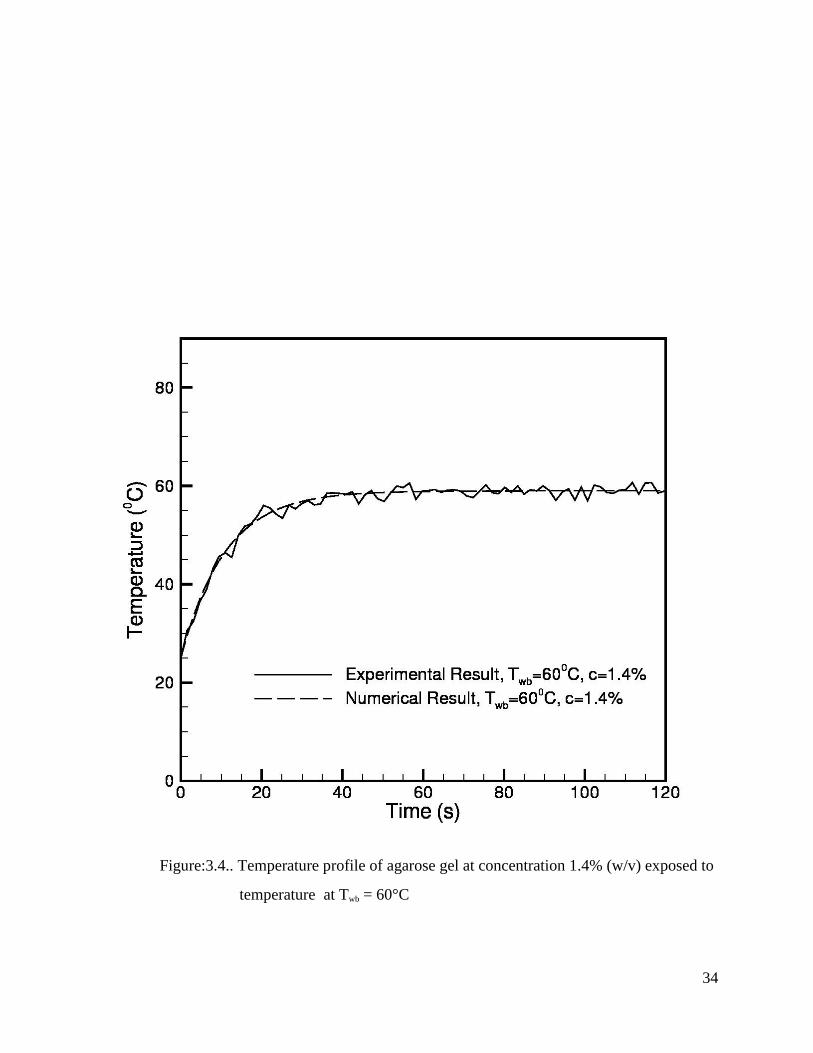
Figure 3.4, Figure 3.5 and Figure 3.6 show the temperature profile of gel sample when exposed
to water at temperature Twb=60°C, 70°C and 80°C respectively. The initial temperature of gel
sample is at temperature Ti= 25°C with gel concentration of 1.4% (w/v). It is then immersed in
hot water and is allowed to heat until it attends a steady-state condition. The time taken to reach
the steady state temperature is given in Table 3.2 for different gel concentrations and temperature
exposure.
34
Figure:3.4.. Temperature profile of agarose gel at concentration 1.4% (w/v) exposed to
temperature at Twb = 60°C

35
Figure:3.5. Temperature profile of agarose gel at concentration 1.4% (w/v) exposed to
temperature at Twb = 70°C

36
Figure:3.6. Temperature profile of agarose gel at concentration 1.4% (w/v) exposed to
temperature at Twb = 80°C

37
3.4. Comparison of Temperature profile of 1.4% agarose gel when exposed to different
Temperature
Table 3.2. Variation of time to attend steady-state temperature with increasing temperature at
Concentration 1.4%
Concentration of Agarose-Gel
(w/v in %)
Temperature maintained in
Water Bath Twb ( °C)
Time to attend steady-state
temperature ( t in sec.)
1.4% 60 °C 42 sec.
1.4% 70 °C 46 sec.
1.4% 80 °C 50 sec.
CONCLUSION
The initial temperature of agarose gel at 0.6% w/v was 20°C, which increased gradually due to
heating. It was observed that the time taken to reach higher temperature i.e. 80°C was more than
the time taken to reach 60°C. When the concentration of agarose was kept 1.4% w/v, then the
initial temperature of the gel was observed to be 25°C. Therefore, it could be said that at higher
concentrations of agarose, the initial temperature of the gel also increased. This variation in
temperature is a result of the internal properties of the gel itself. The convective heat transfer
coefficient of tissue mimicking gel is predicted by fitting the analytical result with the
experimental result which ensures a goodness of fit in the range of 97% - 99%. The predicted
value of convective heat transfer coefficient lies between 400-450 W/m2 K.

38
REFERENCES
1. A. Clark, D. Rowlands, S. Murphy, Small-Angle X-ray Scattering Characterisation of
Agarose Sols and Gels, American Chemical Society, 22:180-188, 1989.
2. Donald Venes ;Taber's Cyclopedic Medical Dictionary,21th
Edition, 2005.
3. K. Almdal,J. Dyre, S. Hvidt and O.Kramer; Towads a phenomenological definition of the
term ’gel’, Polymer Gels Networks,1:5-17,1993.
4. T. Ling, Q. Jin, H. Yao, H. Zheng; Design and Characterization of a Tissue-Mimicking
Phantom for Ultrasonic Elastography, IEEE, 978:4244-4713, 2010.
5. E. Fernandez, D. Lopez, C. Mijangos, M. Duskova, M. Ilavsky, K. Dusek; Rheological
and Themal Properties of Agarose Aqueous Solutions And Hydrogels, Journal of
polymer science, 46:322-328, 2007.
6. Biomechanics and Motion Analysis - Agarose Gel Material Properties.html.
7. F.A. Duck., Physical Properties of Tissues: A Comprehensive Reference Book,
Academic Press, San Diego,1990.
8. T. E. Cooper and W. E. Petrovic; An Experimental Investigation of the Temperature
Field Produced by a Cryosurgical Cannula, Journal of Heat Transfer, 96:415-420, 1974.
9. H. Budman, A. Shitzer, S.Giudice; Investigation of Temperature Fields around embedded
Cryoprobes, Journal of Biomechanical Engineering, 108:40-48, 1986.
10. J. C. R. S. Juan, B. Choi, W. Franco, J. S. Nelson and G. Augilar; Effect of ambient
humidity on light transmittance through skin phantoms during cryogen spray cooling,
Journal of Physics in Medicine and Biology, 51:113-120, 2006.
11. M. L. Cancillo, An Approximate Method of Calculating the Heat Transfer Coefficient in
Metal Bar, Journal of Engineering Physics and Thermophysics, 73(6), 2000.
12. D. H. Gultekin and J. C. Gore; Measurement of heat transfer coefficients by nuclear
magnetic resonance, Journal of Magnetic Resonance Imaging, 26:1323-1328, 2008.
13. J. K. Carson, J. Willix and M. F. North; Measurements of heat transfer coefficients within
convection ovens, Journal of Food Engineering, 72:293-301, 2006.
14. W. Duangthongsuk and S. Wongwises; Effect of thermophysical properties models on
the predicting of the convective heat transfer coefficient for low concentration nanofluid,

39
Journal of International Communications in Heat and Mass Transfer, 35:1320-1326,
2008.
15. T. Diller and K. VandenBerghe , Analysis and Design of Experimental Systems for Heat
Transfer Measurement from Constant-Temperature Surfaces, Virginia Polytechnic
Institute and state University, Blackburg, Virginia.
16. A. Gracia, D. David, A. Castell, L.F. Cabeza, J. Virgone; A correlation of the convective
heat transfer coefficient between an air flow and a phase change material plate, Journal of
Applied Thermal Engineering, 51:1245-1254, 2013.
17. P.E.D. Augusto, T.F. Pinheiro and M. Cristianini; Determining Convective Heat Transfer
Coefficient (h) for heating and cooling of bottles in water immersion, Journal of Food
Process Engineering, 35:54-75, 2012.
18. N. Adam.,B. Blocken and J. Carmeliet; Determiation of surface convective heat transfer
coefficients by CFD, 11th
Canadian Conference on Building Science and Technology,
Alberta, 2007.
19. L. Savassand, L. Renderberg, G. Aguilar, B. Majaron, S. Kimel, E. Lavarnia and J.
Nelson, Cooling Efficiency of Cryogen Spray During Laser Therapy of Skin, Lasers in
Surgery and Medicine, 32:137-142, 2003.
20. X. Ye, R. Ruan, P. Chen, C. Doona AND I. Tuab, MRI Temperature Mapping and
Determination of Liquid Particulate Heat Transfer Coefficient in an Ohmically Heated
Food System, Journal of Food Science , 68, 2003.
21. M. Hossan, Analysis of microwave heating for cylindrical shaped objects, International
Journal of Heat and Mass Transfer, 53:5129-5138, 2010.
22. M. Etheridge, J. Choi, S. Ramadhyani, J. Bishof, Methods for Characterizing Convective
Cryoprobe Heat Transfer in Ultasound Gel Phantoms, J. Biomech. Eng, 135(2), 2013.
23. I. Christae, J. Patel and R. Toledo, Fluid to Particle Heat Transfer Coefficients in
Holding Tubes Having Non Circular Cross Section, JOURNAL OF FOOD SCIENCE,
70, 2005.
24. A. Miguel, F. Nascimento, A. Rocha, I. Santos, An instrument to measure the convective
heat transfer coefficients on large vessels, IEEE, 117(20), 2008.
25. Da Wen Sun, Computational Fluid Dynamics in Food Processing, Contemporary Food
Engineering Series, 2007.

40
26. M. Zhang, J. Che, J. Chen, H. Zhao, L. Yang, Z. Zhong and J. Lu; Experimental
Determination of Thermal Conductivity of Water-Agar Gel at Different Concentrations
and Temperatures, Journal of Chemical and Engineering Data, 56:859-864, 2011.