Embed Size (px)
Citation preview
www.irstea.fr
Mazzella, N., Byers, H., Bernard, M., Fauvelle, V.,
Lissalde, S., Guibaud, G., Booij, K.
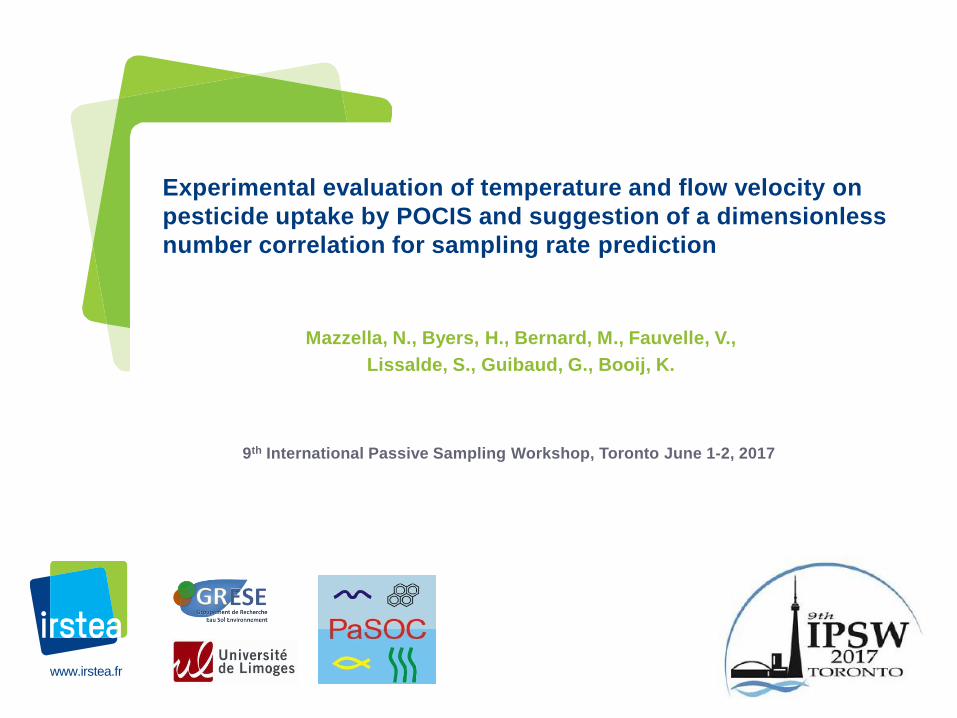
Experimental evaluation of temperature and flow velocity on
pesticide uptake by POCIS and suggestion of a dimensionless
number correlation for sampling rate prediction
9th International Passive Sampling Workshop, Toronto June 1-2, 2017
2
time
ku
ke
Ksw
Ns
tk
swwstseeKCMN
1)(e
usw
k
kK With
tR
NC
s
Sw
Time Weighted
Average (TWA)
Concentrations sws
se
KM
Rk
Kinetics and calibration Water
Boudary
Layer
3
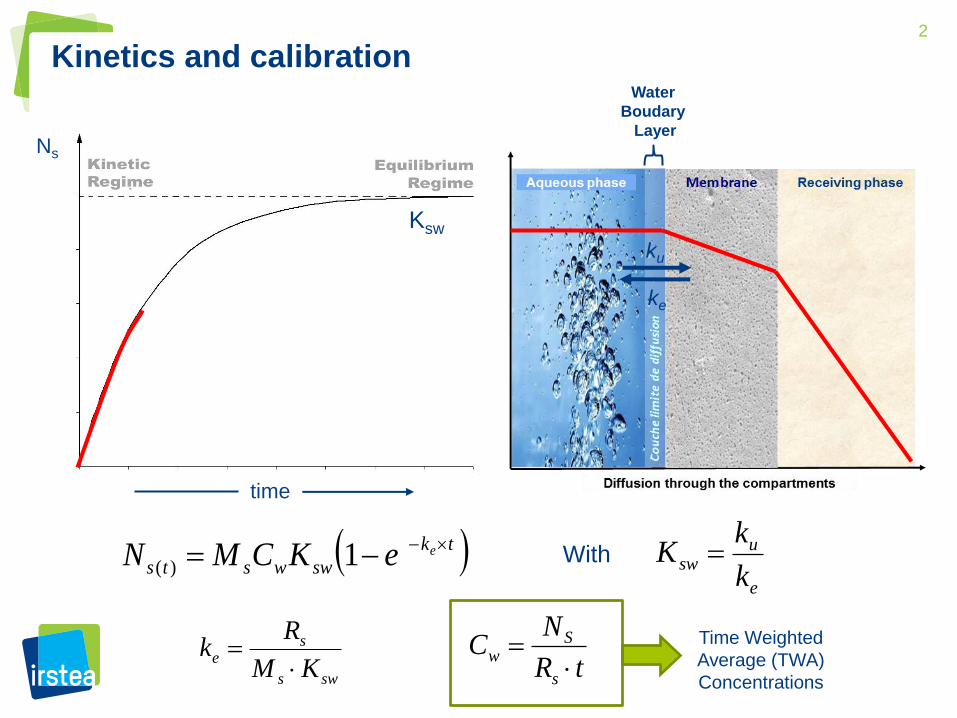
atrazine
diuron
0
0.05
0.1
0.15
0.2
0.25
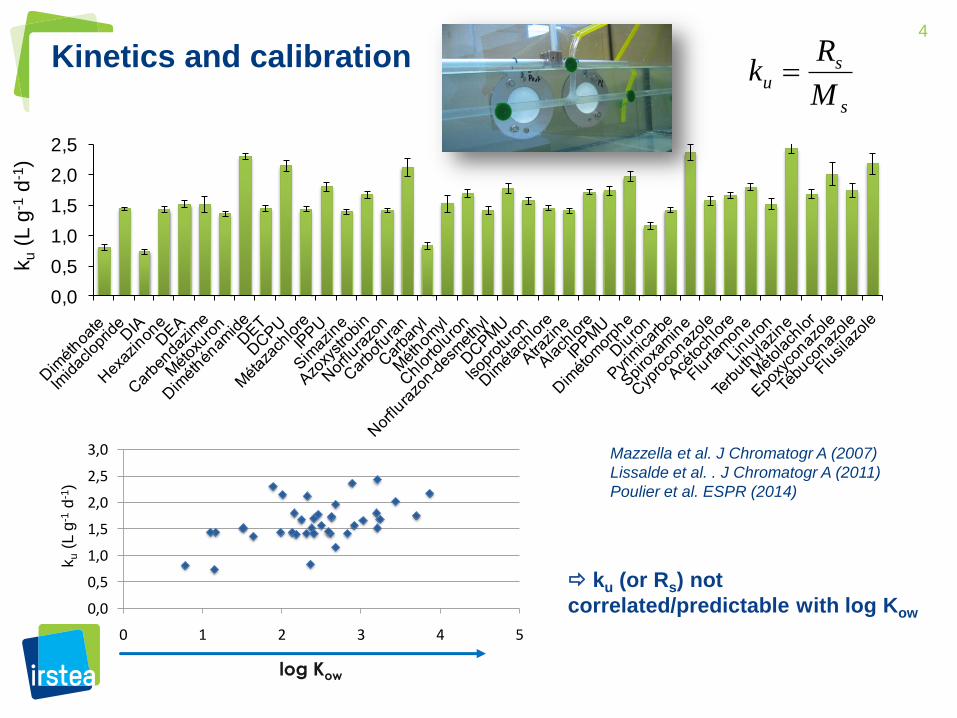
High data dispersion
- various flowing conditions (0 to dozens of cm.s-1)
- various temperatures, salinity/conductivity
- various surface exposures (18 or 45 cm2)
- various sorbents (but Oasis HLB is mainly used)
…
L.d-1
Alvarez, 1999
Alvarez et al., 2004
Hernando et al., 2005
Mazzella et al., 2007
Martinez Bueno et al., 2009
Lissalde et al., 2011
Ibrahim et al., 2013
Kinetics and calibration
4
Kinetics and calibration
0,0
0,5
1,0
1,5
2,0
2,5
ku (
L g
-1 d
-1)
log Kow
0,0
0,5
1,0
1,5
2,0
2,5
3,0
0 1 2 3 4 5
ku
(l j-1
g-1)
Log Kow
ku (
L g
-1 d
-1)
Mazzella et al. J Chromatogr A (2007)
Lissalde et al. . J Chromatogr A (2011)
Poulier et al. ESPR (2014)
ku (or Rs) not
correlated/predictable with log Kow
s
su
M
Rk
5
Prediction of sampling rates
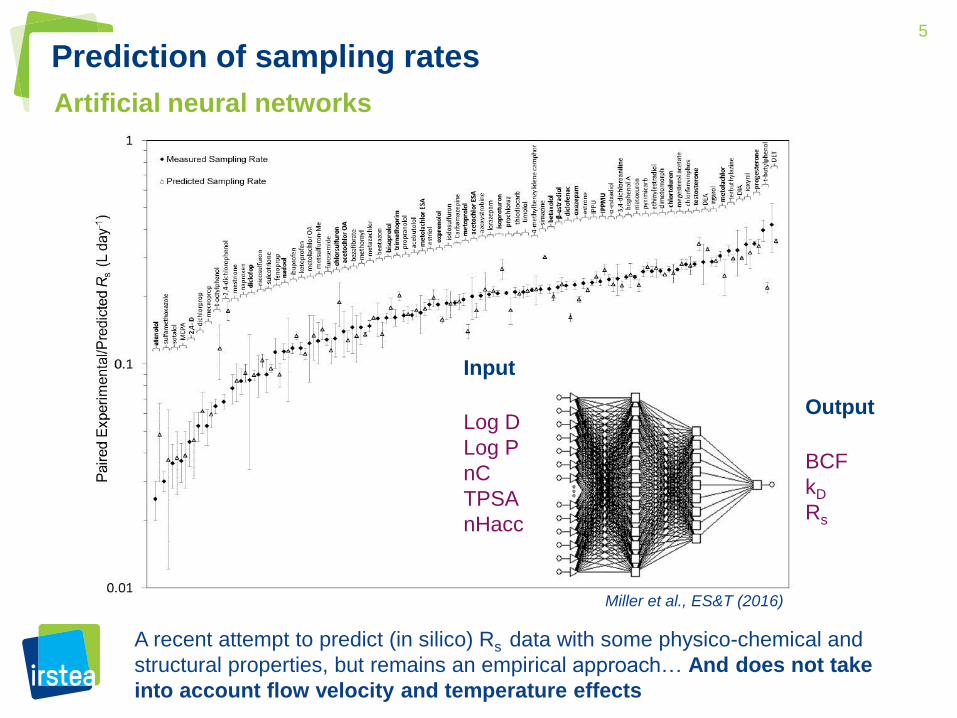
Miller et al., ES&T (2016)
Artificial neural networks
A recent attempt to predict (in silico) Rs data with some physico-chemical and
structural properties, but remains an empirical approach… And does not take
into account flow velocity and temperature effects
Input
Log D
Log P
nC
TPSA
nHacc
Output
BCF
kD
Rs
6
Sswmmwws kKkKkkR
A 1111
0
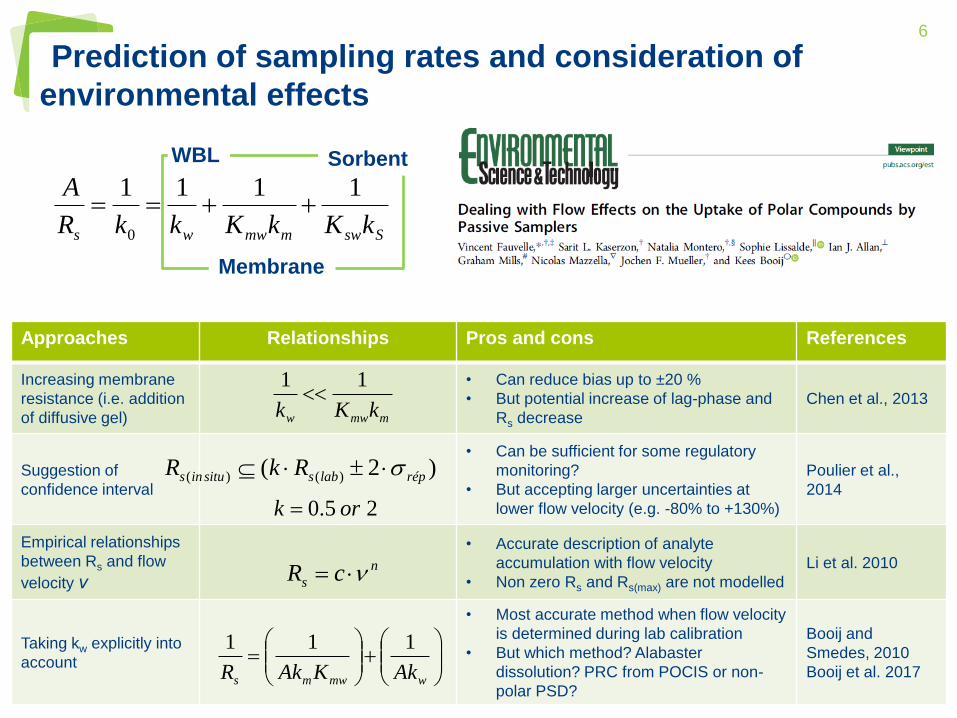
Prediction of sampling rates and consideration of
environmental effects
Sswmmwws kKkKkR
A 1111
0
Approaches Relationships Pros and cons References
Increasing membrane
resistance (i.e. addition
of diffusive gel)
• Can reduce bias up to ±20 %
• But potential increase of lag-phase and
Rs decrease
Chen et al., 2013
Suggestion of
confidence interval
• Can be sufficient for some regulatory
monitoring?
• But accepting larger uncertainties at
lower flow velocity (e.g. -80% to +130%)
Poulier et al.,
2014
Empirical relationships
between Rs and flow
velocity ν
• Accurate description of analyte
accumulation with flow velocity
• Non zero Rs and Rs(max) are not modelled
Li et al. 2010
Taking kw explicitly into
account
• Most accurate method when flow velocity
is determined during lab calibration
• But which method? Alabaster
dissolution? PRC from POCIS or non-
polar PSD?
Booij and
Smedes, 2010
Booij et al. 2017
mmww kKk
11
n
s cR
)2( )()( réplabssituins RkR
wmwms AkKAkR
111
25.0 ork
WBL
Membrane
Sorbent
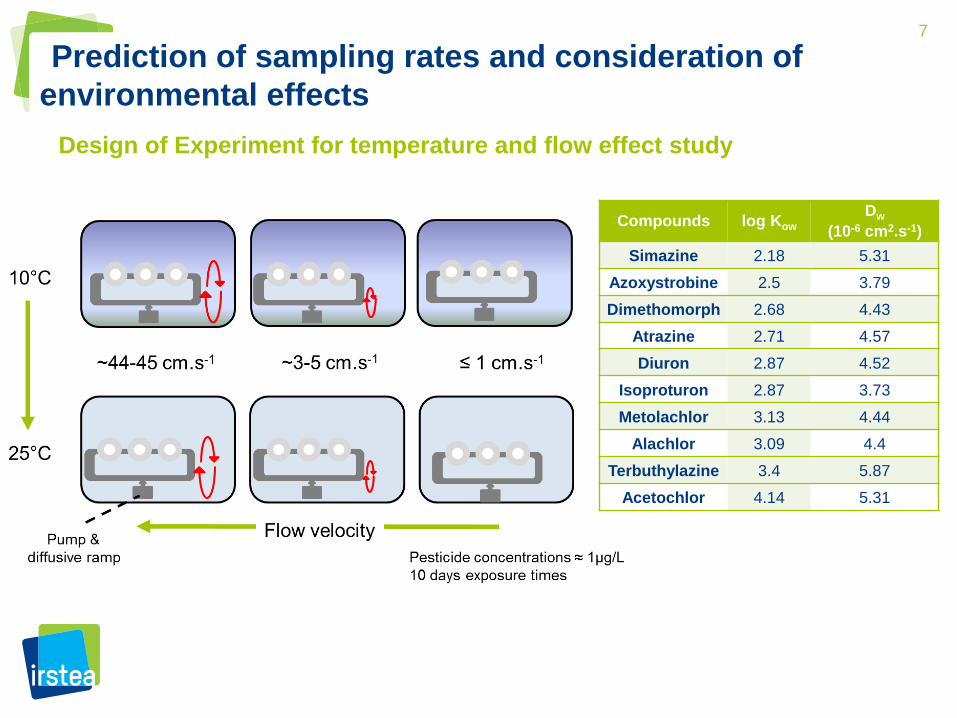
7
Prediction of sampling rates and consideration of
environmental effects
Design of Experiment for temperature and flow effect study
Compounds log Kow Dw
(10-6 cm2.s-1)
Simazine 2.18 5.31
Azoxystrobine 2.5 3.79
Dimethomorph 2.68 4.43
Atrazine 2.71 4.57
Diuron 2.87 4.52
Isoproturon 2.87 3.73
Metolachlor 3.13 4.44
Alachlor 3.09 4.4
Terbuthylazine 3.4 5.87
Acetochlor 4.14 5.31
8
Temp.
Flow
Interactions
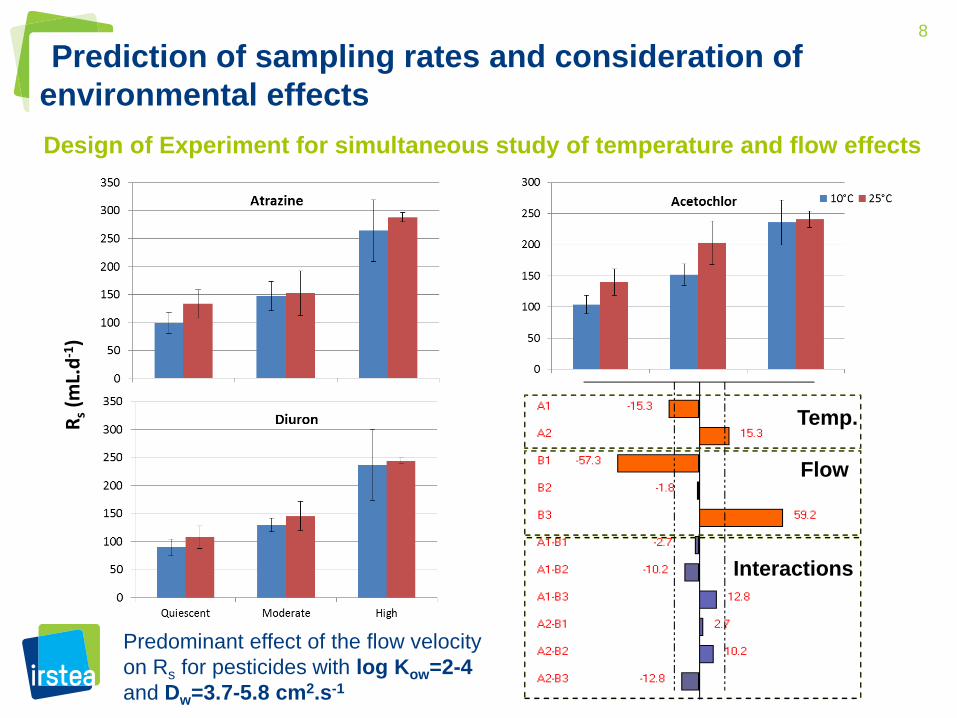
Prediction of sampling rates and consideration of
environmental effects
Design of Experiment for simultaneous study of temperature and flow effects
Rs (
mL.
d-1
)
Predominant effect of the flow velocity
on Rs for pesticides with log Kow=2-4
and Dw=3.7-5.8 cm2.s-1
9
Sswmmwwos kKkKkkR
A 1111
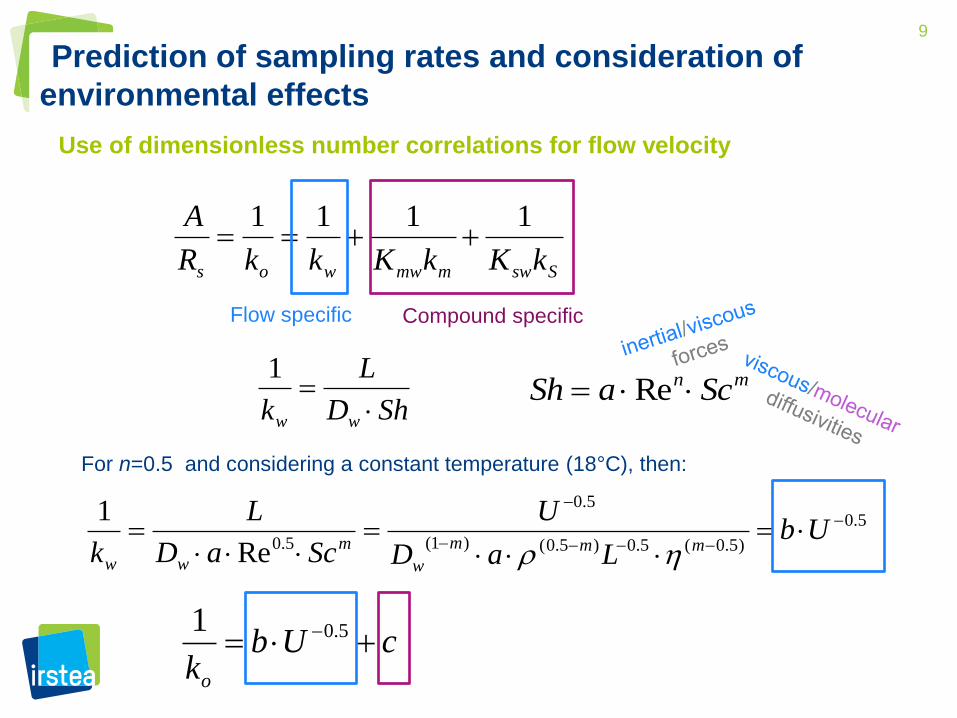
Prediction of sampling rates and consideration of
environmental effects
Use of dimensionless number correlations for flow velocity
Flow specific Compound specific
5.0
)5.0(5.0)5.0()1(
5.0
5.0Re
1
UbLaD
U
ScaD
L
k mmm
w
m
ww
For n=0.5 and considering a constant temperature (18°C), then:
cUbko
5.01
ShD
L
k ww
1 mn ScaSh Re
10
Mas
s tr
ansf
er
resi
stan
ce 1
/ko (
d.c
m-1
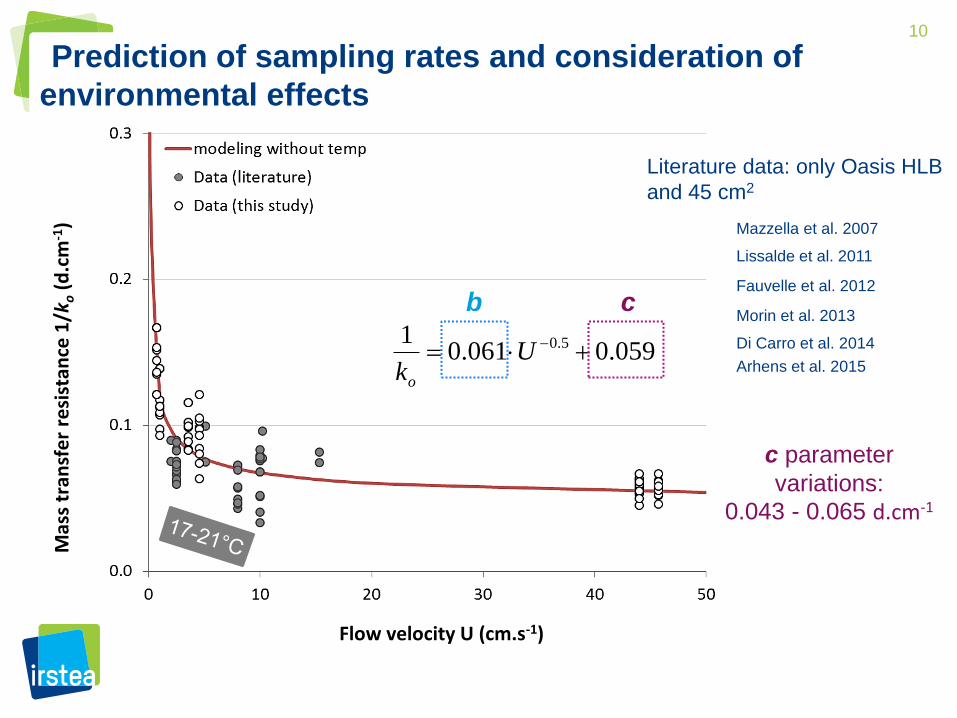
) Prediction of sampling rates and consideration of
environmental effects
10 and 25°C
Flow velocity U (cm.s-1)
Literature data: only Oasis HLB
and 45 cm2
Mazzella et al. 2007
Lissalde et al. 2011
Fauvelle et al. 2012
Morin et al. 2013
Di Carro et al. 2014
Arhens et al. 2015 059.0061.0
1 5.0 Uko
b c
c parameter
variations:
0.043 - 0.065 d.cm-1
11 M
ass
tran
sfe
r re
sist
ance
1/k
o (
d.c
m-1
)
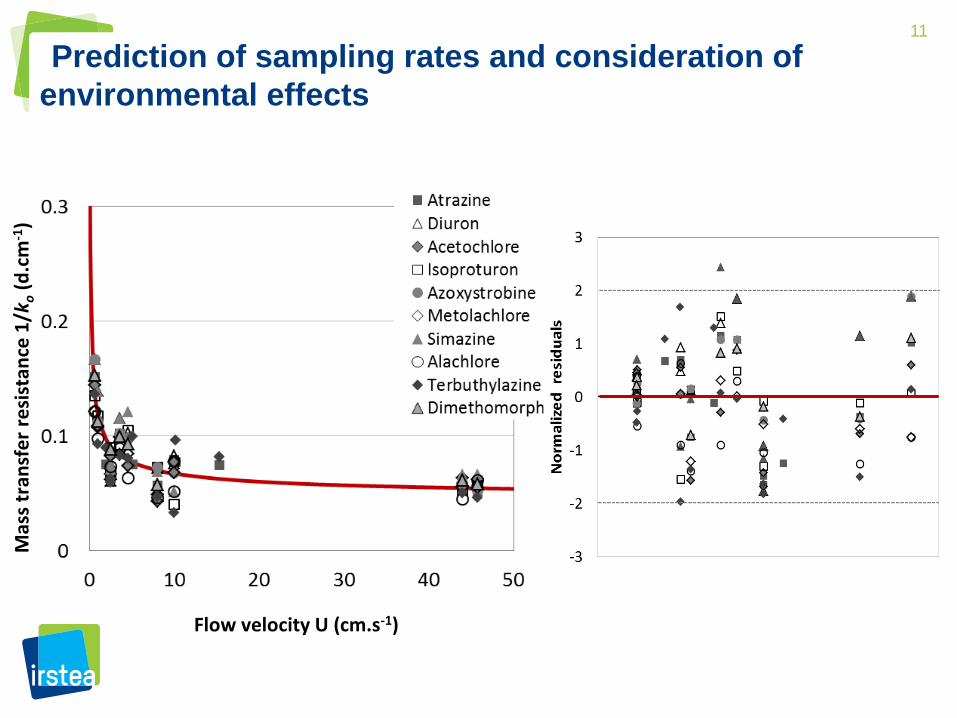
Flow velocity U (cm.s-1)
Prediction of sampling rates and consideration of
environmental effects
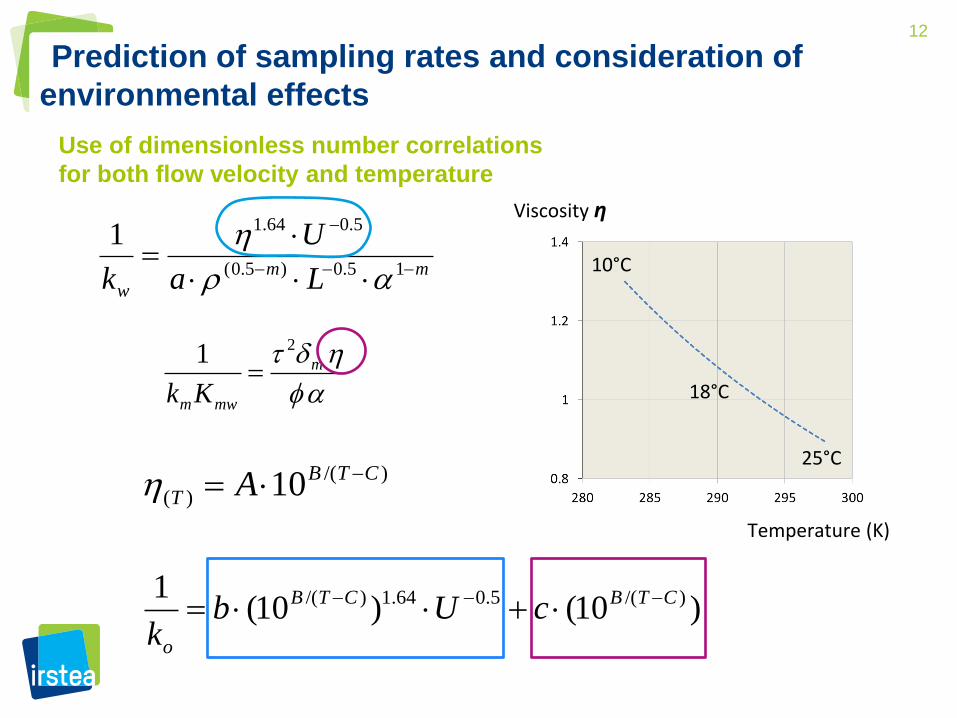
12
mm
w La
U
k
15.0)5.0(
5.064.11
Viscosity η
Temperature (K)
)/(
)( 10 CTB
T A
10°C
25°C
18°C
)10()10(1 )/(5.064.1)/( CTBCTB
o
cUbk
Use of dimensionless number correlations
for both flow velocity and temperature
Prediction of sampling rates and consideration of
environmental effects
m
mwmKk
21
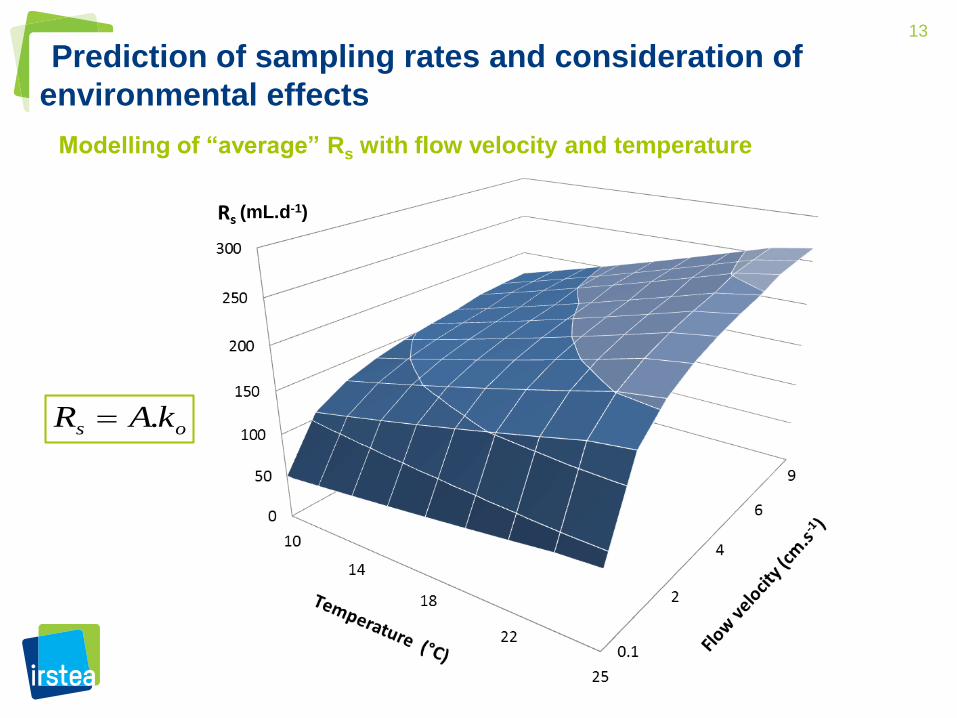
13
Prediction of sampling rates and consideration of
environmental effects
Modelling of “average” Rs with flow velocity and temperature
(mL.d-1)
os kAR .
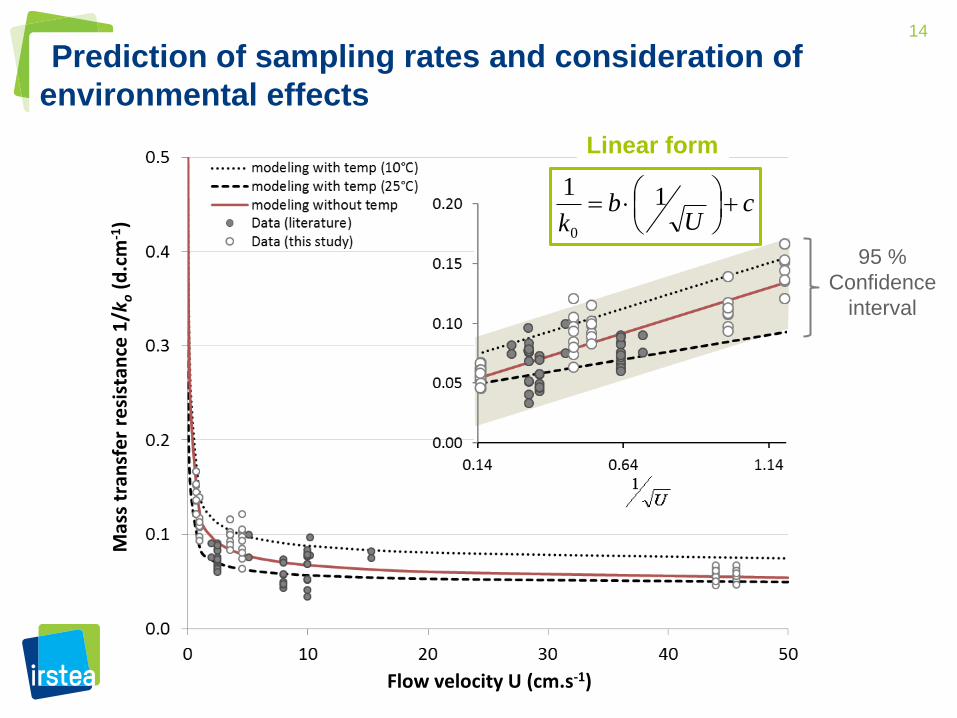
14
Prediction of sampling rates and consideration of
environmental effects
Linear form
cU
bk
11
0
Mas
s tr
ansf
er
resi
stan
ce 1
/ko (
d.c
m-1
)
Flow velocity U (cm.s-1)
95 %
Confidence
interval
15
Conclusions and further works
Predominant effect of the flow velocity on the Rs, whatever the temperature
For the range of polarity and structures considered, the coefficients of the model
seem to converge possibility of predicting the Rs for a wide range of
moderately polar pesticides?
Possibility of neglecting the temperature effect with a Maximum Permissible
Error of ±65% (i.e. confidence interval for flow velocity modelling only)
However, we need a reliable flow velocity estimate by using:
o Alabaster dissolution?
o PRC from non-polar PSD?
o PRC from POCIS, since the desorption rate also appears to be correlated with
the flow velocity?