Embed Size (px)
Citation preview
Wayne State UniversityDigitalCommons@WayneState
Wayne State University Dissertations
1-1-2013
Experimental Investigation And Development OfAn Extended Two Color Method (etcm) WithApplication To Internal Combustion EnginesElena FloreaWayne State University,
Follow this and additional works at: http://digitalcommons.wayne.edu/oa_dissertations
This Open Access Dissertation is brought to you for free and open access by DigitalCommons@WayneState. It has been accepted for inclusion inWayne State University Dissertations by an authorized administrator of DigitalCommons@WayneState.
Recommended CitationFlorea, Elena, "Experimental Investigation And Development Of An Extended Two Color Method (etcm) With Application ToInternal Combustion Engines" (2013). Wayne State University Dissertations. Paper 762.

EXPERIMENTAL INVESTIGATION AND DEVELOPMENT OF AN EXTENDED TWO COLOR METHOD
(eTCM) WITH APPLICATION TO INTERNAL COMBUSTION ENGINES
by
ELENA FLOREA
DISSERTATION
Submitted to the Graduate School
of Wayne State University,
Detroit, Michigan
in partial fulfillment of the requirements
for the degree of
DOCTOR OF PHILOSOPHY
2013
MAJOR: MECHANICAL ENGINEERING
Approved by:
Advisor Date

ii
DEDICATION
To my son, David A.

iii
ACKNOWLEDGMENTS
I would like to express my sincere gratitude to my adviser, Dr. Dinu Taraza,
for his constant support throughout my graduate education. With careful attention to
detail, Dr. Taraza’s invaluable advice steered my path in the great Sea of
Engineering Knowledge. I consider myself very fortunate and blessed to have had
the honor of working under his guidance.
I am very grateful as well to my professors, Dr. Naeim Henein and Dr. Marcis
Jansons, for sharing their valuable insight while working with graduate students,
such as myself, every day.
I would like to thank the members of my doctoral committee: Dr. Walter
Bryzik, Dr. Kai Yang and Dr. Trilochan Singh. Each and every one of you had a
significant contribution to my growth as a PhD. candidate.
Special thanks to Optical Engine Research Group: Dr. Marcis Jansons, Dr.
Radu Florea, Kan Zha, Xin Yu, Eric Gingrich and Alex Davidson for their continued
support. It was always a pleasure to work with the research team, and the friendly
atmosphere always made it fun.
I will always look back with joy at the times spend with my fellow graduate
students within the Center for Automotive Research with whom I shared long hours
preparing for exams or setting up experiments.
Furthermore, I would like to gratefully acknowledge the financial support of
the US Army TARDEC for the work conducted as PhD candidate at Wayne State
University’s Center for Automotive Research.
In the complexity of the PhD program machinery, every little bit helps. With
this in mind, I would like to say thank you to: Rosalind Willis, Taquandra Grant and
the wonderful people working at the front desk, Lidia and the machine shop staff for
the daily dose of smiles and helpful attitude.

iv
Last but not least, my sincere and special gratitude goes to my parents for
their unending trust and love. And to the most important people in my life: my
wonderful husband Radu and my amazing son David, you are the very reason for my
life to be so incredibly beautiful.

v
TABLE OF CONTENTS
Dedication .................................................................................................... ii
Acknowledgments ........................................................................................... iii
List of Tables ................................................................................................ viii
List of Figures ................................................................................................. ix
Nomenclature ............................................................................................... xiii
Chapter 1. Introduction ................................................................................... 1
Chapter 2. Literature review ............................................................................ 6
2.1 Combustion engines ........................................................... 6
2.1.1 Internal combustion engine classification............................... 7
2.2 Optically accessible engines ............................................... 11
2.3 Sensors for monitoring combustion parameters.................... 13
2.3.1 Optical fiber sensors ......................................................... 14
2.4 In-cylinder gas temperature measurements......................... 22
2.5 Two-color method ............................................................ 23
2.6 Blue flame ....................................................................... 33
2.7 Conclusions ..................................................................... 35
Chapter 3. Development of extended two color method (eTCM) ......................... 36
3.1 Two color method – theoretical background ......................... 36
3.2 Development of the combustion optical probe ...................... 40
3.2.1 Lenses and optical fiber components ................................... 42
3.2.2 Beam splitters ................................................................. 44
3.2.3 Bandpass filters ............................................................... 46
3.2.4 Photomultiplier tubes ........................................................ 47
3.3 Method calibration ............................................................ 49

vi
3.3.1 Source calibration ............................................................ 49
3.3.2 High speed camera image calibration .................................. 51
3.4 Numerical solution ............................................................ 54
3.5 Theoretical background for extended two-color method ........ 55
Chapter 4. Research engine and experimental facility........................................ 63
4.1 Optically accessible experimental engine ............................. 64
4.2 Test cell instrumentation, engine systems ........................... 68
4.3 Data acquisition system .................................................... 71
4.4 Engine instrumentation ..................................................... 71
4.5 Optical equipment, high-speed camera ............................... 72
Chapter 5. Data analysis ............................................................................... 75
5.1 Experimental operating conditions and motivation ................ 75
5.2 High-speed imaging results ............................................... 78
5.3 Fiber-optic probe measurements. Blue-flame intereference ... 81
5.3.1 Short wave effects – f12 ................................................... 85
5.3.2 Long wave effects – f23 .................................................... 88
5.4 Blue flame interference compensation. eTCM ....................... 90
5.5 Extended Two-Color Method (eTCM) assumptions ................ 91
5.6 Uncertainty factors ........................................................... 92
5.6.1 Temperature and optical thickness KL effects ....................... 92
5.6.2 Soot cloud area effects ..................................................... 96
5.6.3 Comparison with high-speed soot cloud area measurement ... 99
5.7 Blue-flame results .......................................................... 101
5.7.1 Comparison with high-speed blue-flame intensity
measurements ............................................................... 101

vii
5.7.2 Effect of soot cloud area assumption on blue-flame intensity
estimation ..................................................................... 103
Chapter 6. Conclusions and future work ........................................................ 104
6.1 Conclusions ................................................................... 104
6.2 Future work ................................................................... 106
References ............................................................................................... 107
Abstract ............................................................................................... 125
Autobiographical Statement ........................................................................... 127

viii
LIST OF TABLES
Table 1 – 74-UV collimating lens specifications [122] .......................................... 42
Table 2 – Specifications of the UV plan-convex lens [123] ................................... 43
Table 3 - Beam splitter specifications [124] ....................................................... 44
Table 4 - Bandpass filters specifications [125] ................................................... 46
Table 5 – Hamamatsu H5784 PMT specifications [126] ....................................... 48
Table 6 – Experimental engine characteristics .................................................... 64
Table 7 – Fuel injector specifications ................................................................. 65
Table 8 – Optical properties of fused silica and sapphire [133] ............................. 67
Table 9 – ULSD and n-heptane fuel properties ................................................... 75
Table 10 – Experimental operating conditions .................................................... 77

ix
LIST OF FIGURES
Fig 2.1 – US energy usage consumption by sector 2011 [73] ................................. 8
Fig 2.2 – LTC enables high efficiency with low emissions [74] .............................. 10
Fig 2.3 –Single mode optical fiber structure (Author: Bob Mellish) ........................ 15
Fig 2.4 – Optical fiber [83] .............................................................................. 15
Fig 2.5 – Yan and Borman’s schematic of the optical setup [84] ........................... 18
Fig 2.6 – Cummins engine cross section and optical window positioning [84] ......... 19
Fig 2.7 – Optimum design of the radiation probe that keeps the window clean [84] 19
Fig 2.8 – Experimental optical setup for soot temperature and concentration
measurements [86] ........................................................................... 20
Fig 2.9 – Components of the optical system [88]................................................ 21
Fig 2.10 – AVL sensor installed in glow plug adapter [89] .................................... 22
Fig 2.11 – Optical setup for temperature and heat transfer measurements –
Musculus [101] ................................................................................. 29
Fig 2.12 – Experimental setup for the optically accessible diesel engine [98] ......... 30
Fig 2.13 – Optically accessible single cylinder diesel engine with optical setup for
two-color thermometry [99] ............................................................... 32
Fig 3.1 –Detector’s field of view for the two color method case with high speed
visible range images .......................................................................... 39
Fig 3.2 – Optical components of the combustion probe ....................................... 40
Fig 3.3 - Schematic of the combustion optical probe ........................................... 41

x
Fig 3.4 – Geometric specifications of the UV plan-convex lens [123] ..................... 43
Fig 3.5 – Transmittance UV grade fused silica [123] ........................................... 44
Fig 3.6 – Blue-green dichroic plate beam splitter coating performance [124] ......... 45
Fig 3.7 – Green-orange dichroic plate beam splitter coating performance [124] ..... 45
Fig 3.8 – Transmission data for the bandpass filters [125] ................................... 46
Fig 3.9 – Sensitivity of Hamamatsu photomultiplier tubes, type -02, -03 and -04
[126] ............................................................................................... 48
Fig 3.10 – Optical probe calibration setup with a blackbody source ....................... 50
Fig 3.11 – Scaling coefficient calculated for different blackbody temperatures ........ 51
Fig 3.12 – Optical probe setup calibration .......................................................... 52
Fig 3.13 – Angular effect calibration results ....................................................... 52
Fig 3.14 – Optical probe calibration. Effect of light source on Z position ................ 53
Fig 3.15 – Solution for T and KL ....................................................................... 55
Fig 3.16 – Schematic diagram of numerical solution ........................................... 56
Fig 3.17 – Calculated T and KL; measured signals V1, V2 and V3; and calculated
signal V1 .......................................................................................... 57
Fig 3.18 – CO flame continuum and soot continuum ........................................... 58
Fig 3.19 – Theoretical potential energy curves for the CO and O interaction to form
CO2 [128] ........................................................................................ 60
Fig 4.1 – Experimental setup ........................................................................... 63
Fig 4.2 – Elongated optical piston ..................................................................... 65
Fig 4.3 – AVL 5402 Single cylinder optically accessible research engine [131] ........ 66

xi
Fig 4.4 – Spectral transmissivity for fused silica and sapphire [132] ..................... 67
Fig 4.5 – AVL optical engine and AVL conditioning unit ........................................ 68
Fig 4.6 – AVL engine dynamometer .................................................................. 69
Fig 4.7 – Bosch ECU and ETAS VTK7.1 .............................................................. 70
Fig 4.8 – Phantom v7.3 (high-speed CMOS camera) ........................................... 73
Fig 4.9 – Vision Research Phantom v7.3 optical response [98] ............................. 74
Fig 5.1 – ULSD distillation curve ....................................................................... 76
Fig 5.2 – Cylinder pressure and ARHR for ULSD and n-heptane ............................ 78
Fig 5.3 – Single-cycle high speed combustion images for a) ULSD and b)
n-heptane ........................................................................................ 80
Fig 5.4 – Detector signals for one cycle and corresponding high speed camera
image at 8 CAD ................................................................................. 82
Fig 5.5 – Plot of f12 for 10 arbitrary, consecutive cycles ...................................... 83
Fig 5.6 – Plot of f23 for 10 arbitrary, consecutive cycles ...................................... 83
Fig 5.7 – f12 linear dependence of temperature ................................................ 85
Fig 5.8 – f12 linear dependence of temperature for two data sets ........................ 87
Fig 5.9 – f23 linear dependence of temperature ................................................ 88
Fig 5.10 – Numerical solver – description of the iterative steps ............................ 89
Fig 5.11 – eTCM results for soot temperature and KL factor ................................. 90
Fig 5.12 – Temperature results comparison for TCM and eTCM............................. 94
Fig 5.13 – Optical thickness factor KL results comparison for TCM and eTCM ......... 95

xii
Fig 5.14 – The difference in temperature for various soot cloud areas with respect
to 100% area function of CAD ............................................................ 97
Fig 5.15 – The difference in temperature for various soot clouds area function of
combustion temperatures ................................................................... 97
Fig 5.16 – The difference in temperature for a 10% soot cloud area for various
cycles .............................................................................................. 98
Fig 5.17 – Optical thickness factor KL evaluation for different soot cloud areas ...... 98
Fig 5.18 – Temperature difference for the actual soot cloud area, 10% and 40%
soot cloud area assumptions function of combustion temperature ......... 100
Fig 5.19 – Blue flame intensity comparison for high-speed camera and eTCM ...... 102
Fig 5.20 – Effect of soot cloud coverage assumption ......................................... 103

xiii
NOMENCLATURE
Abbreviations
ARHR apparent rate of heat release
AHR apparent heat release
ARB Air Resources Board
b/aTDC before/after top dead center
C2 free radical
CAFE corporate average fuel economy
COV coefficient of variation
CA50 crank angle for 50% heat release ATDC
CAD crank angle degree
CARS coherent anti-Strokes Raman scattering
CCD charge coupled device
CH, CH* free radical, electronically excited CH
CI compression ignition
CMOS complementary metal–oxide–semiconductor
CN cetane number
CO, CO* carbon monoxide, electronically excited carbon monoxide
CO2, CO2* carbon dioxide, electronically excited carbon dioxide
DCN derived cetane number
DEF diesel exhaust fluid
DEM dimethyl ether
DI direct injection
DOC diesel oxidation catalyst
DPF diesel particulate filter
ECU engine control unit

xiv
EGR exhaust gas recirculation
EPA Environmental Protection Agency
eTCM extended two color method
FSN filter smoke number
GHG green house gas emissions
HCCI homogenous charge compression ignition
HD heavy-duty
HTHR high temperature heat release
ICCD intensified charge coupled device
IMEP indicated mean effective pressure
IR infra-red spectral range
JP8 jet propellant 8
LIF laser induced fluorescence
LPPC location peak premixed combustion
LRS laser Rayleigh scattering
LTC low temperature combustion
LTHR low temperature heat release
M flame molecule
MK modulated kinetics
MMF multi-mode fiber
NOx sum of nitric oxide and nitrogen dioxide
NVH noise – vibration – harshness
O oxygen atom
OEM original equipment manufacturer
OH, OH* free radical, electronically excited hydroxyl radical
PE potential energy

xv
PCCI partially-premixed charge compression ignition
PIC pre-injection chemiluminescence
PMT photomultiplier tube
PPC partially premixed combustion
RCCI reactivity controlled compression ignition
RCM rapid compression machine
SCR selective catalytic reduction
SI spark ignition
SMF single-mode fiber
SNR signal to noise ratio
SOI start of injection
SRS spontaneous Raman scattering
TCM two color method
TDC top dead center
UHC unburned hydrocarbons
ULSD ultra-low sulphur diesel
UV ultra violet spectral range (10nm to 400nm)
UV-Vis ultra violet and visible spectral range (10 nm to 800nm)
VCO valve covered orifice injector nozzle
VIS visible spectral range
YM year model
Symbols
Α area viewed by the detector
Acal aperture area for the blackbody calibration source
Acloud area of the soot cloud

xvi
Bλ blue flame
C1, C2 model coefficients
C(1), C(2), C(3) coefficients obtained during the calibration process
Cλ, Cλ’ calibration constant for the optical setup
Eb blackbody emissive power
Es soot emissive power
f12, f23 ratio of two detector signals
h Plank’s constant (h=6.626069x10⁻³⁴ Js)
Hλ detector transfer function
I pixel count (intensity)
K coefficient proportional to the soot volume concentration
KL factor is proportional to the soot volume fraction
L the mean beam length for the considered volume of soot
Lcal optical length from the detector to the blackbody calibration
source
Lexp optical length from the detector to the soot cloud
P pressure
R2 coefficient of determination
T temperature
Vλ detector signal
α continuous function that characterizes the sooty diesel
combustion
ε emissivity of soot
Equivalence ratio
wavelength
Ω solid angle subtended by the active area of the detector
1
Chapter 1. Introduction
Two major factors are driving today’s internal combustion engine towards
improved efficiency: the need to reduce the greenhouse gas emissions thought to be
responsible for the global warming phenomenon [1, 2] along with increased fuel
economy standards introduced by a number of national governments partially in
response to increasing fuel demand, higher energy costs as well as national security
considerations related to the current energy supply availability [3, 4, 5, 6, 7].
According to the prevailing scientific view, transportation related gaseous
emissions are a major factor contributing to human health [8, 9] as well as climate
change [8]. In the United States the Environmental Protection Agency (EPA) has
been tasked by the US Congress with the authority of regulating these emissions
and, over the last several decades, it has set increasingly strict emissions standards.
In order to comply with these regulations OEM’s and engine manufacturers applied in
general two approaches: one is focused on improving the combustion process for a
cleaner, more efficient combustion [10] and the second is focused on improving the
efficiency and reducing the cost of aftertreatment devices [11, 12, 13, 14, 15, 16,
17, 18, 19].
In the following section details regarding the evolution of the combustion
process improvements are presented along with the driving forces behind them.
The work presented here focuses mostly on the Diesel combustion
technology, due to its high energy efficiency potential which will most likely be
required to meet future Green-House Gas (GHG) emissions regulations [2] as well as
higher fuel economy mandates (such as CAFE – Corporate Average Fuel Economy)
[20]. Given the dominant role played by the heavy duty diesel engine in the US
diesel market, the following emissions related discussion will focus on the heavy duty

2
requirements, although the light-duty sector is facing similar challenges which are
expected to result in similar engine architectures and combustion strategies.
First, in order to meet EPA’s pre-2010MY heavy-duty NOx emissions
standards, most engine manufacturers have pursued the use of exhaust gas
recirculation (EGR) without NOx aftertreatment technology. A number of
manufacturers relied on combustion strategies falling within the broad classification
of Low Temperature Combustion (LTC) [21, 22, 23, 24, 25, 26, 27, 28, 29, 30, 31,
32] which is generally characterized by relatively long ignition delays and high
degrees of premixed combustion. With ever increasing EGR rates, smoke became an
issue [18, 33, 34, 35, 36, 37, 38, 39, 40, 41, 42, 43, 44, 45, 46], driving injection
pressures higher, combustion phasing later in the cycle and lower engine system
efficiency.
Subsequently, following EPA’s 2010MY heavy-duty (HD) emissions standard
decreasing the allowable limits for both tailpipe soot (0.01 g/bhp-hr) and NOx
emissions (0.2 g/bhp-hr) [47], most engine manufacturers adopted exhaust
aftertreatment technologies such as Selective Catalytic Reduction (SCR) [13, 17,
18]. As a result of changing tradeoffs between the engine system and the
aftertreatment system, the combustion strategy has shifted yet again. Lower EGR
rates were employed [28, 36, 38, 39, 48, 49, 50], as the engine-out NOx emissions
were permitted to increase, allowing the recovery of some of the engine efficiency
previously lost to emissions control constraints.
In regards to future engine emissions regulations, California’s ARB (Air
Resources Board), who is in charge of defining the state’s emission standards, is
indicating intent to further reduce the NOx emissions by an order of magnitude
compared to current (2010 emissions year) limit. ARP’s decisions are generally
viewed as precursors to regulations at federal level, thus the expectation of
3
significantly tighter NOx emissions standards in the future. However, given current
SCR efficiency limitations [13, 17, 18] as well as increased Diesel Exhaust Fluid
(DEF) requirements, the proposed standard will likely require a combination of high
efficiency SCR with relatively high EGR rates, shifting the combustion strategy focus
back toward a higher degree of premixed combustion with increased emphasis on
the NOx-soot tradeoff. It is thus expected that at least a fraction of the engine
manufacturers will select one of the LTC combustion strategies to meet the future
emissions targets.
Given the expected future trend of combustion system development, it is of
interest to improve the application range of diagnostic tools such as the two color
method (TCM) typically used in evaluating the properties of engine soot, such as
temperature and volume fraction. This optical diagnostic method relies on the use of
the light emitted by the soot particles along with a soot emissivity model in order to
estimate the temperature T and optical thickness KL characterizing the soot cloud of
interest in the engine development process. This assumption is reasonable for the
“traditional” diesel combustion, where low degrees of premixed combustion result in
very low amounts of blue-flame light emission compared to the soot related
radiation. However, for LTC combustion modes this assumption is no longer
applicable, especially for combustion strategies characterized by very large premixed
combustion phases, such as the Partially-premixed Charge Compression Ignition
(PCCI) strategies.
For these combustion modes soot is still of concern, as the mixture is not
perfectly homogenous, but the application of TCM may be restricted by the presence
of large amounts of blue flame radiation. The current work is focused on addressing
this limitation of TCM and extends its range of applicability to highly premixed
combustion regimes.

4
The aim is to obtain more information related to the combustion process and
specifically on the soot formation and oxidation process. For this reason, the present
research can be divided in two major sections.
The first section focuses on the development of a combustion optical probe
and the optical experimental setup necessary for conducting the experimental work.
On one hand, the optical probe developed is needed for providing information related
to the combustion process from within the combustion chamber. Information
regarding the soot formation and oxidation processes may be inferred from the
measured signal. This provides complementary cycle resolved information regarding
the soot evolution beyond the more widely employed engine-out soot measurements
such as AVL’s filter smoke number (FSN) which provide engine-out soot data. The
benefits of applying the additional insight of in-cylinder soot evolution to combustion
system development is well documented in literature [51, 52, 53, 54, 55, 56, 57, 58,
59, 60, 61, 62, 63, 64, 65, 66, 67, 68, 69, 70] and allowing the extension of the
range of applicability of the TCM to partially premixed combustion modes could prove
useful for future combustion system development needs.
With the engine development cycle in mind, the current work focuses on
applying the soot measurements with an optical probe which requires minimum
intrusiveness associated with the optical access. The specifics of the hardware
implementation have been detailed in a number of previous publications [51, 52, 53,
54, 55, 56, 57, 58, 59, 60, 61, 62, 63, 64, 65, 66, 67], thus the focus of this work is
on the development and evaluation of the optical technique.
The objective of the second section of the current research is to provide the
theoretical background and experimental evidence needed to describe the proposed
optical diagnostic tool, the extended two-color method (eTCM). This method
attempts to extend the domain of applicability of the classical two color method
5
within the area of strong CO continuum interference as well as providing a method of
testing the validity of the conventional two-color method. Further, it provides
additional information regarding the strength of the radiation associated with the CO
flame continuum.
Towards this goal, the work was conducted on a fully accessible optical
engine, which allowed the use of multiple synchronous optical measurements
targeted towards the evaluation of the proposed optical diagnostic tool.

6
Chapter 2. Literature review
In the first part of the literature review, a short overview of the internal
combustion engine is presented with focus on the diesel combustion strategy along
with its advantages and challenges; following, other combustion strategies are
introduced, with an emphasis on low temperature combustion (LTC). Furthermore,
the topic of optical diagnostics is introduced along with a description of their
applicability to the investigation of practical combustion systems.
This chapter is focused on reviewing previous work related to combustion
sensing as well as engine applied investigations of the two-color method targeted
towards soot temperature and optical thickness measurements.
The second part of this chapter outlines several optical-fiber based techniques
developed for combustion monitoring.
Furthermore, the third part of the literature review chapter concentrates on
the research that has been carried out in the field of two-color method technique. A
discussion is presented with regards to the details of the two-color method
implementation in practical combustion systems, while a description of the method
itself is presented in a subsequent chapter (3.1).
2.1 Combustion engines
For the past 100 years the internal combustion engine maintained its lead as
the main propulsion system for the ground transportation and marine applications.
Detailed information regarding the history and progress of the combustion engines is
presented by Heywood [71].
In its early days, the engine had to overcome challenges such as increased
power density and efficiency followed later on by the need for reduced emissions.

7
Recognizing increased environmental concerns within their respective
societies, an increasing number of governments are proposing legislation aimed
towards reducing green-house gas (GHG) emissions of which the main contributor is
CO2. Carbon dioxide is an unavoidable by-product of hydrocarbon-based fuels; as
such, a significant tool available in enabling nations to meet the proposed reduction
in GHG emission is the improvement of the fuel efficiency of future combustion
systems. Among the engine subsystems, the combustion chamber has significant
potential for efficiency improvement and much research and development efforts are
being dedicated towards achieving that potential now and in the foreseeable future.
Thus the importance of investigating the details of the combustion process
with all engineering tools available, including optical diagnostics of combustion.
2.1.1 Internal combustion engine classification
Traditionally the internal combustion engines have been classified based on
the ignition method. Two broad classes are typically identified based on this criterion
as spark ignition engines and compression ignition engines. The spark ignition (SI),
engine also known as Otto engine, is characterized by ignition of the fuel air mixture
with the aid of a spark generated by a sparkplug. At the same time, the compression
ignition engine (CI), commonly referred to as a Diesel engine, uses the heat of
compression to autoignite the fuel that is direct-injected in the combustion chamber.
Over the past decade a significant amount of combustion research targeted towards
attaining the maximum efficiency with minimum emissions has yielded several other
combustion modes (such as HCCI, PCCI and dual-fuel strategies) which blur the lines
between the aforementioned combustion modes.
Given the focus of this work on self-ignited combustion modes, the next
subchapter provides more information regarding the characteristics of diesel engines.
8
2.1.1.1 Diesel engines
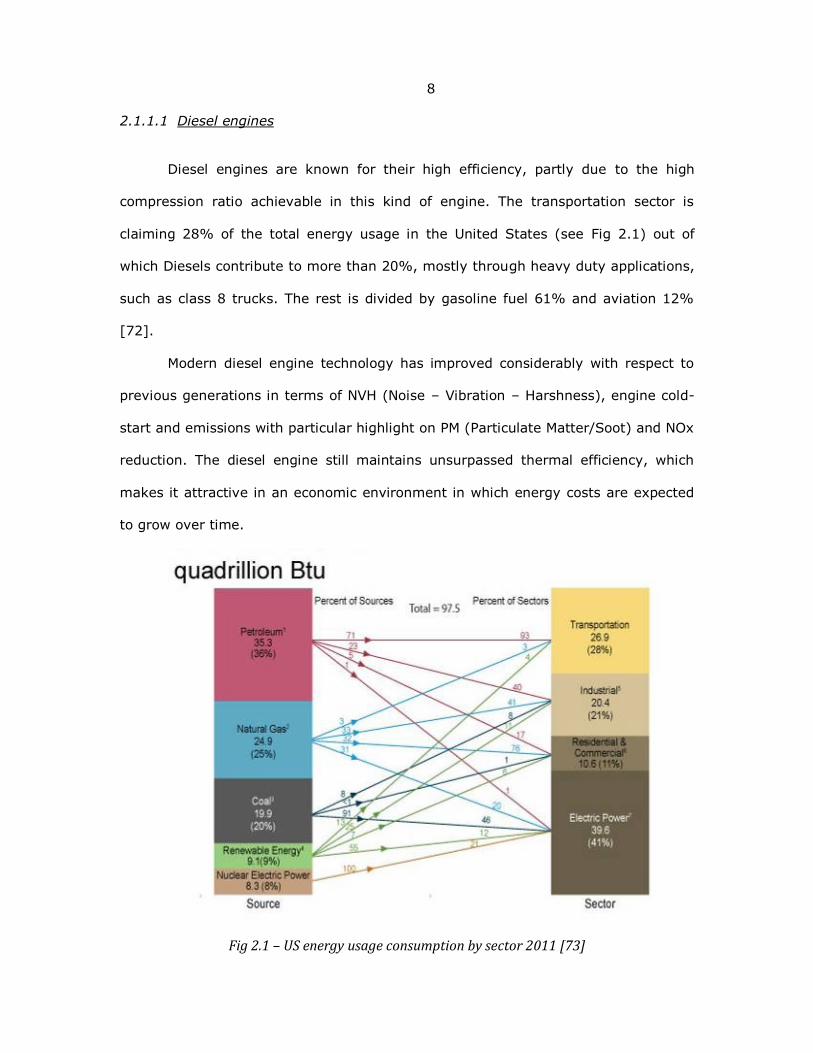
Diesel engines are known for their high efficiency, partly due to the high
compression ratio achievable in this kind of engine. The transportation sector is
claiming 28% of the total energy usage in the United States (see Fig 2.1) out of
which Diesels contribute to more than 20%, mostly through heavy duty applications,
such as class 8 trucks. The rest is divided by gasoline fuel 61% and aviation 12%
[72].
Modern diesel engine technology has improved considerably with respect to
previous generations in terms of NVH (Noise – Vibration – Harshness), engine cold-
start and emissions with particular highlight on PM (Particulate Matter/Soot) and NOx
reduction. The diesel engine still maintains unsurpassed thermal efficiency, which
makes it attractive in an economic environment in which energy costs are expected
to grow over time.
Fig 2.1 – US energy usage consumption by sector 2011 [73]

9
This has been accomplished largely through the use of the common-rail
injection system, which allows more precise control of fuel metering, timing,
injection pressures and the number of injection events. Improved control of engine
parameters such as exhaust gas recirculation (EGR) rates, injection timing and
pressure, further allow the diesel engine to operate in conditions which minimize
pollutant formation while maximizing efficiency. The successful application of such
diesel engine controls requires knowledge regarding spray formation, and especially,
ignition characteristics. The currently reported work aims towards providing an
additional tool for the development of the future high-efficiency internal combustion
engine by providing quasi real-time combustion information regarding in-cylinder
soot quantity and temperature as well as characterization of the premixed,
smokeless phase of the combustion process.
2.1.1.2 Low Temperature Combustion – LTC
Low temperature combustion (LTC) is a type of combustion that has been
previously shown to combine the advantages of both spark ignition combustion and
compression ignition combustion by increasing the degree of premixed combustion of
a compression-ignited engine. LTC attempts to operate within the low-PM and low-
NOx regions of the well-known Φ-T map (see Fig 2.2) while maintaining good
thermal efficiency. LTC is generally achieved by lowering the compression ratio as
well as by employing higher rates of EGR [25, 28].

10
Fig 2.2 – LTC enables high efficiency with low emissions [74]
Among the most important combustion modes falling within the LTC category
include: Homogeneous Charge Compression Ignition (HCCI) [29], Premixed Charge
Compression Ignition (PCCI) [23], Modulated Kinetics (MK) [26], and Reactivity
Controlled Compression Ignition (RCCI) [31].
Because the combustion is not initiated with the aid of a sparkplug but it
rather employs the autoignition of the mixture as a diesel engine does, some of LTC
combustion modes (such as HCCI) face the additional challenges in controlling the
combustion phasing [21, 24, 32]. Another constraint is placed on the maximum load
and/or minimum EGR rate that can be utilized in order to avoid unnecessarily high
rates of pressure rise [22, 30].
In the end, combustion phasing and duration can be controlled by varying
different parameters such as charge dilution, injection timing [24], air intake
temperature or through different chemical compositions of the fuels [22, 31].
Another option of dealing with the combustion control at high loads was proposed by

11
Walter [32] with what the author called a dual mode engine application, where for
part load the engine has an HCCI combustion mode while for the full load it switches
to conventional diesel.
2.2 Optically accessible engines
In order to gain the knowledge regarding the details of the combustion
process required to address the challenges facing the internal combustion engine,
optical diagnostics of combustion have seen increasing application in different areas
of internal combustion engine research. The set of tools typically includes
visualization of sprays, mixture formation processes, auto-ignition, combustion, and
pollutant formation within the combustion chamber. As a result, a number of
research engines have been modified or developed to facilitate optical access.
Depending upon the degree of intrusiveness of the optical access required, several
types may be distinguished.
At one end of the spectrum are the production-grade engines with minimum
modifications required to insert either a small optic-fiber access or a small endoscope
attachment. These relatively small modifications maintain the integrity of the
combustion system and the combustion process may be investigated in a highly-
realistic environment. Typical issues associated with this approach are related to the
size and quality of the optical access as well as the limited range of optical diagnostic
that may be employed.
At the other end of the spectrum are model combustion systems, such as
constant volume reactors and rapid compression machines (RCM). Typically these
combustion systems are suitable for experiments where precise and elaborate optical

12
experiments are needed and the combustion conditions may be simplified
significantly compared to the actual combustion system being modeled.
Somewhere between these two extremes lies a range of dedicated research
engines typically called “optically accessible engines” which provide a compromise
between the quality of optical access and the level of modifications brought to the
combustion system. As a result, there are unavoidable differences between the
optically accessible research engine and the metal engine in terms of materials,
cooling, heat transfer within the combustion chamber, blow-by gases, exhaust gas
recirculation (EGR) composition as well as emissions [49, 75, 76].
To start with, pressure and heat release are affected by the slightly larger
TDC clearance volume of the optical engine due to larger crevice volumes. For the
same reason, greater fueling rates are necessary in order to attain the same load as
an all metal engine. Also to counteract the lower compression ratios encountered in
the optical engine, higher intake pressures and temperatures are employed [49].
Secondly, in order to lower the temperature in the combustion chamber due
to modifications of the cooling system as well as different thermal conductivity of the
optical materials used, a skip fire operation of the engine is applied during testing
[77], [78].
However, these modifications brought to the engine in order to gain optical
access are necessary in order to collect significant information for the optimization of
the combustion process for production engines.
For this purpose, Colband et al. [49] have conducted a comparison between
an optically accessible engine and a similar geometry all metal engine. The authors
have looked at combustion performance and engine out emissions, analyzing the
effect of injection strategy and fuel consumption for the same load and
thermodynamic conditions. The results show that unburned hydrocarbons (UHC),

13
carbon monoxide (CO) and soot emissions follow the same trend for the two types of
engines just that for the optical engine the values were slightly higher.
In order to have optical access to the combustion chamber, one can employ
one of three ways: access through the cylinder head, cylinder liner or piston. The
optical access can be a full optical access or partial optical access. Also the materials
the windows are made of can be made of: optical glass (fused silica, fused quartz) or
crystals (sapphire). These two types of materials are most suitable due to their
resistance to high temperatures and pressures as well as having a good transmission
in the UV region of the spectrum. Additionally, a history of optically accessible
engines: two stroke engines, SI engines and CI engines with different designs for the
windows is presented by Zhao et al. in [76].
2.3 Sensors for monitoring combustion parameters
For one thing, the internal combustion engine of the 21 century is a complex
system that continues to be enhanced in order to offer increased performance, better
fuel economy, and lower emissions. In order to improve these engine parameters
there is a necessity to monitor and better understand the combustion process.
However, diesel combustion is a complex process; additionally, the combustion
chamber is a challenging thermal and mechanical environment for a sensor.
Several classes of combustion sensing technologies may be distinguished. For
instance, sensors that measure the in-cylinder combustion pressure can be classified
as: sensors for direct in-cylinder pressure measurements or indirect cylinder
pressure measurements.
The category of direct in-cylinder pressure sensors includes piezoelectric,
piezoresistive and optical-based pressure measurement (deflected membrane

14
sensors). Indirect pressure measurements include cylinder head deflection and
change in cylinder head sealing gap measurement sensors as well as engine-speed
based cylinder pressure reconstruction.
However, the most common sensor used for measuring in-cylinder pressure
of combustion in engines is the piezoelectric transducer. Its wide use is due to its
advantages, such as: dynamic and continuous measurement of the combustion
pressure based on the crank angle, resistant to radiation interference, stable
repeatable operation and long service life.
On the other hand, the pressure transducer is facing disadvantages as well.
One of the most concerning is the measurement accuracy affected by thermal shock
[79, 80, 81, 82] for certain operating conditions. One option to this problem is the
use of water cooled pressure transducers but this introduces another degree of
complexity to the system. Other disadvantages include: high costs and difficult
mounting.
The indicated data provided by a pressure transducer has been a fundamental
tool for the diagnostic of the combustion system for several decades now. It is
currently employed for both research and development purposes. However, most
applications would benefit from additional information beyond the indicated data,
such as optical-based measurements mentioned in the previous paragraphs.
Subsequent sections will provide a description of the main classes of optical-
based sensors available commercially or previously described in literature.
2.3.1 Optical fiber sensors
An optical fiber is a transparent, flexible fiber that transmits light along its
axis operating on the principle of total internal reflection. The transparent core is

15
surrounded by a transparent cladding material that has a lower index of refraction
(see Fig 2.3 and Fig 2.4). That is to say, the fiber operates as a waveguide.
Fig 2.3 –Single mode optical fiber structure (Author: Bob Mellish)
Where: 1 – core; 2 – cladding; 3 – buffer; 4 – jacket
Fig 2.4 – Optical fiber [83]
Depending on the number of propagation paths, optical fibers can be divided
in single-mode fibers (SMF) that supports a single mode or multi-mode fiber (MMF)
that supports many propagation paths. Also, the acceptance cone is the maximum
angle at which light can enter the fiber in order to propagate in the core without light

16
leakage (see Fig 2.4 – Optical fiber ). The sinus of this maximum angle is called
numerical aperture (NA) of the fiber.
A typical optical fiber is made of glass, plastic or sometimes sapphire. Optical
fibers have been historically developed for signal processing applications, such as
high-bandwidth communication networks. However, a range of optical measurement
as well as optical imaging techniques have been developed over the last several
decades.
Miguel and Higuera [61] classified optical fiber sensors according to the
domain and type of magnitude to be measured in the next classes: mechanical,
thermal, electromagnetic, radiation, chemical composition, flow and turbulence of
fluids, and typical magnitudes for the biomedical field.
On one hand, the main advantages of the fiber optic are derived from the
dielectric property not to have any electromagnetic, chemical or electrical external
interference. That makes it ideal for applications in hostile, corrosive environments
or even environments with elevated risk of explosion. Also, due to its high fusion
point optical fiber has high temperature resistance. Other advantages are the small
dimension and light weight of the optical transducers. When compared to
conventional sensors optical fiber has greater sensitivity, dynamic range and
resolution. The signal generated or detected by the optical fiber does not deteriorate
with the distance traveled due to the excellent capability as a transmission channel.

17
Last but not least, it is the great cost reduction of a sensor system when compared
to traditional sensors.
Due to their small size and good light transmission capability, optic fibers
have been employed in internal combustion engine investigations.
In 1985 Murray et al. [62] were discussing the necessity and advantages of a
fiber optic sensor for in-cylinder combustion measurements. Clowater [51] developed
a fiber optic imaging system with the aim of enhancing flow visualization studies. In
fact, in 1994 Pendlebury and Nwagboso surveyed the available literature regarding
the application of in-cylinder fiber optic measurements [64]. The authors highlight
that these are the lowest cost sensors for nonintrusive measurements into the
combustion chamber.
2.3.1.1 Optical fiber sensors for pressure measurement
In 1988 Witze [67] enhanced a spark plug with eight optical fibers mounted
on a ring. He transmitted the light emitted by the flame through a fiber optic cable to
a photomultiplier tube and to the data acquisition system. In order to obtain the
average flame velocity, the time elapsed between ignition and detection of flame by
the sensor was measured.
Other studies have been conducted using fiber optic sensors integrated in a
spark plug such as the ones by He [53], Jie [54], Poorman [65] and Kawa [55] . The
author [53] emphasized the small size and low cost system that can provide valuable
information regarding the initial flame development. Jie [54] reports data related to
flame propagation used to optimize fuel injection timing. Poorman [65] has
conducted tests on a single cylinder gasoline stationary gen-set engine. He is also
stressing the low cost, good performance and durability of the sensor developed.

18
2.3.1.2 Optical fiber sensors for temperature measurement
Yan et.al. [84] described an optical radiation probe that consisted of an
trifurcated optical fiber bundle component exposed to the combustion chamber
through a 0.25 inch diameter sapphire rod window. The rest of the components used
in the optical setup are: condensing lenses, bandpass filters and photodiode
detectors as it can be seen from Fig 2.5. The experiments reported were conducted
on a single cylinder Cummins diesel engine. The engine cross section illustrated in
Fig 2.6 shows the optical window positioning as well as the 14° field of view of the
optical radiation probe employed by the authors for the experimental testing. A
second design had the capability of a 180° field of view but the downside of the
respective probe was the fouling of the window due to soot deposits.
Fig 2.5 – Yan and Borman’s schematic of the optical setup [84]
Different designs were employed until one design was able to sustain a clean
window even for full load conditions. This optimum design is shown in Fig 2.7 and it
consists of a well defined gap between the window surface and the bottom of the
restriction sleeve of 1.27 mm.

19
Fig 2.6 – Cummins engine cross section and optical window positioning [84]
The authors were interested in obtaining direct information related to flame
temperature, soot concentration and radiative heat transfer through the use of the
two-color method [85]. This optic measurement technique is described in detail in a
later section (3.1). The three detectors were receiving light that was filtered for the
550 nm, 700 nm and 850 nm. However, the authors have chosen the 550 and 850
nm wavelengths for the comparisons presented in the paper [84].
Fig 2.7 – Optimum design of the radiation probe that keeps the window clean [84]

20
Also, another approach was investigated by Shakal and Martin [86]. In order
to gather information from a large area of the combustion chamber, they used an
optical setup with a fiber optic bundle and acquired photographs during the
combustion cycle. Subsequently the two-color method was applied to the
photographs in order to determine the soot temperature and optical thickness factor
KL. The full field optical setup consisted of a coherent fiber-optical bundle, a
microscope objective lens with a 10x magnification, an image doubler and an
intensified charge injection device (CID) camera. The experimental optical setup is
presented in Fig 2.8. Two wavelengths were selected: 550 and 650 nm. And the
optical access to the two-stroke direct injection diesel engine combustion chamber
was provided through a sapphire window mounted in place of a pressure transducer.
Fig 2.8 – Experimental optical setup for soot temperature and concentration measurements [86]
Li and Wallace [87] were also interested in investigating soot temperature
and optical thickness in a diesel engine. They used three optical probes with direct
access to the combustion gases through the cylinder head for their experimental
work.
Also, Struwe in 2003 [88] used two radiant probes to measure total
hemispherical in-cylinder radiant heat transfer. The probes were used one at a time
and were mounted in the cylinder head in place of one of the exhaust valves. The

21
design was based on the optical radiation probe developed by Yan and Borman [84].
Again, the self-cleaning feature of the probe played a major role in the design
process as well as data analysis.
Fig 2.9 – Components of the optical system [88]
Fig 2.9 represents the components of the optical system. Also, the three
wavelengths selected by the author were: 750 nm, 830nm and 1000 nm.
Additionally, Hall et al. [52] employed a fiber optic infrared spectroscopic
sensor to measure the residual fraction of burned gas. Furthermore, Kawahara et al.
[56, 57, 58] developed a fiber optic sensor as part of a heterodyne interferometry
system to measure in-cylinder temperature of burned and unburned gases on an SI
engine. The optic sensor has a sapphire window and a metal mirror. Even though the
authors have used an SI engine for their tests they call attention to the benefits of
the sensor that can be mounted on any engine in place of the pressure transducer.
The same system was used by Lee [60] to obtain transient measurements for
unburned gas temperatures.
Also, as a part of a spectroscopic system, Lan [59] has used a fiber optic
sensor to measure the H2O mole fraction and gas temperature in an HCCI engine.
This all fiber laser sensor system was capable to provide real time in-cylinder

22
temperatures but the authors faced the challenge of improving the system in order
to eliminate the measurement errors.
Fig 2.10 – AVL sensor installed in glow plug adapter [89]
Another sensor developed for combustion monitoring with a fiber optic cable
component is the one from AVL. The sensor, installed in a glow-plug adapter, is
shown in Fig 2.10 and is part of flame analysis system designed for diesel engines.
The field of view of the sensor is of 90°. The system has the capability to monitor
soot evolution, formation and oxidation. The working principle is based on
measurement of the emitted radiation coming from soot. Then the information is
evaluated using the traditional two-color method for the 600 nm and 950 nm
wavelengths [89]. The classical interpretation of the two color method (TCM) will be
described in the following section
2.4 In-cylinder gas temperature measurements
When it comes to temperature measurements one thinks to thermocouples.
However, for the case of in-cylinder gas temperatures thermocouples fall short when
it comes to durability and time response. That is why this type of measurements has
been dependent until recently by optical techniques.

23
The line-of-sight techniques used for this type of temperature measurements
can be classified as radiation thermometry and spectroscopic techniques.
In recent years, laser based diagnostics have been developed such as
spontaneous Raman scattering (SRS), laser Rayleigh scattering (LRS), coherent anti-
Strokes Raman scattering (CARS), and laser induced fluorescence (LIF).
With the exception of two-color method the techniques mentioned above do
not constitute the subject of the current work and so no comprehensive explanation
is going to be provided here; however, detailed information can be obtained from
multiple sources including the book published by Zhao [76].
2.5 Two-color method
The two-color method is a technique that has been developed in order to
obtain information related to flame temperature and soot concentration in a diesel
engine.
The two-color method looks at the soot spectral radiation intensity and
measures the soot temperature and optical thickness by performing optical
measurements at two discrete wavelengths. In order to better understand the
process, some elementary information related to spectra of flames is presented in
the next paragraphs.
Gaydon and Zizak [90, 91] classified the flame emission spectra in two basic
types of spectra: discontinuous and continuous spectra. The first category of
discontinuous spectra includes atomic spectra or line spectra characterized by
isolated lines emitted or absorbed by free atoms experiencing electronic transitions
from one energetic level to another; and molecular spectra or band spectra described
by transitions in between energetic levels of molecules. Band spectra of free radicals

24
such as CH, OH and C2 are the most well-known and well studied band spectra in
hydrocarbon flames.
In the second category are the continuous spectra such as the spectra
radiated by the sun or the spectra emitted by a candle. The spectrum of a typical
flame covers the ultraviolet (UV), visible (VIS) and infra-red (IR) regions of the
electromagnetic spectrum.
Now, considering the structure of flames, two major types are generally
observed: premixed flames and the non-premixed flames [90, 92]. In the case of
premixed flames, the fuel and air or oxidant are well mixed prior to combustion. For
the non-premixed flame or diffusion flame, little mixing generally takes place before
combustion starts. The main mixing mechanisms of the fuel with the surrounding air
are convection and diffusion. As the diffusion process is generally slower than the
kinetically driven combustion process, it is constraining the rate at which the
combustion process is evolving.
In practice premixed flames can be observed to be blue to bluish-green in
color. As an example, the blue color of the carbon monoxide flame is caused by the
emitted photon resulted from the chemical reaction of carbon monoxide with oxygen.
This will be addressed in further detail in section 3.5. At the same time, diffusion
flames appear as bright yellow. In this case the color is due to the blackbody-like
radiation associated with the hot soot particles.
With respect to the topic of interest in this work, the classical diesel
combustion starts with a small amount of partially premixed combustion followed by
the main phase, the diffusion control combustion.
The roots of the soot optical thermometry technique are based on the two-
color method initially developed in the 1940’s by [93]. The two-color method
proposed by the researchers works by measuring the soot radiation intensity at two

25
different wavelengths, hence its name. The method describes the equations and the
assumptions for computing the soot temperature T and soot optical thickness factor
KL (see equation (3.9) below for further details). Also, soot volumetric fraction and
gravimetric density can be obtained by considering an additional set of assumptions
regarding the optical properties of the associated soot particles, such as it complex
index of refraction.
The classical two-color method described here is restricting the field of view
of the detector to a small, well defined area. In this way, the spatial resolution is
increased whereas the instrument sensitivity is reduced due to the fact that less
radiation emitted by the soot is reaching the detector. Another reason for reducing
the field of view is to increase the probability of having it filled with a soot cloud of
homogenous properties. Should the soot cloud not fill the entire detector area, the
estimated temperature would be underestimated.
In their review of the optical techniques for in-cylinder temperature
measurement, Zhao and Ladommatos [94] offered a discussion regarding the
selection of parameter α (see section 3.1 for further details) as well as regarding the
selection of the two measurement wavelengths for both the visible and the infrared
spectral regions. Several previous publications described the details of the
experimental technique, including the calibration requirements.
The KL factor is sensitive to cycle-to-cycle variations, while there is a lower
impact of these factors on the estimated soot temperature. The typical solution to
this high KL sensitivity is the application of extensive temporal averaging. In
consequence, as the traditional two-color method increases the expected accuracy
by targeting a smaller area of the emitting soot cloud, the accuracy is negatively
impacted by the temporal averaging process, as no two soot clouds are expected to
be perfectly identical.

26
Thus, it is postulated here without further proof that the temporal and spatial
averaging processes yield similar accuracies.
With regard to the temporal averaging, there are two methods to obtain T
and KL On an average basis. According to the first method, used by Matsui [95], the
measured detector signals are averaged for each crankangle and then the
corresponding T and KL values are calculated. While according to the second
method, T and KL are computed first for each crankangle for every cycle followed by
averaging. Yan and Borman [84] have compared the two methods and concluded
that there is no significant difference in the results obtained for T and KL for the
combustion systems the authors investigated. However, in practice the first method
is preferred for two reasons. One is that it is faster, as a the solution to the non-
linear system of equations is obtained for a vastly reduced number of points. The
second reason is associated with the improvement of the signal to noise ratio of the
analog signals used for computing T and KL.
Another concept that should to be discussed with regard to the two-color
method is related to the source of the radiation used in estimating T and KL. The
method assumes that the radiation is generated only by soot, with the reflections
and scattering being ignored. However, in a real combustion system, the detected
signal is influenced by radiation emitted by the combustion chamber walls as well as
radiation reflected by the same walls.
Whenever the two-color method is applied, as it is in this work, in the visible
spectral range, the radiation emitted by walls can be safely ignored, as the surface
temperature of the walls is much lower than that of soot [94]. However, the effect
of the radiation reflected by the walls is significantly higher, Matsui [96] showing that
for the case of low soot concentration the KL error is as much as 10% for high soot
concentration. The KL estimation error is accompanied by a temperature estimation

27
error of about 2 – 3 K. In a typical application of the two-color method is largely
impossible to perform a direct measurement of the amount of radiation reflected by
the combustion chamber walls and, as a result, these errors are accepted as
unavoidable and contribute to the total measurement uncertainty.
On the other hand, one of the advantages of the two-color method is that it is
easy to implement and can provide valuable insight through sensitivity analyses (i.e.
comparison against data obtained using the same experimental setup). For example
such analyses have been performed to measure the differences between fuels [97,
98, 99] or different injection techniques [100]. A second benefit is that it does not
require an external light source, as the method relies on the light emitted by soot
particles. Finally, by taking advantage of the fast response detectors, as in the case
of the current research, real time monitoring of the soot concentration and
distribution can be achieved.
There are some challenges as well. One such challenge is that TCM it is a line-
of-sight method. The third dimension, the depth, is compressed and accounted for in
the 2D image that is being analyzed. The non-uniformity in temperature and
concentration of soot within the soot cloud is going to influence the calculated flame
temperature and KL factor. Also, the flame closer to the detector is going to have a
greater influence on the measured temperature than the flame further away mostly
due to light absorption effects. The gradient distribution in soot concentration along
the line-of-sight has a smaller influence on the measured temperature than the
gradient dispersal of soot temperature [84, 94, 101].
The method assumes that the temperature is spatially uniform along the line
of sight. Consequently, the information related to the temperature and optical
thickness is obtained when evaluated against a calibration light source for the same
wavelengths. More details related to the mathematical background of the two-color

28
method are provided in subchapter 3.1. Also, the specifics regarding the calibration
procedure of the optical setup used in the current research are presented in
subchapter 0. In fact, the classical two-color method is a “line-of-point”
measurement. In order to expand the field of view from a small area to a two
dimensional image, the two color method can be used in conjunction with high-speed
cameras or CCD cameras.
The two-color method was used by Hottel and Broughton [85] in 1932 on an
open flame application and Uyehara [93] used it in 1946 for diesel flame
temperature measurements. These results were reported from a single point
measurement within the combustion chamber. Matsui et al. [96] extended the
method to a full view, 2D high speed images to obtain both temperature and soot
concentration with results obtained from a direct injection diesel engine. Other
applications of the technique include studies regarding the effect of fuel properties on
in-cylinder soot concentration [102], the effect of multiple injections [86] on the
combustion process and soot emissions [100], the effect of the injection strategy and
injection timing on soot and NOx formation [103]. The full field two-color method
application for 2D temperature and KL factor determination covers a wide range
research areas. A few examples include the work of Kobayashi [104] in his research
on a single cylinder, optically accessible diesel engine, Miyamoto [105] studied the
effect of oxygenated additives on the combustion process and emission formation,
Arcouomanis [46] analyzed the effect of EGR on flame temperature, Winterbone
[106] examined the effect of swirl on combustion and Shiozaki [50] gained more
insight on the reliance of OH radical emissions on flame temperature.
Of particular interest for the current research is the work published by
Musculus [101] at Sandia National Laboratory. The author applied the two-color

29
method in order to measure the temperature and heat transfer with the goal of
correlating the soot radiative heat transfer to NOx formation.
Fig 2.11 – Optical setup for temperature and heat transfer measurements – Musculus [101]
The optically accessible, single cylinder, direct injection (DI) diesel engine is
shown in Fig 2.11. Similar to the classical Bowditch arrangement, a mirror is placed
under the extended piston at a 45° angle and it offers optical access through the
piston crown window into the combustion chamber. Soot thermometry is performed
with the help of an ICCD camera and three photodiodes. Elements of the optical
setup are three beam splitters as well as three bandpass filters placed at 410 nm,
570 nm and 900 nm. The ICCD camera is used by Musculus to estimate the surface
area of the soot cloud. Experiments were carried with different start of injection
(SOI) timings and the corresponding engine out NOx emissions were recorded at the
same time. The author concludes that at late SOI and with a corresponding increase
of the premixed burning phase, the NOx emissions were also increasing. This
behavior was shown to be influenced by the reduced quantity of soot that is being

30
formed. Less soot formed less radiation emitted by the soot and thus an increased
flame temperature which farther can be translated as higher NOx emissions.
Fig 2.12 – Experimental setup for the optically accessible diesel engine [98]
Recent papers focused on the in-cylinder soot evolution, employing the
technique of two color method, are the ones from Wayne State University’s Center of
Automotive Research group [97, 98, 99]. The authors are using the same optically
accessible diesel engine (see also Fig 2.12) that has been employed in this work. The
experimental setup is described in detail in Chapter 4.
Yu et al. [97] compared the in-cylinder soot evolution of two fuels, JP-8 (a
kerosene based jet fuel widely used by the US Military) and ULSD. Yu has employed
three approaches for his comparison. First, engine out soot measurements were
obtained by using an AVL MicroSoot Sensor. Second, for his optical set-up the author
used the high speed CMOS color camera in order to obtain images from which
temperature and optical thickness factor KL information can be extracted. And third,

31
a chemical kinetic-coupled CFD model was developed and utilized for understanding
the third dimension that was not available experimentally. Also, the line-of-sight
integration was applied to the 3D model with the aim of attaining equivalent images
for comparison with the images obtained experimentally.
According to the research of Yu, fuels with higher volatility such as JP-8 show
a lower engine out soot emissions. This behavior was attributed to the better fuel
mixing. For the same testing conditions, it was confirmed that JP-8 exhibits lower in-
cylinder soot formation. The lower KL factor, as well as the reduced number of high
temperature zones exhibited by JP-8 were reproduced by the CFD line-of-sight
integration results.
Zha et al. [98] published the results of an investigation regarding the effect of
a biodiesel blend on soot formation and oxidation during combustion. The authors
used ULSD as a baseline fuel and performed the tests on the optical engine whose
schematic is presented in Fig 2.12. For the optical setup the high speed CMOS color
camera was used in order to obtain crank angle based combustion images. The
camera is a visible range camera with a Bayer color filter array for the CMOS sensor.
The authors focused on gathering data for light load engine operating
conditions, in the low temperature combustion regime. For different fuel injection
pressures, the soot evolution was analyzed for the two fuels. It was showed that B20
produces more soot earlier in the cycle, in the premixed burning phase; however,
owing to the higher soot oxidation rates for B20, lower engine-out soot emissions
were measured for the biofuel compared to baseline fuel, ULSD. Also, for higher
injection pressures the author showed that B20 as well as ULSD have lower late
cycle soot formation.

32
Fig 2.13 – Optically accessible single cylinder diesel engine with optical setup for two-color thermometry [99]
In a subsequent publication, Zha et al. [99] continued their research by
extending the optical setup to the one presented in Fig 2.13 where two more
intensified CCD cameras were added alongside the high-speed CMOS camera. The
goal of the research was to extend the dynamic range of the two-color method
towards the lower intensity regions of the cloud (i.e. low temperature or low optical
thickness). In this experimental setup, the light detected by the ICCD cameras is
wavelength restricted with the aid of two narrow bandpass filters for 655 nm and
532 nm respectively. These two cameras are used for soot temperature and KL
optical thickness factor measurement for low intensity soot clouds while the high-
speed CMOS color camera is focused on the same measurements for the high
intensity soot clouds. As in the previously reference paper, Zha used two fuels for
the experimental investigation: ULSD and a 20% by volume blend of soybean
biodiesel and ULSD, B20.

33
The extended capability of the optical setup allowed the authors to make
some interesting data comparison. First, the data collected by the high-speed CMOS
camera was analyzed, followed by data collection with the two ICCD cameras.
Finally, the ICCD camera information was integrated into the high-speed camera
data to yield an expanded camera dynamic range.
The authors concluded that the high speed color camera is underestimating
the soot formation in the early stages of combustion by about 30% compared to the
results obtained using the three camera setup and also predicts lower temperature
because it omits the low intensity soot clouds. On the other hand, the use of the
ICCD cameras alone, with unchanged sensitivity levels, overestimate soot
temperature and underestimate KL factor by about 70%, due to omission on high
intensity soot clouds as a result of pixel data saturation.
2.6 Blue flame
While blue flames have been extensively investigated in open, atmospheric
pressure flames for well over a century, relatively little blue-flame data is available
for high-pressure environments such as internal combustion engines. A possible
explanation for the relative lack of experimental data in this field of spectroscopic
measurements could be due to the relatively low direct application of such
techniques towards the development of internal combustion engines.
In 1926 Clark et al. [107] described the blue-flame emission of different
motor fuels through spectroscopic techniques. Similarly, in 1957 Pipenberg et al.
[108] performed spectroscopic investigations of n-heptane on an ASTM supercharged
method engine. The authors focused on studying the radiation phenomena and the
34
accompanying preflame reactions for n-heptane in the UV, VIS and IR spectral
regions.
By collecting spectrums throughout the entire combustion cycle, the authors
were able to identify some of the chemical species present at specific times during
combustion as well as their quantity.
Also, the radiation from the preflame was used to identify three types of
flames: the cool flame, the blue flame and the intense blue flame. From the
experimental data it was shown that the blue flame reactions preceded the
autoignition and that with an increase in compression ratio (CR) there was an
increase in the blue flame as well.
In 1991 Ohta et al. [109] reported data regarding the identification of cool
and blue flames in CI engines with the help of emission spectroscopy. As means of
identifying the blue flame the authors have used the HCO molecule emitted at 330
nm wavelength as well as the emitted blue color.
Additionally, Lawn et al. [110] investigated in chemiluminescent emissions
from premixed flames. However, the authors focused on the UV region OH
chemiluminescence intensity relation to heat release.
Later studies performed by Griffiths et al. [111] on a rapid compression
machine to study knock occurrence confirmed that blue flame appearance is signaled
by the emerging HCHO* followed by CH* and then CO2* covering the UV and VIS
regions of the electromagnetic spectrum.
Both Yao et al. [112] and Arcoumanis et al. [113] studied the applicability of
dimethyl ether (DME) as a candidate fuel for compression ignition engines. While
Arcoumanis performed experimental studies to investigated DME’s chemical
properties compared to diesel fuel, Yao carried a numerical study to explore the
chemical reaction mechanism in the HCCI process of DME. It was noted by

35
Arcoumanis that DME burns with a visible blue flame, while Yao explained that the
blue flame reaction of the high temperature reaction is the moment when DME is
oxidized rapidly and there is a sharp increase in the CO concentration.
More information on the chemistry of blue flame is provided in subchapter
3.5. An attempt at emulating the reaction mechanism of CO2* (electronically excited
carbon dioxide, the main source for the blue-flame radiation) was realized by Kopp
et al. [114] concurrent with experimental results performed in a shock-tube.
2.7 Conclusions
The internal combustion engine is on a continuous path of improvement to
reduce exhaust gaseous emissions and improve fuel economy. While recent trends in
diesel engine development have lowered the EGR requirements, future regulatory
pressure will likely result in a reversed trend in the future. Highly premixed
combustion modes generally falling within the LTC category are typically
accompanied by the occurrence of blue-flames. The stronger the degree of premixed
combustion, the stronger the CO2* emitted blue-flame radiation. This may result in a
significant inference in the application of the two-color method which, at the most
fundamental level, needs to be understood and ultimately compensated for. This
chapter summarized previously published studies relevant for the current research,
with a focus on the details of the application of the two-color method.

36
Chapter 3. Development of extended two color method (eTCM)
3.1 Two color method – theoretical background
The two color method is a method used in soot optical thermometry for
determining the temperature and volumetric concentration of a soot cloud. This
method is of interest for characterizing the soot formed and oxidized in a diesel
engine. Following, a description of the mathematical background is presented.
The dependence of the blackbody emissive power on temperature and
wavelength is given by Plank’s equation:
(3.1)
where Eb is the blackbody monochromatic emissive power [W m-3], λ –
wavelength [nm], T is the blackbody temperature [K], C1 and C2 are model
coefficients given by C1 = 3.7418x10² [W nm2] and C2 = 1.4388x10⁷ [nm K]
Citing the work of Hottel et.al. [115], Siegel and Howell [116] considered an
empirical equation describing the emissivity of soot in the following form:
(3.2)
where the wavelength λ is expressed in µm even though for this empirical
equation the term λ is regarded as unitless, K is a coefficient proportional to the soot
volume concentration and L is the geometric thickness of the flame along the optical
axis of the detector . The product between K and L is called KL factor and is used for
quantifying the soot concentration. Also, the value of the wavelength exponent
coefficient α depends on the optical and physical properties of the soot present in the
flame. This includes variables such as wavelength range and fuel used. Due to the
fact that the three wavelengths selected for the current research are in the visible
range of the spectrum the value of α is less critical for evaluation of flame

37
temperature and KL factor [94]. In 1963 Siddal and McGrath [117] have developed a
continuous function to characterize the wavelength exponent coefficient α. Following
their work, Matsui et al. [96] used this alpha function to characterize sooty diesel
combustion. As a result of the experimental work conducted they came up with
different constants for the α function as it can be seen from the following equation:
1.22 – 0.245 ln(λ) (3.3)
To be noted that α is a dimensionless number; however, the value of λ used
in the equation should be in μm. Subsequently, the results obtained by using
equation (3.3) are in conformity with the findings of Siegel and Howell [116], and
Hottel and Broughton [85]. They suggest the use of α = 0.95 for infrared
measurements (λ > 800 nm) and α = 1.39 in the visible range (300nm < λ < 800
nm). Other values for the α coefficient have been suggested over the years by
numerous authors and are summarized by Zhao and Ladammatos [76]. Thus, based
on equations (3.1) and (3.2), the soot emissive power is given by:
(3.4)
Also, the equation for the signal received from an optical detector that looks
at a radiating soot cloud can be expressed by [101, 118]:
ddAd),T(E)(HV bsoot
A
(3.5)
Where Vλ is the signal that comes from the detector; Hλ is the detector
transfer function; A is the area of the soot cloud and Ω is the solid angle subtended
by the active area of the detector.
Typically, under the two-color method described previously, a requirement for
a narrow field of view of the detector must be imposed in order to simplify the form
of equation (3.5) and avoid the triple integration. So in this narrow cone associated
with the field of view, the temperature and composition are assumed to be constant.

38
While this is a convenient mathematical simplification, it reduces the amount of
signal that can be received by the detector. More importantly, the two-color method
becomes quite sensitive to cycle-to-cycle variation in the position of the soot clouds,
thus requiring extensive cycle-averaging (as much as 1000 cycles)[76] (see Fig 3.1).
In seeking to alleviate this issue, one may remove the requirement for a narrow
field-of-view and replace it with a set of assumptions. It is assumed that for a cloud
of soot of arbitrary shape and size, there exists an equivalent temperature and KL
factor which closely approximates the behavior of the soot-cloud temperature and
concentration. This assumption is necessary due to the lack of spatial resolution of
this type of measurement and it has been used implicitly in equation (3.6). The term
Hλ is considered a constant. Let εsoot and Eb be the equivalent average function such
that εsoot times Eb equals the equivalent of the triple integral.
It can be argued that the assumption used does not increase the error in soot
temperature measurement when compared to the classical two-color method as
described by Zhao and Ladammatos[76]. While the two-color method measures the
incident radiation in a much smaller field of view of the detector and the gradient of
soot temperature and concentration may be assumed to be relatively small, the
averaging needed in order to remove the cycle-to-cycle variation introduces actually
a “gradient” in time of the two variables. Thus, the errors in determining the soot
temperature and concentration of the two-color method and the extended two color
method are expected to be of the same order.
The effect of temperature and soot concentration non-uniformity has been
studied for the two-color method by Matsui et.al.[119],[120] and by Yan et.al.[121]
whose work was cited by Zhao and Ladammatos [76]. It has been observed that a
severe variation of the temperature distribution results in the underestimation of the
KL factor while a variation in the soot concentration has a milder effect on the
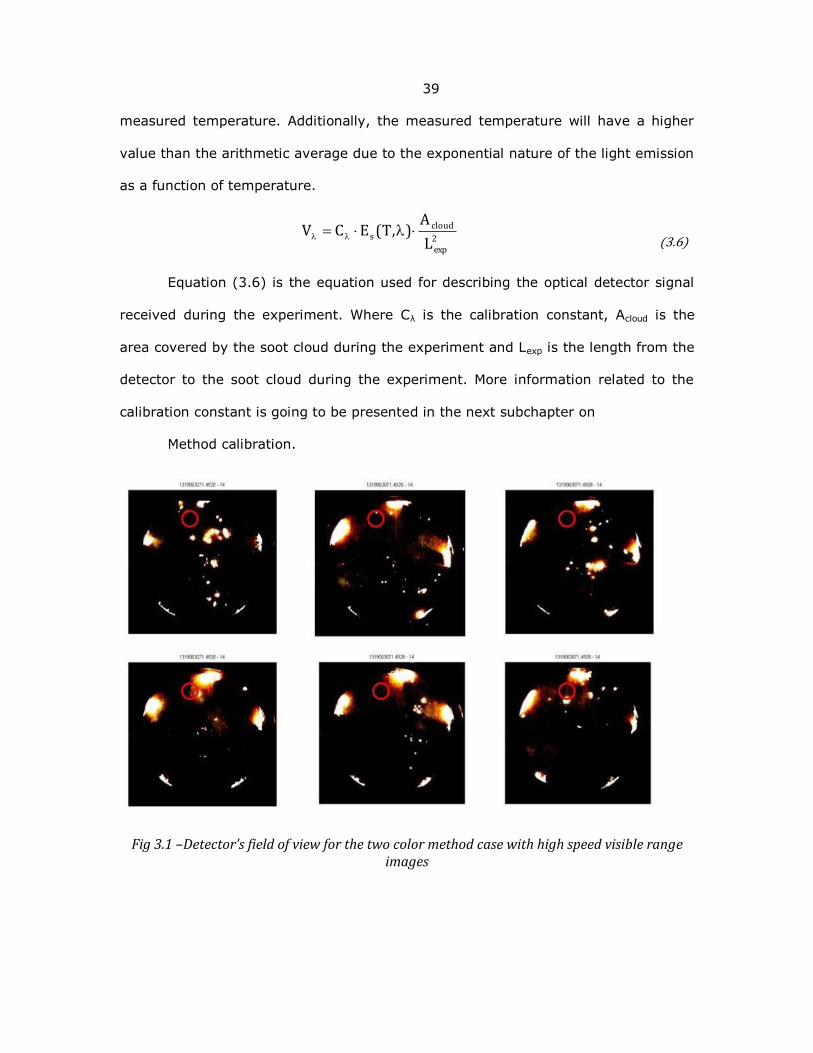
39
measured temperature. Additionally, the measured temperature will have a higher
value than the arithmetic average due to the exponential nature of the light emission
as a function of temperature.
2exp
clouds
L
A),T(ECV
(3.6)
Equation (3.6) is the equation used for describing the optical detector signal
received during the experiment. Where Cλ is the calibration constant, Acloud is the
area covered by the soot cloud during the experiment and Lexp is the length from the
detector to the soot cloud during the experiment. More information related to the
calibration constant is going to be presented in the next subchapter on
Method calibration.
Fig 3.1 –Detector’s field of view for the two color method case with high speed visible range images

40
3.2 Development of the combustion optical probe
The need to obtain more information related to the combustion process with a
sensor system that has small dimensions when compared to traditional sensors has
driven the author to develop the enhanced chemiluminescence-based combustion
optical probe. A picture of the instrument layout is shown in Fig 3.2.
Fig 3.2 – Optical components of the combustion probe
With its aid, essential information is gathered and analyzed. More details on
data analysis are presented in Chapter 5. This subchapter however, is focused on the
development of the combustion optical probe.
Specifically, Fig 3.3 illustrates the schematic of the combustion optical probe.
The light emitted during the combustion process is collected with the aid of a
focusing lens and directed to the collimating lens through an optical cable. Next, the
collimated beam of light encounters the first beam splitter where light in the 446-500
nm range is reflected while light in the 513-723 range is transmitted. The reflected

41
light passes through a 450 nm bandpass filter and reaches the first photomultiplier
tube. Then, the once transmitted beam of light encounters the second beam splitter.
The reflected light in the 499-555 nm range passes through a 532 nm bandpass filter
and arrives at the second PMT. In the same way, the transmitted light in the 569-
730 nm range is delivered to the third PMT through a 640 nm bandpass filter. At the
PMT level light intensity is translated into voltage output that it is collected further on
by the data acquisition system with a resolution of 0.1 CAD.
Fig 3.3 - Schematic of the combustion optical probe
Detailed information related to every component used for the optical probe
development is presented in the next subchapters.
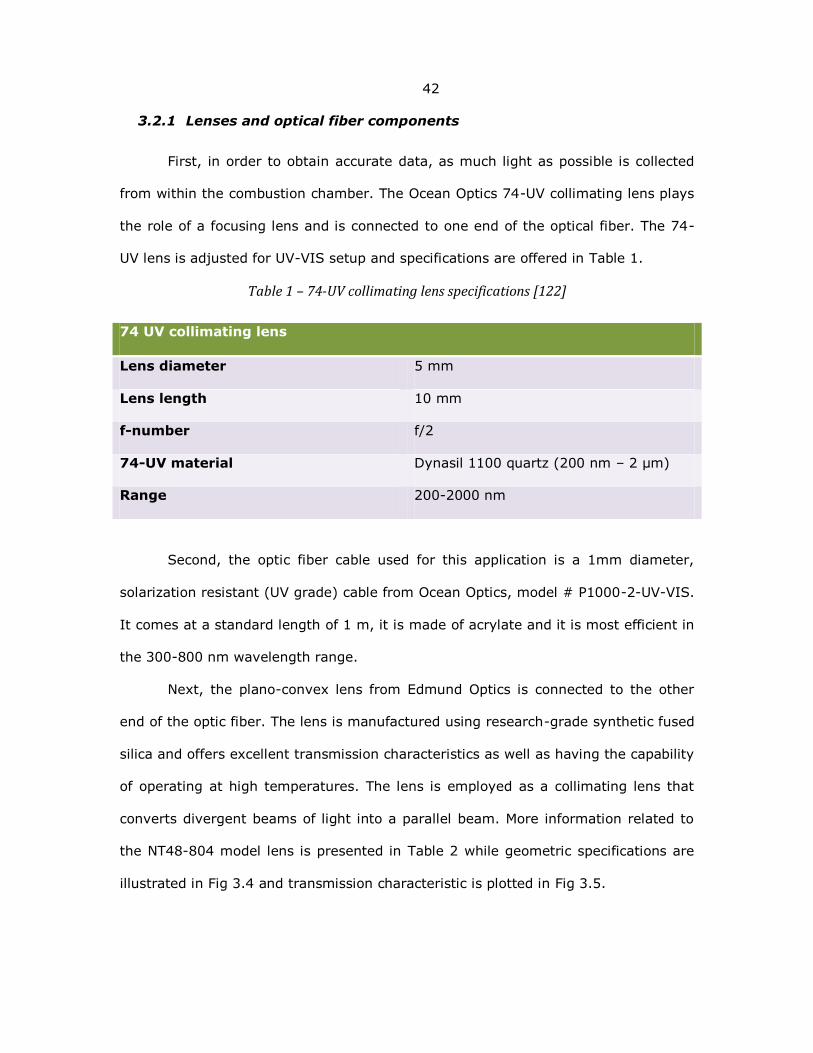
42
3.2.1 Lenses and optical fiber components
First, in order to obtain accurate data, as much light as possible is collected
from within the combustion chamber. The Ocean Optics 74-UV collimating lens plays
the role of a focusing lens and is connected to one end of the optical fiber. The 74-
UV lens is adjusted for UV-VIS setup and specifications are offered in Table 1.
Table 1 – 74-UV collimating lens specifications [122]
74 UV collimating lens
Lens diameter 5 mm
Lens length 10 mm
f-number f/2
74-UV material Dynasil 1100 quartz (200 nm – 2 μm)
Range 200-2000 nm
Second, the optic fiber cable used for this application is a 1mm diameter,
solarization resistant (UV grade) cable from Ocean Optics, model # P1000-2-UV-VIS.
It comes at a standard length of 1 m, it is made of acrylate and it is most efficient in
the 300-800 nm wavelength range.
Next, the plano-convex lens from Edmund Optics is connected to the other
end of the optic fiber. The lens is manufactured using research-grade synthetic fused
silica and offers excellent transmission characteristics as well as having the capability
of operating at high temperatures. The lens is employed as a collimating lens that
converts divergent beams of light into a parallel beam. More information related to
the NT48-804 model lens is presented in Table 2 while geometric specifications are
illustrated in Fig 3.4 and transmission characteristic is plotted in Fig 3.5.

43
Table 2 – Specifications of the UV plan-convex lens [123]
NT48-804
Diameter 6 mm
Clear aperture ≥90% of diameter (mm)
Effective focal length EFL 9 mm
Back focal length BFL 7.29 mm
Radius R1 4.13 mm
Edge thickness ET 1.21 mm
Center thickness CT 2.50 mm
Centering 3-5 arcminutes
Design wavelength DWL 587.6
Coating UV-VIS
Fig 3.4 – Geometric specifications of the UV plan-convex lens [123]

44
Fig 3.5 – Transmittance UV grade fused silica [123]
3.2.2 Beam splitters
As it can be seen from Fig 3.3, two beam splitters were used for the optical
probe development. Both are dichroic beam splitters from Edmund Optics, model #
NT47422 and NT47423. A dichroic beam splitter is an optical device that splits a
beam of light in two beams (one reflected and one transmitted) with different
wavelengths. How much is transmitted and how much is reflected depends on the
application and the properties of the beam splitter. For these particular beam
splitters the main characteristics are presented in Table 3.
Table 3 - Beam splitter specifications [124]
NT47422 NT47423
Color Blue-green Green-orange
Dimensions 25.2 x 35.6 mm 25.2 x 35.6 mm
Thickness 1.1 mm 1.1 mm
Angle of incidence 45° 45°
Reflection wavelength 446-500 nm 499-555 nm
Transmission wavelength 513-723 nm 569-730 nm
Cut-off wavelength 508 nm 565 nm
Substrate UV grade fused silica UV grade fused silica

45
Also, in Fig 3.6 the transmission wavelength range can be seen for the blue-
green dichroic beam splitter. Same thing is plotted for the green-orange dichroic
beam splitter in Fig 3.7
Fig 3.6 – Blue-green dichroic plate beam splitter coating performance [124]
Fig 3.7 – Green-orange dichroic plate beam splitter coating performance [124]
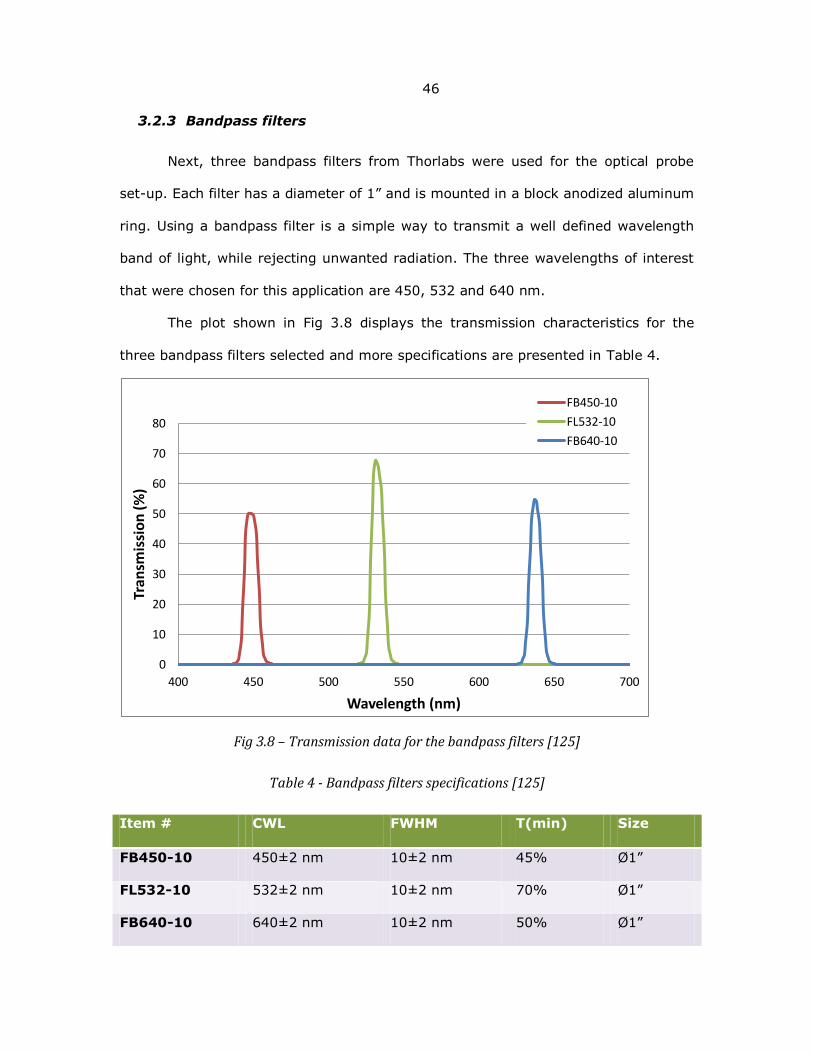
46
3.2.3 Bandpass filters
Next, three bandpass filters from Thorlabs were used for the optical probe
set-up. Each filter has a diameter of 1” and is mounted in a block anodized aluminum
ring. Using a bandpass filter is a simple way to transmit a well defined wavelength
band of light, while rejecting unwanted radiation. The three wavelengths of interest
that were chosen for this application are 450, 532 and 640 nm.
The plot shown in Fig 3.8 displays the transmission characteristics for the
three bandpass filters selected and more specifications are presented in Table 4.
Fig 3.8 – Transmission data for the bandpass filters [125]
Table 4 - Bandpass filters specifications [125]
Item # CWL FWHM T(min) Size
FB450-10 450±2 nm 10±2 nm 45% Ø1”
FL532-10 532±2 nm 10±2 nm 70% Ø1”
FB640-10 640±2 nm 10±2 nm 50% Ø1”
0
10
20
30
40
50
60
70
80
400 450 500 550 600 650 700
Tran
smis
sio
n (
%)
Wavelength (nm)
FB450-10
FL532-10
FB640-10

47
Where CWL – center wavelength; FWHM – full width half maximum; T(min) –
peak transmission
A discussion is essential at this point in order to explain why the three specific
wavelengths have been chosen for this particular research. As mentioned before in
the literature review part of this thesis, soot emits a continuous spectrum in the
infrared and visible regions of the electromagnetic spectrum. The two wavelengths,
λ2 and λ3, should be chosen in such a way that minimum to no radiance interference
from other species should exists. On the other hand λ1 has been chosen on purpose
in the maximum range of interference from the CO continuum. Another reason for
choosing visible wavelengths over infrared ones is due to the larger rate of change of
the spectral radiance with respect to temperature for a given wavelength. In this
way, greater signal sensitivity can be achieved. Following, by having a larger
difference in the signal output from the two wavelengths λ2 and λ3 signal to noise
ratio is improved. Next, having λ1, λ2 and λ3 in the visible range makes the estimation
of temperature and KL factor less sensitive to the value of parameter α. A detailed
explanation for KL and α is provided in the following section 3.1. To continue the
discussion for the choice of λs another advantage of visible over infrared is given by
the fact that combustion chamber wall reflections and radiation are insignificant
when calculating the temperature and KL factor with the two-color method. Overall,
it can be said that using the wavelengths in the visible region of the spectrum
increases the reliability of the two-color method.
3.2.4 Photomultiplier tubes
Lastly, the photomultiplier tubes used in the combustion probe development
are from Hamamatsu, model # H5784. A photomultiplier tube (PMT) is a vacuum
tube and a very sensitive detector of light in the ultraviolet and visible range of the
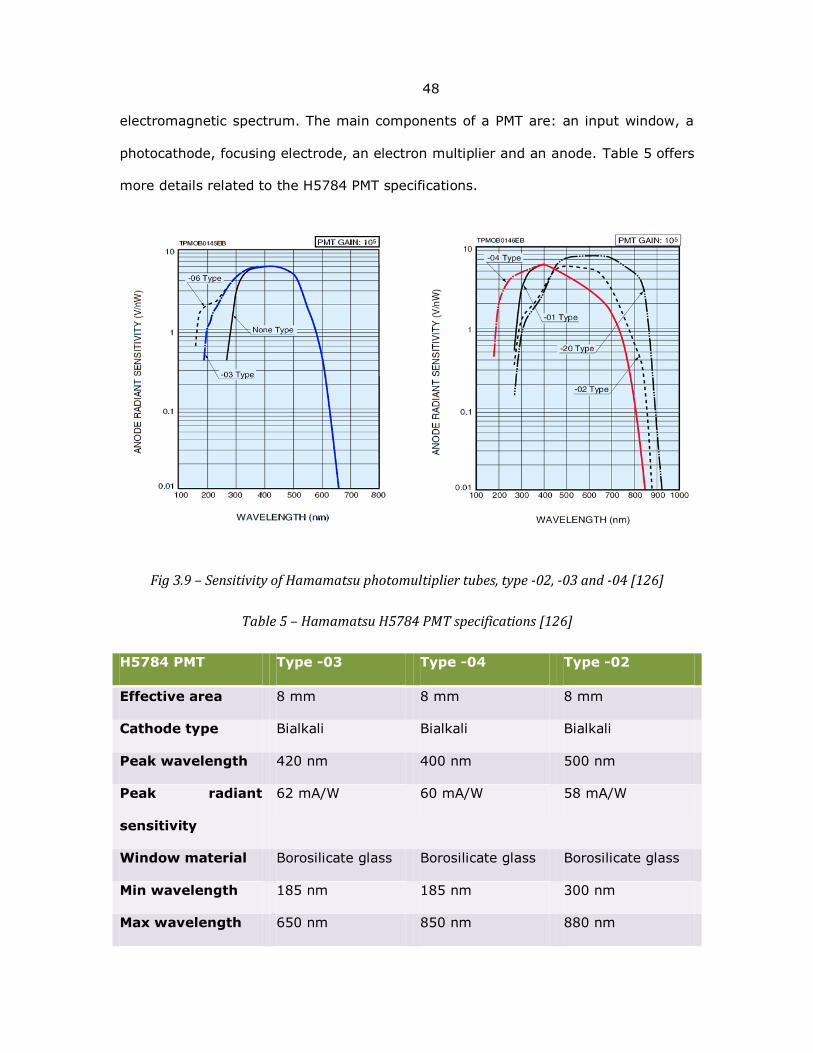
48
electromagnetic spectrum. The main components of a PMT are: an input window, a
photocathode, focusing electrode, an electron multiplier and an anode. Table 5 offers
more details related to the H5784 PMT specifications.
Fig 3.9 – Sensitivity of Hamamatsu photomultiplier tubes, type -02, -03 and -04 [126]
Table 5 – Hamamatsu H5784 PMT specifications [126]
H5784 PMT Type -03 Type -04 Type -02
Effective area 8 mm 8 mm 8 mm
Cathode type Bialkali Bialkali Bialkali
Peak wavelength 420 nm 400 nm 500 nm
Peak radiant
sensitivity
62 mA/W 60 mA/W 58 mA/W
Window material Borosilicate glass Borosilicate glass Borosilicate glass
Min wavelength 185 nm 185 nm 300 nm
Max wavelength 650 nm 850 nm 880 nm
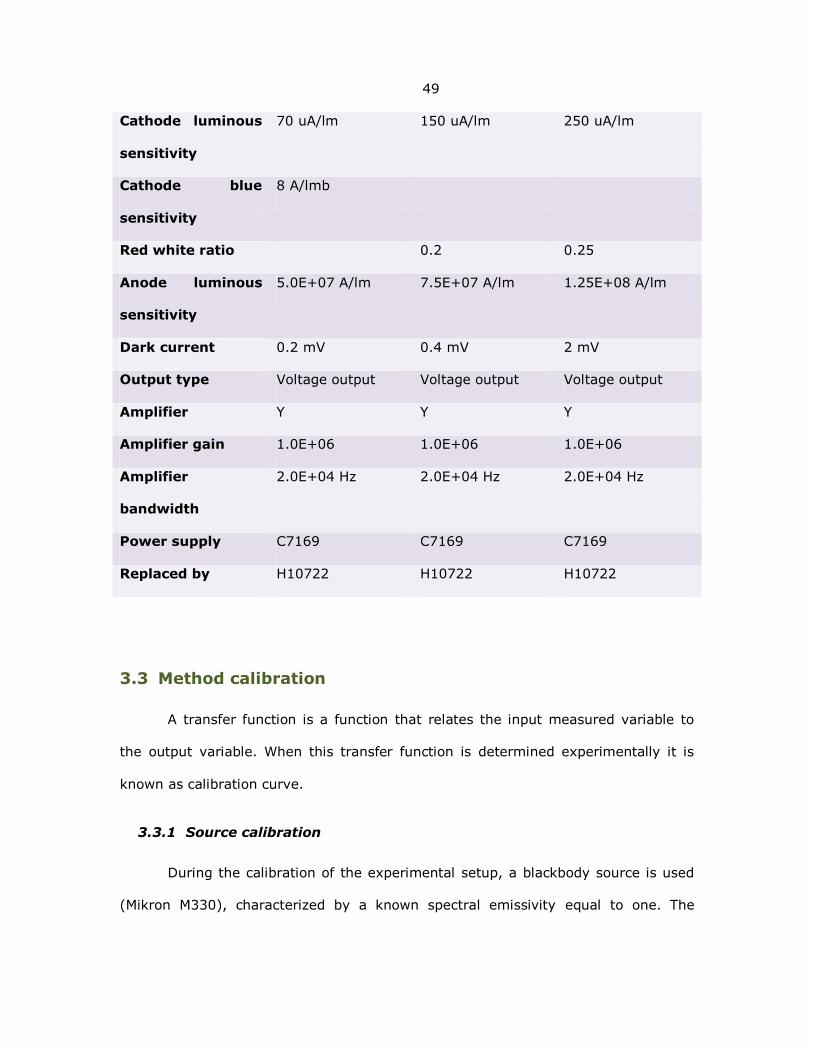
49
Cathode luminous
sensitivity
70 uA/lm 150 uA/lm 250 uA/lm
Cathode blue
sensitivity
8 A/lmb
Red white ratio 0.2 0.25
Anode luminous
sensitivity
5.0E+07 A/lm 7.5E+07 A/lm 1.25E+08 A/lm
Dark current 0.2 mV 0.4 mV 2 mV
Output type Voltage output Voltage output Voltage output
Amplifier Y Y Y
Amplifier gain 1.0E+06 1.0E+06 1.0E+06
Amplifier
bandwidth
2.0E+04 Hz 2.0E+04 Hz 2.0E+04 Hz
Power supply C7169 C7169 C7169
Replaced by H10722 H10722 H10722
3.3 Method calibration
A transfer function is a function that relates the input measured variable to
the output variable. When this transfer function is determined experimentally it is
known as calibration curve.
3.3.1 Source calibration
During the calibration of the experimental setup, a blackbody source is used
(Mikron M330), characterized by a known spectral emissivity equal to one. The

50
blackbody simulates the flame temperatures estimated to be encountered within the
combustion chamber. Thus, equation (3.6) during the calibration process becomes:
2cal
calbb
L
A)blackbody_T,(EC)object_T(V (3.7)
And then Cλ can be expressed as:
cal
2cal'
cal
2cal
bb A
LC
A
L
)blackbody_T,(E
)object_T(VC
(3.8)
where a distinction has been made between the temperature detected
optically – Tobject – and the one measured by the blackbody source thermocouple -
Tblackbody. Under ideal conditions of blackbody thermal stability and emissivity, Tobject
and Tblackbody are equal. During the calibration procedure sufficient time should be
allowed before measurement for thermal equilibrium to be reached.
Fig 3.10 – Optical probe calibration setup with a blackbody source
Equation (3.7) uses the form of the blackbody function shown in equation
(3.1), along with the voltage Vλ measured experimentally at the three different
wavelengths λ = 450, 532 and 640 nm. The resulting value of 'C is calculated for
different blackbody temperatures; 'C is shown as a function of T in the figure below.
It can be observed that 'C can be considered independent of temperature, which is

51
an expected outcome of equation (3.7). The markers are representing the
experimental data collected for each pair of wavelengths while the lines are showing
the linear fit. By averaging the obtained values, the three coefficients are:
C(1) =78.24303, C(2) = 17.199917 and C(3) = 4.04148.
Fig 3.11 – Scaling coefficient calculated for different blackbody temperatures
3.3.2 High speed camera image calibration
For example, in order to compare the two signals, one coming from the
optical probe and the other one from the high speed Phantom camera a new
calibration needs to be performed. The Phantom camera does not have an angular
effect. No matter where the soot position is within the combustion chamber its
intensity is recorded in the same way on the Phantom image. However, with the
optical probe this angular effect is present and has to be accounted for.
0.00
10.00
20.00
30.00
40.00
50.00
60.00
70.00
80.00
90.00
1300 1350 1400 1450 1500 1550
C(λ
) [V
m3/
W]
Temperature [K]
C(1) C(2) C(3)

52
Fig 3.12 – Optical probe setup calibration
Fig 3.13 – Angular effect calibration results
In Fig 3.12 the calibration setup is shown. The Phantom camera and the
optical probe were positioned in the same way as during the experimental setup.
One deuterium light source was moved within the combustion chamber on a
Cartesian grid. The results are plotted in Fig 3.13 and it can be seen that the

53
intensity coming from the sides of the combustion chamber is less important than
the intensity coming from the center. That being the case, in order to correlate the
two signals one has to apply on the phantom images the obtained transfer function.
Next, by repeating the same procedure presented above but translating the
XY plane on the Z axis a second function is obtained. This information from Z axis is
lost when the Phantom camera is used because the image obtained is integrated on
the line of sight. The results are plotted in Fig 3.14. As it can be seen there is an
effect from the Z positioning within the combustion chamber but it is not that
significant. So, an assumption it is made. One can use the previously determined
transfer function at a certain Z positioning within the combustion chamber and can
say that it is valid for the entire combustion chamber.
Fig 3.14 – Optical probe calibration. Effect of light source on Z position
0.0
0.2
0.4
0.6
0.8
1.0
-20 -15 -10 -5 0
No
rmal
ized
inte
nsi
ty
Light source distance [mm]
22.4mm
30.0mm
14.8mm
~60mm

54
3.4 Numerical solution
To resume, by inserting equation (3.8) in (3.6), one obtains:
cal
2cal
2exp
clouds
'
A
L
L
A)T,(ECV
(3.9)
Equation (3.9) actually represents a system of two equations with two
unknowns, KL and T. In this system of equations, although Tsoot is not known,
voltages Vλ are determined experimentally and thus available. The system of
equations is non-linear and the most reasonable approach to solving it is to seek the
roots numerically. While many options for solving this system numerically are
available, the fsolve() function, part of the MATLAB© [127] computing language,
has been chosen due to ease of implementation, algorithm efficiency and flexibility of
seeking either the actual root or a minimum of the function, as it will be shown later.
The function that is being solved for is directly obtained from (3.9), and has
the following form:
VL
L
A
AC
)1e(
C)e1(),T,KL(F
2exp
2cal
cal
cloud
T
C5
1
KL
2
(3.10)
This can be written as a system with two equations, two unknowns. In order
to visualize a potential surface associated with this function, the following procedure
has been applied. First, all Vλ have been evaluated using the soot emissive power
described by equation (3.4) for given values of KLsoot and Tsoot, in order to generate
input data for the classical two color method which is not affected by measurement
errors. This approach is quite useful in assessing the error behavior, which will be
presented later. Next, the value of the function:
(3.11)

55
is calculated for different values of the T, KL, λ2 and λ3 provided earlier. Its
values are shown in the figure below. The solution, which in the ideal scenario,
without input errors, would mean that the function F reaches zero, is achieved when
the potential surface reaches zero. As PE ≥ 0 due to the form chosen, it means that
the solution is also a minimum for the potential surface. Indeed, that can be
observed in Fig 3.15 for the conditions chosen.
Fig 3.15 – Solution for T and KL
3.5 Theoretical background for extended two-color method
Previously, in this chapter, the traditional two color method was used to solve
a system of two equations (see (3.9)) for two wavelengths λ2 = 532 nm and λ3 =
Solution (Tsoot=1900K)
KLsoot=1)

56
640 nm. In this way solutions for T and KL can be found. By following the same
steps in the reverse way, from T and KL one can calculate the signal that should be
received from the first detector at the 450 nm wavelength. This signal denoted by
“V1 calculated” is compared with the actual measured signal, V1 measured.
Fig 3.16 – Schematic diagram of numerical solution
Following the comparison one would expect for the two signals to coincide. In
the case when the two signals overlap this comparison would confirm that the
calculations for temperature and KL are correct and the two color method is
validated. However, by looking at Fig 3.17 it can be observed that V1 calculated is
different from V1 measured at least for the first 20 CAD for this particular cycle. In
the first part of the cycle the temperature is reaching high unphysical values.
It appears that the CO flame information is “encoded” in the available signals
V1, V2 and V3. Should a relationship exist between the spectral components of the CO
flame signal at the sampled wavelengths, it could be exploited to infer both the
intensity of the CO flame as well as provide an accurate estimate of the soot
temperature and optical thickness factor KL. So, the difference between V1 measured

57
and V1 calculated is a strong indicator of the error introduced in the two color
method by the CO flame.
Fig 3.17 – Calculated T and KL; measured signals V1, V2 and V3; and calculated signal V1
Next, by understanding the CO flame behavior an attempt is made to
experimentally determine and quantify this phenomenon.
Looking at Fig 3.18 the orange line is describing the soot continuum for the
300-900 nm range that includes the visible spectrum domain as well. The blue line is
representing the CO flame continuum. At the three wavelengths of interest a signal
Vλ is measured that can be used to determine the characteristics of the soot cloud
within the combustion chamber. It can be seen that there is a disparity between the

58
orange line and the blue line. This difference is denoted by Bλ and is the signal
measured by the detectors additional to the signal proportional to the soot radiation
intensity. So Bλ is the signal attributed to the chemiluminescence reaction called
“blue flame”.
Fig 3.18 – CO flame continuum and soot continuum
According to Gaydon [90, 128] carbon monoxide combustion generates a
spectrum of the blue flame that can be described as a continuum with the strongest
peak in the 350-450 nm region. However, the continuum extends into the ultraviolet
region as well as the visible region of the electromagnetic spectrum approximately
from 340 nm to 650 nm.
A detailed reaction mechanism for the formation and destruction of CO2* is
not well understood as of today but this is not a limited factor because it can be
addressed through experimental measures [114].
The processes generating the blue flame continuum was initially described as
a result of the interaction:
[128, 129] hCOOCO 2
1
200 300 400 500 600 700 800 900
λ2 λ3
B2B1
B3
V2 V3
CO flame continuum
Soot continuum
Visible Spectrum [nm]UV IR
λ1
V1
De
tect
or
sign
al [
V]
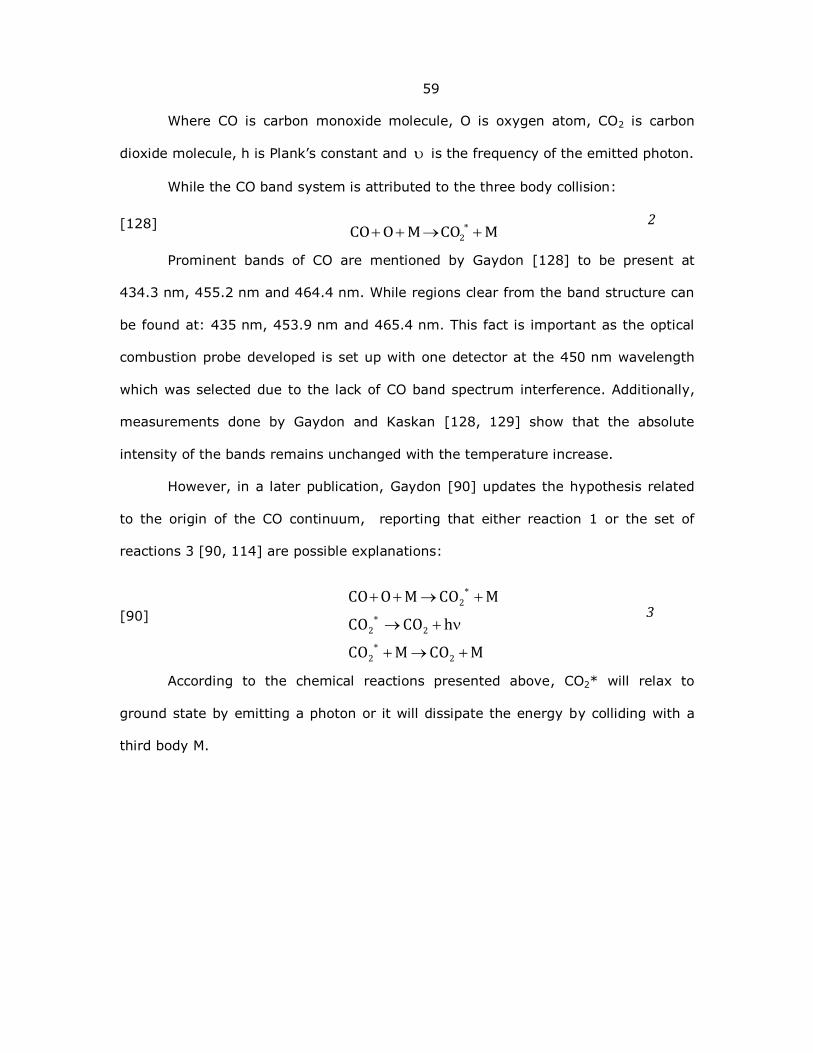
59
Where CO is carbon monoxide molecule, O is oxygen atom, CO2 is carbon
dioxide molecule, h is Plank’s constant and is the frequency of the emitted photon.
While the CO band system is attributed to the three body collision:
[128] MCOMOCO 2
2
Prominent bands of CO are mentioned by Gaydon [128] to be present at
434.3 nm, 455.2 nm and 464.4 nm. While regions clear from the band structure can
be found at: 435 nm, 453.9 nm and 465.4 nm. This fact is important as the optical
combustion probe developed is set up with one detector at the 450 nm wavelength
which was selected due to the lack of CO band spectrum interference. Additionally,
measurements done by Gaydon and Kaskan [128, 129] show that the absolute
intensity of the bands remains unchanged with the temperature increase.
However, in a later publication, Gaydon [90] updates the hypothesis related
to the origin of the CO continuum, reporting that either reaction 1 or the set of
reactions 3 [90, 114] are possible explanations:
[90]
MCOMCO
hCOCO
MCOMOCO
22
22
2
3
According to the chemical reactions presented above, CO2* will relax to
ground state by emitting a photon or it will dissipate the energy by colliding with a
third body M.

60
Fig 3.19 – Theoretical potential energy curves for the CO and O interaction to form CO2 [128]
At this time, as the author is not aware of any other publically available
research regarding this topic, reaction 1 will be considered to be responsible for the
CO continuum in an attempt of describing the CO continuum behavior. This
explanation relies on work by Gaydon [128]. However, consideration of system (3) is
not expected to have a significant impact on the conclusions presented later.
The goal is to understand the impact of temperature and pressure on the
relative spectral intensity of the CO continuum. Towards this goal, let us consider the
molecular potential energy model proposed by Gaydon [128] and shown in Fig 3.19.

61
Along the X axis is represented the distance between the CO molecule and O atom as
they collide within the combusting mixture, while the Y axis corresponds to the
potential energy resulting from the balance of attractive and repulsive forces
occurring between the atomic nuclei. Two curves are depicted: one for the reaction
of CO with O in the singlet D state (1D) and the other one for CO and O in the triplet
P state (3p). The CO2 dissociation reaction is expected to follow the CO + O(1D)
path.
According to Gaydon’s model, in the case when enough kinetic energy is
available to the CO molecule and O(3P) atom at the time of their collision, it is
probable that the CO+O(3P) system will reach state A or lower. Due to repulsive
characteristics of the CO+O(1D) system, it is not possible to form a CO2 molecule
unless a transition occurs from CO+O(1D) to CO+O(3P). A certain probability
distribution will exist for all the possible transitions occurring from energy state A or
lower, which may be translated into a certain spectral intensity distribution as
measured experimentally by a spectrometer. As the temperature of the system is
increased, providing CO and O with higher kinetic energy at the time of the collision,
the highest energy state achieved by the CO+O(1D) system increases from state A to
state C. The resulting transition to state D will yield higher energy photons,
characterized by shorter wavelength. This in turn skews the probability distribution
towards shorter wavelengths, which was indeed observed experimentally.
In other words, if CO continuum intensity measurements are performed at
two wavelengths, the ratio of the shorter wavelength intensity to the longer
wavelength will increase with an increase in temperature.
At the same time, increased pressure for the environment in which the CO+O
collisions are taking place will increase the probability of collision (i.e. absolute blue

62
flame light intensity) but will not have an impact on the photon energy probability
distribution (i.e. ratio of CO continuum light emission at different wavelengths).
However, while Gaydon’s conceptual model for CO continuum light emission is
based on scientific data available through spectral measurements as well as good
understanding of the quantum-mechanics behavior of the atoms and molecules
involved, it is not validated by direct measurement or computation of the potential
energy surfaces suggested in Fig 3.19.
With the aid of modern tools, such as numerical Schrödinger equation solvers
(e.g. ab initio solvers such as Gaussian [130]), the model could be validated by
computing the potential energy surfaces associated with the CO+O(1D) and
CO+O(3P) systems. Additionally, it is possible that this understanding of the potential
energy surfaces would provide the means to predict the impact of temperature on
the probability distribution function which governs the light emission for reaction 1
for a range of ν’s.
Under these circumstances, going back to eTCM equation (3.9) can be
rewritten with the additional term that counts for the blue flame:
B
A
L
L
A)T,(ECV
cal
2cal
2exp
exps
' (3.12)
Where: Bλ is the blue flame phenomenon that influences in different
proportions the signal received for the specific three wavelengths considered. This is
the equation used by the extended two-color method – eTCM. The next step is how
to quantify the Bλ term. This subject will be further discussed and analyzed in
Chapter 5.

63
Chapter 4. Research engine and experimental facility
The experiments presented in this thesis were conducted on a small bore
optically accessible diesel engine. The engine is part of a state of the art
experimental facility at Wayne State University known as Low Temperature Research
Center.
Further technical details related to the research engine and investigation
equipment are presented in this chapter and a schematic of the experimental setup
can be seen in Fig 4.1.
Fig 4.1 – Experimental setup

64
4.1 Optically accessible experimental engine
As mentioned before, the engine used for the experimental component of this
thesis is a single cylinder, direct injection, model AVL 5402 research diesel engine.
Pertinent information related to the engine characteristics is presented in Table 6.
Table 6 – Experimental engine characteristics
Optically accessible engine AVL 5402, DI
Bore 85 mm
Stroke 90 mm
Swept volume 510 cm3
Compression ratio 15:1
Connecting rod length 148 mm
Combustion bowl diameter 40 mm
Combustion bowl depth 17 mm
Number of intake valves 2
Number of exhaust valves 2
Intake valve opening/closing 326°/594° CA aTDC
Exhaust valve opening/closing 106°/374° CA aTDC
Injection system Bosch Common Rai
(Pmax=1350 bar)
Swirl control/ratio AVL/2.0-4.5
Rated speed 3000 rpm
The engine’s fuel injection system is a common rail, Bosch CR CP1, with a
VCO design, 5 holes Bosch fuel injector. The system is capable of delivering injection

65
pressures up to 1350 bar. Table 7 provides more details regarding the fuel injector
specifications.
Table 7 – Fuel injector specifications
Injection System Common Rail CP1
Model Bosch DSLA 142 P
Design VCO – nozzle
Injection Pressure Variable (1350 bar max)
Injector Number of Holes,
Hole Diameter
5 holes,
180μm dia
Hole Included Angle 142°
For instance, optical access is provided through a 20 mm thick window
mounted on the extended Bowdich type piston. This window is encased in a metallic
casing allowing the assembly to be removed with ease for cleaning.
As it can be seen from Fig 4.3 a fixed mirror is positioned at a 45 deg angle,
with respect to the cylinder axis, underneath the piston assembly in order to grant
unrestricted view of the 40 mm diameter combustion bowl.
Fig 4.2 – Elongated optical piston

66
Fig 4.3 – AVL 5402 Single cylinder optically accessible research engine [131]
Additionally, there are two more optical windows mounted in the piston
crown. The design of the piston and combustion chamber, while providing necessary
optical access is striving to maintain the geometry as close as possible to the
geometry of an all metal engine.
The combustion chamber is a high pressure, high temperature environment.
That being the case, the materials utilized for the windows have to withstand these
harsh conditions. Combining these mechanical properties with optical requirements
two materials are most suitable for the optical windows: fused silica and sapphire.
Depending on the application both materials have their advantages. On one hand
sapphire has great hardness; while on the other hand, fused silica has better
transmissivity in the UV-Vis spectrum. Fig 4.4 and Table 8 – Optical properties of

67
fused silica and sapphire [133] show details related to spectral transmissivities and
optical and mechanical properties of sapphire and fused silica.
Fig 4.4 – Spectral transmissivity for fused silica and sapphire [132]
Table 8 – Optical properties of fused silica and sapphire [133]
Property Fused Silica Sapphire
Chemical Formula Al2O3
Index of refraction @400nm 1.469 1.785
Density @293K [kg/m3] 2.19 3.98
Thermal Conductivity @300K [W/m.K] 1.4 35.1 ∥
33.0
Thermal Expansion @ 293K [1/K] 0.5e-06 5.6e-06 ∥
5.0e-06
Specific Heat @298K [J/kg.K] 750 753
Mohs Hardness 7 (ref [134]) 9
Young’s modulus of elasticity E [GPa] 72 335
Poisson’s Ratio 0.17 0.25
0
20
40
60
80
100
100 1000
% T
ran
smis
sivi
ty
Wavelength [nm]
Sapphire Fused …

68
In order not to interfere with the optical access, oil cannot be employed for
cooling the piston. The oil-less lubrication is provided by slotted graphite rings while
sealing of the piston is achieved by uninterrupted bronze-teflon rings. Also,
compressed air is directed underside of the piston window to cool the piston crown-
window during the engine operation.
4.2 Test cell instrumentation, engine systems
Fig 4.5 – AVL optical engine and AVL conditioning unit
The optical engine is located in a closed environment cold chamber that can
lower the environment temperature up to -40°C. However, the cold starting testing
of the engine is not of interest for the subject of this thesis.
For example, the AVL 577 external conditioning unit (see Fig 4.5) is used to
maintain the coolant and lubricant flows at the preferred, optimum temperatures.
Electric resistance heaters are used for raising the temperature to a desired, set-up

69
value of 60°C in order to prepare the engine for the experimental testing. On the
other hand, heat exchangers are used for dumping the heat from the closed system
during the experiments. In case of the optical engine, the coolant and lubricant
systems are separate systems and their functioning is independent on the engine
speed.
Fig 4.6 – AVL engine dynamometer
As part of the experimental setup, an AVL AMK AC dynamometer (DW13-170-
4-A0W) is used for driving the single cylinder engine. The dynamometer is
characterized by a 38 kW output power with a maximum torque of 120 Nm for a
nominal speed of 3000 rpm.

70
Also, an optical encoder wheel (AVL 365) with a resolution of 720 pulses/
resolution is mounted on the crankshaft. In order to increase the angular resolution
from 0.5 CAD to 0.1 CAD for the data acquisition system a pulse multiplier (AVL
Model 365Z01M) is used to extrapolate the crankshaft position. A cam-shaft type
TDC pulse is supplied to other equipment that require a crank angle signal for data
synchronization such as NI-cRIO based engine and camera controller.
Fig 4.7 – Bosch ECU and ETAS VTK7.1
The engine’s electronic control unit is a Bosch ECU designed for diesel
applications. The ECU is working together with the ETAS ETK 7.1 controller through
the INCA v5.1 software to manage the fuel rail injection pressure. The National
Instruments compact RIO (cRIO) real-time controller is controlling the triggering for
the camera systems as well as fuel delivery parameters such as injection timing and
duration.

71
The optical engine also has the capability of adjustable swirl. With the aid of a
butterfly valve different swirl values are obtained, ranging from 2.0 to 4.5 swirl
number.
4.3 Data acquisition system
Two data acquisition systems are available for use with the optical engine
setup. First, is a high speed data acquisition system, AVL Indimeter, which is used to
acquire cycle resolved information. It has eight channels available with a memory of
128 MB to record information for parameters of interest such as: in-cylinder
pressure, needle lift and common rail pressure. This data acquisition system can
operate at a maximum frequency of 20 MHz. Next, the information is handled by the
AVL Indicom computer software and can be saved in an IFILE format. For post-
processing a Matlab script [135] is used in order to have more flexibility for data
analysis and display.
The second one is a low speed data acquisition system, AVL IFEM (Front End
Module). This system is used for recording information related to slow changing
parameters such as engine speed, fluid and gas temperatures. It has a maximum
frequency of 100 Hz and the recorded parameters are time based instead of crank
angle based.
4.4 Engine instrumentation
For information related to the combustion process such as rate of pressure
raise and maximum combustion pressure the optical engine is equipped with an un-
cooled piezo-electric pressure transducer (AVL GH 12 D) mounted with access within
the combustion chamber through the cylinder head. A charge amplifier (AVL 621) is

72
used for signal conditioning. The pressure transducer is characterized by a calibration
constant of 16.25 pC/V.
Then, a fuel line pressure transducer is mounted between the fuel rail and
injector in order to feed the high speed data acquisition system with cycle resolved
rail pressure information. The transducer is an AVL SL31D-2000 strain-gage type
transducer and the AVL 621 strain gage/charge amplifier is used for signal
amplification. The calibration settings for this pressure transducer are 275.95 bar/V
and 0.453µV/V.bar.
Also, a MicroEpsilon ES04 needle lift sensor is mounted on the fuel injector in
order to detect the displacement of the injector needle throughout the injection
event. The sensor is capable of measuring displacements from 0 to 0.4 mm. The
amplifier (MicroEpsilon eddyNCDT 3300) used with the senor supplies a signal in the
range of 0 to 10 V.
4.5 Optical equipment, high-speed camera
In addition to the optical probe developed, a high-speed camera was used for
the experimental section of this thesis. The Phantom v7.3 from Vision Research Inc
was found to be one of the best cameras for combustion studies; it is a visible range,
high-speed CMOS digital, color camera. It has a 16 GB memory and a 14 bit dynamic
resolution for each color. The CMOS sensor is using a Bayer color filter array (RGBG)
covering the visible spectrum from 400 to 700 nm. The sensor’s maximum resolution
is of 800x600 pixels where the pixel size is of 22 µm. Also, the camera is capable of
capturing 200,000 frames per second.
During the experiment, the camera is synchronized with the engine and
individual frames are recorded with a resolution of 0.5 CAD. With this high resolution

73
the quantity of data captured is so large that in order to save memory as well as
reduce the post-processing time only the frames within a 90 CAD interval are
recorded. This range of interest begins with the start of fuel delivery and is signaled
by the triggering of a TTL pulse from the National Instruments cRIO/Drivven Inc.
controller. In this way only the frames of interest that contain pertinent information
are recorded.
Fig 4.8 – Phantom v7.3 (high-speed CMOS camera)
In addition, Zha et al. [98] has published a paper in which the normalized
spectral response of this high-speed camera has been measured and the results are
illustrated in Fig 4.9.
Resolution Frames/s
800 x 600 6,688
640 x 480 10,101
512 x 512 11,527
256 x 256 36,697
128 x 128 88,888
128 x 64 129,032
64 x 64 148,148
32 x 32 190,476

74
Fig 4.9 – Vision Research Phantom v7.3 optical response [98]
Due to space restrictions the camera is mounted on a custom design camera
support outside the cold chamber with access to the engine through a window. Also,
the camera support has the capability of x, y and z translations for high accuracy
positioning.

75
Chapter 5. Data analysis
5.1 Experimental operating conditions and motivation
The experiments were conducted using a single cylinder optically accessible
diesel engine. A complete description of the optical engine and its specifications as
well as the equipment used during testing has been previously presented in Chapter
4.
Table 9 – ULSD and n-heptane fuel properties
properties ULSD n-heptane
cetane number 48.3 (DCN) 56 (CN)
density@15°C [kg/m3] 842 680
lower heating value [MJ/kg] 41.2 44.5
kinematic viscosity @40°C [mm2/sec] 2.479 -
Bulk modulus [GPa] 2.562 -
Two fuels were used for testing. First, ultra low sulfur diesel was selected, as
it is the fuel of choice for diesel-type combustion systems. The second fuel, n-
heptane, was chosen as a low-soot alternative to ULSD. While the n-heptane
combustion process is quite similar to that of ULSD [136], it also has the advantage
of low smoke (soot) formation propensity partially due to the lack of aromatic
content. This characteristic will be taken advantage of later, during the results
analysis part, when quantification of the CO flame will be necessary. Actually, similar
trends can be seen for both fuels in terms of homogeneity when comparing the
premixed combustion part.
In Table 9 a list of ULSD and n-heptane fuel properties is provided along with
the distillation curve of ULSD presented in Fig 5.1.

76
Fig 5.1 – ULSD distillation curve
In order to maintain the optical access free of impurities for as long as
possible, the engine is equipped with an “oil-less” ring pack, where the production
rings are replaced with Teflon-based rings. To facilitate the control the ring pack
temperature and thus reduce the wear on the Teflon piston rings, the engine was
skip-fired. During the skip-fired operation, fuel is injected for 3 consecutive cycles
followed by a variable number of motoring cycles, ranging from 7 to 12 cycles, so
that the thermal stability of the ring pack is maintained, as indicated by in-cylinder
pressure measurements. Another advantage of using the skip-fire operation is that
the window providing optical access within the combustion chamber is kept clean for
a larger number of fired cycles. Matsui et al. [96] showed that, for a direct diesel
engine, a 14% reduction in transmissivity influences the estimate for temperature by
1%, while the KL factor impact is 5%. In the referenced work the measurements
were performed at 550nm.
n-
heptane boils at 99°C

77
Table 10 – Experimental operating conditions
Parameter ULSD n-heptane
Engine speed 1200 rpm
Injection timing 9.5 °bTDC 7.5 °bTDC
Common rail injector solenoid activation
time
480 μs 450 μs
Injection pressure 800 bar
Location of peak premixed combustion 7°aTDC
Intake temperature 306 K
Swirl number 2
The main parameters for the experimental operating conditions are
summarized in Table 10. A single injection event 480 μs long, with a fuel rail
pressure of 800 bar was chosen to yield a location of the peak premixed combustion
at 7°aTDC. In addition, the engine cooling and lubricating systems were conditioned
for one hour at 60°C prior to performing the experiments.
Also, images were acquired with the high speed camera (details available in
the previous chapter) and each frame was synchronized with the engine crankshaft
position. Individual frames were recorded with a crank position resolution of 0.5 CAD
for each engine cycle.
A MATLAB script was used to calculate the apparent rate of heat release
(ARHR) using the average pressure data. The ARHR calculation is based on the
method described by Heywood [71] and the data shown is normalized by the engine
displacement.

78
Fig 5.2 – Cylinder pressure and ARHR for ULSD and n-heptane
The combustion behavior shown in Fig 5.2 is typical of PCCI combustion,
characterized by long ignition delays followed by a strong peak of premixed
combustion and little to no diffusion combustion. This combustion mode is relevant
for light load, high EGR, light duty engine applications as well as other combustion
modes similar to the PCCI combustion. The engine was operated with no external
EGR.
5.2 High-speed imaging results
In order to provide a better understanding of the single-point results, the
high-speed imaging results will be described briefly in this section. Fig 5.4 shows the
comparison of the combustion process of ULSD and n-heptane associated with one
representative cycle. One may immediately observe a clear difference between the
n-heptane and ULSD combustion: the lack of soot radiation, as indicated by lack of
bright-yellow flame regions. While the combustion of n-heptane has been previously
79
shown [137, 138] to lead to the formation of soot under certain operating conditions,
is observed in this experiment to form negligible amounts of soot.
Both the ULSD and n-heptane combustion are characterized by five individual
flame regions associated with each injector nozzle used in this experiment. The blue
flame region is observed to occupy mostly the central region of the combustion
chamber, while the soot-rich area is mostly restricted to the combustion chamber
walls, close to the point of fuel jet impingement.
This combustion behavior, as documented by the high-speed color images, is
significantly different from the traditional diesel combustion, where the fuel ignites
and combusts during the injection process. As a result, the blue-flame radiation from
the CO flame continuum is either dominant (n-heptane combustion) or of the same
order of magnitude (ULSD combustion) as the soot blackbody-like radiation.
A final observation worth mentioning here is the timing of the blue-flame and
soot radiation within the combustion process. The blue-flame is observed to initiate
early on, as soon as the high-temperature heat release (HTHR) phase of the ARHR
starts. As the local temperature increases and soot is formed, soot clouds become
apparent. As the premixed combustion ends, the blue-flame radiation intensity
decreases. As a result, the blue-flame radiation contribution to the two-color method
decreases.
The goal of this research is to allow for the separation of the blue-flame and
soot radiation effects, which in turn enables the calculation of the instantaneous gas
temperature.
The topic of blue-flame interference on the soot radiation signal will be
addressed in the following sections.

80
Fig 5.3 – Single-cycle high speed combustion images for a) ULSD and b) n-heptane

81
5.3 Fiber-optic probe measurements. Blue-flame intereference
Simultaneous measurements were performed using the fiber-optic probe
described in section 3.2. The fiber-optic probe is exposed to the same radiation
detected by the high-speed camera. As discussed in the previous section, the blue-
flame radiation is fairly strong and may interfere with the application of the two-color
method, by invalidating one of the TCM assumptions. By applying the method in its
traditional form, using two detection channels, it is impossible to determine when
such interference occurred except for the conditions in which the two-color method
computes unreasonably high temperatures.
However, the blue-flame component of the radiation may be included in the
TCM assumptions by considering a blue-flame model. As previously discussed in
Chapter 3, section 3.5, the equation describing the optical detector signal received
during the experiment is given by:
B
A
L
L
A)T,KL(ECV
cal
2cal
2exp
exp
s'
where KL, T and Bλ are the unknown quantities. One may note that Bλ as
defined above does not have an engineering unit and is subject to the experimental
setup calibration settings.
The characteristics of the blue-flame radiation may be determined by
interpreting the fiber-optic measurements associated with the smokeless n-heptane
combustion. Under these specific conditions where there is no soot generated during
the combustion process equation (3.12) becomes:
BV (5.1)
By writing equation (5.1) for λ1, λ2 and λ3 and taking the ratios one obtains:

82
23
3
2
3
2
12
2
1
2
1
fB
B
V
V
fB
B
V
V
(5.2)
and the ratios are denoted by: f12 and f23.
Fig 5.4 – Detector signals for one cycle and corresponding high speed camera image at 8 CAD
Fig 5.4 shows data from one engine cycle where n-heptane was used as fuel.
Also, an image of the high speed camera is shown for 8 CAD of that cycle. The high-
speed camera image confirms (Fig 5.4) the lack of radiation associated with soot.
The assumption shown in equation (5.1) is thus reasonable.
While V1, V2 and V3 are characterized by a large cycle to cycle coefficient of
variation (COV), Fig 5.5 and Fig 5.6 show that f12 and f23 have a significantly lower
COV, with a repeatable and constant behavior. For both figures, the average values
of f12 and f23 are plotted in red. Coefficient f23 is observed to have slightly higher
noise compared to f12, which may be attributed to the lower level of blue-flame
radiation at longer wavelengths [90, 128].

83
Fig 5.5 – Plot of f12 for 10 arbitrary, consecutive cycles
Fig 5.6 – Plot of f23 for 10 arbitrary, consecutive cycles

84
The range of interest is delimited by the range where the optical probe
detectors receive a signal due to the blue flame phenomenon. Outside that range,
the signal to noise ratio (SNR) is low and no useful information is available.
The fact that ratio f12 is not constant may lead to the assumption that the
signal is influenced by aldehyde chemiluminescence. However, the fact that f23 has
the same shape and magnitude indicates that it is less likely that this mechanism is
responsible for the observed behavior.
As previously discussed in section 3.5, the author believes that with increase
in pressure there is an increased probability of having collisions between the
molecule of CO and the O atom that could be translated in an increase magnitude of
the continuum throughout the entire spectrum. But it is supposed that there is no
effect on changing the shape of the CO continuum spectrum (i.e. relative spectral
intensity).
The author acknowledges the fact that, due to the complexity of the
phenomenon (i.e. tri-atomic molecule responsible for the measured change in
continuum relative intensity, potential contribution from CO flame bands or
aldehydes and others), this hypothesis requires further testing in order to be fully
validated.
On the other hand, the experimental tests performed by Gaydon [128] on
preheated flames (750°C) of CO with air and CO with O2 in a modified burner
showed for both cases that with increase in temperature the CO flame continuum is
increasing in intensity and the short-wave end is getting stronger. Gaydon’s findings
have also been confirmed by Kaskan [129] who obtained the same behavior in his
experimental work.
Also, formaldehyde (CH2O) can influence the measurements because it emits
in the region of interest of the CO continuum; however, it is consumed at the onset
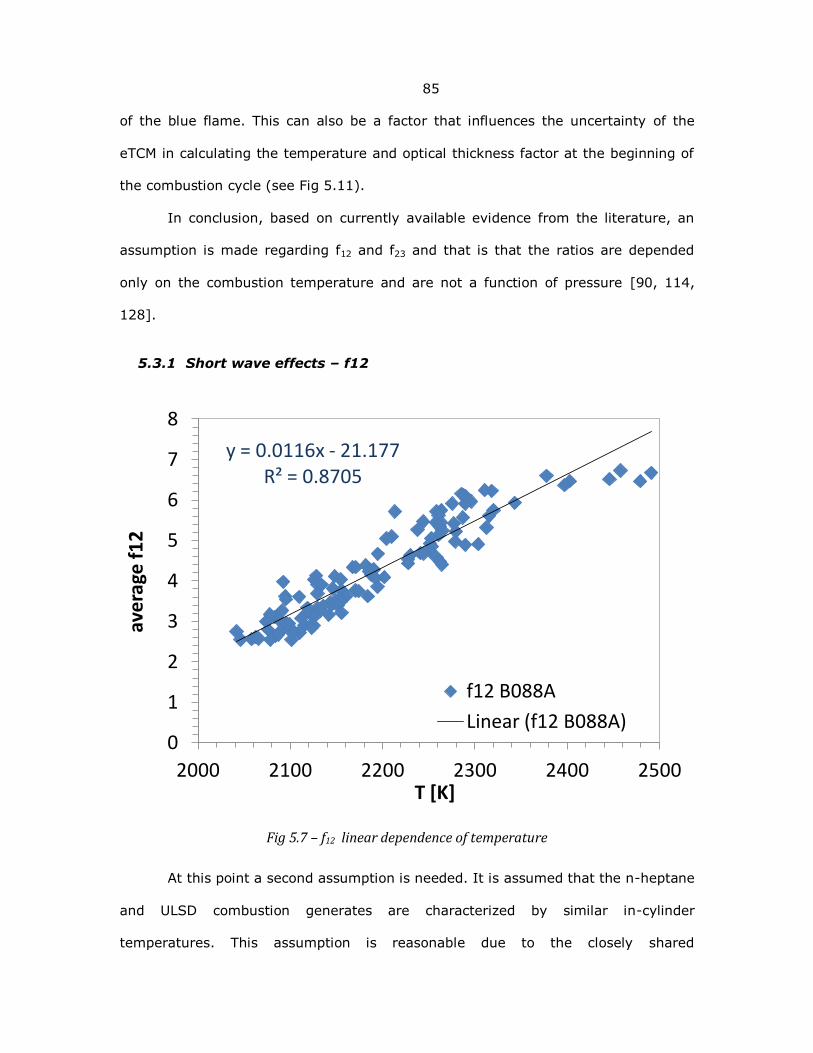
85
of the blue flame. This can also be a factor that influences the uncertainty of the
eTCM in calculating the temperature and optical thickness factor at the beginning of
the combustion cycle (see Fig 5.11).
In conclusion, based on currently available evidence from the literature, an
assumption is made regarding f12 and f23 and that is that the ratios are depended
only on the combustion temperature and are not a function of pressure [90, 114,
128].
5.3.1 Short wave effects – f12
Fig 5.7 – f12 linear dependence of temperature
At this point a second assumption is needed. It is assumed that the n-heptane
and ULSD combustion generates are characterized by similar in-cylinder
temperatures. This assumption is reasonable due to the closely shared
y = 0.0116x - 21.177 R² = 0.8705
0
1
2
3
4
5
6
7
8
2000 2100 2200 2300 2400 2500
aver
age
f12
T [K]
f12 B088A
Linear (f12 B088A)

86
characteristics of n-heptane and ULSD, such as energy release rate and
stoichiometric adiabatic flame temperature [136]. Additionally, owing to their small
size, the soot particles emitting the blackbody radiation are in thermal equilibrium
with the surrounding mixture, assuming the temperature of the surrounding gas.
With the additional experimental data provided by a fundamental investigation of f12
and f23, the need for this assumption would be alleviated, with potential benefits
related to blue-flame intensity measurement.
A fairly strong correlation may be observed in Fig 5.7 between the quasi-
average in-cylinder temperature determined by eTCM and the associated f12 value.
The correlation appears to be mostly linear, although the linearity assumption is not
completely certain due to the relatively large degree of scattering exhibited by the
data. The linear regression R2 coefficient mirrors the increased data scatter.
The physical reason behind the linear correlation is not fully understood at
this time and additional data is required to fully describe it. A possible explanation
could be associated with the relatively small range of temperatures explored by this
experimental setup, which in turn has a linearizing effect.

87
Fig 5.8 – f12 linear dependence of temperature for two data sets
Further, Fig 5.8 shows the f12 correlation for two data sets; these data sets
are were sampled consecutively with no cleaning of the main optical access occurring
between them. The results indicate that the correlation is replicated very well
between the two tests. The slight vertical shift between the two linear regression
models could be associated with window deposit effects. As is the case with the
traditional implementation of TCM as well, window deposits are responsible for
increased measurement uncertainty which needs to be controlled for reliable
temperature and soot optical thickness estimations.
y = 0.0116x - 21.177 R² = 0.8705
y = 0.0118x - 21.957 R² = 0.8753
2
2.5
3
3.5
4
4.5
5
5.5
6
6.5
7
2000 2100 2200 2300 2400 2500
Ave
rage
f1
2
T [K]
f12 B088A
f12 B088B
Linear (f12 B088A)
Linear (f12 B088B)

88
5.3.2 Long wave effects – f23
Fig 5.9 – f23 linear dependence of temperature
A similar correlation is observed for the intensity ratio between detectors two
and three. A linear correlation is maintained, albeit the regression model exhibiting a
lower slope.
The blue-flame spectral emission models f12 and f23 are now used to
determine the soot temperature and optical thickness under blue-flame interference
conditions. Equations 3.12 along with the empirical f12 and f23 models described
previously, form a system of equations that may be solved for the unknowns T, KL
and blue-flame intensity B1. The solution algorithm is shown in Fig 5.10 below.
y = 6.461217E-03x - 1.013152E+01 R² = 8.016852E-01
0
1
2
3
4
5
6
7
2000 2100 2200 2300 2400 2500
Ave
rage
f2
3
T [K]
f23 B088A
Linear (f23 B088A)

89
Fig 5.10 – Numerical solver – description of the iterative steps

90
5.4 Blue flame interference compensation. eTCM
Fig 5.11 – eTCM results for soot temperature and KL factor
A sample engine cycle is shown for illustration purposes in Fig 5.11. It may be
observed that the measured and calculated V1 signals agree rather well. This is
expected, as it represents one of the solver constraints, as shown in Fig 5.10. At the
onset of combustion the temperature prediction is unreasonably high, well in excess
of the stoichiometric adiabatic flame temperature of the selected fuels. This could
either be attributed to the high detector uncertainty and low signal to noise ratio
associated with the third detector signal, V3. The temperature and optical thickness
results are shown as well. In blue is the temperature calculated with the two-color

91
method while with red is represented the temperature recalculated with the
extended two-color method. The optical thickness KL is computed under the
assumption that the soot cloud occupies the entire combustion chamber. This
assumption is rather an extreme case out of the possible scenarios. The impact of
this assumption will be discussed in a subsequent section.
The eTCM solution is applied up to about 25 CAD in this case. As the blue-
flame interference diminishes below detection limit, the TCM method is applied until
the signal strength from the three detectors decreases below a 0.1V amplitude.
As for both methods for the first crank angle degrees of each cycle unphysical
high temperatures are obtained. This can be explained by the high detector
uncertainty that translates in a low signal to noise ration.
To conclude, it has been shown that the blue flame has a significant effect on
the measurement of T and KL when using the traditional two-color method. A
solution has been proposed to measure the strength radiation of the blue flame by
employing the extended two-color method.
5.5 Extended Two-Color Method (eTCM) assumptions
Two major assumptions are part of the proposed extended two-color method.
First, one assumes that the blue flame interference is significant and can no longer
be ignored without incurring significant temperature and KL estimation errors. This
statement was already discussed in the previous section but will be demonstrated in
the section 5.6 below.
Second, the area of interest is no longer assumed to cover an infinitely small
area of the soot cloud. Rather, as described in section 5.6.2, the detector is allowed
to collect light from the entire visible range of the combustion chamber. This

92
approach replaces the typical time-averaging associated with the classical TCM with
space averaging. Thus, the temporal uncertainty regarding the position of the soot
cloud is now replaced with the spatial uncertainty associated with the heterogeneous
coverage of the combustion chamber by the soot cloud. Without proof, the two
methods are expected to have uncertainties in the same order of magnitude. From
this point of view, the eTCM and TCM are inter-exchangeable without loss of
accuracy. However, as the measurement area is increased to the whole combustion
area visible using optical techniques, the position and area occupied by the soot
cloud are unknown at the time of the measurement. In order to get around this
issue, eTCM assumes that the soot cloud is uniformly distributed across the entire
view area. The impact of this assumption will be discussed in further detail in section
5.6.2.
5.6 Uncertainty factors
5.6.1 Temperature and optical thickness KL effects
As previously prefaced in figure Fig 5.11, the eTCM results differ from the
TCM results during the blue flame interference phase. This is better viewed in an
eTCM
versus TCM correlation plot. Fig 5.12 shows such a temperature correlation
for five consecutive cycles. While there is some cyclic variability that may be
observed in the data, all cycles exhibit similar trends. First, a high degree of
correlation is observed for lower temperatures. Those temperatures occur later in the
cycle, during the expansion stroke, where the blue-flame radiation drops below the
detection limit. Higher temperatures, occurring earlier in the cycle have a significant
deviation from the diagonal line which indicates equality between the TCM and eTCM

93
derived temperatures. As a result of the blue-flame interference, as mentioned in
section 5.4, the TCM results tend to overestimate the soot temperature. The error
can be significant in this range, showing 10% higher temperatures compared to the
eTCM estimation.
Similarly, the optical thickness KL results for eTCM and TCM are the same for
the crank angle range where there is no blue-flame interference, while the blue-
flame introduces significant errors in the KL prediction. This may be observed in Fig
5.13, where, unlike the temperature results which were overestimated by TCM, both
over and underestimation are encountered. The error bound for the KL estimation is
as high as 30% of the measured signal. This behavior is in agreement with previous
error analyses of TCM [76] where various uncertainty factors have an exaggerated
effect on KL and a relatively small impact on temperature.

94
Fig 5.12 – Temperature results comparison for TCM and eTCM
1800
1900
2000
2100
2200
1800 1900 2000 2100 2200
eTC
M T
em
pe
ratu
re (
K)
TCM Temperature (K)
cyc 21 cyc 22 cyc 23 cyc 24 cyc 20

95
Fig 5.13 – Optical thickness factor KL results comparison for TCM and eTCM
0
0.01
0.02
0.03
0.04
0 0.01 0.02 0.03 0.04
eTC
M K
L (-
)
TCM KL (-)
cyc 21
cyc 22
cyc 23
cyc 24
cyc 20

96
5.6.2 Soot cloud area effects
Unlike the conventional two-color method, where a small area of the
combustion chamber is sampled by the detector, eTCM proposes the use of the
optical information collected from the entire field of view available. The main benefit
of this approach is that single-cycle measurements are possible with a much higher
degree of accuracy compared to the conventional approach, which requires
significant cycle-averaging. The resulting soot optical thickness factor KL is thus a
representation of the average combustion chamber soot concentration. This
assumption is referred to as the “standard eTCM assumption”. The assumption
regarding the soot cloud sampled area is expected to have a small impact on the
soot temperature estimation. The following paragraphs will describe the impact of
various area assumptions on the temperature and KL estimations.
First, a cycle’s worth of data has been processed under different assumptions
regarding the soot cloud area. As discussed previously, eTCM assumes that the soot
cloud covers the entire combustion chamber. This 100% area coverage will be
considered to be the reference solution. Fig 5.14 shows the temperature difference
between the 100% area coverage reference case and a range of area coverage
assumptions. As a result temperature differences as high as 4K may be observed if
the area assumption is off by an order of magnitude. When viewed in Fig 5.15, this
temperature difference occurs at about 1900K, resulting in a 0.2% error. The
contribution of this error to the measurement uncertainty is thus relatively small
compared to other sources of uncertainty. Consecutive cycles, shown in Fig 5.16,
have a similar behavior for the 10% to 100% coverage area temperature difference.

97
Fig 5.14 – The difference in temperature for various soot cloud areas with respect to 100% area function of CAD
Fig 5.15 – The difference in temperature for various soot clouds area function of combustion temperatures

98
Fig 5.16 – The difference in temperature for a 10% soot cloud area for various cycles
Fig 5.17 – Optical thickness factor KL evaluation for different soot cloud areas
0.0
1.0
2.0
3.0
4.0
5.0
6.0
1600 1800 2000 2200 2400 2600
tem
per
atu
re d
iffe
ren
ce (
K)
flame temperature 100% area (T)
cycle 33
cycle 34
cycle 35
0.00
0.01
0.02
0.03
0 10 20 30 40 50 60
KL
(-)
CAD
10%
20%
40%
60%
80%

99
The impact of the cloud area assumption is shown in Fig 5.17. Large “errors”
are apparent, as KL halves as the cloud area increases from 10 to 20%. However, it
will be argued that this is not a real “error”. Due to the large light sampling area, the
optical thickness factor is now area dependent and thus its value will change as a
function of the assumed area convention. As the assumed soot cloud area increases,
the equivalent cloud would need to be “optically thinner” in order to match the
spectral intensity characteristics experimentally measured.
5.6.3 Comparison with high-speed soot cloud area measurement
Given the increased flexibility allowed by the experimental setup available for
this work, the results of the eTCM method may be compared under two sets of
assumptions. The first includes the use of the standard eTCM assumption, where the
entire field of view available is considered as being covered by a homogenous soot
cloud of equivalent optical properties as the one available experimentally. The
second set of assumptions follow the work of Musculus [101], where the area
covered by the soot cloud is estimated using the available high-speed camera data.
An error estimate is thus available to further quantify the impact of the standard
eTCM assumption. As one may recall, the standard eTCM assumption is needed in
combustion systems where a full optical access or high-speed imaging of combustion
is not practical.
An additional verification of the validity of the eTCM results is available by
comparing the blue flame data provided by eTCM with the blue-flame data sampled
by the high-speed camera. The range of data points available for this type of work is
expected to be restricted to combustion events with relatively small amounts of soot
and relatively strong CO flame radiation intensity.

100
Fig 5.18 – Temperature difference for the actual soot cloud area, 10% and 40% soot cloud area assumptions function of combustion temperature
The impact of the constant area assumption is shown in Fig 5.18 above. The
temperature difference between the estimation based on the standard eTCM
assumption (100% of the combustion chamber is occupied by soot) and the
temperature estimation based on the “actual” soot cloud area measured by the high-
speed camera. The result shows that the maximum uncertainty introduced by this
assumption is about 10K, or 0.5%.
0.0
1.0
2.0
3.0
4.0
5.0
6.0
7.0
8.0
9.0
10.0
1600 1800 2000 2200 2400 2600
Tem
per
atu
re D
iffe
ren
ce (
K)
Temperature 100% flame area (T)
10% 40% actual

101
5.7 Blue-flame results
Besides the improved temperature and KL estimations which relate to soot
properties, eTCM provides the added benefit of quantifying the amount of blue-flame
radiation. The amount of radiation emitted by CO2* is proportional to the rate of
energy release from the premixed phase of the combusting fluid. This in turn
provides a useful measure of the degree of combustion homogeneity, which could
provide significant benefits in both combustion research as well as development
efforts, such as engine calibration.
5.7.1 Comparison with high-speed blue-flame intensity measurements
As in the case of the soot cloud area, the high-speed information may be used
to provide added validation of the eTCM assumptions and hypotheses. The high-
speed camera, equipped with a Bayer-type filter, allows for the spatial separation of
the radiation originating from blue-flame and soot radiation. A Matlab® based script
was used to identify the pixels likely occupied by blue flame and performed a signal
integration. Some of the blue flame radiation will not be fully accounted for, as it
originates from regions of the combustion chamber where soot is available along the
line of sight. However, for the combustion mode investigated, the soot cloud area is
rather small, occupying up to 10% (Fig 5.18 previously discussed). As such, the
error introduced by ignoring the amount of blue-flame radiation originating in those
areas will be very small.
At the same time, the results of the high-speed image integration may be
compared with the blue-flame intensity estimation provided by eTCM. Such results
are shown in Fig 5.19 below. Two distinct zones may be observed in this plot. First,
an area of linear correlation between the camera and eTCM results is apparent,
especially for higher blue flame intensities. For the linear correlation zone, the

102
degree of scatter is well within acceptable limits, indicating a good agreement
between the camera and eTCM results.
Fig 5.19 – Blue flame intensity comparison for high-speed camera and eTCM
On the other hand, for low blue-flame intensities (i.e. 3 eTCM blue flame
intensity units), the high-speed camera is no longer sensitive and no data is
available. The optical probe appears to have increased sensitivity compared to the
high-speed CMOS chip. This increased sensitivity could be attributed to the data
acquisition methodology employed for the two blue-flame measurement methods.
While the CMOS chip samples the data through a large number of individual
detectors, eTCM uses a much restricted number of detectors, performing the
integration process within the detector hardware, prior to the digital conversion step,
which significantly improves the signal to noise ratio.
It is noteworthy that the blue-flame detection sensitivity is maintained even
after a significant number of computational steps required by the eTCM approach.
0
5000
10000
15000
20000
25000
30000
0 2 4 6 8 10
Blu
e Fl
ame
Inte
nsi
ty H
S ca
me
ra (
a.u
.)
Blue Flame Intensity ETCM (a.u.)
cyc 21 cyc 22 cyc 23 cyc 24 cyc 25 cyc 26 cyc 27
camera sensitivity
limit

103
5.7.2 Effect of soot cloud area assumption on blue-flame intensity
estimation
eTCM assumes that the soot cloud covers the entire combustion chamber
area. However, as previously discussed in section 5.6.3, this is not the case. The
effect of this assumption has been explored in Fig 5.20 below. Data plotted along the
x axis is associated with the blue-flame prediction considering the actual soot cloud
area, as measured from the high-speed images. At the same time, the difference
between the blue-flame intensity determined using this assumption and the blue-
flame estimation considering 100% soot area coverage is plotted on the y axis. The
data indicates a reasonable impact of the 100% area assumption for high blue flame
intensities. However, for lower blue-flame intensities the error quickly grows and
may exceed 25%. This behavior is likely caused by the decrease in SNR associated
with the lower blue-flame intensities.
Fig 5.20 – Effect of soot cloud coverage assumption
0
5
10
15
20
25
30
0 2 4 6
blu
e f
lam
e d
evia
tio
n (
%)
blue flame (a.u.)

104
Chapter 6. Conclusions and future work
6.1 Conclusions
In modern engines, combustion modes, such as partially-premixed charge
compression ignition (PCCI), are characterized by strong premixed flames
accompanied by relatively small soot-producing diffusion controlled flames.
In such situations, the application of the two-color method to determine flame
temperature and soot optical thickness is strongly influenced by the contribution of
the CO flame radiation. This is shown in high-speed photography collected by the
author as well as numerous other publications from other research groups. As a
result the two-color method assumptions break down and temperature and KL data
is no longer available.
The current work presents the theoretical background and experimental
evidence needed to describe a newly proposed optical diagnostic tool, the extended
two-color method (eTCM) as well as the development and construction of an
original optical probe designed to provide the required experimental data.
The optical combustion probe is capable of providing information regarding
the soot formation and oxidation processes calculated from the measured signal.
Three detectors are used to collect information from the 450 nm, 532 nm and 640
nm wavelenghts.
An experimental setup has been built and tested in a fully accessible optical
engine. This approach allowed the synchronous use of other optical diagnostic tools
such as high-speed imaging, which are not typically available in an all-metal engine,
alongside the eTCM input and output data. The engine testing conditions were
selected such as to provide a representative sample of optical signals where mixed
conditions, with and without blue-flame interference, are present.
105
The second part of the dissertation concentrates on eTCM as it attempts to
extend the domain of applicability of the two color method within the area of strong
CO continuum interference.
• First, it provides a means of testing the validity of the conventional
two-color method, which can be adversely impacted by the blue-flame interference.
• The second goal is to extract additional information regarding the
strength of the radiation associated with the CO flame continuum.
Based on empirical observations of the CO continuum behavior and its
relationship with the flame temperature as measured by the two-color method, a
reconstruction of the source of interference (CO flame radiation continuum) is
proposed. The CO flame continuum empirical model required by eTCM has been
developed based on the available experimental data.
The evidence presented in this work suggests that eTCM is capable of
temperature and soot optical thickness factor correction under medium and strong
blue-flame interference without significant impact on the temperature estimation
uncertainty.
The classical implementation of the two-color method (TCM) has arguably
become the most successful application of optical diagnostics towards the
fundamental understanding of the combustion process in practical combustion
systems. The small space required for the fiber optic that is used to collect
information from the engine’s cylinder it is a clear advantage. The optical probe
could be further miniaturized and used with the proposed extended two-color
method (eTCM) as a tool for engine development and calibration.

106
6.2 Future work
Perhaps the most important direction for future work stemming from the
current research is the fundamental investigation and further development of the
CO-flame continuum radiation intensity model. The current model relies on empirical
data from a relatively small dataset.
The optical engine used in this work is arguably not the best platform to
perform such work, which is the main reason why no such attempt has been made at
this time. However, other reactors, such as a constant volume optically accessible
reactor or a rapid compression machine could provide such data without the
confounding effects typically associated with a moving piston. As the pressure effects
are not expected to be significant, experimental setups using stationary atmospheric
pressure flames could also provide valuable data. Early work by Gaydon and others
described briefly the spectral intensity behavior of CO flames, but additional work is
required to build a model with accurate predictive capabilities.
Should a reliable CO-flame continuum model become available through such
fundamental work, the author envisions the use of such a model for the direct
determination of in-cylinder temperatures in absence of soot clouds. The benefits of
such a technique are obvious, as it would provide a low-effort means to probe the
temperature of low-soot formation combustion modes similar to the HCCI strategy.
Last, but not least, is the application of the currently proposed method
(eTCM) to various combustion system with particular emphasis on combustion modes
characterized by significant amount of blue-flame radiation, such as PCCI, MK, HCCI,
RCCI and others.

107
REFERENCES
[1] Environmental Protection Agency, U.S. "Overview of Greenhouse Gases".
Available from:
http://www.epa.gov/climatechange/ghgemissions/gases.html
[2] Environmental Protection Agency, U.S. "Climate Change Science". Available
from: http://www.epa.gov/climatechange/science/index.html
[3] Burke, P.J. and Nishitateno, S., "Gasoline prices, gasoline consumption, and
new-vehicle fuel economy: Evidence for a large sample of countries". Energy
Economics, 2013. 36(0): p. 363-370
[4] Chèze, B., Gastineau, P. and Chevallier, J., "Forecasting world and regional
aviation jet fuel demands to the mid-term (2025)". Energy Policy, 2011. 39(9):
p. 5147-5158
[5] Cohn, S.M., "Fuel choice and aggregate energy demand in the residential and
commercial sectors". Energy, 1980. 5(12): p. 1203-1212
[6] Rauch, P. and Gronalt, M., "The effects of rising energy costs and transportation
mode mix on forest fuel procurement costs". Biomass and Bioenergy, 2011.
35(1): p. 690-699
[7] Wadud, Z., Graham, D.J. and Noland, R.B., "Modelling fuel demand for different
socio-economic groups". Applied Energy, 2009. 86(12): p. 2740-2749
[8] Environmental Protection Agency, U.S. "Climate change is happening".
Available from: http://www.epa.gov/climatechange/basics/

108
[9] Haines, A., McMichael, A.J., Smith, K.R., Roberts, I., Woodcock, J., Markandya,
A., Armstrong, B.G., Campbell-Lendrum, D., Dangour, A.D., Davies, M., Bruce,
N., Tonne, C., Barrett, M. and Wilkinson, P., "Public health benefits of strategies
to reduce greenhouse-gas emissions: overview and implications for policy
makers". The Lancet, 2009. 374(9707): p. 2104-2114
[10] Environmental Protection Agency, U.S. (2004) "Clean Diesel Combustion –
Clean, Efficient, and Cost Effective Technology echnology".
[11] Burtscher, H., "Physical characterization of particulate emissions from diesel
engines: a review". Journal of Aerosol Science, 2005. 36(7): p. 896-932
[12] Clerc, J.C., "Catalytic diesel exhaust aftertreatment". Applied Catalysis B:
Environmental, 1996. 10(1–3): p. 99-115
[13] Güthenke, A., Chatterjee, D., Weibel, M., Krutzsch, B., Kočí, P., Marek, M., Nova,
I. and Tronconi, E., "Current status of modeling lean exhaust gas
aftertreatment catalysts", in Advances in Chemical Engineering, B.M. Guy,
Editor. 2007, Academic Press. p. 103-283.
[14] Kittelson, D.B., Watts, W.F., Johnson, J.P., Rowntree, C., Payne, M., Goodier, S.,
Warrens, C., Preston, H., Zink, U., Ortiz, M., Goersmann, C., Twigg, M.V.,
Walker, A.P. and Caldow, R., "On-road evaluation of two Diesel exhaust
aftertreatment devices". Journal of Aerosol Science, 2006. 37(9): p. 1140-
1151
[15] Koltsakis, G.C. and Stamatelos, A.M., "Catalytic automotive exhaust
aftertreatment". Progress in Energy and Combustion Science, 1997. 23(1): p.
1-39
109
[16] Kreuzer, T., Lox, E.S., Lindner, D. and Leyrer, J., "Advanced exhaust gas
aftertreatment systems for gasoline and diesel fuelled vehicles". Catalysis
Today, 1996. 29(1–4): p. 17-27
[17] Miao, Y., Chen, L.-D., He, Y. and Kuo, T.-w., "Study of SCR cold-start by energy
method". Chemical Engineering Journal, 2009. 155(1–2): p. 260-265
[18] Rodríguez-Fernández, J., Tsolakis, A., Cracknell, R.F. and Clark, R.H.,
"Combining GTL fuel, reformed EGR and HC-SCR aftertreatment system to
reduce diesel NOx emissions. A statistical approach". International Journal of
Hydrogen Energy, 2009. 34(6): p. 2789-2799
[19] Schejbal, M., Štěpánek, J., Kočí, P., Marek, M. and Kubíček, M., "Sequence of
monolithic converters DOC–CDPF–NSRC for lean exhaust gas detoxification: A
simulation study". Chemical Engineering and Processing: Process
Intensification, 2010. 49(9): p. 943-952
[20] Environmental Protection Agency, U.S. "Fuel Economy - Regulations and
Standards". Available from:
http://www.epa.gov/fueleconomy/regulations.htm
[21] Akagawa, H., Miyamoto, T., Harada, A., Sasaki, S., Shimazaki, N., Hashizume, T.
and Tsujimura, K. "Approaches to Solve Problems of the Premixed Lean Diesel
Combustion".
[22] Cracknell, R.F., Head, R.A., McAllister, L.J. and Andrae, J.C.G. "Octane Sensitivity
in Gasoline Fuels Containing Nitro-Alkanes: A Possible Means of Controlling
Combustion Phasing for HCCI".
110
[23] Kokjohn, S.L. and Reitz, R.D., "Investigation of charge preparation strategies
for controlled premixed charge compression ignition combustion using a
variable pressure injection system". International Journal of Engine Research,
2010. 11(Compendex): p. 257-282
[24] Kook, S., Bae, C., Miles, P.C., Choi, D. and Pickett, L.M. "The Influence of Charge
Dilution and Injection Timing on Low-Temperature Diesel Combustion and
Emissions".
[25] Ladommatos, N., Abdelhalim, S.M., Zhao, H. and Hu, Z. "The Dilution, Chemical,
and Thermal Effects of Exhaust Gas Recirculation on Diesel Engine Emissions -
Part 1: Effect of Reducing Inlet Charge Oxygen".
[26] Lee, T. and Reitz, R.D., "The effect of intake boost pressure on MK (Modulated
Kinetics) combustion". JSME International Journal, Series B: Fluids and
Thermal Engineering, 2003. 46(Compendex): p. 451-459
[27] Musculus, M.P.B. "Multiple Simultaneous Optical Diagnostic Imaging of Early-
Injection Low-Temperature Combustion in a Heavy-Duty Diesel Engine".
[28] Plee, S.L., Ahmad, T. and Myers, J.P. "Flame Temperature Correlation for the
Effects of Exhaust Gas Recirculation on Diesel Particulate and NOx Emissions".
[29] Ryan, T.W., Callahan, T.J. and Mehta, D. "HCCI in a Variable Compression Ratio
Engine-Effects of Engine Variables".
[30] Sjoberg, M. and Dec, J.E., "Ethanol Autoignition Characteristics and HCCI
Performance for Wide Ranges of Engine Speed, Load and Boost". SAE Int. J.
Engines, 2010. 3(1): p. 84-106
111
[31] Splitter, D., Hanson, R., Kokjohn, S. and Reitz, R. "Reactivity Controlled
Compression Ignition (RCCI) Heavy-Duty Engine Operation at Mid-and High-
Loads with Conventional and Alternative Fuels". SAE 2011-01-0363
[32] Walter, B. and Gatellier, B. "Development of the High Power NADI™ Concept
Using Dual Mode Diesel Combustion to Achieve Zero NOx and Particulate
Emissions".
[33] Abu-Jrai, A., Rodríguez-Fernández, J., Tsolakis, A., Megaritis, A., Theinnoi, K.,
Cracknell, R.F. and Clark, R.H., "Performance, combustion and emissions of a
diesel engine operated with reformed EGR. Comparison of diesel and GTL
fuelling". Fuel, 2009. 88(6): p. 1031-1041
[34] Fang, Q., Fang, J., Zhuang, J. and Huang, Z., "Influences of pilot injection and
exhaust gas recirculation (EGR) on combustion and emissions in a HCCI-DI
combustion engine". Applied Thermal Engineering, 2012. 48(0): p. 97-104
[35] Hountalas, D.T., Mavropoulos, G.C. and Binder, K.B., "Effect of exhaust gas
recirculation (EGR) temperature for various EGR rates on heavy duty DI diesel
engine performance and emissions". Energy, 2008. 33(2): p. 272-283
[36] Hussain, J., Palaniradja, K., Alagumurthi, N. and Manimaran, R., "Effect of
Exhaust Gas Recirculation (EGR) on Performance and Emission characteristics
of a Three Cylinder Direct Injection Compression Ignition Engine". Alexandria
Engineering Journal, 2012. 51(4): p. 241-247
[37] Ishida, M., Yamamoto, S., Ueki, H. and Sakaguchi, D., "Remarkable
improvement of NOx–PM trade-off in a diesel engine by means of bioethanol
and EGR". Energy, 2010. 35(12): p. 4572-4581
112
[38] Maiboom, A., Tauzia, X. and Hétet, J.-F., "Experimental study of various effects
of exhaust gas recirculation (EGR) on combustion and emissions of an
automotive direct injection diesel engine". Energy, 2008. 33(1): p. 22-34
[39] Peng, H., Cui, Y., Shi, L. and Deng, K., "Effects of exhaust gas recirculation (EGR)
on combustion and emissions during cold start of direct injection (DI) diesel
engine". Energy, 2008. 33(3): p. 471-479
[40] Saravanan, N. and Nagarajan, G., "An experimental investigation on
performance and emissions study with port injection using diesel as an ignition
source for different EGR flow rates". International Journal of Hydrogen
Energy, 2008. 33(16): p. 4456-4462
[41] Shi, L., Cui, Y., Deng, K., Peng, H. and Chen, Y., "Study of low emission
homogeneous charge compression ignition (HCCI) engine using combined
internal and external exhaust gas recirculation (EGR)". Energy, 2006. 31(14):
p. 2665-2676
[42] Tsolakis, A., Megaritis, A., Wyszynski, M.L. and Theinnoi, K., "Engine
performance and emissions of a diesel engine operating on diesel-RME
(rapeseed methyl ester) blends with EGR (exhaust gas recirculation)". Energy,
2007. 32(11): p. 2072-2080
[43] Ying, W. and Longbao, Z., "Experimental study on exhaust emissions from a
multi-cylinder DME engine operating with EGR and oxidation catalyst".
Applied Thermal Engineering, 2008. 28(13): p. 1589-1595

113
[44] Zamboni, G. and Capobianco, M., "Experimental study on the effects of HP and
LP EGR in an automotive turbocharged diesel engine". Applied Energy, 2012.
94(0): p. 117-128
[45] Zhang, W., Chen, Z., Li, W., Shu, G., Xu, B. and Shen, Y., "Influence of EGR and
oxygen-enriched air on diesel engine NO–Smoke emission and combustion
characteristic". Applied Energy, 2013. 107(0): p. 304-314
[46] Arcoumanis, C., Bae, C., Nagwaney, A. and Whitelaw, J.H. "Effect of EGR on
Combustion Development in a 1.9L DI Diesel Optical Engine".
[47] Environmental Protection Agency, U.S. "Emission Standards Reference Guide".
Available from: http://www.epa.gov/otaq/standards/heavy-duty/hdci-
exhaust.htm
[48] Beasley, M., Cornwell, R., Fussey, P., King, R., Noble, A., Salamon, T., Truscott,
A. and Landsmann, G. "Reducing Diesel Emissions Dispersion by Coordinated
Combustion Feedback Control".
[49] Colban, W.F., Kim, D., Miles, P.C., Oh, S., Opat, R., Krieger, R., Foster, D.,
Durrett, R.P., Manuel, A. and Gonzalez, D., "A Detailed Comparison of Emissions
and Combustion Performance Between Optical and Metal Single-Cylinder Diesel
Engines at Low Temperature Combustion Conditions". SAE Int. J. Fuels Lubr.,
2008. 1(1): p. 505-519
[50] Shiozaki, T., Nakajima, H., Kudo, Y., Miyashita, A. and Aoyagi, Y. "The Analysis
of Combustion Flame Under EGR Conditions in a DI Diesel Engine".
[51] Clowater, L., Hamady, F. and Schock, H. "Fiber Optic Imaging System for
Remote Location Flow Visualization Studies".

114
[52] Hall, M.J., Zuzek, P. and Anderson, R.W. "Fiber Optic Sensor for Crank Angle
Resolved Measurements of Burned Gas Residual Fraction in the Cylinder of an
SI Engine".
[53] He, G., Patania, A., Kluzner, M., Vokovich, D., Astrakhan, V., Wall, T. and
Wlodarczyk, M. "Low-Cost Spark Plug-Integrated Fiber Optic Sensor for
Combustion Pressure Monitoring".
[54] Jie, M.-S., Lee, S.-H. and Lee, K.-H. "Flame Propagation Measurement By the
Fiber Optic Spark Plug and Ionization Probe".
[55] Kawa, T., Ishikawa, T., Yanagihara, S., Koyama, T. and Tsuchiya, K.
"Characteristic of Fiber-Optic Pressure Sensor for Measuring Cylinder
Pressure".
[56] Kawahara, N., Tomita, E., Ichimiya, M., Takasu, K., Tsuchida, N. and Goto, K.
"Transient Temperature Measurement of Unburned Gas in an Engine Cylinder
Using Laser Interferometry with a Fiber-Optic Sensor".
[57] Kawahara, N., Tomita, E. and Kamakura, H. "Transient Temperature
Measurement of Gas Using Fiber Optic Heterodyne Interferometry".
[58] Kawahara, N., Tomita, E., Ohnishi, K. and Goto, K. "In-situ Unburned Gas
Temperature Measurement in a Spark Ignition Engine Using Laser
Interferometry".
[59] Lan, C., Caswell, A.W., Kranendonk, L.A., Sanders, S.T., Urata, Y. and Okura, Y.
"19-Color H2O Absorption Spectrometer Applied for Real-Time In-Cylinder Gas
Thermometry in an HCCI Engine".

115
[60] Lee, C., Kawahara, N., Tomita, E. and Inoshita, K. "Gas Temperature
Measurement in a DME-HCCI Engine using Heterodyne Interferometry with
Spark-Plug-in Fiber-Optic Sensor".
[61] Miguel, J. and Higuera, L., "Handbook of optical fiber sensing technology".
2002, West Sussex PO 19 IUD, England: John Wiley & Sons Ltd
ISBN:
[62] Murray, R.T., Cox, E.R., Smith, D.E. and Wright, P.G. "Fibre Optic Sensors for
Automobiles".
[63] Nwagboso, C. "Condition Monitoring of CNG Engine Using Optic Fiber Sensory
Systems".
[64] Pendlebury, M.A. and Nwagboso, C. "Fiber Optic Sensors for Engine
Combustion Intensity Detection-A Review".
[65] Poorman, T.J., Xia, L. and Wlodarczyk, M.T. "Ignition System-Embedded Fiber-
Optic Combustion Pressure Sensor for Engine Control and Monitoring".
[66] Roth, K.J., Sobiesiak, A., Robertson, L. and Yates, S. "In-Cylinder Pressure
Measurements with Optical Fiber and Piezoelectric Pressure Transducers".
[67] Witze, P.O., Hall, M.J. and Wallace, J.S. "Fiber-Optic Instrumented Spark Plug
for Measuring Early Flame Development in Spark Ignition Engines".
[68] Ulrich, O., Wlodarczyk, R. and Wlodarczyk, M.T. "High-Accuracy Low-Cost
Cylinder Pressure Sensor for Advanced Engine Controls".
[69] Wlodarczyk, M.T. "High Accuracy Glow Plug-Integrated Cylinder Pressure
Sensor for Closed Loop Engine Control". Paper

116
[70] Wlodarczyk, M.T., Poorman, T., Xia, L., Arnold, J. and Coleman, T., "In-Cylinder
Fiber-Optic Pressure Sensors for Monitoring and Control of Diesel Engines".
1998
[71] Heywood, J.B., "Internal combustion engine fundamentals". 1988. ISBN:
[72] US, D.o.E., "Annual Energy Outlook". 2006.
[73] U.S. Energy Information Administration. "U.S. Primary energy consumption by
source and sector". 2011; Available from:
http://www.eia.gov/energyexplained/
[74] Singh, G. "Overview of the DOE Advanced Combustion Engine R&D". 2011;
Available from:
http://www1.eere.energy.gov/vehiclesandfuels/pdfs/merit_review_2011/a
dv_combustion/ace00a_singh_2011_o.pdf
[75] Aronsson, U., Chartier, C., Horn, U., Andersson, Ö., Johansson, B. and Egnell, R.
"Heat Release Comparison Between Optical and All-Metal HSDI Diesel Engines".
[76] Zhao, H.L., Nicos, "Engine combustion instrumentation and diagnostics". 2001.
ISBN: ISBN: 0-7680-0665-1
[77] Steeper, R.R. and Stevens, E.J. "Characterization of Combustion, Piston
Temperatures, Fuel Sprays, and Fuel-Air Mixing in a DISI Optical Engine".
[78] De Zilwa, S. and Steeper, R. "Acquisition of Corresponding Fuel Distribution
and Emissions Measurements in HCCI Engines".
[79] Higuma, A., Suzuki, T., Yoshida, M., Oguri, Y. and Minoyama, T. "Improvement
of Error in Piezoelectric Pressure Transducer".

117
[80] Rai, H.S., Brunt, M.F.J. and Loader, C.P. "Quantification and Reduction of IMEP
Errors Resulting from Pressure Transducer Thermal Shock in an S.I. Engine".
[81] Lee, S., Bae, C., Prucka, R., Fernandes, G., Filipi, Z.S. and Assanis, D.N.
"Quantification of Thermal Shock in a Piezoelectric Pressure Transducer".
[82] Patterson, G.J. and Davis, R.S., "Geometric and Topological Considerations to
Maximize Remotely Mounted Cylinder Pressure Transducer Data Quality". SAE
Int. J. Engines, 2009. 2(1): p. 414-420
[83] Gringer. "Optical fibre". 2008; Available from:
http://en.wikipedia.org/wiki/File:Optical-fibre.svg
[84] Yan, J. and Borman, G.L., "Analysis and In-Cylinder Measurement of Particulate
Radiant Emissions and Temperature in a Direct Injection Diesel Engine", in
Reprint: Analysis and In-Cylinder Measurement of Particulate Radiant
Emissions and Temperature in a Direct Injection Diesel Engine,. 1988: United
States. p. 25p.
[85] Hottel, H.C. and Broughton, F.P., "Determination of true temperature and total
radiation from luminous gas flames". Industrial and Engineering Chemistry --
Analytical Edition, 1932. 4(2): p. 166-175
[86] Shakal, J.S. and Martin, J.K. "Imaging and Spatially Resolved Two-Color
Temperature Measurements Through a Coherent Fiberoptic: Observation of
Auxiliary Fuel Injection Effects on Combustion in a Two-Stroke DI Diesel".
[87] Li, X. and Wallace, J.S. "In-Cylinder Measurement of Temperature and Soot
Concentration Using the Two-Color Method".

118
[88] Struwe, F.J. and Foster, D.E., "In-Cylinder Measurement of Particulate Radiant
Heat Transfer in a Direct Injection Diesel Engine". SAE 2003-01-0072, 2003
[89] AVL. "Visiolution - Optical Combustion Analysis Systems". 2009; Available
from: https://www.avl.com/visiolution-optical-combustion-analysis-
systems
[90] Gaydon, A.G., "The spectroscopy of flames". 1974, London; New York:
Chapman and Hall; Halsted Press Division, Wiley. ISBN: 0470294337
9780470294338
[91] Zizak, G., "Flame Emission Spectroscopy: Fundamentals and Applications".
2000.
[92] Peters, N., "Combustion Theory". 2010, CEFRC Summer School Princeton.
[93] Uyehara, O.A., Myers, P.S., Watson, K.M. and Wilson, L.A., "Flame-temperature
measurement in internal-combustion engines". American Society of
Mechanical Engineers -- Transactions, 1946. 68(1): p. 17-28
[94] Zhao, H. and Ladommatos, N., "Optical diagnostics for soot and temperature
measurement in diesel engines". Progress in Energy and Combustion Science,
1998. 24(3): p. 221-255
[95] Matsui, Y., Kamimoto, T. and Matsuoka, S. "A Study on the Time and Space
Resolved Measurement of Flame Temperature and Soot Concentration in a D. I.
Diesel Engine by the Two-Color Method".
[96] Matsui, Y., Kamimoto, T. and Matsuoka, S. "A Study on the Application of the
Two–Color Method to the Measurement of Flame Temperature and Soot
Concentration in Diesel Engines".

119
[97] Yu, X., Zha, K., Florea, R. and Jansons, M., "Comparison of In-Cylinder Soot
Evolution in an Optically Accessible Engine Fueled with JP-8 and ULSD". SAE
Int. J. Fuels Lubr., 2012. 5(2): p. 875-891
[98] Zha, K., Florea, R.-C. and Jansons, M. "Comparison of soot evolution using high-
speed CMOS color camera and two-color thermometry in an optical diesel
engine fueled with B20 biodiesel blend and ultra-low sulfur diesel". in ASME
2011 Internal Combustion Engine Division Fall Technical Conference, ICEF
2011, October 2, 2011 - October 5, 2011. 2011. Morgantown, WV, United
states: American Society of Mechanical Engineers
[99] Zha, K., Yu, X., Florea, R. and Jansons, M. "Impact of Biodiesel Blends on In-
cylinder Soot Temperature and Concentrations in a Small-Bore Optical Diesel
Engine".
[100] Hampson, G.J. and Reitz, R.D. "Two-Color Imaging of In-Cylinder Soot
Concentration and Temperature in a Heavy-Duty DI Diesel Engine with
Comparison to Multidimensional Modeling for Single and Split Injections".
[101] Musculus, M.P.B. "Measurements of the Influence of Soot Radiation on In-
Cylinder Temperatures and Exhaust NOx in a Heavy-Duty DI Diesel Engine".
[102] Bertoli, C., Beatrice, C., di Stasio, S. and Del Giacomo, N. "In-Cylinder Soot and
NOx Concentration Measurements in D.I. Diesel Engine Fed by Fuels of Varying
Quality".
[103] Bakenhus, M. and Reitz, R.D. "Two-Color Combustion Visualization of Single
and Split Injections in a Single-Cylinder Heavy-Duty D.I. Diesel Engine Using an
Endoscope-Based Imaging System".

120
[104] Kobayashi, S., Sakai, T., Nakahira, T., Komori, M. and Tsujimura, K.
"Measurement of Flame Temperature Distribution in D.I. Diesel Engine with
High Pressure Fuel Injection".
[105] Miyamoto, N., Ogawa, H., Arima, T. and Miyakawa, K. "Improvement of Diesel
Combustion and Emissions with Addition of Various Oxygenated Agents to
Diesel Fuels".
[106] Winterbone, D.E., Yates, D.A., Clough, E., Rao, K.K., Gomes, P. and Sun, J.H.,
"Combustion in high-speed direct injection diesel engines - A comprehensive
study". Proceedings of the Institution of Mechanical Engineers, Part C: Journal
of Mechanical Engineering Science, 1994. 208(4): p. 223-239
[107] Clark, G.L. and Thee, W.C., "Ultra-Violet Spectroscopy of Flames of Motor
Fuels". INDUSTRIAL AND ENGINEERING CHEMISTRY, 1926. 18(5): p.
528~531
[108] Pipenberg, K.J. and Pahnke, A.J., "Spectrometric Investigations of n-Heptane
Preflame Reactions in a Motored Engine". Industrial & Engineering Chemistry,
1957. 49(12): p. 2067-2072
[109] Ohta, Y. and Furutani, M., "Identification of cool and blue flames in
compression ignition". Archivum Combustiones, 1991. 11(1~2): p. 43-52
[110] Lawn, C.J., "Distributions of instantaneous heat release by the cross-correlation
of chemiluminescent emissions". Combustion and Flame, 2000. 123(1–2): p.
227-240

121
[111] Griffiths, J.F. and Whitaker, B.J., "Thermokinetic interactions leading to knock
during homogeneous charge compression ignition". Combustion and Flame,
2002. 131(4): p. 386-399
[112] Yao, M.-f., Zheng, Z.-l. and Liang, X. "Numerical Study on the Chemical Reaction
Kinetics of DME/Methanol for HCCI Combustion Process".
[113] Arcoumanis, C., Bae, C., Crookes, R. and Kinoshita, E., "The potential of di-
methyl ether (DME) as an alternative fuel for compression-ignition engines: A
review". Fuel, 2008. 87(7): p. 1014-1030
[114] Kopp, M., Brower, M., Mathieu, O., Petersen, E. and Güthe, F., "CO*2
chemiluminescence study at low and elevated pressures". Applied Physics B,
2012
[115] Hottel, H.C., "Heat Transmission 3rd ed", ed. McGraw-Hill. 1954. ISBN:
[116] Siegel, R. and Howell, J.R., "Thermal Radiation Heat Transfer 3rd edition".
1992. ISBN: 0-89116-271-2
[117] Siddall, R.G. and McGrath, I.A., "The emissivity of luminous flames". Symposium
(International) on Combustion, 1963. 9(1): p. 102-110
[118] Wahiduzzaman, S., Morel, T., Timar, J. and DeWitt, D.P. "Experimental and
Analytical Study of Heat Radiation in a Diesel Engine".
[119] Matsui, Y., Kamimoto, K. and Matsuoka, S. "A Study on the Time and Space
Resolved Measurement of Flame Temperature and Soot Concentration in a
Diesel Engine by the Two-Colour Method". 790491

122
[120] Matsui, Y., Kamimoto, K. and Matsuoka, S. "A Study on the Application of the
Two-Colour Method to the Measurement of Flame Temperature and Soot
Concentration in Diesel Engines". 800970
[121] Yan, J. and Borman, G. "Analysis and In-Cylinder Measuremnt of Particulate
Radiant Emissions and Temperature in a Direct Injection Diesel Engine".
881315
[122] Ocean Optics. "74-UV Collimating lens". 2012; Available from:
http://www.oceanoptics.com/Products/74series.asp
[123] Edmund Optics. "UV Fused Silica Plano-Convex (PCX) Lenses". 2012; Available
from: http://www.edmundoptics.com/optics/optical-lenses/uv-lenses/uv-
fused-silica-plano-convex-pcx-lenses/2027
[124] Edmund Optics. "Dichroic Plate Beamsplitters". 2012; Available from:
http://www.edmundoptics.com/optics/beamsplitters/plate-
beamsplitters/dichroic-plate-beamsplitters/2516
[125] Thorlabs. "Bandpass Filters". 2012; Available from:
http://www.thorlabs.com/newgrouppage9.cfm?objectgroup_id=1001
[126] Hamamatsu. "Photomultiplier Tubes". 2012; Available from:
http://sales.hamamatsu.com/en/products/electron-tube-
division/detectors/photomultiplier-tubes.php
[127] Matlab, "The language of technical computing". 1999. No. 5
[128] Gaydon, A.G. and Guedeney, F., "Effect of preheating on the spectra of carbon
monoxide diffusion flames". Transactions of the Faraday Society, 1955. 51(0):
p. 894-900

123
[129] Kaskan, W.E., "The source of the continuum in carbon monoxide hydrogen-air
flames". Combustion and Flame, 1959. 3(0): p. 39-48
[130] Available from: http://www.gaussian.com/
[131] Jansons, M., Brar, A., Estefanous, F., Florea, R., Taraza, D., Henein, N. and
Bryzik, W. "Experimental Investigation of Single and Two-Stage Ignition in a
Diesel Engine".
[132] Florea, R., "Optical investigation of ethanol and n-heptane dual-fuel partially
premixed combustion in a reciprocating engine", in Mechanical Engineering.
2012, Wayne State University: Detroit.
[133] Träger, F., "Springer Handbook of Lasers and Optics". 2006: Springer, New
York. ISBN: 9780387955797
[134] Taylor, W.E., "Correlation of the Mohs's scale of hardness with the Vickers' s
hardness numbers". Mineralogical Magazine, 1949. 28: p. 718
[135] Brown, B. "catool - Combustion Analysis Tool - User Guide". 2010; Available
from: http://catool.org
[136] Mueller, C.J., Boehman, A.L. and Martin, G.C., "An Experimental Investigation of
the Origin of Increased NOx Emissions When Fueling a Heavy-Duty
Compression-Ignition Engine with Soy Biodiesel". SAE Int. J. Fuels Lubr., 2009.
2(1): p. 789-816
[137] O'Connor, J. and Musculus, M., "Post Injections for Soot Reduction in Diesel
Engines: A Review of Current Understanding". SAE Int. J. Engines, 2013. 6(1):
p. 400-421

124
[138] O'Connor, J. and Musculus, M., "Optical Investigation of the Reduction of
Unburned Hydrocarbons Using Close-Coupled Post Injections at LTC Conditions
in a Heavy-Duty Diesel Engine". SAE Int. J. Engines, 2013. 6(1): p. 379-399

125
ABSTRACT
EXPERIMENTAL INVESTIGATION AND DEVELOPMENT OF AN
EXTENDED TWO COLOR METHOD (eTCM) WITH APPLICATION TO INTERNAL
COMBUSTION ENGINES
by
ELENA FLOREA
August 2013
Advisor: Dr. Dinu Taraza
Major: Mechanical Engineering
Degree: Doctor of Philosophy
The internal combustion engine is on a continuous path of improvement to
reduce exhaust gaseous emissions and improve fuel economy. While recent trends in
diesel engine development have lowered the EGR requirements, future regulatory
pressure will likely result in a reversed trend in the future.
Given this, it is of interest to improve the application range of diagnostic tools
such as the two color method (TCM) typically used in evaluating the properties of
engine soot, such as temperature and volume fraction. This optical diagnostic
method relies on the use of the light emitted by the soot particles along with a soot
emissivity model in order to estimate the temperature T and optical thickness KL
characterizing the soot cloud of interest. This assumption is reasonable for the
“traditional” diesel combustion, where low degrees of premixed combustion result in
very low amounts of blue-flame light emission compared to the soot related
radiation. However, for LTC (low temperature combustion) combustion modes this
assumption is no longer applicable, especially for combustion strategies
characterized by very large premixed combustion phases, such as the Partially-
premixed Charge Compression Ignition (PCCI) strategies.

126
The aim is to obtain more information related to the combustion process and
specifically on the soot formation and oxidation process. For this reason, the present
research can be divided in two major sections.
The first section focuses on the development of a combustion optical probe
and the optical experimental setup necessary for conducting the experimental work.
Information regarding the soot formation and oxidation processes may be inferred
from the measured signal.
The objective of the second section of the current research is to provide the
theoretical background and experimental evidence needed to describe the proposed
optical diagnostic tool, the extended two-color method (eTCM). This method
attempts to extend the domain of applicability of the classical two color method
within the area of strong CO continuum interference as well as providing a method of
testing the validity of the conventional two-color method. Further, it provides
additional information regarding the strength of the radiation associated with the CO
flame continuum.
Towards this goal, the work was conducted on a fully accessible optical
engine, which allowed the use of multiple synchronous optical measurements
targeted towards the evaluation of the proposed optical diagnostic tool.
The evidence presented in this work suggests that eTCM is capable of
temperature and soot optical thickness factor correction under medium and strong
blue-flame interference without significant impact on the temperature estimation
uncertainty.
Consequently, the currently proposed extended two-color method (eTCM) has the
potential for a large-scale impact in the fields of fundamental engine research as well
as engine development and calibration.

127
AUTOBIOGRAPHICAL STATEMENT
Most people can tell you that ever since they were children they wanted to be
a teacher or an actor or a doctor. For me it was different, it was a process of
discovery. I have not chosen engineering as much as it has chosen me. It was a part
of me from the beginning and it started showing in high school when I was more
interested in mathematics and physics.
It came naturally for me to continue my education by following a mechanical
engineering undergraduate program at Transylvania University of Brasov, Romania
and opting for the automotive engineering major.
Towards the end of my undergraduate studies, I received a scholarship at
Rheinisch-Westfälische Technische Hochschule Aachen, Germany where I spent the
semester working on my graduation thesis. I had the opportunity of working on a
“hands on” project that concentrated on upgrading an existing diesel engine to be in
conformity with the specifications and regulations for mining applications.
After I graduated from college I knew I didn’t want to bring my education to
an end. I was very lucky to receive the position of graduate research assistant at
Wayne State University in Detroit, USA. Under the guidance of wonderful professors
I started my PhD program working on diesel engines in the Center for Automotive
Research group. The research was stimulating and involved working with biofuels on
an all metal diesel engine as well as on an optically accessible diesel engine.
On the whole, I look back from where I started, a small town in Romania, and
I realize how lucky I was to meet the right people at the right time. They gave me
the opportunity to discover what I like and what is a part of me: engineering. I am
looking at the future and I am thrilled for the next step in my career as an engineer.