Embed Size (px)
Citation preview
1
Experimental investigation and modeling of diffusion dialysis for
HCl recovery from waste pickling solution
R. Gueccia a, S. Randazzo a, D. Chillura Martino b, A. Cipollina a, G. Micale a
aDipartimento dell’Innovazione Industriale e Digitale - Ingegneria Chimica, Gestionale, Informatica, Meccanica, Università
di Palermo – Viale delle Scienze ed.6, 90128 Palermo, Italy. bDipartimento di Scienze e Tecnologie Biologiche, Chimiche e Farmaceutiche, Università di Palermo – Viale delle Scienze
ed.17, 90128 Palermo, Italy. *Corresponding Author. e-mail: [email protected]
Abstract
Hydrochloric acid recovery from pickling solutions was studied by employing a batch diffusion dialysis
(DD) laboratory test-rig equipped with Fumasep membranes. The effect of main operating parameters
such as HCl concentration (0.1-3 M) and the presence of Fe2+ (up to 150 g/l) was investigated to simulate
the system operation with real industrial streams. The variation of HCl, Fe2+ and water flux was
identified. When only HCl is present, a recovery efficiency of 100% was reached. In the presence of
FeCl2, higher acid recovery efficiencies, up to 150%, were observed due to the so-called “salt effect”,
which promotes the passage of acid even against its concentration gradient. A 7% leakage of FeCl2 was
detected in the most severe conditions. An original analysis on water flux in DD operation has indicated
that osmotic flux prevails at low HCl concentrations, while a dominant “drag flux” in the opposite
direction is observed for higher HCl concentrations.
Self-archival version of the article published in Journal of
Environmental Management: R. Gueccia, S. Randazzo, D. Chillura Martino, A. Cipollina, G. Micale, 2019. Experimental
investigation and modeling of diffusion dialysis for HCl recovery from waste pickling
solution. Journal of Environmental Management 235, 202-212.
https://doi.org/10.1016/j.jenvman.2019.01.028

2
A comprehensive mathematical model was developed and validated with experimental data. The model
has a time and space distributed-parameters structure allowing to effectively simulate steady-state and
transient batch operations, thus providing an operative tool for the design and optimization of DD units.
Keywords: Pickling process; Diffusion dialysis; Modeling; Industrial waste recovery; AEM.
1. Introduction
The pickling process is an essential step in steel manufacturing industry. During the pickling treatment,
ferrous ions are released in solution, after being complexed in FeCl2, reaching concentrations up to 200
g/l, while the acid concentration decreases by 75-85%. A pickling bath in this condition is considered
spent (Regel-Rosocka, 2010) and provides low pickling rate, thus requiring to be replaced. Disposal of
the industrial pickling waste strongly affects the hot-dip galvanizing industries economics and
environmental footprint. Thus, the recovery of acid is one of the most beneficial steps to enhance the
process sustainability.
Several techniques have been proposed to reuse spent pickling liquor by recovering the free acid (e.g.
by membrane technologies), or by regenerating the acid (e.g. by pyrohydrolysis, where also the reacted
acid is recovered) (Balakrishnan et al., 2018). Several authors investigated the regeneration of pickling
waste acid solutions by spray roasting (Bascone et al., 2016; Regel-Rosocka, 2010).
Membrane techniques are considered simple, effective and sustainable (Regel-Rosocka, 2010). These
characteristics make them very attractive in acid recovery field, though their actual applicability strongly
depends on high-performing membranes availability and cost. In this respect, diffusion dialysis (DD) is
becoming popular thanks to the recent important advances in ion exchange membranes (IEMs) (Mondal
et al., 2017). The main advantages of DD are: clean nature of the process, low installation and operating
cost, operational simplicity and compatibility, low energy (Jung Oh et al., 2000; Luo et al., 2010; Xu et
al., 2009)

3
In diffusion dialysis an anionic exchange membrane is used to achieve the separation of acid and salts.
Due to the positive fixed charges present in the membrane, the transport of counter-ions (chlorides) is
facilitated, whereas co-ions (iron cations, for instance) are rejected because of the electrostatic repulsion.
However, also H+ ions can diffuse through the anionic membrane, despite their positive charge, thanks
to their little size and through the tunneling mechanism (Luo et al., 2011b; Strathmann, 2004; Xu et al.,
2009). Therefore, the acid recovery and separation from salts occur.
Up to now, many authors have reported promising results for the recovery of HCl with DD. Among
them, very few researchers studied the performances of Fumasep membranes (Palatý and Bendová,
2018). Research efforts have been devoted also to analyse how the acid concentration and the presence
of metal salts (e.g. FeCl2) can affect HCl recovery in DD. In particular, their effect on the diffusive
permeability and the acid recovery have been quantitatively analysed (Jung Oh et al., 2000; Luo et al.,
2013; Palatý and Bendová, 2009; Xu et al., 2009). Interestingly, only few researchers used very high
concentrations of iron ions as in an industrial pickling waste (up to 150 g/l), when the leakage of cations
through the anionic exchange membrane can be considerable (Xu et al., 2009).
In the DD process, the acid and iron salt diffusive permeability of the membrane is highly related to the
mobility of all ionic species. Several researchers developed theoretical models to characterize transport
phenomena in DD. Some important parameters, especially the permeability (P), have been defined and
determined, both for the acid and the iron chloride transport, by carrying out experiments in batch (Davis,
2000; Kang et al., 2001; Luo et al., 2011a; Palatý and Bendová, 2009) and in continuous (Bendová et
al., 2009; Davis, 2000; Kang et al., 2001) systems. Another important parameter, the water flux through
the membrane, was also observed and poorly discussed only in a few cases (Davis, 2000; Jung Oh et al.,
2000; Xu et al., 2009).
In the present work, a single-cell diffusion dialysis module was employed in order to study the effect of
process parameters on the efficiency of HCl recovery, even in the presence of FeCl2 at very high
4
concentrations, to simulate real industrial pickling waste conditions. In addition, a mathematical model
able to simulate the process was developed and validated, providing an effective tool for the prediction
of all the main process phenomena, from acid and salt flux to the water flux, and the simulation of real
scale continuous or transitory operation.
2. Experimental
2.1 Materials
The solutions for diffusion dialysis experiments were prepared in laboratory from 37% HCl solution,
FeCl2 tetrahydrate (Carlo Erba reagents, purity ≥ 99%) and deionized water generated by a two-stage
reverse osmosis (conductivity below 5 S/cm). Na2CO3 (Carlo Erba reagents, purity ≥ 99.5%) was used
for HCl titration. In all tests, the feed retentate solutions consist of HCl solutions from 0.1 to 3 M, or
FeCl2 solutions with Fe ions concentration from 50 to 150 g/l and 2 M HCl. The inlet diffusate stream is
deionized water in tests performed to investigate the permeability of acid or the combined effect of acid
and salt. Differently, for the investigation of iron diffusion through the membrane, a 0.1 M HCl
concentration is used in the retentate and diffusate, in order to keep a low pH (thus avoiding iron
precipitation phenomena in the retentate channel) and minimize acid flux between the two
compartments.
The membrane adopted is a Fumasep type FAD from Fumatech GmbH and the main characteristics are
reported in Table 1.
Table 1. Properties of Fumasep FAD type anion exchange membrane.
Item Specifications
thickness (dry) µm 70-80
electric resistance a) Ω cm² < 1
5
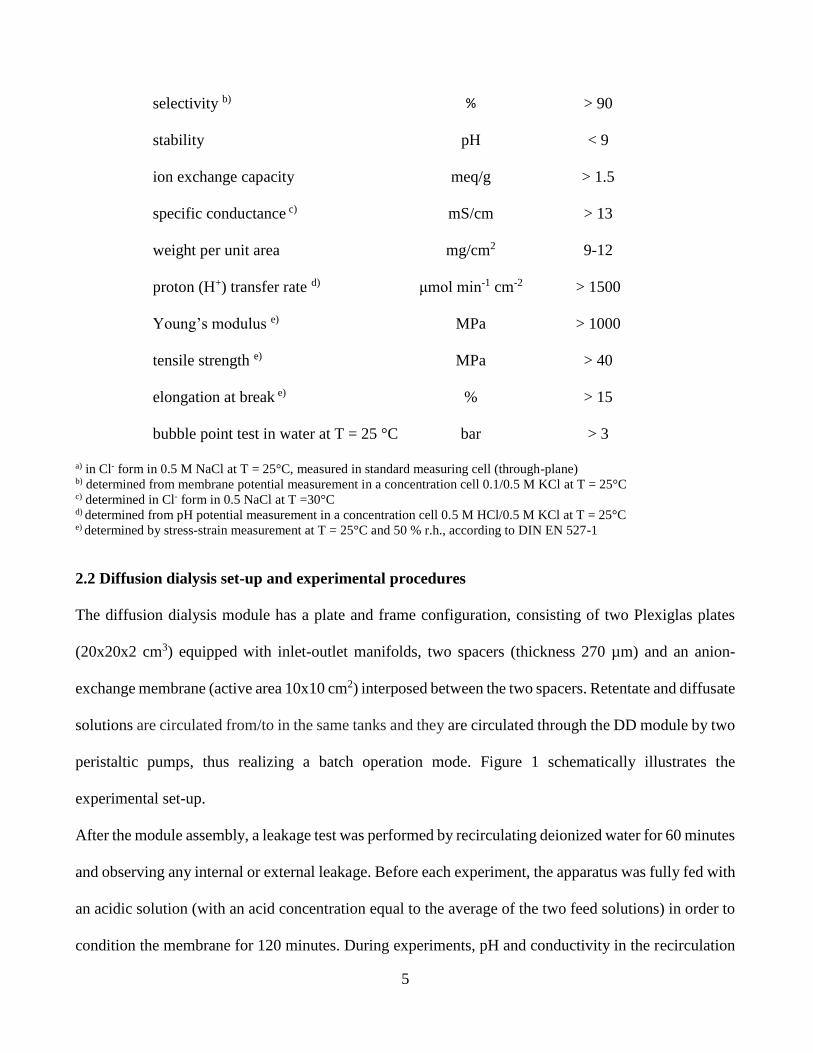
a) in Cl- form in 0.5 M NaCl at T = 25°C, measured in standard measuring cell (through-plane) b) determined from membrane potential measurement in a concentration cell 0.1/0.5 M KCl at T = 25°C c) determined in Cl- form in 0.5 NaCl at T =30°C d) determined from pH potential measurement in a concentration cell 0.5 M HCl/0.5 M KCl at T = 25°C e) determined by stress-strain measurement at T = 25°C and 50 % r.h., according to DIN EN 527-1
2.2 Diffusion dialysis set-up and experimental procedures
The diffusion dialysis module has a plate and frame configuration, consisting of two Plexiglas plates
(20x20x2 cm3) equipped with inlet-outlet manifolds, two spacers (thickness 270 µm) and an anion-
exchange membrane (active area 10x10 cm2) interposed between the two spacers. Retentate and diffusate
solutions are circulated from/to in the same tanks and they are circulated through the DD module by two
peristaltic pumps, thus realizing a batch operation mode. Figure 1 schematically illustrates the
experimental set-up.
After the module assembly, a leakage test was performed by recirculating deionized water for 60 minutes
and observing any internal or external leakage. Before each experiment, the apparatus was fully fed with
an acidic solution (with an acid concentration equal to the average of the two feed solutions) in order to
condition the membrane for 120 minutes. During experiments, pH and conductivity in the recirculation
selectivity b) % > 90
stability pH < 9
ion exchange capacity meq/g > 1.5
specific conductance c) mS/cm > 13
weight per unit area mg/cm2 9-12
proton (H+) transfer rate d) μmol min-1 cm-2 > 1500
Young’s modulus e) MPa > 1000
tensile strength e) MPa > 40
elongation at break e) % > 15
bubble point test in water at T = 25 °C bar > 3

6
tanks were measured by digital multi parameter pH/conductivity-meter (Hanna Instruments) and several
samples were withdrawn to measure acid and iron concentration, the first one after 1 h, the others every
two hours.
Fig. 1. Experimental set-up: (a) scales, (b) pumps, (c) DD module, (P) pressure gauges, (r) retentate
tank, (d) diffusate tank. Osmotic (Jos), drag (Jdr) and i-component (Ji) fluxes through the membrane are
indicated with arrows.
At the output of each pump, a pressure gauge is connected to the circuit, in order to monitor the pressure
drops inside the stack. All the experiments were performed with a constant flow rate (48 ml/min) and at
room temperature (20-25 °C). Preliminary test at lower flow rates were carried out and results were not
significantly different, thus operating at the higher flow rate was preferred to reduce air bubbles trapping
issues. Each experiment was repeated from 2 to 4 times in order to have a statistical relevance and to
calculate the error bars reported in the graphs. Water flux was determined by weight measurements in
the two tanks.
Parameters such as flux of i-species in solution, acid recovery and iron leakage are calculated from
experimental results as a function of the test duration, by the closure of mass balances in the retentate
or diffusate tanks:

7
𝐽𝑖 = −∆(𝑉𝑟𝑐𝑖,𝑟)
𝐴𝑚∆𝑡= −
𝑉𝑟|𝑡
𝐴𝑚(
𝑐𝑖,𝑟|𝑡+∆𝑡
− 𝑐𝑖,𝑟|𝑡
∆𝑡) −
𝑐𝑖,𝑟|𝑡
𝐴𝑚(
𝑉𝑟|𝑡+∆𝑡 − 𝑉𝑟|𝑡
∆𝑡) (1)
𝑅𝑅𝐻𝐶𝑙(%) =𝑉𝑑𝑐𝐻𝐶𝑙,𝑑|
𝑡+∆𝑡− 𝑉𝑑𝑐𝐻𝐶𝑙,𝑑|
𝑡
𝑉𝑟𝑖𝑛𝑐𝐻𝐶𝑙,𝑟
𝑖𝑛𝑥100
(2)
𝐿𝑒𝑎𝑘𝑎𝑔𝑒𝐹𝑒𝐶𝑙2(%) =
𝑉𝑑𝑐𝐹𝑒𝐶𝑙2,𝑑|𝑡+∆𝑡
− 𝑉𝑑𝑐𝐹𝑒𝐶𝑙2,𝑑|𝑡
𝑉𝑟𝑖𝑛𝑐𝐹𝑒𝐶𝑙2,𝑟
𝑖𝑛 𝑥100
(3)
where 𝑅𝑅𝐻𝐶𝑙 and 𝐿𝑒𝑎𝑘𝑎𝑔𝑒𝐹𝑒𝐶𝑙2represent the recovery ratio and leakage percentage of acid and FeCl2
respectively.
In addition, the acid recovery efficiency (𝜂𝐻𝐶𝑙) is defined as the ratio between the actual recovery of acid
and the theoretical maximum recovery achievable when the two solutions reach the equilibrium (in the
present case of equal feed tank volumes, corresponding to 50%).
𝜂𝐻𝐶𝑙(%) =𝑅𝑅𝐻𝐶𝑙
𝑅𝑅𝐻𝐶𝑙𝑚𝑎𝑥 𝑥100
(4)
2.3 Analysis
The concentration of HCl was measured through conductivity measurements and verified by titration
with a standard Na2CO3 solution. The concentration of Fe ions in solution was measured by
spectrophotometric technique (Beckham DU 800 spectrophotometer) adding 1,10-phenanthroline and
characterizing the samples at a λ of 510 nm.
3. Results and discussion
3.1 Effect of HCl concentration on acid permeability
The flux of acid at different initial concentrations was studied in order to determine the diffusive acid
permeability. Several experiments were carried out with HCl at 0.1, 0.5, 1, 2 and 3 M at room
8
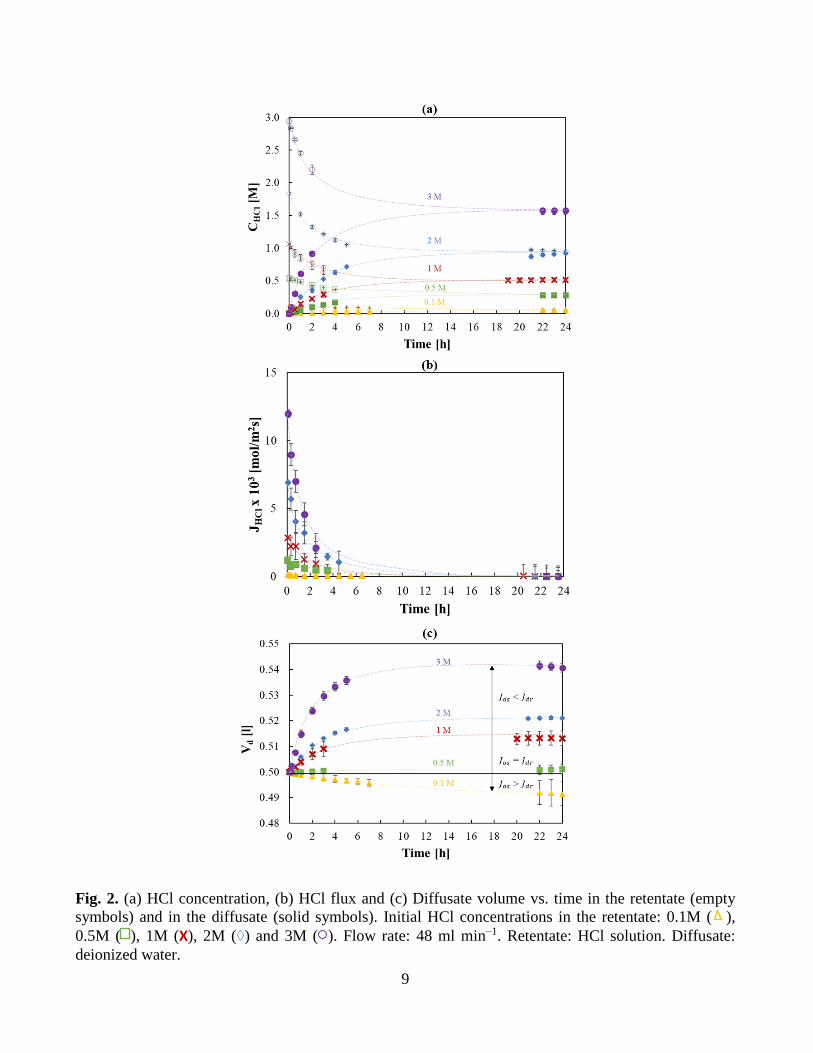
temperature using deionized water as draw solution. In Figure 2 (a), time variation of HCl concentration
is reported in the retentate and diffusate tanks. Such variation can be ascribed to the presence of a
diffusive acid flux through the membrane from the retentate to the permeate channel. This is reported in
Figure 2 (b). In fact, according to the Fick's law, which relates the diffusive flux to the concentration
gradient across the membrane, this flux decreases significantly along time due to the reduction in the
concentration driving force, as also observed by Jung Oh et al. (2000). Moreover, also the permeability
value is influenced by acid concentration (see section 5). In all these cases a recovery efficiency of
almost 100% is reached after 24 hours of operation.
Finally, Figure 2 (c) reports the variation of volumes in the diffusate tank along time. Volume variation
is related to the water flux through the membrane, which can be described with two terms (see Fig.1):
an osmotic flux from the diffusate solution to the retentate one and a drag flux, which is the flux of water
molecules associated with acid molecules passing from the retentate to the diffusate solution. The two
counter acting effects lead to a diffusate volume decrease for the case of very low acid concentration
(0.1 M), while it increases at higher concentrations (0.5–3 M). In fact, the drag flux prevails when acid
concentrations are above a threshold limit of about 0.5 M, where the significant flux of acid leads to an
important drag flux of water molecules, as already reported by some authors for the case at higher acid
concentrations (Davis, 2000; Jung Oh et al., 2000).
9
Fig. 2. (a) HCl concentration, (b) HCl flux and (c) Diffusate volume vs. time in the retentate (empty
symbols) and in the diffusate (solid symbols). Initial HCl concentrations in the retentate: 0.1M ( ),
0.5M ( ), 1M (X), 2M (◊) and 3M ( ). Flow rate: 48 ml min−1. Retentate: HCl solution. Diffusate:
deionized water.

10
3.2 Fe passage and its effect on HCl recovery
To evaluate the iron passage through the membrane, two solutions at the same HCl content (0.1 M) were
used in the two channels in order to always keep an acidic pH. FeCl2 was added in the retentate at
different concentrations (namely 50, 100 and 150 g/l of Fe2+ ions). The experiments were performed
with a flowrate of 48 ml/min in both the channels, at room temperature. As reported in Figure 3, a
leakage from 2 to 12 g/l was detected after 7 hours increasing as the iron concentration increases.
Fig. 3. Fe concentration vs. time in the diffusate. Initial Fe concentrations: 50 (♦), 100 ( ) and 150 ( )
g/l. Initial acid concentration: 2M. Flow rate: 48 ml min−1. Retentate: HCl and FeCl2 solution. Diffusate:
deionized water.
The effect of FeCl2 concentration on the HCl recovery was also studied. As shown in Figure 4, for an
initial iron concentration of 100 g/l, the acid recovery in the presence of iron in solution is higher
compared to the one revealed in the absence of Fe. In fact, the acid concentration in the diffusate is
higher than the one in the retentate (a cross can be observed in the figure), differently from the case
without iron salt, when the maximum value of acid recovery is 50%. This is imputed to the so-called
“salt effect”, i.e. the addition of salt with the same anion of the acid causes an additional driving force
for the diffusion of chlorides (Davis, 2000; Luo et al., 2011b; Xu et al., 2009), which leads to additional
diffusion of protons in order to respect the electroneutrality of the system. Such phenomena are reflected

11
in acid recovery efficiency values above 100%, thus indicating the importance of salt effect in the HCl
recovery process.
Fig. 4. Time variation of HCl concentration in the diffusate (solid symbols) and retentate (empty
symbols). Initial Fe concentrations in retentate: 0 g/l ( ) and 100 g/l ( ). Initial acid concentration: 2M.
Flow rate: 48 ml min−1. Retentate: HCl and FeCl2 solution. Diffusate: deionized water.
Moreover, it was observed that the HCl recovery increases by increasing FeCl2 concentration, keeping
the initial HCl concentration at a constant value (2 M). Of course, even though the acid permeation
increases, also the Fe leakage through the membrane increases, causing a loss of membrane efficiency
in co-ions rejection. The two performance parameters, acid recovery and iron leakage, increase from 50
to 75% and 7%, respectively, by increasing initial Fe ions concentration from 50 to 150 g/l, as shown in
Figure 5, which results in an acid recovery efficiency of 150%. Concerning the water flux, diffusate
volume profiles are reported in Figure 6.
As shown, the drag flux initially prevails, then a net water flux from the diffusate to the retentate is
observed, thus indicating an overall prevalent osmotic flux. A critical time, t*, can be identified when
drag and osmotic fluxes are equivalent. As expected, t* decreases when increasing FeCl2 concentration,
due to the stronger effect of salts in determining the osmotic pressure increase in the retentate.

12
Fig. 5. (a) HCl Recovery Ratio and (b) FeCl2 leakage percentage vs. initial Fe concentration in the
retentate: 0 ( ) 50 (♦), 100 ( ) and 150 g/l ( ). Initial acid concentration: 2M. Flow rate: 48 ml min−1.
Retentate: HCl and FeCl2 solution. Diffusate: deionized water.
Fig. 6. Retentate volume vs. time. Initial Fe concentrations: 50 (◊), 100 ( ) and 150 ( ) g/l. Initial acid
concentration: 2M. Flow rate: 48 ml min−1. Retentate: HCl and FeCl2 solution. Diffusate: deionized
water.
4. Model for Diffusion Dialysis
A model was developed in order to simulate the Diffusion Dialysis process in steady-state and batch
operation. For that purpose, the model includes steady-state spatial differential mass balance equations
(section 4.1) with a 1-dimensional spatial discretization of the DD unit along channels and time

13
differential equations describing the variation of concentration and of volume in the two feed tanks
during batch operations (section 4.2).
4.1 Spatial differential model equations
Figure 7 shows the sketch of a countercurrent module of length zch and membrane area Am.
Since the concentration of the i-component in I is higher than in II, a mass transport from I to II occurs.
Thus, the concentration of the i-component in the retentate side decreases and, conversely, in the
diffusate side it increases along the flow direction.
Fig. 7. Schematic representation of the discretized domain of the DD unit, indicating the main variables.
Assuming steady-state conditions and considering diffusion and convection mass transport, the variation
of concentration along z in the two channels can be derived from the mass balance on the differential
volume between z and z+dz (only the equations for the retentate are reported for the sake of brevity):
𝐹𝑟𝑐𝑖𝑟|
𝑧= 𝐹𝑟𝑐𝑖𝑟
|𝑧+𝑑𝑧
+ 𝐽𝑖𝑑𝐴𝑚 (5)
𝑑𝐴𝑚 = 𝑑𝑧𝑤𝑐ℎ (6)
𝑑𝐹𝑟𝑐𝑖𝑟
𝑑𝑧= −𝐽𝑖𝑤𝑐ℎ
(7)
𝑑𝐹𝑟
𝑑𝑧= ∑
𝑑𝐹𝑟𝑐𝑖𝑟
𝑑𝑧
𝑃𝑀𝑖
𝜌𝑟𝑖
(8)
where 𝑐𝑖𝑟 is the bulk concentration of the i-component in the retentate side; 𝐹𝑟 is the volumetric flow
rate in the retentate channel; 𝐽𝑖 is the molar flux of the i-component through the membrane; 𝑑𝐴𝑚 is the

14
differential membrane area; 𝑤𝑐ℎ is the channel width; 𝑃𝑀𝑖 and 𝜌𝑟 are molecular weight and density of
the retentate solution, respectively.
The boundary conditions for the two feeds are:
𝑧 = 0 𝑐𝑖,𝑟 = 𝑐𝑖,𝑟𝑖𝑛 (9)
𝑧 = 𝑧𝑐ℎ 𝑐𝑖,𝑑 = 𝑐𝑖,𝑑𝑖𝑛 (10)
The flux of the i-component is controlled by resistances in series i.e. from the bulk of retentate to the
membrane interface (Eq.11), across the membrane (Eq. 12) and from the membrane interface at the
diffusate side to the bulk of the diffusate (Eq. 13):
𝐽𝑖 = 𝑘𝑖,𝑟(𝑐𝑖,𝑟 − 𝑐𝑖,𝑟𝑖𝑛𝑡) (11)
𝐽𝑖 = 𝑃𝑖(𝑐𝑖𝑟
𝑖𝑛𝑡 − 𝑐𝑖𝑑
𝑖𝑛𝑡) (12)
𝐽𝑖 = 𝑘𝑖,𝑑(𝑐𝑖,𝑑𝑖𝑛𝑡 − 𝑐𝑖,𝑑)
(13)
where ki,r and ki,d are the mass transport coefficients for the i-component in retentate and diffusate
channels, respectively; ci,r and ci,d are the bulk concentrations in the retentate and diffusate solutions; 𝑃𝑖
is the permeability of the i-component through the membrane; ci,rint
and ci,dint are the solution
concentrations at the retentate and diffusate membrane interface, respectively.
To determine the mass transport coefficients, data from literature were used (Gurreri et al., 2014; Perry
and Green, 2008). In particular, a Sherwood number in a laminar regime, in forced convection and for
planar configuration was derived as:
𝑆ℎ𝑟 = (−1.48110−7𝑅𝑒𝑟5 + 3.73910−5𝑅𝑒𝑟
4 − 0.003253𝑅𝑒𝑟3 + 0.1118𝑅𝑒𝑟
2 + 0.1348𝑅𝑒𝑟
+ 6.9536) (𝑆𝑐𝑟
600)
0.5
(14)
where 𝑆ℎ𝑟, 𝑅𝑒𝑟 and 𝑆𝑐𝑟 are dimensionless numbers:

15
𝑆ℎ𝑟 =𝑘𝑖𝑟
𝐷𝑒𝑞
𝒟 𝑅𝑒𝑟 =
𝜌𝑟𝑣𝑟𝐷𝑒𝑞
µ𝑟 𝑆𝑐𝑟 =
µ𝑟
𝜌𝑟𝒟𝑖 (15)
where 𝑣𝑟 is the fluid linear velocity in the retentate channel, µ𝑟 is dynamic viscosity of the fluid in the
retentate channels, 𝒟𝑖 is the mass diffusivity of the i-component and 𝐷𝑒𝑞 is the hydraulic diameter
defined as:
𝐷𝑒𝑞 =4𝑠𝑐ℎ𝑤𝑐ℎ
2(𝑠𝑐ℎ + 𝑤𝑐ℎ) (16)
where 𝑠𝑐ℎ is channel thickness.
A single equation transport can be derived (Eq. 17), where an overall mass transfer coefficient of the i-
component (𝑈𝑖) can be used (Eq. 18) to express the flux as function of the bulk concentration.
𝐽𝑖 = 𝑈𝑖(𝑐𝑖,𝑟 − 𝑐𝑖,𝑑) (17)
𝑈𝑖 = (1
𝑘𝑖,𝑟+
1
𝑃𝑖+
1
𝑘𝑖,𝑑)
−1
(18)
The permeability coefficient (𝑃𝑖) takes into account the absorption coefficient and the membrane
permeability itself.
Transport of water through the membrane also affects process performances. Water flux was considered
in the model as the sum of the osmotic and drag fluxes, where the osmotic flux depends on the osmotic
pressure driving force, while the drag flux is related to the total water molecules associated to ions
transport (Eq. 19-21).
𝐽𝑤 = 𝐽𝑜𝑠 + 𝐽𝑑𝑟 (19)
𝐽𝑜𝑠 = 𝑃𝑜𝑠𝑅𝑇 ∑ 𝜐𝑖(𝑐𝑖,𝑟 − 𝑐𝑖,𝑑)
(20)

16
𝐽𝑑𝑟 = ∑ 𝛽𝑖𝐽𝑖
𝑖
(21)
where 𝐽𝑤, 𝐽𝑜𝑠 and 𝐽𝑑𝑟 are the total, osmotic and drag water fluxes, respectively, Pos is the osmotic
permeability of the membrane and βi is the hydration number of species i. Hydration numbers equal to
1 for protons, 6 for chlorides and 6 for the iron cations were considered (Lundberg et al., 2007).
The flux of HCl through the membrane is affected by the presence of FeCl2 in solution. As reported by
some authors (Davis, 2000; Palatý and Bendová, 2009), the total acid flux (𝐽𝐻𝐶𝑙𝑡𝑜𝑡 ) can be considered as
the sum of two terms, one dependent on the actual acid concentration difference and the other one related
to the presence of additional chlorides from the iron salt (Eq. 22):
𝐽𝐻𝐶𝑙𝑡𝑜𝑡 = 𝑈𝐻𝐶𝑙(𝑐𝐻𝐶𝑙,𝑟 − 𝑐𝐻𝐶𝑙,𝑑) + 𝑈𝐻𝐶𝑙
𝑠 (𝑐𝐹𝑒𝐶𝑙2,𝑟 − 𝑐𝐹𝑒𝐶𝑙2,𝑑) (22)
where 𝐽𝐻𝐶𝑙𝑡𝑜𝑡
is the hydrochloric acid molar flux through the membrane, 𝑈𝐻𝐶𝑙𝑠 is the secondary overall mass
transfer coefficient related to the presence of iron salts, and 𝑐𝐹𝑒𝐶𝑙2,𝑟 and 𝑐𝐹𝑒𝐶𝑙2,𝑑 are the concentrations of
the salt in the retentate and diffusate solutions, respectively.
Considering Eqs 11-13, 19-21, it is possible to derive the flux of FeCl2 as:
𝐽𝐹𝑒𝐶𝑙2= 𝑈𝐹𝑒𝐶𝑙2
(𝑐𝐹𝑒𝐶𝑙2,𝑟 − 𝑐𝐹𝑒𝐶𝑙2,𝑑) (23)
In order to estimate the efficiency of the process, two important parameters are evaluated: the acid
recovery ratio (𝑅𝑅𝐻𝐶𝑙) and the iron leakage through the membrane (𝐿𝑒𝑎𝑘𝑎𝑔𝑒𝐹𝑒𝐶𝑙2).
The acid recovery ratio (𝑅𝑅𝐻𝐶𝑙) is calculated as:
𝑅𝑅𝐻𝐶𝑙 (%) =𝐹𝑑
𝑜𝑢𝑡𝑐𝐻𝐶𝑙,𝑑𝑜𝑢𝑡 − 𝐹𝑑
𝑖𝑛𝑐𝐻𝐶𝑙,𝑑𝑖𝑛
𝐹𝑟𝑖𝑛𝑐𝐻𝐶𝑙,𝑟
𝑖𝑛𝑥100
(24)
where the superscripts in and out indicate the inlet and outlet from the DD channel, respectively.
The iron leakage (𝐿𝑒𝑎𝑘𝑎𝑔𝑒𝐹𝑒𝐶𝑙2) is calculated as:

17
𝐿𝑒𝑎𝑘𝑎𝑔𝑒𝐹𝑒𝐶𝑙2(%) =
𝐹𝑑𝑜𝑢𝑡𝑐𝐹𝑒𝐶𝑙2,𝑑
𝑜𝑢𝑡 − 𝐹𝑑𝑖𝑛𝑐𝐹𝑒𝐶𝑙2,𝑑
𝑖𝑛
𝐹𝑟𝑖𝑛𝑐𝐹𝑒𝐶𝑙2,𝑟
𝑖𝑛𝑥100 (25)
4.2 Time-dependent model equations
In order to simulate the time-dependent variations of concentrations and volumes of the two tanks in the
batch operation mode, the model also includes a dynamic part consisting of time-differential equations
for the volume and concentration of the feed tanks (see Fig. 8).
𝑑𝜌𝑟𝑉𝑟
𝑑𝑡= 𝜌𝑟
𝑖𝑛𝐹𝑟𝑖𝑛,𝐷𝑦𝑛
− 𝜌𝑟𝑜𝑢𝑡𝐹𝑟
𝑜𝑢𝑡,𝐷𝑦𝑛 (26)
𝑑𝑉𝑟𝑐𝑖,𝑟𝑡𝑎𝑛𝑘
𝑑𝑡= 𝐹𝑟
𝑖𝑛,𝐷𝑦𝑛𝑐𝑖,𝑟
𝑖𝑛,𝐷𝑦𝑛− 𝐹𝑟
𝑜𝑢𝑡,𝐷𝑦𝑛𝑐𝑖,𝑟
𝑜𝑢𝑡,𝐷𝑦𝑛
(27)
where 𝐹𝑟𝑖𝑛,𝐷𝑦𝑛
and 𝐹𝑟𝑜𝑢𝑡,𝐷𝑦𝑛
represent the inlet/outlet volumetric flowrates in the retentate tank, equal to
the outlet/inlet retentate stream in the DD unit, respectively. In the same way, 𝑐𝑖,𝑟𝑖𝑛,𝐷𝑦𝑛
and 𝑐𝑖,𝑟𝑜𝑢𝑡,𝐷𝑦𝑛
are
the inlet/outlet concentrations in the retentate tank, equal to the outlet/inlet concentrations retentate
stream in the DD unit, respectively, while 𝑐𝑖,𝑟𝑡𝑎𝑛𝑘 is the concentration of the i-component in the retentate
tank. In all cases, perfect mixing is assumed in the tanks, thus:
𝑐𝑖,𝑟𝑜𝑢𝑡,𝐷𝑦𝑛
= 𝑐𝑖,𝑟𝑡𝑎𝑛𝑘
(28)
Fig. 8. Schematics of the control volumes in the DD set-up for the dynamic section of the model

18
Volume and concentration variations in the diffusate tank are calculated from the closure of mass balance
equations.
The overall concentration and volume profiles were determined by numerically implementing the model
according to the algorithm shown in Fig.9.
Fig. 9. Algorithm for the numerical implementation of the spatial-time dependent in diffusion dialysis
model

19
Values of permeability were determined through a calibration procedure (presented in section 5) and are
related to the acid concentration in the retentate solution.
5. Model calibration and validation
5.1 Model calibration
Calibration permeability values of the membrane with respect to the acid, salt and water diffusion have
been related to the concentration of the acid and salt in the feed solution using experimental data. For
each experiment a good fitting between experimental and model data was obtained by using linear
correlations for the acid (PHCl) and for water (Pos) permeability as a function of the acid concentration in
the retentate. By way of example, the comparison between experimental data and model prediction is
reported in Figure 10 for the 2M HCl test.
Fig. 10. Comparison between experimental data in the retentate (empty symbols) and in the diffusate
(solid symbols) and model predictions (continuous line) for 2M HCl test. Flow rate: 48 ml min−1.
Retentate: HCl solution. Diffusate: deionized water.

20
Therefore, all these linear trends were plot in a graph (Fig. 11) in order to obtain a unique correlation
relating acid permeability values to the acid concentration in the retentate tank, as reported below:
𝑃𝐻𝐶𝑙 = 3.21 · 10−7𝑐𝑟,𝐻𝐶𝑙3 − 1.93 · 10−6𝑐𝑟,𝐻𝐶𝑙
2 + 4.11 · 10−6𝑐𝑟,𝐻𝐶𝑙 + 6.61 · 10−7
(29)
As previously mentioned in section 3, the diffusive permeability to the acid is strongly affected by the
acid concentration.
In fact, as reported in Figure 11 (a), it increases as HCl concentration increases in the whole range
investigated.
In a similar way, osmotic permeability coefficients were obtained experimentally as an increasing
function of the acid concentration (Figure 11 (b)) as:
𝑃𝑜𝑠 = 1.7 ∙ 10−6𝑐𝑟,𝐻𝐶𝑙 + 6.3 ∙ 10−6
(30)
Finally, the FeCl2 leakage permeability coefficient was calibrated according to a similar procedure.
However, differently from the acid, a constant value for each test was considered.
As shown in Figure 11 (c), also FeCl2 diffusive permeability increases as the salt concentration increases,
though, as expected, permeability of the salt is 10 times lower than for the acid:
𝑃𝐹𝑒𝐶𝑙2= −1.87 · 10−8𝑐𝑟,𝐹𝑒𝐶𝑙2
2 + 1.17 · 10−7𝑐𝑟,𝐹𝑒𝐶𝑙2+ 3 · 10−8 (31)
As already described in Eq. 23, in order to consider the salt effect, acid permeation in the presence of
FeCl2 was modelled. In this case, the 𝑈𝐹𝑒𝐶𝑙2 coefficient was also experimentally obtained, showing a
linear dependence on the acid concentration:
𝑈𝐹𝑒𝐶𝑙2= 2.6 · 10−6𝑐𝑟,𝐻𝐶𝑙 + 9.95 · 10−8 (32)

21
Fig. 11. Linear correlations (continuous line) and overall trend (dotted curve) of the acid diffusive
permeability (a) and osmotic permeability (b) obtained for the model calibration as a function of HCl
concentration in the retentate; values and overall trend (dotted curve) of the iron diffusive permeability
obtained for the model calibration as a function of FeCl2 concentration in the retentate (c).

22
In order to compare diffusive permeability ranges obtained in this work with the values reported in
literature for other membranes, a summary table was prepared (Table 2). A comparison between acid
permeabilities indicates that Fumasep membrane behaves better than most other AEMs tested, although
iron salt permeability is slightly higher.
Table 2. Comparison of diffusive permeability among different membranes.
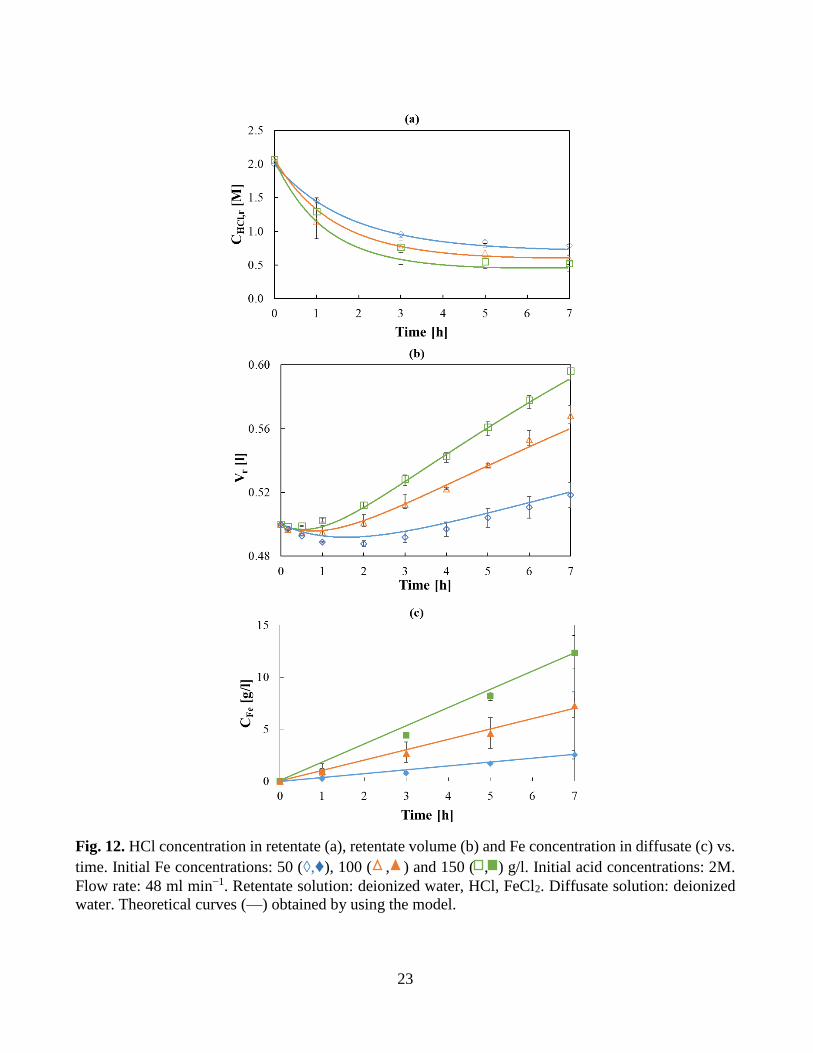
5.2 Model validation
The model was validated by comparison with all experimental trends observed. As an example, Figure
12 reports a comparison between predicted and experimental trends for some of the investigated cases.
Instead, in Figure 13 a comparison of experimental data and model predictions is reported for all the
investigated cases.
In all cases a good agreement is shown between model and experiments.
Membrane
AEM
Concentration
Range
Operation
Configuration
PHCl
(10-6 𝑚
𝑠 )
PFeCl2
(10-7 𝑚
𝑠 )
Ref
Fumasep FAD 0.1-3 M HCl
0.9-2.7 M FeCl2 Batch recirculation 1-4 1-2 This work
Fumasep FAD 0.2-2 M HCl Two compartment
stirred cells 3.7-13.4 -
Palatý and
Bendová, 2018
Neosepta AFN 4 M HCl
0.26 M FeCl2 Dialyzer Stack 2.1 0.14
Jung Oh et al.,
2000
DF-120 1.28 M HCl
0.22 M FeCl2
Two compartment
stirred cells 3 1.4
Luo et al.,
2010
PPO-SiO2 1.28 M HCl
0.22 M FeCl2
Two compartment
stirred cells 1.5-3 0.7
Luo et al.,
2010
23
Fig. 12. HCl concentration in retentate (a), retentate volume (b) and Fe concentration in diffusate (c) vs.
time. Initial Fe concentrations: 50 (◊,♦), 100 ( , ) and 150 ( , ) g/l. Initial acid concentrations: 2M.
Flow rate: 48 ml min−1. Retentate solution: deionized water, HCl, FeCl2. Diffusate solution: deionized
water. Theoretical curves (—) obtained by using the model.

24
Fig. 13. Comparison of experimental and predicted values of concentration of species and tanks volumes
in retentate and diffusate compartments. (a)&(b) tests with only HCl at 0.1M ( ), 0.5M ( ), 1M (X),
2M (♦), 3M ( ); (c)&(d) tests with initial HCl at 2M and Fe at 50 (♦), 100 ( ), 150 ( ) g/l; (e)&(f) tests
with initial HCl at 0.1M and Fe at 50 (♦), 100 ( ), 150 ( ) g/l.

25
6. Conclusions
HCl recovery from pickling solutions by Diffusion Dialysis was investigated, highlighting the main
effects of operating conditions on process performance. Acid flux was significantly enhanced by higher
acid concentration in the retentate due to a larger driving force and a higher value of acid diffusive
permeability through the membrane. The effect of the iron (II) chloride on the acid recovery was also
investigated, indicating how the acid flux is enhanced as the FeCl2 concentration increases, due to the
“salt effect”, reaching an acid recovery efficiency over 100%, despite the batch configuration adopted.
Also the FeCl2 diffusive permeability increases as the Fe concentration increases. However, the highest
leakage detected is only 7% in the most severe conditions. A detailed analysis of osmotic and drag water
flux in DD operation is presented. For pure HCl tests, at low HCl concentrations, the osmotic flux
prevails, whereas at higher concentrations a net water flux in the opposite direction is observed due to
the presence of a drag flux, related to the water molecules associated to ions transported through the
membrane. Conversely, in the presence of Fe ions, the osmotic flux always dominates water transport
phenomena.
The whole process was mathematically described within a time/space distributed-parameters model
implemented and adopted as a process simulator. The model was calibrated and fully validated using the
available experimental data in the wide range of acid and iron concentration investigated (0.1-3 M and
50 – 150 g/l, respectively), providing a powerful tool for the simulation and optimisation of DD operation
in transient and steady-state operation.
Acknowledgements

26
This work was financially supported by EU within the ReWaCEM project (Resource recovery from
industrial Wastewater by Cutting Edge Membrane technologies) – Horizon 2020 program, Grant
Agreement no. 723729.
The authors are greeting to DEUKUM GmbH and Fumatech GmbH for supporting during the DD stack
assembly and supplying the AEM membranes.
Nomenclature and acronyms
AEM Anion Exchange Membrane
DD Diffusion Dialysis
IEMs Ion Exchange Membranes
A [𝑚2] area
c [𝑚𝑜𝑙
𝑙] molar concentration
D [𝑚] hydraulic diameter
𝒟 [𝑚2
𝑠] mass diffusivity
F [𝑙
𝑠] volumetric flow rate
𝐽𝑖 [𝑚𝑜𝑙
𝑚2 · 𝑠] molar flux
𝐽𝑤; 𝐽𝑜𝑠; 𝐽𝑑𝑟 [𝑙
𝑚2 · 𝑠] volumetric flux
k [𝑚
𝑠] mass transport coefficient
𝑃𝑖 [𝑚
𝑠] diffusive permeability
PM [𝑔
𝑚𝑜𝑙] molecular weight

27
𝑃𝑜𝑠 [𝑙
𝑏𝑎𝑟 · 𝑚2 · 𝑠] osmotic permeability
R [𝑙 · 𝑏𝑎𝑟
𝐾 · 𝑚𝑜𝑙] gas costant
Re [-] Reynolds number
RR [%] recovery ratio
s [𝑚] thickness
Sc [-] Schmidt number
Sh [-] Sherwood number
T [K] temperature
U [𝑚
𝑠] overall mass transfer coefficient
V [𝑙] volume
v [𝑚
𝑠] linear velocity
w [𝑚] width
z [𝑚] length
𝛽 [-] hydration number
η [%] recovery efficiency
µ [𝑃𝑎 · 𝑠] dynamic viscosity
ρ [𝑔
𝑙] density
Subscripts and superscripts
calc calculated
ch channel
d diffusate
Dyn dynamic

28
dr drag
eq equivalent
fin final
i component i, i.e., HCl, FeCl2
in inlet
int interface
m membrane
max maximum
n discretization number
os osmotic
out outlet
r retentate
s salt
t time
tank tank
tot total
w water
I compartment I
II compartment II
References
Balakrishnan, M., Batra, R., Batra, V.S., Chandramouli, G., Choudhury, D., Hälbig, T., Ivashechkin, P.,
Jain, J., Mandava, K., Mense, N., Nehra, V., Rögener, F., Sartor, M., Singh, V., Srinivasan, M.R.,
Tewari, P.K., 2018. Demonstration of acid and water recovery systems: Applicability and
operational challenges in Indian metal finishing SMEs. J. Environ. Manage. 217, 207-213.
https://doi.org/10.1016/j.jenvman.2018.03.092
Bascone, D., Cipollina, A., Morreale, M., Randazzo, S., Santoro, F., Micale, G., 2016. Simulation of a
regeneration plant for spent pickling solutions via spray roasting. Desalin. Water Treat. 57, 23405-
23419. https://doi.org/10.1080/19443994.2015.1137146

29
Bendová, H., Palatý, Z., Žáková, A., 2009. Continuous dialysis of inorganic acids: permeability of
Neosepta-AFN membrane. Desalination 240, 333–340. https://doi.org/10.1016/j.desal.2007.10.096
Davis, T., 2000. II / MEMBRANE SEPARATIONS / Diffusion Dialysis. Nano 1693–1701.
https://doi.org/10.1016/B0-12-226770-2/05751-3
Gurreri, L., Tamburini, A., Cipollina, A., Micale, G., Ciofalo, M., 2014. CFD prediction of concentration
polarization phenomena in spacer-filled channels for reverse electrodialysis. J. Memb. Sci. 468,
133-148. https://doi.org/10.1016/j.memsci.2014.05.058
Jung Oh, S., Moon, S.H., Davis, T., 2000. Effects of metal ions on diffusion dialysis of inorganic acids.
J. Memb. Sci. 169, 95–105. https://doi.org/10.1016/S0376-7388(99)00333-6
Kang, M.S., Yoo, K.S., Oh, S.J., Moon, S.H., 2001. A lumped parameter model to predict hydrochloric
acid recovery in diffusion dialysis. J. Memb. Sci. 188, 61–70. https://doi.org/10.1016/S0376-
7388(01)00372-6
Lundberg, D., Ullström, A.S., D’Angelo, P., Persson, I., 2007. A structural study of the hydrated and the
dimethylsulfoxide, N,N′-dimethylpropyleneurea, and N,N-dimethylthioformamide solvated
iron(II) and iron(III) ions in solution and solid state. Inorganica Chim. Acta 360, 1809–1818.
https://doi.org/10.1016/j.ica.2006.09.014
Luo, J., Wu, C., Wu, Y., Xu, T., 2013. Diffusion dialysis of hydrochloric acid with their salts: Effect of
co-existence metal ions. Sep. Purif. Technol. 118, 716–722.
https://doi.org/10.1016/j.seppur.2013.08.014
Luo, J., Wu, C., Wu, Y., Xu, T., 2011a. Diffusion dialysis processes of inorganic acids and their salts:
The permeability of different acidic anions. Sep. Purif. Technol. 78, 97–102.
https://doi.org/10.1016/j.seppur.2011.01.028
Luo, J., Wu, C., Wu, Y., Xu, T., 2010. Diffusion dialysis of hydrochloride acid at different temperatures
using PPO-SiO2 hybrid anion exchange membranes. J. Memb. Sci. 347, 240-249.

30
https://doi.org/10.1016/j.memsci.2009.10.029
Luo, J., Wu, C., Xu, T., Wu, Y., 2011b. Diffusion dialysis-concept, principle and applications. J. Memb.
Sci. 366, 1-16. https://doi.org/10.1016/j.memsci.2010.10.028
Mondal, A.N., Cheng, C., Khan, M.I., Hossain, M.M., Emmanuel, K., Ge, L., Wu, B., He, Y., Ran, J.,
Ge, X., Afsar, N.U., Wu, L., Xu, T., 2017. Improved acid recovery performance by novel
Poly(DMAEM-co-γ-MPS) anion exchange membrane via diffusion dialysis. J. Memb. Sci. 525,
163–174. https://doi.org/10.1016/j.memsci.2016.10.042
Palatý, Z., Bendová, H., 2018. Permeability of a Fumasep-FAD membrane for selected inorganic acids.
Chem. Eng. Technol. 41, No.2, 385-391. https://doi.org/10.1002/ceat.201700595
Palatý, Z., Bendová, H., 2009. Separation of HCl + FeCl2 mixture by anion-exchange membrane. Sep.
Purif. Technol. 66, 45–50. https://doi.org/10.1016/j.seppur.2008.11.026
Perry, R.H., Green, D.W., 2008. Perry’s Chemical Engineers’ Handbook, McGraw-Hill.
https://doi.org/10.1017/CBO9781107415324.004
Regel-Rosocka, M., 2010. A review on methods of regeneration of spent pickling solutions from steel
processing. J. Hazard. Mater. 177, 57-69. https://doi.org/10.1016/j.jhazmat.2009.12.043
Strathmann, H., 2004. Electrochemical and Thermodynamic Fundamentals, in: Ion-Exchange
Membrane Separation Processes. 9, 23-88. https://doi.org/10.1016/S0927-5193(04)80033-0
Xu, J., Lu, S., Fu, D., 2009. Recovery of hydrochloric acid from the waste acid solution by diffusion
dialysis. J. Hazard. Mater. 165, 832-837. https://doi.org/10.1016/j.jhazmat.2008.10.064