Embed Size (px)
Citation preview
S e c t i o n I: Bas ic and Appl ied Research
Experimental Investigation and Thermodynamic Optimization of the
Y-Cu Binary System S.G. Fries* a n d H.L. Lukas
Max-Planck-Inst i tut f i i r Meta l l forschung Ins t i tu t f i i r Werks t o f fw i s senscha f t , PML
Heisenbergstr . 5, D - 7 0 5 6 9 S t u t t g a r t , G erm any a n d
R. K o n e t z k i a n d R. Schmid-Fe t zer AG E l e k t r o n i s c h e Mater ia l i en
Technische Universit~it C laus tha l Robert-Koch-Str. 42 , D -38678 Clausthal -Zel ler fe ld , G e r m a n y
(Submitted January 4, 1994: in revised form October 13, 1994)
The Y-Cu binary system was experimentally investigated by DTA and XRD. The DTA results provide evidence for the possible existence of a high-temperature phase transformation in the YCu2 com- pound. The XRD results confirm a range of solubility for the YCu6 phase. A thermodynamic descrip- tion for all the phases was obtained by taking into account all experimental data in the literature.A new phase diagram is proposed.
I n t r o d u c t i o n
The Y-Cu, Ba-Cu, and Ba-Y binary systems form the ternary metallic subsystem of the quaternary Y-Ba-Cu-O system, for which a thermodynamic description is searched. This quater- nary system contains the superconducting phase YBa2Cu307_ ,. For a thermodynamic description of the quaternary system, re- liable experimental and thermodynamic descriptions of the bi- nary subsystems must be available.
The Ba-Cu binary system was recently experimentally rein- vestigated, and the equilibrium temperature of the peritectic fl)rmation of the BaCu13 compound was found to be much higher than the temperatures previously reported in the litera- ture. This experimental result was taken into account in the new thermodynamic description for this binary system [93Kon].
The only information available on the Ba-Y system is found in a theoretical survey of Y-alkali metal systems by [86Dju]. No compounds were reported, and the liquid phase has a miscibil- ity gap with a high unknown critical temperature. This tem- perature can be estimated through experimental investigations on the liquid of the Ba-Cu-Y ternary system [94Kon].
The Y-Cu binary system was previously assessed by [81Cha], and more recently the phase diagram was calculated from an optimized thermodynamic description by [90Ita] using the ex- perimental data obtained by [89Qi]. According to [92Oka], who accepted the Itagaki et al. [90lta] calculated diagram, the system presents five intermetallic compounds: YCu, YCu 2,
*On leave from Instituto de Ffsica, Universidade Federal do Rio Grande do Sul, Av. Bento Gonqalves 9500, 91501-970 Porto Alegre, RS, Brazil.
Y2Cu7 , Y C u 4, and YCu 0 (denoted Y C u 7 by [71Bus]). A range of solubility is attributed to Y C u 6. Apart from YCu6 and Y2Cu7, all phases melt congruently. There is still some contro- versy in the literature with regard to the temperatures of the bi- nary invariant reactions. In addition, the ranges of solubility reported in the literature for the YCu 4 and YCu 6 phases [81Cha], and calculated by [90Ita] for YCu 6, have not yet been determined quantitatively.
These facts motivated the present experimental investigation and the subsequent thermodynamic optimization of the Y-Cu system.
E x p e r i m e n t a l
E x p e r i m e n t a l Procedure
The DTA results in this study were obtained using pyrolytic boron nitride (PBN) crucibles, which had 6 mm length, 4 mm inner diameter, 1/2 mm thick wall, and 1/2 mm thick flat lid (Ringsdorff GmbH). The sample mass was NI80 mg, which was optimal for our study. The starting materials were Cu chips or rod (99.999 wt.% pure) and Y chips (99.9 wt.% pure). Yt- trium powder (99.9 wt.% pure) was used in the beginning of the study, hut this resulted in excessive Y loss.
The small Cu pieces were freshly cleaned in a 10% HCl solu- tion to remove the surface oxide, washed in methanol, rinsed in acetone, and dried. The Cu and Y were weighed in air (+0.1 mg) and for melting placed into a PBN crucible twice as long as a DTA crucible (the starting materials did not fit into the DTA crucible). The melting crucible was placed into a silica tube, a PBN lid and silica spacer were placed on top, and a small amount of Ti-getter was added. After repeatedly evacu- ating the sample to < 10 4 bar and flushing with argon, the silica
606 Journal of Phase Equilibria Vol. 15 No. 6 1994
Bas ic a n d Appl i ed R e s e a r c h : S e c t i o n I
tube was sealed and the Ti-getter was heated with the torch for several minutes to remove all the remaining oxygen from the gaseous phase. The sample was then isolated from the Ti-getter by sealing the silica tube. The samples were premelted at 1393 K for - L/2 h, water quenched, and annealed for approximately 12 h at 1123 K. The samples could be easily removed from the melting crucibles because they formed small spheres with di- ameters less than the crucible. The sample normally had a small amount of surface discoloration, which could be easily removed with fine SiC paper.
The samples for DTA analysis were placed into the smaller PBN crucible, which was held in an alumina support crucible with a hole in the bottom to allow direct contact between the thermocouple and the PBN crucible. A small Pt sphere was used as the DTA reference material and was placed in similar PBN and alumina crucibles. Then the DTA furnace was repeat- edly evacuated using a mechanical pump and refilled with ar- gon (99.998 wt.% pure). In order to reduce the amount of oxygen contamination, the argon was first passed through an oxygen titration unit. This unit consisted of a solid-state elec- trolyte tube (calcium-stabilized zirconia), which had Pt elec- trodes painted both inside and outside of the active zone of the tube. The active zone was held in a small furnace at 1073 K, and oxygen could be titrated out of the argon by placing a volt- age across the electrodes (0.8 to 1 V).
In order to calibrate the DTA system, pure Sb, Ag, Cu, and Au standards were analyzed using the same Pt reference, PBN, and alumina crucibles. The calibration offset, with respect to
the tabulated standard emf of Pt/Pt-Rh thermocouples, varied from 7 to 0 K among the different DTA sample holders used in the course of this study.
The DTA results were obtained using heating and cooling rates of 0.067 K/s and an argon flow rate of 0.83 mL/s. The reaction onset temperature was chosen as the intersection of the ex- trapolated baseline with the tangent drawn to the greatest slope of the leading edge of the DTA peak. Since the same analysis was used for the calibration standards, most side effects should be compensated.
In addition to the DTA analysis, powder XRD work was per- formed on several samples in the composition range 80 to 90 at.% Cu. The XRD samples were prepared in the same way as the DTA samples, except that they were annealed either at 1123 K for 7 days or at 973 K for 18 days (sample N21, which was made subsequent to the other samples, was for only 6 days). After annealing, the samples were milled to powder in a zir- conia ball mill and analyzed by a diffractometer using Cu-K~ radiation and a 2| step size of 0.04 ~
E x p e r i m e n t a l R e s u l t s
Numerous difficulties were encountered during the XRD and metallographic investigations. Initial work using bulk alloys (0.5 to 1 g) was often confusing and ambiguous. Satisfactory results were obtained using only very small spheres (180 mg), which were rapidly quenched after melting and annealed for long times at high temperatures.
1350 I I 1 1
1300.
1250
"- 1200
r
1150
1100 0.3
A h e a t i n g v c o o l i n g
1050
1000
I I I
.2 .3 .4 .5 .6 .7
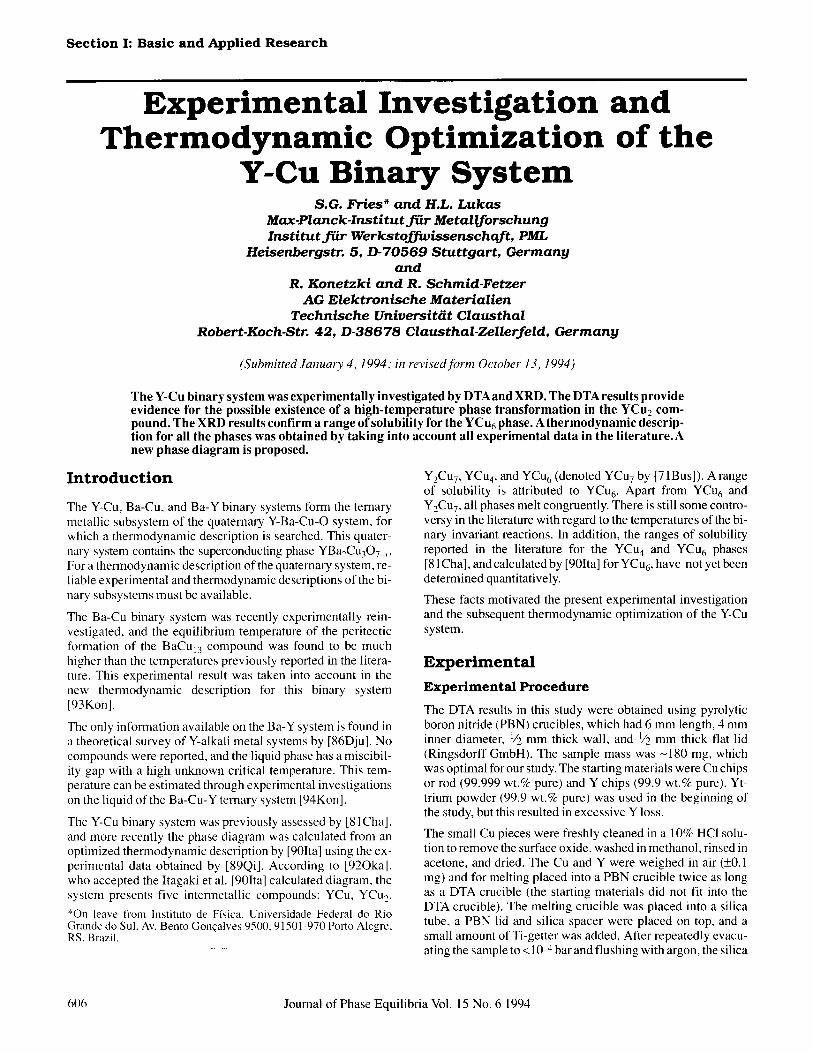
mole f r a c t i o n Cu Fig.1 DTA experimental results on heating and cooling, plotted in the Y-Cu phase diagram.
.8 .9 1.0
Cu
Journal of Phase Equilibria Vol. 15 No. 6 1994 607
S e c t i o n I: B a s i c a n d A p p l i e d R e s e a r c h
D i f f e r e n t i a l T h e r m a l A n a l y s i s
The DTA results obtained on heating and cooling are plotted in the calculated Y-Cu phase diagram in Fig. 1, where each data point is the average of several heating and cooling cycles. The invariant equilibrium temperatures obtained agree well with most of the experimental results from [89Qi]. However, since the mass of the samples used in this study was small (180 mg), a small loss of Y will have a significant impact on the sample composition. Therefore in the subsequent optimization, only the invariant equilibrium temperatures, but not the liquidus data, were used.
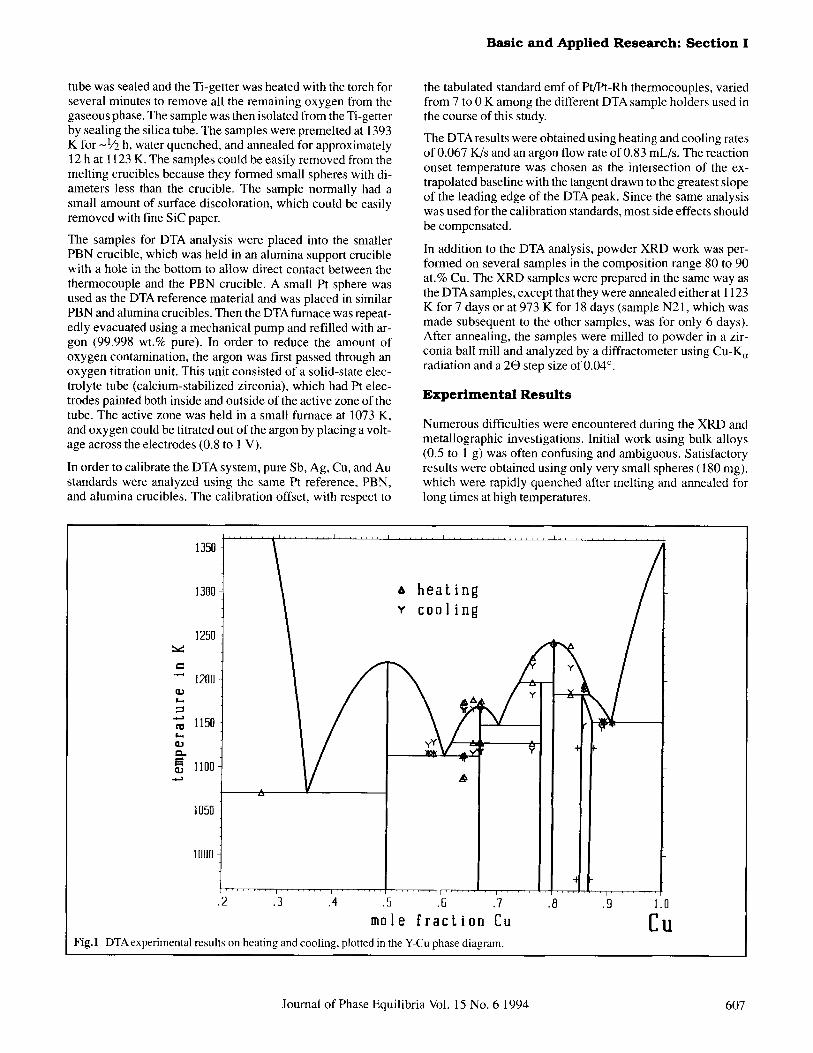
Examples of DTA heating and cooling curves obtained near the YCu: composition are shown in Fig. 2. The real compositions may be slightly shifted to the more Cu-rich side from the nomi- nal ones given in Fig. 2, but no corresponding quantitative data can be given.
X - R a y D i f f r a c t i o n
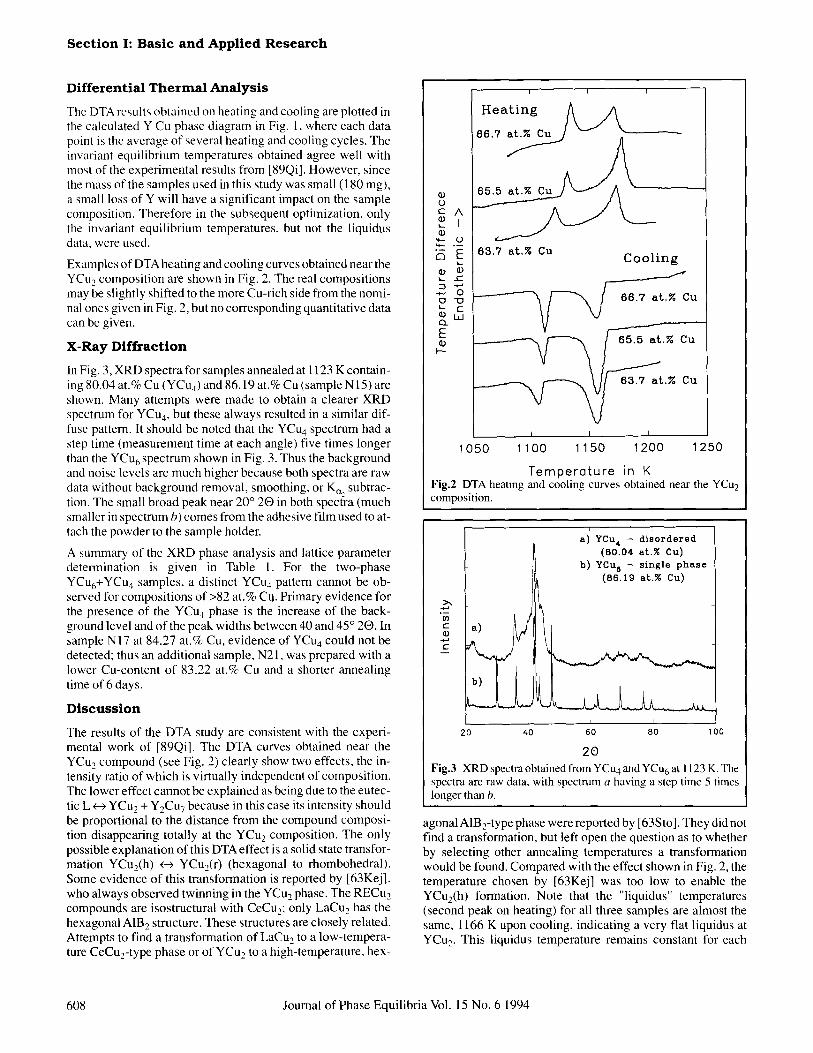
In Fig. 3, XRD spectra for samples annealed at 1123 K contain- ing 80.04 at.% Cu (YCu4) and 86.19 at.% Cu (sample N15) are shown. Many attempts were made to obtain a clearer XRD spectrum for Y C u 4, but these always resulted in a similar dif- fuse pattern. It should be noted that the Y C u 4 spectrum had a step time (measurement time at each angle) five times longer than the Y C u 6 spectrum shown in Fig. 3. Thus the background and noise levels are much higher because both spectra are raw data without background removal, smoothing, or Kc~ subtrac- tion. The small broad peak near 20 ~ 20 in both spectra (much smaller in spectrum b) comes from the adhesive film used to at- tach the powder to the sample holder.
A summary of the XRD phase analysis and lattice parameter determination is given in Table 1. For the two-phase YCu6+YCu 4 samples, a distinct Y C u 4 pattern cannot be ob- served for compositions of>82 at.% Cu. Primary evidence for the presence of the YCu4 phase is the increase of the back- ground level and of the peak widths between 40 and 45 ~ 20, In sample N17 at 84.27 at.% Cu, evidence of YCu 4 could not be detected; thus an additional sample, N21. was prepared with a lower Cu-content of 83.22 at.% Cu and a shorter annealing time of 6 days.
D i s c u s s i o n
The results of the DTA study are consistent with the experi- mental work of [89Qi]. The DTA curves obtained near the YCu 2 compound (see Fig. 2) clearly show two effects, the in- tensity ratio of which is virtually independent of composition. The lower effect cannot be explained as being due to the eutec- tic L ~ YCu2 + Y2Cu7 because in this case its intensity should be proportional to the distance from the compound composi- tion disappearing totally at the YCu2 composition. The only possible explanation of this DTA effect is a solid state transfor- mation YCu2(h) ~ YCu2(r) (hexagonal to rhombohedral). Some evidence of this transformation is reported by [63Kej], who always observed twinning in the YCu2 phase. The RECu 2 compounds are isostructural with CeCu2; only LaCu~ has the hexagonal A1B2 structure. These structures are closely related. Attempts to find a transformation of LaCu, to a low-tempera- ture CeCu2-type phase or of YCu2 to a high-temperature, hex-
I I I
"~ 63.7 at.N Cu C o o l i n g
�9 .
X"'
t.N Cu
I I I
1050 1100 1150 1200 1250
TemperGtu re in K Fig.2 DTA heating and cooling curves obtained near the YCu 2 composition.
t
' a) YCu 4 - d i s o r d e r e d (80.04 a t .~ C u )
II b) YCu 0 - s ing le p h a s e I ~ (86.19 a t .Z Cu)
11\
I I I
20 40 60 80 1 O0
2O Fig.3 XRD spectra obtained from YCu 4 and YCu 6 at 1123 K. The spectra are raw data, with spectrum a having a step time 5 times longer than b.
agonal A1B2-type phase were reported by [63Sto]. They did not find a transformation, but left open the question as to whether by selecting other annealing temperatures a transformation would be found. Compared with the effect shown in Fig. 2, the temperature chosen by [63Kej] was too low to enable the YCu2(h) formation. Note that the "liquidus" temperatures (second peak on heating) for all three samples are almost the same, 1166 K upon cooling, indicating a very flat liquidus at YCu2. This liquidus temperature remains constant for each
608 Journal of Phase Equilibria Vol. 15 No. 6 1994
Basic and Applied Research: S e c t i o n I
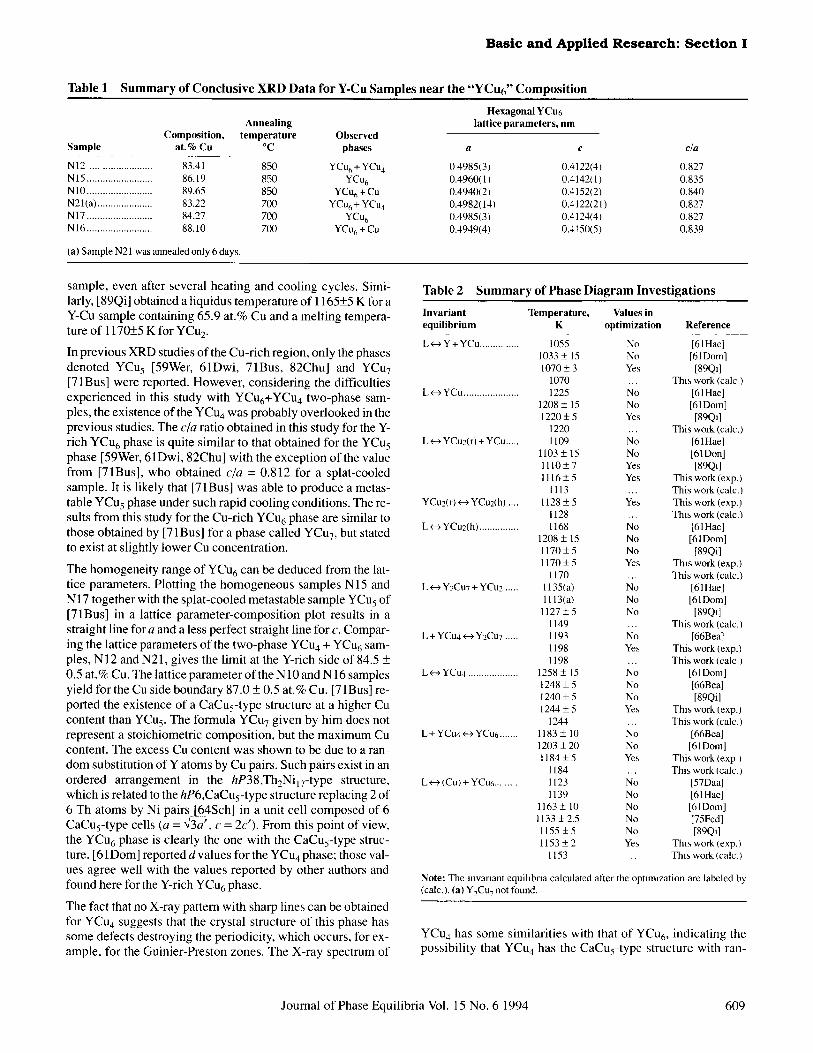
Table I Summary of Conclusive XRD Data for Y-Cu Samples near the "YCu6" Composition
Annealing Composition, temperature Observed
Sample at.% Cu ~ phases a
N12 ....................... 83.41 8,50 YCu6+ YCu 4 0 4 9 8 5 ( 3 ) N 15 ......................... 86.19 850 YCu 6 0.4960( 1 ) N 10 ......................... 89.65 850 YCu 6 + Cu 0.4940(2/ N21(a) ..................... 83.22 700 YCu6+ YCu 4 0.4982(14) N17 ......................... 84.27 700 YCu 6 0.4985(3) N I 6 ......................... 88.10 700 Y C u 6 + C u 0.4949(4)
[a) Sample N21 was annealed only 6 days.
Hexagonal YCu6 lattice parameters, nm
c c/a
0.4122(4) 0.827 0.414211) 0.835 0.4152(2) 0 .840 0.4122(21) 0.827 0.4124(4) 0.827 0.4150(5) 0.839
sample, even after several heating and cooling cycles. Simi- larly, [89Qi] obtained a tiquidus temperature of 1165+5 K for a Y-Cu sample containing 65.9 at.% Cu and a melting tempera- ture of 1170+5 K for YCu 2.
In previous XRD studies of the Cu-rich region, only the phases denoted YCu 5 [59Wer, 61Dwi, 71Bus, 82Chu] and Y C u 7
[71 Bus] were reported. However, considering the difficulties experienced in this study with YCu6+YCu 4 two-phase sam- ples, the existence of the YCu 4 was probably overlooked in the previous studies. The c/a ratio obtained in this study for the Y- rich YCu 6 phase is quite similar to that obtained for the YCu 5 phase [59Wer, 61Dwi, 82Chu] with the exception of the value from [71Bus], who obtained c/a = 0.812 for a splat-cooled sample, it is likely that [71Bus] was able to produce a metas- table YCu 5 phase under such rapid cooling conditions. The re- sults from this study for the Cu-rich YCu 6 phase are similar to those obtained by [71Bus] for a phase called YCu 7, but stated to exist at slightly lower Cu concentration.
The homogeneity range of YCu 6 can be deduced from the lat- tice parameters. Plotting the homogeneous samples N15 and N 17 together with the splat-cooled metastable sample YCu5 of [71Bus] in a lattice parameter-composition plot results in a straight line for a and a less perfect straight line for c. Compar- ing the lattice parameters of the two-phase Y C u 4 + YCu 6 sam- ples, N12 and N21, gives the limit at the Y-rich side of 84.5 _+ 0.5 at.% Cu. The lattice parameter of the N 10 and N 16 samples yield for the Cu side boundary 87.0 _+ 0.5 at.% Cu. [71Bus] re- ported the existence of a CaCus-type structure at a higher Cu content than YCu 5. The formula YCu 7 given by him does not represent a stoichiometric composition, but the maximum Cu content. The excess Cu content was shown to be due to a ran- dom substitution of Y atoms by Cu pairs. Such pairs exist in an ordered arrangement in the hP38,Th2NilT-type structure, which is related to the hP6,CaCus-type structure replacing 2 of 6 Th atoms by Ni pairs [64Sch] in a unit cell composed of 6 CaCus-type cells (a = ~ ' c = 2c'). From this point of view, the YCu 6 phase is clearly the one with the CaCus-type struc- ture. [61Dom] reported d values for the YCu 4 phase; those val- ues agree well with the values reported by other authors and found here for the Y-rich Y C u 6 phase.
The fact that no X-ray pattern with sharp lines can be obtained for Y C u 4 suggests that the crystal structure of this phase has some defects destroying the periodicity, which occurs, for ex- ample, for the Guinier-Preston zones. The X-ray spectrum of
Table 2 Summary of Phase Diagram Investigations
Invariant Temperature, Values in equilibrium K optimization Reference
L ~ Y + YCu .............. 1055 No [6 IHae] 1033 _+ 15 No [61Dom] 1070 _+ 3 Yes [89Q1]
1070 ... Thts work (ca lc ) L <---> YCu ..................... 1225 No [61Hae]
1208 _+ 15 No [61Dom] 1220 _+ 5 Yes [89Q1]
1220 ... This work (calc.) L <--> YCu2(r) + YCu ..... 1109 No [61Hae]
1103 + 15 No [61Don] 1110 _+ 7 Yes [89Q1] 1116 _+ 5 Yes This work (exp.)
1113 ... This work (calc.) YCu2(r) <---> YCu2(h) .... 1128 _+ 5 Yes This work (exp.)
1128 ... This work (calc.) L ~ YCu2(h) ............... 1168 No [61Hae]
1208 _+ 15 No [61Dom] 1170 _+ 5 No [89Qi] 1170 + 5 Yes Tbls work (exp.)
1170 ... This work (calc.) L <---> Y2Cu7 + YCu2 ..... 1135(a) No [61Hae]
1113(a) No [61Dom] 1127 -+ 5 No [89Q1]
1149 ... This work (calc.) L + YCu4 ~ Y2Cu7 ..... 1193 No [66Bea]
1198 Yes This work (exp.) 1198 ... This work (ca lc )
L<---~ YCu4 ................... 1258 + 15 No [61Dom] 1248 _+ 5 No [66Bea] 1240 _+ 5 No [89Qi] 1244 +_ 5 Yes This work (exp.)
1244 ... This work (calc.) L + YCu4,*--> YCu6 ....... 1183 _+ 10 No [66Bea]
1203 + 20 No [61Dora] 1184 _+ 5 Yes This work ( exp)
1184 ... This work (calc.) L <---> t Cu) + YCu6 . . . . . . . 1123 No [57Daa]
1139 No [61Hae] 1163 _+ 10 No [6 IDom] I 133 -+ 2.5 No [75Fed] 1155 -+ 5 No [89Qi] 1153 _+ 2 Yes This work lexp./
1153 This work (calc.)
Note: The mvarlant equihbrla calculated after the optlmLzation are labeled by (calc.). (a) Y2Cu7 not found.
Y C u 4 has some similarities with that of Y C u 6, indicating the possibility that Y C u 4 has the CaCus-type structure with ran-
Journal of Phase Equilibria Vol. 15 No. 6 1994 609
S e c t i o n I: B a s i c a n d A p p l i e d R e s e a r c h
Table 3 Summary of the Thermodynamic Experimental Investigations
Experimental Reference method Function
[84War] ...... . . . . . . . Reaction calomnetry Enthalpy of mixing Drop calorimetry Enthalpy of formanon
[89Qd ....................... Drop calorimetry Heat content [89Yah] ................... Electromotive force ~y
Cu m u l e Temperature, Values in fraction K optimization
0 to 0.80 1373 Yes 0.50 1373 Yes
0.6667 1373 Yes 0.80 1373 Yes
0.33 to 0.907 850to 1300 Yes 0.6667 973 to 1103 No 0�9 973 to 1103 No 0.85 973 to 1103 No 100 973 to 1103 No
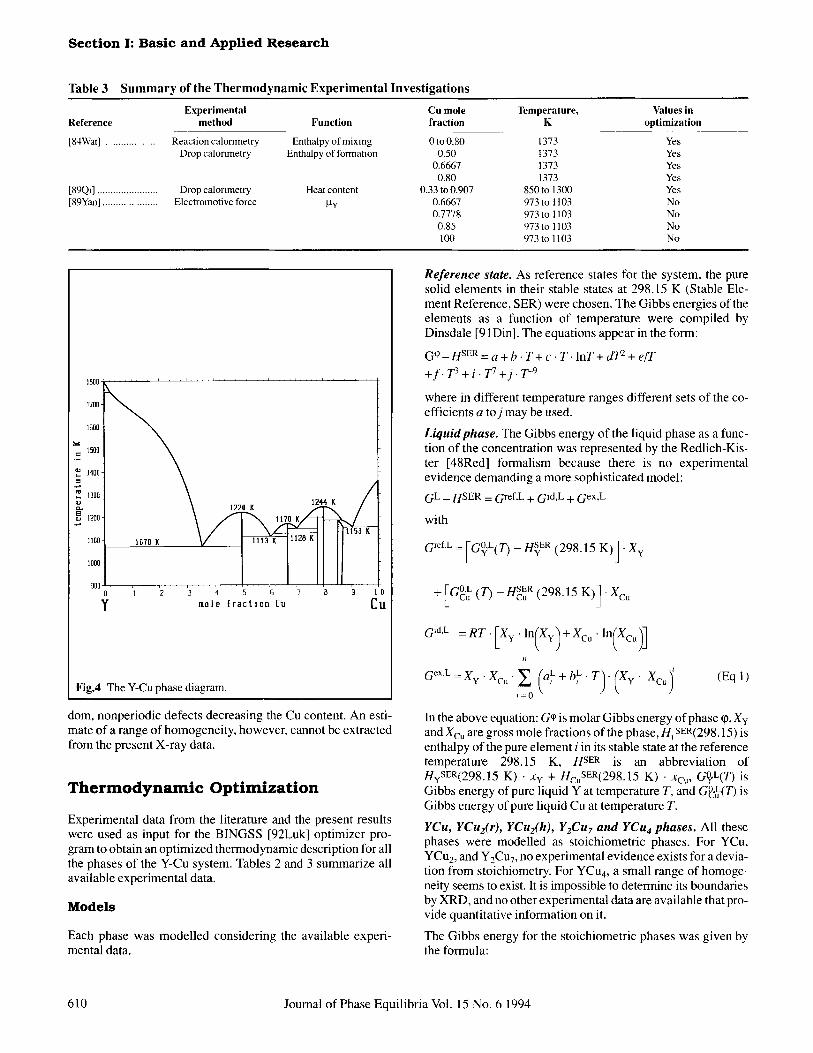
IBOO < ~ . . . . ' . . . . ~ . . . . ' . . . . ' . . . . ' . . . . ' . . . . ' . . . . ~ . . . .
1 7 0 0 - ~
1 0 0 0 ~
.~ 15oo~
1300 ~ 1220 K 1244 K
1200 1170 g ]
l l O 0 1 0 7 0 K
I I H 900 , , , . . , v , , ,
1 2 3 4 fi 6 7 8
y mole fraction C~ 0
Cu
Fig.4 The Y-Cu phase diagram.
dora, nonperiodic defects decreasing the Cu content�9 An esti- mate of a range of homogeneity, however, cannot be extracted from the present X-ray data.
Thermodynamic Optimization
Experimental data from the literature and the present results were used as input for the BINGSS [92Luk] optimizer pro- gram to obtain an optimized thermodynamic description for all the phases of the Y-Cu system. Tables 2 and 3 summarize all available experimental data.
M o d e l s
Each phase was modelled considering the available experi- mental data.
Reference state. As reference states for the system, the pure solid elements in their stable states at 298.15 K (Stable Ele- ment Reference, SER) were chosen. The Gibbs energies of the elements as a function of temperature were compiled by Dinsdale [91 Din]. The equations appear in the form:
G ~ - H sER = a + b. T + c�9 T. lnT + dT z + e/T
+ f . T3 + i . T7 + j . T -9
where in different temperature ranges different sets of the co- efficients a to j may be used.
Liqu id phase. The Gibbs energy of the liquid phase as a func- tion of the concentration was represented by the Redlich-Kis- ter [48Red] formalism because there is no experimental evidence demanding a more sophisticated model:
G L _ HSER = Gref,L + Gld,L + Gex, L
with
G~ef'c = [G~C(/~ - H sER (298.15 K)] - Xy
[-G ~ H SER (298.15 +L c. c. K) l -xc .
G m'L = R T . I X Y �9 l n (Xy)+Xcu , ln/Xcu)l
�9 �9 Xy - Xcu ' )
In the above equation: G~ 0 is molar Gibbs energy of phase q), Xy and Xcu are gross mole fractions of the phase, H, SER(298.15) is enthalpy of the pure element i in its stable state at the reference temperature 298.15 K, H SER is an abbreviation of HMSER(298.15 K) - Xy + HcuSER(298.15 K) - Xcu, G~L(T) is Gibbs energy of pure liquid Y at temperature T, and G ~ ( T ) is Gibbs energy of pure liquid Cu at temperature T.
YCu, YCuz(r) , YCu2(h), Y2Cu7 and YCu 4 phases. All these phases were modelled as stoichiometric phases. For YCu, YCu 2, and Y2Cu7, no experimental evidence exists for a devia- tion from stoichiometry. For YCu 4, a small range of homoge- neity seems to exist. It is impossible to determine its boundaries by XRD, and no other experimental data are available that pro- vide quantitative information on it.
The Gibbs energy for the stoichiometric phases was given by the formula:
610 Journal of Phase Equilibria Vol. 15 No. 6 1994
B a s i c a n d A p p l i e d R e s e a r c h : S e c t i o n I
Table 4 Parameter Set for the Y-Cu System
Phase Model P a r a m e t e r a v, J /moi by, J /mol
L~quid . . . . . Redlich-Kister L~,cuL'0 - 8 8 958.06 21.56669
E L I 33 607.31 -3 .10462 g, Cu L 2 8 083.16 ~3.74669
I 4 : c u cph ............ Redlich-Klster I cph,0 (0) (80.0000)
~'Y, Cu bcc ............ Redlich-Klster 1 bcc,0 10) (80.0000)
"-'Y, Cu fcc ............. Redhch-Kls ter 1 fcc,0 /0) (80.0000)
L'Y, Cu YCu . . . . . . . S toichiometnc (7.YCu _ ((7,cp h --I- r - 4 4 616.68 4 12162
YCu2(r) ..... Stolchiometric GYCu2(r) - ( G ~ h + 2 . ~fcca m5 324.22 6.03462 " J C u ]
YCu2(h/ .... Stnichiometric a Y C u : (h) - ( a ~ p h + 2 . a ~ c) -51 788.22 -5 .96538
Y2Cu7(r) .... Stoichiometric aY, ,C u 7 - ( 2 �9 @ h + 7 - UCuJt'7"fcc~ - 168 519.60 15.56757
YCu4 . . . . . . Stolchlnmetric a Y c u 4 - ( G ~ h + 4 " '-'Cup~fcc'~ - 8 9 328.50 8.25205
YCu6 Wagner-Schottky (Y.Cue)Cu 5 YC - c h . . . . . . G y . c ~ ( G ~ + 5 - G ~ - 8 9 797.58 8.29539
G Y C u , _ 7 /'2_fcc (35 000.0) (0) Cu~'Uu " '--' Cu
L~,C-u6,0 - 3 4 386 27 21.56669 Cuz'Cu
One mole means one mole of formula units for the mtermedtate compounds and one mole of a toms for the hquid phase and the solid elements. Coefficients shown m
parentheses are estimated and were not optimized. The parameter 0 + 80 T expresses negligible solid solubihty of the terminal Y and Cu phases.
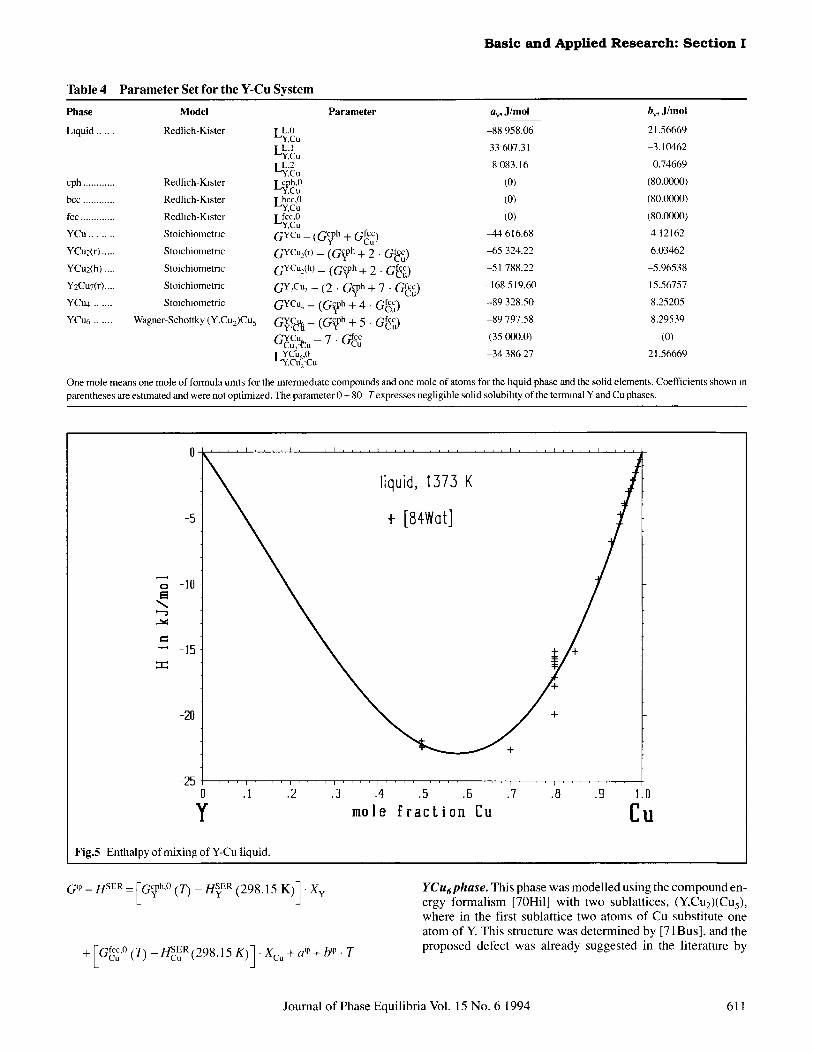
I . . . . I . . . . ~ . . . . I . . . . t . . . . I . . . . I . . . . i . . . .
l ~ liquid, 137,3 K 5 + [84War]
,-, -10
e~
"- -15 .-r"
+
-25 1 . . . . 0
Y
i . . . . J . . . . i
.1 .2 .3
+
. . . . I . . . . I . . . . I . . . . I . . . . I . . . . I . . . . I
.4 .5 .6 .7 .8 .9 1.0
mole fraction Cu Co
Fig.5 Enthalpy of mixing of Y-Cu liquid.
G ' # - H S E R = IG~ph'0 (T) - H sER (298.15 K ) I . X v
I H~ER(298.15 K ) I . Xcu + am +bm �9 T + GcfC~ '~ - cu
YCu6phase. This phase was modelled using the compound en- ergy formalism [70Hil] with two sublattices, (Y, Cu2)(Cus), where in the first sublattice two atoms of Cu substitute one atom of Y. This structure was determined by [71Bus], and the proposed defect was already suggested in the literature by
Journal of Phase Equilibria Vol. 15 No. 6 1994 611
S e c t i o n I: Bas ic and Appl ied Research
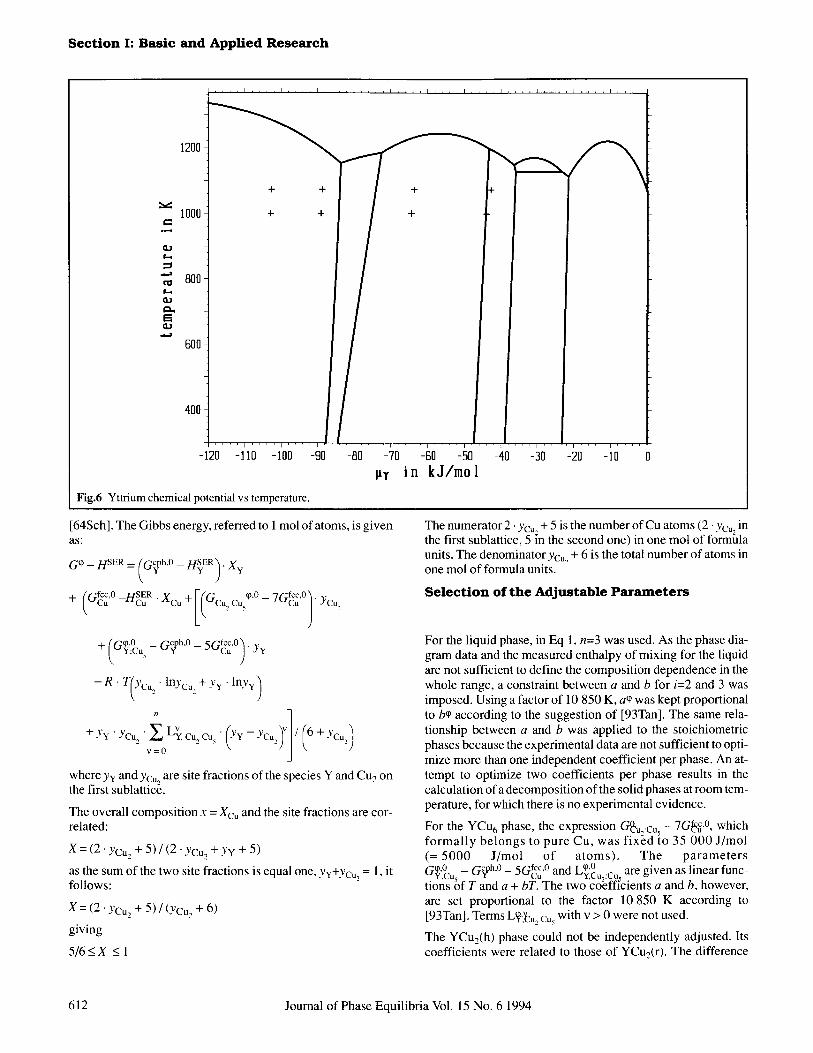
1200
~
O,a
OJ
E a,J
1000
800
600
+ +
+ +
+
+
400
-120 -110 -100 -90 -80 -70
gr
Fig.6 Yttrium chemical potential vs temperature.
-60 -50 -40 -30 -20 -10 0
in k J / m o 1
[64Sch]. The Gibbs energy, referred to 1 mol of atoms, is given a s :
? / + ~vCu Cu 'Xcu + c % c % ' - T a c u ' 'Yc%
['f'7.q~,O _ (~cph,O _ 5 a f c c , 0 " ~ . y y + ~ v Y : C u 5 u y Cu )
+ R " T(Ycu2 " InYcuz+ Yy " l n y y )
. y, Cu 2 Cu 5 y - - YCu 2 / 6 + Y c u 2
v = 0
where YY and Ycu~ are site fractions of the species Y and Cu2 on the first sublattic~.
The overall composit ion x = Xc~ and the site fractions are cor- related:
X = ( 2 .Ycu 2 + 5 ) / ( 2 .),Cu e + y y + 5)
as the sum of the two site fractions is equal one, YY+YCu, = 1, it follows:
X = (2. Ycu 2 + 5) / (Ycu 2 + 6)
giving
5 / 6 < X < 1
The numerator 2. Ycu,+ 5 is the number of Cu atoms (2. Ycu~ in the first sublattice, 5 in the second one) in one mot of formula units. The denominator Yc, + 6 is the total number of atoms in
2 one mol of formula units.
S e l e c t i o n of the Adjustable Parameters
For the liquid phase, in Eq 1, n=3 was used. As the phase dia- gram data and the measured enthalpy of mixing for the liquid are not sufficient to define the composit ion dependence in the whole range, a constraint between a and b for i=2 and 3 was imposed. Using a factor of 10 850 K, a~ was kept proportional to b~ according to the suggestion of [93Tan]. The same rela- tionship between a and b was applied to the stoichiometric phases because the experimental data are not sufficient to opti- mize more than one independent coefficient per phase. An at- tempt to optimize two coefficients per phase results in the calculation of a decomposit ion of the solid phases at room tem- perature, for which there is no experimental evidence.
For the Y C u 6 phase, the expression G~u .Cu 5 - 7 G ~ .~ which f o r m a l l y b e l o n g s to pu re Cu, was f i x e d to 35 000 J /mol (= 5000 J /mol o f a t oms ) . The p a r a m e t e r s
0 c h 0 f c c 0 cp0 G~' Cu - G ~ �9 - 5Gcu' and Ly'cu .Cu are given as linear func- �9 ' 5 ' 2" .5 .
tlons of T and a + bT. The two coefficients a and b, however, are set proportional to the factor 10 850 K according to [93Tan]. Terms L~.~,, cu 5 with v > 0 were not used.
The YCu2(h) phase could not be independently adjusted. Its coefficients were related to those of YCu2(r). The difference
612 Journal of Phase Equilibria Vol. 15 No. 6 1994
Basic and Applied Research: S e c t i o n I
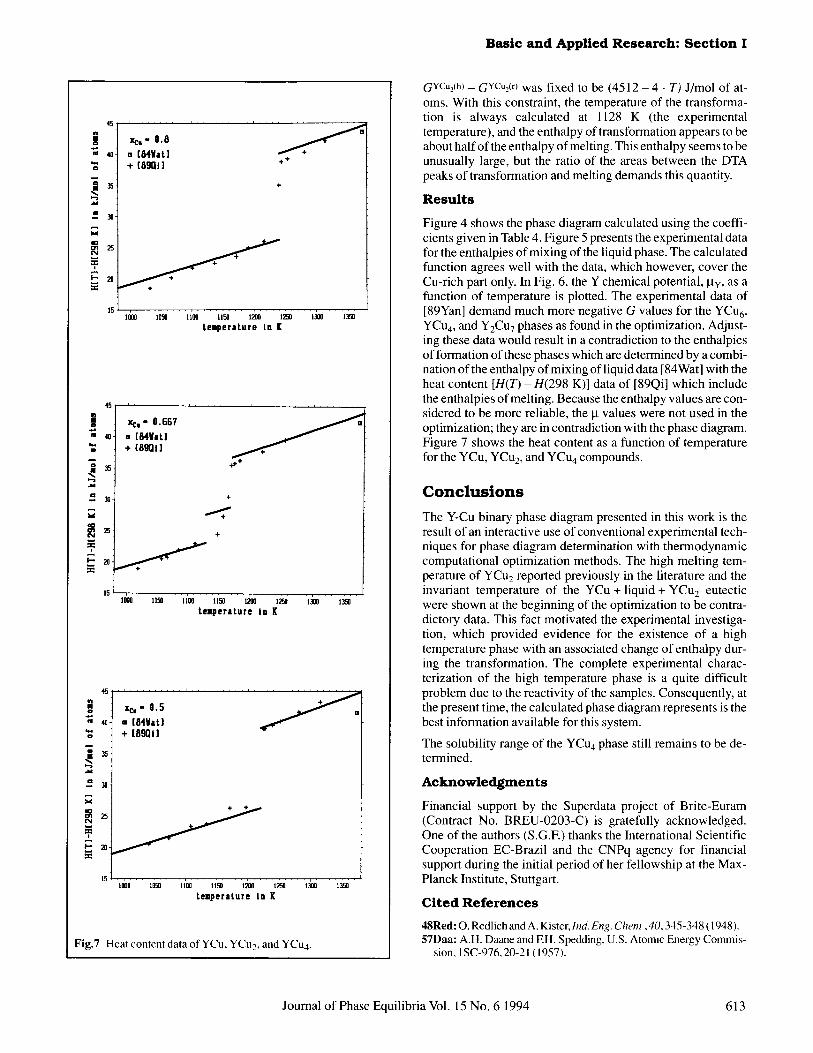
1 + [89QI1 ]*
\ . . . . . . . 1000 1050 |IOC 1150 1200 1250 1300 1~0
temperature iu [
J m 4C
m
D
G
15
, i . . . . . . . i . . . . i . . . . i , , ,
Xc.- 0.667
a [84u + [8901]
I000 1050 IIO0 1150 1200 1250 1300 1350
temperature In K
45
"d
-.= 3o
25
20 ..p.
xc. - 0.5 a [84u + [890i]
1000 1050 I100 1150 1200 12fi0 1300 1350
temperature In K
Fig.7 Heat content data of YCu, YCu2, and YCu 4.
GYCu2(h) - GYCu2 (r) was fixed to be (4512 - 4 �9 T) J/mol of at- oms. With this constraint, the temperature of the transforma- tion is always calculated at 1128 K (the experimental temperature), and the enthalpy of transformation appears to be about half of the enthalpy of melting. This enthalpy seems to be unusually large, but the ratio of the areas between the DTA peaks of transformation and melting demands this quantity.
Resul t s
Figure 4 shows the phase diagram calculated using the coeffi- cients given in Table 4. Figure 5 presents the experimental data for the enthalpies of mixing of the liquid phase. The calculated function agrees well with the data, which however, cover the Cu-rich part only. In Fig. 6, the Y chemical potential, ~ty, as a function of temperature is plotted. The experimental data of [89Yan] demand much more negative G values for the YCu 6, YCu4, and Y2Cu7 phases as found in the optimization. Adjust- ing these data would result in a contradiction to the enthalpies of formation of these phases which are determined by a combi- nation of the enthalpy of mixing of liquid data [84Wat] with the heat content [H(T) - H(298 K)] data of [89Qi] which include the enthalpies of melting. Because the enthalpy values are con- sidered to be more reliable, the g values were not used in the optimization; they are in contradiction with the phase diagram. Figure 7 shows the heat content as a function of temperature for the YCu, YCu 2, and YCu 4 compounds.
C o n c l u s i o n s
The Y-Cu binary phase diagram presented in this work is the result of an interactive use of conventional experimental tech- niques for phase diagram determination with thermodynamic computational optimization methods. The high melting tem- perature of YCu2 reported previously in the literature and the invariant temperature of the YCu + liquid + YCu 2 eutectic were shown at the beginning of the optimization to be contra- dictory data. This fact motivated the experimental investiga- tion, which provided evidence for the existence of a high temperature phase with an associated change of enthalpy dur- ing the transformation. The complete experimental charac- terization of the high temperature phase is a quite difficult problem due to the reactivity of the samples. Consequently, at the present time, the calculated phase diagram represents is the best information available for this system.
The solubility range of the YCu 4 phase still remains to be de- termined.
A c k n o w l e d g m e n t s
Financial support by the Superdata project of Brite-Euram (Contract No. BREU-0203-C) is gratefully acknowledged. One of the authors (S.G.F.) thanks the International Scientific Cooperation EC-Brazil and the CNPq agency for financial support during the initial period of her fellowship at the Max- Planck Institute, Stuttgart.
Cited References
48Red: O. Redlich and A. Kister, Ind. Eng. Chum, 40,345-348 (1948). 57Daa: A.H. Daane and EH. Spedding. U.S. Atomic Energy Commis-
sion, 1 SC-976, 20-21 (1957).
Journal of Phase Equilibria Vol. 15 No. 6 1994 613
S e c t i o n I: B a s i c a n d A p p l i e d R e s e a r c h
59Wet: J.H. Wemick and S. Geller, Acta Crvstallogr., 12, 662-665 (1959).
61Dwi: A.E. Dwight, Metall. Trans. ASM, 53,479-500 ( 1961 ). 61Dora: R.E Domagala, J.J. Rausch, and D.W Levinson, Metall.Trans.
ASM,53, 137-155 (1961). 61Hae: J. Haeflmg and A.H. Daane, unpublished data; quoted by C.E.
Lundin, The Rare Earths, F.H. Spedding and A.H. Daane, Ed., John Wiley & Sons, Inc., NY, 252-254 (1961 ).
63Kej: P.K. Kej riwal and E. Ryba, A eta 03'stallogr, 16, 853 ( 1963 ). 63Sto: A.R. Storm and K.E. Benson,Acta Crystollogr, 16, 701 (1963). 64Sch: K. Schubert, Kristallstrukturen :wed,omponentiger Phasen,
Springer-Verlag, Berlin, 165 (1964) in German. (~iBea: B.J. Beaudry, unpublished results; quoted by [81Cha]. 70HiI: M. Hillert and L.-I. Staffansson, Acta Chem. Stand., 24, 3618-
3626 (1970). 71Bus: K.H.J. Buschow and A.S. Van Der Goot, Acta Oystallogr. B, 2 7,
1085-1088(1971). 75Fed: V.N. Fedorov, A.A. Zhurba, Russ. Metall., No. 1, 137-140
(1975). 81Cha: D.J. Chakrabarti and D.E. Laughlin, Bull. Alloy Phase Dia-
grams,2(3),315-319(1981).
82Chu: Y.C. Chuang, C.H. Wu, and Y.C. Chang,J Less-Common Met., 84,201-213 (1982).
84Wat: S. Watanabe and O.J. Kleppa, Metall Trans. B, 15, 357-368 (1984).
86Dju: T.D. Djuraev and R.A. Altynaev, Dokl. Akad. Nauk Tadzh. SSR, 29, 472 (1986).
89Qi: G. Qi, K. Itagaki, and A. Yazawa, Mater Trans. JIM, 30, 273-282 (1989).
89Yan: Q. Yang, G. Liu, and Z. Liu, Acta Metall Sin., 25, 250-254 (1989).
90Ita: K. Itagaki, G. Qi, S. an Mey, and P.J. Spencer, Calphad, 14,377- 384 (1990).
91Din: A.T. Dinsdale, Calphad, 15(4), 317-432 ( 1991). 92Oka: H. Okamoto,J. Phase Equlhbria, 13( 1 ), 102-103 (1992). 92Luk: H.L. Lukas and S.G. Fries, J. Phase Equthbria, 13(5), 532-541
(1992). 93Kon: R. Konetzki, R. Schmid-Fetzer, A. Watson, B. Argent, S.G.
Fries, and H.L. Lukas,Z. Metallkd., 84,569-573 (1993). 93Tan: T. Tanaka, N.A. Goksen, Z. Morita, and T. Iida, Z. Metallkd., 84,
192-200 (1993). 94Kon: R. Konetzki, R. Schmid-Fetzer, S.G. Fries, and H.L. Lukas, Z.
Metallkd., 85(11 ) (1994) m press.
614 Journal of Phase Equilibria Vol. 15 No. 6 1994