Embed Size (px)
Citation preview
Fuel 182 (2016) 391–401
Contents lists available at ScienceDirect
Fuel
journal homepage: www.elsevier .com/locate / fuel
Full Length Article
Experimental investigation on the effect of n-butanol blending on spraycharacteristics of soybean biodiesel in a common-rail fuel injectionsystem
http://dx.doi.org/10.1016/j.fuel.2016.05.1090016-2361/� 2016 Elsevier Ltd. All rights reserved.
⇑ Corresponding authors.E-mail addresses: [email protected] (C. Tang), zhhuang@mail.
xjtu.edu.cn (Z. Huang).
Jun Mo, Chenglong Tang ⇑, Junge Li, Li Guan, Zuohua Huang ⇑State Key Laboratory of Multiphase Flow in Power Engineering, Xi’an Jiaotong University, Xi’an 710049, People’s Republic of China
h i g h l i g h t s
� We investigate the spray characteristics of soybean biodiesel with/without butanol blending.� The total droplet number slightly decreases from the spray center line to the spray periphery while butanol blending makes the droplets more evenlydistributed.
� Butanol addition leads to smaller Sauter Mean Diameter due to reduced viscosity and lower surface tension.
a r t i c l e i n f o
Article history:Received 15 March 2016Received in revised form 20 May 2016Accepted 22 May 2016Available online 3 June 2016
Keywords:Soybean biodieseln-ButanolSpray penetrationSpray cone angleDroplet size/number distribution
a b s t r a c t
In this work, the spray and atomization characteristics of neat soybean biodiesel fuel (BD100) and biodie-sel/n-butanol blends (BDB80, 20% of n-butanol (wt.)), were investigated at room temperature and ambi-ent pressure of 1 and 2 MPa. A high-pressure common-rail injection system was used to generate spraysfrom an injector (aperture 0.25 mm) at a maximum injection pressure of 100 MPa. High speed schlierentechnique was used to record the highly transient spray penetration process, through which the spraymacroscopic parameters such as spray tip penetration, spray cone angle, projected spray area and sprayvolume were deduced. In addition, droplet size, number density and its sauter mean values at specificlocation within the spray cone was analyzed, by using a particle/droplet image analyzing technique(PDIA). Results show that longer spray tip penetration and larger droplet diameters were observed forBD100, compared with BDB80, which was attributed to the lower viscosity and surface tension ofBDB80. BDB80 has a spray volume less than BD100, the same trend is also observed in the spray tip pen-etration. BD100 presents bigger spray area than BDB80 under 1 MPa ambient pressure. This is mainlyattributed to the bigger spray tip penetration of BD100. The results also show that droplets at the sprayperiphery have larger diameters than those in the center of the spray due to the effect of air entrainmentat the spray periphery. The small particles of fuels are easily sucked into internal of spray. Furthermore,the droplets near the liquid core of spray have more small numbers, where the effect of viscosity isdominant.
� 2016 Elsevier Ltd. All rights reserved.
1. Introduction
Fossil fuels such as natural gas, petroleum and coal have beenmeeting most industrial and commercial demands for relativelylow cost, high energy density, transportable fuels for decades.However, being the main source of transportation fuels, petroleumis estimated to be running out within 50 years due to the limited
storage under the stratum [1]. Because of the increasing fuel costand stringent emissions, Biofuels, such as alcohols, DME, and bio-diesel [2–6], have become an increasing attractive, efficient andless expensive fuels compared to gasoline. All these biofuels canbe renewable resources instead of fossil feedstock.
As an alternative fuel, biodiesel has many similar or betterproperties than diesel fuel, such as cetane number, non-toxic,biodegradable and good inherent lubricity, which make it moresuitable for diesel engines. Biodiesel fuels can be produced fromvarious feedstocks. Some of them, especially soybean derivedbiodiesel fuels, have attracted attention due to its higher potential

Table 1Physical properties of test fuels.
Fuel Density (kg/m3) (40 �C)
Kinematic viscosity(mm2/s) (40 �C)
Surfacetension(mN/m)
Biodiesel 871.853 5.288 29.2320% n-Butanol of
biodiesel blend854.665 3.870 29.16
n-Butanol 809.8 3.64 24.6
392 J. Mo et al. / Fuel 182 (2016) 391–401
for a renewable source. Since soybean is more abundant in most ofdeveloped countries and oil derivation can be up to 20% by weight,its prices are generally more reasonable than the other feedstocks.Thus, soybean oil has become the main favorable feedstock for bio-diesel fuel production. Mohamed et al. [7] conducted an experi-mental and theoretical study on a single cylinder, direct injectiondiesel engine fueled with different blends of soybean methyl ester(SME) and No. 2 diesel fuel. It was reported that the use of biodieselproduced lower smoke with a 14.65% higher brake fuel specificconsumption (BSFC) compared to diesel fuel. The measured COemissions of B20% SME and B100% SME were found to be 11.36%and 41.7% lower than that of diesel fuel respectively. All blendsof SME were found to emit significantly lower UHC concentrationcompared to that of diesel over the entire load range. NOx emis-sions were observed to be higher for all blends of SME. Özeneret al. [8] investigated the effect of soybean biodiesel addition onthe engine combustion, performance and emissions. The resultsshowed that when biodiesel was added, the brake torque wasreduced by 1–4% and BSFC increased by 2–9% with the increaseof the biodiesel blended ratio, when compared with diesel fuel.Furthermore, CO and HC emissions were found to be 28% and46% lower but it was observed that NOx and CO2 emissionsincreased by 17.62% and 5.03%, respectively. Their combustionanalyses showed that the biodiesel addition to diesel resulted inthe decrease of the ignition delay and the peak pressure of the pre-mixed combustion.
As a biomass-based renewable fuel, n-butanol has many advan-tageous properties, such as better miscibility in diesel, higherenergy content and higher cetane number. These properties, makebutanol an attractive alternative fuel or blending component todiesel fuel compared with other alcohols, such as methanol andethanol. Recently, some investigations have been carried out onthe combustion and emission characteristics about n-butanol/biodiesel blends. Specifically Tüccar et al. [9] studied the engineperformance and exhaust emissions of diesel–microalgae biodie-sel(MB)–butanol blends on a four-cylinder diesel engine. Theirresults showed that the power and torque output of enginereduced slightly when butanol was added to the diesel–MB blends.CO and NOx emission and smoke opacity values decreased with theaddition of butanol. Rakopoulos [10] studied the combustion andemissions of cottonseed oil and its biodiesel in blends with n-butanol or diethyl ether in high-speed direct injection (HSDI) die-sel engine. Their results showed that the tested blended fuels pro-duced lower smoke, NOx and CO emission but higher HC emissionthan neat biodiesel. The BSFC decreases with the usage of thesefuel blends, compared with the neat biodiesel, and the correspond-ing brake thermal efficiencies increase. Yilmaz et al. [11] studiedthe effect of butanol–biodiesel blends on the emissions and perfor-mance characteristics using an indirect-injection diesel engine.Their results showed that butanol blended fuels produced lowerNOx emissions and higher CO and HC emissions than neat biodie-sel. Furthermore, butanol blended fuels produced lower CO andhigher NOx emissions than diesel fuel for low concentrations ofbutanol (5% and 10%), but there was no significant change in termsof HC emissions. The biodiesel blend with the highest concentra-tion of butanol (20%) produced higher CO and HC emissions butlower NOx emission than diesel.
It is well known that fuel spray characteristics and atomizationhave an important effect on combustion process and final engineperformance and emission. In some studies, the experimentaland numerical investigation on spray atomization characteristicsof biodiesel fuel have been conducted [12–20]. Park et al. [14]investigated the spray atomization characteristics of soybean oilmethyl ester (SME) compared with that of diesel fuel in a dieselengine. Their results showed that the spray tip penetration of bio-diesel fuel had almost similar behavior pattern compared with that
of diesel fuel at various experimental conditions. The spray area ofbiodiesel fuel decreases when the ambient pressure increases. Fur-thermore, the Sauter Mean Diameter (SMD) of biodiesel fueldecreases along the spray axis, and biodiesel fuel had a slightly lar-ger droplets size than diesel fuel. Deshmukh et al. [17] studied thehigh pressure spray characterization of Straight Vegetable Oils (Jat-ropha and Pongamias). Their results showed that Pongamias oilhad higher injection delays at low injection pressures and this isattributed to its higher viscosity. The spray tip penetration for Pon-gamia and Jatropha is less than that of diesel. Deshmukh andRavikrishna [20] studied the high pressure spray characterizationof Pongamis oil and its blends with diesel under various ambientpressures. Their results showed that the spray cone angle for bio-fuels was lower than that of diesel. The Pongamia had 200% higherSMD than that of diesel. The spray atomization performance wastypically characterized by the droplet size. Because there werelarge number of droplets within the spray, there have been severalmethods to characterize the average droplet size. Among these def-initions, SMD is the most commonly used. However, studies on thespray atomization characteristics of n-butanol blending with dieseland biodiesel are not sufficient so far. Liu et al. [21,22] studied theeffects of volatility on butanol–biodiesel–diesel spray characteris-tics. The results indicated that for the non-combusting case, thetip of the spray jet erupted into a plume sometime after injectionfor the butanol–biodiesel–diesel blend at an ambient temperatureof 1100 K. Such phenomenon was not seen with the biodiesel–die-sel blend, neither with the same fuel but at a lower ambient tem-perature of 900 K. It is concluded that micro-explosion could occurunder particular conditions for the butanol–biodiesel–diesel blend.Wu et al. [23] conducted an experimental study of spray character-istics of different fuel mixtures and analyzed the influence of dif-ferent proportions of acidic oil biodiesel and n-butanol on themacroscopic parameters of spray. The results show that after add-ing n-butanol in acidic oil biodiesel and diesel mixture fuel, thesurrounding air entrainment is enhanced, and spray front endwiden. With the increasing of mixing ratio, spray penetrationincreasing first, then decreases. The spray cone angle increasesafter adding n-butanol, and decreases with the increase of mixingratio. The results show that adding n-butanol can be used as one ofthe methods to improve biodiesel spray characteristics. In theresearch of Liu et al. [24], the spray, flame natural luminosity andsoot quantitative measurement by fueling n-butanol and soybeanbiodiesel on a constant volume chamber were investigated. Resultsdemonstrate that the transient liquid penetration length of n-butanol is less affected by the downstream flame and is shorterthan that of biodiesel under similar conditions. Compared to bio-diesel, the flame luminosity of n-butanol is lower and its propaga-tion and distribution is less sensitive to ambient temperatures.Ambient temperature is confirmed as the dominant impact onthe soot emissions as the net soot increases for both tested fuelswith elevated ambient temperature. No soot emission is detectedfor either n-butanol or biodiesel at low ambient temperature of700 K. The soot starts to appear at both downstream of the jetand near wall regions from 800 K for biodiesel whereas the sootdo not emerge until 900 K for n-butanol. The higher soot formation
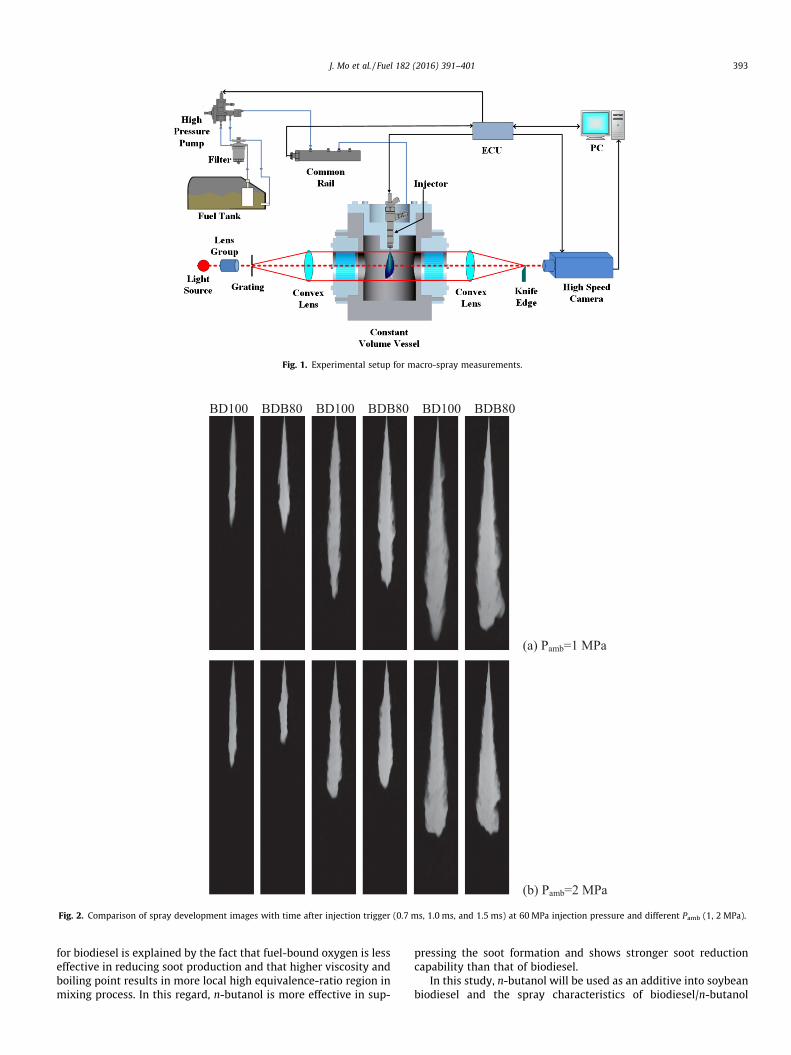
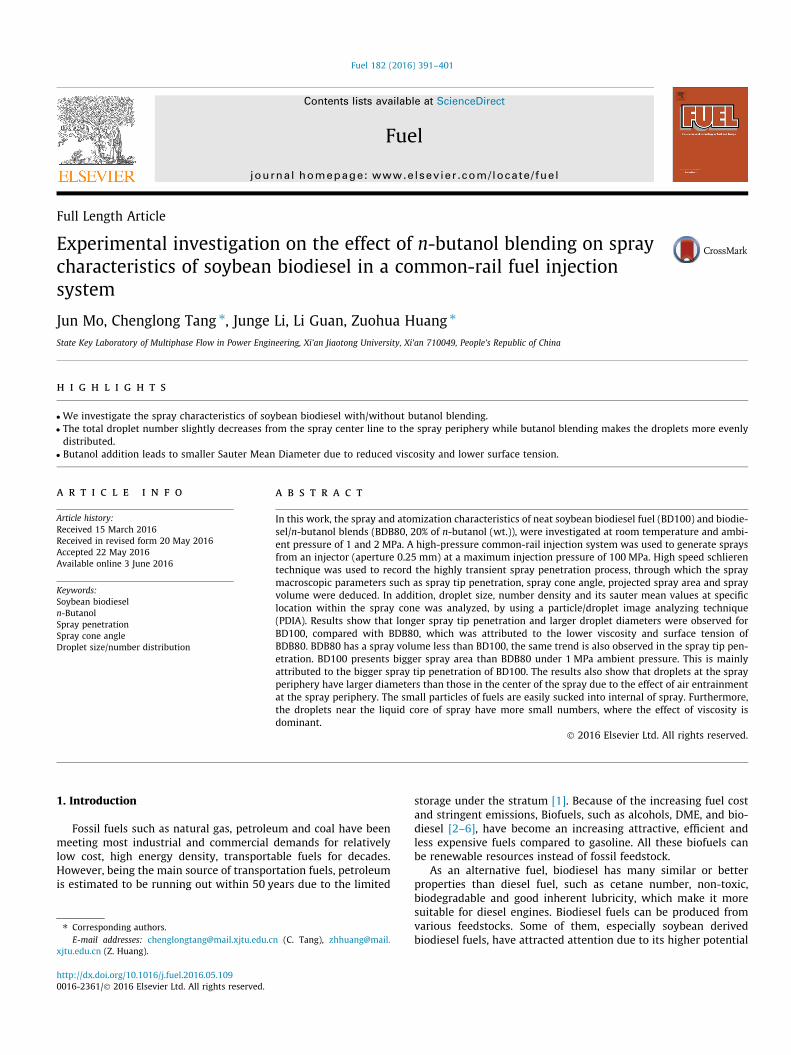
Fig. 1. Experimental setup for macro-spray measurements.
BD100 BDB80 BD100 BDB80 BD100 BDB80
(a) Pamb=1 MPa
(b) Pamb=2 MPa
Fig. 2. Comparison of spray development images with time after injection trigger (0.7 ms, 1.0 ms, and 1.5 ms) at 60 MPa injection pressure and different Pamb (1, 2 MPa).
J. Mo et al. / Fuel 182 (2016) 391–401 393
for biodiesel is explained by the fact that fuel-bound oxygen is lesseffective in reducing soot production and that higher viscosity andboiling point results in more local high equivalence-ratio region inmixing process. In this regard, n-butanol is more effective in sup-
pressing the soot formation and shows stronger soot reductioncapability than that of biodiesel.
In this study, n-butanol will be used as an additive into soybeanbiodiesel and the spray characteristics of biodiesel/n-butanol

Fig. 3. The location of observation point for droplets size distribution statistics.
Table 2Experiment parameters.
Equipment Parameter
Measurement system Spray master Davis 8.0Detector range 1.2–7.5 mmSpray image acquisition system Imager Pro SX 5MResolution 2456 � 2058 pixelPixel size 3.45 � 3.45 lmLaser energy 400 MJPulse duration 4 nsWavelength 532, 266 nm
Fig. 4. Definition of the parameters that chara
394 J. Mo et al. / Fuel 182 (2016) 391–401
blends will be investigated. Table 1 lists the physical properties oftest fuels. In the following, the experimental system will be speci-fied in detail. The macroscopic spray characteristics of biodiesel/n-butanol blends at different injection pressures and ambient pres-sures in terms of the spray tip penetration (STP), spray angle, sprayvolume and projected area will be examined from the spray imagescaptured through high speed schlieren photography. Additionally,microscopic and statistical spray characteristic parameters suchas the droplets size/number distribution will be compared.
2. Experimental methods
In the present study, biodiesel/n-butanol sprays were generatedinside the high pressure constant volume chamber. The spray char-acteristics play a critical role in the engine performance and under-standing the spray of alternative fuels for diesel is important inapplying these fuels in practical combustion engine. Studies ofthe fuel spray behavior can be classified into two categories: themacroscopic and microscopic characteristics. Macroscopic param-eters such as the spray tip penetration and cone angle can be mea-sured by direct visualization methods such as the high speedschlieren photography techniques. Microscopic parameters suchas the droplet velocity, droplet size and number density distribu-tion can be measured through particle image velocimetry (PIV),phase Doppler particle analyzer (PDPA) or laser diffraction particleanalyzer (LDPA) systems. These microscopic and macroscopicspray parameters quantify the atomization quality of a certain fueland essentially influence the mixture formation process and even-tually the combustion and emission performance of the engine.
Fig. 1 shows the spray test rig used in this study. The whole testrig is composed of the fuel injection system, the constant volumechamber and the imaging system. A common rail fuel injection sys-tem (BOSCH CP1H3) was used for generating the high pressure fueljet. A single hole injector nozzle with a diameter of 250 lm wasused in this work. In this study, three injection pressures weretested: 60, 80, and 100 MPa. The cylindrical constant volumechamber with optical windows was used to provide ambient pres-sures by filling the compressed nitrogen. Two ambient pressureswere tested (1 and 2 MPa) at room temperature. Two sides of the
cterize the macroscopic spray evolution.
0.4 0.6 0.8 1.0 1.2 1.4 1.6 1.8 2.00
20
40
60
80
100
Spr
ay T
ip P
enet
ratio
n (m
m)
Time after start of injection (ms)
(a) Pinj
= 60 MPa
tbreak
Pamb
BD100 1 MPa 2 MPa BDB80 1 MPa 2 MPa
0.4 0.6 0.8 1.0 1.2 1.4 1.6 1.8 2.00
20
40
60
80
100
Pamb
BD100 1 MPa 2 MPa BDB80 1 MPa 2 MPatbreak
Spr
ay T
ip P
enet
ratio
n (m
m)
(b) Pinj
= 80 MPa
Time after start of injection (ms)
0.4 0.6 0.8 1.0 1.2 1.4 1.6 1.8 2.00
20
40
60
80
100
Pamb
BD100 1 MPa 2 MPa BDB80 1 MPa 2 MPa
tbreak
Spr
ay T
ip P
enet
ratio
n (m
m)
Time after start of injection (ms)
(c) Pinj
= 100 MPa
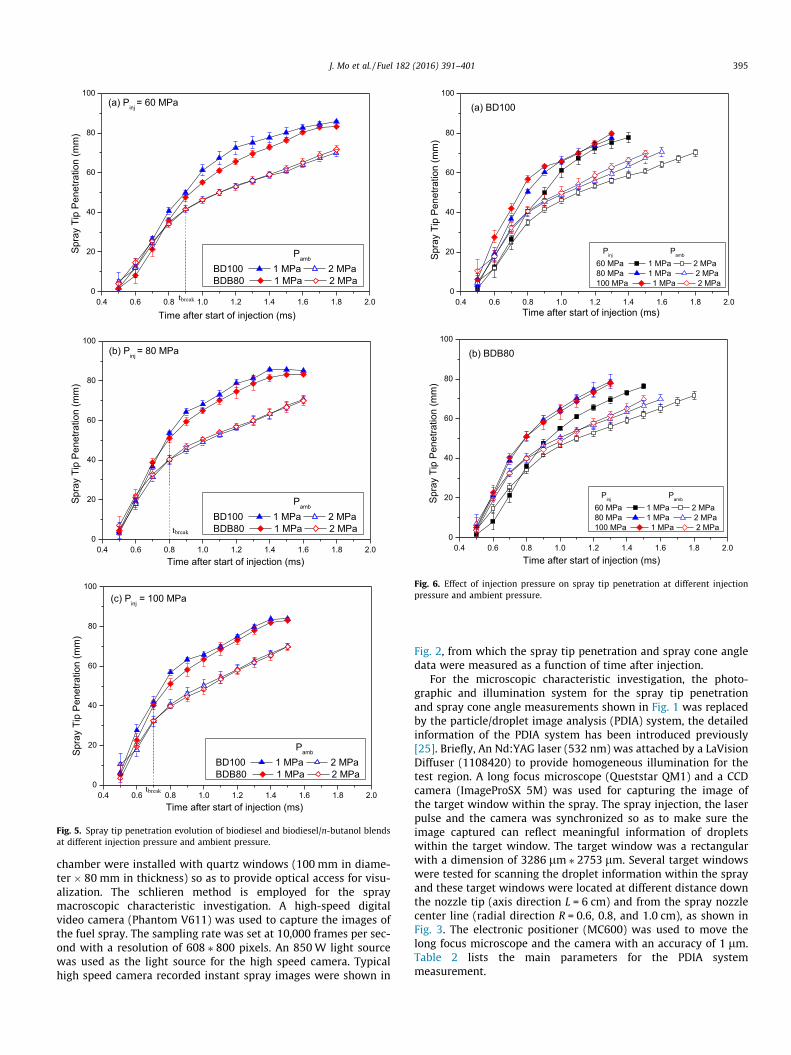
Fig. 5. Spray tip penetration evolution of biodiesel and biodiesel/n-butanol blendsat different injection pressure and ambient pressure.
0.4 0.6 0.8 1.0 1.2 1.4 1.6 1.8 2.00
20
40
60
80
100
(a) BD100
Spr
ay T
ip P
enet
ratio
n (m
m)
Time after start of injection (ms)
Pinj
Pamb
60 MPa 1 MPa 2 MPa 80 MPa 1 MPa 2 MPa100 MPa 1 MPa 2 MPa
0.4 0.6 0.8 1.0 1.2 1.4 1.6 1.8 2.00
20
40
60
80
100
Pinj
Pamb
60 MPa 1 MPa 2 MPa 80 MPa 1 MPa 2 MPa100 MPa 1 MPa 2 MPa
(b) BDB80
Spr
ay T
ip P
enet
ratio
n (m
m)
Time after start of injection (ms)
Fig. 6. Effect of injection pressure on spray tip penetration at different injectionpressure and ambient pressure.
J. Mo et al. / Fuel 182 (2016) 391–401 395
chamber were installed with quartz windows (100 mm in diame-ter � 80 mm in thickness) so as to provide optical access for visu-alization. The schlieren method is employed for the spraymacroscopic characteristic investigation. A high-speed digitalvideo camera (Phantom V611) was used to capture the images ofthe fuel spray. The sampling rate was set at 10,000 frames per sec-ond with a resolution of 608 ⁄ 800 pixels. An 850W light sourcewas used as the light source for the high speed camera. Typicalhigh speed camera recorded instant spray images were shown in
Fig. 2, from which the spray tip penetration and spray cone angledata were measured as a function of time after injection.
For the microscopic characteristic investigation, the photo-graphic and illumination system for the spray tip penetrationand spray cone angle measurements shown in Fig. 1 was replacedby the particle/droplet image analysis (PDIA) system, the detailedinformation of the PDIA system has been introduced previously[25]. Briefly, An Nd:YAG laser (532 nm) was attached by a LaVisionDiffuser (1108420) to provide homogeneous illumination for thetest region. A long focus microscope (Queststar QM1) and a CCDcamera (ImageProSX 5M) was used for capturing the image ofthe target window within the spray. The spray injection, the laserpulse and the camera was synchronized so as to make sure theimage captured can reflect meaningful information of dropletswithin the target window. The target window was a rectangularwith a dimension of 3286 lm ⁄ 2753 lm. Several target windowswere tested for scanning the droplet information within the sprayand these target windows were located at different distance downthe nozzle tip (axis direction L = 6 cm) and from the spray nozzlecenter line (radial direction R = 0.6, 0.8, and 1.0 cm), as shown inFig. 3. The electronic positioner (MC600) was used to move thelong focus microscope and the camera with an accuracy of 1 lm.Table 2 lists the main parameters for the PDIA systemmeasurement.
0.4 0.6 0.8 1.0 1.2 1.4 1.6 1.8 2.010
15
20
25
30
35
40
45
tbreak
Time after start of injection (ms)
Spr
ray
Con
e A
ngle
(deg
ree)
(a) Pinj
= 60 MPa Pamb
BD100 1 MPa 2 MPaBDB80 1 MPa 2 MPa
0.4 0.6 0.8 1.0 1.2 1.4 1.6 1.8 2.010
15
20
25
30
35
40
45
Pamb
BD100 1 MPa 2 MPaBDB80 1 MPa 2 MPa
tbreak
(b) Pinj
= 80 MPa
Spr
ay C
one
Ang
le (d
egre
e)
Time after start of injection (ms)
0.4 0.6 0.8 1.0 1.2 1.4 1.6 1.8 2.010
15
20
25
30
35
40
45 P
amb
BD100 1 MPa 2 MPaBDB80 1 MPa 2 MPa
tbreak
(c) Pinj
= 100 MPa
Spr
ay C
one
Ang
le (d
egre
e)
Time after start of injection (ms)
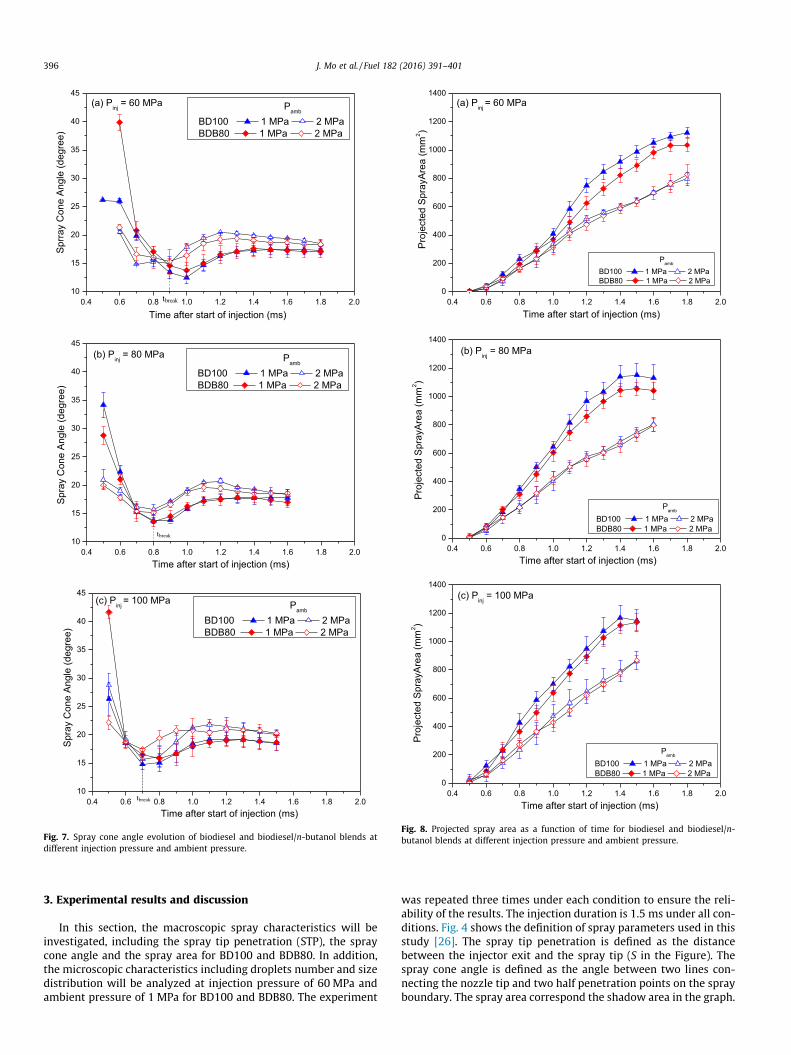
Fig. 7. Spray cone angle evolution of biodiesel and biodiesel/n-butanol blends atdifferent injection pressure and ambient pressure.
0.4 0.6 0.8 1.0 1.2 1.4 1.6 1.8 2.00
200
400
600
800
1000
1200
1400(a) P
inj = 60 MPa
Pro
ject
ed S
pray
Are
a (m
m2 )
Time after start of injection (ms)
Pamb
BD100 1 MPa 2 MPaBDB80 1 MPa 2 MPa
0.4 0.6 0.8 1.0 1.2 1.4 1.6 1.8 2.00
200
400
600
800
1000
1200
1400
Pro
ject
ed S
pray
Are
a (m
m2 )
(b) Pinj
= 80 MPa
Time after start of injection (ms)
Pamb
BD100 1 MPa 2 MPa BDB80 1 MPa 2 MPa
0.4 0.6 0.8 1.0 1.2 1.4 1.6 1.8 2.00
200
400
600
800
1000
1200
1400
Pamb
BD100 1 MPa 2 MPa BDB80 1 MPa 2 MPa
Pro
ject
ed S
pray
Are
a (m
m2 )
(c) Pinj
= 100 MPa
Time after start of injection (ms)
Fig. 8. Projected spray area as a function of time for biodiesel and biodiesel/n-butanol blends at different injection pressure and ambient pressure.
396 J. Mo et al. / Fuel 182 (2016) 391–401
3. Experimental results and discussion
In this section, the macroscopic spray characteristics will beinvestigated, including the spray tip penetration (STP), the spraycone angle and the spray area for BD100 and BDB80. In addition,the microscopic characteristics including droplets number and sizedistribution will be analyzed at injection pressure of 60 MPa andambient pressure of 1 MPa for BD100 and BDB80. The experiment
was repeated three times under each condition to ensure the reli-ability of the results. The injection duration is 1.5 ms under all con-ditions. Fig. 4 shows the definition of spray parameters used in thisstudy [26]. The spray tip penetration is defined as the distancebetween the injector exit and the spray tip (S in the Figure). Thespray cone angle is defined as the angle between two lines con-necting the nozzle tip and two half penetration points on the sprayboundary. The spray area correspond the shadow area in the graph.
0.4 0.6 0.8 1.0 1.2 1.4 1.6 1.8 2.00
2
4
6
8
10
12
14
16
Spr
ay v
olum
e (c
m3 )
Time after start of injection (ms)
(a) Pinj
= 60 MPa
Pamb
BD100 1 MPa 2 MPaBDB80 1 MPa 2 MPa
0.4 0.6 0.8 1.0 1.2 1.4 1.6 1.8 2.00
2
4
6
8
10
12
14
16
Time after start of injection (ms)
Spr
ay v
olum
e (c
m3 )
(b) Pinj
= 80 MPa
Pamb
BD100 1 MPa 2 MPa BDB80 1 MPa 2 MPa
0.4 0.6 0.8 1.0 1.2 1.4 1.6 1.8 2.00
2
4
6
8
10
12
14
16
Pamb
BD100 1 MPa 2 MPa BDB80 1 MPa 2 MPa
(c) Pinj
= 100 MPa
Spr
ay v
olum
e (c
m3 )
Time after start of injection (ms)
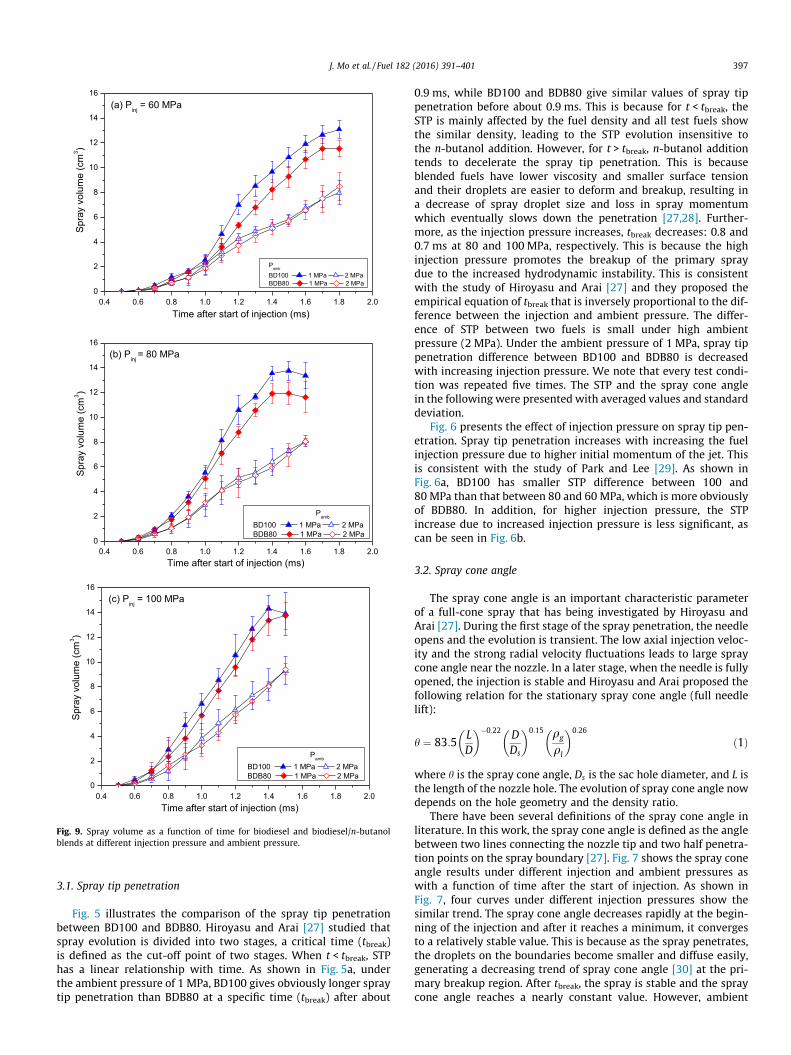
Fig. 9. Spray volume as a function of time for biodiesel and biodiesel/n-butanolblends at different injection pressure and ambient pressure.
J. Mo et al. / Fuel 182 (2016) 391–401 397
3.1. Spray tip penetration
Fig. 5 illustrates the comparison of the spray tip penetrationbetween BD100 and BDB80. Hiroyasu and Arai [27] studied thatspray evolution is divided into two stages, a critical time (tbreak)is defined as the cut-off point of two stages. When t < tbreak, STPhas a linear relationship with time. As shown in Fig. 5a, underthe ambient pressure of 1 MPa, BD100 gives obviously longer spraytip penetration than BDB80 at a specific time (tbreak) after about
0.9 ms, while BD100 and BDB80 give similar values of spray tippenetration before about 0.9 ms. This is because for t < tbreak, theSTP is mainly affected by the fuel density and all test fuels showthe similar density, leading to the STP evolution insensitive tothe n-butanol addition. However, for t > tbreak, n-butanol additiontends to decelerate the spray tip penetration. This is becauseblended fuels have lower viscosity and smaller surface tensionand their droplets are easier to deform and breakup, resulting ina decrease of spray droplet size and loss in spray momentumwhich eventually slows down the penetration [27,28]. Further-more, as the injection pressure increases, tbreak decreases: 0.8 and0.7 ms at 80 and 100 MPa, respectively. This is because the highinjection pressure promotes the breakup of the primary spraydue to the increased hydrodynamic instability. This is consistentwith the study of Hiroyasu and Arai [27] and they proposed theempirical equation of tbreak that is inversely proportional to the dif-ference between the injection and ambient pressure. The differ-ence of STP between two fuels is small under high ambientpressure (2 MPa). Under the ambient pressure of 1 MPa, spray tippenetration difference between BD100 and BDB80 is decreasedwith increasing injection pressure. We note that every test condi-tion was repeated five times. The STP and the spray cone anglein the following were presented with averaged values and standarddeviation.
Fig. 6 presents the effect of injection pressure on spray tip pen-etration. Spray tip penetration increases with increasing the fuelinjection pressure due to higher initial momentum of the jet. Thisis consistent with the study of Park and Lee [29]. As shown inFig. 6a, BD100 has smaller STP difference between 100 and80 MPa than that between 80 and 60 MPa, which is more obviouslyof BDB80. In addition, for higher injection pressure, the STPincrease due to increased injection pressure is less significant, ascan be seen in Fig. 6b.
3.2. Spray cone angle
The spray cone angle is an important characteristic parameterof a full-cone spray that has being investigated by Hiroyasu andArai [27]. During the first stage of the spray penetration, the needleopens and the evolution is transient. The low axial injection veloc-ity and the strong radial velocity fluctuations leads to large spraycone angle near the nozzle. In a later stage, when the needle is fullyopened, the injection is stable and Hiroyasu and Arai proposed thefollowing relation for the stationary spray cone angle (full needlelift):
h ¼ 83:5LD
� ��0:22 DDs
� �0:15 qg
ql
� �0:26
ð1Þ
where h is the spray cone angle, Ds is the sac hole diameter, and L isthe length of the nozzle hole. The evolution of spray cone angle nowdepends on the hole geometry and the density ratio.
There have been several definitions of the spray cone angle inliterature. In this work, the spray cone angle is defined as the anglebetween two lines connecting the nozzle tip and two half penetra-tion points on the spray boundary [27]. Fig. 7 shows the spray coneangle results under different injection and ambient pressures aswith a function of time after the start of injection. As shown inFig. 7, four curves under different injection pressures show thesimilar trend. The spray cone angle decreases rapidly at the begin-ning of the injection and after it reaches a minimum, it convergesto a relatively stable value. This is because as the spray penetrates,the droplets on the boundaries become smaller and diffuse easily,generating a decreasing trend of spray cone angle [30] at the pri-mary breakup region. After tbreak, the spray is stable and the spraycone angle reaches a nearly constant value. However, ambient

(a) BD100
(b) BDB80
R : 0.6 cm 0.8 cm 1.0 cm
Fig. 10. Examples of droplets shadow image at different radial location (L = 6 cm, injection pressure: 60 MPa, ambient pressure: 1 MPa, injection duration: 1.5 ms).
6000 7000 8000 9000 10000 11000 120000
500
1000
1500
2000
2500BD100
Axi
al d
irect
ion
(µm
)
Radial distance from the center of spray (µm)
6000 7000 8000 9000 10000 11000 120000
500
1000
1500
2000
2500BDB80
Axi
al d
irect
ion
(µm
)
Radial distance from the center of spray (µm)
Fig. 11. The droplets assembly for the test fuels at the injection pressure of 60 MPaand ambient pressure of 1 MPa.
398 J. Mo et al. / Fuel 182 (2016) 391–401
pressure has an obvious influence on the spray cone angle, andhigh ambient pressure supply strengthened the resistance to fuelspray and inhibits spray axial development, which results in alarger spray cone angle [31]. Furthermore, the spray cone angleof the test fuels converge to a constant value at around 0.9 ms afterstart of injection at 60 MPa injection pressure, and steady state isachieved earlier after injection as the injection pressure increases,i.e., 0.8 and 0.7 ms for 80 and 100 MPa, respectively. This is becausehigher injection pressure leads to smaller tbreak, as reported byGuan et al. [25].
3.3. Spray area and volume
The projected spray area can be employed to represent thequality of fuel air mixing [26]. Fig. 8 presents spray area versusinjection time for all conditions. The results show that BD100 pre-sents larger spray area than BDB80 under 1 MPa ambient pressure.This is mainly attributed to the longer spray tip penetration ofBD100, as shown in Fig. 2. The difference of spray area amongtwo fuels is quite small under high ambient pressure (2 MPa).
To further understand the fuel–air mixing, the spray volume isestimated. Fuel spray is assumed to consist of a cone and half asphere, thus the spray volume is then described by the followingcorrelation [26],
V ¼ ðp=3ÞS3½tan2ðh=2Þ� 1þ 2 tanðh=2Þ½1þ tanðh=2Þ�3
ð2Þ
where S is the spray tip penetration and h is the spray cone angle.Fig. 9 shows the calculated spray volumes of different fuels usedin this study with time after the start of injection. The spray vol-umes develop as exponential curves under low injection pressure(60 MPa) and become proportional when increasing the pressure.This is considered as the effect of higher injection pressure deliver-ing the fuel faster than low pressure and causing the sprays to reachsteady state earlier. The spray volume gives the similar results with

0 20 40 60 80 100
0.00
0.02
0.04
0.06
0.08
0.10
0.12
Praticle Diameter (µm)
Frac
tion
of P
artic
le N
umbe
r
R = 0.6 cm BD100 BDB80
(a)
0 20 40 60 80 100
0.00
0.02
0.04
0.06
0.08
0.10
0.12
(b)
Praticle Diameter (µm)
Frac
tion
of P
artic
le N
umbe
r
R = 0.8 cm BD100 BDB80
0 20 40 60 80 100
0.00
0.02
0.04
0.06
0.08
0.10
0.12
(c)
Praticle Diameter (µm)
Frac
tion
of P
artic
le N
umbe
r
R = 1.0 cm BD100 BDB80
0 20 40 60 80 100
0.00
0.02
0.04
0.06
0.08
0.10
0.12
(d)
Frac
tion
of P
artic
le N
umbe
r
Whole BD100 BDB80
Praticle Diameter (µm)
Fig. 12. Fractions of number of droplets as a function of droplet diameter for BD100 and BDB80 at the injection pressure of 60 MPa and ambient pressure of 1 MPa.
J. Mo et al. / Fuel 182 (2016) 391–401 399
those of spray area. Moreover, the distribution in spray volume forthe test fuels follows the same trend as spray tip penetration. It isseen that spray volume is mainly determined by the spray tip pen-etration, since the variation of spray cone angles among differentfuels is not significant. Our results show that BDB80 has a sprayvolume less than BD100, the same trend is also observed in thespray tip penetration.
3.4. Droplets size/number distribution
The droplets size and number distribution characteristicsrepresent the quality of spray and atomization and it affects thesubsequent combustion and emissions in engines. The spray is bro-ken into spray particles or droplets of various sizes with theatomization process. Managing the size of spray droplets is criticalin managing spray drift. When the size of spray droplets is reduced,the potential for drift increases. Due to the high droplets density atthe central of the spray that attenuate the background illuminationlight [25], the droplets size/number distribution of BD100 andBDB80 were measured at 6 cm below the nozzle tip and 0.6, 0.8,1.0 cm from the spray axis at injection pressure of 60 MPa andambient pressure of 1 MPa. The recorded images were processedby the software Davis 8.0.0 of LaVision. Fig. 10 shows the typicalshadow images of droplets at three observation windows. It is seenthat the number of droplets was reduced along the radial directionfrom the spray center line. It is more difficult to process the image
which got closer to the spray center because the droplets are toodense. Furthermore, BDB80 has more droplets than BD100 at alldetective windows.
Fig. 11 shows the summation of the detected droplets of BD100and BDB80 in the whole observation region. The black spots wereemployed to represent the droplets. As shown in Fig. 12, dropletstend to aggregate on the left half of the focal plane (close to theliquid core [17]) for all fuels studied here. It is seem that there werea larger number of droplets close to the central of the spray than atthe periphery of it. In addition, for BD100, the droplet numberseems to have a larger gradient along the radial direction, com-pared to BDB80. This might be attributed to its higher viscosityand larger surface tension, which inhibit the droplets diffusion.
Fig. 12a–d shows the droplets number fraction of BD100 andBDB80 at three detecting positions and whole part, respectively.As shown in Fig. 12a, BDB80 has a larger number of small dropletsclose to the central of the spray. This is because BDB80 has thelower viscosity and smaller surface tension, which favors the dro-plet breakup process near the spray core region. As the test regionis shifted to slightly far away from the spray center line, as shownin Fig. 12b, BDB80 has very similar droplet number fraction to thatof BD100. Fig. 12c illustrates the similar trend like Fig. 12b, it is dueto the fast pressure drop far away from the liquid core. The effect ofpressure drop is larger than that of viscosity difference at the sprayperiphery. Fig. 12d illustrates that BDB80 has more small dropletsthan BD100 overall. Fig. 13 shows droplets number distribution of
5000 6000 7000 8000 9000 10000 11000
0.00
0.05
0.10
0.15
0.20
0.25
0.30
0.35
Frac
tion
of P
artic
le N
umbe
r
Radius distance from the center of spray (µm)
BD100 BDB80
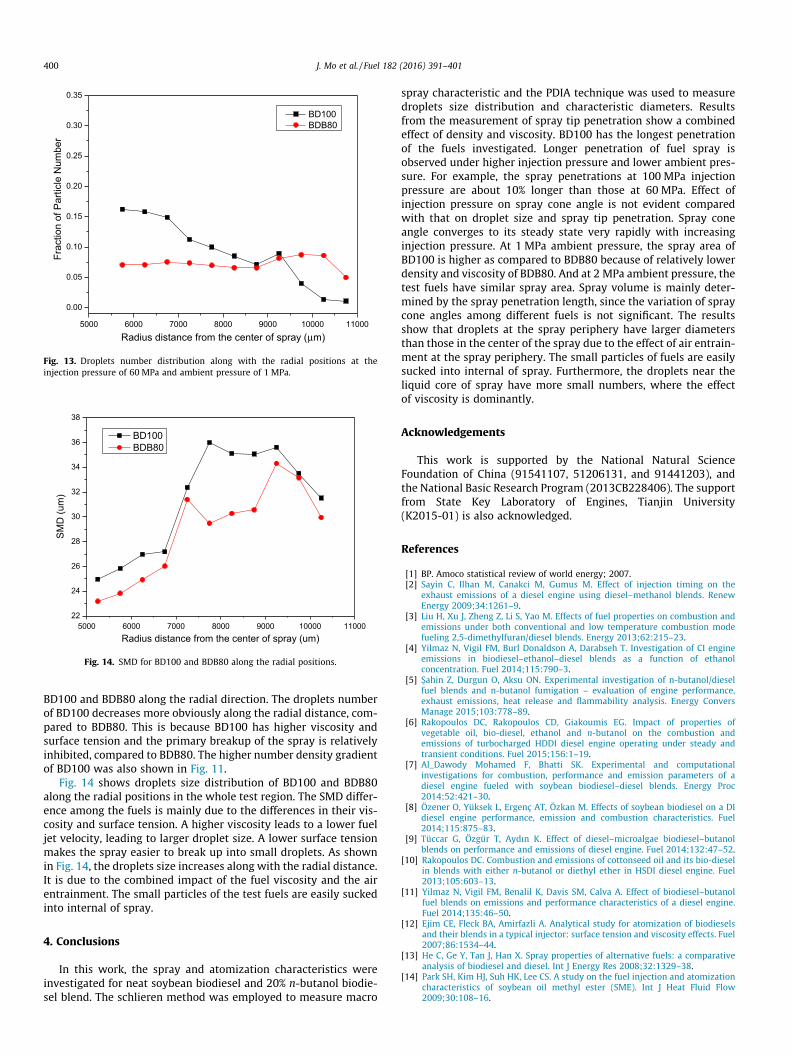
Fig. 13. Droplets number distribution along with the radial positions at theinjection pressure of 60 MPa and ambient pressure of 1 MPa.
5000 6000 7000 8000 9000 10000 1100022
24
26
28
30
32
34
36
38
SM
D (u
m)
Radius distance from the center of spray (um)
BD100 BDB80
Fig. 14. SMD for BD100 and BDB80 along the radial positions.
400 J. Mo et al. / Fuel 182 (2016) 391–401
BD100 and BDB80 along the radial direction. The droplets numberof BD100 decreases more obviously along the radial distance, com-pared to BDB80. This is because BD100 has higher viscosity andsurface tension and the primary breakup of the spray is relativelyinhibited, compared to BDB80. The higher number density gradientof BD100 was also shown in Fig. 11.
Fig. 14 shows droplets size distribution of BD100 and BDB80along the radial positions in the whole test region. The SMD differ-ence among the fuels is mainly due to the differences in their vis-cosity and surface tension. A higher viscosity leads to a lower fueljet velocity, leading to larger droplet size. A lower surface tensionmakes the spray easier to break up into small droplets. As shownin Fig. 14, the droplets size increases along with the radial distance.It is due to the combined impact of the fuel viscosity and the airentrainment. The small particles of the test fuels are easily suckedinto internal of spray.
4. Conclusions
In this work, the spray and atomization characteristics wereinvestigated for neat soybean biodiesel and 20% n-butanol biodie-sel blend. The schlieren method was employed to measure macro
spray characteristic and the PDIA technique was used to measuredroplets size distribution and characteristic diameters. Resultsfrom the measurement of spray tip penetration show a combinedeffect of density and viscosity. BD100 has the longest penetrationof the fuels investigated. Longer penetration of fuel spray isobserved under higher injection pressure and lower ambient pres-sure. For example, the spray penetrations at 100 MPa injectionpressure are about 10% longer than those at 60 MPa. Effect ofinjection pressure on spray cone angle is not evident comparedwith that on droplet size and spray tip penetration. Spray coneangle converges to its steady state very rapidly with increasinginjection pressure. At 1 MPa ambient pressure, the spray area ofBD100 is higher as compared to BDB80 because of relatively lowerdensity and viscosity of BDB80. And at 2 MPa ambient pressure, thetest fuels have similar spray area. Spray volume is mainly deter-mined by the spray penetration length, since the variation of spraycone angles among different fuels is not significant. The resultsshow that droplets at the spray periphery have larger diametersthan those in the center of the spray due to the effect of air entrain-ment at the spray periphery. The small particles of fuels are easilysucked into internal of spray. Furthermore, the droplets near theliquid core of spray have more small numbers, where the effectof viscosity is dominantly.
Acknowledgements
This work is supported by the National Natural ScienceFoundation of China (91541107, 51206131, and 91441203), andthe National Basic Research Program (2013CB228406). The supportfrom State Key Laboratory of Engines, Tianjin University(K2015-01) is also acknowledged.
References
[1] BP. Amoco statistical review of world energy; 2007.[2] Sayin C, Ilhan M, Canakci M, Gumus M. Effect of injection timing on the
exhaust emissions of a diesel engine using diesel–methanol blends. RenewEnergy 2009;34:1261–9.
[3] Liu H, Xu J, Zheng Z, Li S, Yao M. Effects of fuel properties on combustion andemissions under both conventional and low temperature combustion modefueling 2,5-dimethylfuran/diesel blends. Energy 2013;62:215–23.
[4] Yilmaz N, Vigil FM, Burl Donaldson A, Darabseh T. Investigation of CI engineemissions in biodiesel–ethanol–diesel blends as a function of ethanolconcentration. Fuel 2014;115:790–3.
[5] S�ahin Z, Durgun O, Aksu ON. Experimental investigation of n-butanol/dieselfuel blends and n-butanol fumigation – evaluation of engine performance,exhaust emissions, heat release and flammability analysis. Energy ConversManage 2015;103:778–89.
[6] Rakopoulos DC, Rakopoulos CD, Giakoumis EG. Impact of properties ofvegetable oil, bio-diesel, ethanol and n-butanol on the combustion andemissions of turbocharged HDDI diesel engine operating under steady andtransient conditions. Fuel 2015;156:1–19.
[7] Al_Dawody Mohamed F, Bhatti SK. Experimental and computationalinvestigations for combustion, performance and emission parameters of adiesel engine fueled with soybean biodiesel–diesel blends. Energy Proc2014;52:421–30.
[8] Özener O, Yüksek L, Ergenç AT, Özkan M. Effects of soybean biodiesel on a DIdiesel engine performance, emission and combustion characteristics. Fuel2014;115:875–83.
[9] Tüccar G, Özgür T, Aydın K. Effect of diesel–microalgae biodiesel–butanolblends on performance and emissions of diesel engine. Fuel 2014;132:47–52.
[10] Rakopoulos DC. Combustion and emissions of cottonseed oil and its bio-dieselin blends with either n-butanol or diethyl ether in HSDI diesel engine. Fuel2013;105:603–13.
[11] Yilmaz N, Vigil FM, Benalil K, Davis SM, Calva A. Effect of biodiesel–butanolfuel blends on emissions and performance characteristics of a diesel engine.Fuel 2014;135:46–50.
[12] Ejim CE, Fleck BA, Amirfazli A. Analytical study for atomization of biodieselsand their blends in a typical injector: surface tension and viscosity effects. Fuel2007;86:1534–44.
[13] He C, Ge Y, Tan J, Han X. Spray properties of alternative fuels: a comparativeanalysis of biodiesel and diesel. Int J Energy Res 2008;32:1329–38.
[14] Park SH, Kim HJ, Suh HK, Lee CS. A study on the fuel injection and atomizationcharacteristics of soybean oil methyl ester (SME). Int J Heat Fluid Flow2009;30:108–16.
J. Mo et al. / Fuel 182 (2016) 391–401 401
[15] Wang X, Huang Z, Kuti OA, Zhang W, Nishida K. Experimental and analyticalstudy on biodiesel and diesel spray characteristics under ultra-high injectionpressure. Int J Heat Fluid Flow 2010;31:659–66.
[16] Agarwal AK, Chaudhury VH. Spray characteristics of biodiesel/blends in a highpressure constant volume spray chamber. Exp Thermal Fluid Sci 2012;42:212–8.
[17] Deshmukh D, Madan Mohan A, Anand TNC, Ravikrishna RV. Spraycharacterization of straight vegetable oils at high injection pressures. Fuel2012;97:879–83.
[18] Choi S, Oh Y. The spray characteristics of unrefined biodiesel. Renew Energy2012;42:136–9.
[19] Lahane S, Subramanian KA. Effect of different percentages of biodiesel–dieselblends on injection, spray, combustion, performance, and emissioncharacteristics of a diesel engine. Fuel 2015;139:537–45.
[20] Deshmukh D, Ravikrishna RV. Experimental studies on high-pressure spraystructure of biofuels. Atom Sprays 2011;21:467–81.
[21] Liu Y, Cheng W, Huo M, Lee C. A study of effects of volatility on butanol-biodiesel-diesel spray and combustion. SAE technical paper; 2011.
[22] Liu Y, Li J, Gao Y, Yuan X. Laser diagnostic investigation on the spray andcombustion with butanol–biodiesel–diesel fuel blends. Adv Mater Res 2012;443–444:986–95.
[23] Wu J, Hua Y, Wang Z, Zhu L, Shang W. Experimental study on spraycharacteristics of N-butanol/acidic oil/diesel blends. Adv Mater Res 2014;1008–1009.
[24] Liu H, Huo M, Liu Y, Wang X, Wang H, Yao M, et al. Time-resolved spray, flame,soot quantitative measurement fueling n-butanol and soybean biodiesel in aconstant volume chamber under various ambient temperatures. Fuel2014;133:317–25.
[25] Guan L, Tang C, Yang K, Mo J, Huang Z. Effect of di-n-butyl ether blending withsoybean-biodiesel on spray and atomization characteristics in a common-railfuel injection system. Fuel 2015;140:116–25.
[26] Delacourt E, Desmet B, Besson B. Characterisation of very high pressure dieselsprays using digital imaging techniques. Fuel 2005;84:859–67.
[27] Hiroyasu H, Arai M. Structures of fuel sprays in diesel engines. SAE Trans JEngines 1990;V99-3:15.
[28] Berg T, Deppe J, Michaelis D, Voges1 H, Wissel S. Comparison of particle sizeand velocity investigations in sprays carried out by means of differentmeasurement techniques. In: ICLASS’06, Kyoto, Japan; 2006.
[29] Park SW, Lee CS. Macroscopic structure and atomization characteristics ofhigh-speed diesel spray. Int J Automot Technol 2003;4:157–64.
[30] Chen P-C, Wang W-C, Roberts WL, Fang T. Spray and atomization of diesel fueland its alternatives from a single-hole injector using a common rail fuelinjection system. Fuel 2013;103:850–61.
[31] Suh HK, Lee CS. Experimental and analytical study on the spray characteristicsof dimethyl ether (DME) and diesel fuels within a common-rail injectionsystem in a diesel engine. Fuel 2008;87:925–32.