Embed Size (px)
Citation preview
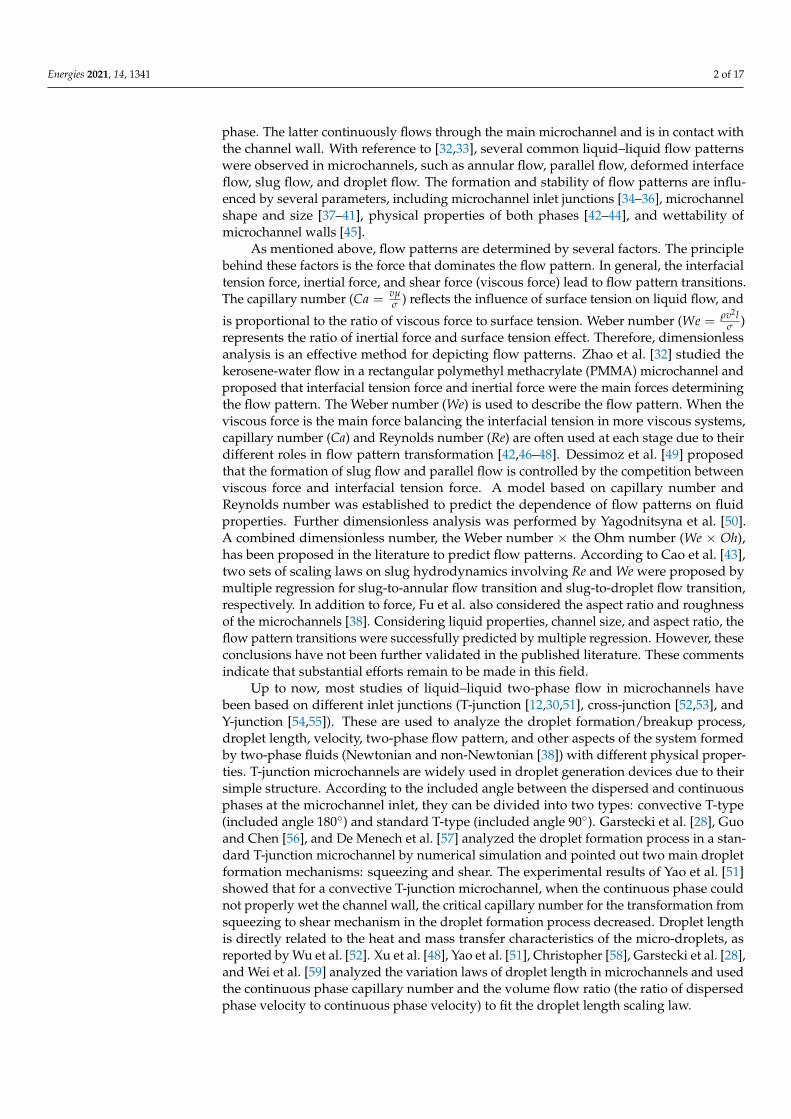
energies
Article
Experimental Studies of Droplet Formation Process and Lengthfor Liquid–Liquid Two-Phase Flows in a Microchannel
Li Lei 1, Yuting Zhao 1, Wukai Chen 1, Huiling Li 1, Xinyu Wang 2 and Jingzhi Zhang 1,3,*
�����������������
Citation: Lei, L.; Zhao, Y.; Chen, W.;
Li, H.; Wang, X.; Zhang, J.
Experimental Studies of Droplet
Formation Process and Length for
Liquid–Liquid Two-Phase Flows in a
Microchannel. Energies 2021, 14, 1341.
https://doi.org/10.3390/en14051341
Academic Editor: Roberto Finesso
Received: 22 December 2020
Accepted: 24 February 2021
Published: 1 March 2021
Publisher’s Note: MDPI stays neutral
with regard to jurisdictional claims in
published maps and institutional affil-
iations.
Copyright: © 2021 by the authors.
Licensee MDPI, Basel, Switzerland.
This article is an open access article
distributed under the terms and
conditions of the Creative Commons
Attribution (CC BY) license (https://
creativecommons.org/licenses/by/
4.0/).
1 School of Energy and Power Engineering, Shandong University, Jinan 250061, China; [email protected] (L.L.);[email protected] (Y.Z.); [email protected] (W.C.); [email protected] (H.L.)
2 Institute of Thermal Science and Technology, Shandong University, Jinan 250061, China; [email protected] Shandong Engineering Laboratory for High-Efficiency Energy Conservation and Energy Storage Technology
& Equipment, School of Energy and Power Engineering, Shandong University, Jinan 250061, China* Correspondence: [email protected]; Tel.: +86-0531-88392890
Abstract: In this study, changes in the droplet formation mechanism and the law of droplet lengthin a two-phase liquid–liquid system in 400 × 400 µm standard T-junction microchannels wereexperimentally studied using a high-speed camera. The study investigated the effects of variousdispersed phase viscosities, various continuous phase viscosities, and two-phase flow parameterson droplet length. Two basic flow patterns were observed: slug flow dominated by the squeezingmechanism, and droplet flow dominated by the shear mechanism. The dispersed phase viscosity hadalmost no effect on droplet length. However, the droplet length decreased with increasing continuousphase viscosity, increasing volume flow rate in the continuous phase, and the continuous-phasecapillary number Cac. Droplet length also increased with increasing volume flow rate in the dispersedphase and with the volume flow rate ratio. Based on the droplet formation mechanism, a scaling lawgoverning slug and droplet length was proposed and achieved a good fit with experimental data.
Keywords: microchannels; two-phase flow; microfluidics; droplet length; droplet formation
1. Introduction
Since micro-electro-mechanical systems (MEMS) were proposed, natural science andengineering technology began to move towards the development of miniaturization. Thefield of microfluidics has become a research hotspot. In 1990, Manz et al. proposed theconcept of micro total analysis systems [1]. Since then, there has been growing interest inacademic research and practical application of microfluidics [2–7].
With the development of microfluidic technology, microfluidic devices have becomewidely used in multiphase flow processes due to their many advantages, such as minia-turization, high mass and heat transfer performance, enhanced mixing, rapid reaction,energy and raw material saving, higher stability and safety, and ease of replication. Com-pared with other forms of multiphase microfluidics, liquid–liquid multiphase microfluidicdroplets have an additional radial inner vortex and a larger surface area to volume ratio,both of which facilitate enhanced mixing and mass transfer [8,9]. Therefore, liquid–liquidmultiphase transport in microchannels has become an important topic in many fields, suchas microchemical reactions [10–13], extraction [14–16], oil recovery [17,18], fuel cells [19],microchannel heat transfer [20–23], carbon capture [24,25], drug transport [26,27], lab on achip [28–31], and others.
The key points of liquid–liquid processing in microfluidic devices are flow patterncontrol and droplet transportation. For immiscible liquids, slug flow is preferred becauseof the larger surface area to volume ratio, shorter transmission path, and stronger recir-culation. Therefore, an in-depth understanding of flow patterns and slug hydrodynamiccharacteristics is crucial to the design and optimization of ideal devices. In liquid–liquidflows, one liquid phase is usually called the dispersed phase and the other the continuous
Energies 2021, 14, 1341. https://doi.org/10.3390/en14051341 https://www.mdpi.com/journal/energies
Energies 2021, 14, 1341 2 of 17
phase. The latter continuously flows through the main microchannel and is in contact withthe channel wall. With reference to [32,33], several common liquid–liquid flow patternswere observed in microchannels, such as annular flow, parallel flow, deformed interfaceflow, slug flow, and droplet flow. The formation and stability of flow patterns are influ-enced by several parameters, including microchannel inlet junctions [34–36], microchannelshape and size [37–41], physical properties of both phases [42–44], and wettability ofmicrochannel walls [45].
As mentioned above, flow patterns are determined by several factors. The principlebehind these factors is the force that dominates the flow pattern. In general, the interfacialtension force, inertial force, and shear force (viscous force) lead to flow pattern transitions.The capillary number (Ca = vµ
σ ) reflects the influence of surface tension on liquid flow, and
is proportional to the ratio of viscous force to surface tension. Weber number (We = ρv2lσ )
represents the ratio of inertial force and surface tension effect. Therefore, dimensionlessanalysis is an effective method for depicting flow patterns. Zhao et al. [32] studied thekerosene-water flow in a rectangular polymethyl methacrylate (PMMA) microchannel andproposed that interfacial tension force and inertial force were the main forces determiningthe flow pattern. The Weber number (We) is used to describe the flow pattern. When theviscous force is the main force balancing the interfacial tension in more viscous systems,capillary number (Ca) and Reynolds number (Re) are often used at each stage due to theirdifferent roles in flow pattern transformation [42,46–48]. Dessimoz et al. [49] proposedthat the formation of slug flow and parallel flow is controlled by the competition betweenviscous force and interfacial tension force. A model based on capillary number andReynolds number was established to predict the dependence of flow patterns on fluidproperties. Further dimensionless analysis was performed by Yagodnitsyna et al. [50].A combined dimensionless number, the Weber number × the Ohm number (We × Oh),has been proposed in the literature to predict flow patterns. According to Cao et al. [43],two sets of scaling laws on slug hydrodynamics involving Re and We were proposed bymultiple regression for slug-to-annular flow transition and slug-to-droplet flow transition,respectively. In addition to force, Fu et al. also considered the aspect ratio and roughnessof the microchannels [38]. Considering liquid properties, channel size, and aspect ratio, theflow pattern transitions were successfully predicted by multiple regression. However, theseconclusions have not been further validated in the published literature. These commentsindicate that substantial efforts remain to be made in this field.
Up to now, most studies of liquid–liquid two-phase flow in microchannels havebeen based on different inlet junctions (T-junction [12,30,51], cross-junction [52,53], andY-junction [54,55]). These are used to analyze the droplet formation/breakup process,droplet length, velocity, two-phase flow pattern, and other aspects of the system formedby two-phase fluids (Newtonian and non-Newtonian [38]) with different physical proper-ties. T-junction microchannels are widely used in droplet generation devices due to theirsimple structure. According to the included angle between the dispersed and continuousphases at the microchannel inlet, they can be divided into two types: convective T-type(included angle 180◦) and standard T-type (included angle 90◦). Garstecki et al. [28], Guoand Chen [56], and De Menech et al. [57] analyzed the droplet formation process in a stan-dard T-junction microchannel by numerical simulation and pointed out two main dropletformation mechanisms: squeezing and shear. The experimental results of Yao et al. [51]showed that for a convective T-junction microchannel, when the continuous phase couldnot properly wet the channel wall, the critical capillary number for the transformation fromsqueezing to shear mechanism in the droplet formation process decreased. Droplet lengthis directly related to the heat and mass transfer characteristics of the micro-droplets, asreported by Wu et al. [52]. Xu et al. [48], Yao et al. [51], Christopher [58], Garstecki et al. [28],and Wei et al. [59] analyzed the variation laws of droplet length in microchannels and usedthe continuous phase capillary number and the volume flow ratio (the ratio of dispersedphase velocity to continuous phase velocity) to fit the droplet length scaling law.
Energies 2021, 14, 1341 3 of 17
As stated above, although there are studies on two-phase flow pattern conversion andmicrochannel inlet junctions in the existing literature, most of the works focused on thegas-liquid two-phase flow under the standard T-type microchannel. Therefore, the liquid–liquid two-phase flow in the convective T-type microchannel still needs to be studied indepth. Moreover, most studies have involved only low-viscosity fluids as the dispersedand continuous phases. The effects of the dispersed phase with high viscosity on the flowpatterns and characteristics of liquid–liquid two phases flows in microchannels have notbeen fully studied. Based on these facts, this study aimed to analyze the droplet formationlaws in the convective T-junction microchannel with two kinds of high-viscosity siliconeoil as the dispersed phase and 0.5 wt % sodium dodecyl sulfate (SDS) as the continuousphase. Another experiment involved silicone oil with a viscosity of 20 cs as the dispersedphase and a glycerol aqueous solution of 20% and 40%, respectively, with 0.5 wt % SDS asthe continuous phase. As a result, scaling laws for slug and droplet length in a convectiveT-junction have been proposed.
2. Experimental Method2.1. Experimental Setup
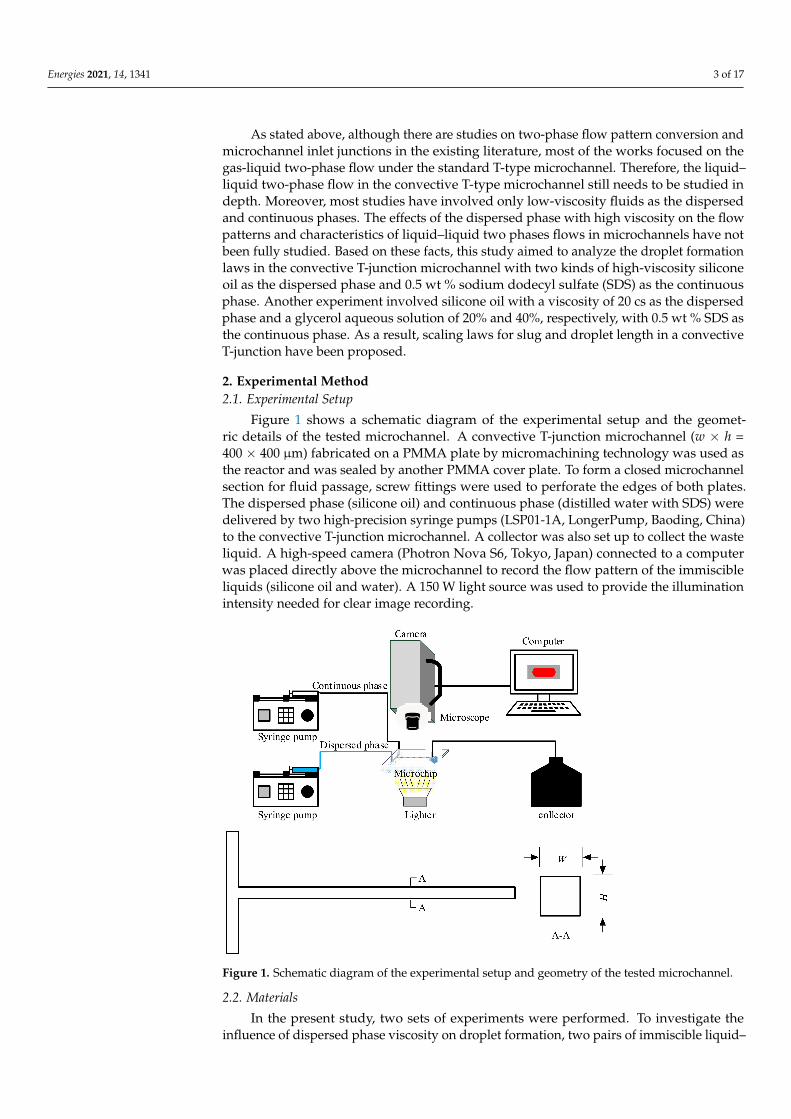
Figure 1 shows a schematic diagram of the experimental setup and the geomet-ric details of the tested microchannel. A convective T-junction microchannel (w × h =400 × 400 µm) fabricated on a PMMA plate by micromachining technology was used asthe reactor and was sealed by another PMMA cover plate. To form a closed microchannelsection for fluid passage, screw fittings were used to perforate the edges of both plates.The dispersed phase (silicone oil) and continuous phase (distilled water with SDS) weredelivered by two high-precision syringe pumps (LSP01-1A, LongerPump, Baoding, China)to the convective T-junction microchannel. A collector was also set up to collect the wasteliquid. A high-speed camera (Photron Nova S6, Tokyo, Japan) connected to a computerwas placed directly above the microchannel to record the flow pattern of the immiscibleliquids (silicone oil and water). A 150 W light source was used to provide the illuminationintensity needed for clear image recording.
Figure 1. Schematic diagram of the experimental setup and geometry of the tested microchannel.
2.2. Materials
In the present study, two sets of experiments were performed. To investigate theinfluence of dispersed phase viscosity on droplet formation, two pairs of immiscible liquid–
Energies 2021, 14, 1341 4 of 17
liquid systems were tested. Water was used as the continuous phase, and silicon oilswith different viscosities were used as the dispersed phase. To explore the influence ofcontinuous phase viscosity on droplet formation, two groups of experiments were setup. A glycerol aqueous solution with different mass fractions of 0.5% SDS was used asthe continuous phase, and silicone oil with a viscosity of 20 cs was used as the dispersedphase. Table 1 gives the physical properties of the fluids (dynamic viscosity µ, density ρand surface tension σ). The liquid phase viscosity was measured by a viscometer (LVDV-II,Brookfield, USA) at room temperature. The interfacial tension of the dispersed phase(silicon oil) in the continuous phase (water) was measured by an interfacial tensiometer(DCAT11EC, Dataphysics, Germany) with the Du Nouy ring method.
Table 1. Liquid properties.
Fluid System µ (Pa·s) ρ (kg/m3) σ (N/m)
Continuous Phase 0.5 wt % SDS 0.00135 971.53 –20 wt % glycerol + 0.5
wt % SDS 0.00182 1039.2 31.5
40 wt % glycerol + 0.5wt % SDS 0.00365 1097.1 31.5
Dispersed phase Silicone oil20cst 0.0268 919.3 0.01064960cst 0.0725 927.4 0.010856
2.3. Experimental Procedure
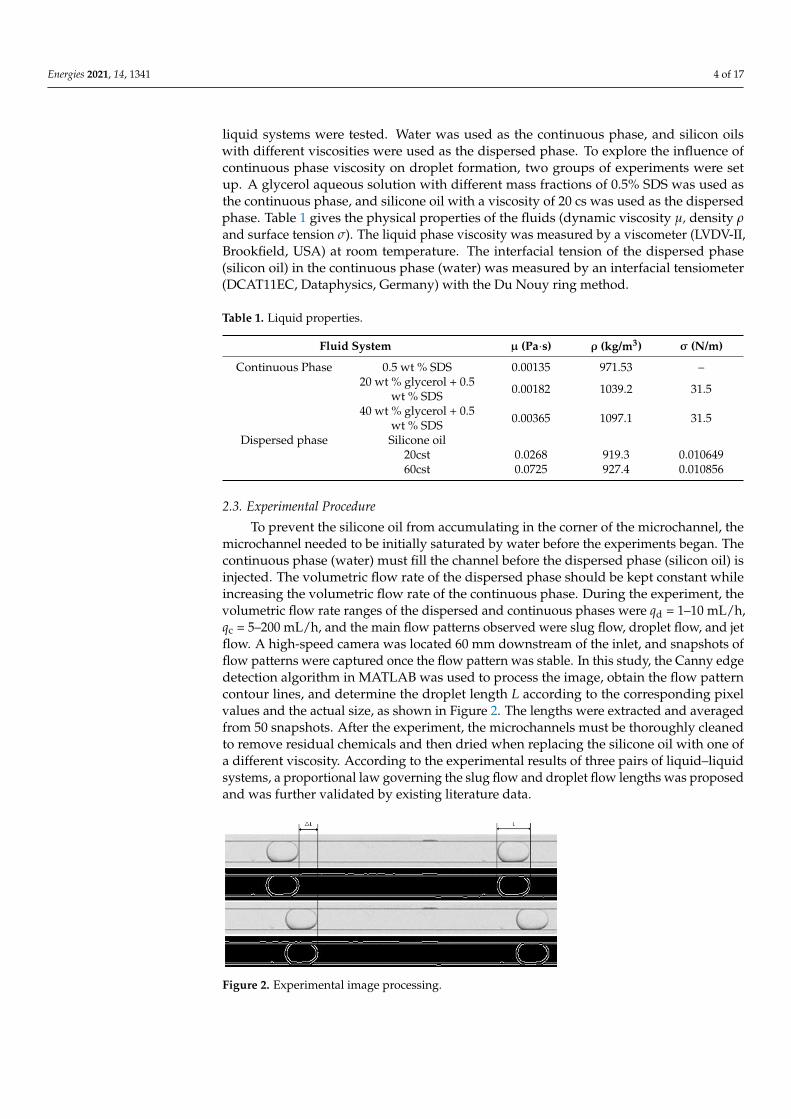
To prevent the silicone oil from accumulating in the corner of the microchannel, themicrochannel needed to be initially saturated by water before the experiments began. Thecontinuous phase (water) must fill the channel before the dispersed phase (silicon oil) isinjected. The volumetric flow rate of the dispersed phase should be kept constant whileincreasing the volumetric flow rate of the continuous phase. During the experiment, thevolumetric flow rate ranges of the dispersed and continuous phases were qd = 1–10 mL/h,qc = 5–200 mL/h, and the main flow patterns observed were slug flow, droplet flow, and jetflow. A high-speed camera was located 60 mm downstream of the inlet, and snapshots offlow patterns were captured once the flow pattern was stable. In this study, the Canny edgedetection algorithm in MATLAB was used to process the image, obtain the flow patterncontour lines, and determine the droplet length L according to the corresponding pixelvalues and the actual size, as shown in Figure 2. The lengths were extracted and averagedfrom 50 snapshots. After the experiment, the microchannels must be thoroughly cleanedto remove residual chemicals and then dried when replacing the silicone oil with one ofa different viscosity. According to the experimental results of three pairs of liquid–liquidsystems, a proportional law governing the slug flow and droplet flow lengths was proposedand was further validated by existing literature data.
Figure 2. Experimental image processing.
Energies 2021, 14, 1341 5 of 17
3. Results and Discussion
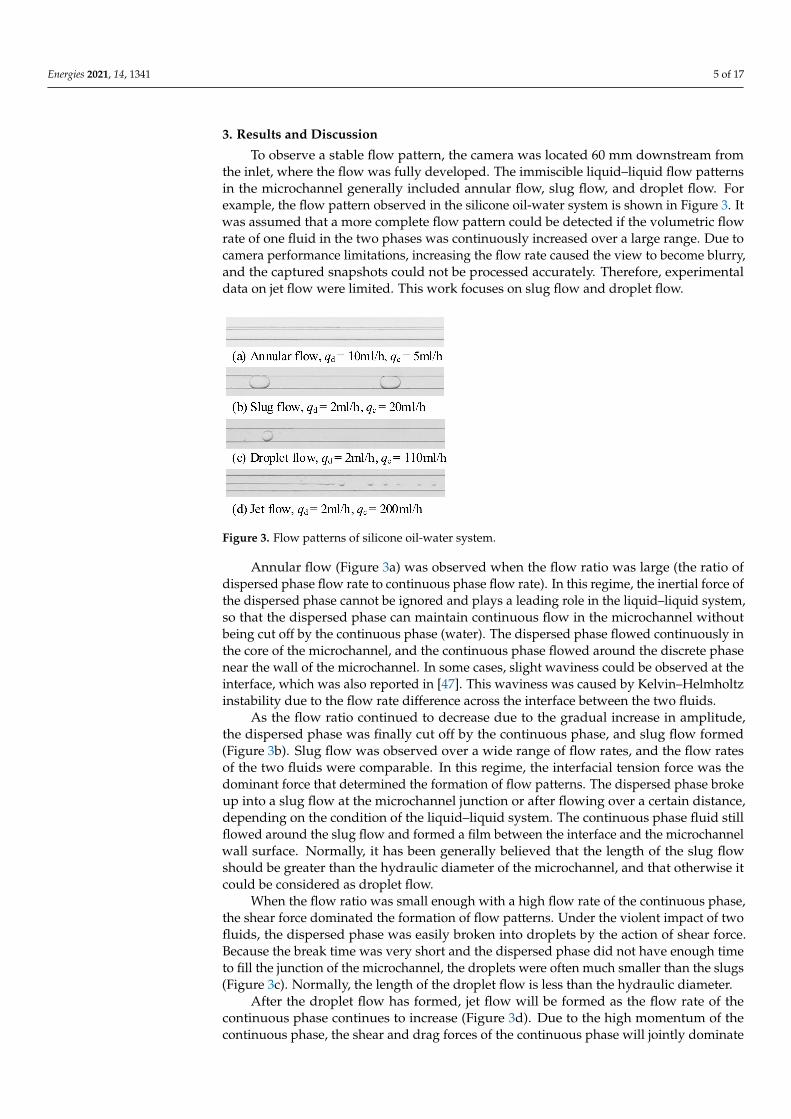
To observe a stable flow pattern, the camera was located 60 mm downstream fromthe inlet, where the flow was fully developed. The immiscible liquid–liquid flow patternsin the microchannel generally included annular flow, slug flow, and droplet flow. Forexample, the flow pattern observed in the silicone oil-water system is shown in Figure 3. Itwas assumed that a more complete flow pattern could be detected if the volumetric flowrate of one fluid in the two phases was continuously increased over a large range. Due tocamera performance limitations, increasing the flow rate caused the view to become blurry,and the captured snapshots could not be processed accurately. Therefore, experimentaldata on jet flow were limited. This work focuses on slug flow and droplet flow.
Figure 3. Flow patterns of silicone oil-water system.
Annular flow (Figure 3a) was observed when the flow ratio was large (the ratio ofdispersed phase flow rate to continuous phase flow rate). In this regime, the inertial force ofthe dispersed phase cannot be ignored and plays a leading role in the liquid–liquid system,so that the dispersed phase can maintain continuous flow in the microchannel withoutbeing cut off by the continuous phase (water). The dispersed phase flowed continuously inthe core of the microchannel, and the continuous phase flowed around the discrete phasenear the wall of the microchannel. In some cases, slight waviness could be observed at theinterface, which was also reported in [47]. This waviness was caused by Kelvin–Helmholtzinstability due to the flow rate difference across the interface between the two fluids.
As the flow ratio continued to decrease due to the gradual increase in amplitude,the dispersed phase was finally cut off by the continuous phase, and slug flow formed(Figure 3b). Slug flow was observed over a wide range of flow rates, and the flow ratesof the two fluids were comparable. In this regime, the interfacial tension force was thedominant force that determined the formation of flow patterns. The dispersed phase brokeup into a slug flow at the microchannel junction or after flowing over a certain distance,depending on the condition of the liquid–liquid system. The continuous phase fluid stillflowed around the slug flow and formed a film between the interface and the microchannelwall surface. Normally, it has been generally believed that the length of the slug flowshould be greater than the hydraulic diameter of the microchannel, and that otherwise itcould be considered as droplet flow.
When the flow ratio was small enough with a high flow rate of the continuous phase,the shear force dominated the formation of flow patterns. Under the violent impact of twofluids, the dispersed phase was easily broken into droplets by the action of shear force.Because the break time was very short and the dispersed phase did not have enough timeto fill the junction of the microchannel, the droplets were often much smaller than the slugs(Figure 3c). Normally, the length of the droplet flow is less than the hydraulic diameter.
After the droplet flow has formed, jet flow will be formed as the flow rate of thecontinuous phase continues to increase (Figure 3d). Due to the high momentum of thecontinuous phase, the shear and drag forces of the continuous phase will jointly dominate
Energies 2021, 14, 1341 6 of 17
the formation of flow patterns. The drag forces caused the dispersed phase fluid to bedrawn thin and long and to flow away from the wall in the core of the microchannel, afterwhich the shear forces rapidly cut up the elongated dispersed phase. This produced jetsthat were much smaller than droplets.
3.1. Flow Pattern Maps
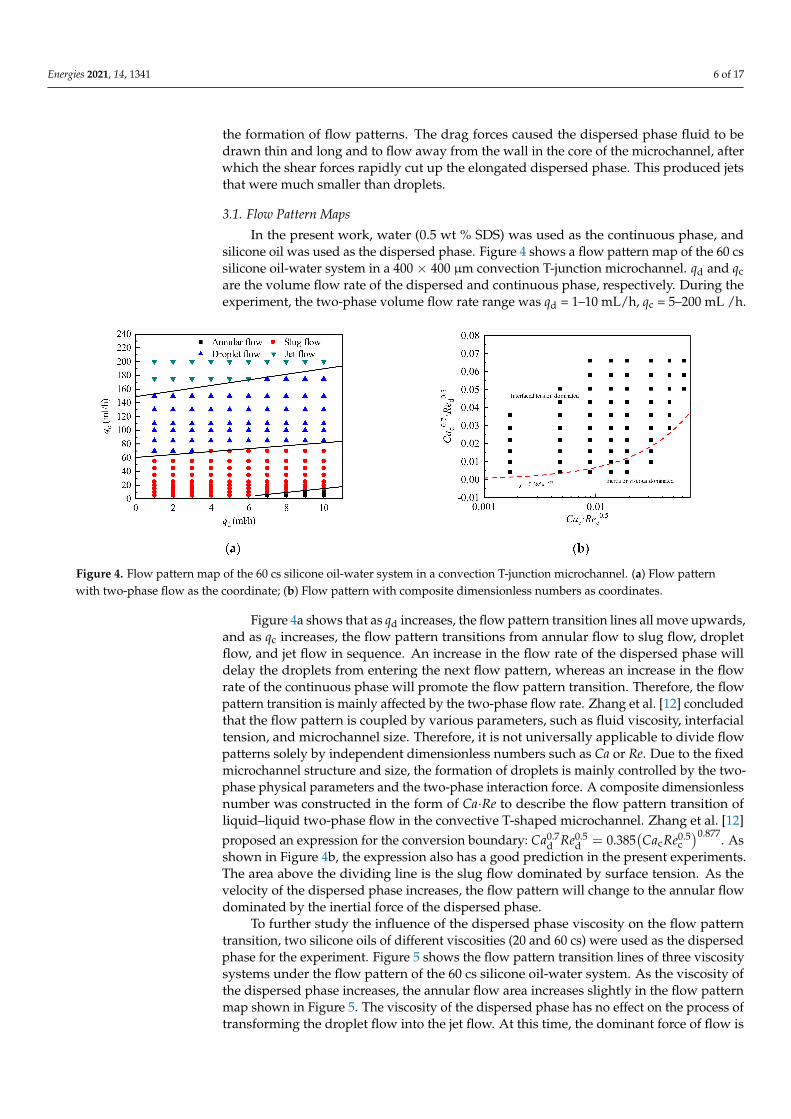
In the present work, water (0.5 wt % SDS) was used as the continuous phase, andsilicone oil was used as the dispersed phase. Figure 4 shows a flow pattern map of the 60 cssilicone oil-water system in a 400 × 400 µm convection T-junction microchannel. qd and qcare the volume flow rate of the dispersed and continuous phase, respectively. During theexperiment, the two-phase volume flow rate range was qd = 1–10 mL/h, qc = 5–200 mL /h.
Figure 4. Flow pattern map of the 60 cs silicone oil-water system in a convection T-junction microchannel. (a) Flow patternwith two-phase flow as the coordinate; (b) Flow pattern with composite dimensionless numbers as coordinates.
Figure 4a shows that as qd increases, the flow pattern transition lines all move upwards,and as qc increases, the flow pattern transitions from annular flow to slug flow, dropletflow, and jet flow in sequence. An increase in the flow rate of the dispersed phase willdelay the droplets from entering the next flow pattern, whereas an increase in the flowrate of the continuous phase will promote the flow pattern transition. Therefore, the flowpattern transition is mainly affected by the two-phase flow rate. Zhang et al. [12] concludedthat the flow pattern is coupled by various parameters, such as fluid viscosity, interfacialtension, and microchannel size. Therefore, it is not universally applicable to divide flowpatterns solely by independent dimensionless numbers such as Ca or Re. Due to the fixedmicrochannel structure and size, the formation of droplets is mainly controlled by the two-phase physical parameters and the two-phase interaction force. A composite dimensionlessnumber was constructed in the form of Ca·Re to describe the flow pattern transition ofliquid–liquid two-phase flow in the convective T-shaped microchannel. Zhang et al. [12]proposed an expression for the conversion boundary: Ca0.7
d Re0.5d = 0.385
(CacRe0.5
c)0.877. As
shown in Figure 4b, the expression also has a good prediction in the present experiments.The area above the dividing line is the slug flow dominated by surface tension. As thevelocity of the dispersed phase increases, the flow pattern will change to the annular flowdominated by the inertial force of the dispersed phase.
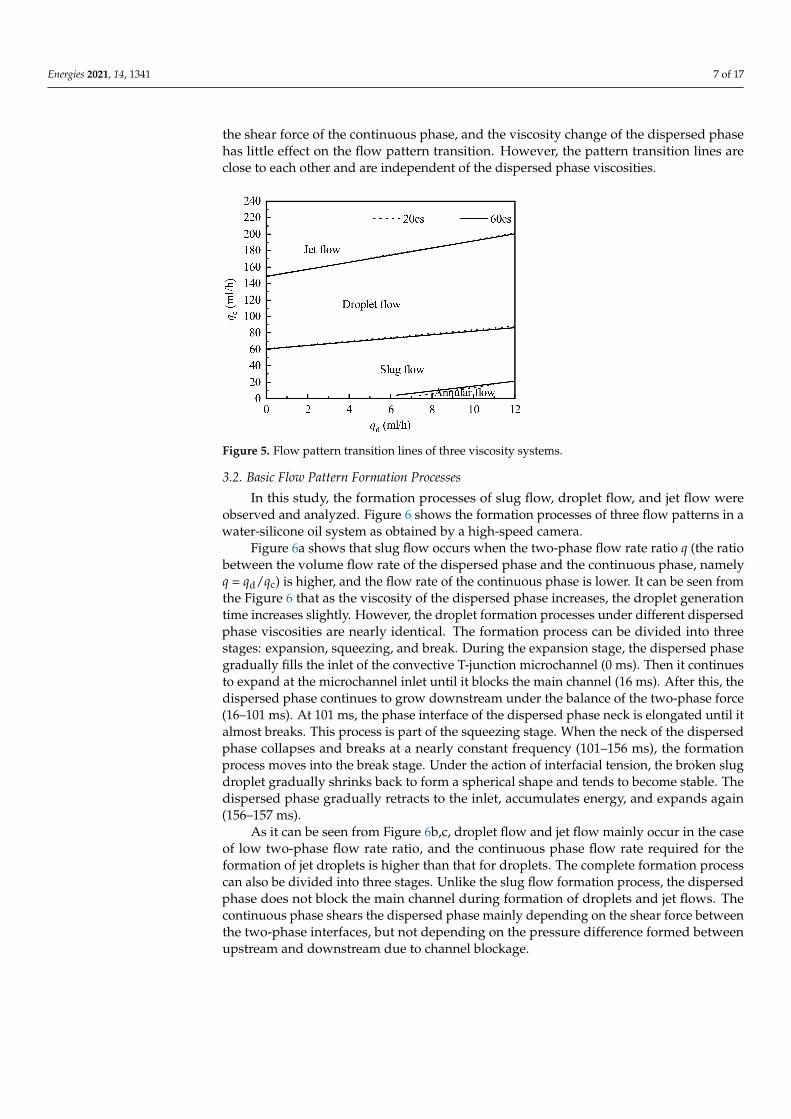
To further study the influence of the dispersed phase viscosity on the flow patterntransition, two silicone oils of different viscosities (20 and 60 cs) were used as the dispersedphase for the experiment. Figure 5 shows the flow pattern transition lines of three viscositysystems under the flow pattern of the 60 cs silicone oil-water system. As the viscosity ofthe dispersed phase increases, the annular flow area increases slightly in the flow patternmap shown in Figure 5. The viscosity of the dispersed phase has no effect on the process oftransforming the droplet flow into the jet flow. At this time, the dominant force of flow is
Energies 2021, 14, 1341 7 of 17
the shear force of the continuous phase, and the viscosity change of the dispersed phasehas little effect on the flow pattern transition. However, the pattern transition lines areclose to each other and are independent of the dispersed phase viscosities.
Figure 5. Flow pattern transition lines of three viscosity systems.
3.2. Basic Flow Pattern Formation Processes
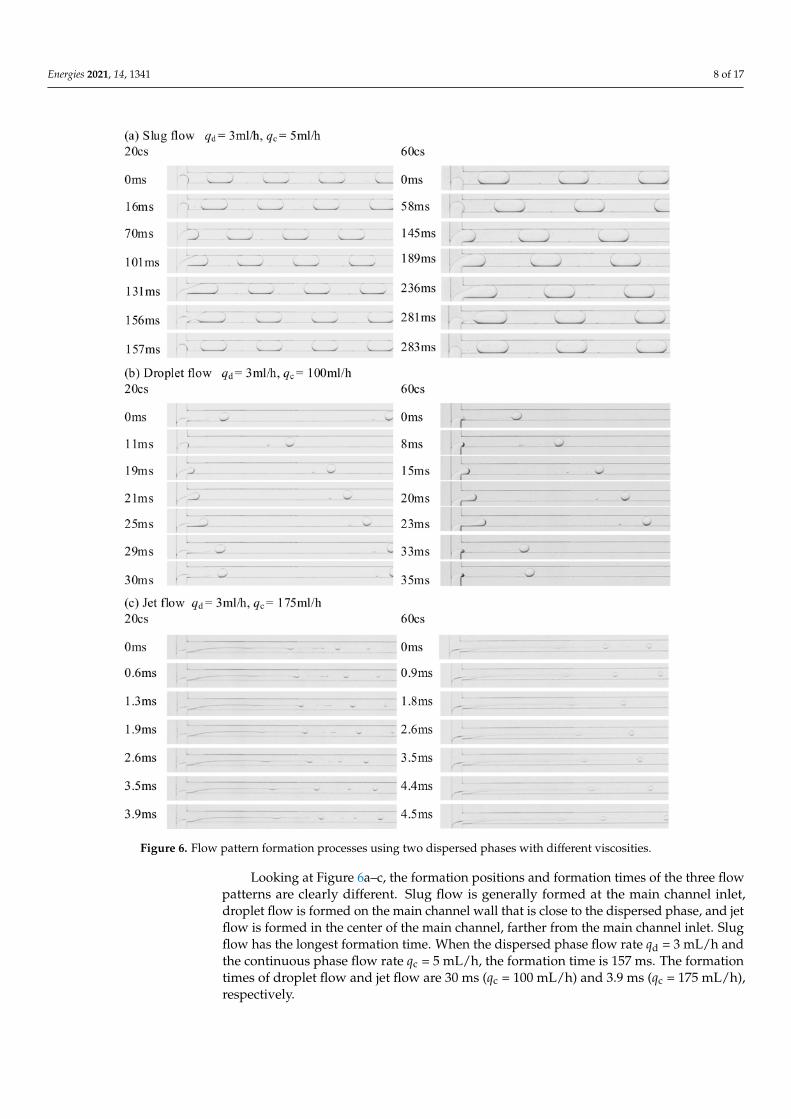
In this study, the formation processes of slug flow, droplet flow, and jet flow wereobserved and analyzed. Figure 6 shows the formation processes of three flow patterns in awater-silicone oil system as obtained by a high-speed camera.
Figure 6a shows that slug flow occurs when the two-phase flow rate ratio q (the ratiobetween the volume flow rate of the dispersed phase and the continuous phase, namelyq = qd/qc) is higher, and the flow rate of the continuous phase is lower. It can be seen fromthe Figure 6 that as the viscosity of the dispersed phase increases, the droplet generationtime increases slightly. However, the droplet formation processes under different dispersedphase viscosities are nearly identical. The formation process can be divided into threestages: expansion, squeezing, and break. During the expansion stage, the dispersed phasegradually fills the inlet of the convective T-junction microchannel (0 ms). Then it continuesto expand at the microchannel inlet until it blocks the main channel (16 ms). After this, thedispersed phase continues to grow downstream under the balance of the two-phase force(16–101 ms). At 101 ms, the phase interface of the dispersed phase neck is elongated until italmost breaks. This process is part of the squeezing stage. When the neck of the dispersedphase collapses and breaks at a nearly constant frequency (101–156 ms), the formationprocess moves into the break stage. Under the action of interfacial tension, the broken slugdroplet gradually shrinks back to form a spherical shape and tends to become stable. Thedispersed phase gradually retracts to the inlet, accumulates energy, and expands again(156–157 ms).
As it can be seen from Figure 6b,c, droplet flow and jet flow mainly occur in the caseof low two-phase flow rate ratio, and the continuous phase flow rate required for theformation of jet droplets is higher than that for droplets. The complete formation processcan also be divided into three stages. Unlike the slug flow formation process, the dispersedphase does not block the main channel during formation of droplets and jet flows. Thecontinuous phase shears the dispersed phase mainly depending on the shear force betweenthe two-phase interfaces, but not depending on the pressure difference formed betweenupstream and downstream due to channel blockage.
Energies 2021, 14, 1341 8 of 17
Figure 6. Flow pattern formation processes using two dispersed phases with different viscosities.
Looking at Figure 6a–c, the formation positions and formation times of the three flowpatterns are clearly different. Slug flow is generally formed at the main channel inlet,droplet flow is formed on the main channel wall that is close to the dispersed phase, and jetflow is formed in the center of the main channel, farther from the main channel inlet. Slugflow has the longest formation time. When the dispersed phase flow rate qd = 3 mL/h andthe continuous phase flow rate qc = 5 mL/h, the formation time is 157 ms. The formationtimes of droplet flow and jet flow are 30 ms (qc = 100 mL/h) and 3.9 ms (qc = 175 mL/h),respectively.
Energies 2021, 14, 1341 9 of 17
3.3. Analysis of Influencing Factors on Slug and Droplet Length
As mentioned above, flow patterns are affected by two-phase flow parameters, two-phase physical properties, and inertial force, viscous force, interfacial tension, and otherforces. The study of two-phase flow rate, flow rate ratio, and continuous phase capillarynumber is likely to yield the scaling laws of slug and droplet length. Formation of slug flowwas observed in the experiment when Cac < 0.01 and the length Ld was mostly greater than0.48 mm, namely when Ld/W > 1.2. Droplet flow formation mainly occurred at Cac > 0.015when the droplet length Ld was generally less than 0.4 mm, namely when Ld/W < 1. WhenCac was between 0.01 and 0.015, a slug-to-droplet transition flow resulted.
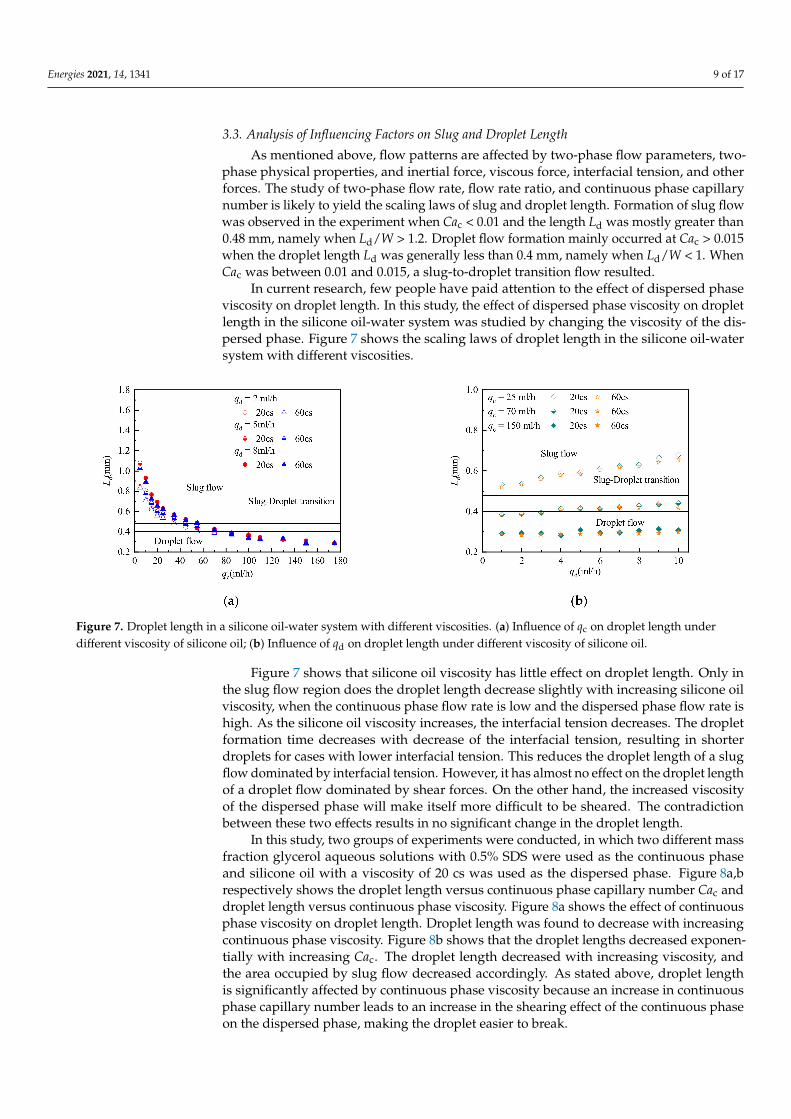
In current research, few people have paid attention to the effect of dispersed phaseviscosity on droplet length. In this study, the effect of dispersed phase viscosity on dropletlength in the silicone oil-water system was studied by changing the viscosity of the dis-persed phase. Figure 7 shows the scaling laws of droplet length in the silicone oil-watersystem with different viscosities.
Figure 7. Droplet length in a silicone oil-water system with different viscosities. (a) Influence of qc on droplet length underdifferent viscosity of silicone oil; (b) Influence of qd on droplet length under different viscosity of silicone oil.
Figure 7 shows that silicone oil viscosity has little effect on droplet length. Only inthe slug flow region does the droplet length decrease slightly with increasing silicone oilviscosity, when the continuous phase flow rate is low and the dispersed phase flow rate ishigh. As the silicone oil viscosity increases, the interfacial tension decreases. The dropletformation time decreases with decrease of the interfacial tension, resulting in shorterdroplets for cases with lower interfacial tension. This reduces the droplet length of a slugflow dominated by interfacial tension. However, it has almost no effect on the droplet lengthof a droplet flow dominated by shear forces. On the other hand, the increased viscosityof the dispersed phase will make itself more difficult to be sheared. The contradictionbetween these two effects results in no significant change in the droplet length.
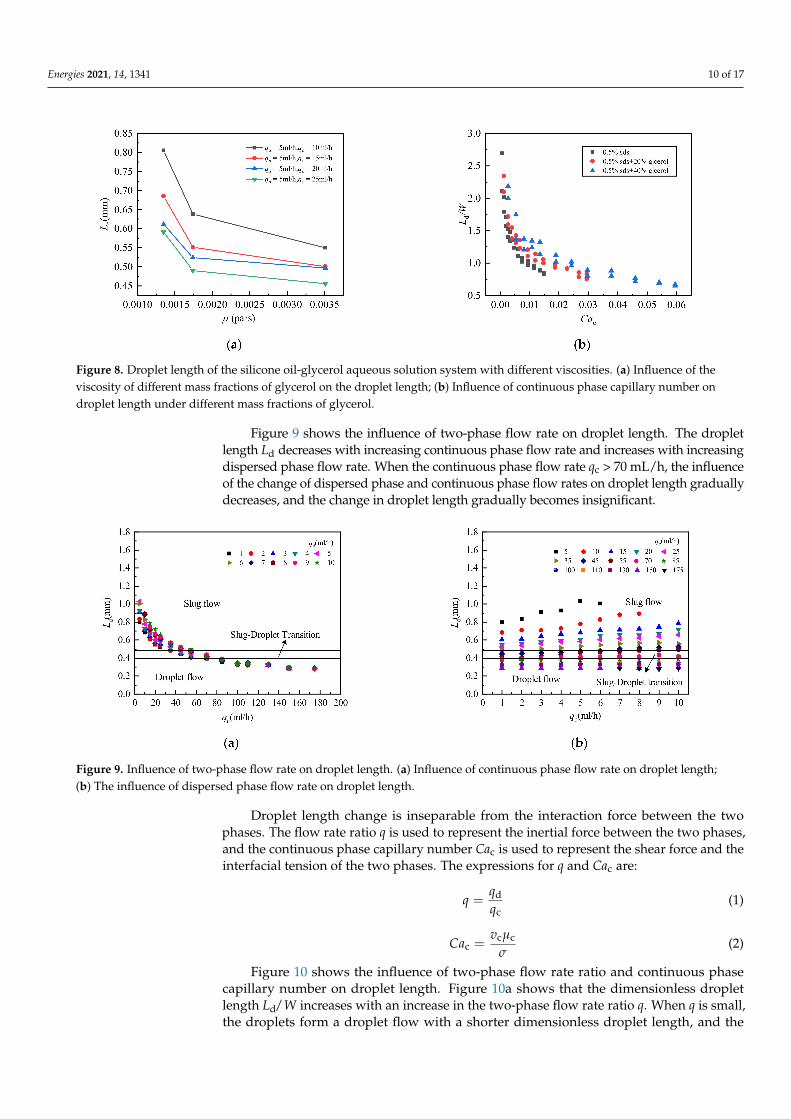
In this study, two groups of experiments were conducted, in which two different massfraction glycerol aqueous solutions with 0.5% SDS were used as the continuous phaseand silicone oil with a viscosity of 20 cs was used as the dispersed phase. Figure 8a,brespectively shows the droplet length versus continuous phase capillary number Cac anddroplet length versus continuous phase viscosity. Figure 8a shows the effect of continuousphase viscosity on droplet length. Droplet length was found to decrease with increasingcontinuous phase viscosity. Figure 8b shows that the droplet lengths decreased exponen-tially with increasing Cac. The droplet length decreased with increasing viscosity, andthe area occupied by slug flow decreased accordingly. As stated above, droplet lengthis significantly affected by continuous phase viscosity because an increase in continuousphase capillary number leads to an increase in the shearing effect of the continuous phaseon the dispersed phase, making the droplet easier to break.
Energies 2021, 14, 1341 10 of 17
Figure 8. Droplet length of the silicone oil-glycerol aqueous solution system with different viscosities. (a) Influence of theviscosity of different mass fractions of glycerol on the droplet length; (b) Influence of continuous phase capillary number ondroplet length under different mass fractions of glycerol.
Figure 9 shows the influence of two-phase flow rate on droplet length. The dropletlength Ld decreases with increasing continuous phase flow rate and increases with increasingdispersed phase flow rate. When the continuous phase flow rate qc > 70 mL/h, the influenceof the change of dispersed phase and continuous phase flow rates on droplet length graduallydecreases, and the change in droplet length gradually becomes insignificant.
Figure 9. Influence of two-phase flow rate on droplet length. (a) Influence of continuous phase flow rate on droplet length;(b) The influence of dispersed phase flow rate on droplet length.
Droplet length change is inseparable from the interaction force between the twophases. The flow rate ratio q is used to represent the inertial force between the two phases,and the continuous phase capillary number Cac is used to represent the shear force and theinterfacial tension of the two phases. The expressions for q and Cac are:
q =qdqc
(1)
Cac =vcµc
σ(2)
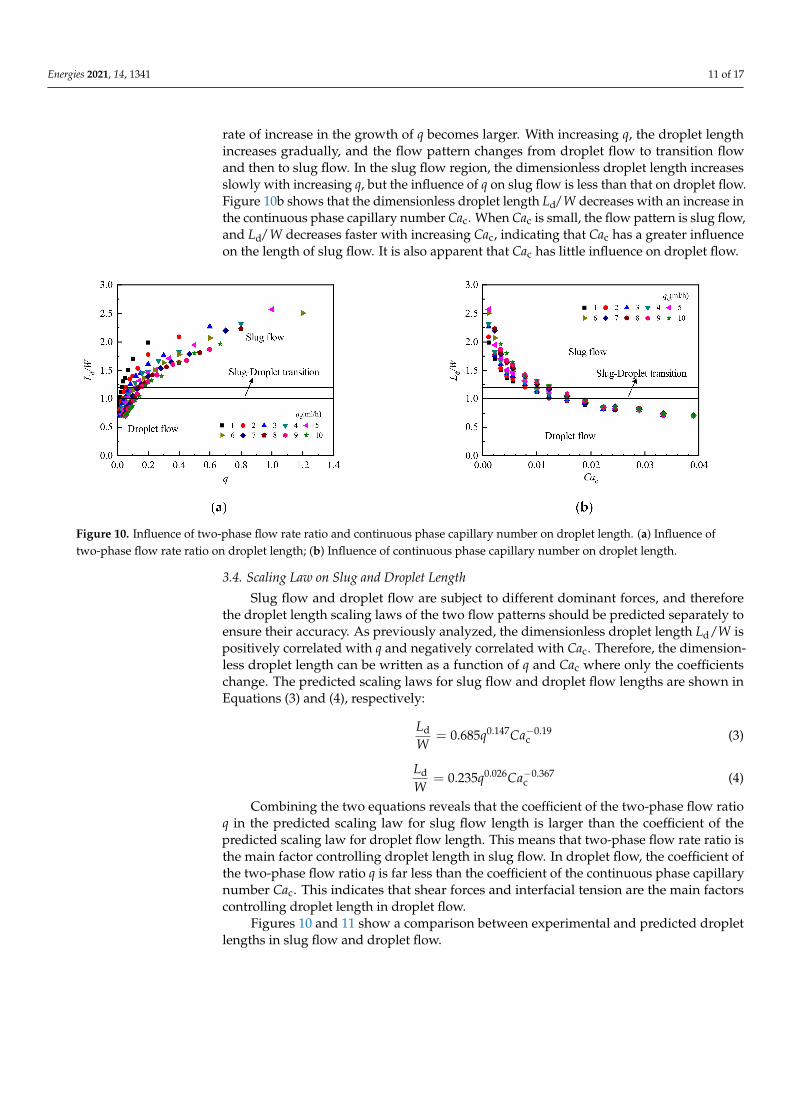
Figure 10 shows the influence of two-phase flow rate ratio and continuous phasecapillary number on droplet length. Figure 10a shows that the dimensionless dropletlength Ld/ W increases with an increase in the two-phase flow rate ratio q. When q is small,the droplets form a droplet flow with a shorter dimensionless droplet length, and the
Energies 2021, 14, 1341 11 of 17
rate of increase in the growth of q becomes larger. With increasing q, the droplet lengthincreases gradually, and the flow pattern changes from droplet flow to transition flowand then to slug flow. In the slug flow region, the dimensionless droplet length increasesslowly with increasing q, but the influence of q on slug flow is less than that on droplet flow.Figure 10b shows that the dimensionless droplet length Ld/ W decreases with an increase inthe continuous phase capillary number Cac. When Cac is small, the flow pattern is slug flow,and Ld/ W decreases faster with increasing Cac, indicating that Cac has a greater influenceon the length of slug flow. It is also apparent that Cac has little influence on droplet flow.
Figure 10. Influence of two-phase flow rate ratio and continuous phase capillary number on droplet length. (a) Influence oftwo-phase flow rate ratio on droplet length; (b) Influence of continuous phase capillary number on droplet length.
3.4. Scaling Law on Slug and Droplet Length
Slug flow and droplet flow are subject to different dominant forces, and thereforethe droplet length scaling laws of the two flow patterns should be predicted separately toensure their accuracy. As previously analyzed, the dimensionless droplet length Ld/W ispositively correlated with q and negatively correlated with Cac. Therefore, the dimension-less droplet length can be written as a function of q and Cac where only the coefficientschange. The predicted scaling laws for slug flow and droplet flow lengths are shown inEquations (3) and (4), respectively:
LdW
= 0.685q0.147Ca−0.19c (3)
LdW
= 0.235q0.026Ca−0.367c (4)
Combining the two equations reveals that the coefficient of the two-phase flow ratioq in the predicted scaling law for slug flow length is larger than the coefficient of thepredicted scaling law for droplet flow length. This means that two-phase flow rate ratio isthe main factor controlling droplet length in slug flow. In droplet flow, the coefficient ofthe two-phase flow ratio q is far less than the coefficient of the continuous phase capillarynumber Cac. This indicates that shear forces and interfacial tension are the main factorscontrolling droplet length in droplet flow.
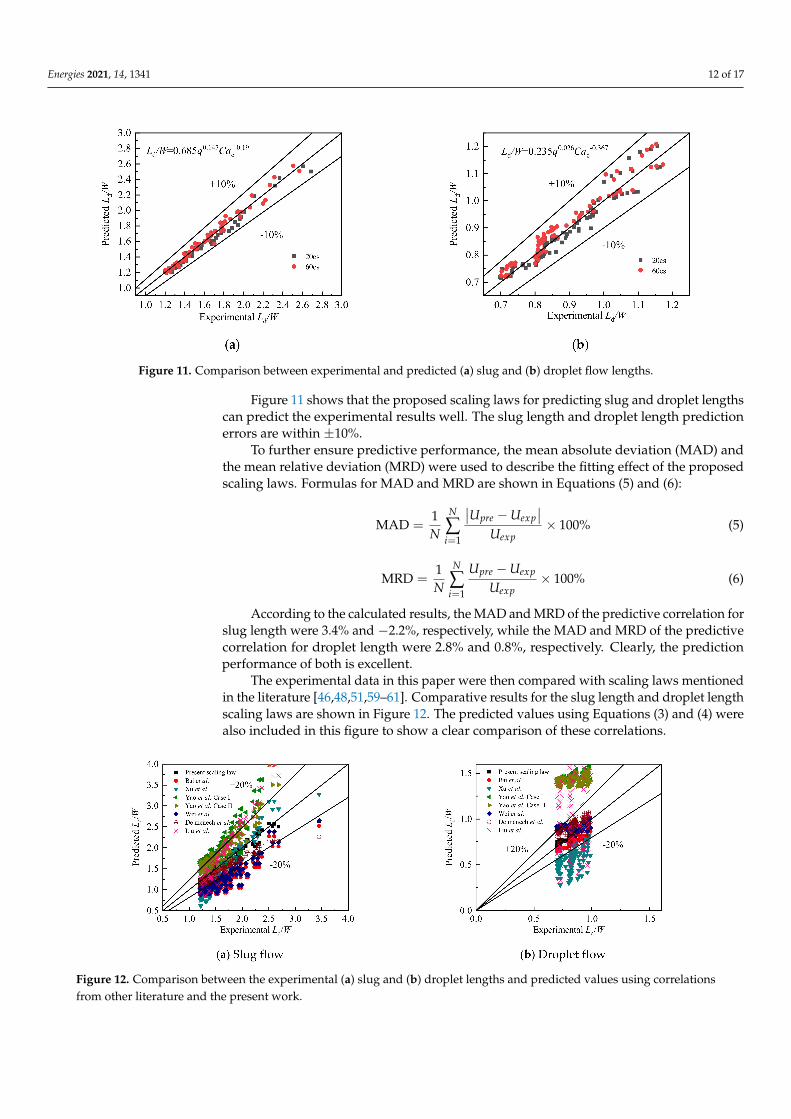
Figures 10 and 11 show a comparison between experimental and predicted dropletlengths in slug flow and droplet flow.
Energies 2021, 14, 1341 12 of 17
Figure 11. Comparison between experimental and predicted (a) slug and (b) droplet flow lengths.
Figure 11 shows that the proposed scaling laws for predicting slug and droplet lengthscan predict the experimental results well. The slug length and droplet length predictionerrors are within ±10%.
To further ensure predictive performance, the mean absolute deviation (MAD) andthe mean relative deviation (MRD) were used to describe the fitting effect of the proposedscaling laws. Formulas for MAD and MRD are shown in Equations (5) and (6):
MAD =1N
N
∑i=1
∣∣Upre − Uexp∣∣
Uexp× 100% (5)
MRD =1N
N
∑i=1
Upre − Uexp
Uexp× 100% (6)
According to the calculated results, the MAD and MRD of the predictive correlation forslug length were 3.4% and −2.2%, respectively, while the MAD and MRD of the predictivecorrelation for droplet length were 2.8% and 0.8%, respectively. Clearly, the predictionperformance of both is excellent.
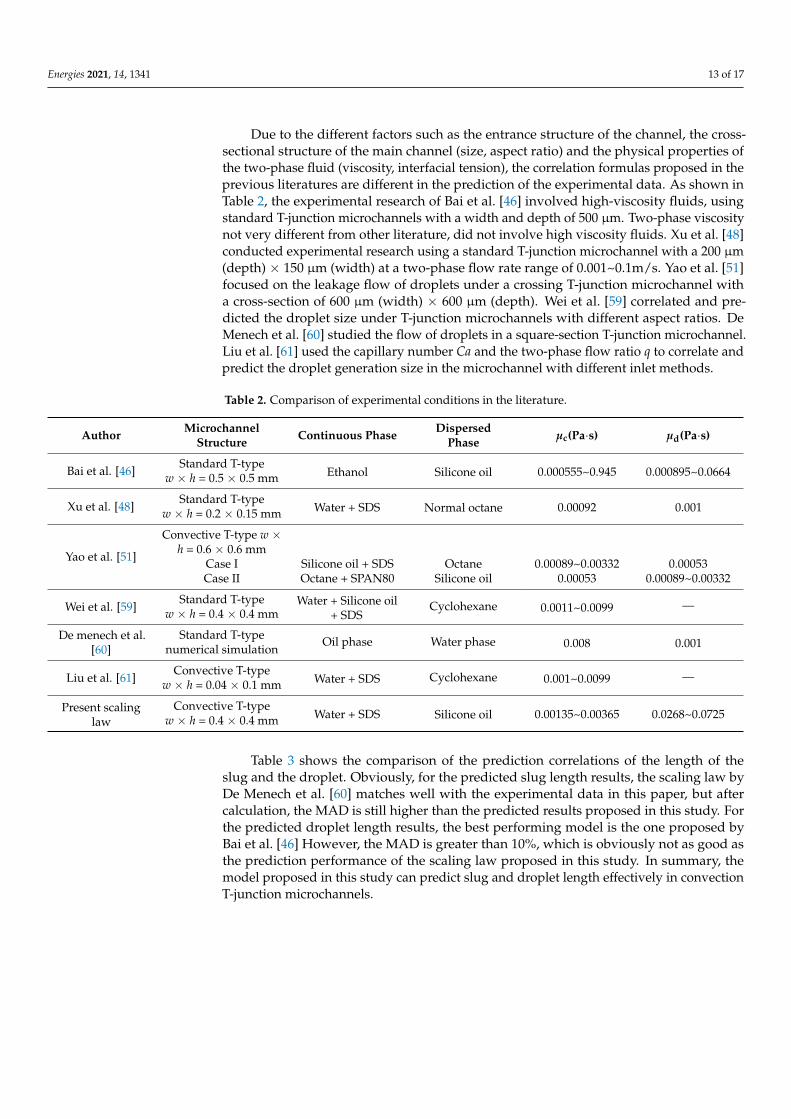
The experimental data in this paper were then compared with scaling laws mentionedin the literature [46,48,51,59–61]. Comparative results for the slug length and droplet lengthscaling laws are shown in Figure 12. The predicted values using Equations (3) and (4) werealso included in this figure to show a clear comparison of these correlations.
Figure 12. Comparison between the experimental (a) slug and (b) droplet lengths and predicted values using correlationsfrom other literature and the present work.
Energies 2021, 14, 1341 13 of 17
Due to the different factors such as the entrance structure of the channel, the cross-sectional structure of the main channel (size, aspect ratio) and the physical properties ofthe two-phase fluid (viscosity, interfacial tension), the correlation formulas proposed in theprevious literatures are different in the prediction of the experimental data. As shown inTable 2, the experimental research of Bai et al. [46] involved high-viscosity fluids, usingstandard T-junction microchannels with a width and depth of 500 µm. Two-phase viscositynot very different from other literature, did not involve high viscosity fluids. Xu et al. [48]conducted experimental research using a standard T-junction microchannel with a 200 µm(depth) × 150 µm (width) at a two-phase flow rate range of 0.001~0.1m/s. Yao et al. [51]focused on the leakage flow of droplets under a crossing T-junction microchannel witha cross-section of 600 µm (width) × 600 µm (depth). Wei et al. [59] correlated and pre-dicted the droplet size under T-junction microchannels with different aspect ratios. DeMenech et al. [60] studied the flow of droplets in a square-section T-junction microchannel.Liu et al. [61] used the capillary number Ca and the two-phase flow ratio q to correlate andpredict the droplet generation size in the microchannel with different inlet methods.
Table 2. Comparison of experimental conditions in the literature.
Author MicrochannelStructure Continuous Phase Dispersed
Phase µc(Pa·s) µd(Pa·s)
Bai et al. [46]Standard T-type
Ethanol Silicone oil 0.000555~0.945 0.000895~0.0664w × h = 0.5 × 0.5 mm
Xu et al. [48]Standard T-type
Water + SDS Normal octane 0.00092 0.001w × h = 0.2 × 0.15 mm
Yao et al. [51]
Convective T-type w ×h = 0.6 × 0.6 mm
Case I Silicone oil + SDS Octane 0.00089~0.00332 0.00053Case II Octane + SPAN80 Silicone oil 0.00053 0.00089~0.00332
Wei et al. [59]Standard T-type Water + Silicone oil
+ SDSCyclohexane 0.0011~0.0099 —
w × h = 0.4 × 0.4 mm
De menech et al.[60]
Standard T-type Oil phase Water phase 0.008 0.001numerical simulation
Liu et al. [61]Convective T-type
Water + SDS Cyclohexane 0.001~0.0099 —w × h = 0.04 × 0.1 mm
Present scalinglaw
Convective T-typeWater + SDS Silicone oil 0.00135~0.00365 0.0268~0.0725w × h = 0.4 × 0.4 mm
Table 3 shows the comparison of the prediction correlations of the length of theslug and the droplet. Obviously, for the predicted slug length results, the scaling law byDe Menech et al. [60] matches well with the experimental data in this paper, but aftercalculation, the MAD is still higher than the predicted results proposed in this study. Forthe predicted droplet length results, the best performing model is the one proposed byBai et al. [46] However, the MAD is greater than 10%, which is obviously not as good asthe prediction performance of the scaling law proposed in this study. In summary, themodel proposed in this study can predict slug and droplet length effectively in convectionT-junction microchannels.
Energies 2021, 14, 1341 14 of 17
Table 3. Comparison of correlation formulas for predicting slug length.
Author CorrelationsSlug Flow Droplet Flow
MAD/% MAD/%
Bai et al. [46]Slug flow: Ld
W = 0.8 + 1.23qDroplet flow: Ld
W = 0.23µc0.1Cac
−0.31 27.5 11.0
Xu et al. [48] LdW = 0.75q
13 Cac
−0.2 15.0 34.5
Yao et al. [51]LdW = 1.34 + 1.623 Qd
Qc−Qleak
Case IQleakQc
= 0.0698q0.0414Cac−0.269
27.6 72.4
Case IIQleakQc
= 0.0282q0.249Cac−0.321
19.6 70.9
Wei et al. [59] LdW = 0.85
(HW
)0.08+ 1.28q
(HW
)−0.54 23.4 11.3
De menech et al. [60] LdW = 0.83q0.14Cac
−0.14 9.14 12.0
Liu et al. [61]Slug flow: Ld
W = 1.17q0.37Cac−0.17
Droplet flow: LdW = 1.43q0.32Cac
−0.25 17.6 57
Present scaling lawSlug flow: Ld
W = 0.685q0.147Cac−0.19
Droplet flow: LdW = 0.235q0.026Cac
−0.367 3.4 2.8
4. Conclusions
In this article, the flow patterns of liquid–liquid two-phase flow and the scaling lawsof droplet length in a convection T-junction microchannel were studied. Silicone oil wasused as the dispersed phase and water as the continuous phase, and the effects of variousfactors on liquid–liquid two-phase system flow characteristics were studied. In more detail,the following conclusions were reached:
1. By combining the flow pattern formation process and force analysis, the formationmechanisms of various flow patterns (annular flow, slug flow, droplet flow, and jetflow) were studied in this experiment. According to the mechanism forming the flowpattern, the pattern was divided into four categories. Annular flow is dominated byinertial force, slug flow is dominated by interfacial tension, droplet flow is dominatedby shear force, and jet flow is controlled by shear force and drag force.
2. The effects of various factors on flow pattern transition and droplet length were ana-lyzed by changing the viscosity of the silicone oil and the two-phase flow parameters.The results show that changing the dispersed phase viscosity affects the flow patterntransition processes of annular flow to slug flow and slug flow to droplet flow, but haslittle effect on slug properties and droplet length. The length is mainly controlled bythe flow rate ratio of the two phases and the continuous phase capillary number. Theincrease in the viscosity of the dispersed phase will increase the droplet generationtime slightly. However, the droplet formation processes under different dispersedphase viscosities in the present work are nearly identical.
3. Using dimensionless analysis, the droplet fluid dynamics were studied, and differ-ent prediction scaling laws were proposed for the slug and droplet lengths formedby different flow patterns. The prediction scaling laws were compared with otherliterature data to further verify their accuracy. The performance was excellent for theprediction results.
Author Contributions: Conceptualization, L.L. and J.Z.; data curation, L.L., Y.Z., W.C. and H.L.;funding acquisition, J.Z.; methodology, W.C.; project administration, L.L. and J.Z.; software, W.C. andX.W.; supervision, L.L. and X.W.; visualization, Y.Z. and H.L.; writing—original draft, L.L. and Y.Z.;writing—review and editing, Y.Z., H.L. and X.W. All authors have read and agreed to the publishedversion of the manuscript.
Energies 2021, 14, 1341 15 of 17
Funding: This research was funded by Guangdong Basic and Applied Basic Research Founda-tion, grant number 2019A1515111116, Key R&D Program of Shandong Province grant number(2019GSF109051, 2019GGX101030), Shandong Provincial Postdoctoral Innovation Project grant num-ber 201902002, and Foundation of Shandong University for Young Scholar’s Future Plans.
Conflicts of Interest: The authors declare no conflict of interest.
Abbreviations
A Area, m2
a Height of the gas phase in the front view, mb Width of the gas phase in the bottom view, mC0 Distribution parameterD Inner diameter, mLd Length of the flow domain, mmLO
* Non-dimensional Laplace constantPDF Probability density functionq Volume flow rate, m3/sS Slip ratioU Superficial velocity, m/sV Volume, m3
x Gas mass fractionGreek letters
α Void fractionβ Volumetric gas flow ratioµ Dynamic viscosity, Pa·sρ Density, kg/m3
σ Surface tension, N/mτ Time, s
Subscriptscs Cross-sectionalvol Volumetricg Gas phasel Liquid phasem Mixture of gas and liquid two phasesp Piped Droplet
References1. Manz, A.; Graber, N.; Widmer, H. Miniaturized total chemical analysis systems: A novel concept for chemical sensing. Sens.
Actuators B Chem. 1990, 1, 244–248. [CrossRef]2. Bardiya, N.; Choi, J.-W.; Chang, S.-I. Analysis of single nucleotide polymorphism in human angiogenin using droplet-based
microfluidics. BioChip J. 2014, 8, 15–21. [CrossRef]3. Dittrich, P.S.; Manz, A. Lab-on-a-chip: Microfluidics in drug discovery. Nat. Rev. Drug Discov. 2006, 5, 210–218. [CrossRef]4. Du, G.-S.; Pan, J.-Z.; Zhao, S.-P.; Zhu, Y.; Toonder, J.M.D.; Fang, Q. Cell-Based Drug Combination Screening with a Microfluidic
Droplet Array System. Anal. Chem. 2013, 85, 6740–6747. [CrossRef] [PubMed]5. Günther, A.; Jensen, K.F. Multiphase microfluidics: From flow characteristics to chemical and materials synthesis. Lab Chip 2006,
6, 1487–1503. [CrossRef] [PubMed]6. Jensen, K.F. Microreaction engineering—Is small better? Chem. Eng. Sci. 2001, 56, 293–303. [CrossRef]7. Zhao, C.-X. Multiphase flow microfluidics for the production of single or multiple emulsions for drug delivery. Adv. Drug Deliv.
Rev. 2013, 65, 1420–1446. [CrossRef]8. Kinoshita, H.; Kaneda, S.; Fujii, T.; Oshima, M. Three-dimensional measurement and visualization of internal flow of a moving
droplet using confocal micro-PIV. Lab Chip 2007, 7, 338–346. [CrossRef] [PubMed]9. Song, H.; Bringer, M.R.; Tice, J.D.; Gerdts, C.J.; Ismagilov, R.F. Experimental test of scaling of mixing by chaotic advection in
droplets moving through microfluidic channels. Appl. Phys. Lett. 2003, 83, 4664–4666. [CrossRef]10. Adamo, A.; Beingessner, R.L.; Behnam, M.; Chen, J.; Jamison, T.F.; Jensen, K.F.; Monbaliu, J.-C.M.; Myerson, A.S.; Revalor, E.M.;
Snead, D.R.; et al. On-demand continuous-flow production of pharmaceuticals in a compact, reconfigurable system. Science 2016,352, 61–67. [CrossRef] [PubMed]
Energies 2021, 14, 1341 16 of 17
11. Yao, C.; Zhao, Y.; Chen, G. Multiphase processes with ionic liquids in microreactors: Hydrodynamics, mass transfer andapplications. Chem. Eng. Sci. 2018, 189, 340–359. [CrossRef]
12. Zhang, Q.; Liu, H.; Zhao, S.; Yao, C.; Chen, G. Hydrodynamics and mass transfer characteristics of liquid–liquid slug flow inmicrochannels: The effects of temperature, fluid properties and channel size. Chem. Eng. J. 2019, 358, 794–805. [CrossRef]
13. Zhou, F.; Zhang, B.; Yao, C.; Zhu, K.; Yang, M.; Chen, G. Cyclization of Pseudoionone Catalyzed by Sulfuric Acid in a Microreactor.Chem. Eng. Technol. 2016, 39, 849–856. [CrossRef]
14. Winkelman, J.G.; Schuur, B.; Heeres, H.J.; Yue, J. Lactic Acid Extraction and Mass Transfer Characteristics in Slug Flow CapillaryMicroreactors. Ind. Eng. Chem. Res. 2016, 55, 4691–4702.
15. Yang, L.; Zhao, Y.; Su, Y.; Chen, G. An Experimental Study of Copper Extraction Characteristics in a T-Junction Microchannel.Chem. Eng. Technol. 2013, 36, 985–992. [CrossRef]
16. Zhao, Z.; Zhao, K.; Jia, D.; Jiang, P.; Shen, R. Numerical Investigation on the Flow and Heat Transfer Characteristics of SupercriticalLiquefied Natural Gas in an Airfoil Fin Printed Circuit Heat Exchanger. Energies 2017, 10, 1828. [CrossRef]
17. Foroughi, H.; Abbasi, A.; Das, K.S.; Kawaji, M. Immiscible displacement of oil by water in a microchannel: Asymmetric flowbehavior and nonlinear stability analysis of core-annular flow. Phys. Rev. E 2012, 85. [CrossRef]
18. Ling, B.; Khan, H.J.; Druhan, J.L.; Battiato, I. Multi-Scale Microfluidics for Transport in Shale Fabric. Energies 2020, 14, 21.[CrossRef]
19. Litster, S.; Sinton, D.; Djilali, N. Ex situ visualization of liquid water transport in PEM fuel cell gas diffusion layers. J. PowerSources 2006, 154, 95–105. [CrossRef]
20. Zhang, J.; Li, W. Investigation of hydrodynamic and heat transfer characteristics of gas–liquid Taylor flow in vertical capillaries.Int. Commun. Heat Mass Transf. 2016, 74, 1–10. [CrossRef]
21. Zhang, J.; Li, W. Thermal and Flow Characteristics of Water–Nitrogen Taylor Flow inside Vertical Circular Tubes. J. Heat Transf.2018, 140, 082004. [CrossRef]
22. Zunlong, J.; Shuiyun, L.; Mingshan, L. Numerical simulation of gas-liquid two-phase flow in a convection T-junction microchan-nels. Cryo. Supercond. 2013, 41, 42–46, 51.
23. Markovic, T.; Ocket, I.; Baric, A.; Nauwelaers, B. Design and Comparison of Resonant and Non-Resonant Single-Layer MicrowaveHeaters for Continuous Flow Microfluidics in Silicon-Glass Technology. Energies 2020, 13, 2635. [CrossRef]
24. Cai, W.; Zhang, J.; Zhang, X.; Wang, Y.; Qi, X. Enhancement of CO2 Absorption under Taylor Flow in the Presence of Fine Particles.Chin. J. Chem. Eng. 2013, 21, 135–143. [CrossRef]
25. Jiang, S.; Zhu, C.; Zhang, F.; Ma, Y. Mass transfer performance of CO2/N2 mixture absorption into monoethanolamine aqueoussolution in microchannel. CIESC J. 2017, 68, 643–652.
26. Damiati, S.; Kompella, U.B.; Damiati, S.A.; Kodzius, R. Microfluidic Devices for Drug Delivery Systems and Drug Screening.Genes 2018, 9, 103. [CrossRef]
27. Zhao, S.; Wang, W.; Shao, T.; Zhang, M.; Jin, Y.; Cheng, Y. Mixing performance and drug nano-particle preparation inside slugs ina gas–liquid microchannel reactor. Chem. Eng. Sci. 2013, 100, 456–463. [CrossRef]
28. Garstecki, P.; Fuerstman, M.J.; Stone, H.A.; Whitesides, G.M. Formation of droplets and bubbles in a microfluidic T-junction—scaling and mechanism of break-up. Lab Chip 2006, 6, 437–446. [CrossRef]
29. Lefortier, S.G.R.; Hamersma, P.J.; Bardow, A.; Kreutzer, M.T. Rapid microfluidic screening of CO2 solubility and diffusion in pureand mixed solvents. Lab Chip 2012, 12, 3387–3391. [CrossRef] [PubMed]
30. Van Steijn, V.; Kleijn, C.R.; Kreutzer, M.T. Predictive model for the size of bubbles and droplets created in microfluidic T-junctions.Lab Chip 2010, 10, 2513–2518. [CrossRef]
31. Zhou, C.; Zhu, P.; Tian, Y.; Tang, X.; Shi, R.; Wang, L. Microfluidic generation of aqueous two-phase-system (ATPS) droplets byoil-droplet choppers. Lab Chip 2017, 17, 3310–3317. [CrossRef]
32. Zhao, Y.; Chen, G.; Yuan, Q. Liquid-liquid two-phase flow patterns in a rectangular microchannel. AIChE J. 2006, 52, 4052–4060.[CrossRef]
33. Salim, A.; Fourar, M.; Pironon, J.; Sausse, J. Oil-water two-phase flow in microchannels: Flow patterns and pressure dropmeasurements. Can. J. Chem. Eng. 2008, 86, 978–988. [CrossRef]
34. Kashid, M.; Kiwi-Minsker, L. Quantitative prediction of flow patterns in liquid–liquid flow in micro-capillaries. Chem. Eng.Process. Process. Intensif. 2011, 50, 972–978. [CrossRef]
35. Li, Y.K.; Liu, G.T.; Xu, J.H.; Wang, K.; Luo, G.S. A microdevice for producing monodispersed droplets under a jetting flow. RSCAdv. 2015, 5, 27356–27364. [CrossRef]
36. Tsaoulidis, D.; Dore, V.; Angeli, P.; Plechkova, N.V.; Seddon, K.R. Flow patterns and pressure drop of ionic liquid–water two-phaseflows in microchannels. Int. J. Multiph. Flow 2013, 54, 1–10. [CrossRef]
37. Cherlo, S.K.R.; Kariveti, S.; Pushpavanam, S. Experimental and Numerical Investigations of Two-Phase (Liquid–Liquid) FlowBehavior in Rectangular Microchannels. Ind. Eng. Chem. Res. 2010, 49, 893–899. [CrossRef]
38. Fu, T.; Wei, L.; Zhu, C.; Ma, Y. Flow patterns of liquid–liquid two-phase flow in non-Newtonian fluids in rectangular microchannels.Chem. Eng. Process. Process. Intensif. 2015, 91, 114–120. [CrossRef]
39. Kashid, M.N.; Agar, D.W. Hydrodynamics of liquid–liquid slug flow capillary microreactor: Flow regimes, slug size and pressuredrop. Chem. Eng. J. 2007, 131, 1–13. [CrossRef]
Energies 2021, 14, 1341 17 of 17
40. Kashid, M.N.; Renken, A.; Kiwi-Minsker, L. Influence of Flow Regime on Mass Transfer in Different Types of Microchannels. Ind.Eng. Chem. Res. 2011, 50, 6906–6914. [CrossRef]
41. Wu, Z.; Cao, Z.; Sundén, B. Liquid-liquid flow patterns and slug hydrodynamics in square microchannels of cross-shapedjunctions. Chem. Eng. Sci. 2017, 174, 56–66. [CrossRef]
42. Cubaud, T.; Mason, T.G. Capillary threads and viscous droplets in square microchannels. Phys. Fluids 2008, 20, 053302. [CrossRef]43. Cao, Z.; Wu, Z.; Sundén, B. Dimensionless analysis on liquid-liquid flow patterns and scaling law on slug hydrodynamics in
cross-junction microchannels. Chem. Eng. J. 2018, 344, 604–615. [CrossRef]44. Bai, L.; Zhao, S.; Fu, Y.; Cheng, Y. Experimental study of mass transfer in water/ionic liquid microdroplet systems using micro-LIF
technique. Chem. Eng. J. 2016, 298, 281–290. [CrossRef]45. Jose, B.M.; Cubaud, T. Formation and dynamics of partially wetting droplets in square microchannels. RSC Adv. 2014, 4,
14962–14970. [CrossRef]46. Bai, L.; Fu, Y.; Zhao, S.; Cheng, Y. Droplet formation in a microfluidic T-junction involving highly viscous fluid systems. Chem.
Eng. Sci. 2016, 145, 141–148. [CrossRef]47. Foroughi, H.; Kawaji, M. Viscous oil–water flows in a microchannel initially saturated with oil: Flow patterns and pressure drop
characteristics. Int. J. Multiph. Flow 2011, 37, 1147–1155. [CrossRef]48. Xu, J.H.; Li, S.W.; Tan, J.; Luo, G.S. Correlations of droplet formation in T-junction microfluidic devices: From squeezing to
dripping. Microfluid. Nanofluidics 2008, 5, 711–717. [CrossRef]49. Dessimoz, A.-L.; Cavin, L.; Renken, A.; Kiwi-Minsker, L. Liquid–liquid two-phase flow patterns and mass transfer characteristics
in rectangular glass microreactors. Chem. Eng. Sci. 2008, 63, 4035–4044. [CrossRef]50. Yagodnitsyna, A.A.; Kovalev, A.V.; Bilsky, A.V. Flow patterns of immiscible liquid-liquid flow in a rectangular microchannel with
T-junction. Chem. Eng. J. 2016, 303, 547–554. [CrossRef]51. Yao, C.; Liu, Y.; Xu, C.; Zhao, S.; Chen, G. Formation of liquid-liquid slug flow in a microfluidic T-junction: Effects of fluid
properties and leakage flow. AIChE J. 2017, 64, 346–357. [CrossRef]52. Wu, Z.; Cao, Z.; Sunden, B. Flow patterns and slug scaling of liquid-liquid flow in square microchannels. Int. J. Multiph. Flow
2019, 112, 27–39. [CrossRef]53. Zhang, Q.; Fu, T.; Zhu, C.; Ma, Y. Formation and size prediction of slug droplet in viscoelastic fluid in flow-focusing microchannel.
CIESC J. 2016, 67, 504–511.54. Dang, M.; Ren, M.; Chen, G. Effect of microchannel inlet configuration on Taylor bubble formation in microreactors. CIESC J.
2014, 65, 805–812.55. Yao, C.; Zhao, Y.; Ye, C.; Dang, M.; Dong, Z.; Chen, G. Characteristics of slug flow with inertial effects in a rectangular
microchannel. Chem. Eng. Sci. 2013, 95, 246–256.56. Guo, F.; Chen, B. Numerical Study on Taylor Bubble Formation in a Micro-channel T-Junction Using VOF Method. Microgravity
Sci. Technol. 2009, 21, 51–58. [CrossRef]57. De Menech, M.; Garstecki, P.; Jousse, F.; Stone, H.A. Transition from squeezing to dripping in a microfluidic T-shaped junction. J.
Fluid Mech. 2008, 595, 141–161. [CrossRef]58. Christopher, G.F.; Noharuddin, N.N.; Taylor, J.A.; Anna, S.L. Experimental observations of the squeezing-to-dripping transition
in T-shaped microfluidic junctions. Phys. Rev. E 2008, 78, 036317. [CrossRef]59. Wei, L.; Zhu, C.; Fu, T.; Ma, Y. Experimental measurement and correlation of droplet size in T-junction microchannels. CIESC J.
2013, 64, 517–523.60. De Menech, M. Modeling of droplet breakup in a microfluidic T-shaped junction with a phase-field model. Phys. Rev. E 2016,
73, 031505. [CrossRef]61. Liu, W. Study on Two-Phase Flow Patterns and Droplet Formation in Microchannels. Master’s Thesis, Tianjin University, Tianjin,
China, 2010.