Embed Size (px)
Citation preview

EXPERIMENTAL STUDY ON SUBCOOLED FLOW BOILING ON HEATING SURFACES WITH DIFFERENT THERMAL CONDUCTIVITIES
BY
LING ZOU
DISSERTATION
Submitted in partial fulfillment of the requirements for the degree of Doctor of Philosophy in Nuclear Engineering
in the Graduate Collage of the University of Illinois at Urbana-Champaign, 2010
Urbana, Illinois
Doctoral Committee: Professor Barclay G. Jones, Chair
Professor Roy A. Axford Professor Rizwan Uddin Professor Ty A. Newell
ii
ABSTRACT
Subcooled flow boiling is generally characterized by high heat transfer capacity and
low wall superheat, which is essential for cooling applications requiring high heat transfer
rate, such as nuclear reactors and fossil boilers. In this study, subcooled flow boiling on
copper and stainless steel heating surfaces was experimentally investigated from both
macroscopic and microscopic points of view.
Flow boiling heat flux and heat transfer coefficient were experimentally measured on
both surfaces under different conditions, such as pressure, flow rate and inlet subcooling.
Significant boiling heat transfer coefficient differences were found between the copper and
the stainless steel heating surfaces. To explain the different flow boiling behaviors on these
two heating surfaces, nucleation site density and bubble dynamics were visually observed and
measured at different experimental conditions utilizing a high-speed digital video camera.
These two parameters are believed to be keys in determining flow boiling heat flux. Wall
superheat, critical cavity size and wall heat flux were used to correlate with nucleation site
density data. Among them, wall heat flux shows the best correlation for eliminating both
pressure and surface property effects. The observed nucleation site distribution shows a
random distribution. When compared to the spatial Poisson distribution, similarity between
them was found, while the measured nucleation site distribution is more uniform. From
experimental observations, for the two surface materials investigated, which have similar
surface wettability but sharply different thermal properties, bubble dynamics displayed fairly
similar behavior. The obtained experimental results indicate that thermal conductivity of
heating surface material plays an important role in boiling heat transfer. This is due to thermal
conductivity having a significant impact on the lateral heat conduction at the heating surface
and consequently temperature uniformity of the heating surface.
A model was then developed and solved numerically for heat conduction at the
heating surface when bubbles are present. Several key parameters which impact lateral heat
conduction and surface temperature profile were studied. These parameters include material

iii
thermal conductivity, bubble size, heating surface thickness, etc. Numerical results show that,
temperature profile on the heating surface tends to be more uniform and have a lower average
value on a heating surface with higher thermal conductivity, which agrees well with the
experimental observation.

iv
ACKNOWLEDGEMENTS
I would like to express my deepest appreciation to my advisor and committee chair,
Dr. Barclay G. Jones, for his excellent advising, inspiring discussion and guidance on the
research during my thesis work. Without Dr. Jones’ persistent support on both academic and
general fields, this dissertation would not have been possible. I would like to thank Dr. Ty A.
Newell for his support on experimental facilities and his guidance on my thesis work. I would
also like to thank Dr. Roy A. Axford and Dr. Rizwan Uddin, for being my committee
members and giving invaluable suggestions on my dissertation.
A special thank goes to Dr. Wen Wu and Dr. Emad W. Jassim for sharing the
knowledge on image processing and conducting experiments.
Lastly, I would like to express my appreciation to my family: my parents and brother,
my wife and my baby girl. Without their love and encouragement, this dissertation wouldn’t
have happened. I dedicate this thesis to them.

v
TABLE OF CONTENTS
LIST OF FIGURES.................................................................................................................. vi
LIST OF TABLES ................................................................................................................. xiii
NOMENCLATURE............................................................................................................... xiv
1. INTRODUCTION........................................................................................................ 1
2. LITERATURE REVIEW............................................................................................. 6
2.1 NUCLEATION SITES AND NUCLEATION SITE DENSITY................................. 6
2.2 BUBBLE DYNAMICS.............................................................................................. 18
2.3 HEAT FLUX PREDICTION ..................................................................................... 31
2.4 SUMMARY ............................................................................................................... 46
3. EXPERIMENTAL SETUP ........................................................................................ 47
3.1 SUBCOOLED FLOW BOILING EXPERIMENTAL TEST APPARATUS............ 47
3.1.1 REFRIGERANT LOOP............................................................................................. 47
3.1.2 TEST SECTION......................................................................................................... 48
3.2 INSTRUMENTATION AND MEASUREMENTS................................................... 51
4. EXPERIMENTAL RESULTS................................................................................... 59
4.1 NUCLEATION SITE DENSITY AND DISTRIBUTION ........................................ 59
4.1.1 NUCLEATION SITE DENSITY............................................................................... 59
4.1.2 NUCLEATION SITE DISTRIBUTION.................................................................... 73
4.2 BUBBLE DYNAMICS.............................................................................................. 83
4.2.1 CONTACT ANGLE AND BUBBLE SHAPE........................................................... 84
4.2.2 BUBBLE GROWTH RATE AND DEPARTURE SIZE........................................... 90
4.3 FLOW BOILING HEAT TRANSFER .................................................................... 102
4.4 SUMMARY AND DISCUSSION ........................................................................... 107
5. MODEL DEVELOPMENT ..................................................................................... 118
5.1 MODEL DESCRIPTION......................................................................................... 118
5.2 MODEL RESULTS ................................................................................................. 124
6. CONCLUSION AND FUTURE WORK................................................................. 136
6.1 CONCLUSION AND DISCUSSION ...................................................................... 136
6.2 FUTURE WORK ..................................................................................................... 140
REFERENCE ........................................................................................................................ 143
AUTHOR’S BIOGRAPHY................................................................................................... 152

vi
LIST OF FIGURES
Figure
1.1 A typical pool boiling curve ………………………………………………… 1
1.2 Effects of liquid velocity and subcooling level on subcooled flow boiling
heat transfer …………………………………………………………………. 3
1.3 Surface and liquid temperatures distribution in a subcooled flow boiling ….. 4
2.1 Conditions for the entrapment of gas in the advance of a semi-infinite liquid
sheet across a groove ………………………………………………..……… 7
2.2 Hsu’s criteria to determine the maximum and minimum nucleation cavity
size at a given wall superheat ………………………………………………. 9
2.3 Bubble growth in incompressible liquid ...................................................... 19
2.4 Bubble departure in pool boiling ………………………………………….. 23
2.5 Bubble departure and lift-off in flow boiling ……………………………… 24
2.6 A schematic drawing of heat transfer zones in pool boiling ………………… 40
3.1 A schematic diagram of the flow boiling test apparatus ……......................... 53
3.2 An explode view of the test section assembly …………………………… 54
3.3 A temperature profile on heating block walls at 100 seconds after critical
heat flux occurring with power on …………………………………………. 55
3.4 Schematic drawings of test sections and locations of thermocouples ……… 56
4.1 A typical bubble image from a set of bubble images at high camera frame
speed to identify active nucleation sites locations ………………………….. 62
4.2 Locations of nucleation sites identified from the same bubble images in
Figure 4.1. …………………………………………………………………… 62
4.3 Nucleation site density against the wall superheat for the copper heating
surface at different system pressures ……………………………………….. 69
4.4 Nucleation site density against the wall superheat for the stainless steel
heating surface at different system pressures …………………………….. 69
vii
4.5 Nucleation site density against the critical cavity diameter for the copper
heating surface at different system pressures ………………………………… 70
4.6 Nucleation site density against the critical cavity diameter for the stainless
steel heating surface at different system pressures ………………………….. 70
4.7 Nucleation site density against the wall heat flux for the copper heating
surface at different system pressures ……………………………………….. 71
4.8 Nucleation site density against the wall heat flux for the stainless steel
heating surface at different system pressures ……………………………….. 71
4.9 Nucleation site density against the critical cavity diameter for both the copper
and the stainless steel heating surfaces …………………………………….. 72
4.10 Nucleation site density against the wall heat flux for both the copper and the
stainless steel heating surfaces ……………………………………………… 72
4.11 A typical nucleation sites distribution on the copper surface ………………. 76
4.12 Nucleation sites on the copper surface at pressure of 500 kPa and wall
superheat of 10.94 ºC. ……………………………………………………… 77
4.13 The discrete probability density of nucleation sites distribution on a copper
surface at pressure of 500 kPa and wall superheat of 10.94 ºC, and its
comparison with the spatial Poisson distribution. …………………………. 77
4.14 Nucleation sites on the copper surface at pressure of 700 kPa and wall
superheat of 8.15 ºC ……………………………………………………….. 78
4.15 The discrete probability density of nucleation sites distribution on the copper
surface at pressure of 700 kPa and wall superheat of 8.15 ºC, and its
comparison with the spatial Poisson distribution. …………………………… 78
4.16 Nucleation sites on the stainless steel surface at pressure of 450 kPa and wall
superheat of 10.09 ºC………………………………………………………. 79
4.17 The discrete probability density of nucleation sites distribution on the
stainless steel surface at pressure of 450 kPa and wall superheat of 10.09 ºC,
and its comparison with the spatial Poisson distribution……………………. 79
viii
4.18 Nucleation sites on the stainless steel surface at pressure of 600 kPa and wall
superheat of 9.26 ºC………………………………………………………… 80
4.19 The discrete probability density of nucleation sites distribution on the
stainless steel surface at pressure of 600 kPa and wall superheat of 9.26 ºC,
and its comparison with the spatial Poisson distribution……………………. 80
4.20 The probability density of the distribution of the nearest-neighbor nucleation
sites distance and its comparison with the spatial Poisson distribution. On the
copper surface, pressure of 500 kPa and wall superheat at 10.94 ºC……….. 81
4.21 The probability density of the distribution of the nearest-neighbor nucleation
sites distance and its comparison with the spatial Poisson distribution. On the
copper surface, pressure of 700 kPa and wall superheat at 8.15 ºC………… 81
4.22 The probability density of the distribution of the nearest-neighbor nucleation
sites distance and its comparison with the spatial Poisson distribution. On the
stainless steel surface, pressure of 450 kPa and wall superheat at 10.09 ºC…. 82
4.23 The probability density of the distribution of nearest-neighbor nucleation
sites distance and its comparison with the spatial Poisson distribution. On the
stainless steel surface, pressure of 600 kPa and wall superheat at 9.26 ºC….. 82
4.24 Coefficient of variance of the measured nearest-neighbor nucleation sites
distance for both the copper and the stainless steel surfaces………………… 83
4.25 Schematic drawing of a bubble on a heating surface……………………… 85
4.26 Typical bubble images on the copper surface at pressures of 400 to 800 kPa.. 88
4.27 Typical bubble images on the stainless steel surface at pressures of 400 to
800 kPa………………………………………………………………………. 89
4.28 Bubble contact angles of both the copper and the stainless steel surfaces at
different pressures……………………………………………………………. 90
4.29 Typical bubble (bubble-1) growth images on the copper surface, 4000 fps,
400 kPa pressure, 8.8 ºC wall superheat, 0.09 m/s bulk flow velocity………. 94

ix
4.30 Typical bubble (bubble-2) growth images on a stainless steel surface, 2000
fps, 400 kPa pressure, 7.3 ºC wall superheat, 0.20 m/s bulk flow velocity….. 96
4.31 The growth rate of the bubble-1(shown in Figure 4.30) and its comparison
with Zuber’s model…………………………………………………………. 98
4.32 The growth rate of the bubble-2 (shown in Figure 4.30) and its comparison
with Zuber’s model…………………………………………………………. 98
4.33 Bubble growth rate coefficient for both the copper and the stainless steel
surfaces at different pressures……………………………………………… 99
4.34 Bubble departure size on both the copper and the stainless steel surfaces at
different pressures and bulk liquid velocities………………………………. 101
4.35 A typical boiling curve obtained from the copper surface at a pressure at 400
kPa, bulk liquid velocity at 0.1 m/s, inlet subcooling at 10 ºC…………….. 103
4.36 A typical heat transfer coefficient vs. wall heat flux curve obtained from the
copper surface at a pressure at 400 kPa, bulk liquid velocity at 0.1 m/s, inlet
subcooling at 10 ºC………………………………………………………… 103
4.37 Surface material’s effect on the flow boiling. Boiling curves at different
pressures. Bulk liquid velocity, 0.1 m/s. ………………………………….. 110
4.38 Surface material’s effect on the flow boiling. Heat transfer coefficient vs.
wall heat flux in the fully developed flow boiling region (corresponding to
Figure 4.37). …………………………………………………………………. 110
4.39 Surface material’s effect on the flow boiling. Boiling curves at different
pressures. Bulk liquid velocity, 0.2 m/s……………………………………… 111
4.40 Surface material’s effect on the flow boiling. Heat transfer coefficient vs.
wall heat flux in the fully developed flow boiling region (corresponding to
Figure 4.39)…………………………………………………………………… 111
4.41 Surface material’s effect on the critical heat flux. Critical heat flux at
different pressures and velocities……………………………………………. 112
x
4.42. Surface material’s effect on the flow boiling. Heat transfer coefficient vs.
wall heat flux. Bulk liquid velocity at 0.15m/s. Inlet subcooling at 22 ºC…. 112
4.43 Surface material’s effect on the flow boiling. Slope, m, of teat transfer
coefficient vs. wall heat flux curves for both the copper and the stainless steel
surfaces shown in Figure 4.42……………………………………………….. 113
4.44 Effect of pressure on the critical heat flux. Bulk liquid velocity at 0.15m/s.
Inlet subcooling at 22 ºC. ………………………………………………….. 113
4.45 Effect of bulk liquid velocity on the flow boiling. Boiling curves at different
bulk liquid velocities. Pressure at 500 kPa, inlet subcooling at 18 ºC………. 114
4.46 Effect of bulk liquid velocity on the flow boiling. Heat transfer coefficient vs.
wall heat flux in the fully developed flow boiling region (corresponding to
Figure 4.45)…………………………………………………………………… 114
4.47 Effect of bulk liquid velocity on the flow boiling. Boiling curves at different
bulk liquid velocities. Pressure at 700 kPa, inlet subcooling at 27 ºC………. 115
4.48 Effect of bulk liquid velocity on the flow boiling. Heat transfer coefficient vs.
wall heat flux in the fully developed flow boiling region (corresponding to
Figure 4.47)…………………………………………………………………… 115
4.49 Effect of bulk liquid velocity on the critical heat flux. For pressure at 500 kPa,
inlet subcooling is 18 ºC; for pressure at 700 kPa, inlet subcooling is 27 ºC… 116
4.50 Effect of inlet subcooling on the flow boiling. Boiling curves at different
inlet subcooling on the copper surface. Pressure at 500 kPa, bulk liquid
velocity at 0.15 m/s…………………………………………………………… 116
4.51 Effect of inlet subcooling on the flow boiling. Boiling curves at different
inlet subcooling on the stainless steel surface. Pressure at 500 kPa, bulk
liquid velocity at 0.15 m/s…………………………………………………… 117
4.52 Effect of inlet subcooling on the critical heat flux. Pressure at 500 kPa, bulk
liquid velocity at 0.15 m/s…………………………………………………… 117

xi
5.1 Schematic of a unit cell with a single layer of material and a bubble in the
center. ………………………………………………………………………. 122
5.2 Schematic of a unit cell with a two-layer configuration and a bubble in the
center. ………………………………………………………………………. 123
5.3 Surface temperature profiles over heating surfaces made of materials with
different thermal conductivities…………………..………………………… 129
5.4 Maximum and average surface temperatures over heating surfaces made of
materials with different thermal conductivities…………………………….. 129
5.5 Surface temperature profiles over a copper heating surface with different
thicknesses………………………………………………………………….. 130
5.6 Maximum and average surface temperatures over a copper heating surface
with different thicknesses……………………………………………………. 130
5.7 Surface temperature profiles over a stainless steel heating surface with
different thicknesses…………………………………………………………. 131
5.8 Maximum and average surface temperatures over a stainless steel heating
surface with different thicknesses……………………………………………. 131
5.9 Surface temperature profile over a stainless steel heating surface with
different thicknesses on a copper base block………………………………… 132
5.10 Maximum and average surface temperature over a stainless steel heating
surface with different thicknesses on a copper base block…………………… 132
5.11 Surface temperature profiles on a copper heating surface as bubble size
changes………………………………………………………………………. 133
5.12 Surface temperature profiles on a stainless steel heating surface as bubble
size changes………………………………………………………………… 133
5.13 Maximum and average surface temperatures on both copper and stainless
steel surfaces as bubble size changes………………………………………. 134
5.14 Surface temperature profiles on a copper heating surface as wall heat flux
changes…………………………………………………………………….. 134

xii
5.15 Surface temperature profiles on a stainless steel heating surface as wall heat
flux changes……………………………………………………………….. 135
5.16 Maximum and average surface temperatures on both copper and stainless
steel surfaces as wall heat flux changes……………………………………. 135
6.1 Bubbles on hydrophilic and hydrophobic surfaces………………………… 142

xiii
LIST OF TABLES
Table
3.1 Physical and thermal properties of R134a at different pressures…………… 57
3.2 Camera magnifications and corresponding length/pixel ratio………………. 58
4.1 Number and coordinates of nucleation sites for the same sample set of bubble
images in Figure 4.1 and 4.2…………………………………………………. 63

xiv
NOMENCLATURE
Bo Bond number
Co Convection number
Cp Specific heat
D Bubble diameter
Dc Critical cavity diameter
Dh Hydraulic diameter
f Bubble frequency
F Force
Fr Froude number
G Mass flow rate
h Heat transfer coefficient
hfg Latent heat
Ja Jacob number
k Thermal conductivity
Na Nucleation site density
Nu Nusselt number
p Pressure
Pr Prandtl number
q, q” Heat flux
r Surface cavity radius
R Bubble radius
Re Reynolds number
T Temperature
t Time
v Velocity

xv
Greek symbols
α Thermal diffusivity
β Half cone angle of a cavity
δ Thickness of thermal boundary layer
∆Tw Wall superheat
θ Contact angle
µ Dynamic viscosity
ν Kinetic viscosity
ρ Density
σ Surface tension
υ Specific volume
Subscripts
b Bubble
bi Boiling
c Critical
d Departure
f Liquid phase
fc Forced convection
g Growth
g Vapor phase
i Inlet
l Liquid phase
max Maximum
min Minimum
o Outlet
s Surface
sat Saturation

xvi
sp Single phase flow
sub Subcooled
tc Transient conduction
tp Two phase flow
v Vapor phase
w Wall
w Waiting

1
CHAPTER 1
INTRODUCTION
Boiling heat transfer is defined as a process in which intensive liquid to vapor phase
change occurs. It’s normally characterized by a high heat transfer capacity and a low wall
temperature, which is essential for industrial cooling applications requiring high heat transfer
capacities, such as nuclear reactors and fossil boilers. Due to its importance in industry, a
large amount of researches have been extensively carried out to study the boiling heat transfer
capacity and mechanism.
The boiling phenomenon has been systematically studied since early last century.
Nukiyama (Tong and Tang 1997, 2) was the first to propose the concept of a ‘boiling curve’,
in which the wall heat flux is plotted against the wall superheat, Figure 1.1. In the nucleate
boiling regime, region B-C in Figure 1.1, intense phase change with bubble formation occurs.
A large portion of the energy is transferred into the bulk liquid in the form of latent heat
carried by bubbles.
Figure 1.1. A typical pool boiling curve. A-B, natural convection regime; B-C, nucleate
boiling regime; C-D, partial film boiling; D-E, stable film boiling. (Tong and Tang 1997, 2)

2
In general, boiling phenomena are divided into two major categories, pool boiling and
flow boiling. Pool boiling is a process in which the heating surface is submerged in a liquid
pool, while flow boiling is normally confined to flow channels. The major difference between
these two is the presence of a forced liquid flow in flow boiling. The flow boiling
phenomenon has attracted a lot of researches for its high heat transfer rate and wide
applications in industry. As the flow boiling is widely used, many early efforts were devoted
to predicting its performance, such as experimental measurement of the heat transfer
coefficient and critical heat flux under different conditions. Parametric studies were also
carried out to understand the impacts of several key parameters, such as fluid velocity, inlet
subcooling level, heating surface materials and surface roughness conditions. Based on
experimental work, empirical and semi-empirical correlations were proposed for industry
applications. Some representative correlations include McAdam’s (McAdams et al. 1949),
Chen’s (Chen 1966), etc. As an example, Figure 1.2 shows the effects of liquid velocity and
inlet subcooling level on subcooled flow boiling heat transfer, given by McAdams (Collier
and Thome 1996, 204).
Other than direct experimental measurements, model development efforts were also
devoted to understanding the boiling mechanisms, such as nucleation site activation criteria,
bubble dynamics, bubble interactions, etc. Bankoff (Bankoff 1958) first examined gas
entrapment in cavities present on heating surfaces, and a criterion was set up to identify a
potential nucleation site. Griffith (Griffith and Wallis 1960) proposed a model to study the
role of surface conditions in nucleate boiling, from which the wall superheat required to
active a nucleation site is established. In recent years, with utilizations of new technologies,
such as high-speed cameras and liquid crystal thermography, more details of the boiling
phenomena were successfully revealed. For example, both bubble growth rate and departure
size could be visually captured by the advanced high-speed camera. The technology of liquid
crystal thermography was used to measure surface temperature profiles around an active

3
nucleation site. A laser was employed to artificially activate multiple bubbles with desired
separation distances. This was used to study boiling chaos due to bubble interactions.
Figure 1.2. Effects of liquid velocity and inlet subcooling level on subcooled flow boiling
heat transfer (Collier and Thome 1996, 204)
Subcooled flow boiling compared to saturated flow boiling, is referred as a flow boiling
process with bulk flow temperature lower than saturation level. Figure 1.3 shows typical
transitions from forced single-phase convection to subcooled flow boiling and to saturated
flow boiling. The transition from single-phase convection to subcooled flow boiling is
sometimes referred as the onset of nucleate boiling (ONB). After ONB, bubbles start to
generate on the heating surface, they enhance the heat transfer. As bubble numbers increase,
heat carried by bubbles becomes a large portion of the total energy transferred. The transition
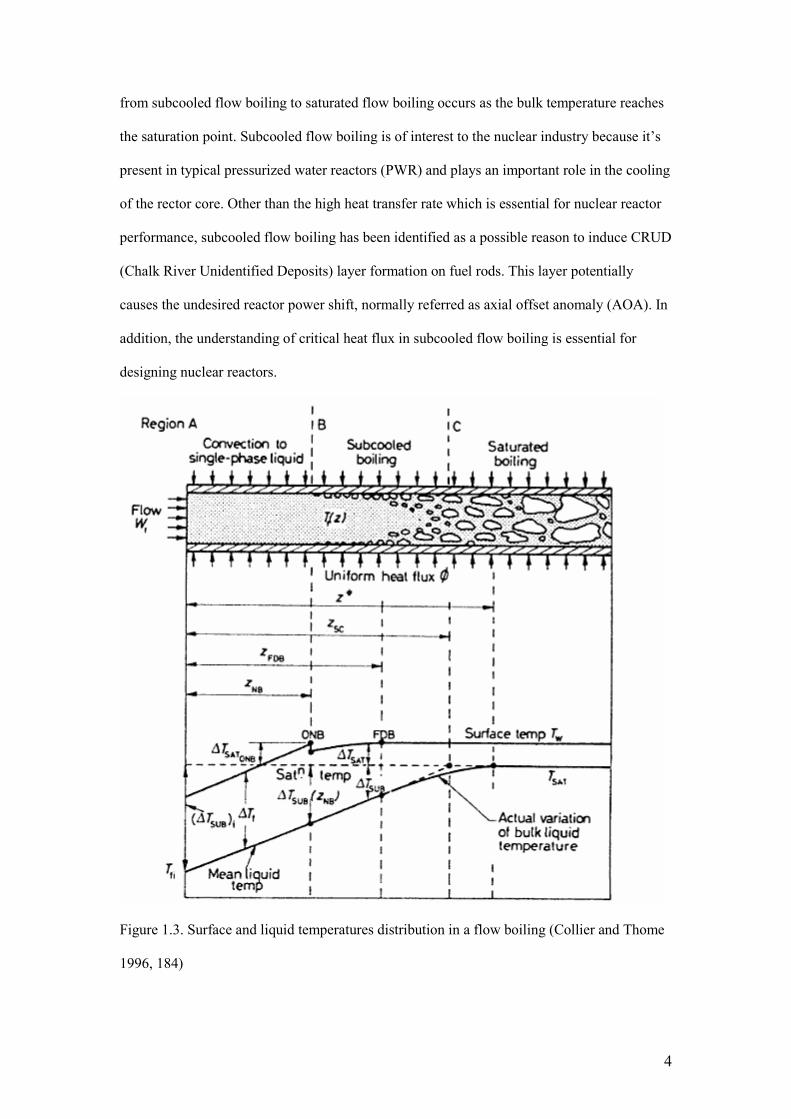
4
from subcooled flow boiling to saturated flow boiling occurs as the bulk temperature reaches
the saturation point. Subcooled flow boiling is of interest to the nuclear industry because it’s
present in typical pressurized water reactors (PWR) and plays an important role in the cooling
of the rector core. Other than the high heat transfer rate which is essential for nuclear reactor
performance, subcooled flow boiling has been identified as a possible reason to induce CRUD
(Chalk River Unidentified Deposits) layer formation on fuel rods. This layer potentially
causes the undesired reactor power shift, normally referred as axial offset anomaly (AOA). In
addition, the understanding of critical heat flux in subcooled flow boiling is essential for
designing nuclear reactors.
Figure 1.3. Surface and liquid temperatures distribution in a flow boiling (Collier and Thome
1996, 184)

5
The objective of this thesis is to experimentally study subcooled flow boiling with a
simulant fluid, R134a, from both macroscopic and microscopic points of view. The
experimental work includes three major parts, e.g., subcooled flow boiling performance from
the macroscopic point of view, nucleation site density and distribution, and bubble dynamics
from the microscopic point of view. The subcooled flow boiling performance can be directly
estimated by measuring the heating surface temperature and wall heat flux. The nucleation
site density, its distribution and bubble dynamics can be obtained from images and videos
taken by a high-speed digital camera. The effects of surface materials, or more specifically
their thermal properties and wettability of R134a, will also be examined by employing two
heating surfaces made of copper and of stainless steel. The measurement of subcooled flow
boiling heat transfer rate and nucleation site density and observation of bubble dynamics will
be studied on both surfaces to examine the heating surface material effects. A simplified heat
transfer model to study heat conduction within the heating block is then proposed to explain
the different flow boiling behaviors of the two surface materials.
6
CHAPTER 2
LITERATURE REVIEW
During the past decades, extensive efforts have been devoted to understanding boiling
phenomena, including both pool boiling and flow boiling. These efforts include direct
experimental measurements and observations, theoretical analyses, empirical correlations,
model developments, etc. In recent years, with the help of state-of-the art technologies, such
as high-speed digital cameras and thermochromic liquid crystals, more insightful information
has been obtained to understand the boiling process. Some of the latest findings include
knowledge on fundamental bubble dynamics, active nucleation site densities, bubbles and
nucleation site interactions, heat flux predictions, critical heat flux models, etc. The literature
review presented in this chapter will mainly focus on several key topics of subcooled flow
boiling heat transfer. These include activation of nucleation sites, their densities and
distributions, bubble dynamics, and subcooled flow boiling heat transfer correlations and
models.
2.1 NUCLEATION SITES AND NUCLEATION SITE DENSITY
The importance of heating surface conditions to boiling processes has been
recognized for decades. It has been found that bubbles originate from preexisting vapor or gas
pockets captured in pits, cavities, scratches and grooves (all generally referred as cavities) on
a heating surface. The cavity size and shape have proved to be critical to entrap vapor and/or
gas and to initiate a bubble, and have already been explored by various researchers. In
addition, the active nucleation site density is a key parameter to predicting the boiling heat
flux, and has been extensively studied. The following section gives some of the important
research on nucleation sites, their densities and distributions.

7
Bankoff (Bankoff 1958) examined the entrapment of gas in the spreading of a liquid
on a rough surface. It was found that the contact angle and surface cavity geometry were
important parameters during the incomplete displacement of gas from the cavity valley by a
liquid drop advancing over the cavity ridges. As shown in Figure 2.1, the liquid contact angle
is θ, and the angle between ridge and horizontal line is φ . To entrap gas volume in the valley,
the following criteria must be satisfied,
φθ 2180 −> o
(2-1)
Figure 2.1. Conditions for entrapment of gas in the advancing of a semi-infinite liquid sheet
across a groove (Bankoff 1958).
Griffith and Wallis (Griffith and Wallis 1960) proposed a model to study the role of
surface conditions in nucleate boiling. Considering a stable bubble forming on a conical
cavity, the pressure difference between the vapor phase inside the bubble and the surrounding
superheated liquid phase is governed by the Gibbs equation,
rp
σ2=∆
(2-2)
The vapor phase inside a bubble is assumed to be at saturation temperature
corresponding to its pressure and the surrounding liquid is at the same temperature and,

8
therefore, superheated. The minimum wall superheat which is needed to initiate a bubble from
a cavity with a mouth radius r* can be calculated by the Clapeyron relation,
( )satwfg
fgw
TTh
Tr
−=
υσ2* (2-3)
However, a question has been raised as to whether the wall superheat would
eventually vanish if the cavity size were to increase without bound, if Griffith’s equation
stands. This contradicts the fact that a boiling process has to occur at a certain level of wall
superheat. By including the temperature gradient in the liquid thermal layer adjacent to the
heating wall, Hsu (Hsu 1962) concluded that nucleation sites could only be effective within a
certain size range. This size is a function of liquid subcooling level, system pressure,
liquid/vapor properties and thickness of the superheated liquid layer. As shown in Figure 2.2,
the liquid temperature at the top of the bubble has to satisfy Griffith’s criteria, equation 2-2.
Combing the temperature gradient in the liquid superheated layer and equation 2-2, a
quadratic equation was obtained which gives the minimum and maximum cavity sizes for a
given wall superheat,
{ } ( )
∆
∆+∆−
∆+∆
∆=
23
1max,min,
811
2,
wvfg
subwsat
subw
w
ccTh
TTCT
TT
T
Crr
δρ
σδm
(2-4)
in which, δ is the thickness of the superheated liquid layer; constants C1 and C3 are functions
of the contact angle, φ.

9
Figure 2.2, Hsu’s criteria to determine the maximum and minimum nucleation cavity size at a
given wall superheat
In a later study by Han and Griffith (Han and Griffith 1965), a liquid contact angle of
90 deg and critical bubble height of 3/2 rc were assumed. The constants, C1 and C3 in equation
(2-3) were both solved equal to 3/2, and equation (2-3) was rewritten as,
{ } ( )
∆
∆+∆−
∆+∆
∆=
23
max,min,
1211
3,
wvfg
subwsat
subw
w
ccTh
TTCT
TT
Trr
δρ
σδm
(2-5)
Kandlikar et al. (Kandlikar et al. 1997) later numerically solved the flow distribution
on a truncated bubble to obtain the stagnant point of a bubble. It was found that the distance
from the stagnant point to the heating surface is around 1.1 times the bubble radius. Hsu’s
equation then became,
{ } ( )
∆
∆+∆−
∆+∆
∆=
23
max,min,
2.911
2.2
sin,
wvfg
subwsat
subw
w
ccTh
TTCT
TT
Trr
δρ
σϕδm
(2-6)
in which, φ is the contact angle.
In addition to analytical work, direct experimental measurements were also done to
understand the relationship among wall superheat, nucleation site density and heat transfer
10
rate during boiling. The umber of nucleation sites was counted throughout the nucleate
boiling region by Gaertner and Westwater (Gaertner and Westwater 1963). An aqueous
solution of nickel salts containing 20% solid was boiled at atmospheric pressure on a
horizontal, flat copper surface. The number of boiling sites was then counted from the nickel
salts deposition. Other than a liner relationship, the heat flux was found to be proportional
approximately to the square root of the number of sites.
Eddington and Kenning (Eddington and Kenning 1978) used a gas bubble nucleation
method to study bubble nucleation from a supersaturated gas solution to compare with bubble
formation during boiling processes. A same stainless steel surface having 0.8 mm thickness
was used in both gas nucleation experiments and flow boiling experiments. The comparison
between these two kinds of experiments showed that there were many more sites in the gas
bubble nucleation method, which satisfied the site activation criteria, equation (2-2), than
were actually observed on the same surface during the boiling process. It was found that site
seeding and thermal interference, which were not present in gas nucleation experiments,
caused the difference between the gas nucleation and flow boiling experiments. A similar
result was also found by Eddington et al. (Eddington et al. 1978) from comparison of gas and
vapor bubble nucleation numbers on a brass surface in water. The authors suggested that the
contact angle might play an important role. The effect of contact angle was later examined
from comparison of the gas bubbles formed in supersaturated solutions of nitrogen in water
and ethanol-water mixtures on two metal surfaces by Eddington and Kenning (Eddington and
Kenning 1979). It was found that a decrease in contact angle results in a decreasing bubble
nucleation site density.
Bergles and Rohsenow (Bergles and Rohsenow 1964) stated that on a commercial
surface the cavity size covered wide range and therefore the onset of boiling was surface
condition independent. The heat flux at onset of boiling could only be a function of fluid and
thermal properties, such as system pressure and wall superheat. However, in a later work,
Mikic and Rohsenow (Mikic and Rohsenow 1969) related the active nucleation site density to

11
the surface cavity size. It’s been found that the active nucleation site density is inversely
proportional to the power function of the critical size,
5.6
~
c
s
D
DNa
(2-7)
in which, Ds is the maximum cavity size present on the heating surface and Dc is the critical
diameter derived from equation (2-2),
( )swfg
fgw
cTTh
TD
−=
υσ4 (2-8)
A similar correlation proposed by Bier et al. (Bier et al. 1978) also expressed the
active nucleation site density as a function of cavity size,
( )
−=
m
c
s
D
DNNa 1lnln max
(2-9)
in which, Nmax is the value corresponding to Dc = 0 andthe empirical constant, m, was found to
be dependent on the surface preparation procedure. For boiling of Freon-115 and Freon-11 on
copper surfaces, the value of m was found to be 0.42 and 0.26, respectively.
Cornwell and Brown (Cornwell and Brown 1978) studied water boiling on copper
surfaces at atmospheric pressure with different surface conditions from smooth to rough. The
active nucleation site density was found to be proportional to a power function of the wall
superheat, or inversely proportional to a power function of the critical cavity size,
5.4
195.4 1036.1
~c
wD
TNa−×
=∆ (2-10)
Kocamustafaogullari and Ishii (Kocamustafaogullari and Ishii 1983) correlated
existing pool boiling nucleation site density data by means of parametric study. It’s assumed
that the nucleation site density in pool boiling, Nnp, is a function of both surface conditions
and fluid thermo-physical properties. Mainly based on existing water data, a non-dimensional
correlation was proposed,
( ) 4.4*** −= cnp RfN ρ (2-11)

12
in which, 2* dnpnp DNN ≡ (2-12)
( ) ( ) 13.42.37 *0049.01*10157.2* ρρρ +×= −−f (2-13)
g
gf
ρ
ρρρ
−≡* (2-14)
( )( )2//* dcc DRR ≡ (2-15)
in which, Dd is the departure diameter, which can be estimated from an empirical correlation.
Taking account of the difference between the effective liquid superheat, we TST ∆=∆ , and
the similarity between pool and convective boiling, Kocamustafaogullari and Ishii concluded
that the proposed nucleation site density correlation for pool boiling could be used for
convective boiling by replacing the wall superheat with an effective superheat, proposing for
flow boiling that,
( ) 4.4*** −= cnp RfN ρ (2-16)
An approach was made by Yang and Kim (Yang and Kim 1988) to correlate active
nucleation site density with the measured statistical boiling surface parameters, such as cavity
size and cone angle distribution. From measurements using a scanning electron microscope
and a differential interference contrast microscope, they concluded that the cavity size and
cone angle could be fit by a Poisson and a normal distribution, respectively. The cavity radius
follows a Poisson distribution,
( ) ( )rrf λλ −= exp (2-17)
The cone angle follows a normal distribution,
( ) ( ) ( )[ ]222exp
2
1s
sf ββ
πβ −−= (2-18)
in which, r and λ are cavity radius and it’s statistical parameter, respectively. β , β and s are
the half cone angle, its mean value and standard deviation, respectively. Following the gas
entrapment criteria proposed by Bankoff (Bankoff 1958), Yang and Kim proposed that the
active nucleation site density could be determined as,

13
( ) ( )drrfdfNNs
c
R
Rna ∫∫= ββ
θ 2/
0 (2-19)
where, nN is the average cavity density, which may only depend on heating surface material
and finish. For a given surface condition, Yang and Kim further approximated equation (2-19)
in the form of,
( )sata TKCN ∆−≈ /exp (2-20)
where, parameters C and K account for the surface conditions effect and liquid properties
effect.
Similar work was later performed by Hibiki and Ishii (Hibiki and Ishii 2003), who
suggested different cavity size and cone angle distribution functions other than Poisson and
normal distributions. Based on Yang and Kim’s (Yang and Kim 1988) data, the cavity size
and cone angle distribution functions were expressed as,
( )
=rr
rfλλ
exp2
(2-21)
and,
( ) ( )[ ]222
2exp µβµβ
β −=f (2-22)
The active nucleation site density can be calculated from equation (2-19). The
proposed model shows a maximum 60% error in comparison with experimental data over a
wide range of flow conditions, 0~886 kg/m2s of mass flux, 0.101~19.8 MPa of pressure,
5~90o of contact angle, 1.0×10⁴~1.51×10¹⁰ of nucleation site density.
Different cavity size and cone angle distributions were also proposed by Qi et al. (Qi
et al. 2004). A gas nucleation technique was used to examine the active nucleation site density
of water on brass and stainless steel surfaces. The surface profiles were examined by a Wyko
NT1000 vertical scanning interferometer (VSI). It was found that the best fit to the cavity size
distribution followed a Weibull distribution,
( )
−
=− λλ
ωωωλ dd
df exp1
(2-23)

14
where, d is the cavity diameter. λ and ω are functions of the mean and standard deviation. The
cavity half cone angles were best represented by the function,
( )6
2
2
2
−+
−=
βπ
βπ
β
B
A
g (2-24)
where, A and B are constants empirically determined. The active nucleation sites were
estimated by equation (2-19) proposed by Yang and Kim (Yang and Kim 1988). However,
Qi’s model did not give good agreement with nucleation site density data from the gas
nucleation technique. The author stated that, “the statistical method for predicting nucleation
site density on commercial heat transfer surfaces with randomly distributed cavities is not
likely to be accurate using the current state-of-the-art in surface metrology technology”.
Wang and Dhir (Wang and Dhir 1993a) proposed an empirical correlation to include
the effect of static contact angle on active nucleation site density based on their water pool
boiling data on vertical copper surfaces at atmospheric pressure. The original surface had a
mirror finish and had a very small surface roughness value, around 0.02 µm. With different
degrees of surface oxidization, the surface wettability changed. The static contact angles of
the water-copper combination were measured ranging from 18˚ to 90˚. The active nucleation
site density was correlated by Wang and Dhir as,
( ) ( ) 0.652 cos1100.5/ −−×= ca DcmsitesN θ (2-25)
where, θ is the static contact angle and Dc is the critical cavity size estimated from equation
(2-2). All data with different contact angles could be correlated by equation (2-25) to within
60% error.
A model describing the effect of wettability on nucleation site density was also
proposed by Wang and Dhir (Wang and Dhir 1993b). From a Helmholtz free energy analysis,
a criterion for gas/vapor entrapment conditions in a uniform temperature field was developed,
minϕθ > (2-26)

15
where, θ is the static contact angle and φmin is the minimum cavity side angle of a spherical,
conical, or sinusoidal cavity. The required wall superheat was found not only to be a function
of the cavity mouth size, but also a function of the cavity geometry,
KDh
TT
cfgv
satw ρ
σ4=∆ (2-27)
in which, K is a parameter accounting for the cavity geometry. The proposed model for the
active nucleation site density was expressed as,
asasa NPN ⋅= (2-28)
in which, Nas is the heating surface cumulative cavity density with cavity mouth side angle
less than a specified reference value. Pas is a dimensionless parameter which is a function of
contact angle and the specified reference value. The model was validated in comparison with
water pool boiling experimental data with contact angles of 18o, 35o and 90o, surface cavity
sizes ranging from 2 to 20 µm.
Following the same technique used by Wang and Dhir (Wang and Dhir 1993a), Basu
et al. (Basu et al. 2002) conducted the subcooled flow boiling experiments with water at
atmospheric pressure on a flat copper surface and a nine-rod zircalloy-4 bundle, respectively.
The static contact angle changed with surface oxidization levels. The active nucleation site
density was found to be a function of both the static contact angle and the wall superheat,
( ) ( ) 0.22 cos134.0/ wa TcmsitesN ∆−= θ (2-29)
when CTT wONBw
o, 15<∆<∆
and,
( ) ( ) 3.552 cos1104.3/ wa TcmsitesN ∆−×= − θ (2-30)
when CTw
o15≥∆
in which, ∆Tw,ONB is the wall superheat corresponding the onset of nucleate boiling. Most of
the experimental data with contact angles ranging from 30o to 90o were fit by the correlation
to within 40% error. The correlation is valid over a wide range of flow boiling conditions:

16
186~886 kg/m2s of mass flux, 2.8~26.5 of wall superheat, and 1~230 sites/cm2 of nucleation
site density.
Benjamin and Balakrishnan (Benjamin and Balakrishnan 1997) conducted
experimental work to investigate nucleation site density in pool boiling with saturated pure
liquid at low-to-moderate heat fluxes. Pool boiling on stainless steel and aluminum surfaces
with different surface polishing levels was examined with combinations of several kinds of
fluids, including distilled water, carbon tetrachloride, n-hexane, and acetone. It was found that
the nucleation site density depended on: the surface micro-roughness, liquid surface tension,
thermal/physical properties of heating surface and liquid, and the wall superheat. A
correlation based on the wall superheat, ∆Tw, Prandtl number, Pr, a surface-liquid interaction
parameter, γ, and a dimensionless surface roughness parameter, θ, was proposed,
34.063.1 1Pr8.218 wa TN ∆
= −θ
γ; (2-31)
Prandtl number is defined as,
l
llp
k
C µ,Pr = ; (2-32)
the surface-liquid interaction parameter, γ, is defined as,
2/1
,
,
=
lpll
wpww
Ck
Ck
ρ
ργ ; (2-33)
the dimensionless surface roughness, θ, is defined as,
2
4.05.45.14
+
−=
σσθ
PRPR aa ; (2-34)
where, Cp,l, µl, kl, ρl, and σ are: liquid specific heat, viscosity, thermal conductivity, density
and surface tension, respectively. Cp,w, kw, and ρw are: wall material specific heat, thermal
conductivity and density, respectively, and P is the pressure.
Experiments of forced convection boiling were conducted by Zeng and Klausner
(Zeng and Klausner 1993) to study the nucleation site density in forced convection boiling.
17
Refrigerant R113 was boiled on a horizontal 25 by 25 mm square transparent test section
heated with nichrome wires. The nucleation site number density was optically measured by a
Videk Megaplus CCD camera. Due to the difficulty of observation from a view normal to the
heating surface, side view images were obtained. To study effects of different system
parameters, the nucleation site number density was plotted against wall heat flux, mass flux,
mean vapor velocity and liquid velocity, respectively. It was found that the mean vapor
velocity, heat flux and system pressure have strong influences on the nucleation site number
density. The experimental results also showed that the critical cavity radius, which normally
has been used to predict the number density of nucleation sites in pool boiling, was an
important but insufficient correlating parameter for flow boiling nucleation site number
density. A question was raised by the author: what is the physical basis for the strong
influence of the mean vapor velocity and the wall heat flux. A possible solution for this was
also proposed that the mean vapor velocity could be a controlling parameter on the interfacial
shear stress, and consequently on the bulk turbulence and boiling heat flux.
Gaertner (Gaertner 1963) experimentally examined the spatial distribution of boiling
nucleation sites on a copper surface. In the experiment, water containing dissolved nickel salts
was boiled with heat fluxes of 200,000; 294,000; and 317,000 BTU/hr-ft2. By dividing the
macro area into smaller regions, it was found that the distribution of the nucleation sites
number, N, in each of the smaller regions was fitted well by a spatial Poisson distribution.
Based on the observation that the distribution of nucleation sites satisfies the spatial Poisson
distribution, it was also found that the probability of distances of nearest-neighbor nucleation
sites falls between S and S+dS is,
( ) dSSeNSP SN 2
2 ππ −= (2-35)
where, N is the area-averaged nucleation sites number. It was also found that the average
distance between nearest-neighbor sites is,
2/1
21
NS = (2-36)
18
The active nucleation site density in subcooled flow boiling of water at high heat flux
at atmospheric pressure was examined by Del Valle M and Kenning (Del Valle M and
Kenning 1985). The positions of active nucleation sites were recorded by photography at
different levels of heat flux, such as 70%, 80%, 90% and 95% of critical heat flux. In general,
they found nucleation site density increases with heat flux from their experimental
observations. It was also found that some of the sites were deactivated at higher heat fluxex
while re-activated at even higher heat fluxes. A very small number of bubbles were found to
slide on the heating surface and most of them grew and collapsed at their original nucleation
sites. By counting the number of nucleation sites in sub-domains, the nucleation sites were
found to fit the spatial Poisson distribution very well. The authors also examined the
distribution of nearest-neighbor distances. Differences between experimental observations
and theoretical spatial Poisson distribution were noticed. It was found that the experimentally
observed nearest-neighbor distances did not fall between zero and a certain minimum value.
A cut-off Poisson distribution was then proposed by the authors. The cut-off distance was
found to be about twice the maximum bubble radius. A possible reason was suggested by the
authors that at high heat fluxes the formation of a bubble was inhibited by adjacent ones.
2.2 BUBBLE DYNAMICS
During a boiling process, energy from the heating surface is first transferred to
superheated liquid layer adjacent to the wall, and the majority of the energy is then transferred
to bubbles in the form of latent heat. The remaining energy is transferred to the bulk flow
through single phase convection. Bubbles play an important role during the boiling process
since, (1) size and number of bubbles directly determine the amount of latent heat transferred
by bubbles, and (2) single phase forced convection is greatly enhanced by bubble motion
through departure and lift-off. In this section, some fundamental bubble dynamics knowledge
is presented from review of the literature.

19
Rayleigh (Rayleigh 1917) first derived the equation of motion for the radius of a
bubble, R, in a non-viscous, incompressible liquid as a function of time,
l
v PPRRR
ρ∞−
=+ 2
2
3&&& (2-37)
Where: Pv and P∞ are vapor pressure and liquid pressure in a far field, respectively, and ρl is
the liquid density. An over dot denotes the differentiation with respect to time.
Figure 2.3, Bubble growth in incompressible liquid
A surface tension term was later added by Plesset and Zwick (Plesset and Zwick
1954) as,
R
PPRRR
ll
v
ρσ
ρ2
2
3 2 −−
=+ ∞&&& (2-38)
An asymptotic solution for the bubble growth was given by Plesset and Zwick
(Plesset and Zwick 1952, 1954),
( )fgv
satlpll
h
TTc
tdt
dR
ρ
ρ
πα −
= ∞,
2/112
2
1 (2-39)
Zuber (Zuber 1961) extended the bubble growth theory of Bosnjakovic and Jakob to
include the effect of a non-uniform temperature field, and gave the bubble radius as,
( ) tJab
tR lαπ
2= (2-40)
where: b is a constant, and Ja is the Jacob number, defined as,

20
( )fgv
swlpl
h
TTcJa
ρ
ρ −= ,
(2-41)
By comparing with the experimental data, the author suggested that the value of the
constant b is from 1 to √3.
Mikic et al. (Mikic et al. 1970) later derived a closed form for bubble growth in both
inertia controlled and diffusion controlled stages,
0121
2
2=−+
dt
dR
B
t
dt
dR
A (2-42)
where, constants A and B are defined as,
2/1
∆=
lsat
vfg
T
ThbA
ρ
ρ (2-43)
and,
2/1212
= lJaB απ
(2-44)
where,
3
2=b for bubble growth in an infinite medium, and,
7
π=b for bubble growth on a surface.
The non-dimensional bubble radius solution was given as,
( ) ( )
−−+= +++ 11
3
22
3
2
3
ttR (2-45)
in which, the non-dimensional bubble radius and time are given by,
AB
RR
/2=+ (2-46)
and,

21
22 / AB
tt =+ (2-47)
It should be noted that, as t+<<1, the Mikic’s solution simplifies to Rayleigh’s
solution; and as t+>>1, it simplifies to Zuber’s solution.
A numerical analysis was carried out by Mei et al. (Mei et al. 1995a) to study bubble
growth in saturated heterogeneous boiling. In their model, energy is transferred from the
heating surface to a superheated liquid microlayer beneath a growing bubble. Evaporation
continuously takes place on the liquid-vapor interface to maintain the bubble growth. Partial
difference equations were constructed based on this concept, and finite difference solutions
were obtained for the bubble growth rate and for temperature fields in the microlayer and the
heater. The parameters characterizing the bubble shape and microlayer wedge angle were
determined by matching with experimental data. The predicted bubble growth rate showed
good agreement with experimental data over a wide range of conditions. In a subsequent
study by Mei et al. (Mei et al. 1995b), a systematic investigation of the dependence of the
bubble growth rate and the thermal field of the microlayer and heater on four dimensionless
governing parameters, i.e. Jacob number, Fourier number, thermal conductivity ratio, and
thermal diffusivity ratio of liquid to solid, was conducted.
In pool boiling, bubble departure diameter refers to bubble diameter when a bubble
leaves from the heating surface. While in flow boiling, bubble behavior is more complicated.
It’s normally observed that a bubble leaves the original nucleation site and then starts to slide
on the heating surface as it reaches a certain size, which is referred as the departure diameter
in flow boiling. The sliding bubble continues to grow by taking energy from the heating
surface, and it eventually leaves the heating surface entering the bulk flow at a certain size,
which is referred as the lift-off diameter in flow boiling. Thus, the bubble frequency is closely
related to the bubble departure diameter, bubble growth rate and waiting time.
The bubble departure size has been studied experimentally and in analytically work.
A correlation was proposed by Cole (Cole 1960) to relate the bubble frequency and departure
diameter for water pool boiling,

22
( )ld
vld
C
gDf
ρρρ
3
42 −= (2-48)
where, f is the bubble frequency, and Dd is the bubble departure diameter. The coefficient Cd
is a bubble drag coefficient, which is equal to 1 for water.
A correlation was later proposed by Cole and Shulman (Cole and Shulman 1966) to
relate the bubble departure diameter with pressure,
PBo
10002/1 = (2-49)
where, P is pressure in mmHg, and the Bond number, Bo, is defined as,
( )( )σρρ 22 dvl Rg
Bo−
= (2-50)
where, Rd is the bubble departure radius.
In a subsequent study, Cole (Cole 1967) proposed that,
JaBo 04.02/1 = (2-51)
where, Ja is the Jacob number, defined in equation (2-41).
An improved correlation was proposed by Cole and Rohsenow (Cole and Rohsenow
1968),
4/52/1cCJaBo = (2-52)
in which, constant C = 1.5×10⁻⁴ for water, and C = 4.65×10⁻⁴ for liquids other than water. The
Jacob number, Jac, was modified by replacing wall temperature with critical temperature.
Klausner et al. (Klausner et al. 1993) proposed a model to predict bubble departure
diameter in forced convection boiling on a horizontal heating surface. Bubble departure from
its original nucleation site, sliding on heating surface and then lift-off were experimentally
observed. The departure diameter was found not to be a constant value, but followed closely
to a Gaussian distribution. Klausner’s model later was improved by Zeng et al. (Zeng et al.
1993) for the prediction of bubble departure diameters in both pool and flow boiling on
horizontal heating surfaces. In pool boiling, the bubble departure diameter is determined by a
force balance in the y-direction (i.e., normal to the heating surface), as shown in Figure 2.4,

23
0=++++=∑ Lcpbduysyy FFFFFF (2-53)
where, Fsy is the surface tension force; Fduy is the unsteady growth force; Fb is the buoyancy
force; Fcp is the contact pressure force; and FL is the lift force created by the wake of a
preceding departed vapor bubble.
Figure 2.4, Bubble departure in pool boiling
The surface tension force in the y-direction is given by,
ασπα sinsin wssy dFF −== (2-54)
where, dw, σ, and α are contact diameter, surface tension and contact angle, respectively.
The unsteady growth force in the y-direction is given by,
+−= RRRCRF slduy&&& 22
2
3πρ (2-55)
where, R is the bubble radius, and an over-dot denotes the differentiation with respect to time.
As suggested by the authors, the bubble radius normally follows a power law with time and
can be experimentally determined. Mikic’s (Mikic et al. 1970) or Zuber’s (Zuber 1961) model
was suggested by the authors, if experimental data on bubble size were not available.
The buoyancy force is given by,
( ) ( )gRgVF vlvlbb ρρπρρ −=−= 3
3
4 (2-56)

24
in which, Vb is the bubble volume, and g is the gravitational acceleration.
The contact pressure force is given by,
r
w
cpr
dF
σπ 2
4
2
= (2-57)
in which, rr is the radius of curvature at the base of the bubble. It’s suggested that since dw/rr
<< 1 and therefore the contact pressure force can be neglected.
The lift force due to a preceding departed vapor bubble in pool boiling is roughly
estimated as,
422
1086.2~ −×RR
F
l
L
&ρ (2-58)
As suggested by Zeng et al., this term can be neglected for most cases of practical
interest.
Figure 2.5, Bubble departure and lift-off in flow boiling.
In flow boiling, bubble departure size is determined by a force balance in both the x-
direction (i.e., flow direction, parallel to the heating surface) and the y-direction (i.e., normal
to the heating surface),
0sin =++=∑ θduqssxx FFFF (2-59)
0cos =+++++=∑ θducphbsLsyy FFFFFFF (2-60)

25
in which, Fsx is the surface tension force component in the flow direction; Fqs is the quasi-
steady drag force in the flow direction; Fdusinθ is the grow force component in the flow
direction; Fsy is the surface tension component in the y-direction; FsL is the shear lift force; Fb
is the buoyancy force; Fh is the hydrodynamic force; Fcp is the contract pressure force;
Fducosθ is the unsteady growth force component in the y-direction; θ is the angle of
inclination.
Surface tension terms are given by Klausner et al. (Klausner et al. 1993) as,
( )( )22
25.1βαπ
βαπσ
−−
−−= wsx dF (2-61)
and,
[ ]αββα
πσ coscos −
−−= wsy dF (2-62)
where, α and β are advancing contact angle and receding contact angle, respectively.
The quasi-steady drag force is given by,
+
+∆=
− n
n
n
b
lqs vRF
/1
796.0Re
12
3
26πρ (2-63)
where, ∆v is the velocity difference between the vapor bubble and the surrounding liquid; R is
the bubble radius and Reb is the bubble Reynolds number, which is defined as,
l
lb
vR
µρ ∆
=2
Re (2-64)
The constant, n, is normally taken as 0.65.
The shear lift force is given by,
[ ]{ }4/1222/122 014.0Re877.32
1sbslsL GGRvF +∆= πρ (2-65)
where,
v
R
dy
dvGs ∆
= (2-66)
and y is the distance from the wall.

26
The hydrodynamic pressure force is given by,
48
9 22 w
lh
dvF
πρ ∆= (2-67)
The unsteady growth force, Fdu, buoyancy force, Fb, and contact pressure force, Fcp,
are defined in equations (2-55), (2-56), and (2-57), respectively.
After bubble departure from its original site, it’s assumed that the bubble slides with
at the same velocity as the surrounding fluid, and therefore, both the velocity difference and
angle of inclination are zero. The bubble lift-off size can be determined simply by the force
balance in the y-direction,
0=++++=∑ ducphbsy FFFFFF (2-68)
Klausner (Klausner et al. 1993) and Zeng’s (Zeng and Klausner 1993) models are so
far the only mechanistic models based on analytical bubble force analysis, and they give fairly
good agreement with experimental data.
In flow boiling processes, other than single bubble dynamics, multiple bubble
dynamics is even more important. Many observations have shown that significant bubble
interactions, such as bubble coalescence, nucleation site prohibition/activation are present in
flow boiling. These strong interactions make flow boiling a highly nonlinear system. A
review of boiling chaos has been provided by Shoji (Shoji 2004). At moderate heat flux, a
sliding vapor bubble can coalesce with another bubble downstream to form a larger bubble.
Experimental evidence shows that this larger bubble has a high chance to lift-off from the
heating surface even it does not reach a normal lift-off size. At higher heat fluxes, nucleation
site density is so high that the distance between two adjacent bubbles is about one bubble
diameter. Then bubble coalescence can happen directly at their original sites without sliding.
However, as the nearest distance between two bubbles becomes close to one bubble diameter,
prohibiting bubble formation due to adjacent bubbles and it has been experimental observed
in pool boiling. Little data were obtained for flow boiling bubble prohibition, but the
mechanism may be applied for these conditions. This needs to be confirmed.

27
An experiment was carried out by Chekanov (Chekanov 1977) to study growth of
bubbles on a heating surface and bubble recurrence rates. Based on experimental data, it was
found that the greatest effect on bubble formations from adjacent bubbles was in the form of
acoustic waves emitted by the growing bubble. This effect of was studied in terms of time
intervals between bubble formation at one site and that at an adjacent site. The distribution of
this time interval can be described by the theory of pulse processes,
( ) ( )[ ] λννν ντλτ −− Γ= eg 1 (2-69)
where, g is the probability that the time interval is within τ and τ+dτ; λ is the reciprocal of the
expected value of the time interval; ν is a correlation parameter. Experimental results were
obtained for both saturation and subcooled boiling of water at atmospheric pressure. The ratio
of the distance between the two sites, r, to the bubble maximum diameter, D, was studied.
Experimental results showed that, when this distance was larger than three times the
maximum bubble diameter, the correlation parameter ν < 1. This means the formation of a
bubble on one nucleation site promotes that on the other site. When this distance r ~< 3D, the
correlation parameter ν > 1, which indicates that the formation of a bubble on one nucleation
site inhibits that on the other site. When the distance is much larger than the bubble diameter,
the correlation parameter ν is close to 1 and there is no interaction between them. It was also
proposed by the author that, the first heat transfer crisis during boiling heat transfer occurred
when the distance between nucleation sites was equal to the correlation radius, which is about
three times the maximum bubble diameter.
Theoretical analyses and experiments were conducted by Chai et al. (Chai et al. 2000)
to analyze the interactions between active sites/bubbles. For nucleate boiling, the formation of
a bubble on a nucleation site was idealized as a round continuous surface heat sink. The
temperature variation induced by bubble growth was then analytically solved. The results
showed that bubble size and heating surface material significantly influenced the temperature
field inside the heating surface. This phenomenon was also experimentally explored in pool
boiling on metal plates with various materials and thicknesses. Temperatures on several

28
adjacent sites were recorded by thermocouples. Different levels of thermal influence were
found for different surface material and thickness combinations. It was experimentally found
that, the thinner the plate and the smaller the plate thermal conductivity, the stronger were the
observed thermal interactions. Both analytical and experimental work showed thermal
conductivity played a critical role during thermal interactions. The study made by the author
revealed a more reasonable mechanistic description of nucleate boiling than the classical
linear approach. The classical linear approach is normally based on analysis of single bubble
dynamics, nucleation site density and an assumed uniform wall superheat. A theoretical
framework was then proposed by Chai (Chai 2004) to analyze interactions between bubbles
and their self-organizing effect. Due to the difficulty of applying classical nonlinear partial
differential equations to describe boiling systems, statistical mechanics, based on Lagrange’s
optimization, was used as an alternative method. This proposed method, although preliminary,
provided a renewed theoretical effort to understand the underlying mechanisms of nucleate
boiling.
It was observed by Judd and Lavdas (Judd and Lavdas 1980) that, bubble emission on
a nucleation site was capable of either activating or deactivating the bubble emission on an
adjacent nucleation site. A potential nucleation site can be activated when it’s covered by a
bubble formed on an adjacent site, while bubble formation can also be prohibited due to the
growth of an adjacent bubble. The influence area, sometimes referred asthe energy extraction
area of a bubble, was also studied. This area is normally expressed as K times the projected
area of a bubble. The value of K was found to be sensitive to interactions between nucleation
sites. When overlapping of bubbles is intensive the value of K approaches unity. By using the
same theory of pulse processes adopted by Chekanov (Chekanov 1977), interactions between
nucleation sites were experimentally studied by Calka and Judd (Calka and Judd 1985). The
probability distribution function of elapsed time between bubble formations on two adjacent
sites was plotted and fitted with a Gamma function. Compared to Chekanov’s results, an
opposite conclusion was drawn based on the analysis of experimental results. It was found
that promotion of a bubble on an adjacent site occurred when 1/2 ≤ S/D ≤ 1, where S is the
29
distance between two sites and D is the maximum bubble diameter. The author believed it
was the result of a ‘seeding’ mechanism. Sites interaction behavior under different boiling
conditions, such as bubble number density and bubble diameter, were also experimentally
revealed by Judd and Chopra (Judd and Chopra 1993). Based on Judd’s (Judd 1988) site-
seeding concept, a simulation routine known as BOILSIM was developed by Mallozzi et al.
(Mallozzi et al. 2000) to simulate the interaction process of nucleation sites. Good agreement
was obtained compared with Chopra’s experimental data (Judd and Chopra 1993).
An experiment was designed to statistically study the interaction between nucleation
sites by Hardenberg et al. (Hardenberg et al. 2004). Spatial-temporal data of wall
temperatures were obtained by liquid crystal thermography over a period of 1,930 seconds,
during pool boiling of water. The experiment was conducted on a thin plate with non-
uniformly distributed nucleation sites at a heat flux at 51 kW/m2. Without the need of direct
visual observation of bubbles, the phenomenon of nucleation sites interactions was identified
from analysis of the spatial-temporal data of wall temperatures. The number of subsequent
events, i.e., bubble formations on other sites during different delayed time intervals was
plotted as a function of distance from the original site. It was found that there were no
interactions for S/R > 0.75, while inhibitions occurred for S/R < 0.25, and promotion occurred
for S/R values between 0.25 and 0.75, where S is the distance between two sites, and R is the
bubble radius.
Surfaces with twin artificial nucleation sites were utilized to study nucleation sites
interactions in pool boiling by Mosdof and Shoji (Mosdof and Shoji 2004). Temperatures of
nucleation sites were recorded and a nonlinearity analysis was performed. It was found that
thermal interactions between two sites decreased while hydrodynamic interactions increased
bubble emission frequency. The nonlinearity analysis showed that, at around S/D = 0.5 and
2.5, interactions through the liquid, i.e. bubble coalescence and hydrodynamic interactions,
promoted bubble departure. At around S/D = 1.75, thermal interactions inhibited bubble
departure. The nonlinearity analysis on twin and triple artificial nucleation sites, which are
activated by a laser, were presented by Mosdorf and Shoji (Mosdof and Shoji 2008).

30
Interactions between lasers activated nucleation sites were also experimentally
studied by Golobič and Gjerkeš (Golobič and Gjerkeš 2001). In their study, interactions
between two, three, and four simultaneously activated sites in various geometrical
arrangements in pool boiling with saturated water were studied. In this kind of study, “natural
occurrence” of boiling is sacrificed to some extent. However, it provides a chance to
manually control parameters and direct observations can be made. For two laser activated
sites with identical diameters and heat fluxes, the interaction did not occur until the distance
between these two sites was in the order of one bubble size. These interactions occurred in the
form of: (1) decreased frequencies on both sites, (2) one decreasing and the other increasing,
or (3) irrespective of each other. Similar behaviors were also found for the interactions of
three or four this kind of sites. It was also found in certain extreme cases with two sites that
one site could completely deactivate the other. The heat transfer capability of these sites was
studied in terms of latent heat carried by lift-off bubbles. However, it is known during boiling
processes micro convection induced by bubble movement is an important contribution to
boiling heat transfer. Therefore, the results provided in this study might be insufficient since
the latent heat flux is not enough to account for the whole boiling process.
The behavior of near-wall bubbles in subcooled flow boiling has been visually
investigated for water flow boiling in vertical, one-side heated, rectangular channels at
atmospheric pressure by Chang et al. (Chang et al. 2002). A Kodak Ektapro 100 motion
analyzer and a Nikon D1 digital camera were used to record bubble behaviors during
subcooled flow boiling. It was observed that significant bubble coalescence was present for
heat fluxes over ~40% of CHF (critical heat flux). At sufficiently high heat fluxes, three
characteristic regions were identified, including, (1) a superheated liquid layer with very
small bubbles attached on heated surfaces, (2) a flowing bubble layer containing vapor clots
and small bubbles, and (3) a liquid core region. It was also visually confirmed that a liquid
sublayer existed beneath coalesced bubbles, and that CHF occurred during the process of
periodic formations of large vapor clots near the exit. As claimed by the author, these
observations provided visual evidence for the liquid sublayer dryout critical heat flux models.

31
A digital photographic study of subcooled flow boiling with R134a was performed in a
vertical rectangular channel by Bang et al. (Bang et al. 2004). In their study, a detailed
observation of near wall bubble structure was obtained. The near wall regions included a
vapor remnant, an interleaved liquid layer, and coalesced bubbles. It was also shown that
critical heat fluxes were trigged by dryout of the near wall bubble layer beneath the vapor
clots.
Bubble growth and condensation behaviors were experimentally investigated by
Prodanovic et al. (Prodanovic et al. 2002) for subcooled flow boiling of water at pressures
from 1.05 to 3 bar and bulk liquid velocities from 0.08 to 0.8 m/s. A high speed camera with
6000-8000 frames per second was used to capture bubble dynamics from the inception to
final collapse. The bubble dynamics were found to vary in different boiling regimes: (1) A
regime before ONB, with low heat flux and nucleation site density, where bubble detachment
is rarely observed; (2) An isolated bubble regime, where bubbles detach from surfaces
without much interactions with adjacent bubbles; (3) A regime with significant bubble
coalescence, where bubble number density is very high and bubble coalescence occurs before
bubble detachment. Aside from normal detachment, bubbles detach after merging or
interacting with adjacent bubbles. An empirical correlation was proposed to correlate bubble
size during growth and condensation against time based on experimental results.
2.3 HEAT FLUX PREDICTION
Flow boiling heat transfer has proved to be an efficient way of cooling in high heat
flux removal applications, such as heat removal in nuclear reactor cores. Much work has been
done to understand and to model flow boiling heat transfer. During the past decades,
numerous empirical correlations were proposed to predict the boiling heat transfer rate.
However, these correlations were normally limited to a certain range of applicability. In
addition to empirical correlations, approaches were also made to build mechanism based
models to explain and predict complex flow boiling phenomena.

32
Some of the empirical correlations were proposed at early years, such as by
McAdams, Jens and Lottes, and Shah.
McAdams et al. (McAdams et al. 1949) first proposed a correlation for water flow
boiling heat transfer as,
86.3sTCq ∆= (2-70)
in which, the constant, C, depends on the dissolved air content and is determined empirically.
Jens and Lottes (Jens and Lottes 1951) gave a correlation to relate wall superheat and
system pressure to heat flux for water flow boiling,
62/25.025 P
s eqT −=∆ (2-71)
in which, the wall heat flux, q”, is in MW/m2 and pressure, P, is in bar.
Jens and Lottes’ correlation was later improved by Thom et al. (Thom et al. 1965) to
fit experimental data,
87/6.025 P
s eqT −=∆ (2-72)
Thom’s correlation is for subcooled or saturated flow boiling of water at pressure up
to 200 bars under conditions where the nucleate boiling contribution is predominant over
forced convection.
Wall heat flux during flow boiling is also normally expressed as a sum of two
components, contribution from single phase convection heat transfer and contribution from
boiling heat transfer,
bisp qqq += (2-73)
in which, qsp is the heat flux component from single phase convection, and qbi is the
component from boiling heat transfer.
Bowring (Bowring 1962) was the first one to identify different heat transfer
mechanisms during flow boiling. It’s proposed that wall heat flux, q, during flow boiling has
three components, single phase convection, qsp, evaporation, qev, and sensible heating of the
bulk liquid filling the void created by departure of vapor bubble, qpump. Thus,

33
( ) evsppumpevsp qqqqqq ε++=++= 1 (2-74)
in which, ε = qpump/ qev is normally empirically determined. Single phase convection heat
transfer can be estimated by,
( )bulkwspsp TThq −= (2-75)
The evaporation term can be calculated by multiplying the latent heat carried by a
single bubble, the bubble frequency and the active nucleation site density,
abfgvev fNVhq ρ= (2-76)
in which, Vb is the volume of a bubble; f is the bubble frequency and Na is the active
nucleation site density.
The ratio ε is empirically given by,
>
≤≤
≤≤∆
+
=
506.2
505.93.2
5.912.31 ,
p
p
ph
Tc
fgv
sublpl
ρ
ρ
ε (2-77)
in which, p is pressure in bar. Bowring’s correlation has been verified in a wide range of flow
boiling conditions, with pressures ranging from 11 to 136 bars, heat fluxes ranging from 30 to
160 W/cm2 and liquid velocities ranging from 0.8 to 2.0 m/s.
Chen (Chen 1966) proposed a correlation to predict saturated flow boiling heat flux
of water, and was also extended to subcooled flow boiling. For saturated water flow boiling,
( )swbi TThq −= (2-78)
NBFCbi hhh += (2-79)
where,
( )F
D
kDxGh
h
l
l
l
h
FC
4.0
8.0
Pr1
023.0
−=
µ (2-80)
34
( ) ( )S
h
PPTTckh
vfgl
swswllpl
NB 24.024.029.05.0
75.024.049.045.0,
79.0
00122.0ρµσ
ρ −−= (2-81)
where, the factor, F, is approximated by,
>
+
≤
=1.0
1,213.0
135.2
1.01
,1
736.0
tttt
tt
Xif
X
Xif
F (2-82)
the inverse Martinelli parameter is defined as,
5.01.09.0
11
−
=v
l
l
v
tt x
x
X ρρ
µµ
(2-83)
and, the suppression factor, S, is approximated by
>
≤<+
≤+
=
70Re,1.0
70Re30,Re42.01
1
30Re,Re12.01
1
78.0
14.1
TP
TP
TP
TP
TP
if
if
if
S (2-84)
where,
( ) 25.14 110Re F
DxG
l
h
TP µ−
= − (2-85)
For subcooled flow boiling, equation (2-78) can be rewritten as,
( ) ( )bwFCswNB TThTThq −+−= (2-86)
in which, the nucleate boiling heat transfer coefficient, hNB, can be calculated by equation (2-
80). The suppression factor, S, can be calculated by equation (2-83) with a single phase
Reynolds number. The single phase heat transfer coefficient, hFC, can be calculated from
equation (2-79) with factor F equal to 1.
A graphic alternative to Chen’s correlation was proposed by Shah (Shah 1976) for
saturated flow boiling. The ratio of the flow boiling heat transfer coefficient to the single
35
phase heat transfer coefficient, hTP/hSP, was plotted with the convection number, Co, the
boiling number, Bo, and the Froude number, Fr. The convection number, Co, is defined as,
5.08.01
−=
l
v
x
xCo
ρρ
(2-87)
where, x is the mass vapor quality.
The boiling number, Bo, is defined as,
fgGh
qBo = (2-88)
The Froude number, Fr, is defined as,
gD
GFr
lρ
2
= (2-89)
Based on experimental data of water, refrigerants, alcohols etc., an empirical non-
dimensional correlation was later proposed by Shah (Shah 1977) to predict subcooled flow
boiling heat transfer in pipes and annuli. The correlation for fully developed flow boiling is
given by,
( )Bofh
h
SP
TP = (2-90)
in which, f(Bo) is given by,
( )
×≤+
×>=
−
−
5
5
100.3461
100.32301
1
BoforBo
BoforBoBof
C
C
(2-91)
A value of 0.5 is suggested by the author for the empirical constant, C1. A similar
study on saturated flow boiling is also provided by Shah (Shah 1982).
Kandlikar (Kandlikar 1990) proposed a general correlation for saturated two-phase
flow boiling heat transfer inside horizontal and vertical tubes. Later, a flow boiling map for
subcooled and saturated flow boiling of different fluids inside circular tubes was constructed
by Kandlikar (Kandlikar 1991). A correlation for subcooled flow boiling was then proposed
by Kandlikar (Kandlikar 1997, 1998). Correlations for saturated two-phase flow boiling heat

36
transfer were separately proposed for vertical and horizontal flows. A final form of the
correlation for both conditions was then proposed as,
( ) ( ) fl
C
l
CC
l
C
lo
TP FFrBoCFrCoCh
h6452 2525 31 += (2-92)
where, constants, C1, C2, C3, C4, C5 and C6 were empirically determined. The convection
number, Co, boiling number, Bo, and Froude number with all flow as liquid, Frl, could be
calculated by equations (2-87), (2-88), and (2-89), respectively. Ffl is a constant depending on
type of fluid. hlo is the single phase convection heat transfer coefficient assuming all mass
flow as liquid only.
The correlation for subcooled flow boiling was proposed as,
fl
lo
TP FBoh
h 7.00.1058= (2-93)
and,
( )swTP TThq −= (2-94)
where, hSP is the single phase convection heat transfer coefficient, calculated from,
=
w
bcplolo NuNu
µµ
, (2-95)
where, µb and µw are fluid dynamic viscosities corresponding bulk temperature and wall
temperature, respectively. The Nulo,cp is the Nusselt number with constant properties, given by
Petukhov and Popov (Petukhov and Popov 1963) for 0.5≤Pr≤2000 and 104≤Relo≤5×10⁶,
( )( )( ) ]2/1Pr7.1207.1[
2/PrRe5.03/2 f
fNu lo
lo−+
= (2-96)
and by Gnielinski (Gnielinski 1976) for 0.5≤Pr≤2000 and 2300≤Relo≤5×10⁴,
( ) ( )( )( ) ]2/1Pr7.1207.1[
2/Pr1000Re5.03/2
f
fNu lo
lo−+
−= (2-97)
where, f is the friction factor given by,
( )[ ] 228.3Reln58.1 −−= lof (2-98)

37
Combining the definition of hTP, and the boiling number, Bo, the final form for the
subcooled flow boiling heat flux can be derived as,
( ) ( )[ ] 3.0/17.00.1058 swloflfg TThFGhq −= − (2-99)
Liu and Winterton (Liu and Winterton 1989) proposed a general correlation for both
saturated and subcooled flow boiling in tubes and annuli based on a nucleate pool boiling
equation. The flow boiling flux is basically calculated from a single phase convection
component and a nucleate pool boiling component as suggested by Kutateladze (Kutateladze
1961). The correction factors, F and S, are from an original idea that the single phase
convection is enhanced while the boiling heat transfer is suppressed due to the presence of
vapor bubbles. The flow boiling heat transfer correlation then is given by,
( ) ( ) ( )swpoolSPsaturated TTShFhq −+= 22 (2-100)
and,
( )[ ] ( )[ ] 22swpoolbwSPsubcooled TTShTTFhq −+−= (2-101)
where, the enhancement fact F and suppression factor S are given by,
35.0
1Pr1
−+=
v
l
lxFρρ
(2-102)
[ ] 116.01.0 Re055.01−
+= lFS (2-103)
where, x is the mass vapor quality. Prl and Rel are the liquid Prandtl number and Reynolds
number, respectively.
The single phase convection heat transfer coefficient is given by the Dittus-Boelter
correlation (Dittus and Boelter 1930),
4.08.0 PrRe023.0 ll
l
SPd
kh = (2-104)
The pool boiling heat transfer coefficient is given by Cooper’s correlation (Cooper
1984),

38
( ) 5.055.010
3/212.0 log55 −−−= Mpqph rrpool (2-105)
where, pr is the reduced pressure, which is the ratio of the pressure to the critical pressure. M
is the molecular weight.
In most of the modeling work on predicting heat transfer rate, the wall heat flux is
calculated from different components, such as single phase convection, bubble latent heat
contribution and transient conduction to bulk flow after bubble departure from heating surface.
This includes work of Kenning and Del Valle M (Kenning and Del Valle M 1981), Del Valle
M and Kenning (Del Valle M and Kenning 1985), Sateesh et al. (Sateesh et al. 2005), Basu et
al. (Basu et al. 2005), Podowski and Podowski (Podowski and Podowski 2009).
Kenning and Del Valle M (Kenning and Del Valle M 1981) proposed a heat transfer
model for fully developed nucleate pool boiling. For isolated pool boiling with small
nucleation site density, the heat transfer rate can be expressed as the sum of two components,
single phase convection and boiling components,
( )α−+= 1cbi qqq (2-106)
where, qbi is the contribution from boiling, qc is the contribution from single phase convection
and α is the nominal fraction of wall affected by boiling. The contribution from boiling can be
estimated from so-called ‘quenching theory’: the heating wall is cooled by the bulk liquid
which fills the vacancy created by a departed bubble. The wall quenching can be modeled as
transient conduction from the wall to a semi-infinite liquid. A time-averaged quenching flux
is given by,
Tfck
qlpll ∆
=
2/1
,1 2
π
ρ (2-107)
in which, kl, ρl and cp,l are liquid thermal conductivity, density and specific heat, respectively.
f is the bubble frequency; ∆T is the temperature difference between the wall and the bulk
liquid. The boiling component then can be calculated from,
α1qqbi = (2-108)
and

39
( )2mRnKnKA πα == (2-109)
where, n is the nucleation site density; A is the bubble projection area, which is a function of
the maximum bubble radius, Rm. The parameter, K, is normally assumed as a constant in a
range of 2≤K≤5, which is experimentally determined. As heat flux increases, the nucleation
site density can be very high, so that bubble affected areas can overlap and therefore a certain
area can be quenched m times during an average bubble period, 1/f. The total wall heat flux
can be expressed as,
−+= ∑∑
∞
=
∞
= 11 11 1
m
mc
m
m
m
m
yq
m
y
q
qqq αα (2-110)
where, ym is the fraction of area of influence quenched by m sites; qm is the time-averaged
quenching flux for m sites. By assuming that adjacent sites have the same frequency and
quenching events are randomly distributed, as given by,
( )( )1232...31
!2 1
1 −−⋅⋅⋅=
−
mm
m
q
q m
m (2-111)
Three types of nucleation sites distributions, e.g., regular triangular distribution,
random distribution (spatial Poisson distribution) and modified random distribution (modified
spatial Poisson distribution), were examined. Based on the calculated results, the author
suggested that the effect of nucleation sites distribution was not significant, while correlations
for bubble size and frequency could be critical for predicting the heat flux.

40
Figure 2.6. A schematic drawing of heat transfer zones in pool boiling (Del Valle M and
Kenning 1985).
Del Valle M and Kenning (Del Valle M and Kenning 1985) then proposed a
theoretical heat transfer model for subcooled flow boiling based on an experimental
investigation of subcooled flow boiling of water at atmospheric pressure on stainless steel. In
this experiment, bubble size, frequency and nucleation sites distribution were examined. In
terms of heat transfer, the heated wall is divided into four zones as shown in Figure 2.6: (1)
maximum bubble projected area, where microlayer evaporation and transient conduction
dominate; (2) surrounding areas of influence, where transient conduction dominates; (3)
overlapping areas of influence, where enhanced transient conduction dominates; and (4) non-
boiling area, where single phase forced convection dominates. The only unspecified quantity
in the theoretical model is the factor K, which is the ratio of the bubble influenced area to the
bubble projected area. The value of K was adjusted to make the model calculated heat flux
match the measured flux. Itwas found that the value of K varied from 5.8 to 7.5. The
microlayer evaporation heat transfer was found to be only 2-3% of the total heat flux. Single
phase convection accounted for around 10% and it decreased to 5% as the boiling area
increased at higher heat flux. This model sheds some light on how to quantify flow boiling

41
heat transfer components, however, the sliding of bubbles was not considered in the model
and an empirical parameter K was adjusted to match the model predicted heat flux and
experimentally measured value.
Sateesh et al. (Sateesh et al. 2005) studied the effect of bubbles sliding on the heating
surface on pool boiling heat transfer. The model considered different heat transfer
mechanisms, than during pool boiling, involving bubble sliding, such as; latent heat transfer
due to microlayer evaporation, transient conduction due to thermal boundary reformation,
natural convection and heat transfer due to bubbles sliding. The latent heat transfer due to
microlayer evaporation of a stationary bubble (i.e., before its sliding) is given by,
fNhdq afgvdme
= ρπ 3
6
1 (2-112)
where: dd is bubble departure diameter; Na is active nucleation site density; and f is bubble
frequency. The transient conduction heat transfer due to bubble departure from its original
site is given by,
ftd
KNTt
ckq w
d
a
w
lpll
tc
∆=
42
2, π
π
ρ (2-113)
Where: tw is the waiting time; K is the ratio of bubble influence area to its projected area; and
a value of 1.8 is suggested. Some detailed work on the influence of sliding bubble on forced
boiling heat transfer can be found in Yan et al. (Yan et al. 1997), Thorncroft and Klausner
(Thorncroft and Klausner 1999), and Donnelly et al. (Donnelly et al. 2009). The microlayer
evaporation due to a sliding bubble can be simply calculated as,
( ) fNhddq afgvdlmes
−= ρπ 33
6
1 (2-114)
where, dl is the bubble lift-off diameter. The transient conduction heat transfer due to a sliding
bubble is given by,
( ) ( )∫∆=l
d
t
tbwa
w
lpll
tcs dttUtKdftTNt
ckq
π
ρ ,2 (2-115)

42
where, td is the bubble departure time; tl is the bubble lift-off time; d(t) is the bubble diameter
at time t; and Ub(t) is the bubble velocity at time t. The area fraction of natural convection is
determined by the area which is not influenced by either a stationary bubble or a sliding
bubble, as given by,
4211 AAAAnc −−−= (2-116)
where, A1 is the stationary bubble influenced area, given by,
44
1
44
3 22
1d
a
d
a
dN
dKNA
ππ+= (2-117)
by assuming that the waiting time is three times the growth time.
A2 is the sliding bubble projected area, given by,
4
2
2
2
+
=
ld
s
dd
nA
π (2-118)
where, ns is the number density of sliding bubbles.
A4 is the transient conduction area of sliding bubbles, given by,
−
+= 24 24
3A
ddKlnA ld
sb (2-119)
The single phase convection heat transfer is then calculated as,
TAhq ncncnc ∆= (2-120)
The total heat flux is calculated as,
( ) ( ) ncstcsmessttcmetotal qxqqxqqq ++++= (2-121)
where, 1=stx , 1=sx , when, 14
12
>=db dn
Rπ
and, Rxst = , 0=sx , when R ≤ 1.
However, the values of xst and xs have to be adjusted or corrected when comparing the model
with existing experimental data.

43
Basu et al. (Basu et al. 2005) proposed a mechanistic wall heat flux partitioning
model for subcooled flow boiling. It’s proposed that all of the energy from the heating surface
is first transferred into the superheated liquid layer adjacent to the wall. A fraction of this
energy generates vapor bubbles while the rest contributesto sensible heating of the bulk liquid.
Thus, the total heat flux can be expressed as a sum of two components, forced convection and
transient conduction,
tcfc qqq += (2-122)
The model is only applicable for subcooled flow boiling heat transfer prediction in
the region downstream of the onset of significant voids (OSV). The two heat flux components
were modeled for two cases, 1) bubble sliding at relatively low heat flux and 2) bubbles
merging without sliding at higher heat flux. In case of flow boiling with bubble sliding, the
transient conduction component is given by,
( ) dtNRATTt
k
ttq afsl
t
subw
l
l
gw
tc ∫ ∆+∆+
=0
1
πα (2-123)
where, tw and tg are bubble waiting time and growth time, respectively. Asl is the area swept by
a sliding bubble, given as Asl = Cdl, in which C is the ratio of bubble base area to bubble
projected area. d is the bubble average diameter, equal to (dd+dl)/2. l is the sliding distance.
RfNa represents the number of bubbles sliding per unit area. t = t* when t* < (tw + tg) and t =
(tw + tg) when t* ≥ (tw + tg). t* is given by,
lfc
l
h
kt
πα1
*
2
= (2-124)
where, fch is the enhanced single phase convection heat transfer coefficient,
The single-phase convection heat transfer component is given by,
( )[ ] ( )
+−∆+∆+−∆+∆=
gw
afslsubwfcafslsubwfcfctt
tNRATThNRATThq
*11 (2-125)
In case of high wall superheat and wall heat flux, bubbles tend to merge with each
other before sliding. At any given moment, the whole surface area is experiencing an

44
enhanced forced convection or transient conduction. The two heat flux components are given
by,
When t* ≤ tw,
( )dtTTt
k
ttq
t
subw
l
l
gw
tc ∫ ∆+∆+
=*
0
1
πα (2-126)
( ) ( )[ ]gw
g
absubwfc
gw
wsubwfcfc
tt
tNATTh
tt
ttTThq
+−∆+∆+
+
−∆+∆= 1
* (2-127)
where, Ab is the bubble base area, Ab = π(Cs)2/4, and s is the average distance between
adjacent nucleation sites.
When t* > tw,
( ) ( )[ ]
−∆+∆+∆+∆
+= ∫ ∫
w
w
t t
tabsubw
l
lsubw
l
l
gw
tc dtNATTt
kdtTT
t
k
ttq
01
1
παπα
(2-128)
where t = tw + tg, if t* ≥ tw + tg, otherwise t = t*.
( )[ ]gw
gw
absubwfcfctt
tttNATThq
+
−+−∆+∆=
*1 (2-129)
if tw < t < tw + tg, otherwise, qfc = 0.
The effect of heating surface materials on pool boiling heat transfer has been studied
by many different researchers. The impact of heating wall thermal properties on the boiling
process was first investigated by Bonilla and Perry (Bonilla and Perry 1941). Differences
were found between boiling of ethanol on different heating surfaces, such as copper, gold and
chromium electroplated surfaces. Berenson (Berenson 1962) experimentally examined the
pool boiling of n-pentane on surfaces with different materials, surface roughness, and
cleanliness. Different heat transfer coefficients were observed for boiling on wires made of
different materials (Farber and Scorah 1968). Bliss et al. (Bliss et al. 1969) conducted tests of
nucleate boiling on a stainless steel tube and also the same stainless steel tube coated with
different materials, such copper, zinc, tin, nickel, cadmium and chromium. It was found

45
nucleate boiling heat transfer showed significant differences for different coatings. For
example, the heat transfer coefficient between copper and zinc coatings had a difference in
the range of 200 to 300 percent.
A method was proposed by Rohsenow (Rohsenow 1952) based on a logical
explanation of the mechanism of heat transfer associated with the boiling process to correlate
heat transfer data for nucleate pool boiling. A correlation was proposed to fit a wide range of
data of water pool boiling on a platinum wire,
( )
7.133.0
0/
−=
l
ll
vlfgl
sf
fg
xl
k
c
g
g
h
AqC
h
Tc µρρ
σµ
(2-131)
in which: cl, kl, and µl are specific heat, thermal conductivity, and dynamic viscosity of
saturated liquid, respectively; Tx is wall superheat; hfg is latent heat of evaporation; g and g0
are the acceleration of gravity and a conversion factor, respectively; and ρl, ρv and σ are liquid
density, vapor density and surface tension, respectively. A constant, Csf, was proposed to
account for liquid-surface combination effects. It was found for the water-platinum
combination, that the value of Csf is 0.013 with a spread of data of approximately ±20%. The
values of the constant, Csf, were also obtained for other fluid-surface combinations. For
benzene-chromium, ethyl alcohol-chromium, n-pentane-chromium and water-brass
combinations, the values of the constant, Csf, were found to be 0.010, 0.0027, 0.015 and
0.0060, respectively.
Recent experimental work done by Jabardo et al. (Jabardo et al. 2009) tested the roughness
and surface material effects on nucleate boiling heat transfer from cylindrical surfaces to
refrigerants such as R134a and R123. Pool nucleate boiling data were obtained for both
refrigerants on copper, brass and stainless steel surfaces. The heat transfer coefficient was
correlated with wall heat flux in the form of,
mCqh = (2-132)
in which, m is a constant taking account effect of materials. A slight difference on values of m
was found between copper and brass surfaces. However, the value of m for stainless steel

46
surfaces was found to be significantly lower than the other two surfaces, indicating lower
boiling heat transfer coefficients.
A lot of research has been done in the past to investigate the heating surface material
effects on the nucleate boiling heat transfer. However, most was focused on pool boiling
while similar studies for flow boiling conditions is lacking. More importantly, due to
limitations of experimental observations and measurement methodologies, most of the early
research was mainly based on empirical means to correlate experimental data. Mechanism
behind the material effect was not fully understood.
2.4 SUMMARY
The main objective of current thesis is to study subcooled flow boiling on both
copper and stainless steel surfaces from both microscopic and macroscopic points of view.
This chapter of literature review, therefore, has been main focused on three major topics
related to the subcooled flow boiling process, such as boiling capacity, nucleation site
activation, number density and its distribution, and bubble dynamics. The literature review
presented in this chapter covers a wide range of researches done in the past to understand the
flow boiling phenomenon. These researches efforts are including experimental measurements
and observations, analytical and theoretical works, model developments, empirical and semi-
empirical correlations, developments on new technologies, etc.
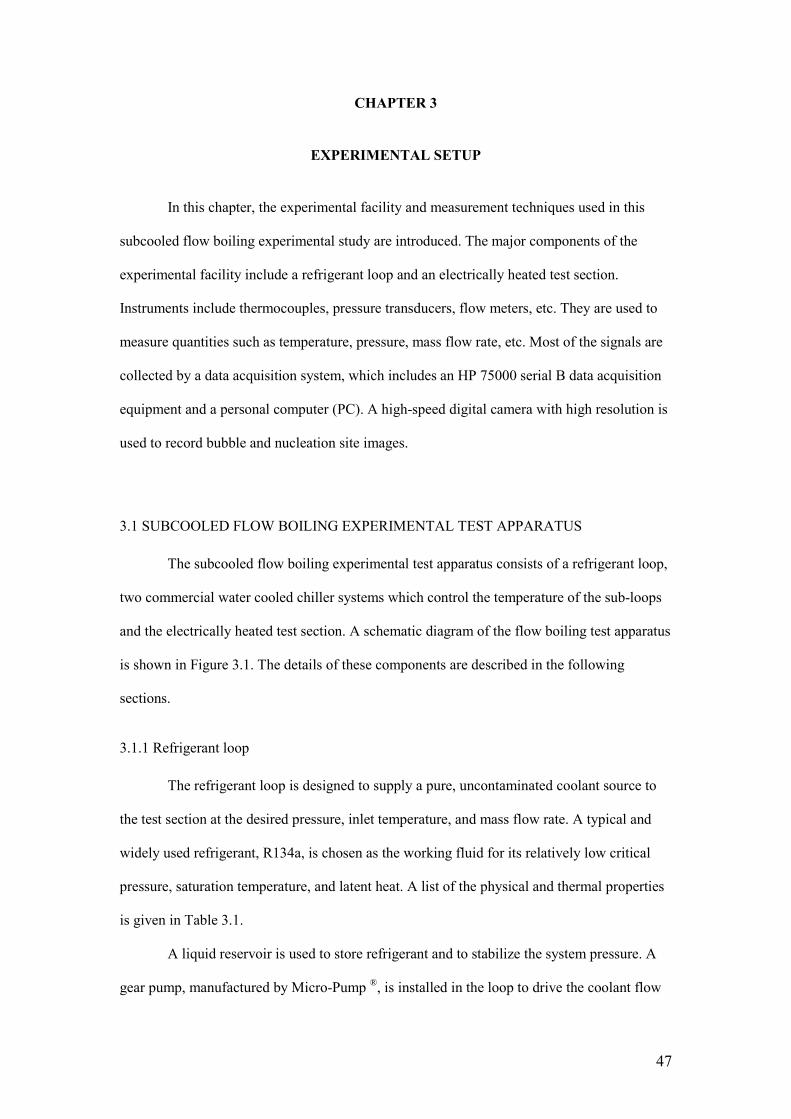
47
CHAPTER 3
EXPERIMENTAL SETUP
In this chapter, the experimental facility and measurement techniques used in this
subcooled flow boiling experimental study are introduced. The major components of the
experimental facility include a refrigerant loop and an electrically heated test section.
Instruments include thermocouples, pressure transducers, flow meters, etc. They are used to
measure quantities such as temperature, pressure, mass flow rate, etc. Most of the signals are
collected by a data acquisition system, which includes an HP 75000 serial B data acquisition
equipment and a personal computer (PC). A high-speed digital camera with high resolution is
used to record bubble and nucleation site images.
3.1 SUBCOOLED FLOW BOILING EXPERIMENTAL TEST APPARATUS
The subcooled flow boiling experimental test apparatus consists of a refrigerant loop,
two commercial water cooled chiller systems which control the temperature of the sub-loops
and the electrically heated test section. A schematic diagram of the flow boiling test apparatus
is shown in Figure 3.1. The details of these components are described in the following
sections.
3.1.1 Refrigerant loop
The refrigerant loop is designed to supply a pure, uncontaminated coolant source to
the test section at the desired pressure, inlet temperature, and mass flow rate. A typical and
widely used refrigerant, R134a, is chosen as the working fluid for its relatively low critical
pressure, saturation temperature, and latent heat. A list of the physical and thermal properties
is given in Table 3.1.
A liquid reservoir is used to store refrigerant and to stabilize the system pressure. A
gear pump, manufactured by Micro-Pump ®, is installed in the loop to drive the coolant flow

48
and to provide a variable range of mass flow rates, up to 4 LPM (liter per minute). The mass
flow rate controlled by adjusting the electrical voltage applied through a variac to the pump.
An electric pre-heater, which provides different inlet subcooling levels to the test section, is
installed upstream of the test section. The pre-heater consists of three copper tubes 1.8 meters
in length and 9.525 mm in outer diameter and assembled in a serpentine shape. The outside of
the tubes is wrapped with twelve electrical heating stripes with variable powers. Ten of these
twelve stripes are controlled by 4 switches and provide constant power, while the othe two
provide a different power level controlled by a 115 Volt variac. The rectangle test section is
heated by electric power from the bottom side. The test section has three quartz windows
installed on the remaining sides, which enable direct observations of the flow boiling process.
One cooling sub-loop is installed immediately downstream of the test section. It cools the
refrigerant exiting from the test section, which is especially important for a flow boiling
experiment to maintain a constant system pressure. Another cooling sub-loop is installed
immediately upstream of the gear pump and downstream of the liquid reservoir, which
ensures there is no refrigerant vapor entering the pump. The working fluid for these two
cooling sub-loops is R-12, which is then cooled in two commercial water chillers.
3.1.2 Test section
An exploded view of the test section assembly is shown in Figure 3.2. The
rectangular copper heating block, 12.7 mm by 107.95 mm (width by length), is installed in the
middle of a straight horizontal rectangular stainless steel flow channel. The dimensions of the
flow channel are 1 m by 12.7 mm by 12.7 mm (length by width by height). The entrance
length, which is measured from the entrance of the straight flow channel to the leading edge
of the test section heating surface, is 490 mm. The ratio of entrance length to the flow channel
hydraulic diameter is calculated as 38.58. This is much larger than the recommended entrance
length ratio values of ~19 to ~24, calculated from experimental conditions investigated, such
as system pressures ranging from 400 kPa to 800 kPa and liquid velocities ranging from

49
0.1m/s to 0.3m/s. The value of the required entrance length to hydraulic diameter ratio is
evaluated by (Sanchayan and Pijush 2005, 425) as,
( ) 6/1Re4.4≈h
e
D
L (3-1)
The test section is heated by seven cartridge heaters, which provide a maximum total
power of 750×7=5050W. These seven heaters are divided into three groups with a 2/3/2
pattern, each of which can be turned on and off independently. The electric power level is
controlled by an auto-transformer and measured by voltmeter and ammeter instruments in the
power circuit. Each of these seven cartridge heaters contains one continuous 76.2 mm long
heated section. All heaters have an INCOLOY sheath to enhance the heat conduction from
heaters to copper base block. To obtain a uniform heat flux and temperature profile close to
the heating surface, it’s recommended to turn on either all of these 7 cartridge heaters or the
center 3 ones. A numerical study by using FLUENT® shows that with the center 3 cartridge
heaters turned on, a nearly identical temperature profile can be obtained compared to the 7
cartridge heaters turned on condition.
During the experiments, the critical heat flux condition can be achieved. The film
boiling phenomenon normally takes place at the post-CHF stage, which gives a much smaller
heat transfer coefficient compared to nucleate boiling heat transfer. To avoid an accident
scenario with burn-out or components damage, the electric power applied on the heating
block has to be shut off promptly. The maximum temperature the INCOLOY sheath can with
stand is approximately 800ºC, while the silicone rubber O-ring which seals the gap between
the flow channel and the heating block can only sustain temperatures lower than 250 ºC. To
assure there is no accidental scenario, a transient heat transfer simulation was carried out with
FLUENT® to calculate the temperature profile inside the copper base block and heating block
at the post-CHF stage. Conservative boundary conditions were assigned, i.e., the heat transfer
coefficient from the heating block to fluid side drops to zero, and heat can only be removed
by natural convection and radiation heat transfer at surfaces exposed to air. 100 seconds of
post CHF transient heat transfer simulation has been done with FLUENT® to predict the

50
temperature profiles in the heating blocks. The simulation obtained a maximum critical heat
flux in 800kPa pressure, of around 6.0×10⁵W/m2. The temperature profile is shown in Figure
3.3. The simulation results show that, at 100 seconds after CHF occurs, the temperature at the
O-ring is around 169 ºC, and the maximum temperature on the INCOLOY sheath is around
196 ºC. This simulation result ensures that when CHF occurs, there will be enough time to
turn off the heaters.
Two heating blocks with copper and stainless steel heating surfaces were employed
separately to study subcooled flow boiling performance for materials with different thermal
properties. Copper was selected as the base material for both the heating block and the base
block to reduce the overall temperature magnitude in the blocks due to its very high thermal
conductivity, ~400W/m·K. The heating block with a copper heating surface was machined
from a pure copper block. To make a heating block with stainless steel heating surface, a 1
mm thick stainless steel strip was attached onto the copper block using silver solder. The
stainless steel layer thickness was selected so as not to significantly increase the overall
temperature magnitude due to its fairly poor thermal conductivity, ~15W/m·K. However, the
stainless steel layer has to be thick enough to represent the material’s boiling heat transfer
characteristics, or more specifically, the local temperature disturbance caused by bubble
wouldn’t penetrate to the copper base material.
To measure the heating surface wall temperature and heat flux, eight type-K
thermocouples were installed in the copper heating block. The heat flux can be calculated
from the temperature gradient in the copper heating block, and the wall temperature can be
calculated from the temperatures measured at the thermocouples located very close to the
heater wall, with a distance correction applied. The detailed test section dimensions and
locations of thermocouples are shown in Figure 3.4.

51
3.2 INSTRUMENTATION AND MEASUREMENTS
The signals recorded during the flow boiling heat transfer experiment include directly
measured quantities, such as temperature, pressure, mass flow rate, electric voltage and
current, etc. Quantities calculated from the directly measured quantities, such as power and
heat flux are also recorded. An array of instruments, such as thermocouples and pressure
transducers, is employed to measure these quantities. A data acquisition system for
temperature, pressure and mass flow rate signals includes an HP 75000 serial B data
acquisition equipment and a PC. In addition, a high-speed digital camera was used to observe
the small scale bubble dynamics, which were recorded in a second PC.
Types K and T thermocouples are used for temperature measurements. All
thermocouples are calibrated using an ice bath reference and are considered valid from 5 ºC to
100 ºC with an uncertainly of ±0.1 ºC. The working fluid inlet and outlet temperatures are
directly measured with thermocouples inserted in the flow channel. Eight thermocouples were
installed in the heater block, so that the heat flux then can be calculated from the temperature
gradient inside the heating block. The uncertainty for heat flux measurements is estimated to
be ±3%, given the maximum temperature measurement error of 0.75%. The heating surface
wall temperature can be calculated from temperatures measured at locations immediately
beneath the surface by compensating the temperature difference due to the distance from the
wall surface to the thermocouples. The saturation temperature is calculated from the measured
system pressure. The bulk temperature, Tb, is an average value of inlet and outlet temperatures.
Two BEC strain-gage type pressure transducers are installed before the pre-heater
inlet and the test section inlet. Both transducers are calibrated using a dead weight tester with
an uncertainly of ±900Pa with a range of 0-300psi (0-2100kPa).
The liquid mass flow rate is measured by a model D12 mass flow meter (inertial flow
meter or Coriolis flow meter) manufactured by Micro-Motion. A pair of U-shaped tubes in
the flow meter vibrates as fluid flows by, and a current which depends on the frequency of
vibration is delivered to the data acquisition system.

52
A Photron FASTCAM Ultima 1024 high-speed digital camera is used to record the
boiling phenomena in the test section. The camera can acquire images at a rate up to 12000
frames per second (fps) using an intensive back-lit source, with various magnifications
controlled by a set of micro lenses, shown in table 3.2. The images and videos were stored in
a computer in digital format through an IEEE 1394 fire wire connection. The resolutions of
the camera range from 2.60 µm/pixel to 16.73 µm/pixel, depending on the lenses
magnification selected. In order to achieve the highest possible resolution and best fidelity,
the camera is mounted on a 65mm XYZ linear stage and the focal length of the lens is fixed at
a constant value, which is about 5 cm. The XYZ linear stage provides a smooth and stable
camera positioning function with travel distance of 30/30/45(X/Y/Z) mm, and sensitivity of
0.1 mm. The camera is calibrated by comparing the size of an object in the image and its real
size which is measured with a micrometer. The uncertainly of the image is estimated to be 1
pixel and therefore the error depends on the image size and the lens magnification selected.

53
Figure 3.1 Schematic diagram of the flow boiling test apparatus
Cooling sub-loop
Cooling sub-loop

54
A – Cartridge heaters
B – Copper base block
C – Heating block
D – Stainless steel flow channel
E – Rear quartz window
F – Front quartz window
G – Top quartz window
H – Rear stainless steel window mounting
I – Front stainless steel window mounting
J – Top stainless steel window mounting
Figure 3.2. An exploded view of the test section assembly
A
B
C
D
E
F
G
H
I
J
55
Figure 3.3. Temperature profile on heating block walls at 100 seconds after critical heat flux
occurring with power on.
O-ring

56
(# n
umbe
ring
of
ther
moc
oupl
es)
(a
) Pu
re c
oppe
r te
st s
ectio
n
(b
) C
oppe
r te
st s
ecti
on c
oate
d w
ith s
tain
less
ste
el la
yer
Figu
re 3
.4.
Sche
mat
ic d
raw
ings
of
test
sec
tions
and
loca
tions
of
ther
moc
oupl
es.

57
Tab
le 3
.1. P
hysi
cal a
nd th
erm
al p
rope
rtie
s of
R13
4a a
t dif
fere
nt p
ress
ures
.
P (
MPa
) T
sat (
K)
Tsa
t (ºC
) ρ
l (kg
/m3)
ρ
v (kg
/m3)
k l
(W
/m·K
) C
p,l (
J/kg
·K)
hfg (
J/kg
) σ (
N/m
)
0.20
26
3.07
-1
0.08
13
27.4
0 10
.012
9.
653E
-02
1315
.4
206.
02
1.30
3E-0
2 0.
25
268.
87
-4.2
8 13
08.8
0 12
.394
9.
392E
-02
1329
.7
201.
81
1.21
8E-0
2 0.
30
273.
82
0.67
12
92.6
0 14
.770
9.
172E
-02
1342
.9
198.
10
1.14
6E-0
2 0.
35
278.
18
5.03
12
78.0
0 17
.147
8.
979E
-02
1355
.2
194.
72
1.08
4E-0
2 0.
40
282.
08
8.93
12
64.7
0 19
.529
8.
808E
-02
1367
19
1.61
1.
029E
-02
0.45
28
5.63
12
.48
1252
.30
21.9
18
8.65
4E-0
2 13
78.4
18
8.70
9.
791E
-03
0.50
28
8.88
15
.73
1240
.80
24.3
17
8.51
3E-0
2 13
89.4
18
5.97
9.
340E
-03
0.55
29
1.90
18
.75
1229
.90
26.7
29
8.38
2E-0
2 14
00.2
18
3.37
8.
925E
-03
0.60
29
4.72
21
.57
1219
.50
29.1
55
8.26
1E-0
2 14
10.9
18
0.89
8.
542E
-03
0.65
29
7.37
24
.22
1209
.70
31.5
96
8.14
7E-0
2 14
21.4
17
8.51
8.
186E
-03
0.70
29
9.86
26
.71
1200
.20
34.0
54
8.04
0E-0
2 14
31.8
17
6.21
7.
852E
-03
0.75
30
2.23
29
.08
1191
.10
36.5
30
7.93
9E-0
2 14
42.3
17
3.98
7.
539E
-03
0.80
30
4.48
31
.33
1182
.20
39.0
25
7.84
2E-0
2 14
52.7
17
1.81
7.
243E
-03
0.85
30
6.62
33
.47
1173
.70
41.5
41
7.75
1E-0
2 14
63.1
16
9.71
6.
963E
-03
0.90
30
8.68
35
.53
1165
.40
44.0
78
7.66
3E-0
2 14
73.6
16
7.65
6.
698E
-03
0.95
31
0.65
37
.50
1157
.20
46.6
38
7.57
9E-0
2 14
84.2
16
5.63
6.
445E
-03
1.00
31
2.54
39
.39
1149
.30
49.2
22
7.49
8E-0
2 14
94.8
16
3.66
6.
204E
-03
1.05
31
4.36
41
.21
1141
.60
51.8
31
7.42
0E-0
2 15
05.6
16
1.73
5.
974E
-03
1.10
31
6.12
42
.97
1134
.00
54.4
65
7.34
5E-0
2 15
16.5
15
9.82
5.
754E
-03
1.15
31
7.82
44
.67
1126
.50
57.1
26
7.27
2E-0
2 15
27.6
15
7.95
5.
543E
-03
1.20
31
9.46
46
.31
1119
.20
59.8
15
7.20
1E-0
2 15
38.8
15
6.09
5.
340E
-03

58
Table 3.2 Camera magnifications and corresponding length/pixel ratios
Magnification Index µm/pixel pixel/mm
3 16.73 59.76
4 12.93 77.33
5 10.34 96.67
6 8.62 116.00
7 7.29 137.09
0.58 4.52 221.46
1 2.60 384.91

59
CHAPTER 4
EXPERIMENTAL RESULTS
To understand subcooled flow boiling heat transfer, experimental work has been
pursued in this study and the experimental results obtained are presented in this chapter. The
experimental results include three major parts, subcooled flow boiling performance from a
macroscopic point of view, nucleation site density and bubble dynamics from a microscopic
point of view. Flow boiling heat flux and heat transfer coefficients have been experimentally
measured on both copper and stainless steel surfaces under different experimental conditions,
such as pressure, flow rate and inlet subcooling. In terms of heat flux and heat transfer
coefficient, significant differences are found between copper and stainless steel heating
surfaces. To explain the different flow boiling performances on these two heating surfaces, a
high-speed digital camera was utilized. Nucleation site densities and bubble dynamics have
been visually observed and measured under different experimental conditions. These two
quantities are believed to be key parameters in determining flow boiling heat flux.
4.1 NUCLEATION SITE DENSITY AND DISTRIBUTION
4.1.1 Nucleation site density
The importance of active nucleation site density was realized in early stages of
boiling heat transfer study. Both analytical and experimental work has been done to
understand the nucleation site activation criteria, nucleation site density and its distribution.
Some early analytical work on nucleation site activation was provided by Bankoff (Bankoff
1958), Griffith (Griffith and Wallis 1960) and Hsu (Hsu 1962). Salt deposition (Gaertner and
Westwater 1963), gas bubble nucleation (Eddington and Kenning 1978), direct visualization
(Wang and Dhir 1993a) and liquid crystal thermography (Hardenberg et al. 2004) have been
used to measure the nucleation site densities in pool boiling. In general, it’s more difficult to

60
measure this in flow boiling. Firstly, at low to moderate wall heat fluxes, bubbles tend to slide
on the heating surface before lifting-off. By counting number of bubbles from still boiling
images does not provide accurate nucleation site densities. Experimental evidence shows
there are normally several sliding bubbles released from a same nucleation site, so the
nucleation site density can be greatly overestimated by counting bubble numbers. Secondly,
at relatively higher heat fluxes, intense bubble coalescence takes place such that adjacent
bubbles tend to merge into big bubbles or vapor patches. The vapor volume fraction in the
bulk flow is also significantly larger compared to lower heat flux conditions. When using
direct visualization techniques, both effects lead to undesired light reflection and therefore
blurred images. A multiple image ensemble method was used by Zeng and Klausner (Zeng
and Klausner 1993) to count nucleation site density from digital images taken from a side
view. This, however, creates more uncertainty as bubbles at different depths of field collapse
together on the image.
In flow boiling with R134a, vapor bubbles have very short lifespan, in the magnitude
of milliseconds. They are also very small, in the magnitude of tens of microns. To accurately
measure the quantities of interest, such as bubble size and growth rate, advanced technology
is required. A Photron FASTCAM Ultima 1024 high-speed digital camera with high
magnification was used in this study to record high frequency boiling images. To acquire
more accurate nucleation site density measurements, a normal view of the heating surface is
preferred rather than a side view, in which bubbles at different depths of field produce
overlapping images and are difficult to be distinguished from each other. However, the
disadvantage of a normal view is that a back-lighting source cannot be applied and therefore
the image quality is not as good as a side view in terms of brightness and contrast. To obtain
bubble images in a view normal to the heating surface, a quartz window was installed on the
top side of the flow channel and the high-speed digital camera was mounted above the test
section. Two light sources were provided from above the test section through the same quartz
window where bubble images were taken. Bubble images on the heating surface were
recorded at high frequencies, 1000/2000 fps, for time periods of several seconds. Normally,

61
for each experimental condition, a set of several thousands of images were obtained for data
analysis. Recorded image sets can be loaded into a computer program implemented by Visual
C++ ® to be displayed frame by frame, either automatically or manually. Every single active
nucleation site can be manually identified and their coordinates recorded. Measurement errors
mainly come from nucleation sites not always being activated. Due to random characteristics
of boiling, not all nucleation sites are constantly activated. It’s been observed that some sites
can be randomly activated or deactivated. At high heat fluxes the error is estimated to be
relatively large since nucleation sites are more crowded and this activation/deactivation
process occurs more frequently. The measurement error was estimated to be approximately
10% by counting the sites that are not constantly activated. Figure 4.1 shows a typical bubbles
image obtained for R134a in flow boiling on the copper surface. Locations of active
nucleation sites are listed in Table 4.1 and shown in Figure 4.2.

62
Figure 4.1. A typical bubble image from a set of bubble images at high camera frame speed to
identify active nucleation sites locations. Experimental conditions: 606kPa, ∆Tw=9.23ºC.
Image taken conditions: magnification index 3, 1000 fps, 1/2000 second of shutter time.
Other information: 256 by 256 pixels of image size, frame number, 13616, real time, 13.616
seconds.
Figure 4.2. Nucleation sites (green squares) identified from bubble images shown in Figure
4.1.
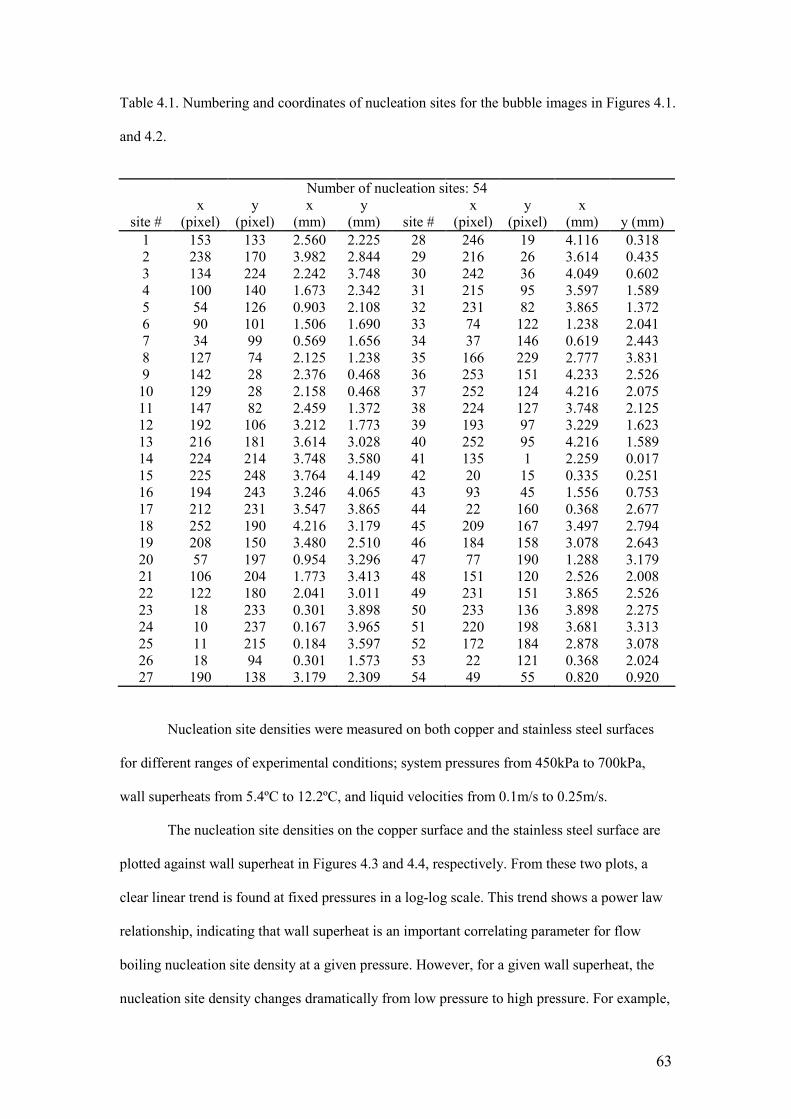
63
Table 4.1. Numbering and coordinates of nucleation sites for the bubble images in Figures 4.1.
and 4.2.
Number of nucleation sites: 54
site # x
(pixel) y
(pixel) x
(mm) y
(mm) site # x
(pixel) y
(pixel) x
(mm) y (mm) 1 153 133 2.560 2.225 28 246 19 4.116 0.318 2 238 170 3.982 2.844 29 216 26 3.614 0.435 3 134 224 2.242 3.748 30 242 36 4.049 0.602 4 100 140 1.673 2.342 31 215 95 3.597 1.589 5 54 126 0.903 2.108 32 231 82 3.865 1.372 6 90 101 1.506 1.690 33 74 122 1.238 2.041 7 34 99 0.569 1.656 34 37 146 0.619 2.443 8 127 74 2.125 1.238 35 166 229 2.777 3.831 9 142 28 2.376 0.468 36 253 151 4.233 2.526 10 129 28 2.158 0.468 37 252 124 4.216 2.075 11 147 82 2.459 1.372 38 224 127 3.748 2.125 12 192 106 3.212 1.773 39 193 97 3.229 1.623 13 216 181 3.614 3.028 40 252 95 4.216 1.589 14 224 214 3.748 3.580 41 135 1 2.259 0.017 15 225 248 3.764 4.149 42 20 15 0.335 0.251 16 194 243 3.246 4.065 43 93 45 1.556 0.753 17 212 231 3.547 3.865 44 22 160 0.368 2.677 18 252 190 4.216 3.179 45 209 167 3.497 2.794 19 208 150 3.480 2.510 46 184 158 3.078 2.643 20 57 197 0.954 3.296 47 77 190 1.288 3.179 21 106 204 1.773 3.413 48 151 120 2.526 2.008 22 122 180 2.041 3.011 49 231 151 3.865 2.526 23 18 233 0.301 3.898 50 233 136 3.898 2.275 24 10 237 0.167 3.965 51 220 198 3.681 3.313 25 11 215 0.184 3.597 52 172 184 2.878 3.078 26 18 94 0.301 1.573 53 22 121 0.368 2.024 27 190 138 3.179 2.309 54 49 55 0.820 0.920
Nucleation site densities were measured on both copper and stainless steel surfaces
for different ranges of experimental conditions; system pressures from 450kPa to 700kPa,
wall superheats from 5.4ºC to 12.2ºC, and liquid velocities from 0.1m/s to 0.25m/s.
The nucleation site densities on the copper surface and the stainless steel surface are
plotted against wall superheat in Figures 4.3 and 4.4, respectively. From these two plots, a
clear linear trend is found at fixed pressures in a log-log scale. This trend shows a power law
relationship, indicating that wall superheat is an important correlating parameter for flow
boiling nucleation site density at a given pressure. However, for a given wall superheat, the
nucleation site density changes dramatically from low pressure to high pressure. For example,

64
for wall superheat of 8.8ºC on the copper heating surface, the nucleation site density is
6.65×10⁶ sites/m2 at pressure of 700kPa, which is more than ten times larger than that at
500kPa, 5.45×10⁵ sites/m2. Experimental results suggest that, although wall superheat is an
important correlating parameter, by itself it is insufficient to correlate the nucleation site
density. To account for the pressure’s effect, a new parameter needs to be introduced. As
suggested by Griffith and Wallis (Griffith and Wallis 1960), the critical cavity diameter, Dc,
Wfgg
sat
cTh
TD
∆=
ρσ4
(4-1)
can be used as a criterion for bubbles initiation. Griffith’s study suggested that at a certain
wall superheat, cavities with mouth sizes smaller than the critical cavity size, given by
equation (4-1), cannot be activated. The critical cavity diameter, Dc, was later used by
different researchers (Mikic and Rohsenow 1969, Bier et al. 1978, Cornwell and Brown 1978,
Wang and Dhir 1993a, etc.) to correlate with active nucleation site density. For the current
study, nucleation site densities for both copper and stainless surfaces are plotted in Figures
4.5 and 4.6, respectively, as a function of critical cavity diameter. Both Figures 4.5 and 4.6
show that, in log-log plots all nucleation site density data are approximately collapsed to a
single straight line for given heating surfaces. For the copper heating surface, the measured
nucleation site density data were correlated as,
7975.533103558.4 −−×= ca DN (4-2)
with most of the data within a ±25% deviation. For the stainless steel heating surface, the
measured nucleation site density data were correlated as,
3703.423102634.5 −−×= ca DN (4-3)
with most of the data within a ±50% deviation. However, a trend can be found in both Figures
4.5 and 4.6 that, for a given Dc nucleation site densities were lower for higher pressures,
which is clearer for the stainless steel surface. This trend indicates that the critical cavity size
is still not the single parameter which ultimately correlates with the nucleation site density.
Wang and Dhir (Wang and Dhir 1993a) concluded from their research that surface wettability

65
played an important role in activation nucleation sites. In their study, water pool boiling
experiments were carried out at atmospheric pressure and the wettability changed due to
different surface oxidation levels. The active nucleation site density was correlated with
critical cavity size and contact angle. Wang and Dhir had experimentally found that for given
conditions, surfaces with lower wettability, and therefore larger contact angle, tended to have
more nucleation sites. For R134a used in the current study, surface tension is smaller at higher
pressure, which normally gives a larger contact angle (Wu et al. 2007). If Wang and Dhir’s
theory is true, the nucleation site density should be higher at higher pressures since it has a
lower wettability. Experimental results obtained in the current study, however, contradict with
Wang and Dhir’s findings. The contradiction indicates that the Wang and Dhir theory of
surface wettability may not be applied to scenarios where pressure, instead of surface
conditions, is the root cause of wettability changes.
Based on Griffith’s theory, Hsu (Hsu 1962) proposed that nucleation sites could only
be effective in a certain sizes range. The maximum and minimum effective cavity sizes are
two roots of the quadratic equation, given in (2-3). The range of effective cavity sizes can be
estimated as the difference between the maximum and minimum effective cavity sizes,
2
3
2
3
1min,max, 1
2
−
∆+∆
∆−−=−
δδδ CD
TT
TCD
CDD c
wsub
subc
cc (4-4)
in which, C1 and C3 are constants. Dc, ∆Tsub, ∆Tw and δ are critical cavity diameter, bulk
subcooling, wall superheat and thickness of liquid thermal layer, respectively. For a given Dc,
the corresponding wall superheat at low pressure is higher from equation (2-2). Also, if ∆Tsub,
and δ are given the same, there’s a wider range of effective cavity sizes at lower pressures
than that at higher pressures from equation (4-4). This explains the observed results that at a
given Dc, the nucleation site density is higher at lower pressures.
Nucleation site densities for both copper and stainless steel surfaces are plotted
against the wall heat flux in Figures 4.7 and 4.8, respectively. These figures show that the
66
relationship between nucleation site density and wall heat flux can also be approximated by a
power law function. For the copper surface, an approximate correlation is obtained as,
( ) 8193.27 "108031.2 qN a
−×= (4-5)
or,
3547.093.210" aNq = (4-6)
with most of the data within an approximate ±25% deviation. For the stainless steel surface,
the measured nucleation site density data can be correlated with wall heat flux as,
( ) 2863.39 "107231.2 qN a
−×= (4-7)
or
3043.092.403" aNq = (4-8)
with most of the data within an approximate ±50% deviation. A similar relationship between
wall heat flux and nucleation site density was also obtained by Gaertner and Westwater
(Gaertner and Westwater 1963), Wang and Dhir (Wang and Dhir 1993a), where the heat flux
was found to be approximately proportional to the square root of the nucleation site density.
Heating surface materials used in the current study include copper and stainless steel,
which have sharply different thermal conductivities and thermal diffusivities. For example, at
100ºC, the thermal conductivities of copper and stainless steel are 400 and 16.2 W/m·K,
respectively, and the thermal diffusivities are 1.16×10⁻⁴and 4.05×10⁻⁶m2/s, respectively. To
examine the nucleation site density on heating surfaces with different thermal diffusivity, the
measured data for both copper and stainless steel heating surfaces are plotted against critical
cavity size and wall heat flux in Figures 4.9 and 4.10, respectively. As discussed above,
nucleation site density can be correlated with critical cavity size with a power function.
However, in Figure 4.9, nucleation site density data of these two materials do not merge into a
single line, and the copper surface has a lower nucleation site density for the same critical
cavity size (or the same wall superheat if pressure is fixed). It can also be observed that the
curve for copper has a slope larger than for stainless steel. Eventually, at a smaller critical

67
cavity size (or high wall superheat), the copper heating surface will have a higher nucleation
site density. This trend agrees with boiling performance measurements that, at higher wall
superheat, the wall heat flux is higher for the copper surface. (Details of flow boiling
performance on both surfaces will be discussed in later sections). However, due to
experimental limitations on direct observation, the nucleation site density data at higher wall
superheat are not available. Figure 4.10 shows nucleation site density data on both copper and
stainless steel heating surfaces against the wall heat flux. The stainless steel surface shows a
slightly higher nucleation site density at relatively higher heat flux. Nevertheless, most of the
measured data from these two heating surfaces collapse onto a single line. This is so far the
best correlating parameter for comparing wall superheat and critical cavity diameter, with
nucleation site density data. As shown in Figure 4.10, nucleation site density data can be
correlated with wall heat flux as,
( ) 1767.39 "107137.7 qN a
−×= (4-9)
or,
3148.094.357" aNq = (4-10)
with most of the data located within a ±60% deviation. The result indicates that boiling heat
transfer capability is mainly determined by fluid properties. To transport a certain amount of
energy, a certain number of bubbles have to be generated. However, this conclusion may only
stand for materials on which a fluid shows similar wettability, such as the combination of
R134a on copper or stainless steel surfaces. The contact angles of R134a on copper and
stainless steel surfaces show almost identical behavior. This has been experimentally
observed and will be discussed in later sections. Experimental evidence (Phan et al. 2009a
and 2009b) shows that on heating surfaces with greatly different surface wettabilities, the
bubble dynamics and boiling behaviors also have significantly different characteristics. On a
hydrophobic surface, bubbles tend to initiate at a relatively lower wall superheat. Also due to
poor liquid wettability, bubbles tend not to detach from the heating surface while they
coalesce with adjacent bubbles. On the contrary, on a hydrophilic surface, bubbles tend to

68
form into a spherical shape with relatively larger radii and lower departure frequencies. Wang
and Dhir’s study (Wang and Dhir 1993a) shows that, on heating surfaces made of the same
material but with different wettability, the surface with higher wettability has a lower
nucleation site density.
In this study, experimental results show that the nucleation site density can be
correlated with wall superheat in a power law relation for a given pressure on a specific
heating surface material, and the nucleation site density is higher for a higher pressure. To
eliminate the pressure effect, the critical cavity diameter and the wall heat flux are used to
correlate with the nucleation site density as suggested by Griffith. Nucleation site density
data obtained at different pressures correlates well with critical cavity size or wall heat flux
with power law relations. Compared to the critical cavity diameter, the wall heat flux shows
better correlation behavior with nucleation site density on both heating surfaces. However, it
has to be noticed that, the good correlation between nucleation site density and wall heat flux
may only hold for materials which have similar surface wettabilities, such as the combination
of R134a and a copper or stainless steel surfaces.

69
1 10 100
104
105
106
107
108
450 kPa
500 kPa
600 kPa
700 kPaNucleation Sites Number Density (sites/m
2)
∆∆∆∆TW (oC)
Figure 4.3. Nucleation site density against wall superheat for copper heating surface at
different system pressures.
1 10 100
104
105
106
107
108
450 kPa
500 kPa
550 kPa
600 kPa
700 kPa
Nucleation Sites Number Density (sites/m
2)
∆∆∆∆TW (oC)
Figure 4.4. Nucleation site density against wall superheat for the stainless steel heating
surface at different system pressures.

70
10-7
2x10⁻⁷
3x10⁻⁷
4x10⁻⁷
5x10⁻⁷
104
105
106
107
108
450 kPa
500 kPa
600 kPa
700 kPa
Nucleation Sites Number Density (sites/m
2)
Dc (m)
Figure 4.5. Nucleation site density against critical cavity diameter for the copper heating
surface at different system pressures.
10-7
3x10⁻⁷
5x10⁻⁷
7x10⁻⁷
9x10⁻⁷
104
105
106
107
108
109
Dc (m)
450 kPa
500 kPa
550 kPa
600 kPa
700 kPa
Nucleation Sites Number Density (sites/m
2)
Figure 4.6. Nucleation site density against critical cavity diameter for the stainless steel
heating surface at different system pressures.

71
2x10⁴
4x10⁴
6x10⁴
8x10⁴
105
104
105
106
107
108
450 kPa
500 kPa
600 kPa
700 kPaNucleation Sites Number Density (sites/m
2)
q"
Figure 4.7. Nucleation site density against wall heat flux for the copper heating surface at
different system pressures.
2x10⁴
4x10⁴
6x10⁴
8x10⁴
105
104
105
106
107
108
450 kPa
500 kPa
550 kPa
600 kPa
700 kPa
Nucleation Sites Number Density (sites/m
2)
q"
Figure 4.8. Nucleation site density against wall heat flux for stainless steel heating surface at
different system pressures.

72
10-7
3x10⁻⁷
5x10⁻⁷
7x10⁻⁷
9x10⁻⁷
104
105
106
107
108
Dc (m)
Copper Heating Surface
SS Heating Surface
Nucleation Sites Number Density (sites/m
2)
Figure 4.9. Nucleation site density against critical cavity diameter for both copper and
stainless steel heating surfaces.
2x10⁴
4x10⁴
6x10⁴
8x10⁴
105
104
105
106
107
108
Copper Heating Surface
SS Heating Surface
Nucleation Sites Number Density (sites/m
2)
q" (W/m2)
Figure 4.10. Nucleation site density against wall heat flux for both copper and stainless steel
heating surfaces.

73
4.1.2 Nucleation site distribution
Early studies have shown that the nucleation site activation is mainly controlled by
local wall superheat and surface characteristics, such as cavity size, shape and angle. Both
heating surfaces used in the current study were polished with the same sandpaper (#600) and
were then naturally oxidized by long time air exposure. It’s expected that the cavities follow a
spatial random distribution, and therefore the active nucleation sites follow a similar
distribution. Nucleation site distribution data were obtained for both copper and stainless steel
heating surfaces at different system pressures and wall superheat levels. The size of the
observable domain, which was recorded by the high-speed digital camera, is in an area
magnitude of several millimeters by several millimeters, depending on the camera
magnification used. Normally the number of nucleation sites in such an observable domain is
in the range of tens to hundred, depending on the wall superheat level. Figures 4.1 to 4.2 in
the previous section have shown typical nucleation site distributions on the copper heating
surface. Direct observation suggests that nucleation site distributions are fairly random and
uniform. To statistically examine the nucleation site distribution, the domain is divided into
identical sub-domains. Numbers of nucleation sites are counted in each of these sub-domains,
schematically shown in Figure 4.11. The statistical probability density can be calculated as a
fractional ratio of number of sub-domains having Na nucleation sites to the total number of
sub-domains,
( ) ( )totalN
NaNNaP = (4-11)
where, N(Na) is the number of sub-domains having Na nucleation sites, and Ntotal is the total
number of sub-domains. In this study, to estimate the sites distribution, the observable domain
is divided into 4×4 and 8×8 sub-domains. The estimated discrete probability densities are also
compared with the discrete spatial Poisson distribution, defined as,
( ) ( )( )!Na
aNeNaP
NaaN−
= (4-12)

74
where, aN is the average number of nucleation sites in a sub-domain. Figures 4.12 to 4.19
show typical distributions of nucleation sites on both copper and stainless steel surfaces, their
corresponding discrete probability densities, and comparisons with the spatial Poisson
distribution. The comparisons show that the calculated nucleation site distribution probability
densities agree pretty well with the spatial Poisson distribution. However, there is a general
trend that the calculated probability density for Na close to its average value, aN , and is
higher than that given by the spatial Poisson distribution. For example, as shown in Figure
4.13 for the copper heating surface with 10.94 ºC wall superheat at 500kPa, the average
number of nucleation sites in a sub-domain are 4.8 and 1.2 for 4×4 and 8×8 patterns,
respectively. The calculated probabilities from experimental data (Na=1 for 4×4 sub-domains,
and Na=5 for 8×8 sub-domains) are both significantly larger than values given by the spatial
Poisson distribution. This trend is observed for almost all conditions explored in the
experiments. It indicates that the real nucleation site distribution observed during a flow
boiling process is more uniform than the spatial Poisson distribution. To reveal more details
of the distribution of nucleation sites, the distribution of the distance between two nearest
adjacent nucleation sites, sometimes referred as ‘nearest-neighbor distance’, are examined.
The distributions and their comparisons with the spatial Poisson distribution are shown in
Figures 4.20 to 4.23. The distribution of the nearest-neighbor distance from the spatial
Poisson distribution is given by,
( ) dSSeNdsSSSP SN 2
2 ππ −=+<< (4-13)
with a mean value given by,
2/1
2
1 −= NS (4-14)
The most probable nearest-neighbor distance is given by,
2/1
2
1 −= NSmpπ
(4-15)

75
From Figures 4.20 to 4.23, it can be found that the probability of the nearest-neighbor
distance being located between 0 and a certain cut-off value is much smaller than that given
by a Poisson spatial distribution. However, an opposite trend is found as the nearest-neighbor
distance is close the mean distance value given by equation (4.14). These results lead to the
same conclusion drawn previously: the real nucleation site distribution is more uniform than
the Poisson spatial distribution. The observed nucleation site distribution phenomenon
indicates there is a mechanism that nucleation sites are self-organized to cover as much
heating area as possible to obtain a maximum boiling heat transfer capability. A possible
reason for this self-organization behavior is nucleation site interactions. In general, nucleation
site interactions can be divided into two major categories; fluid-side interactions and solid-
side interactions. The fluid-side interactions include acoustic waves emitted by a growing
bubble (Chekanov 1977), sites activation/deactivation by an adjacent bubble (Judd and
Lavdas 1980), bubble coalescence (Mosdof and Shoji 2004), etc. The solid-side interaction is
mainly thermal interactions between an active site and adjacent sites inside the solid heating
surface. During a bubble growth, the local wall temperature near an active site drops
dramatically due to liquid evaporation, serving as a heat sink. Consequently, in a certain
bubble influence area, the wall temperature drops to a level which is lower than the required
value to activate a bubble. This influence area is expected to be controlled by the thermal
properties or, more specifically, the thermal diffusivity of the heating surface. If assuming a
similar bubble behavior, a material with higher thermal diffusivity tends to have a larger
influence area. The statistical behavior of the nearest-neighbor distance of both copper and
stainless steel surfaces are compared in Figure 4.24, in terms of the coefficient of variance,
which is defined as the ratio of standard deviation to the mean value. Figure 4.24 shows a
trend that the nearest-neighbor distance on the copper surface generally has a smaller
coefficient of variance, which indicates the nucleation site distribution is more uniform than
that on the stainless steel surface. It can also be found from Figure 4.24 that the coefficient of
variance tends to decrease as nucleation site density increases or, in other words, the
distribution of sites is more uniform at higher nucleation site density.

76
As a summary, the nucleation site density has been experimentally studied and
measured for both copper and stainless steel surfaces by high-speed visualization techniques
with relatively low wall superheat, due to experimental limitations. The nucleation site
density data were correlated with the wall superheat, critical cavity size and wall heat flux.
All show good correlation with nucleation site density data. However, the wall superheat is
not able to be correlated with the nucleation site density data for different system pressures.
This then leads to a new correlating parameter, critical cavity size to account for the pressure
effect. Again, the critical cavity size does not achieve success in correlating the data for both
surfaces. The wall heat flux, however, shows a good correlation with the nucleation site
density data for both surfaces. The measured nucleation site density data are also compared
with a Poisson spatial distribution. The measured data show good agreement with the Poisson
spatial distribution by counting nucleation site numbers in sub-domains. However, the
comparison of the distribution of nearest-neighbor distance indicates the real nucleation site
has a more uniform distribution than the Poisson spatial distribution. In addition, the copper
surface has a more uniform distribution than the stainless steel surface, which may be
explained by the nucleation sites thermal interactions.
Figure 4.11. A typical nucleation sites distribution on the copper surface.

77
0.00 2.14 4.28 6.43 8.57
0.00
2.14
4.280 128 256 384 512
0
128
256
Y Position (mm)
X Position (mm)
X Position (pixel)
Y Position (pixel)
Figure 4.12. Nucleation sites on the copper surface at pressure of 500 kPa and wall superheat
of 10.94 ºC.
0 1 2 3 4 5 6 7 8 9 10
0.0
0.2
0.4
0.6
0.8
P=500kPa, ∆TS=10.94
oC
4x4 Sub-domains 8x8 Sub-domains
Probability Density
Nucleation Sites Number in a Sub-domain (#)
Figure 4.13. The discrete probability density of nucleation sites distribution on a copper
surface at pressure of 500 kPa and wall superheat of 10.94 ºC, and its comparison with the
spatial Poisson distribution.
Spatial Poisson distribution
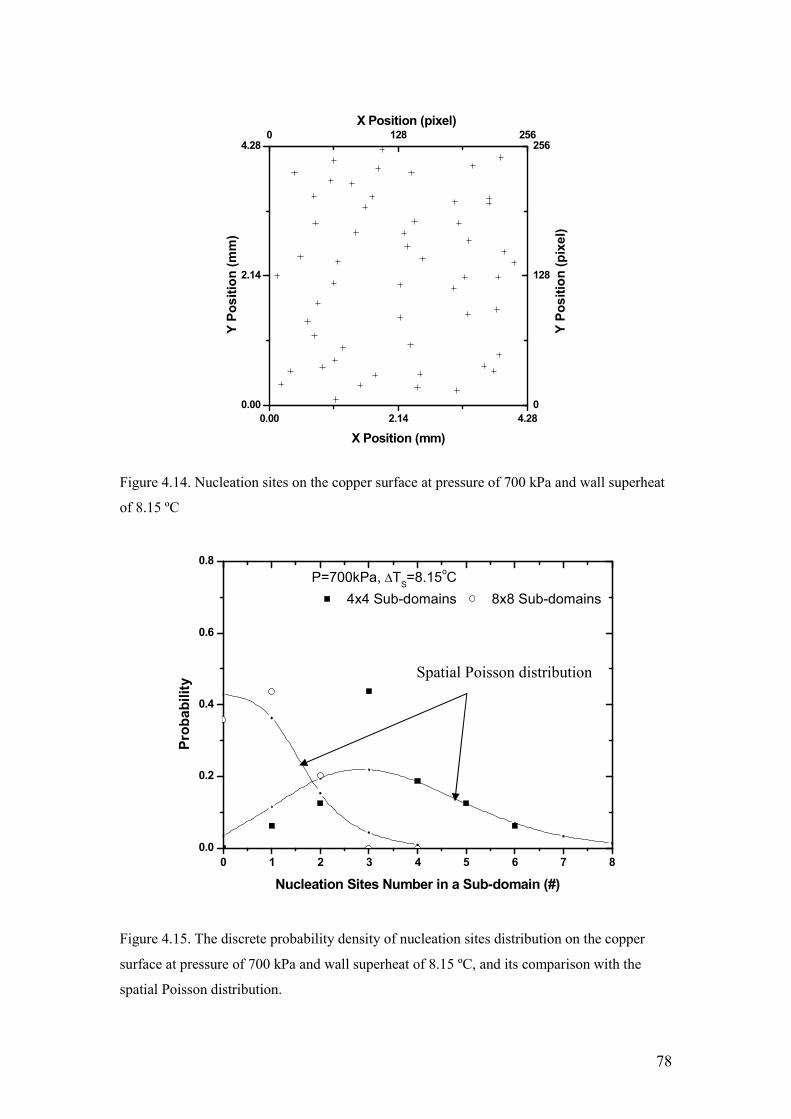
78
0.00 2.14 4.28
0.00
2.14
4.280 128 256
0
128
256
Y Position (pixel)
X Position (pixel)
Y Position (mm)
X Position (mm)
Figure 4.14. Nucleation sites on the copper surface at pressure of 700 kPa and wall superheat
of 8.15 ºC
0 1 2 3 4 5 6 7 8
0.0
0.2
0.4
0.6
0.8
P=700kPa, ∆TS=8.15
oC
4x4 Sub-domains 8x8 Sub-domains
Probability
Nucleation Sites Number in a Sub-domain (#)
Figure 4.15. The discrete probability density of nucleation sites distribution on the copper
surface at pressure of 700 kPa and wall superheat of 8.15 ºC, and its comparison with the
spatial Poisson distribution.
Spatial Poisson distribution

79
0.00 2.14 4.28 6.43 8.57
0.00
2.14
4.280 128 256 384 512
0
128
256
Y Position (pixel)
X Position (pixel)
Y Position (mm)
X Position (mm)
Figure 4.16. Nucleation sites on the stainless steel surface at pressure of 450 kPa and wall
superheat of 10.09 ºC.
0 1 2 3 4 5 6 7 8 9
0.0
0.2
0.4
0.6
0.8
P=450kPa, ∆TS=10.09
oC
4x4 Sub-domains 8x8 Sub-domains
Probability Density
Nucleation Sites Number in a Sub-domain (#)
Figure 4.17. The discrete probability density distribution of nucleation sites on the stainless
steel surface at pressure of 450 kPa and wall superheat of 10.09 ºC, and its comparison with
the spatial Poisson distribution.
Spatial Poisson distribution

80
0.00 1.32 2.65
0.00
1.32
2.650 128 256
0
128
256
X Position (pixel)
Y Position (pixel)
Y Position (mm)
X Position (mm)
Figure 4.18. Nucleation sites on the stainless steel surface at pressure of 600 kPa and wall
superheat of 9.26 ºC.
0 1 2 3 4 5 6 7 8 9
0.0
0.2
0.4
0.6
0.8
P=600kPa, ∆TS=9.26
oC
4x4 Sub-domains 8x8 Sub-domains
Probability Density
Nucleation Sites Number in a Sub-domain (#)
Figure 4.19. The discrete probability density of nucleation sites distribution on the stainless
steel surface at pressure of 600 kPa and wall superheat of 9.26 ºC, and its comparison with the
spatial Poisson distribution.
Spatial Poisson distribution

81
0 100 200 300 400 500 600 700 800 900 1000
0.00
0.05
0.10
0.15
0.20
0.25
0.30
0.35
0.40
Probability
s (µµµµm)
Figure 4.20. The probability density of nearest-neighbor nucleation sites distance and its
comparison with the spatial Poisson distribution, on the copper surface, pressure of 500 kPa
and wall superheat at 10.94 ºC.
0 100 200 300 400 500 600
0.00
0.05
0.10
0.15
0.20
0.25
0.30
Probability
s (µµµµm)
Figure 4.21. The probability density of nearest-neighbor nucleation sites distance and its
comparison with the spatial Poisson distribution, on the copper surface, pressure of 700 kPa
and wall superheat at 8.15 ºC.
Spatial Poisson distribution
Spatial Poisson distribution

82
0 100 200 300 400 500 600
0.00
0.05
0.10
0.15
0.20
0.25
0.30
0.35
0.40
Probability
s (µµµµm)
Figure 4.22. The probability density of nearest-neighbor nucleation sites distance and its
comparison with the spatial Poisson distribution, on the stainless steel surface, pressure of 450
kPa and wall superheat at 10.09 ºC.
0 100 200 300 400
0.00
0.05
0.10
0.15
0.20
0.25
Probability
s (µµµµm)
Figure 4.23. The probability density of nearest-neighbor nucleation sites distance and its
comparison with the spatial Poisson distribution, on the stainless steel surface, pressure of 600
kPa and wall superheat at 9.26 ºC.
Spatial Poisson distribution
Spatial Poisson distribution
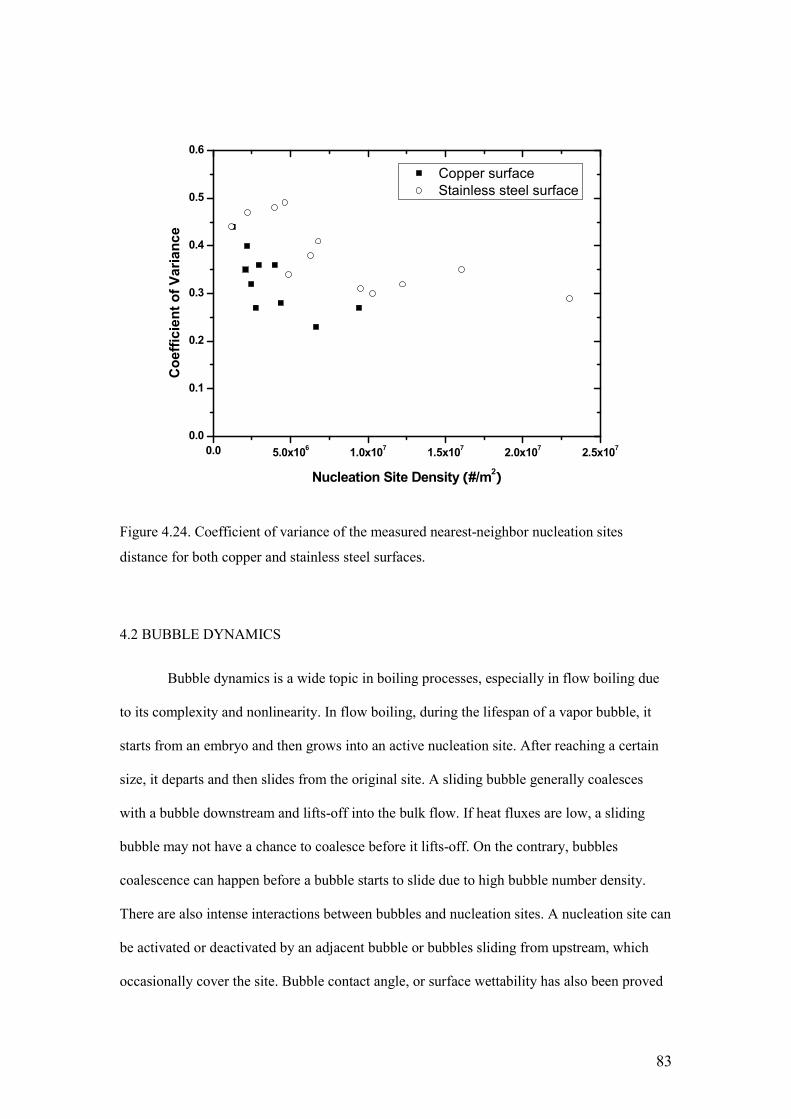
83
0.0 5.0x10⁶
1.0x10⁷
1.5x10⁷
2.0x10⁷
2.5x10⁷
0.0
0.1
0.2
0.3
0.4
0.5
0.6
Copper surface
Stainless steel surface
Coefficient of Variance
Nucleation Site Density (#/m2)
Figure 4.24. Coefficient of variance of the measured nearest-neighbor nucleation sites
distance for both copper and stainless steel surfaces.
4.2 BUBBLE DYNAMICS
Bubble dynamics is a wide topic in boiling processes, especially in flow boiling due
to its complexity and nonlinearity. In flow boiling, during the lifespan of a vapor bubble, it
starts from an embryo and then grows into an active nucleation site. After reaching a certain
size, it departs and then slides from the original site. A sliding bubble generally coalesces
with a bubble downstream and lifts-off into the bulk flow. If heat fluxes are low, a sliding
bubble may not have a chance to coalesce before it lifts-off. On the contrary, bubbles
coalescence can happen before a bubble starts to slide due to high bubble number density.
There are also intense interactions between bubbles and nucleation sites. A nucleation site can
be activated or deactivated by an adjacent bubble or bubbles sliding from upstream, which
occasionally cover the site. Bubble contact angle, or surface wettability has also been proved
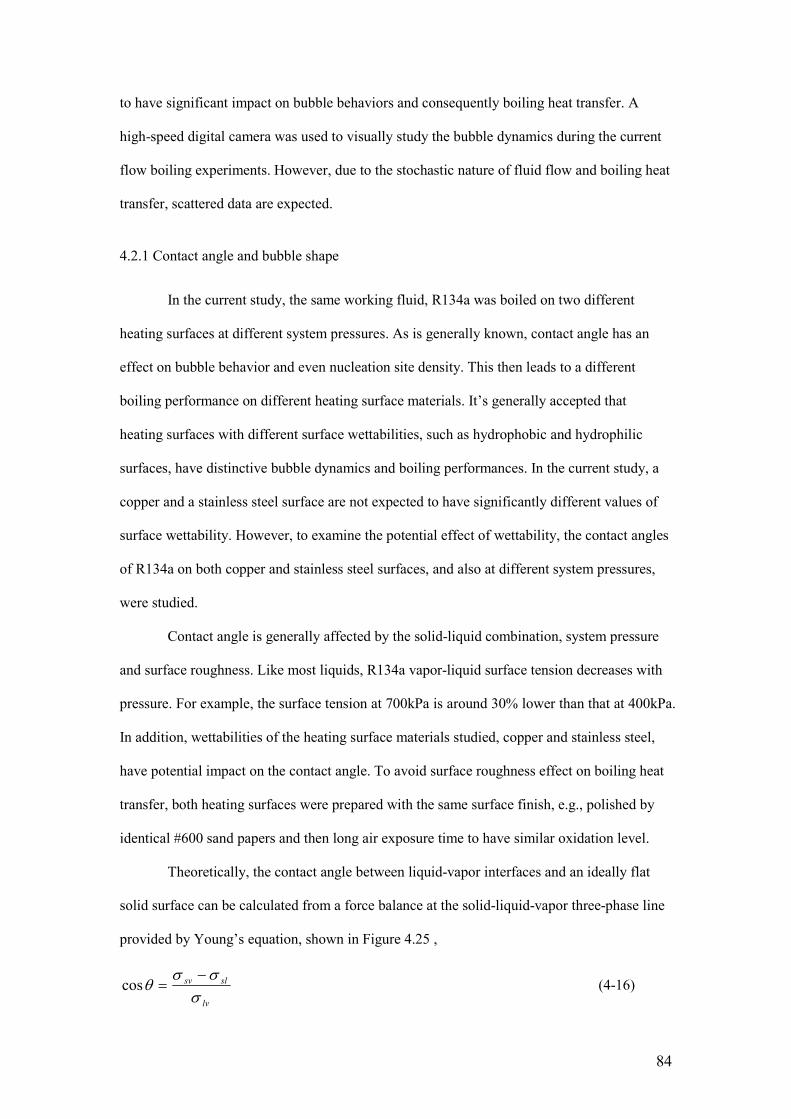
84
to have significant impact on bubble behaviors and consequently boiling heat transfer. A
high-speed digital camera was used to visually study the bubble dynamics during the current
flow boiling experiments. However, due to the stochastic nature of fluid flow and boiling heat
transfer, scattered data are expected.
4.2.1 Contact angle and bubble shape
In the current study, the same working fluid, R134a was boiled on two different
heating surfaces at different system pressures. As is generally known, contact angle has an
effect on bubble behavior and even nucleation site density. This then leads to a different
boiling performance on different heating surface materials. It’s generally accepted that
heating surfaces with different surface wettabilities, such as hydrophobic and hydrophilic
surfaces, have distinctive bubble dynamics and boiling performances. In the current study, a
copper and a stainless steel surface are not expected to have significantly different values of
surface wettability. However, to examine the potential effect of wettability, the contact angles
of R134a on both copper and stainless steel surfaces, and also at different system pressures,
were studied.
Contact angle is generally affected by the solid-liquid combination, system pressure
and surface roughness. Like most liquids, R134a vapor-liquid surface tension decreases with
pressure. For example, the surface tension at 700kPa is around 30% lower than that at 400kPa.
In addition, wettabilities of the heating surface materials studied, copper and stainless steel,
have potential impact on the contact angle. To avoid surface roughness effect on boiling heat
transfer, both heating surfaces were prepared with the same surface finish, e.g., polished by
identical #600 sand papers and then long air exposure time to have similar oxidation level.
Theoretically, the contact angle between liquid-vapor interfaces and an ideally flat
solid surface can be calculated from a force balance at the solid-liquid-vapor three-phase line
provided by Young’s equation, shown in Figure 4.25 ,
lv
slsv
σσσ
θ−
=cos (4-16)

85
in which, σsv, σsl and σlv are solid-vapor surface, solid-liquid surface, and liquid-vapor surface
tensions, respectively. Young’s equation, however, requires the knowledge of solid-vapor and
solid-liquid surface tensions, which are difficult to measure and normally unavailable. In
equation (4-16), R134a liquid-vapor surface tension data are available for different pressures.
However, without knowing the other two parameters, the prediction of the contact angle is not
achievable by using Young’s equation. Recent research (Wu et al. 2007) shows that the
contact angle – pressure relation can be made explicit and that the contact angle normally
increases with pressure, which has been experimentally proved. Another recent study
(Vadgama and Harris 2007), however, shows that the pressure has a minor effect on the
contact angle of R134a-copper surface combination. This experimental work has been done to
specifically study the pressure effect on the contact angle of R134a on both aluminum and
copper surfaces at different system pressures. Saturation temperature tested ranged from 0 ºC
to 80 ºC, which corresponds to pressures from 0.3 MPa to 2.6 MPa. The contact angles were
measured to be in the range of 5.1º to 6.5º, and there’s no clear trend that the contact angle
increases with pressure.
Figure 4.25. Schematic drawing of a bubble on heating surface.
With respect to contact angle, flow boiling has a distinct behavior which pool boiling
does not have. For pool boiling, contact angle is normally treated as a constant value along
the bubble-solid contact line due to the symmetry of stationary bubbles. In flow boiling,
86
before a bubble departs from its original site, it tends to be tilted with an inclination angle due
to the relative velocity between the bubble and its surrounding fluid. The inclination level is
determined by a force balance between the liquid drag force and the surface tension force.
Thus, the contact angle of a bubble along the bubble-solid contact line is no longer a constant
value. If a bubble is observed from a side view, perpendicular to the flow direction, contact
angles can be observed to be different on the upstream and downstream sides of the bubble.
The side facing the incoming flow has a larger contact angle, which is so-called advancing
contact angle. The smaller one on the other side is called receding contact angle. After bubble
departure, it tends to slide on the heating surface, traveling a certain distance before it lifts-off
into the bulk flow or merges with a bubble downstream. During bubble sliding, the relative
velocity between a sliding bubble and its surrounding liquid becomes much smaller and
experimental evidence shows that the inclination angle is very small and can normally be
negligible. The contact angle is a constant value along the bubble-solid contact line, so there’s
no net surface tension force in the flow direction.
Contact angles were measured during this study for both copper and stainless steel
heating surfaces at different system pressures, ranging from 400kPa to 800kPa. The bulk
liquid velocity tested was in the range of 0.05 m/s to 0.25 m/s. Figures 4.26 and 4.27 show
typical bubble images taken from the copper and the stainless steel heating surfaces,
respectively. On both surfaces, bubbles exhibit spherical shapes or ellipsoidal shapes close to
spherical. Contact angles were obtained by measuring the angle between a tangent line of the
bubble profile and the flat surface at the contact point. Figures 4.26 and 4.27 show that there
is no significant difference in bubble shapes and contact angles between these two surfaces.
However, it was found that the bubbles on the copper surface had a more spherical shape, as
compared with that on the stainless steel surface. Contact angles at different pressures are
plotted in Figure 4.28 for both surfaces. Both pressure and surface material do not show
significant impacts on the contact angle. Contact angles on the copper surface were measured
to range from 34º to 40º, with an average value of 38.4º. Contact angles on the stainless steel
surface have slightly larger values, in the range of 40º to 44º, with an average value of 41.4º.

87
Bubble inclination angle was also visually examined from the images. It was found that the
advancing contact angle and receding contact angle are nearly equal, indicating a fairly small
inclination angle. As discussed above, the incline angle is a result of a force balance between
the fluid drag force and the surface tension force. The fluid drag force is proportional to the
local liquid velocity relative to the bubble. For a small bubble size in the magnitude of tens
microns, the local liquid velocity is calculated to be very small so that the observed
inclination angle is very small.
As a summary, bubble images studies showed that there was no significant difference
between the copper heating and the stainless steel heating surfaces in terms of contact angle
and bubble shape. Also, even the liquid-vapor surface tension changes with pressure, it was
found that the system pressure did not have a significant impact on the contact angle. Bubble
inclination angle was found to be fairly small.
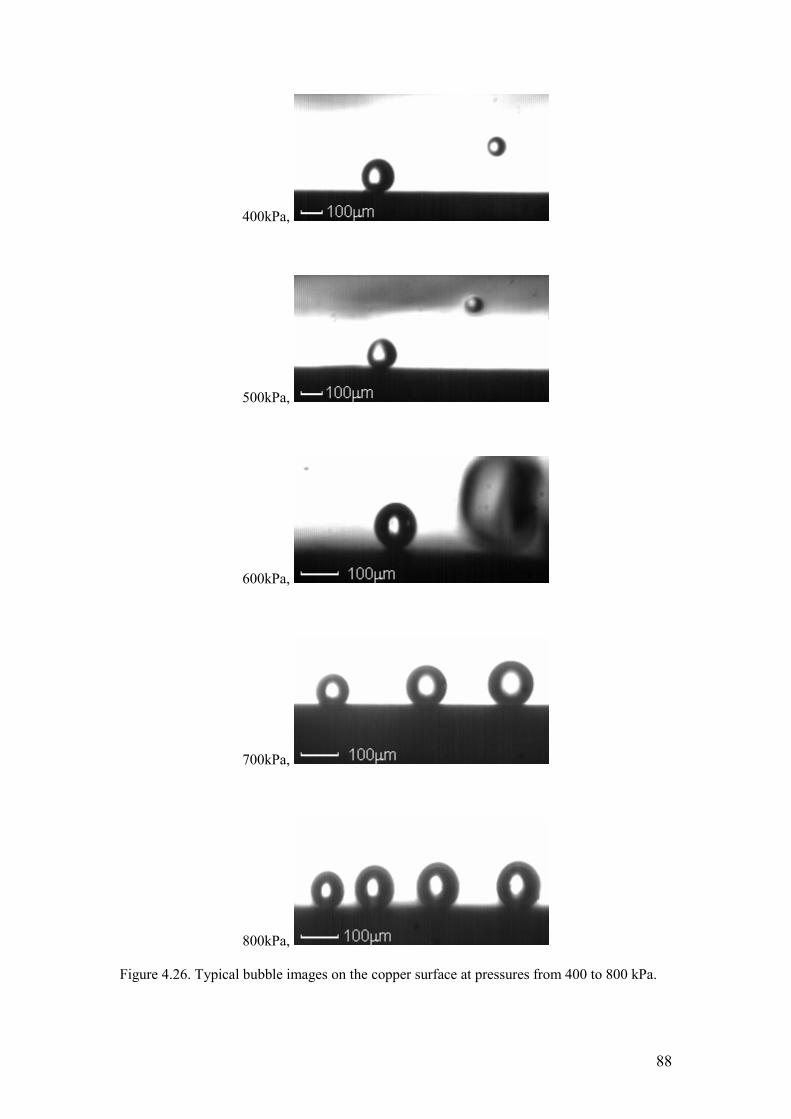
88
400kPa,
500kPa,
600kPa,
700kPa,
800kPa,
Figure 4.26. Typical bubble images on the copper surface at pressures from 400 to 800 kPa.

89
400kPa,
500kPa,
600kPa,
700kPa,
800kPa,
Figure 4.27. Typical bubble images on the stainless steel surface at pressures from 400 to 800
kPa.

90
300 400 500 600 700 800 900
0
10
20
30
40
50
Copper Surface
SS Surface
Contact Angle (degree)
Pressure (kPa)
Figure 4.28. Bubble contact angles of both copper and stainless steel surfaces at different
pressures.
4.2.2 Bubble growth rate and departure size
In flow boiling, the overall heat transfer consists of three major components, latent
heat carried by vapor bubbles, transient conduction due to quenching effect on heating surface
after bubble leaving, and single phase convection in areas without bubbles covering. A large
portion of heat is transferred from the heating surface to the working fluid in the form of
latent heat. Vapor bubbles serve as important media to transfer energy to the bulk flow as they
carry latent heat and agitate the flow. Transient conduction is highly connected with bubble
formation and departure. After bubble departure from its original site, bulk fluid with lower
temperature fills the vacancy created by bubble departure, which was described as a
“quenching” mechanism. The single phase convection is generally a small component
compared to latent heat and transient conduction transfers. Especially in fully developed flow
boiling regime, where most of the heating surface area is covered by bubbles, and leads to

91
diminished single phase convection. In flow boiling, bubble growth rate, departure diameter
and waiting time are dominant parameters in determining how fast energy is transferred to the
bulk flow.
Bubble growth has been studied by several researchers, including Rayleigh (Rayleigh
1917), Plesset and Zwick (Plesset and Zwick 1954), Zuber (Zuber 1961) and Mikic et al.
(Mikic et al. 1970). Mikic concluded that, bubble growth normally experiences two stages, a
very short inertia controlled stage at bubble initiation and a diffusion controlled stage
thereafter. The bubble growth rate was visually measured in the current study. For R134a
boiling with wall superheat in the magnitude of ten degrees, the inertia controlled stage is
estimated to be much less than 1×10⁻⁹ seconds, which was not able to be captured by the high-
speed camera used. All bubble images captured by the camera were considered to be in the
thermal diffusion controlled stage. For bubbles in this stage, bubble radii have been observed
to be proportional to t1/2,
2/1~ CtRb (4-17)
where, Rb is bubble radius, C is a constant and t is time.
Figure 4.29 and 4.30 show typical bubble images during growth on both copper and
stainless steel heating surfaces, respectively. Figure 4.29 displays a growing bubble (bubble-1)
on the copper heating surface with a wall superheat of 8.8 ºC, a system pressure of 400kPa
and an average bulk liquid velocity at 0.09m/s. Figure 4.30 displays a growing bubble
(bubble-2) on the stainless steel heating surface with a wall superheat of 7.3 ºC, a system
pressure at 400kPa and an average bulk liquid velocity at 0.20m/s. The bubble radius was
measured at each time step and plotted against the time in Figures 4.31 and 4.32 for bubble-1
and bubble-2, respectively. Zuber’s model prediction wasalso plotted to compare with the
experimental data. Zuber’s model gives that,
( ) tJab
tR lαπ
2= (4-18)
92
where, b is a constant and Ja is the Jacob number. By comparing his experimental data with it,
Zuber suggested the value of constant b to lie between 1 and √3. Comparisons for both
bubbles indicate that the experimental data agrees well with Zuber’s model with constant b
equal to 1. To compare bubble growth rate for both copper and stainless steel heating surfaces,
the bubble growth experimental data were fitted in the form of,
( ) tJab
CtR lb απ
2= (4-19)
using the least square method. In equation (4-19), Cb is an experimentally determined
constant. The values of Cb for both heating surfaces at different system pressures are plotted
in Figure 4.33. It was that most values of Cb are located between 0.75 and 1.25. The average
values of Cb are 0.99 and 0.98 for the copper and the stainless steel surfaces, respectively. In
addition, there’s no significant difference on Cb found between these two surfaces. This
indicates that Zuber’s model is suitable for predicting bubble growth rates under flow boiling
conditions for both surfaces. In Zuber’s model, the bubble growth rate is only a function of
liquid/vapor thermal properties and wall superheat. More importantly, the fact that Zuber’s
model works for two heating surfaces with widely different thermal conductivities and
thermal diffusivities indicates that heating surface thermal properties do not play important
roles in bubble growth rate.
The bubble waiting time can be estimated by counting the frame numbers between a
departure bubble and a subsequent new embryo. From bubble images, most of the bubble
waiting time was found to be within one frame interval at 4000 fps camera speed. The
bubble’s life time before departures normally lasts tens of frames, and the bubble waiting time
is only a minor portion of a bubble’s lifespan. It is noted that the bubble waiting time was
measured at low wall superheat. The bubble waiting time for high wall superheat level is not
available due to the limitation of the technology for reasons mentioned in the beginning of
this chapter. Many researches (Han and Griffith, 1967; Podowski et. al., 1997; Basu et. al.,
2005) have studied the bubble waiting time, and concluded that the bubble waiting time
decreases with increasing wall superheat. Therefore, the bubble waiting time at higher wall

93
superheats is expected to be even smaller than that at low wall superheats. As a summary, the
bubble frequency is largely determined by how fast a bubble grows and its departure size,
while the bubble waiting time may be safely neglected.

94
t = 0.00 ms,
t = 1.00 ms,
t = 2.00 ms,
t = 3.00 ms,
t = 4.00 ms,
t = 5.00 ms,
Figure 4.29. Typical bubble (bubble-1) growth images on the copper surface, 4000 fps, 400
kPa pressure, 8.8 ºC wall superheat, 0.09 m/s bulk flow velocity. Some frames have been
omitted.

95
t = 6.00 ms,
t = 7.00 ms,
t = 8.00 ms,
t = 9.00 ms,
t = 10.0 ms,
t = 11.0 ms,
Figure 4.29. Typical bubble (bubble-1) growth images on the copper surface, 4000 fps, 400
kPa pressure, 8.8 ºC wall superheat, 0.09 m/s bulk flow velocity. Some frames have been
omitted. (Continued)

96
t = 0.00 ms,
t = 0.50 ms,
t = 1.00 ms,
t = 1.50 ms,
t = 2.00 ms,
Figure 4.30. Typical bubble (bubble-2) growth images on a stainless steel surface, 2000 fps,
400 kPa pressure, 7.3 ºC wall superheat, 0.20 m/s bulk flow velocity. Some frames have been
omitted.

97
t = 2.50 ms,
t = 3.00 ms,
t = 3.50 ms,
t = 4.00 ms,
t = 4.50 ms,
Figure 4.30. Typical bubble (bubble-2) growth images on a stainless steel surface, 2000 fps,
400 kPa pressure, 7.3 ºC wall superheat, 0.20 m/s bulk flow velocity. Some frames have been
omitted. (Continued)

98
0 2 4 6 8 10 12
0
20
40
60
80
100
120
140
160
180
200
Experimental data
Bubble Radius (
µµ µµm)
Time (ms)
Figure 4.31. The growth rate of bubble-1on the copper heating surface (shown in Figure 4.29)
and its comparison with Zuber’s model.
0 2 4 6 8 10
0
20
40
60
80
100
120
140
160
Experimental data
Bubble Radius (
µµ µµm)
Time (ms)
Figure 4.32. The growth rate of bubble-2 on the stainless steel surface (shown in Figure 4.30)
and its comparison with Zuber’s model.
Zuber’s model, b=√3 Zuber’s model, b=1
Zuber’s model, b=√3 Zuber’s model, b=1

99
300 400 500 600 700 800
0.0
0.2
0.4
0.6
0.8
1.0
1.2
1.4
1.6
1.8
2.0
+25%
Copper Surface
SS Surface
Bubble Growth Rate Coefficient, C
b
Pressure (kPa)
-25%
Figure 4.33. Bubble growth rate coefficient for both copper and stainless steel surfaces at
different pressures.
As discussed above, bubble departure size largely determines how much energy a
bubble is able to carry and also the bubble frequency. A model has been proposed by Zeng et.
al. (Zeng et. al. 1993) to predict bubble departure size by a force balance in the flow direction.
Major forces acting on a stationary bubble before its departure include fluid drag force,
surface tension force and bubble growth force. As suggested by Klausner et al. (Klausner et
al., 1993), the fluid drag force is proportional to bubble size and the relative velocity between
a stationary bubble and its surrounding fluid. In some previous research, surface tension force
was treated as negligible by noting that the bubble-solid contact diameter is much smaller
than the bubble diameter. However, in the current study, the surface roughness was estimated
to be in the magnitude of 10 microns. The bubble-solid contact diameter is assumed to have a
similar value as the surface roughness. Bubble diameters observed had a same order of
magnitude as the contact diameter. In this case, the surface tension force has to be considered

100
in the force balance. As suggested by Zeng et al., the bubble growth force is determined by
bubble size, bubble growth rate and its time derivative. As discussed in the previous section,
for a given working fluid the bubble growth rate is only a function of wall superheat. This
suggests that the bubble departure size is mainly controlled by fluid properties, wall superheat
level and the fluid velocity. However, the wall superheat level investigated in this study was
only in a small range due to experimental limitations. As a result, the bulk velocity is
expected to have a dominant effect on the bubble departure size under the experimental
conditions investigated in this study. Figure 4.34 shows bubble departure sizes of both copper
and stainless steel heating surfaces at different system pressures. It can be clearly seen that the
bubble departure size decreases quickly with bulk liquid velocity. This is because the drag
force is proportional to the liquid velocity. The effect of system pressure on bubble departure
size is also shown in Figure 4.34. The bubble departure size is observed to be smaller at
higher system pressures. From the comparison between these two heating surfaces in Figure
4.34, the heating surface materials have no apparent effect on bubble departure size. This
again proves that the bubble dynamics is mainly controlled by liquid thermal properties and
not heating surface material thermal properties.
In summary, bubble dynamics was experimentally investigated in this section. Bubble
dynamics, covers a very wide range of topics, including bubble contact angle, bubble shape,
bubble size and growth rate, waiting time, activation and deactivation, etc. Not all of them are
quantifiable due to their complex physics and non-linear behaviors, and also experimental
limitations on observations and measurements. In this study, some important parameters,
which are directly related to boiling heat transfer, were experimentally measured. Contact
angles were measured for both heating surfaces at different system pressures. System pressure
was found to have no apparent effect on contact angle. The stainless surface has a slightly
larger contact angle than the copper surface. The bubble growth rate was estimated by
measuring bubble size at different times. Zuber’s model fits the experimental data very well.
Most of the bubble growth rate data were found to agree with Zuber’s model within a ±25%
error. Again, the heating surface material does not display a significant effect on the bubble

101
growth rate. The bubble waiting time was found to be negligible compared to bubble lifetime
for both heating surfaces. With respect to bubble departure size, both average liquid bulk
velocity and system pressure showed significant effects. Bubble departure sizes were found to
be smaller at high bulk velocities and high system pressures. The comparison of bubble
departure sizes between these two heating surfaces indicated heating surface material has only
a minor effect. As a summary, copper and stainless steel heating surfaces were investigated in
the current study with the same working fluid, R134a. Both surfaces had a same surface
finishing and also showed similar wettability. By comparing bubble parameters, it was found
that bubble dynamics is mostly controlled by liquid thermal and hydraulic conditions, while
the heating surface thermal properties have little effect.
0.0 0.1 0.2 0.3
10
20
30
40
50
60
70
80
90
Copper - 400kPa
Copper - 500kPa
Copper - 700kPa
Copper - 800kPa
SS - 400kPa
SS - 500kPa
SS - 700kPa
Bubble Departure Radius (
µµ µµm)
Liquid Velocity (m/s)
Figure 4.34. Bubble departure sizes on both copper and stainless steel surfaces at different
pressures and bulk liquid velocities.

102
4.3 FLOW BOILING HEAT TRANSFER
The boiling heat transfer performances of the two heating surface materials, with
R134a coolant, have been tested under various conditions, including system pressure, flow
velocity, inlet subcooling level, etc. The system pressures were experimentally explored over
a range from 400kPa to 800kPa. The average bulk velocity was varied over a range from 0.1
m/s to 0.2m/s, which corresponds to mass fluxes of around 120 kg/m2s to 240 kg/m2s,
depending on system pressure. The average inlet subcooling level was controlled in the range
of 10ºC to 30ºC. Figures 4.35 and 4.36 show typical boiling curves and plots of their
corresponding heat transfer coefficients, respectively. The data shown in Figures 4.35 and
4.36 were obtained for 400kPa system pressure, liquid velocity at 0.1m/s and inlet subcooling
of 10ºC, on the copper surface. In Figure 4.35, single phase convection is dominant in this
low wall superheat region. Boiling then starts at a wall temperature, which is referred to as
onset of nucleate boiling (ONB). As the wall temperature increases, more and more bubbles
are generated on the heating surface and fully developed nucleate flow boiling develops.
Between single phase convection and fully developed nucleate boiling, a transition region is
normally present. As the wall temperature is increased even more, the bubble number reaches
a limiting point above which it cannot increase more and departure from nucleate boiling
(DNB) takes place, and the heating surface experiences a maximum heat flux. After reaching
this maximum heat flux, the heat transfer coefficient drops dramatically and the wall
temperature increases rapidly. The maximum heat flux achieved on a heating surface under
such a condition is referred as the critical heat flux (CHF).

103
-10 0 10 20 30 40
0.0
2.0x10⁵
4.0x10⁵
6.0x10⁵
Wall Heat Flux (W/m
2)
Wall Superheat (oC)
Figure 4.35. A typical boiling curve obtained from the copper surface at a pressure at 400 kPa,
bulk liquid velocity at 0.1 m/s, inlet subcooling at 10 ºC.
103
104
105
106
102
103
104
Heat Transfer Coefficient, (W/m
2K)
Heat Flux (W/m2)
Figure 4.36. A typical heat transfer coefficient vs. wall heat flux curve obtained from the
copper surface with system pressure at 400 kPa, bulk liquid velocity at 0.1 m/s, inlet
subcooling at 10 ºC.
CHF
104
Figures 4.37 and 4.38 show the effect of heating surface material on flow boiling heat
transfer performance. The effect of heating surface materials on boiling heat transfer has been
studied in the past (Rohsenow, 1952; Gorenflo et al., 2004; Ribatski and Saiz Jabardo, 2003).
Rohsenow (Rohsenow, 1952) expressed the material effect indirectly by introducing
combined surface/liquid coefficients. Some other researchers included this effect explicitly
using parameters directly involving material physical properties. In the current study, boiling
curves for both copper and stainless steel heating surfaces are plotted in Figure 4.37. Heat
fluxes were measured at an average liquid velocity of 0.10m/s, with system pressures ranging
from 400 kPa to 700 kPa. For same system pressure, inlet subcooling levels were kept the
same for these two surfaces, while they were higher for higher pressures. This plot clearly
shows that the copper surface has better performance in terms of boiling heat transfer. More
specifically, the copper surface achieves higher heat fluxes than the stainless steel surface at
the same wall superheat temperature. In other words, at given wall heat flux, the copper
surface has lower wall superheat temperatures than the stainless steel surface. The heat
transfer coefficient plotted against wall heat flux in the fully developed flow boiling regime is
shown in Figure 4.38. It shows that the copper surface has higher heat transfer coefficients at
given wall superheat temperatures. Data obtained at a bulk liquid velocity of 0.2 m/s are
plotted in Figures 4.39 and 4.40, similar to Figures 4.37 and 4.38. A linear correlation is
observed between heat transfer coefficient and heat flux on these log-log plots, indicating that
the heat transfer coefficient can be expressed in the form of,
mCqh = (4-20)
in which, the exponent m is the slope of the heat transfer coefficient vs. heat flux (h vs. q)
curve. Corresponding to boiling curves shown in Figures 4.37 and 4.39, (h vs. q) curves on
the copper surface have larger slopes than those on the stainless steel surface. Values of m are
estimated by curve fittings to experimental data. For example, values of m shown in Figure
4.38 on the copper surface are 0.9338, 0.9731, 0.9899, and 0.9933 for system pressures of 400,
105
500, 600, and 700 kPa, respectively. The corresponding m values for the stainless steel
surface are 0.8194, 0.8832, 0.8836 and 0.9145, respectively.
Critical heat fluxes experienced by these two surfaces were also experimentally
measured, as plotted in Figure 4.41. At a low bulk liquid velocity, 0.1m/s, critical heat fluxes
on the copper surface are slightly higher than those on the stainless steel surface. The
differences between them are not significant. At a relatively higher bulk liquid velocity,
0.2m/s, it’s clear that the copper surface has higher critical heat fluxes. Compared to the
stainless steel surface, the copper surface has about 5% higher critical heat flux values.
However, it should be noted that Figure 4.41 does not necessarily reflect the pressure effect
on critical heat flux since different inlet subcooling levels were used.
The pressure effect on the heat transfer coefficient is plotted in Figures 4.42 and 4.43.
Heat fluxes were measured for both heating surfaces, at the same bulk liquid velocity of
0.15m/s and inlet subcooling level of 22.0 ºC, for pressures of 500, 600 and 700kPa. Figure
4.43 shows that pressure does not have a significant impact on boiling heat transfer on both
heating surfaces. Values of m were determined by curve fitting and are plotted with system
pressure and the reduced pressure in Figure 4.43. The reduced pressure is defined as,
cr
rp
pp = (4-21)
in which, pr, p and pcr are reduced pressure, system pressure and fluid critical pressure,
respectively. Figure 4.43 indicates that in pressure ranges experimentally explored in the
current study, pressure does not have a significant impact on boiling heat transfer coefficient.
A possible reason is that the pressure explored in the current study is limited in a small range,
or more specifically, the reduced pressures ranging from 0.12 to 0.17. The effect of reduced
pressure has been studied by different researchers. Cooper (Cooper 1984) proposed a
correlation to account for both reduced pressure and surface roughness on heat transfer
coefficient. Gorenflo (Gorenflo 2004) proposed a correlation to directly incorporate the effect
of the reduced pressure for pool boiling. This correlation is expressed as,

106
3.03.09.0 rpm −= (4-22)
in which, the slope value m decreases with reduced pressure. The comparison between
experimental data and Gorenflo’s correlation is displayed in Figure 4.43. It shows that this
correlation for pool boiling but does not give good predictions for flow boiling.
Corresponding critical heat flux data are plotted against pressure in Figure 4.44.
Unlike its minor impact on the heat transfer coefficient, pressure shows a significant influence
on critical heat flux. For example, on both copper and stainless steel surfaces, critical heat
fluxes measured at 700 kPa are around 7-8% higher than those measured at 500 kPa.
Figures 4.45 to 4.48 show the effect of fluid velocity on boiling heat transfer
performance on both surfaces. Data shown in Figures 4.45 and 4.46 were obtained from flow
boiling on both surfaces at 500 kPa system pressure, inlet subcooling at 18 ºC, with bulk
liquid velocities of 0.1, 0.15 and 0.2 m/s. Data shown in Figures 4.47 and 4.48 were obtained
from flow boiling on both surfaces at 700 kPa system pressure, inlet subcooling at 27 ºC, with
bulk liquid velocities of 0.1, 0.15 and 0.2 m/s. Both figures show that liquid velocity does not
have a significant impact on flow boiling heat transfer in the fully developed regime. A
similar phenomenon has also been experimentally observed by another researcher (McAdams
1949). It’s been found that, with other conditions fixed, boiling curves with different liquid
velocities collapse onto the same curve in the fully developed flow boiling regime. Normally,
a higher liquid velocity gives a higher heat transfer coefficient in the single-phase convection
region. Also, transition from partially to fully developed flow boiling occurs at a higher wall
temperature. In addition, critical heat fluxes are higher for higher liquid velocities, which
were also experimentally observed for different pressures and inlet subcooling levels in this
study, shown in Figure 4.49. The inlet subcooling level effect is shown in Figures 4.50, 4.51
and 4.52. Similarly for the bulk liquid velocity, the inlet subcooling level does not show
significant impact on flow boiling heat transfer. However, it’s normally accepted that heat
fluxes are higher in the fully developed flow boiling regime as the inlet subcooling level is
higher. This phenomenon was not clearly observed in the current study, which may be due to

107
the limited inlet subcooling range explored. The critical heat flux, however, shows an
apparent dependence on the inlet subcooling level. Figure 4.52 shows critical heat fluxes
measured for both surfaces at different pressures and inlet subcooling levels. It clearly shows
that, for given pressures, higher inlet subcooling levels give higher critical heat fluxes.
Flow boiling heat transfer performance on both copper and stainless steel surfaces,
including parametric studies, were experimentally carried out in this study. Experimental data
clearly show that the copper surface has better performance than the stainless steel surface in
terms of both heat transfer coefficient and critical heat flux. Parametric studies, such as
effects of pressure, bulk liquid velocity, and inlet subcooling level, were also presented. The
comparison between the current study and other research shows good agreement. From
experimental results obtained in the current study, it was concluded that heat flux is largely
determined by nucleation site density. Also, the bubble dynamics on both surfaces show
almost identical characteristics. The differences on boiling heat transfer between these two
surfaces, however, raises a question as to what is the root cause for the differences. A possible
explanation is that lateral heat transfer just inside the heating surface creates a non-uniform
surface temperature distribution. The lateral heat transfer is governed by heating surface
thermal properties, such as thermal conductivity and thermal diffusivity, which are greatly
different for the two heating surfaces investigated. This suggested further model development
to investigate the heat transfer inside the heating surface, from which a surface temperature
profile can be obtained. This may shed some light on boiling heat transfer performance
differences between these two heating surface materials.
4.4 SUMMARY AND DISCUSSION
In this study, the subcooled flow boiling on copper and stainless steel heating
surfaces was experimentally investigated from both macroscopic and microscopic points of
view. Nucleation site density, an essential parameter in determining the flow boiling heat
transfer capacity, was measured for both surfaces using a high-speed digital video camera.

108
Number of nucleation sites and their locations in domains of interest were able to be
measured. Several conclusions were made based on these observations and data analysis:
(1) Wall superheat, critical cavity diameter and wall heat flux were used to correlate
with the nucleation site density data. Among them, the wall heat flux showed the best
correlating behavior to eliminate both pressure and surface properties effects.
(2) The observed nucleation site distribution agreed well with the spatial Poisson
distribution when only considering probability density of nucleation numbers counted in sub-
domains.
(3) The distribution of nearest-neighbor sites distance, however, did not agree with
the spatial Poisson distribution. The observed data had a more uniform distribution compared
to the spatial Poisson distribution, which might be a result of interactions of nucleation sites.
(4) The distribution of nucleation sites on the copper surface was slightly more
uniform than that on the stainless steel surface, which is probably a result from stronger
interactions of nucleation sites due to higher thermal diffusivity.
Bubble dynamics were experimentally observed and recorded via the high-speed
digital camera. In this study, some of the important parameters, which are directly related to
the boiling heat transfer capacity, were experimentally measured. Some conclusions were
made based on the observations and data analysis,
(5) System pressure showed no significant influence on contact angle. The stainless
steel surface had slightly larger contact angles than those on the copper surface.
(6) Bubble growth rates measured for both heating surfaces were fairly similar, which
agreed very well with Zuber’s model. There is no apparent difference between these two
surfaces in terms of bubble growth rate.
(7) Bubble waiting time was measured to be negligible compared to bubble lifespan
for both surfaces.
(8) Bubble departure size tended to be smaller with either a higher liquid velocity or a
higher system pressure. Similarly, heating surface material showed a minor effect.
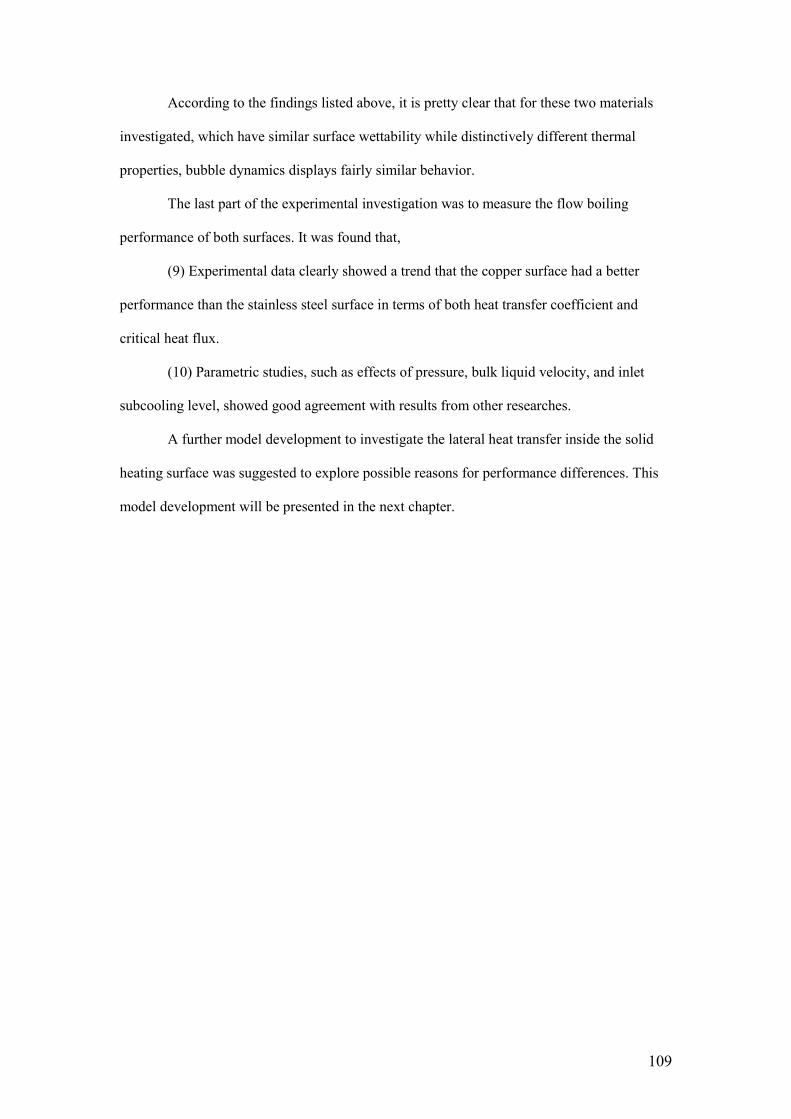
109
According to the findings listed above, it is pretty clear that for these two materials
investigated, which have similar surface wettability while distinctively different thermal
properties, bubble dynamics displays fairly similar behavior.
The last part of the experimental investigation was to measure the flow boiling
performance of both surfaces. It was found that,
(9) Experimental data clearly showed a trend that the copper surface had a better
performance than the stainless steel surface in terms of both heat transfer coefficient and
critical heat flux.
(10) Parametric studies, such as effects of pressure, bulk liquid velocity, and inlet
subcooling level, showed good agreement with results from other researches.
A further model development to investigate the lateral heat transfer inside the solid
heating surface was suggested to explore possible reasons for performance differences. This
model development will be presented in the next chapter.

110
-20 -10 0 10 20 30 40 50 60 70 80
0.0
2.0x10⁵
4.0x10⁵
6.0x10⁵
8.0x10⁵
400 kPa
500 kPa
600 kPa
700 kPa
Wall Heat Flux (W/m
2)
Wall Superheat (oC)
Figure 4.37. Surface material’s effect on the flow boiling. Boiling curves at different
pressures. Bulk liquid velocity, 0.1 m/s. Blackened symbols, copper surface; open symbols,
stainless steel surface.
104
105
106
102
103
104
400 kPa
500 kPa
600 kPa
700 kPa
Heat Transfer Coefficient, (W/m
2K)
Heat Flux, (W/m2)
Figure 4.38. Surface material’s effect on the flow boiling. Heat transfer coefficient vs. wall
heat flux in the fully developed flow boiling region (corresponding to Figure 4.37). Blackened
symbols, copper surface; open symbols, stainless steel surface.

111
-20 -10 0 10 20 30 40 50 60 70 80
0.0
2.0x10⁵
4.0x10⁵
6.0x10⁵
8.0x10⁵
400 kPa
500 kPa
600 kPa
700 kPa
Wall Heat Flux (W/m
2)
Wall Superheat (oC)
Figure 4.39. Surface material’s effect on the flow boiling. Boiling curves at different
pressures. Bulk liquid velocity, 0.2 m/s. Blackened symbols, copper surface; open symbols,
stainless steel surface.
104
105
106
102
103
104
400 kPa
500 kPa
600 kPa
700 kPa
Heat Transfer Coefficient, (W/m
2K)
Heat Flux, (W/m2)
Figure 4.40. Surface material’s effect on the flow boiling. Heat transfer coefficient vs. wall
heat flux in the fully developed flow boiling region (corresponding to Figure 4.39). Blackened
symbols, copper surface; open symbols, stainless steel surface.

112
300 400 500 600 700 800
3x10⁵
4x10⁵
5x10⁵
6x10⁵
7x10⁵
0.1 m/s
0.2 m/s
Critical heat flux, (W
/m2)
Pressure (kPa)
Figure 4.41. Surface material’s effect on the critical heat flux. Critical heat flux at different
pressures and velocities. Blackened symbols, copper surface; open symbols, stainless steel
surface.
104
105
106
102
103
104
500 kPa
600 kPa
700 kPa
Heat Transfer Coefficient, (W/m
2K)
Heat Flux, (W/m2)
Figure 4.42. Surface material’s effect on the flow boiling. Heat transfer coefficient vs. wall
heat flux. Bulk liquid velocity at 0.15m/s. Inlet subcooling at 22 ºC. Blackened symbols,
copper surface; open symbols, stainless steel surface.
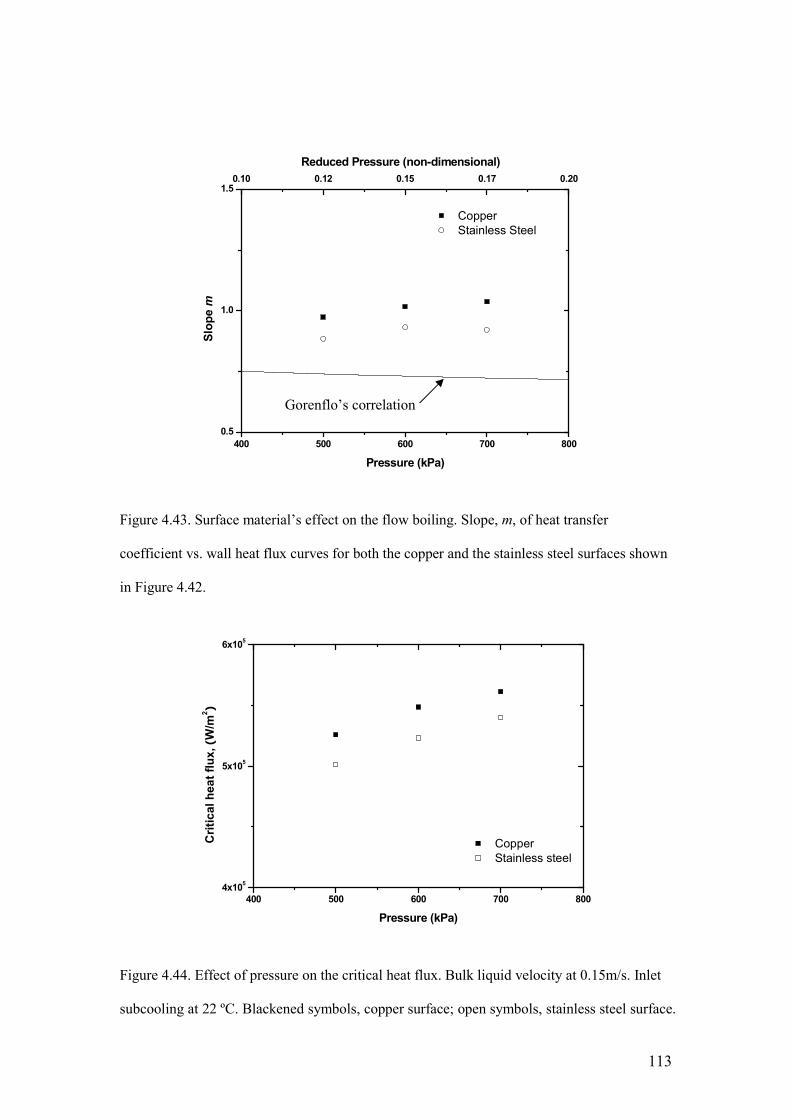
113
400 500 600 700 800
0.5
1.0
1.50.10 0.12 0.15 0.17 0.20
Copper
Stainless Steel
Slope m
Pressure (kPa)
Reduced Pressure (non-dimensional)
Figure 4.43. Surface material’s effect on the flow boiling. Slope, m, of heat transfer
coefficient vs. wall heat flux curves for both the copper and the stainless steel surfaces shown
in Figure 4.42.
400 500 600 700 800
4x10⁵
5x10⁵
6x10⁵
Copper
Stainless steel
Critical heat flux, (W
/m2)
Pressure (kPa)
Figure 4.44. Effect of pressure on the critical heat flux. Bulk liquid velocity at 0.15m/s. Inlet
subcooling at 22 ºC. Blackened symbols, copper surface; open symbols, stainless steel surface.
Gorenflo’s correlation

114
-20 -10 0 10 20 30 40 50 60 70 80
0.0
2.0x10⁵
4.0x10⁵
6.0x10⁵
8.0x10⁵
0.10 m/s
0.15 m/s
0.20 m/s
Wall Heat Flux (W/m
2)
Wall Superheat (oC)
Figure 4.45. Effect of bulk liquid velocity on the flow boiling. Boiling curves at different bulk
liquid velocities. Pressure at 500 kPa, inlet subcooling at 18 ºC. Blackened symbols, copper
surface; open symbols, stainless steel surface.
104
105
106
102
103
104
0.10 m/s
0.15 m/s
0.20 m/s
Heat Transfer Coefficient, (W/m
2K)
Heat Flux, (W/m2)
Figure 4.46. Effect of bulk liquid velocity on the flow boiling. Heat transfer coefficient vs.
wall heat flux in the fully developed flow boiling region (corresponding to Figure 4.45).
Blackened symbols, copper surface; open symbols, stainless steel surface.
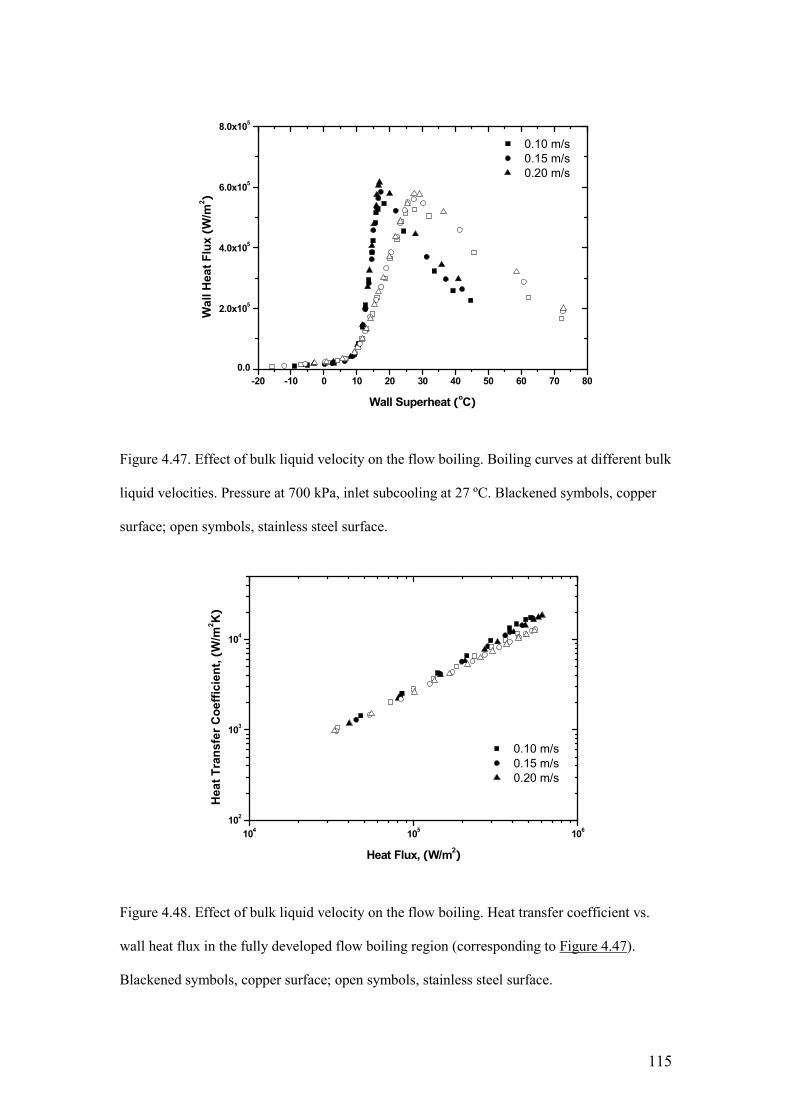
115
-20 -10 0 10 20 30 40 50 60 70 80
0.0
2.0x10⁵
4.0x10⁵
6.0x10⁵
8.0x10⁵
0.10 m/s
0.15 m/s
0.20 m/s
Wall Heat Flux (W/m
2)
Wall Superheat (oC)
Figure 4.47. Effect of bulk liquid velocity on the flow boiling. Boiling curves at different bulk
liquid velocities. Pressure at 700 kPa, inlet subcooling at 27 ºC. Blackened symbols, copper
surface; open symbols, stainless steel surface.
104
105
106
102
103
104
0.10 m/s
0.15 m/s
0.20 m/s
Heat Transfer Coefficient, (W/m
2K)
Heat Flux, (W/m2)
Figure 4.48. Effect of bulk liquid velocity on the flow boiling. Heat transfer coefficient vs.
wall heat flux in the fully developed flow boiling region (corresponding to Figure 4.47).
Blackened symbols, copper surface; open symbols, stainless steel surface.

116
0.05 0.10 0.15 0.20 0.25
3x10⁵
4x10⁵
5x10⁵
6x10⁵
7x10⁵
500 kPa
700 kPa
Critical heat flux, (W
/m2)
Liquid Velocity, (m/s)
Figure 4.49. Effect of bulk liquid velocity on the critical heat flux. For pressure at 500 kPa,
inlet subcooling is 18 ºC; for pressure at 700 kPa, inlet subcooling is 27 ºC. Blackened
symbols, copper surface; open symbols, stainless steel surface.
-10 0 10 20 30 40 50 60
0.0
2.0x10⁵
4.0x10⁵
6.0x10⁵
18.3 oC subcooling
10.7 oC subcooling
Wall Heat Flux (W/m
2)
Wall Superheat (oC)
Figure 4.50. Effect of inlet subcooling on the flow boiling. Boiling curves at different inlet
subcooling on the copper surface. Pressure at 500 kPa, bulk liquid velocity at 0.15 m/s.

117
-10 0 10 20 30 40 50 60
0.0
2.0x10⁵
4.0x10⁵
6.0x10⁵
18.9 oC subcooling
11.5 oC subcooling
Wall Heat Flux (W/m
2)
Wall Superheat (oC)
Figure 4.51. Effect of inlet subcooling on the flow boiling. Boiling curves at different inlet
subcooling on the stainless steel surface. Pressure at 500 kPa, bulk liquid velocity at 0.15 m/s.
5 10 15 20 25 30 35
3x10⁵
4x10⁵
5x10⁵
6x10⁵
7x10⁵
500 kPa
600 kPa
700 kPa
Critical heat flux, (W
/m2)
Inlet subcooling level, (oC)
Figure 4.52. Effect of inlet subcooling on the critical heat flux. Pressure at 500 kPa, bulk
liquid velocity at 0.15 m/s. Blackened symbols, copper surface; open symbols, stainless steel
surface.

118
CHAPTER 5
MODEL DEVELOPMENT
Subcooled flow boiling heat transfer has been experimentally studied in this thesis
work and has been presented in the previous chapter. The wall heat flux has been found to
directly correlate with the nucleation site density. Also, experimental evidence shows that the
working fluid, R134a, has similar contact angles on both copper and stainless steel surfaces.
The measured bubble parameters, such as bubble size and growth rate, are similar on both
surfaces too. However, it’s been found that the copper heating surface has a better
performance than the stainless steel surface in terms of heat transfer coefficient. As discussed
in previous chapters, significant differences between these two surface materials are their
thermal properties, such as thermal conductivity and thermal diffusivity. This indicates that
thermal properties of heating surface materials play important roles in their performance. This
is based on the fact that thermal conductivity has a significant impact through lateral heat
transfer and consequently temperature uniformity of the heating surface. To quantify the
impact of thermal conductivity on boiling heat transfer, a model development is suggested. In
this chapter, a simplified model is developed to simulate heat transfer within the heating block
at the surface solid domain when bubbles are present on the heating surface. The purpose is to
study the impact of several key parameters’ on lateral heat transfer and surface temperature
profile. These parameters include: material thermal conductivity, bubble size, heating surface
thickness, etc.
5.1 MODEL DESCRIPTION
It is known that flow boiling is a complex phenomenon in which several heat transfer
mechanisms are present simultaneously. In general, in flow boiling the overall heat transfer
consists of three major components: latent heat carried by vapor bubbles, transient conduction
due to the quenching effect on heating surface after bubble departure, and single phase
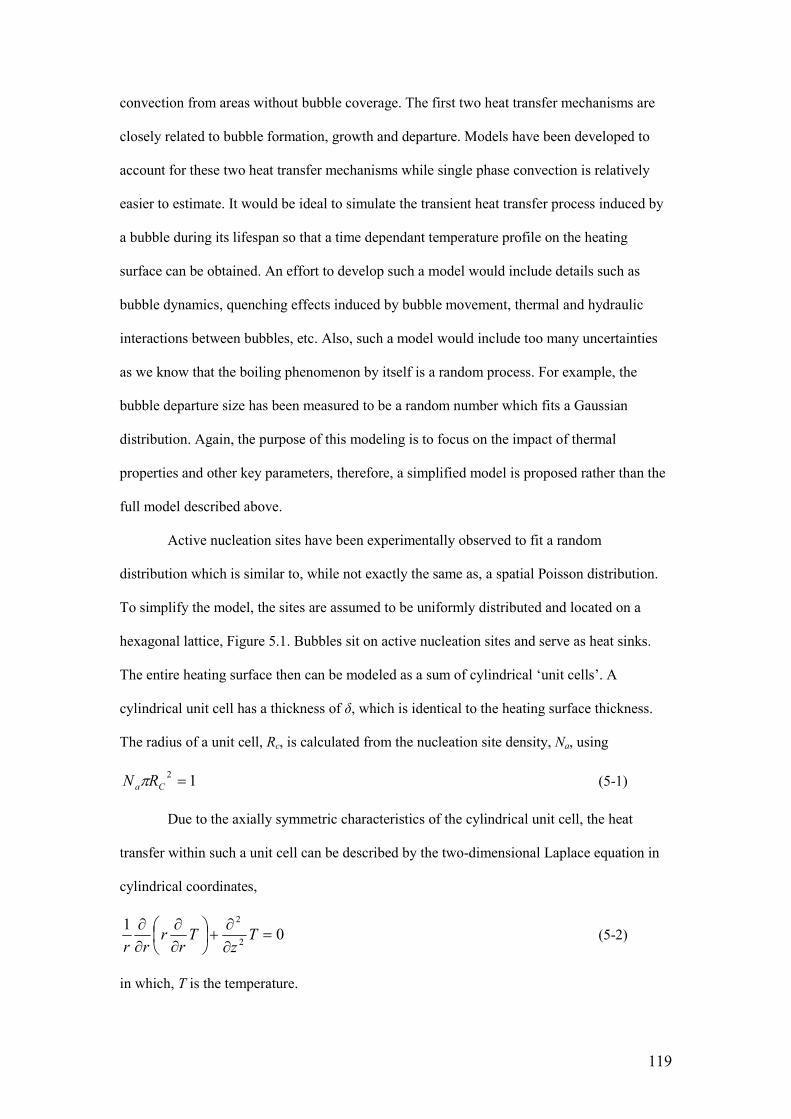
119
convection from areas without bubble coverage. The first two heat transfer mechanisms are
closely related to bubble formation, growth and departure. Models have been developed to
account for these two heat transfer mechanisms while single phase convection is relatively
easier to estimate. It would be ideal to simulate the transient heat transfer process induced by
a bubble during its lifespan so that a time dependant temperature profile on the heating
surface can be obtained. An effort to develop such a model would include details such as
bubble dynamics, quenching effects induced by bubble movement, thermal and hydraulic
interactions between bubbles, etc. Also, such a model would include too many uncertainties
as we know that the boiling phenomenon by itself is a random process. For example, the
bubble departure size has been measured to be a random number which fits a Gaussian
distribution. Again, the purpose of this modeling is to focus on the impact of thermal
properties and other key parameters, therefore, a simplified model is proposed rather than the
full model described above.
Active nucleation sites have been experimentally observed to fit a random
distribution which is similar to, while not exactly the same as, a spatial Poisson distribution.
To simplify the model, the sites are assumed to be uniformly distributed and located on a
hexagonal lattice, Figure 5.1. Bubbles sit on active nucleation sites and serve as heat sinks.
The entire heating surface then can be modeled as a sum of cylindrical ‘unit cells’. A
cylindrical unit cell has a thickness of δ, which is identical to the heating surface thickness.
The radius of a unit cell, Rc, is calculated from the nucleation site density, Na, using
12 =Ca RN π (5-1)
Due to the axially symmetric characteristics of the cylindrical unit cell, the heat
transfer within such a unit cell can be described by the two-dimensional Laplace equation in
cylindrical coordinates,
01
2
2
=∂
∂+
∂∂
∂∂
Tz
Tr
rrr
(5-2)
in which, T is the temperature.

120
The boundary conditions are described as follows.. On the bottom side of the heating
surface, z = 0, it’s assumed that there’s a uniformly distributed heat flux q”,
( )"
0
qz
Tk
z
=∂∂
−=
(5-3)
in which, k is the thermal conductivity of the heating surface material. Due to repeatability of
unit cells, on the unit cell boundary, where r = Rc, ,a symmetric boundary condition is
assumed,
( )0=
∂∂
= cRrr
T (5-4)
On the heating surface, z = δ, the boundary condition has to be set properly to
represent boiling heat transfer. As discussed above, boiling heat transfer is a very complex
phenomenon which consists of several heat transfer mechanisms. Bubbles are the major
media to transfer the energy in the form of latent heat and also they agitate local micro-
convection. The heat transfer on surfaces not covered by bubbles is dominated by single
phase forced convection, which normally contributes only a small fraction to the total heat
transfer (Wu 2007, Basu et al. 2005b). To simplify the model, it’s assumed that all energy is
transferred via bubbles while the surface not covered by bubbles is under adiabatic conditions.
The boundary condition on the heating surface, z = δ, then can be expressed as,
( )( )bulkb
z
TThz
Tk −=
∂∂
−=δ
at ( )bRr ≤≤0 (5-5)
and,
( )0=
∂∂
−=δzz
Tk at ( )cb RrR ≤< (5-6)
in which, Tbulk is the bulk temperature and hb is the boiling heat transfer coefficient. Since a
bubble is always approximately at its saturation temperature, heating surfaces covered by
bubbles are assumed to be at the same temperature due to the very high heat transfer
coefficient. Therefore, the boiling heat transfer coefficient can be back calculated as,

121
( )bulksb
c
bTTR
Rqh
−=
2
2"
π
π (5-7)
in which, Ts is the saturation temperature.
In the experimental part of current study, the stainless steel surface is attached onto
the copper base block by silver soldering. The thickness of the stainless steel layer is 1 mm,
which is much larger than the normal bubble size. As discussed in chapter 3, this will assure
that the copper base won’t have any impact on the boiling performance of the stainless steel.
To explore the effect of the stainless steel layer thickness attached onto the copper base, a
secondary model was built, schematically shown in figure 5.2. The only difference between
these two models is that the secondary model has a two-layer configuration, in which the
stainless steel layer lies on the top of the copper block. This secondary model is only used
when studying the heating surface thickness effect with the two-layer configuration. The
governing equation is still the same as equation (5-2) in both two layers and an additional
boundary condition for the stainless steel-copper interface is used,
( ) ( )cc z
SSSS
z
CuCu
z
Tk
z
Tk
δδ == ∂
∂−=
∂
∂− (5-8)
in which, TCu and TSS are temperatures in the copper and stainless steel layers, respectively,
and. kCu and kSS are thermal conductivities of copper and stainless steel, respectively.
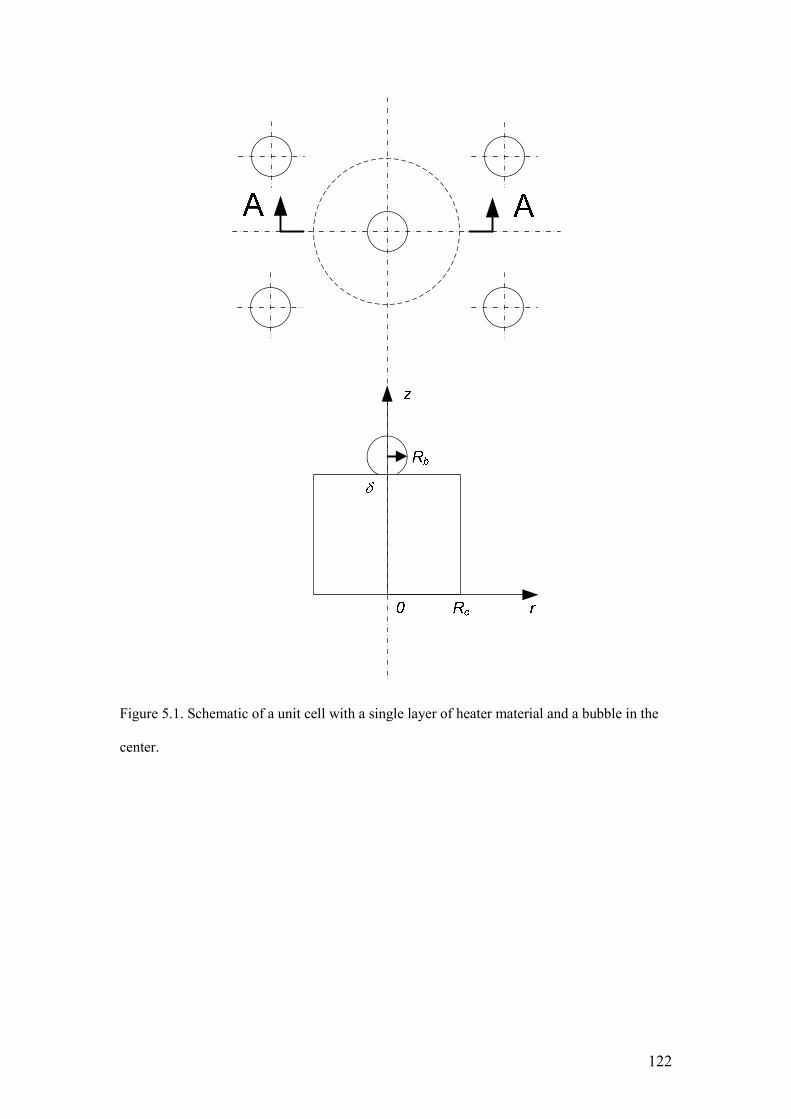
122
Figure 5.1. Schematic of a unit cell with a single layer of heater material and a bubble in the
center.

123
Figure 5.2. Schematic of a unit cell with a two-layer heater configuration and a bubble in the
center.

124
5.2 MODEL RESULTS
In this section, results of the model prediction are presented. As discussed in the
previous section, the purpose of this model development was to explore the impact of several
key parameters on the lateral heat transfer in the heater block very near to the heating surface
and consequently the surface temperature profile. These parameters include the heater surface
material thermal conductivity, thickness of heating surface, relative bubble size to unit cell
size and also heat flux. The model is numerically solved by a commercial CFD software
package, FLUENT ®.
To quantify these parametric effects, a sample case is numerically solved. The system
pressure is 300 kPa with the saturation temperature is 270K. The bulk inlet subcooling level is
20 K. The radius of the unit cell is set at 0.1 mm, which is equivalent to a nucleation site
density of 3.18×10⁷ sites/m2. The bubble radii explored include 0.02 mm, 0.04 mm, 0.06 mm
and 0.08 mm. Heat transfer coefficients are solved using equation (5-7). The thicknesses of
heating surface explored include 0.01 mm, 0.02 mm, 0.05 mm, 0.1 mm, 0.15 mm and 0.2 mm.
Heating surface materials explored include materials with different thermal conductivities,
such as stainless steel, tin, nickel, brass, 7075 aluminum, pure aluminum, and pure copper.
Different heat fluxes were also studied, including 1×10⁵ up to 5×10⁵ W/m2.
The first parameter explored is the thermal conductivity of the heating surface
material. In chapter 4, the experimental results show that the copper and stainless steel
heating surfaces have different flow boiling heat transfer capacities, while both nucleation site
density and bubble dynamics do not show significant differences. As discussed in the
previous chapter, a possible reason for this is that the thermal conductivity of the heating
surface material affects the lateral heat transfer inside the heating block and therefore the
surface temperature varies with materials. On a heating surface, a bubble serves as a heat sink
with a high heat transfer coefficient due to coolant phase change. The temperature under a
bubble therefore is expected to be low and close to the saturation temperature. The heating
surface without bubbles covering is then controlled by two heat transfer mechanisms, forced
convection to the bulk flow and lateral heat conduction to the bubble covered region.

125
Compared to the phase change during bubble growth, the forced convection is a relatively
inefficient to transfer mechanism. If the thermal conductivity is high enough, lateral heat
conduction can be even more important than forced convection to transfer energy from the
heating surface into the bulk flow. Figure 5.3 shows temperature profiles on heating surfaces
made of materials with different thermal conductivities. The temperature profiles were solved
in a unit cell with radius of 0.1 mm and thickness of 0.1 mm. The bubble radius was set at
0.02 mm and the heat flux was set at 1×10⁵ W/m2. Figure 5.4 shows the maximum and
average surface temperatures corresponding to Figure 5.3. From Figure 5.3, it can be seen that
due to the presence of a bubble, all temperature profiles have a dip in the center region. The
surface with a higher thermal conductivity has a flatter surface temperature profile, which has
both smaller maximum and average surface temperatures. This proves that an active bubble
has a larger influence area when the heating surface thermal conductivity is higher. This
explains that in flow boiling, on a copper surface tends to have a more uniform nucleation site
distribution than on a stainless steel surface, which has been experimentally observed in this
study. It is also found that at a relatively low heat flux, 1×10⁵ W/m2, the average surface
temperature difference between a copper surface and a stainless steel surface is more than 2 K.
This numerical result agrees very well with the experimental results presented in chapter 4.
Also, as thermal conductivity increases, the effect of the thermal conductivity becomes
negligible.
Figure 5.5 displays surface temperature profiles on a copper heating surface of
different thicknesses, ranging from 0.01 mm to 0.2 mm (10 µm to 200 µm). Correspondingly,
Figure 5.6 displays the maximum and average surface temperatures for different thicknesses.
A similar set of numerical data are presented in Figures 5.7 and 5.8 for a stainless steel
heating surface. Both numerical solutions were obtained with the same bubble radius of 0.02
mm and heat flux of 1×10⁵ W/m2. Similar temperature profiles are found for both the copper
and the stainless steel surfaces but with different temperature magnitudes. For both material
two surfaces, the overall surface temperature becomes higher as the heating surface becomes
thinner. For heating surface thicknesses is larger than 0.05 mm, which is 2.5 times of the

126
bubble radius, the heating surface thickness does not show any significant impact on the
temperature profiles. This is also shown in Figures 5.6 and 5.8 for the copper and the stainless
surfaces, respectively. Comparing Figures 5.5 and 5.7, shows that thickness has a smaller
effect on the surface temperature profile on the copper heating surface due to the much higher
thermal conductivity and therefore better lateral heat transfer. The heating surface thickness
effect has also been studied in another way with the secondary model described in the
previous section. In this secondary model, the stainless steel layer is installed on a copper
base block by silver soldering, which is assumed to provide an ideal connection. The total
thickness of these two layers is kept constant at 0.2 mm, while the stainless steel layer
thickness changes from 0 to 0.2 mm. The thicknesses of 0 and 0.2 mm represent a pure
copper layer and a pure stainless steel layer, respectively. The surface temperature profiles are
shown in Figure 5.9. Correspondingly, the maximum and average surface temperatures are
shown in Figure 5.10. As shown in Figures 5.9 and 5.10, the thickness effect shows an
opposite effect on the temperature profiles compared to that in Figures 5.7 and 5.8. More
specifically, when a copper base block is present, a thinner stainless steel surface has a lower
overall surface temperature. The reason is that the copper base block provides additional
lateral heat conduction capacity. A thinner stainless steel layer has a better chance to enhance
lateral heat conduction through the copper material. Again, as the stainless steel layer
thickness reaches 50µm, which is 2.5 times of the bubble radius, the thickness effect is
diminished. Comparing Figures 5.9 and 5.7, it is found that as the thickness becomes larger
than 50 µm, the temperature profiles are almost identical for the two conditions, with or
without the copper base block. This result is important for justifying the experimental setup
described in chapter 3. The stainless steel layer was selected with a thickness of 1 mm,
compared to typical bubble radii of 0.02 to 0.08 mm, depending on pressure and bulk flow
velocity. The ratio of the thickness to bubble radius is in the range of 12.5 to 50, which is
much larger than the 2.5 obtained from the model calculations. This result assures that the 1
mm thickness stainless steel is adequate to represent the characteristics of the stainless steel in
terms of flow boiling heat transfer.

127
The effect of bubble radius and heat flux was also numerically studied. Surface
temperature profiles on copper and stainless steel surfaces are shown in Figures 5.11 and 5.12,
respectively. The numerical solutions were obtained for a unit cell with radius of 0.1 mm,
layer thickness of 0.2 mm, and wall heat flux of 1×10⁵ W/m2. The bubble sizes explored
range from 0.02 mm to 0.08 mm. Equivalently, the ratio of bubble radius to unit cell radius
ranged from 0.2 to 0.8. The bubble heat transfer coefficient with different bubble sizes was
calculated from Equation (5-2). From Figure 5.11 and 5.12, the bubble radius shows a similar
effect on surface temperature profiles on both heating surface materials. For large bubble
sizes, the overall surface temperature is lower, which is shown in Figure 5.13. As discussed
above, the temperature on surfaces without bubble coverage is partially controlled by the
lateral heat conduction through the heating surface. With a larger bubble size, more surface
area is covered by the bubble and which provides a high heat transfer coefficient. The lateral
heat conduction resistance is also reduced due to a smaller lateral distance from the surface
area not covered by a bubble to the portion covered by a bubble. In addition, the comparison
between Figures 5.11 and 5.12 shows that the temperature profiles on both two surfaces are
almost identical for various bubble radii, while the temperature magnitudes are different. This
is explained by noting that current model is a steady-state model and the thermal conductivity
shows only in the boundary conditions while not in the governing equation. Figure 5.13 also
shows that the stainless steel surface temperature has a much stronger dependency on the
bubble radius as compared to the copper surface. On the copper surface, the average
temperature change with various bubble radii is within 0.1 K, while it’s about 2.5 K on the
stainless steel surface. This again is due to the high copper thermal conductivity, which
ensures better lateral heat conduction and, therefore, a lower overall surface temperature as
discussed previously. The surface temperature profiles on copper and stainless steel surfaces
with different wall heat fluxes are shown in Figure 5.14 and 5.15, respectively. The numerical
solutions are obtained in a unit cell with radius of 0.1 mm and thickness of 0.2 mm, and the
bubble size is set at a constant 0.02 mm. The wall heat flux ranges from 1×10⁵ to 5×10⁵ W/m2.
On both surfaces, it’s very clear that the overall temperature increases as the wall heat flux
128
increases. A linear relationship between surface temperature and the wall heat flux can be
found in Figure 5.16. Bubble sizes won’t remain constant as wall heat flux changes, the
numerical results presented here, however, still shed some light on the impact of wall heat
flux. This is not like the heating surface thickness and bubble radius, which have a stronger
impact on stainless steel surfaces than on copper surfaces. Heat flux shows a strong impact on
the surface temperature for both surfaces, as shown in Figure 5.16. This indicates that the
flow boiling process is a strongly wall heat flux dependent process.
In summary, a simplified mathematical model has been proposed in this chapter to
simulate steady-state heat conduction through the heating surface with bubble present. The
heat transfer governing equation was derived for a unit cell, for which the radius is calculated
from nucleation site density and the thickness is identical to the heating surface thickness. A
bubble is treated as a heat sink with a high heat transfer coefficient. Impacts of several key
parameters, such as heating surface material thermal conductivity, thickness, bubble size and
wall heat flux on the surface temperature were numerically studied. It’s found that with the
same wall heat flux and bubble size, a heating surface with higher thermal conductivity tends
to have a lower wall temperature due to better lateral heat conduction inside the heating block.
Also, as the heating surface thickness becomes large enough, or more specifically 2.5 times
the bubble radius, the thickness effect tends to be diminished. This finding again supports the
selection that the 1 mm thick stainless steel used in the experiments to test the stainless steel
material boiling heat transfer capacity is a good choice. The results also indicate that, both the
bubble radius and thickness show a stronger effect on a stainless steel surface than on a
copper one. This is mainly due to the much higher thermal conductivity of copper. The
numerical results also indicate that flow boiling is a strongly wall heat flux dependent process.
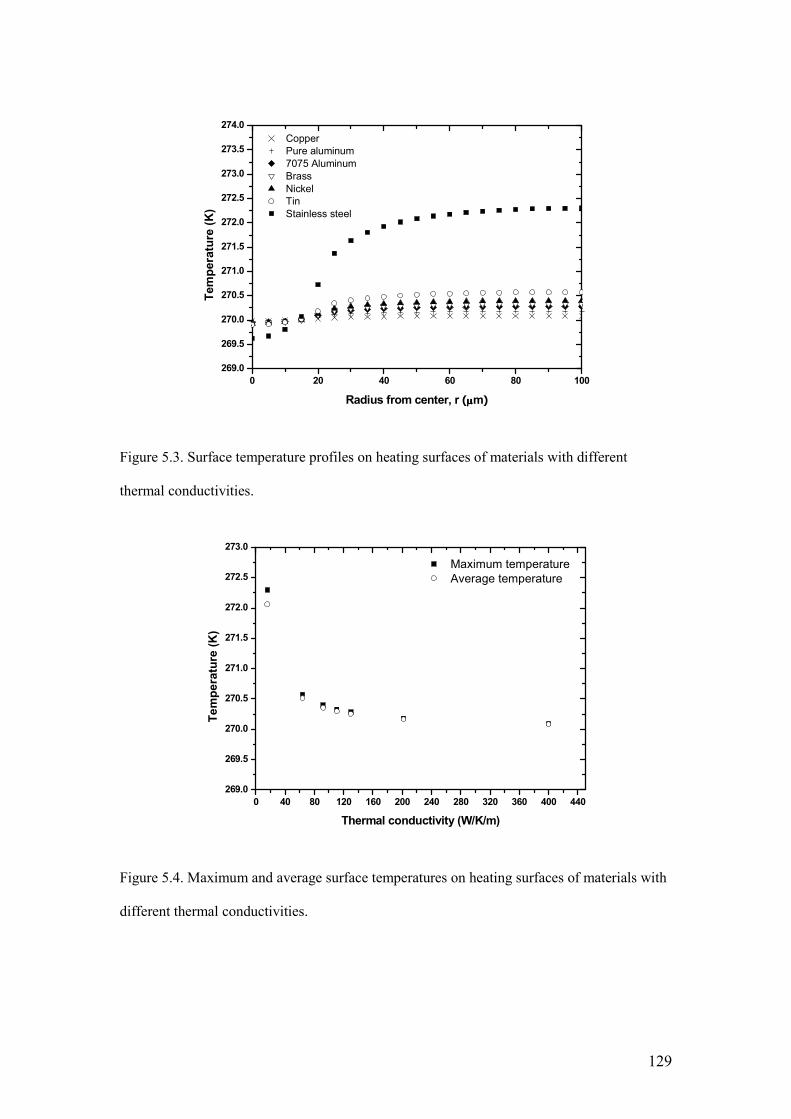
129
0 20 40 60 80 100
269.0
269.5
270.0
270.5
271.0
271.5
272.0
272.5
273.0
273.5
274.0
Copper
Pure aluminum
7075 Aluminum
Brass
Nickel
Tin
Stainless steelTemperature (K)
Radius from center, r (µµµµm)
Figure 5.3. Surface temperature profiles on heating surfaces of materials with different
thermal conductivities.
0 40 80 120 160 200 240 280 320 360 400 440
269.0
269.5
270.0
270.5
271.0
271.5
272.0
272.5
273.0
Maximum temperature
Average temperature
Temperature (K)
Thermal conductivity (W/K/m)
Figure 5.4. Maximum and average surface temperatures on heating surfaces of materials with
different thermal conductivities.

130
0 20 40 60 80 100
269.95
270.00
270.05
270.10
270.15
270.20
δ = 10 µm δ = 20 µm δ = 50 µm δ = 100 µm δ = 150 µm δ = 200 µm
Temperature (K)
Radius from center, r (µµµµm)
Figure 5.5. Surface temperature profiles on copper heating surfaces with different thicknesses.
0 40 80 120 160 200 240
270.04
270.06
270.08
270.10
270.12
270.14
270.16
270.18
270.20
270.22
270.24
Maximum temperature
Average temperature
Temperature (K)
Thickness (µµµµm)
Figure 5.6. Maximum and average surface temperatures profiles on copper heating surfaces
fordifferent thicknesses.

131
0 20 40 60 80 100
269
270
271
272
273
274
275
276
δ = 10 µm δ = 20 µm δ = 50 µm δ = 100 µm δ = 150 µm δ = 200 µm
Temperature (K)
Radius from center, r (µµµµm)
Figure 5.7. Surface temperature profiles on stainless steel heating surfaces for different
thicknesses.
0 40 80 120 160 200 240
271
272
273
274
275
276
Maximum temperature
Average temperature
Temperature (K)
Thickness (µµµµm)
Figure 5.8. Maximum and average surface temperatures on a stainless steel heating surfaces at
different thicknesses.

132
0 20 40 60 80 100
269.0
269.5
270.0
270.5
271.0
271.5
272.0
272.5
273.0
δ = 0 µm δ = 10 µm δ = 20 µm δ = 50 µm δ = 100 µm δ = 150 µm δ = 200 µm
Temperature (K)
Radius from center, r (µµµµm)
Figure 5.9. Surface temperature profiles on stainless steel heating surfaces with different
thickness on a copper base block.
0 40 80 120 160 200 240
270.0
270.4
270.8
271.2
271.6
272.0
272.4
272.8 Maximum temperature
Average temperature
Temperature (K)
Thickness (µµµµm)
Figure 5.10. Maximum and average surface temperatures over a stainless steel heating surface
with different thicknesses on a copper base block.

133
0 20 40 60 80 100
269.95
270.00
270.05
270.10
270.15
Rb/R
c = 0.2
Rb/R
c = 0.4
Rb/R
c = 0.6
Rb/R
c = 0.8
Temperature (K)
Radius from center, r (µµµµm)
Figure 5.11. Surface temperature profiles on a copper heating surface as bubble size changes.
0 20 40 60 80 100
269.0
269.5
270.0
270.5
271.0
271.5
272.0
272.5
273.0
Rb/R
c = 0.2
Rb/R
c = 0.4
Rb/R
c = 0.6
Rb/R
c = 0.8
Temperature (K)
Radius from center, r (µµµµm)
Figure 5.12. Surface temperature profiles on a stainless steel heating surface as bubble size
changes.

134
0.0 0.2 0.4 0.6 0.8 1.0
265
270
275
Copper, maximum temperature
Copper, average temperature
Stainless steel, maximum temperature
Stainless steel, average temperature
Temperature (K)
Rb/R
c Ratio
Figure 5.13. Maximum and average surface temperatures on both copper and stainless steel
surfaces as bubble size changes.
0 20 40 60 80 100
260
270
280
290
300
310
320
330
340
350
360
370
380
390
400 q" = 1x10
5 W/m
2
q" = 2x10⁵ W/m
2
q" = 3x10⁵ W/m
2
q" = 4x10⁵ W/m
2
q" = 5x10⁵ W/m
2
Temperature (K)
Radius from center, r (µµµµm)
Figure 5.14. Surface temperature profiles on a copper heating surface as wall heat flux
changes.

135
0 20 40 60 80 100
260
270
280
290
300
310
320
330
340
350
360
370
380
390
400
410
420 q" = 1x10
5 W/m
2
q" = 2x10⁵ W/m
2
q" = 3x10⁵ W/m
2
q" = 4x10⁵ W/m
2
q" = 5x10⁵ W/m
2
Temperature (K)
Radius from center, r (µµµµm)
Figure 5.15. Surface temperature profiles on a stainless steel heating surface as wall heat flux
changes.
0 1x10⁵
2x10⁵
3x10⁵
4x10⁵
5x10⁵
6x10⁵
260
280
300
320
340
360
380
400
Copper, maximum temperature
Copper, average temperature
Stainless steel, maximum temperature
Stainless steel, average temperature
Temperature (K)
Wall heat flux, q", (W/m2)
Figure 5.16. Maximum and average surface temperatures on both copper and stainless steel
surfaces as wall heat flux changes.
136
CHAPTER 6
CONCLUSION AND FUTURE WORK
6.1 CONCLUSION AND DISCUSSION
Subcooled flow boiling has been found to have a very high heat transfer capacity
while at low wall superheat. Subcooled flow boiling is especially of interest for nuclear
industry applications since it’s normally present in typical pressurized water reactor (PWR)
cores and plays an important role in cooling the rector core. Other than the high heat transfer
capacity, which is essential for nuclear reactor heat transfer, subcooled flow boiling is also of
interest since it has been identified as a possible reason for inducing the CRUD (Chalk River
Unidentified Deposits) layer found on fuel bundles. This layer potentially causes the
undesired reactor power shift, normally referred as axial offset anomaly (AOA). In addition,
the understanding of critical heat flux in subcooled flow boiling is critical for reactor safety
and design of nuclear reactors.
The objective of this thesis was to experimentally study subcooled flow boiling from
both macroscopic and microscopic points of view, through using a simulant coolant fluid,
R134a. The experimental work mainly included subcooled flow boiling performance,
nucleation site density and its distribution, and bubble dynamics. Nucleation site density, its
distribution and bubble size data have been obtained from images and videos taken using a
high-speed video camera. The subcooled flow boiling performance was directly estimated by
measuring wall temperature and wall heat flux, which was implemented by mounting
thermocouples into a heating block. The impact of thermal properties of surface materials on
boiling heat transfer was examined by employing two different heating blocks made of copper
and stainless steel, respectively. A simplified heat transfer model within the heating block was
proposed to explain the different flow boiling behaviors between these two materials.
The nucleation site density has been experimentally studied and measured for both
the copper and the stainless steel surfaces using a high-speed, high-fidelity video camera. The

137
nucleation site density data were correlated with wall superheat, critical cavity size and wall
heat flux. All these parameters showed good correlation with nucleation site density.
However, the wall superheat was not able to be correlated with nucleation site density data for
different system pressures. This leads to the selection of critical cavity size as the new
correlating parameter, to account for pressure effects. However, the critical cavity size does
not achieve success in correlating the data for both surface materials. The wall heat flux does
show good correlation with nucleation site density data for both surfaces.
The measured nucleation site distribution data was compared with a spatial Poisson
distribution. This data show good agreement with the spatial Poisson distribution by counting
nucleation site numbers in sub-domains. However, the comparison of the distribution of the
nearest-neighbor distance indicates the experimentally obtained nucleation site density has a
more uniform distribution than the spatial Poisson distribution. This is mainly due to
interactions of bubbles and nucleation sites, because boiling system bubbles tend to be self-
organized to cover as much heating surface area as possible. In addition, the copper surface
has a more uniform bubble site distribution than the stainless steel surface. This can be
explained by the interaction of nucleation sites due to lateral conduction inside the heating
block. The heating surface beneath a vapor bubble is cooled by the bubble, thus having a
relatively low temperature, and therefore another bubble can’t be activated inside under
influence of this existing bubble. The size of this low temperature zone is controlled by the
lateral heat conduction inside the solid heating block and consequently by material’s thermal
conductivity. As heating surface material’s thermal conductivity is higher, the size of this low
temperature zone is larger due to better lateral heat conduction, and therefore has a more
uniform nucleation site distribution.
Bubble dynamics is a very wide topic in a boiling system, especially in a flow boiling
system due to its complexity and nonlinearity. In flow boiling, a bubble begins from an
embryo and grows from this active nucleation site. After reaching a certain size, it departs and
then may slide from its original site. A sliding bubble generally coalesces with a bubble
downstream and lifts-off into the bulk flow. If heat fluxes are low, sliding bubbles may not

138
have a chance to coalesce before they lift-off. On the contrary, coalescence can happen before
a bubble starts to slide, due to high bubble number densities. There are also intense
interactions between bubbles and nucleation sites. A nucleation site can be activated or
deactivated by an adjacent bubble or a bubble sliding from upstream, which occasionally
happens. The bubble contact angle, or in other words, the surface wettability has also been
observed to have significant impact on bubble behaviors and consequently boiling heat
transfer. A high-speed digital camera has been used to visually study these bubble dynamics
during the flow boiling experiments. In this study, some of the important parameters, which
are directly related to boiling heat transfer capacity, were experimentally measured. Contact
angles were measured for both material heating surfaces at different system pressures. The
system pressure was found to have no apparent effect on the contact angle. The stainless
surface has a slightly larger contact angle than the copper surface. The bubble growth rate
was estimated by measuring bubble size at different times. It was found that Zuber’s model
fits the bubble growth experimental data to within a ±25% error. Again, the heating surface
material does not display a significant effect on the bubble growth rate. The bubble waiting
time was found to be negligible compared to bubble lifetime for both heating surfaces. With
respect to bubble departure size, both the average liquid bulk velocity and the system pressure
show significant effects. The comparison of bubble departure sizes for the two heating
surfaces indicates heating surface material has a minor effect on bubble departure sizes. As a
summary, copper and stainless steel heating surfaces were investigated with the same working
fluid, R134a. Both surfaces have the same surface finish and also exhibit similar wettabilities.
By comparing bubble parameters, it was found that the bubble dynamics are primarily
controlled by liquid thermal and hydraulic conditions, while the heating surface thermal
properties have a minor effect.
Flow boiling heat transfer performance on both the copper and the stainless steel
surfaces, including parametric studies, were experimentally carried out in this study.
Experimental data clearly show a trend that the copper surface has better performance than
the stainless steel surface in terms of both heat transfer coefficient and critical heat flux.
139
Parametric studies, such as effects of pressure, bulk liquid velocity, and inlet subcooling level
were also presented. The comparison between the current study and those of other researches
shows good agreement. From experimental results obtained in the current study, it was
concluded that heat flux is largely determined by nucleation site density. Also, the bubble
dynamics on both surfaces show almost identical characteristics. The difference of boiling
heat transfer between these two surfaces, however, raises a question as to what is the root-
cause for the difference. A possible explanation is that the lateral heat transfer just inside the
heating surface creates a non-uniform surface temperature distribution. This lateral heat
transfer is determined by the heating surface thermal properties, such as thermal conductivity
and thermal diffusivity, which are significantly different for the two heating surfaces
investigated. This suggests further model development is needed to investigate the heat
transfer inside the solid heating surface, from which a surface temperature profile can be
obtained. This may shed some light on the boiling heat transfer performance differences.
A model was then developed to simulate the heat transfer inside the heating block
when bubbles are present on the heating surface. On a heating surface, bubbles serve as a heat
sink with a high heat transfer coefficient due to phase change. The temperature beneath a
bubble, therefore, is expected to be low and close to the saturation temperature. The heating
surface without bubbles covering it is then controlled by two heat transfer mechanisms,
forced convection to the bulk flow and lateral heat conduction to the bubble covered region.
Compared to phase change during bubble growth, the forced convection is relatively
inefficient in transferring energy. If the thermal conductivity is sufficiently high, lateral heat
conduction can be even more important than forced convection in transferring energy from
the heating surface into the bulk flow. The results predicted by the model show that the
thermal conductivity plays an important role through lateral heat conduction inside the heater
block and, therefore, has a significant impact on boiling heat transfer performance.

140
6.2 FUTURE WORK
In this thesis work, copper and stainless steel heating surfaces with significantly
different thermal properties, such as thermal conductivity, were experimentally studied.
Experimental evidence shows that, , nucleation site density, bubbles growth rate and
departure sizes, do not display significant differences between the two heating surfaces
investigated. A further observation on contact angles of the working fluid, R134a, over the
heating surfaces, indicates that both materials have fairly similar wettabilities with the
working fluid. As discussed in previous chapters, similar bubble characteristics is mainly due
to their similar surface wettabilities, while their different boiling heat transfer is due to their
difference in thermal conductivity.
To further extend the current study, it’s proposed to explore the effects of surface
wettability on boiling heat transfer. The surface wettability may have two major effects on
boiling, including its effect on nucleation site density and bubble dynamics. This can be
visually observed with the techniques developed in the current and previous studies carried
out by our laboratory. A commonly used way to alter the surface wettability is to utilize a
nanocoating. The surface can be coated with either hydrophilic or hydrophobic material. As
described in chapter 3, a new heating block with a stainless steel heating surface was
manufactured separately for the current study. A similar approach can be used to prepare a
heating surface using nanocoatings. A hydrophilic surface tends to have smaller contact
angles, while a hydrophobic one tends to have larger contact angles, as shown in Figure 6.1.
Also, due to the different shapes of bubbles, it’s expected that bubbles will have different
sliding characteristics in flow boiling. Bubbles tend to have round shapes on hydrophilic
surfaces, while they tend to have flatter shapes on hydrophobic surfaces. Consequently,
bubble shape will have an effect on forces bubbles experience during their growth and sliding
phases. These forces include hydrostatic, hydrodynamic and surface tension, which are
impacted by bubble size and shape. The shape and size of bubbles on hydrophilic and
hydrophobic surfaces can be measured from images captured by the high-speed digital video
camera used in the current study. More detailed force analyses are required to understand

141
bubble behavior differences between these two kinds of surfaces. In addition, the contact
angle effect has been demonstrated to have an important effect on nucleation site density,
which is an essential parameter in determining boiling heat transfer coefficients. Nucleation
site densities can be measured by the methodology developed in this study, by taking bubble
emit images from a top view using the video camera.
Other than single bubble dynamics, bubble size and shape are expected to have
important impacts on multiple bubble interactions, such as bubbles coalescence and
nucleation site interactions. On hydrophilic surfaces, bubbles tend to have spherical shapes
and bubbles coalescence happens when two or more adjacent bubbles grow into contact. After
coalescence, large bubbles normally form and lift-off from the heating surface. Some recent
research (Phan 2009a) shows that on hydrophobic surfaces, vapor bubbles tend to coalescence
and attach onto the surface to form a vapor blanket. This will potentially influence the critical
heat flux as it’s known that during nucleate boiling the formation of vapor blankets might
trigger DNB (departure from nucleate boiling). Boiling heat transfer coefficients and critical
heat fluxes can be experimentally measured at nominal pressures and temperatures in the
Freon loop used in the current thesis study.
In addition, model development work study heat transfer near a growing bubble,
including the heat transfer inside the heating block, in the fluid region near the bubble base,
the evaporation in the microlayer beneath a bubble and a potential condensation on the apex
of a bubble. The heat transfer in the solid and liquid phases is dominant by heat conduction
and can be described by two-dimensional Laplace formulations. On the liquid-solid interface,
energy conservation has to be satisfied. On the liquid-vapor interface, a similar boundary
condition will be applied, except that the heat transfer is either by evaporation or
condensation. Moreover, it’s generally hypothesized that a liquid microlayer is present
beneath a growing bubble and evaporation takes place on the interface between this
microlayer and the vapor bubble. With these more advanced features, the model may be able
to predict a more complete picture of heat transfer near a bubble. Comparing the model
developed in the current study, the proposed modeling may provide better understanding of

142
bubble behavior and a more accurate prediction on the effect of bubbles on heat transfer from
the heating block. Such a model may provide more insight into the differences between
hydrophilic and hydrophobic surfaces.
Figure 6.1, Bubbles on hydrophilic and hydrophobic surfaces.

143
REFERENCE
Akshoy Ranjan, P., Sanchayan, M. and Pijush, R. 2005. Mechanical science: Engineering
thermodynamics and fluid mechanics. New Delhi: Prentice-Hall of India Private
Limited.
Bankoff, S.G. 1958. Entrapment of gas in the spreading of a liquid over a rough surface.
A.I.Ch.E. Journal 4:24-26
Bang, I.C., Chang, S.H., and Baek, W.P. 2004. Visualization of the subcooled flow boiling of
R-134a in a vertical rectangular channel with an electrically heated wall.
International Journal of Heat and Mass Transfer 47:4349-4363.
Basu, N., Warrier, G.R., and Dhir, V.K. 2002. Onset of nucleate boiling and active nucleation
site density during subcooled flow boiling. Journal of Heat Transfer 124:717-728.
Basu, N., Warrier, G.R., and Dhir, V.K. 2005a. Wall heat flux partitioning during subcooled
flow boiling: Part 1-Model development. Journal of Heat Transfer 127(2):131-140.
Basu, N., Warrier, G.R., and Dhir, V.K. 2005b. Wall heat flux partitioning during subcooled
flow boiling: Part 2-Model validation. Journal of Heat Transfer 127(2):141-148.
Benjamin, R.J. and Balakrishnan, A.R. 1997. Nucleation site density in pool boiling of
saturated pure liquids: Effect of surface microroughness and surface and liquid
physical properties. Experimental Thermal and Fluid Science 15:32-42.
Berenson, P.J. 1962. Experiments on pool-boiling heat transfer. International Journal of Heat
and Mass Transfer 5:985-999.
Bergles, A.E. and Rohsenow, W.M. 1964. The determination of forced-convection surface-
boiling heat transfer. Journal of Heat Transfer 86:365-372.
Bier, K., Gorenflo, D., Salem, M. and Tanes, Y. 1978. Pool boiling heat transfer and size of
active nucleation centers for horizontal plates with different surface roughness.
Paper presented at Proceedings of the 6th International Heat Transfer Conference,
Vol. 1:151–156. August 7-11, in Toronto, Canada.

144
Bliss, F.E., Jr., Hsu, S.T., and Crawford, M. 1969. An investigation into the effects of various
platings on the film coefficient during nucleate boiling from horizontal tubes.
International Journal of Heat and Mass Transfer 12:1061-1072.
Bonilla, C.F. and Perry, C.W. 1941. Heat transmission to boiling binary liquid mixtures,
Trans. AIChE, Vol. 37:685-705.
Bowring, R.W. 1962. Physical model based on bubble detachment and calculation of steam
voidage in the subcooled region of a heated channel. OECD Halden Reactor
Project Report HPR-10.
Calka, A. and Judd, R.L. 1985. Some aspects of the interaction among nucleation sites during
saturated nucleate boiling. Int. J. Heat Mass Transfer 28(12):2331-2342.
Chekanov, V.V. 1977. Interaction of centers in nucleate boiling. High Temp. Phys. 15:101-
106. (Translated from Teplofizika Vysokikh Temperatur. 15(1):121-128. 1977)
Chai, L.H. 2004. A theoretical analysis of bubble interaction in boiling systems. International
Journal of Thermal Sciences 43(11):1067-1073.
Chai, L.H., Peng, X.F. and Wang, B.X. 2000. Nucleation site interaction during boiling.
International Journal of Heat and Mass Transfer 43:4249-4258.
Chang, S.H., Bang, I.C., and Baek, W.P. 2002. A photographic study on the near-wall bubble
behavior in subcooled flow boiling. Int. J. Therm. Sci. 41:609-628.
Chen, J.C. 1966. Correlation for boiling heat transfer to saturated liquids in convective flow.
Int. Eng. Chem. Process Design and Development 5:322-329.
Cole, R. 1960. A photographic study of pool boiling in the region of critical heat flux.
A.I.Ch.E. Journal 6:533-538.
Cole, R., and Shulman, H.L. 1966. Bubble departure diameters at subatmospheric pressures.
Chem. Eng. Prog. Symp. Ser. 62:6-16.
Cole, R. 1967. Frequency and departure diameter at sub-atmospheric pressures. A.I.Ch.E.
Journal 13:779-783.
Cole, R. and Rohsenow, W.M. 1968. Correlation of bubble departure diameters for boiling of
saturated liquids. Chem. Eng. Prog. Symp. Ser. 65:211-213.

145
Collier, J.G. and Thome, J.R., Convective boiling and condensation, 3rd edition, Oxford
University Press, 1996.
Cooper, M.G. 1984. Saturation nucleate boiling, a simple correlation. Paper presented at the
1st U.K. Natn. Conf. on Heat Transfer, July 3-5, in University of Leeds.
Cornwell, K. and Brown, R.D. 1978. Boiling surface topography. Paper presented at
Proceedings of the 6th International Heat Transfer Conference, Vol. 1:157–161.
August 7-11, in Toronto, Canada.
Donnelly, B., O’Donovan, T.S., and Murray, D.B. 2009. Surface heat transfer due to sliding
bubble motion. Applied Thermal Engineering 29(7):1319-1326.
Del Valle M., V.H. and Kenning, D.B.R. 1985. Subcooled flow boiling at high heat flux. Int.
J. Heat Mass Transfer 28(10):1907-1920.
Dittus, F.W. and Boelter, L.M.K. 1930. Heat transfer in automobile radiators of the tubular
type. University of California Publication in Engineering 2:443-446.
Eddington, R.I. and Kenning, D.B.R. 1978. The prediction of flow boiling bubble populations
from gas bubble nucleation experiments. Paper presented at Proceedings of the 6th
International Heat Transfer Conference, Vol. 1:275–280. August 7-11, in Toronto,
Canada.
Eddington, R.I., Kenning, D.B.R., and Korneichev, A.I. 1978. Comparison of gas and vapor
bubble nucleation on a brass surface in water. Int. J. Heat Mass Transfer 21(7):855-
862.
Eddington, R.I. and Kenning, D.B.R. 1979. The effect of contact angle on bubble nucleation.
Int. J. Heat Mass Transfer 22(8):1231-1236.
Farber, E.A. and Scorah, R.L. 1968. Heat transfer to water boiling under pressure. Trans
ASME, Vol. 70:369-384.
Gaertner, R.F. and Westwater, J.W. 1963. Population of active sites in nucleate boiling heat
transfer. Chem. Eng. Prog. Symp. Ser. 56(30):39-48.
Gaertner, R.F. 1963. Distribution of active sites in the nucleate boiling of liquids. Chem. Eng.
Prog. Symp. Ser. 59(41):52-61.

146
Gnielinski, V. 1976. New equations for heat and mass transfer in turbulent pipe and channel
flow. International Chemical Engineering 16:359-368.
Golobič, I. and Gjerkeš. H. 2001. Interactions between laser-activated nucleation sites in pool
boiling. International Journal of Heat and Mass Transfer 44:143-153.
Gorenflo, D., Chandra, U., Kotthoff, S., and Luke, A. 2004. Influence of thermophysical
properties on pool boiling heat transfer of refrigerants. Int. J. Refrig. 27:492-502.
Griffith, P. and Wallis, J.D. 1960. The role of surface conditions in nucleate boiling. Chem.
Eng. Prog. Symp. Ser. 56(30):49-63.
Hardenberg, J.V., Kenning, D.B.R., Xing, H. and Smith, L.A. 2004. Identification of
nucleation site interactions. International Journal of heat and Fluid Flow 25:298-
304.
Han, C.Y. and Griffith, P. 1965. The mechanism of heat transfer in nucleate pool boiling-Part
I, Bubble initiation, growth and departure. Int. J. heat Mass Transfer 8:887-904.
Hibiki, T. and Ishii, M. 2003. Active nucleation site density in boiling system. International
Journal of Heat and Mass Transfer 46:2587-2601.
Hsu, Y.Y. 1962. On the size range of active nucleation cavities on a heating surface. Journal
of Heat Transfer 84:207-212.
Jens, W.H. and Lottes, P.A. 1951. Analysis of heat transfer burnout, pressure drop and
density data for high pressure water. USAEC Rep. ANL-4627.
Judd, R. L. and Lavdas, C.H. 1980. The nature of nucleation site interaction. Journal of Heat
Transfer 102:461-464.
Judd, R.L. and Chopra, A. 1993. Interaction of nucleation processes occurring at adjacent
nucleation sites. Journal of Heat Transfer 115:955-962.
Judd, R.L. 1988. On nucleation site interaction. Journal of Heat Transfer 110:475-478.
Kandlikar, S.G. 1990. A general correlation for saturated two-phase flow boiling heat transfer
inside horizontal and vertical tubes. Journal of Heat Transfer 112(1):219-228.
147
Kandlikar, S.G. 1991. Development of a flow boiling map for subcooled and saturated flow
boiling of different fluids inside circular tubes. Journal of Heat Transfer
113(1):190-200.
Kandlikar, S.G. 1997. Further development in subcooled flow boiling heat transfer. Paper
presented at the Engineering Foundation Conference on Convective and Pool
Boiling, May 18-25, in Irsee, Germany.
Kandlikar, S.G. 1998. Heat transfer characteristics in partial boiling, fully developed boiling,
and significant void flow regions of subcooled flow boiling. Journal of Heat
Transfer 120(2):395-401
Kandlikar, S.G., Mizo, V., Cartwright, M., and Ikenze, E. 1997. Bubble nucleation and
growth characteristics in subcooled flow boiling of water. Paper presented at the
National Heat Transfer Conference Volume 4. HTD-Vol. 342:11-18
Kenning, D.B.R. and Del Valle M., V.H. 1981. Fully-developed nucleate boiling: Overlap of
areas of influence and interference between bubble sites. Int. J. Heat Mass Transfer
24(6):1025-1032.
Klausner, J.F., Mei, R., Bernhard, D.M. and Zeng, L.Z. 1993. Vapor bubble departure in
forced convection boiling. Int. J. Heat Mass Transfer 36(3):651-662.
Kocamustafaogullari, G. and Isshi, M. 1983. Interfacial area and nucleation site density in
boiling system. Int. J. Heat Mass Transfer 26:1377-1387.
Kutateladze, S.S. 1961. Boiling heat transfer. Int. J. Heat Mass Transfer 4:31-45.
Liu, Z. and Winterton, R.H.S. 1989. A general correlation for saturated and subcooled flow
boiling in tubes and annuli, based on a nucleate pool boiling equation. Int. J. Heat
Mass Transfer 34:2759-2766.
Mikic, B.B., Rohsenow, W.M., and Griffith, P. 1970. On bubble growth rates. Int. J. Heat
Mass Transfer 13:657-666.
McAdams, W.H., Minden, C.S., Carl, R., Picornell, D.M., and Dew, J.E. 1949. Heat transfer
at high rates to water with surface boiling. Ind. Eng. Chem. 41:1945-1953.

148
Mallozzi, R., Judd, R.L., and Balakrishnan, N. 2000. Investigation of randomness, overlap
and the interaction of bubbles forming at adjacent nucleation sites in pool boiling.
International Journal of Heat and Mass Transfer 43:3317-3330.
Mosdorf, R. and Shoji, M. 2004. Chaos in nucleate boiling – nonlinear analysis and modeling.
International Journal of Heat and Mass Transfer 47:1515-1524.
Mosdorf, R. and Shoji, M. 2008. Hydrodynamic aspects of interaction between nucleation
sites. International Journal of Heat and Mass Transfer 51:3378-3386.
Mei, R., Chen, W.C., and Klausner, J.F. 1995a. Vapor bubble growth in heterogeneous
boiling – I. Formulation. Int. J. Heat Mass Transfer 38(5):909-919.
Mei, R., Chen, W.C., and Klausner, J.F. 1995b. Vapor bubble growth in heterogeneous
boiling – I. Growth rate and thermal fields. Int. J. Heat Mass Transfer 38(5):921-
934.
Mikic, B.B. and Rohsenow, W.M. 1969. A new correlation of pool boiling data including the
effect of heating surface characteristics. Journal of Heat Transfer 91:245-250.
Petukhov, B.S. and Popov, V.N. 1963. Theoretical calculation of heat exchange in turbulent
flow in tubes of an incompressible fluid with variable physical properties. High
Temp. 1:69-83.
Phan, H.T., Caney, N., Marty, P., Colasson, S., and Gavillet. J. 2009a. How does surface
wettability influence nucleate boiling? C. R. Mecanique 337:251-259.
Phan, H.T., Caney, N., Marty, P., Colasson, S., and Gavillet. J. 2009b. Surface wettability
control by nanocoating: The effects on pool boiling heat transfer and nucleation
mechanism International Journal of Heat and Mass Transfer 52:5459-5471.
Plesset, M.S. and Zwick, S.A. 1952. A nonsteady heat diffusion problem with spherical
symmetry. Journal of Applied Physics 23:95-98.
Plesset, M.S. and Zwick, S.A. 1954. The growth of vapor bubble in superheated liquids.
Journal of Applied Physics 25:493-500.
149
Podowski, M.Z. and Podowski, R.M. 2009. Mechanistic multidimensional modeling of forced
convection boiling heat transfer. Science and Technology of Nuclear Installations,
Volume 2009, Article ID 387020, Hindawi Publishing Corporation.
Podowski, R.M., Drew, D.A., Lahey Jr., R.T., and Podowski, M.Z. 1997. A mechanistic
model of the ebullition cycle in forced convection subcooled boiling, in: Eight
International Topical Meeting on Nuclear Reactor Thermal-Hydraulics 3:1535–
1542.
Prodanovic, V., Fraser, D., and Salcudean, M. 2002. Bubble behavior in subcooled flow
boiling of water at low pressures and low flow rates. International Journal of
Multiphase Flow 28(1):1-19.
Qi, Y.S., Klausner, J.F., and Mei, R. 2004. Role of surface structure in heterogeneous
nucleation. International Journal of Heat and Mass Transfer 47:3097-3107.
Rayleigh, L. 1917. On the pressure developed in a liquid during the collapse of a spherical
cavity. Phil. Mag. 34:94-98.
Ribatski, G. and Saiz Jabardo, J.M. 2003. Experimental study of nucleate boiling of
halocarbon refrigerants on cylindrical surfaces. Int. J. Heat Mass Transfer 46:4439-
4451.
Rohsenow, W.M. 1952. A method of correlating heat transfer data for surface boiling liquids.
J. Heat Transfer 74:969-976.
Shoji, M. 2004. Studies of boiling chaos: a review. International Journal of Heat and Mass
Transfer 47:1105-1128.
Shah, M.M. 1976. A new correlation for heat transfer during boiling flow through pipes.
ASHRAE Trans. 82:66-86.
Shah, M.M. 1977. A general correlation for heat transfer during subcooled boiling in pipes
and annuli. ASHRAE Trans. 83:205-215.
Shah, M.M. 1982. Chart correlation for saturated boiling heat transfer: Equations and further
study. ASHRAE Trans. 88:185-196.
150
Sateesh, G., Das, S.K., and Balakrishnan, A.R. 2005. Analysis of pool boiling heat transfer:
effect of bubbles sliding on the heating surface. International Journal of Heat and
Mass Transfer 48:1543-1553.
Thorncroft, G.E. and Klausner, J.F. 1999. The influence of vapor bubble sliding on forced
convection boiling heat transfer. Journal of Heat Transfer 121:73-79.
Thom, J.R.S., Walker, W.M., Fallon, T.A., and Reising, G.F.S. 1965. Boiling in subcooled
water during flow up heated tubes or annuli. Paper presented at the Symposium on
Boiling Heat Transfer in Steam Generating Units and Heat Exchanger held by Inst.
Mech. Engrs., September 15-16, in Manchester, England.
Tong, L.S. and Tang, Y.S., Boiling heat transfer and two-phase flow, Taylor and Francis,
1997.
Vadgama, B. and Harris, D.K. 2007. Measurements of the contact angle between R134a and
both aluminum and copper surfaces. Experimental Thermal and Fluid Science
31:979-984.
Wang, C.H. and Dhir, V.K. 1993a. Effect of surface wettability on active nucleation site
density during pool boiling of saturated water. Journal of Heat Transfer 115:659-
669.
Wang, C.H. and Dhir, V.K. 1993b. On the gas entrapment and nucleation site density during
pool boiling of saturated water. Journal of Heat Transfer 115:670-679.
Wu, J.Y., Farouk, T. and Ward, C.A. 2007. Pressure dependence of the contact angle. J. Phys.
Chem. B 111:6189-6197.
Wu, W. 2007, Combined Modeling and Experimental Validation of Boiling Curve and
Critical Heat Flux, Ph.D Thesis, University of Illinois at Urbana-Champaign.
Yan, Y., Kenning, D.B.R., and Cornwell, K. 1997. Sliding and sticking vapor bubbles under
inclined plane and curved surfaces. International Journal of Refrigeration 20:583-
591.

151
Yang, S.R. and Kim, R.H. 1988. A mathematical-model of the pool boiling nucleation site
density in terms of the surface characteristics. Int. J. Heat Mass Transfer 31:1127-
1135.
Zeng, L.Z., Klausner, J.F., and Mei, R. 1993. A unified model for the prediction of bubble
detachment diameters in boiling systems— I. Pool boiling. Int. J. Heat Mass
Transfer 36(9):2261-2270.
Zeng, L.Z., Klausner, J.F., Bernhard, D.M., and Mei, R. 1993. A unified model for the
prediction of bubble detachment diameters in boiling systems— I. Flow boiling. Int.
J. Heat Mass Transfer 36(9):2271-2279.
Zeng, L.Z. and Klausner, J.F. 1993. Nucleation site density in forced convection boiling.
Journal of Heat Transfer 115(1):215-221.
Zuber, N. 1961. The dynamics of vapor bubbles in nonuniform temperature fields. Int. J. Heat
Mass Transfer 2:83-98.

152
AUTHOR’S BIOGRAPHY
Ling Zou was born in Jiangxi Province, P. R. China on July 06, 1980. He received a
Bachelor of Science degree in Engineering Physics from Tsinghua University in July 2000.
He then received a Master of Science degree in Nuclear Engineering from China Institute of
Atomic Energy in July 2003. After that, he shortly worked in China Institute of Atomic
Energy before he was enrolled as a graduate student for his Ph.D. study in the Department of
Nuclear, Plasma and Radiological Engineering at University of Illinois at Urbana-Champaign.


![Application of Boiling Heat Transfer to High-Heat-Flux · PDF file127 Suzuki et al.: Application of Boiling Heat Transfer (1/7) [Tutorial Paper] Application of Boiling Heat Transfer](https://img.pdfslide.net/doc/110x75/5ab004da7f8b9aa8438e12d1/application-of-boiling-heat-transfer-to-high-heat-flux-suzuki-et-al-application.jpg)


![Flow boiling heat transfer of HFO1234yf and HFC32 ... boiling heat transfer of... · boiling heat transfer coefficient is calculated from the pool boiling correlation of Cooper [7]](https://img.pdfslide.net/doc/110x75/6060f16e796df51c036c4972/flow-boiling-heat-transfer-of-hfo1234yf-and-hfc32-boiling-heat-transfer-of.jpg)