Embed Size (px)
Citation preview

Accepted Manuscript
Experimental study on the stability of plate anchors in clay undercyclic loading
Long Yu, Qi Zhou, Jun Liu
PII: S2095-0349(15)00020-3DOI: http://dx.doi.org/10.1016/j.taml.2015.02.005Reference: TAML 19
To appear in: Theoretical and Applied Mechanics Letters
Received date: 23 October 2014Accepted date: 29 December 2014
Please cite this article as: L. Yu, Q. Zhou, J. Liu, Experimental study on the stability of plateanchors in clay under cyclic loading, Theoretical and Applied Mechanics Letters (2015),http://dx.doi.org/10.1016/j.taml.2015.02.005
This is a PDF file of an unedited manuscript that has been accepted for publication. As aservice to our customers we are providing this early version of the manuscript. The manuscriptwill undergo copyediting, typesetting, and review of the resulting proof before it is published inits final form. Please note that during the production process errors may be discovered whichcould affect the content, and all legal disclaimers that apply to the journal pertain.

Manuscript submitted to Theoretical & Applied Mechanics Letters
1
Special Issue: Offshore Structure-Soil Interaction
Experimental study on the stability of plate anchors
in clay under cyclic loading
Long Yu,1, a) Qi Zhou, 1, b) and Jun Liu 1, c)
1) State Key Laboratory of Coastal and Offshore Engineering, Dalian University of Technology, Dalian 116024, China
a) Corresponding author. Email: [email protected].
b) Email: [email protected]
c) Email: [email protected].
Abstract Although the bearing capacity of plate anchors in clay has been studied extensively, the results considering the effects of offshore cyclic loading are relatively rare. In the present study, 1 g model tests are carried out to investigate the effect of cyclic loading on the bearing capacity of plate anchors in clay. The ultimate pullout capacity of plate anchors in clay decreases as the accumulated plastic shear strain grows due to the strain-softening of clay under cyclic loading. The load-displacement curves of these tests are presented and the effects of overburden stress and cyclic loading amplitude on the strain-softening behavior are discussed. Keywords Plate anchor, clay, cyclic loading, strain softening
Plate anchors have been commonly used to provide pullout resistance for many engineering structures, such as transmission towers and earth retaining walls. Providing mooring system of offshore floating facilities with a simple and economical foundation, plate anchors have been increasingly used in offshore oil/gas exploration[1].
During the past decades, considerable efforts have been made to estimate the pullout capacity of plate anchors under monotonic conditions, which includes model test studies of Das and co-workers[2-5] and Meyerhof[6], numerical studies of Rowe and Davis[7], Merifield and co-workers[1,
8, 9] and Yu et al.[10]. However, these studies are limited to static analysis and the effects of cyclic loading on the pullout capacity of plate anchors are not very clear.
In order to take into account the combination of static and cyclic loads in evaluation of the bearing capacity of foundations, Andersen[11, 12] carried out numerous direct simple shear (DSS) tests and triaxial tests to simulate the simplified stress conditions in the soil beneath the platform for a few typical elements along a potential failure surface. Thus the relationship between cyclic shear strength and number of cycles, average shear stress, overconsolidation ratio, cyclic shear stress was established, which can be used to determine the critical failure surface. Similarly, Wang[13] took the octahedral shear stress as the failure criteria of soil elements, simplifying the effect of cyclic loading as the softening of equivalent cyclic strength to evaluate the bearing capacity of foundations. Zhou & Randolph[14, 15] provided numerical investigations into soil characteristics, and presented an equation to reflect the effect of strain rate and strain softening on the value of undrained shear strength.
Datta et al.[16] carried out experimental model tests to study the effects of mean load and the

2
cyclic amplitude on the permanent anchor movement and post-cyclic static pullout capacity. Singh and Ramaswamy[17, 18] studied the effects of cyclic frequency and pre-loading on the behavior of circular plate anchors in clay. All these studies are in the scale of model test, i.e., the stress level is obviously lower than that in the field.
This paper presents the model test results of one low stress level test and two high stress level tests on plate anchors in overconsolidated kaolin clay. The strain-softening behavior of plate anchors in clay owing to disturbance of the cyclic loading was focused on.
The model tests were carried out in kaolin clay consolidated from slurry in a tank of 800 mm in height, 700 mm in length and 220 mm in width. The schematic layout of the consolidation setup is shown in Fig. 1 (a). The end of lever can be adjusted manually to different height according to the settlement of the soil specimen to keep approximately horizontal.
Plate
Soil
Drainage hole
Load
Guide rod Lever
Consolidation tank
Height adjustment hole
CameraImages acquisition
system
Force transducer
Loading system
Control system
Guide frame
Connecting rod
Test chamber
Soil
Air bag
Plate anchor
(a) (b)
Fig. 1. Schematic layout of the experimental set-up. (a) Clay consolidation. (b) Cyclic loading test
The experimental set-up of the cyclic test is shown in Fig. 1 (b). The model plate anchor (made of steel, 210 mm long, 50 mm wide, and 20 mm thick) is pre-embedded in the chamber. The length of the anchor is designed to exactly fit the width of the chamber, but with very slight gaps to avoid being stuck by the walls during loading. The overburden pressure was added to the soil surface by an air bag.
Hebei kaolin clay was used in this study. The liquid and plastic limits are 58% and 27% respectively. Homogeneous and deaired slurry at a moisture of 116% (two times the liquid limit), was prepared in a ribbon-blade mixer equipped with a vacuum pump. After mixed for at least 5 hours, the slurry was pumped into the consolidation tank. The consolidation pressure was increased by 3 kPa in each step. The consolidation after each load increment is assumed to finish when the settlement of the sample is lower than 1.0 mm during 24 hours. The total time required for consolidation, which depends on the final consolidation pressure, was about 25 days. It should also be noted that the model plate anchor was manually placed into the slurry after a certain period of consolidation when the clay was soft enough to let the anchor in but strong enough to avoid further settlement due to the self-weight of the plate anchor.
A T-bar penetrometer of diameter 5 mm and length 20 mm and a plate-bar penetrometer of diameter 12 mm were used to determine the shear strength profile of the kaolin clay before the loading of anchor. These tests were all conducted at a rate of 0.2 mm/s which equals to the loading rate of the plate anchor in Tests 2 and 3. It is assumed that the loading rate is low enough to get rid of the dynamic influence. Note that there is a limitation of the travel range of the loading hydro-cylinder.
2
Manuscript submitted to Theoretical & Applied Mechanics Letters
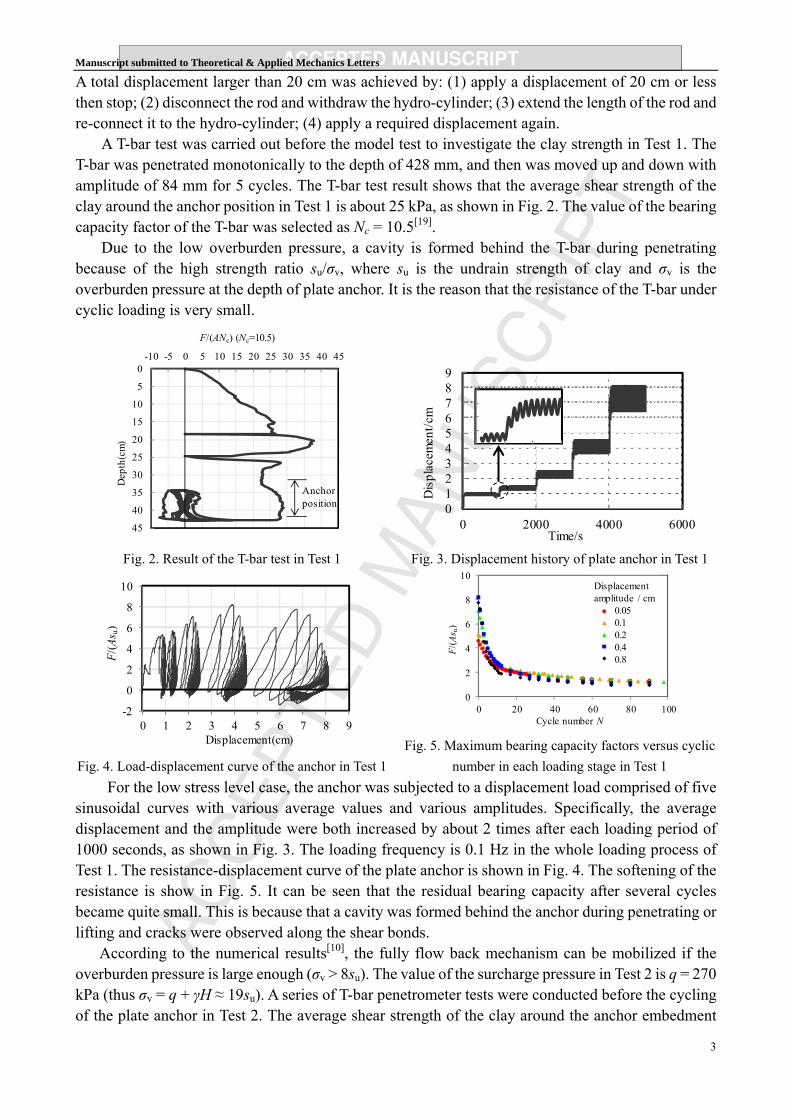
A total displacement larger than 20 cm was achieved by: (1) apply a displacement of 20 cm or less then stop; (2) disconnect the rod and withdraw the hydro-cylinder; (3) extend the length of the rod and re-connect it to the hydro-cylinder; (4) apply a required displacement again.
A T-bar test was carried out before the model test to investigate the clay strength in Test 1. The T-bar was penetrated monotonically to the depth of 428 mm, and then was moved up and down with amplitude of 84 mm for 5 cycles. The T-bar test result shows that the average shear strength of the clay around the anchor position in Test 1 is about 25 kPa, as shown in Fig. 2. The value of the bearing capacity factor of the T-bar was selected as Nc = 10.5[19].
Due to the low overburden pressure, a cavity is formed behind the T-bar during penetrating because of the high strength ratio su/σv, where su is the undrain strength of clay and σv is the overburden pressure at the depth of plate anchor. It is the reason that the resistance of the T-bar under cyclic loading is very small.
Fig. 2. Result of the T-bar test in Test 1
0123456789
0 2000 4000 6000Time/s
Dis
plac
emen
t/cm
Fig. 3. Displacement history of plate anchor in Test 1
-2
0
2
4
6
8
10
0 1 2 3 4 5 6 7 8 9Displacement(cm)
F/(A
s u)
Fig. 4. Load-displacement curve of the anchor in Test 1
0
2
4
6
8
10
0 20 40 60 80 100
Displacement amplitude / cm
0.050.10.20.40.8
Cycle number N
F/(A
s u)
Fig. 5. Maximum bearing capacity factors versus cyclic
number in each loading stage in Test 1
0
5
10
15
20
25
30
35
40
45
-10 -5 0 5 10 15 20 25 30 35 40 45
Dep
th(c
m)
F/(ANc) (Nc=10.5)
Anchor position
For the low stress level case, the anchor was subjected to a displacement load comprised of five sinusoidal curves with various average values and various amplitudes. Specifically, the average displacement and the amplitude were both increased by about 2 times after each loading period of 1000 seconds, as shown in Fig. 3. The loading frequency is 0.1 Hz in the whole loading process of Test 1. The resistance-displacement curve of the plate anchor is shown in Fig. 4. The softening of the resistance is show in Fig. 5. It can be seen that the residual bearing capacity after several cycles became quite small. This is because that a cavity was formed behind the anchor during penetrating or lifting and cracks were observed along the shear bonds.
According to the numerical results[10], the fully flow back mechanism can be mobilized if the overburden pressure is large enough (σv > 8su). The value of the surcharge pressure in Test 2 is q = 270 kPa (thus σv = q + γH ≈ 19su). A series of T-bar penetrometer tests were conducted before the cycling of the plate anchor in Test 2. The average shear strength of the clay around the anchor embedment
3

4
depth is approximately 15 kPa. In Test 2, the anchor was uplifted for 48 mm and then pushed back to the initial position, and
repeated 9 times. The resistance response of the plate anchor in Test 2 is shown in Fig. 6. It can be seen that the result of Test 2 shows much more obvious hysteresis behavior by comparison with that of Test 1.
The softening behavior of the resistance response in Test 2 is shown in Fig. 7. The maximum resistance in the second cycle is 88% of the resistance at the end of the lifting in the first cycle. In the last cycle, the maximum resistance is 72% of the maximum resistance in the first cycle. Note that in Test 1 (low stress level) the maximum resistance in the last cycle is only 15% - 30% of the maximum resistance in the first cycle.
-16-12
-8-4048
12
0 1 2 3 4
F/(A
s u)
Displacement(cm)5
Fig. 6. Load-displacement curves of Test 2
02468
101214
0 2 4 6 8 10 12 14 16 18 20N
c
Cycle number N
Test 2Numerical 1Numerical 2
1 2 3 4 5 6 7 8 9
Fig. 7. Maximum bearing capacity factors versus cyclic
number in each loading stage in Test 2
A numerical simulation of the result of Test 2 is carried out using the strain-softening model of FLAC. The softening behavior of the clay is governed by Eq. (1) [14, 15], where δrem is the residual shear strength of fully remolded soil, ξ/ξ95 is the ratio between the present accumulated strain and that of 95% remolded soil, su0 is the strength before any remolding. Only the first two loading cycles are simulated. The minimum element size of the mapped mesh is 0.125 m in width. The width of plate anchor is 4 m. The embedment depth of the anchor is 40 m. The clay density is 1000 kg/m3 and the cohesion is 25 kPa. Thus γH/su0 = 16, making sure that the full localized failure mechanism would occur.
( ) 95301u rem rem us e sξ ξδ δ −⎡ ⎤= + − ⋅⎣ ⎦ . (1)
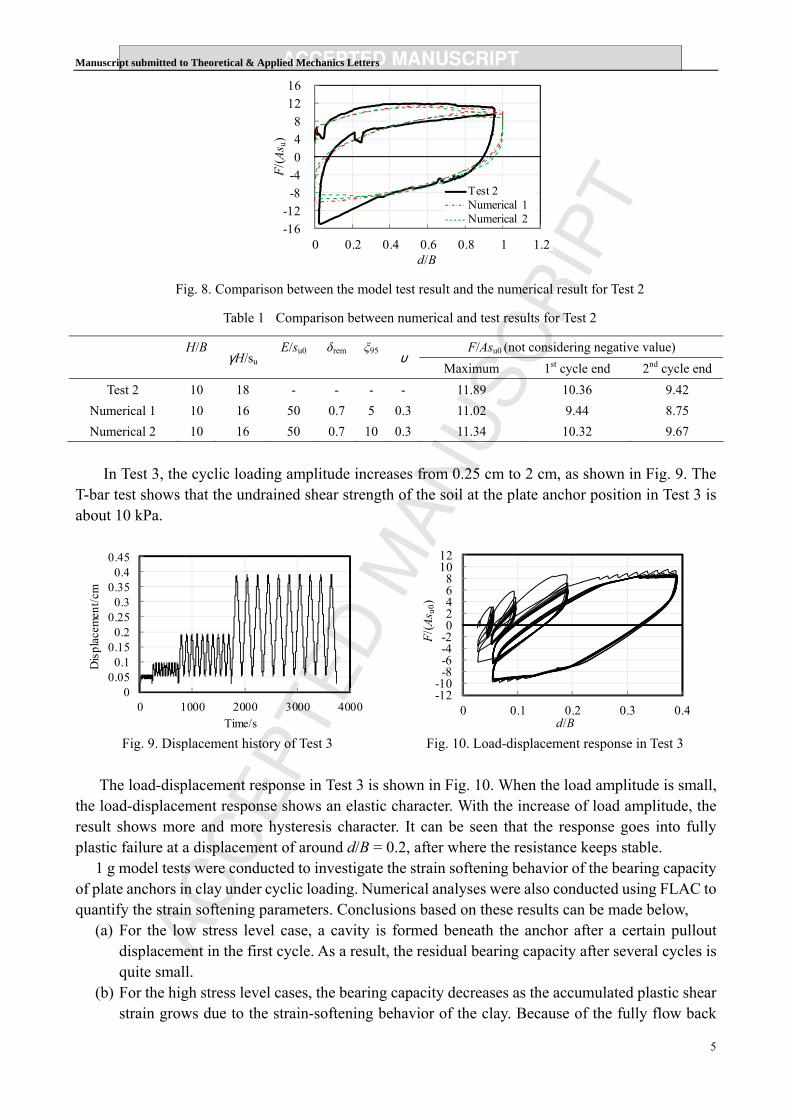
The comparison of the model test result and the numerical results is demonstrated in Fig. 8. Various values of ξ95 and δrem have been tried. The strain-softening of plate anchor of model Test 2 agrees well with the numerical curves as the ultimate capacity of the plate anchor is continually softening during the first two uplifting stages. It can be concluded that the strain-softening model in FLAC can approximately reflect the strain-softening behavior of the clay, by properly selecting the parameters of ξ95 and δrem. It confirms that fully localized soil flow mechanism was mobilized in Test 2.
4
Manuscript submitted to Theoretical & Applied Mechanics Letters
-16-12
-8-4048
1216
0 0.2 0.4 0.6 0.8 1 1.2
Test 2Numerical 1Numerical 2
d/BF/
(As u
)
Fig. 8. Comparison between the model test result and the numerical result for Test 2
Table 1 Comparison between numerical and test results for Test 2
F/Asu0 (not considering negative value) H/B γH/su
E/su0 δrem ξ95 υ Maximum 1st cycle end 2nd cycle end
Test 2 10 18 - - - - 11.89 10.36 9.42 Numerical 1 10 16 50 0.7 5 0.3 11.02 9.44 8.75 Numerical 2 10 16 50 0.7 10 0.3 11.34 10.32 9.67
In Test 3, the cyclic loading amplitude increases from 0.25 cm to 2 cm, as shown in Fig. 9. The T-bar test shows that the undrained shear strength of the soil at the plate anchor position in Test 3 is about 10 kPa.
00.05
0.10.15
0.20.25
0.30.35
0.40.45
0 1000 2000 3000 4000Time/s
Dis
plac
emen
t/cm
Fig. 9. Displacement history of Test 3
-12-10
-8-6-4-202468
1012
0 0.1 0.2 0.3 0.4d/B
F/(A
s u0)
Fig. 10. Load-displacement response in Test 3
The load-displacement response in Test 3 is shown in Fig. 10. When the load amplitude is small,
the load-displacement response shows an elastic character. With the increase of load amplitude, the result shows more and more hysteresis character. It can be seen that the response goes into fully plastic failure at a displacement of around d/B = 0.2, after where the resistance keeps stable.
1 g model tests were conducted to investigate the strain softening behavior of the bearing capacity of plate anchors in clay under cyclic loading. Numerical analyses were also conducted using FLAC to quantify the strain softening parameters. Conclusions based on these results can be made below,
(a) For the low stress level case, a cavity is formed beneath the anchor after a certain pullout displacement in the first cycle. As a result, the residual bearing capacity after several cycles is quite small.
(b) For the high stress level cases, the bearing capacity decreases as the accumulated plastic shear strain grows due to the strain-softening behavior of the clay. Because of the fully flow back
5

6
6
mechanism, the resistance of the anchor under cyclic loading shows obvious hysteresis, and the absolute value of maximum uplift resistance is similar to that of the maximum push-down resistance. Residual bearing capacity of the plate anchor was over 70% of the maximum pullout resistance during the first uplift loading.
(c) Loading amplitude has great effect on the shape of load-displacement curve. More hysteresis character can be mobilized when increasing the loading amplitude.
1. Acknowledgements
This work was supported by the National Natural Science Foundation of China (51121005 and 51209033), the Natural Science Foundation of Liaoning Province, China (2013020154), and the Fundamental Research Funds for the Central Universities of China (DUT14ZD206).
2. Reference
1 R. S. Merifield, S. W. Sloan and H. S. Yu, Stability of Plate Anchors in Undrained Clay,
Geotechnique, Vol. 51 (2), 141-153 (2001).
2 B. M. Das, A Procedure for Estimation of Ultimate Capacity of Foundations in Clay, Soils and
foundations, Vol. 20 (1), 77-82 (1980).
3 B. M. Das, R. Moreno and K. F. Dallo, Ultimate Pullout Capacity of Shallow Vertical Anchors in
Clay, Soils and Foundations, Vol. 25 (2), 148-152 (1985).
4 B. M. Das and V. K. Puri, Holding Capacity of Inclined Square Plate Anchors in Clay, Soils and
Foundations, Vol. 29 (3), 138-144 (1989).
5 B. M. Das, A. J. Tarquin and R. Moreno, Model Tests for Pullout Resistance of Vertical Anchors
in Clay, Civil Engineering for Practicing and Design Engineers, Vol. 4 (2), 191-209 (1985).
6 G. G. Meyerhof and J. I. Adams, The Ultimate Uplift Capacity of Foundations, Canadian
Geotechnical Journal, Vol. 5 (4), 225-244 (1968).
7 R. K. Rowe and E. H. Davis, The Behaviour of Anchor Plates in Clay, Geotechnique, Vol. 32 (1),
9-23 (1982).
8 R. S. Merifield, A. V. Lyamin and S. W. Sloan, Stability of Inclined Strip Anchors in Purely
Cohesive Soil, Journal of Geotechnical and Geoenvironmental Engineering, Vol. 131 (6), 792-799
(2005).
9 R. S. Merifield, S. W. Sloan and A. V. Lyamin, The Stability of Inclined Plate Anchors in Purely
Cohesive Soil, Faculty of Engineering & Surveying (2003).
10 L. Yu, J. Liu, X. Kong and Y. Hu, Numerical Study on Plate Anchor Stability in Clay,
Geotechnique, Vol. 61 (3), 235-246 (2011).
Manuscript submitted to Theoretical & Applied Mechanics Letters
7
11 K. H. Andersen and R. Lauritzsen, Bearing Capacity for Foundations with Cyclic Loads,
Publikasjon - Norges Geotekniske Institutt, Vol. (175) (1988).
12 K. H. Andersen, J. H. Pool and S. F. Brown, Cyclic and Static Laboratory Tests on Drammen
Clay, American Society of Civil Engineers, Journal of the Geotechnical Engineering Division, Vol.
106 (5), 499-529 (1980).
13 J. Wang, Y. Liu, Y. Xing and H. Di, Estimation of Undrained Bearing Capacity for Offshore Soft
Foundations with Cyclic Load, China Ocean Engineering, Vol. 12 (2), 213-222 (1998).
14 H. Zhou and M. F. Randolph, Computational Techniques and Shear Band Development for
Cylindrical and Spherical Penetrometers in Strain-Softening Clay, International Journal of
Geomechanics, Vol. 7 (4), 287-295 (2007).
15 H. Zhou and M. F. Randolph, Resistance of Full-Flow Penetrometers in Rate-Dependent and
Strain-Softening Clay, Geotechnique, Vol. 59 (2), 79-86 (2009).
16 M. Datta, S. K. Gulhati and G. Achari, Behaviour of Plate Anchors in Soft Cohesive Soils under
Cyclic Loading, Indian Geotechnical Journal, Vol. 20 (3), 206-224 (1990).
17 S. P. Singh and S. V. Ramaswamy, Influence of Frequency on the Behaviour of Plate Anchors
Subjected to Cyclic Loading, Marine Georesources and Geotechnology, Vol. 26 (1), 36-50 (2008).
18 S. P. Singh and S. V. Ramaswamy, Effects of Cyclic Frequency and Pre-Loading on Behaviour of
Plate Anchors, Geotechnical Special Publication, American Society of Civil Engineers, Shanghai,
China, Vol. 252-260 (2010).
19 M. S. Hossain, Y. Hu, M. F. Randolph and D. J. White, Limiting Cavity Depth for Spudcan
Foundations Penetrating Clay, Geotechnique, Vol. 55 (9), 679-690 (2005).
3. Notation
A Cross section area of a T-bar or an anchor
B Anchor width
d Displacement of a T-bar or an anchor
F Soil resistance force
H Embedment depth of an anchor
N Cycle number
Nc Bearing capacity factor of a T-bar or an anchor
Q Surcharge pressure on soil surface
8
8
su The undrained strength of clay
su0 The undrained shear strength of clay before remoulding
γ Unit weight of clay
δrem The residual shear strength of fully remolded soil
ξ, ξ95 Present accumulated strain and that of 95% remolded soil
σv The overburden pressure at the depth of plate anchor
υ Poisson’s ratio


![Stability and Vibrations of Micrononhomogeneous Plate ......2021/04/23 · Kączkowski [1] analysed statics and stability of rectangular plates and plate bands resting on the Winkler](https://img.pdfslide.net/doc/110x75/612d97061ecc5158694248a8/stability-and-vibrations-of-micrononhomogeneous-plate-20210423-kczkowski.jpg)


![DnV-RP-E302 - Design and Installation of Plate Anchors in Clay [2000]](https://img.pdfslide.net/doc/110x75/577ccd5c1a28ab9e788c1d8c/dnv-rp-e302-design-and-installation-of-plate-anchors-in-clay-2000.jpg)