Embed Size (px)
Citation preview
VIEREGG - RÖSSLER GmbH Innovative Verkehrsberatung
Expert Report
on the Traffic Forecasts and Cost Calculations
of the Proposed Fixed Fehmarnbelt Link
Client:
NABU Naturschutzbund Germany e.V. Charitéstrasse 3, 10117 Berlin
Munich, in January 2008
Schornstr. 10 D-81669 Munich Executive Directors: Flessabank Munich Tel.: 089/260236-55 Fax -56 Karlheinz Rößler Bank Code: 70030111 E-Mail: [email protected] Dr. Martin Vieregg Acct. No.: 770 504 Internet: www.vr-transport.de Register Court: Munich HRB 94833 VAT ID: DE129487819
VIEREGG - RÖSSLER GmbH MB
Table of Contents Page
1. Initial Situation and Task Definition 3
2. Feasibility Analysis of the Traffic Forecasts for the Fixed Feh- marnbelt Link 4
2.1 Overview of the Forecasts and Their Results 4 2.1.1 Traffic Volumes of the Fixed Fehmarnbelt Link 5 2.1.2 Traffic Volumes via all Western Baltic Sea Links 7 2.2 Examination of the Forecast Constraints 9 2.2.1 Basic Scenario A 9 2.2.2 Basic Scenario B 13 2.2.3 Additional Scenarios 13 2.2.4 General Constraints for Both Basic Scenarios 14 2.2.5 Summary Regarding Constraints 16
2.3 Base Year 2001 and Null Scenario 2015 17 2.4 Crossing Time Effect of the FFBL 20 2.5 Number of Vehicles or Trains 24 2.6 Competing Carriers 27 2.7 Trends Beyond the 2015 Forecast Horizon 29 2.8 Comparison of the FFBL with the Fixed Øresund Link 32 2.9 Summary and Conclusions 34
2.9.1 Result of the Forecasts Review 34 2.9.2 Conclusions Regarding FFBL Dimensioning 36
3. Feasibility Analysis of the Project Costs 39 3.1 Definition of the Project Costs 39 3.2 Comparison of the Fehmarnbelt Bridge with Similar Bridges in
Europe 40 3.3 Projection of the Construction Costs of the Fehmarnbelt Bridge on
the Basis of the Øresund Bridge 42 3.4 Possible Increased Costs 45 3.4.1 Possible Increased Cost as a Result of Wind Deflection Measures 45 3.4.2 Possible Increased Cost as a Result of Geological Risks 46 3.4.3 Cost Increase as a Result of Price Increases from 2004 to 2007 47
3.5 Project Costs Update 48 3.6 Possible Project costs in the Year of Completion 49 3.7 Summary 51
4. Summary and Outlook 52
Source References 55
2
VIEREGG - RÖSSLER GmbH
1. Initial Situation and Task Definition
The proposed fixed Fehmarnbelt Link in the form of a cable-stayed bridge between the islands of Fehmarn and Lolland, featuring a 4-lane roadway plus a 2-rail railroad line (4 + 2-solution), faces rejection among nature conservation organizations, tourism organizations, ferry operators and residents as well as numerous economists and politicians. Along with fears of severe ecological damage, realization of the project primarily arouses concerns in regard to bird protection and marine biology as well as financial risks that will lead to an unacceptable burden on the Danish national budget. This is because for the construction and operation of the Fehmarnbelt Bridge, actually designed with the private sector in mind, Denmark wants to provide either financial subsidies or compensation guarantees to the project’s private investors for the already anticipated deficit that will emerge as a result of the fact that the number of travelers (via automobiles, bus and long-distance trains) and freight (per heavy goods vehicles and freight trains) using this bridge and needed to generate the returns required to lower the associated costs cannot actually be attained, as is clearly documented by the market survey process published in June of 2002.1 This is augmented by the financial risk that the construction costs and/or operational costs calculated up to now will be exceeded.
As such, the first item to be examined in an expert report is whether the traffic volumes indicated in the previous forecasts for the fixed Fehmarnbelt Link are actually realistic or whether they represent inflated figures which would necessarily also lead to corresponding consequences for the dimensioning of the structure’s capacity.
The second task of the expert report’s preparation consists of examining the "cable-stayed bridge" option as the favored solution for the fixed Fehmarnbelt Link, along with how high the actual investment costs will be, including consideration of the costs for construction measures designed to protect vehicles and the bridge from high winds as well as the already recognizable heavy price increases for the raw materials and energy quantities required for the construction of the bridge.
As the object of investigation, the "Fixed Fehmarnbelt Link" will be abbreviated as "FFBL" for purposes of simplification in the remaining body of text.
3
VIEREGG - RÖSSLER GmbH
2. Feasibility Analysis of the Traffic Forecasts for the Fixed Fehmarnbelt Link
Before examination of the feasibility of the FFBL traffic forecasts can be conducted, an overview of these forecasts and their results is provided first. This is followed by a critical examination of the underlying forecast constraints (forecast scenarios). The steps following this examine whether the traffic volumes applied for the Base Year 2001 are correct and whether the Null Scenario – i.e., Situation 2015 without FFBL – was correctly defined. Afterwards, the question is addressed as to whether the effect that the FFBL will have on road vehicle crossing time was determined correctly. This is followed by an examination of whether the number of road vehicles and railroad trains was correctly derived from the forecast number of travelers and freight tonnage on the proposed Fehmarnbelt Bridge. Whether the carriers competing with FFBL (aircraft for passenger transport, cargo ships for goods transport) has accurately been accounted for is additionally examined. Thereafter, it must be evaluated whether the growth trend anticipated for the entire duration of the structure’s usage is realistic. In conclusion, the FFBL must be thoroughly compared with the fixed Øresund Link in regard to the actual or forecast traffic volume.
2.1 Overview of the Forecasts and Their Results
Differentiated forecasts of FFBL traffic volumes were already presented in 1999, which were nevertheless related to the year 2010.2 Since it is impossible that the proposed structure will be completed by then, and even unlikely that construction work will have begun at all, these forecasts are subsequently no longer up-to-date. As such, only the latest forecasts are to be considered in the following section; these relate to the year 2015 and were presented in 2003, at which time it was anticipated that the FFBL would open in 2012. The forecasts establish 2015 as the forecast horizon, since there is the presumption relating to the project that "the first 4 operational years are a phased adaptation period (...) This adaptation period was implemented in order to account for the fact that some customers require a period of time to become accustomed to a new, faster and more direct connection between Scandinavia and the continent."3
4
VIEREGG - RÖSSLER GmbH MB
These latest forecasts, the two Basic Scenarios A and B, which themselves are also now 4 years old, are distinguished by different constraints primarily related to user costs. Basic Scenario A is further divided here into 4 sub-scenarios, which nonetheless only differ in regard to the ferry timetables and prices of competing ferry companies and the toll for usage of the Øresund Bridge. More detail is explained below regarding these Basic and Sub-Scenarios (see Chapter 2.2).
The forecasts presented in 2003 differentiate between traffic volumes for the Fehmarnbelt Link and overall traffic on all ferry lines and fixed crossings of the entire western Baltic Sea.
2.1.1 Traffic Volumes of the Fixed Fehmarnbelt Link
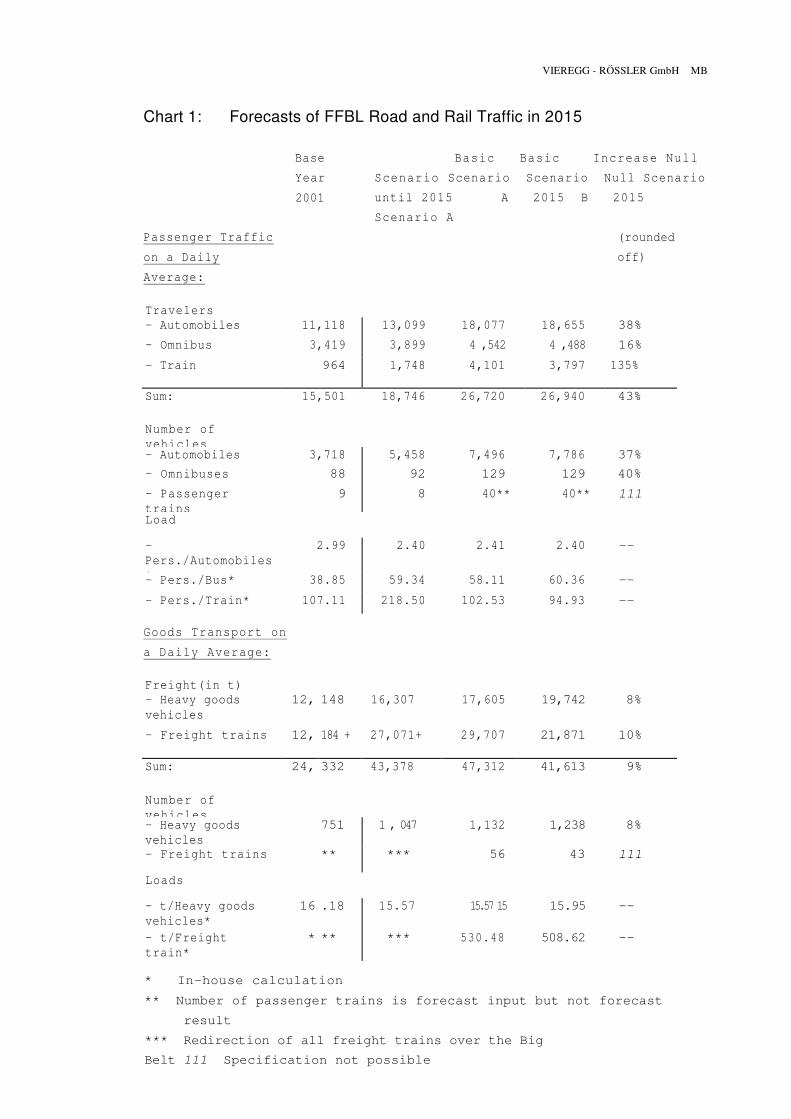
The following chart (see Chart 1) depicts the data initially relevant for the Base Year 2001, followed by the forecast data for the Null Scenario in 2015, therefore without realization of the proposed project. Lastly, the traffic volumes for the Fehmarnbelt Bridge Basic Scenarios A and B are depicted.
In order to determine what effect the FFBL will have on future traffic volumes, the 2015 forecast value may not be compared with the traffic in the Base Year 2001. Instead, it is necessary to proceed from the 2015 Null Scenario.
Based on this premise, the FFBL affects an automobile traffic increase of almost 40% in Basic Scenario A as compared with the status quo (number of travelers and number of automobiles). For the omnibus and passenger train transport carrier categories, the forecasts in Basic Scenario A indicate a passenger numbers increase of 16% for the former and 135% for the latter compared with the Null Scenario.
In comparison with the indicated growth figures in passenger traffic, the growth rates in goods transport as a result of FFBL are lower, consisting of some 10% for both road-bound and rail-bound transports.
5
VIEREGG - RÖSSLER GmbH MB
Chart 1: Forecasts of FFBL Road and Rail Traffic in 2015
Passenger Traffic
on a Daily
Average:
Base Year 2001
Basic Basic Increase Null
Scenario Scenario Scenario Null Scenario
until 2015 A 2015 B 2015
Scenario A (rounded
off)
Travelers - Automobiles 11,118 13,099 18,077 18,655 38% - Omnibus 3,419 3,899 4 ,542 4 ,488 16% - Train 964 1,748 4,101 3,797 135%
Sum: 15,501 18,746 26,720 26,940 43%
Number of vehicles
- Automobiles 3,718 5,458 7,496 7,786 37% - Omnibuses 88 92 129 129 40% - Passenger trains
9 8 40** 40** 111
Load
- Pers./Automobiles*
2.99 2.40 2.41 2.40 --
- Pers./Bus* 38.85 59.34 58.11 60.36 -- - Pers./Train* 107.11 218.50 102.53 94.93 --
Goods Transport on
a Daily Average:
Freight(in t) - Heavy goods vehicles
12, 148 16,307 17,605 19,742 8%
- Freight trains 12, 184 + 27,071+ 29,707 21,871 10%
Sum: 24, 332 43,378 47,312 41,613 9%
Number of vehicles
- Heavy goods vehicles
751 1 , 047 1,132 1,238 8%
- Freight trains ** *** 56 43 111
Loads
- t/Heavy goods vehicles*
16 .18 15.57 15.57 15 15.95 --
- t/Freight train*
* ** *** 530.48 508.62 --
* In-house calculation ** Number of passenger trains is forecast input but not forecast
result *** Redirection of all freight trains over the Big
Belt 111 Specification not possible

6
VIEREGG - RÖSSLER GmbH
2.1.2 Traffic Volumes via all Western Baltic Sea Links
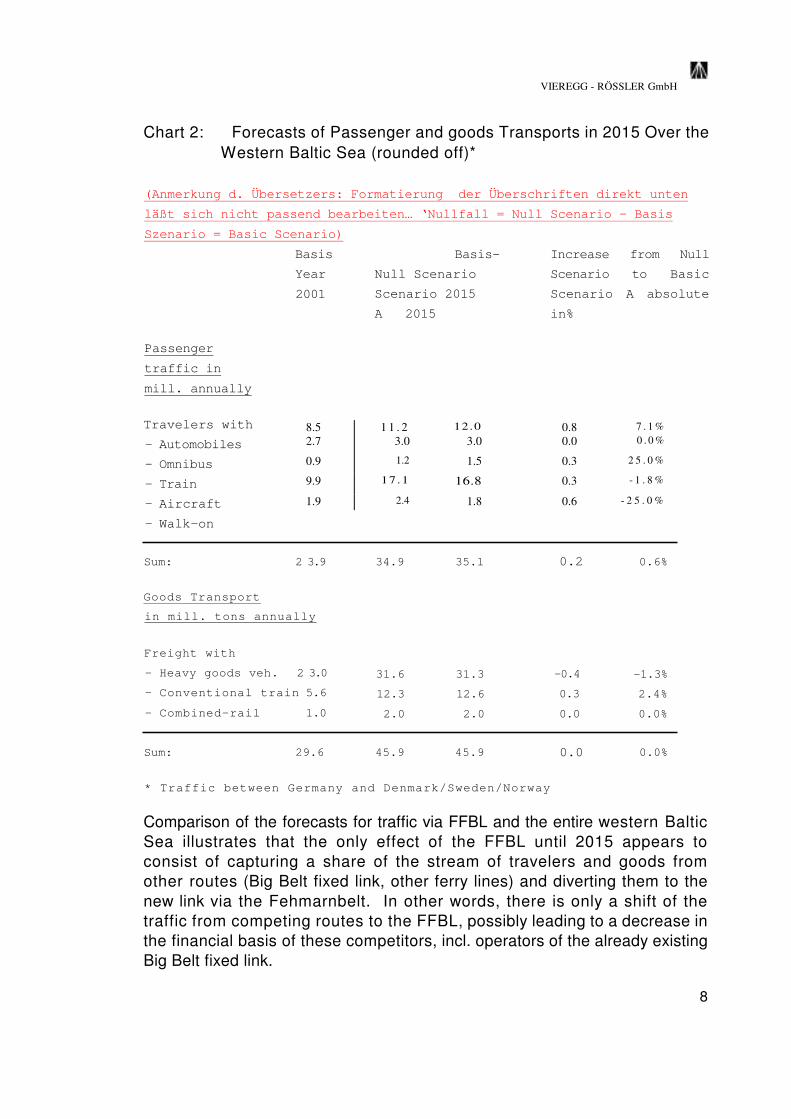
In order to evaluate the effect of the FFBL at all, an observation of the overall traffic crossing the western Baltic Sea was required, i.e., between Germany plus Jutland on the one hand and the remainder of Denmark/Sweden/Norway on the other. This excluded all streams of traffic originating in or with their destinations in Poland, the Baltic region and in Finland, since the route via the Fehmarnbelt would represent too great a detour for these crossings. This overall observation is depicted in Chart 2.
Against the backdrop of the Null Scenario 2015, the construction of the FFBL has little effect on the overall passenger traffic over the western Baltic Sea 2015 (see Chart 2). Essentially there is a relatively small increase in automobile journeys and simultaneously a decrease in "walk-on" transport, i.e., the use of ferries by pedestrians or cyclists. The extent to which this represents a pure shift from the original number of walk-on passengers to automobile travel or whether complicated shifts occur between the 5 travel modes cannot be established. Some level of shift away from aircraft to rail travel is however probable, whereby the absolute number of rail passengers in comparison to the other travel modes is nevertheless very small.
In goods transport, the total transported quantity shows no change at all between the Null Scenario 2015 and Basic Scenario 2015, and only a small shift takes place between the transport carriers heavy goods vehicles and conventional freight trains.
7
VIEREGG - RÖSSLER GmbH
Chart 2: Forecasts of Passenger and goods Transports in 2015 Over the Western Baltic Sea (rounded off)*
(Anmerkung d. Übersetzers: Formatierung der Überschriften direkt unten
läßt sich nicht passend bearbeiten… ‘Nullfall = Null Scenario – Basis
Szenario = Basic Scenario)
Basis Year 2001
Basis-
Null Scenario
Scenario 2015
A 2015
Increase from Null
Scenario to Basic
Scenario A absolute
in%
Passenger
traffic in
mill. annually
Travelers with - Automobiles
- Omnibus
- Train
- Aircraft
- Walk-on
8.5 1 1 . 2 12.0 2.7 3.0 3.0 0.9 1.2 1.5 9.9 17.1 16.8 1.9 2.4 1.8
0.8 7 . 1 % 0.0 0 . 0 %
0.3 2 5 . 0 %
0.3 - 1 . 8 %
0.6 - 2 5 . 0 %
Sum: 2 3.9
Goods Transport in mill. tons annually
Freight with - Heavy goods veh. 2 3.0
- Conventional train 5.6
- Combined-rail 1.0
34.9
31.6 12.3 2.0
35.1
31.3 12.6 2.0
0.2
-0.4
0.3
0.0
0.6%
-1.3%
2.4%
0.0%
Sum: 29.6 45.9 45.9 0.0 0.0%
* Traffic between Germany and Denmark/Sweden/Norway
Comparison of the forecasts for traffic via FFBL and the entire western Baltic Sea illustrates that the only effect of the FFBL until 2015 appears to consist of capturing a share of the stream of travelers and goods from other routes (Big Belt fixed link, other ferry lines) and diverting them to the new link via the Fehmarnbelt. In other words, there is only a shift of the traffic from competing routes to the FFBL, possibly leading to a decrease in the financial basis of these competitors, incl. operators of the already existing Big Belt fixed link.
8
VIEREGG - RÖSSLER GmbH MB
2.2 Examination of the Forecast Constraints
The forecasts for 2015 include not only the rather marginal effects described previously by the FFBL which would (presumably) be finished at this time, but it also takes into account the alterations of constraints, regardless of whether the FFBL is constructed or not. These changes in the constraints are measured against the situation of 1997 as the "Zero Point" year and are summarized into two Basic Scenarios designated as A and B.
2.2.1 Basic Scenario A
Basic Scenario A for 2015 differs from the 1997 situation essentially in the costs of usage for automobiles and heavy goods vehicles, in the travel prices for rail travel and in the ticket prices for aircraft travel. As regards rail traffic, this is augmented by the fact that the crossing times for goods transport are shortened, the scheduling reliability of such transports increases and the speed of the Copenhagen - Hamburg passenger trains will be raised to 160 km/h. It is presumed in regard to automobile traffic that the specific fuel consumption will decrease by 26%.4
The presumed changes in user costs for the individual means of transport from 1997 to 2015 are indicated in particular detail, as is demonstrated by the following depiction:
Forecast Assumptions Regarding User Costs 1997 to 2015 (Basic Scenario A)
- Automobile traffic: Increase by 15% - Heavy goods vehicles traffic: Reduction by 4% - Long-distance rail traffic: Reduction by 30% - Railroad goods transport: Reduction by 18% - Air traffic (average): Increase by 9% - Of which, low-cost airlines: Reduction by 25%5
All these assumptions relating to a period of 18 years contradict the actual development of the last 10 years since 1997. It is extremely improbable that in the remaining 8 years until 2015, such significant changes will emerge in the overall transport sector that the assumptions indicated can actually become reality, since this would require that the development which has taken place up to now would have to be reversed even beyond its original status.
9
VIEREGG - RÖSSLER GmbH MB
The following actual developments from 1997 to 2007 are relevant in this regard:
� The prices for gasoline have risen by 71% since 1997 and for diesel even as much as 98% (in both cases without sales tax).6 During the course of 2007 alone, the price of crude oil as a basic material for gasoline rose by 57%, and today’s 100 dollars per barrel for oil will double by 2017 to 200 dollars.7 If the price trend of the last 10 years for gasoline and diesel continues until 2015 – without additional price increases resulting from crude oil shortages or political interventions by crude oil export nations - then 2015 will see gasoline prices at 162% higher than in 1997 and diesel prices even at 243% higher than in 1997. As such, automobile user costs are more likely to increase 150% by 2015 than by a mere 15%. In light of the specified extreme rise in the price of diesel, user costs for heavy goods vehicles fully dependent on diesel are in no way going to decrease by 4%; instead they are going to increase significantly in a manner similar to the user costs for gasoline automobiles.
� The effect of reduced-consumption automobile engines has previously been compensated by increasing vehicle mass, greater speeds and the installation of additional energy consumers such as air conditioning, electrical motors for opening and closing windows and adjusting seats and through the negative aerodynamic effect of jeep-like car bodies. Before reduced fuel consumption can be alleged in the future, a fundamental trend must first establish itself. Since however most 2015 model cars are already built or at least are already in development, a notable reduction in consumption is unlikely to emerge by 2015. This is emphasized by the fact that automobile manufacturer development departments are currently focused in their hybrid technology work on reducing consumption primarily in city traffic, but not in long-distance transport.
� A price level reduction of 30% in long-distance rail travel is by no means to be anticipated. Instead, the opposite development is more likely to emerge from 1997 to 2015, namely an increase in tickets of some 30%. If one considers the development of consumer goods prices in the last 10 years (average price increases of around 1.5% annually) and applies this price increase rate as a model for the German Bahn (DB - German rail service) long-distance travel ticket prices, then the result is an increase in ticket prices from 1997 to 2015 of approximately 30.7%.
10
VIEREGG - RÖSSLER GmbH MB
But the actual annual increase in DB long-distance travel prices is significantly higher than a rate of 1.5%. For example, on December 9th, 2007, DB ticket prices were raised by 2.9%8, and this was already the second price increase for DB tickets within a single year. The annual price increases for rail cards and seat reservations must also be taken into account. The actual price level in long-distance rail travel is therefore likely to be 70% - 100% higher in 2015 than in 1997.
The presumed shortening of transport times in railroad goods transport is not evident until now. In contrast, the tendency is toward an increase of the crossing times for freight trains due to the increasing quantity and timing of passenger traffic, which increasingly forces freight trains to remain on side rails in order to allow the passenger trains to pass.
The reduction of 18% in user costs for railway goods transport providing the basis for the forecasts is also doubtful. In fact, as a result of the rising cost of energy, expensive electrification and, in particular, of the construction of new rail lines traveled by freight trains, the cost of freight train journeys is constantly increasing. Above all, the use of the infrastructure for which railroad goods transport is proportionately invoiced in the form of rising usage fees (long tunnels, bridges, overpasses, traction power systems, signaling and signal boxes, etc.) at very expensive rates in comparison with heavy goods vehicle transport is inevitably forcing an increase in the user costs. In a conservative estimate, the costs-per-train of goods transports in 2015 are likely to be some 20% greater than in 1997, but by no means less expensive, as was assumed in the forecasts.
The price reduction among low-cost airlines, which were not even present in Scandinavian traffic in 1997, is far greater than the implied reduction of only 25%. Many airline tickets for Germany - Scandinavia routes are already 90% cheaper than at the end of the 90s.
The forecasts assume an average increase of the user costs in air travel (low-cost + established airlines) of 9%. With a reduction of 25% assumed in the low-cost airlines sub-segment, mathematics alone dictates that the increased cost by established airlines would have to be clearly higher than 9%, and more likely 30% to 50%. But in reality, the established airlines (Lufthansa, SAS) already initiated heavy price reductions in Germany - Scandinavia traffic starting in the late 90s.
11
VIEREGG - RÖSSLER GmbH MB
An end to these price changes in road, rail and air traffic is not in sight: As a result of the global rise in crude oil prices which has continuously accelerated in particular in recent years, the costs for using automobiles and heavy goods vehicles will continue to undergo drastic increases, an effect which will also influence railway operations. In air travel, it is likely that only a further decrease in prices will be stopped, however without attaining the high price level of the 90s in 2015. This is because in short-distance air travel - flights between Germany and Scandinavia fall into this category - fuel costs have only a minimal effect on the overall cost of a flight. Even if a reasonable fuel tax is introduced within the EU against the will of the aviation industry in the interest of environmental and climate protection, airline prices for the relatively short main routes between Central Europe and Scandinavia will only undergo a relatively minor increase. Furthermore, the potential for increasing the energy efficiency of aircraft has by no means been exhausted, with particular focus at this time on the reduction of aircraft mass as a primary aim in the development of new aircraft. Even in the worst case for the aviation industry, following an intermediate heavy decrease in airline prices, the price level in 2015 is likely to be at around the same level as in 1997.
Due to the abundance of data, the forecast assumptions regarding user costs are compared in chart form here with the likely development to be realistically anticipated:
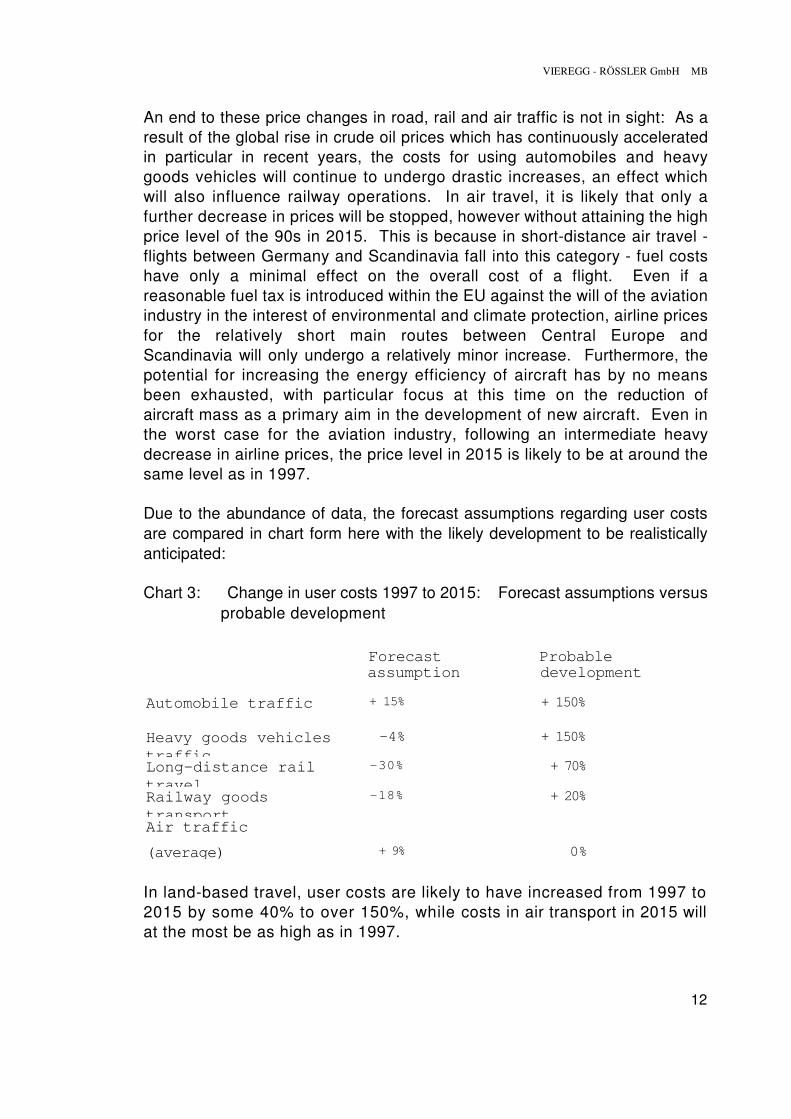
Chart 3: Change in user costs 1997 to 2015: Forecast assumptions versus probable development
Forecast Probable assumption development
Automobile traffic + 15% + 150%
Heavy goods vehicles traffic
-4% + 150%
Long-distance rail travel
-30% + 70%
Railway goods transport
-18% + 20%
Air traffic
(average) + 9% 0%
In land-based travel, user costs are likely to have increased from 1997 to 2015 by some 40% to over 150%, while costs in air transport in 2015 will at the most be as high as in 1997.
12
VIEREGG - RÖSSLER GmbH
2.2.2 Basic Scenario B
Basic Scenario B distinguishes itself from Scenario A all-in-all through fewer and at the same time altogether more minor changes during the period from 1997 to 2015. Aside from an increase in the speed of passenger trains on the Copenhagen - Hamburg route up to 160 km/h, these changes only affect the user costs.
Forecast Assumptions Regarding User Costs 1997 to 2015 (Basic Scenario B)
- Automobile traffic: Reduction of 10% - Heavy goods vehicles traffic: Reduction of 6% - Long-distance rail travel: No change - Railway goods transport: No change - Air travel (average): No change - Low-cost airlines: Reduction of 25%9
As such, the criticisms of the assumptions regarding the costs of automobile and heavy goods vehicle usage already expressed above in Basic Scenario A apply in particular for Basic Scenario B, as the fuel price level trend has recognizably shot consistently upwards for 10 years now, and indeed not fallen. In regard to the costs in railway traffic, Basic Scenario B is more realistic than Scenario A, even if the actual rise in DB ticket prices is significantly underestimated. As regards the costs of aircraft usage, Basic Scenario B could indeed correspond with reality in 2015 in the event that the crude oil price increases massively and, at the same time, the EU introduces an aviation fuel tax for environmental and climate protection reasons despite the protests of the aviation industry.
2.2.3 Additional Scenarios
Basic Scenario A, but not Basic Scenario B, has been supplemented by 4 additional scenarios. These supplementary scenarios attempt to communicate the influence exerted on FFBL travel demand on the one hand by the competing ferry lines with a services offer that is altered in comparison with the timetable and rates of 2002, and on the other hand by the pricing policy of the bridge and ferry operators at Øresund.10 As such, it represents a sensitivity analysis of the forecast data in Basic Scenario A.
13
VIEREGG - RÖSSLER GmbH MB
These additional scenarios comprise two extreme cases:
(1) Increased timetable service offer of ferry crossings east of the Fehmarnbelt; retention of ferry operation over the Fehmarnbelt; reduction of all ferry rates by 25%; increase in prices for the Øresund link (bridge toll or rates for the ferries Helsingør - Helsingborg) by 25%
(2) Reduced timetable service offer of ferry crossings east of the Fehmarnbelt; discontinuation of ferry operation over the Fehmarnbelt; increase of all ferry rates by 25%; reduction in prices for the Øresund link by 25%.
This is adjoined by two scenarios which cover the middle ground of these two extreme cases.
It is noted that forecast results achieved with these additional scenarios demonstrate corresponding deviations from the data of Basic Scenario A.11 As such, these results can be regard as plausible.
2.2.4 General Constraints for Both Basic Scenarios
Both Basic Scenarios demonstrate numerous identical constraints:
(1) The existing ferry crossing over the Fehmarnbelt will be discontinued; all other ferries between Denmark/Sweden/Norway and Germany continue to sail in 2015 according to the Summer 2002 timetables.12
(2) The traffic obstacle posed by national borders when crossing the border into the neighboring country undergoes a small reduction from 1997 to 2015 of 2% - 3%.13
(3) Minimal deregulation in international rail travel occurs from 1997 to 2015.14
(4) Technological improvements in road travel, which will be discussed later in more detail, increase the capacity of the transportation routes by 10% from 1997 to 2015.15
(5) The speed of the passenger trains will be increased in the future to 160 km/h.16
14
VIEREGG - RÖSSLER GmbH MB
(6) Goods transport crossing the Baltic Sea increases from 1997 to 2015 by 76%, or 3.2% annually. 17
Since constraints (2) to (4) are related to relatively small changes between 1997 and 2015, affecting as such the relatively long period of 18 years and therefore only representing marginal details, they are not given further consideration in the following. In contrast, constraints (1), (5) and (6) are examined more closely:
Constraint (1):
The presumption that the timetables of all ferries between Denmark/ Sweden/Norway and Germany – aside from the ferry line crossing the Fehmarnbelt which is to be discontinued – will undergo no changes from 2002 to 2015 and, in particular, that no service offer improvements at all will be introduced, is unrealistic, even for the Null Scenario forecast increase of road traffic (see Chapter 2.3), and it even directly contradicts the consequences arising out of Constraint (6). This constraint explicitly establishes annual growth of goods transports via the Baltic Sea of 3.2%. This is because without capacity expansion of the ferry system, above all through the deployment of additional ships or an increase in Baltic Sea crossings, this level of traffic growth is unlikely to be accomplished.18 A more condensed timetable of the competing ferry lines inevitably means shorter waiting times on average in the future for ferry crossings, thereby reducing the FFBL’s appeal advantage with the result that the increase in the number of road vehicles along the new transportation route across the Fehmarnbelt would likely be lower than in the case of retention of the ferry service offer from 2002 to 2015.
Constraint (5):
Even if in the future the top speed of the passenger trains is at 160 km/h, the railway infrastructure from Hamburg via Lübeck to Copenhagen will still be far below the standard that comparable routes in western Europe between two neighboring population density centers with millions of residents already have today or will have in the near future. 160 km/h is actually a speed level that all important long-distance travel routes in western Europe have had since the 1960s. Therefore, this low standard is utterly inappropriate in the 21st Century and practically represents a neglect of the Hamburg - Copenhagen rail link.
15
VIEREGG - RÖSSLER GmbH MB
If the Fehmarnbelt "Hinterlandanbindung" (‘rural connection’) were finally upgraded on the Danish and German sides to the normal standard for routes between western European population density centers (speeds of 250 km/h and more), then, with the retention of today’s ferry operations, the crossing time for EC and ICE trains between Hamburg and Copenhagen could be reduced from its current time of 4 ½ hours down to 3 hours, representing a crossing time reduction of at least 90 minutes. In contrast, the proposed bridge between Rødby and Puttgarden only represents a maximum crossing time reduction of 55 minutes.
Constraint (6):
The underlying constraint equally applied to both Basic Scenarios of a firm rate of growth in Baltic Sea goods transport crossings is notable. But from a logical basis, such an assumption is in fact not a forecast constraint at all, but rather at best the result of the forecast. This is because if the forecast ultimately indicates growth in goods transport in light of this constraint, then such an assertion is pure tautology or nothing more than a logical circular argument, since such growth is actually a forecast input according to its definition. For this reason, all of the forecast data on goods transport –regardless of the transport carriers – are of little significance.
2.2.5 Summary Regarding Constraints
It can be noted as follows: Since the constraints extensively contradict reality and indeed both of the two Basic Scenarios A and B and the general constraints, the basis of the forecast is questionable. The FFBL traffic volumes indicated for 2015 suggesting strong increases compared with 2001 do not hold up and probably represent a significant overestimation. Perhaps at the time the forecast was prepared in 2002 there was still some hope that the developments that were already underway (in particular the rising cost of road travel fuels and the emergence of low-cost airlines) only represented temporary situations as opposed to a general trend. However, the last 5 years has seen these developments become ever-more entrenched, with the result that completely different constraints are likely to apply in 2015 than those which provided the basis of the forecasts.
16
VIEREGG - RÖSSLER GmbH MB
The resulting consequences by 2015 are likely to be
� that the stagnation in automobile and omnibus traffic across the western Baltic Sea which has already been evident since 1990 is more likely to transition into a process of diminishment rather than growth,
� that the current growth experienced in heavy goods vehicle traffic will weaken or cease altogether,
� and that the downward trend demonstrated in rail traffic over the last 10 years will continue and grow: The number of travelers in passenger trains between Germany and Denmark/Sweden/Norway already decreased from 1997 to 2001 by around 5%.19 The quantity of goods transported by conventional freight trains sank by 15%, and in combined-rail traffic, the decrease over the same period even rose to 41%.20
A forecast subjected to realistic constraints must conclude that the actual traffic volumes to be anticipated as a result of the effect of the FFBL will only be slightly higher than the starting-point level.
2.3 Base Year 2001 and Null Scenario 2015
It is not only the underlying growth rate that is significant for the projected traffic volume created as a result of the proposed structure, but also the numbers basis from which future growth will take place (Base Year). Of additional importance for the evaluation of a measure are the conditions in the event that the project is not realized (Null Scenario).
Base Year 2001
The existing forecasts are based on the traffic volumes actually calculated for 2001 as their starting basis. This addresses the last full calendar year prior to the start of the work on the forecasts, making this numbers basis as up-to-date as possible. But it must be evaluated whether the average number of 3,718 automobiles daily in ferry traffic across the Fehmarnbelt in 2001 (see Chart 1 in Chapter 2.1.1) is in fact accurate and therefore appropriate as the basis for forecasts.
17
VIEREGG - RÖSSLER GmbH MB
According to data from the Scandlines shipping company, the number of automobiles registered for 2001 also includes induced traffic created by marketing measures in addition to the regular traffic.21 These marketing measures include on the one hand a so-called ‘Bordershop’ on the German side in which Scandinavian residents can purchase alcoholic beverages and other reduced-price goods at relatively inexpensive prices and transport them home with their own vehicles, and on the other hand they include ‘Shopping Tickets’, which enable the travelers to have a same-day round trip over the Fehmarnbelt with their own cars at a discount. The share of automobile traffic induced in this fashion in 2001 stood at some 16%, and since 2005 has even amounted to an annual share of around 33%.22 This means that meanwhile, every third automobile using the ferries to cross the Fehmarnbelt is doing so due to the heavily reduced ferry tickets and the attractive shopping opportunities for alcohol.
If one eliminates this induced automobile traffic for the Base Year 2001, then the automobile numbers projected for 2015 are reduced by 16% for both the Null Scenario and for the Basic Scenarios. Consequently, one can only anticipate some 4,700 automobiles in the Null Scenario and only around 6,460 automobiles in the Basic Scenario. The revenues generated by the bridge toll are necessarily then correspondingly less.
Definition of the Null Scenario
A Null Scenario or reference case for the year 2015 is not mentioned in either the summary of the 2015 forecasts23 or in the Closing Report24. Instead, only the changes in traffic volume between the first year of 2001 and the forecast year of 2015 are mentioned. This makes it initially impossible to determine whether any increases in road and rail traffic volumes on the Fehmarnbelt are an effect of the fixed link, or whether they would have emerged even without this structure as a result of a general growth in traffic unaffected by the link itself.
The Null Scenario (Reference Case) is initially addressed in the supplement to the Closing Report25 presented 7 months later. This Null Scenario is defined separately from the two Basic Scenarios in the following manner:
"The basic assumption is that in 2015 the ferry traffic between Rødby and Puttgarden is maintained with the same frequencies as today, but a higher capacity due to reconstruction of the ferries (providing the ferries with an extra deck), and on the ferry connections across the Baltic Sea there is a moderate expansion compared to today. These expansions
18
VIEREGG - RÖSSLER GmbH MB
consist of an additional frequency on the Gedser - Rostock service and an additional frequency on the Trelleborg - Rostock fast ferry service. The main differences in the assumptions on infrastructure between the Reference Cases and the Base Cases concern the railways. (...) For the roads, though, it is assumed that Oldenburg - Heiligenhafen is widened to 4 lanes, while Heiligenhafen - Puttgarden is 2 lanes. For the railways the Reference Cases do not include Fehmarn Belt rural connections, except for some investments in the route via Sønderjylland and Schleswig."26
Railway infrastructure is referred to in particular:
"No upgrading Lübeck - Puttgarden (...) No electrification Ringsted - Rødby No upgrading Orehoved - Rødby to double track"27
Beyond this, the Null Scenario does not differ from the Basic Scenarios.
In light of the expansion of ferry capacity crossing the Fehmarnbelt mentioned in the quote above, the retention of crossing frequency from 2002 to 2015 is not credible. The improvement of all ferries operating here can at best be deemed a makeshift solution (an expensive one) to increase the transport capacity. It is probable that an additional ship could be put into service with similar investment expenditure but with far greater benefit, resulting not only in increased capacity, but increased crossing frequency at the same time. This would reduce the average waiting time for automobile drivers until the next ferry departure, leading to greater numbers of travelers in automobile and omnibus traffic and to higher heavy goods vehicle numbers compared with the existing 2015 Null Scenario. But in addition, it would also make it clear that the effect of the FFBL on ferry operation is even smaller than is proposed in the above comparison between the Null Scenario and Basic Scenario A.
The Null Scenario in relation to the railway infrastructure is particularly questionable, depicting here the same less favorable expansion standard as today; namely, no electrification at all and no 2-line expansion, to say nothing of an increase in the route speed. Such route expansion is first addressed in the Basic Scenarios.
The timetable service offer in the Null Scenario which underlies passenger traffic features a similarly unfavorable situation, consisting specifically of 8 passenger trains daily,28 while the Basic Scenarios, with 40 trains daily, contain a service offer improved by 5 times.
19
VIEREGG - RÖSSLER GmbH MB
As such, the Null Scenario is fundamentally different from the two Planning Concepts (Basic Scenarios).
According to its definition, a Null Scenario represents the opposite of the Planning Concept which, in contrast to the custom, is designated in the existing forecasts as the "Basic Scenario". In other words, the Basic Scenario comprises the case "The bridge will be built" and the Null Scenario signifies "The bridge will not be built". All of the other variables forming the basis of the forecast must be identical. Above all, this means that expansion of the rural connection and the increased number of train connections in long-distance passenger transport must either apply or not apply equally to both the Null Scenario and the Planning Concept. But it is precisely on this point that the Null Scenario and the Planning Concept deviate drastically from one another, with the consequence that the Basic Scenario’s increased traffic compared with the Null Scenario is only partially attributable to the finished bridge. This subsequently leaves the questions open as to what share at all the bridge has of the increased rail traffic in Basic Scenario A in comparison with Null Scenario 2015, as well as what share is designated to the expansion of the rural routes and the greater crossing frequency. As such, the forecasts on rail passenger traffic via Fehmarnbelt for 2015 are of little significance.
2.4 Crossing Time Effect of the FFBL
One aspect must be considered in the following section which, as with numerous additional points, is not appropriately addressed in the forecasts, although this aspect in particular represents the centerpiece of every forecast; namely the effects of the proposed new structure on the user crossing times, or in short, the crossing time effect of the FFBL. In the existing evaluations, the crossing time over the approximately 18.6 km Fehmarnbelt Bridge for automobiles, omnibus and heavy goods vehicles is uniformly indicated as 12 minutes,29 compared to a crossing duration by ferry of 52 minutes,30 while the current crossing time of the Fehmarnbelt ferries is only 45 minutes, or already 7 minutes shorter than provided as the basis in the forecasts. Reciprocally, the indicated FFBL crossing time of 12 minutes requires an average speed of 90 km/h. In light of the general speed limit for heavy goods vehicle traffic of 80 km/h and the speed limit anticipated for all motorized vehicles on the Fehmarnbelt Bridge of 80 km/h to max. 90 km/h, this is clearly too high. But the gravest objection in regard to the crossing time effects of the FFBL is related to the lack of consideration of rest periods and break times during long-distance road travel in the use of the future bridge instead of today’s ferries. This is addressed in the following section.
20
VIEREGG - RÖSSLER GmbH
Due to the small population on Lolland and Fehmarn islands and in Ostholstein – in complete contrast to the Øresund-Region – there is no notable local traffic over the Fehmarnbelt (see Chapter 2.8). The FFBL will therefore be used almost exclusively by long-distance travelers and goods transports, whereby pronounced long-distance automobile traffic between Sweden/Norway and all parts of Central Europe extending to the Mediterranean countries is evident in the summer holiday months. In the case of such long distance journeys, it is customary that the automobile drivers and their passengers take rest breaks after certain intervals - for heavy goods vehicle drivers, such rest periods are even legally required. Tourist coach drivers are also obligated to take such rest breaks, particularly since the bus passengers are also allowed breaks on longer journeys for reasons of comfort and not least for visits to the toilet. Today’s journey via ferry across the Fehmarnbelt represents a welcome opportunity for just such a pause, which also has the additional advantage that, despite the standstill of one’s own vehicle (on the ferry), the journey continues. The FFBL eliminates this possibility of "breaks during the journey", with the consequence that these indispensable pauses have to be made up on land – either through a break in the journey at parking places on the roadside or at rest areas.
The time spent by the automobile and omnibus travelers for such a break on land would total around 30 minutes, similar to the pure crossing time savings attained by using the bridge compared with the time required for the ferry crossing: If one compares the ferry crossing time (45 minutes) with the crossing time of automobiles and busses using the bridge (13 minutes at an average speed of 90 km/h), then a time difference of only 32 minutes exists between both types of Fehmarnbelt Link - and approximately this amount of time is required in the case of the bridge crossing for the otherwise eliminated break. The consequence is that the proposed Fehmarnbelt Bridge only produces a relatively small time saving for most automobile drivers and bus passengers due to the break that is taken in any case. It is only the eliminated waiting time until departure of the next ferry and the eliminated time required for leaving the ferry once it has reached the other bank (unloading process) that lead to a reduction in the overall crossing time, which is depicted below.
Legally required rest periods apply for heavy goods vehicle drivers: After 4.5 hours of driving time, the drivers must take a break of at least 45 minutes. Since the heavy goods vehicle crossing time between Hamburg and Copenhagen itself, including drives on innercity access roads to the highway, totals over 4.5 hours,31 the rest break is obligatory for heavy goods vehicle journeys with departure or destination beyond Hamburg or Copenhagen. This break consists of exactly the same amount of time required for the ferry crossing of the Fehmarnbelt.
21
VIEREGG - RÖSSLER GmbH MB
If the proposed FFBL is used, then not only is this time for "a break during the ferry crossing" completely eliminated, but the time required for crossing the bridge, consisting of around 15 minutes, must be added. As such, in the case of using the FFBL, only the eliminated waiting time until departure of the next ferry and the eliminated time required for disembarking from the ferry speak in favor of the bridge, just as in the case of automobile and bus traffic.
With today’s 30-minute interval between Fehmarnbelt ferries, the average waiting time totals exactly 15 minutes. If growth in crossing traffic over the Fehmarnbelt was presumed, then a need would arise in the future for an even shorter timetable interval, further reducing the average waiting time. However, since the existing evaluation concludes that no traffic growth is to be expected in the future, the current and somewhat inconvenient waiting time for ferry traffic is anticipated.
Since, according to the current Scandlines timetable, the lay time of each ferry (from mooring on embankment until release of the lines) totals exactly 15 minutes, unloading of the ships and renewed loading must take place within this short space of time. If one calculates the duration of the entire unloading procedure until the last vehicle has left the ship with half of the lay time (7'30"), then a space of time of 3'45" is applicable for the average unloading time. Altogether, the following time is required for the average waiting plus unloading time:
15'00" + 3'45" = 18'45.
As such, the time taken up for automobile and bus travelers as well as heavy goods vehicle drivers in long-distance travel by waiting for departure of the ferry plus disembarking from the ferry in comparison with the proposed bridge averages less than 20 minutes.
At first glance, one could suggest that the entirety of the loading time must equally be added to the waiting time. This is however false for logical reasons: The waiting time taken into account already comprises loading of the ferry anyway. If one considers a vehicle which has ‘just missed’ the previous ferry, then there is a full waiting time of 30 minutes. However, loading of the ferry takes place during the last 7.5 minutes of the above-mentioned 30 minutes waiting time. For the last vehicle driving onto the ferry, there is in fact no waiting time at all, because the lines are released immediately after the last vehicle is on deck.
22
VIEREGG - RÖSSLER GmbH MB
The situation with disembarking is completely different. In such case, half of the unloading time must indeed be applied. It is true that after docking, the first vehicle parked in front of the ramp can leave the ferry immediately. But the last vehicle has to wait until all other vehicles have left the ship, which can take up to 7.5 minutes. Therefore, on average each vehicle waits for half of 7.5 minutes.
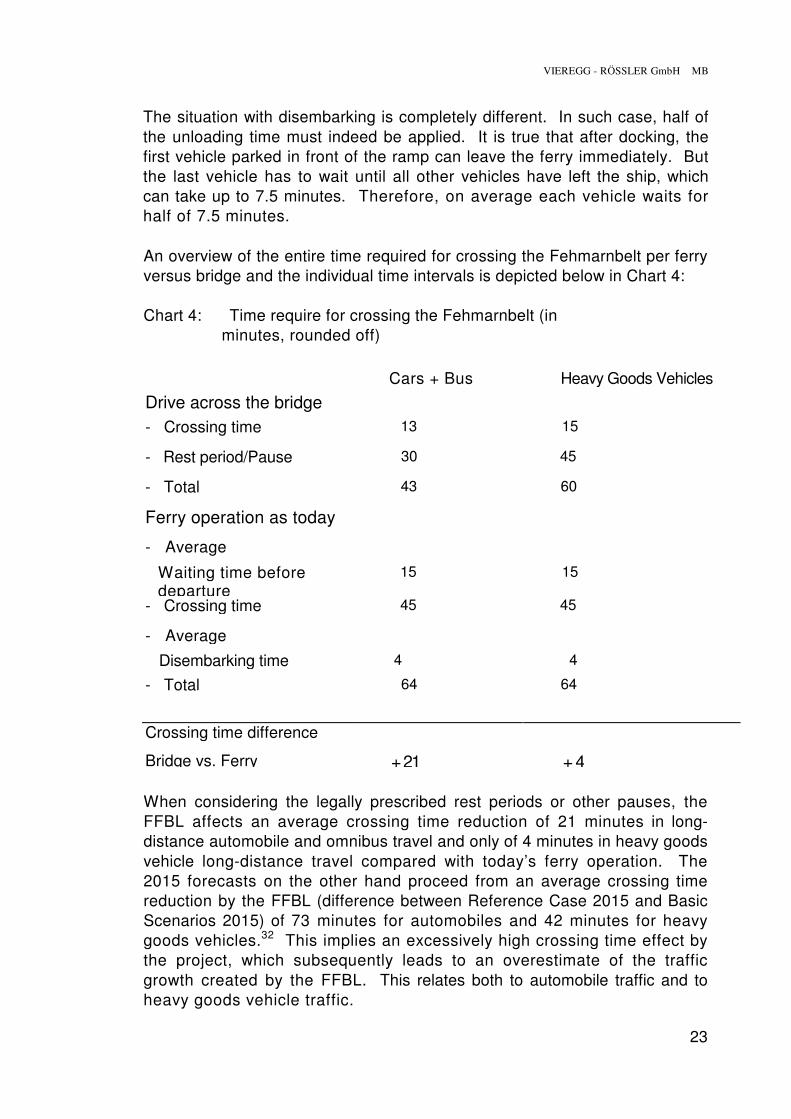
An overview of the entire time required for crossing the Fehmarnbelt per ferry versus bridge and the individual time intervals is depicted below in Chart 4:
Chart 4: Time require for crossing the Fehmarnbelt (in minutes, rounded off)
Cars + Bus Heavy Goods Vehicles
Drive across the bridge
- Crossing time 13 15
- Rest period/Pause 30 45
- Total 43 60
Ferry operation as today
- Average
Waiting time before departure
15 15
- Crossing time 45 45
- Average
Disembarking time 4 4
- Total 64 64
Crossing time difference
Bridge vs. Ferry + 21 + 4
When considering the legally prescribed rest periods or other pauses, the FFBL affects an average crossing time reduction of 21 minutes in long-distance automobile and omnibus travel and only of 4 minutes in heavy goods vehicle long-distance travel compared with today’s ferry operation. The 2015 forecasts on the other hand proceed from an average crossing time reduction by the FFBL (difference between Reference Case 2015 and Basic Scenarios 2015) of 73 minutes for automobiles and 42 minutes for heavy goods vehicles.32 This implies an excessively high crossing time effect by the project, which subsequently leads to an overestimate of the traffic growth created by the FFBL. This relates both to automobile traffic and to heavy goods vehicle traffic.
23
VIEREGG - RÖSSLER GmbH MB
The result is that the indicated travel time savings for automobile traffic of 73 minutes compared with the actual saving of only 21 is overestimated by more than 3 times. For heavy goods vehicle long-distance travel, the implied crossing time reduction of 42 minutes even represents an overestimation of more than 10 times. An increase in ferry service based on growing traffic volume would result in an even greater diminishment of the FFBL time advantage in comparison with ferry operation as it relates to both automobile and bus traffic and to heavy goods vehicle traffic.
This general overestimation of the crossing time effects of the FFBL in the current forecasts also criticizes the Baltic Sea Institute in Rostock:
"The lack of consideration for heavy goods vehicle driver rest periods or automobile traveler breaks already evident in the 1999 forecast in ferry crossings is apparently also missing in the new forecast. This applies both to the two Basic Scenarios as well as to the current forecast for the expanded ferry system. This results in an allocation of too little time for all ferry crossings in which a compensation of the rest periods or taking of driving breaks is possible and which can lead to crossing time extensions on alternative direct road connections, while the fixed crossing is attributed too much time."33
For the reason described, the FFBL will in reality lead to significantly lower automobile, omnibus and heavy goods vehicle figures than those indicated in the Basic Scenarios 2015, which will substantially reduce the calculated toll earnings.
2.5 Number of Vehicles or Trains
The average load per vehicle or train is calculated by dividing the number of travelers per each of the means of transport by the number of the respective road vehicles or passenger trains (see Chart 1). The following is notable in this regard:
� The load of the automobiles which was set in Base Year 2001 at an average of 2.99 persons sinks by the Null Scenario in 2015 to 2.62 persons, and in the two Planning Concepts down to only around 2.4 persons, which is not plausible. This is because such a low degree of occupation of the automobiles could only emerge as a result of a disproportionate number of single drivers, i.e., without passengers, traveling in automobiles via the Fehmarnbelt Bridge in comparison with today’s ferry operation. But while single drivers can take a rest break on the ferries, which is a welcome opportunity from the driver’s perspective in light of the relatively long journey routes in automobile traffic between
24
VIEREGG - RÖSSLER GmbH MB
Germany and Denmark/Sweden/Norway (see above), such a break is eliminated when driving across the bridge, leaving many drivers needing to be relieved by allowing a passenger to drive. Furthermore, the new bridge and the simultaneous expansion of the rural connection shortens the crossing time in rail passenger traffic, thereby creating an attractive alternative to their own car to previous single automobile drivers, above all. For this reason, following completion of the FFBL, the number of automobile drivers sitting alone in their cars is more likely to decrease than increase, with the result that the average load of the cars is more likely to increase instead of be reduced.
If one subjects the Basic Scenarios to the same load value of 2.99 persons as in the Base Year 2001, the number of automobiles using the FFBL daily in Basic Scenario A only totals around 6,050 instead of around 7,500, or almost 20% lower than predicted. The anticipated earnings from the bridge toll also then accordingly fall.
The average omnibus load is completely inconsistent, with 39 persons in the Base Year, 35 persons in the Null Scenario, 58 persons in Basic Scenario A and finally, 60 persons in Basic Scenario B. For this alternating load, which is in no way understandable, no rationale is provided whatsoever. The indicated number of omnibuses which will use the FFBL subsequently does not hold up.
In regard to road-bound goods transport via FFBL, it is indicated that the calculated average load of heavy goods vehicles at around 16 t per vehicle for the Base Year, the Null Scenario and the two Planning Concepts demonstrates an almost constant value and is therefore plausible. In addition, if one considers that the sizes and therefore also the load capacity of heavy goods vehicles covers an extremely broad range from pickup trucks to 44-ton trucks, then the amount indicated as an average for all heavy goods vehicles seems to correspond with the reality.
The load of the daily average of 9 operating passenger trains was extremely low in the Base Year 2001, with an average of 107 persons, particularly when one considers the fast that modern long-distance travel trains usually have seating capacity numbers of from 500 to over 1,000. This deficient utilization of the trains is more intensified in Planning Concepts A and B, leading to unprofitable vehicle deployment. It must be noted on this point that the high number of 40 trains represents a forecast input34, and is by no means the result of the forecasts. Nevertheless, even the traffic volume that is evoked as a result, still with only some 100 passengers per train, is marginal, preventing profitable train transport from emerging at all.
25
VIEREGG - RÖSSLER GmbH MB
For economic reasons alone, the future number of passenger trains on the FFBL is likely only to stand at 10 to a maximum of 16, which will lead to a reduction in the earnings from rail passenger traffic of 2/3 to 3/4.
� It must be noted in regard to railroad goods transport that the projected number of 56 freight trains35 ostensibly seems plausible. But since the two Basic Scenarios only permit an average load per freight train of somewhat more than 500 t to be calculated, while the capacity of a modern freight train with a length of 750 m – particularly on the flatland route between Hamburg - Copenhagen with no notable ascents – is at least 1,000 t and can by all means also reach 2,000 t, the projected number of freight trains appears to be 2 – 4 times too high. If one takes an efficient railroad operation as the basis, then at best one can anticipate a total of some 20 freight trains on a daily average in both directions: In the case of 20-hour operation, this would result in only one freight train every 2 hours per direction. The toll earnings of the bridge operator from railroad goods transport, given a uniform FFBL fee per freight train, would be approximately half of what is predicted in the forecast. Incidentally, thorough consideration is currently being given to this particular corridor in the framework of the FERRMED-Project (railroad axis Sweden – Southern Spain) to doubling the typical European train length from 750 m to 1,500 m, thereby doubling the load quantities and simultaneously halving the number of trains.
It must therefore be noted that the indicated numbers of automobiles, as measured by their loads, is around 20% too high, the number of heavy goods vehicles appears in contrast correct, while both the number of passenger trains in relation to the number of travelers and the number of freight trains are 2 to 4 times too high. Instead of 96 trains per day (40 passenger trains plus 56 freight trains)36, it is likely that only a maximum of 36 trains can be expected, or a good 1/3rd. The fees paid by the railway enterprises to the bridge operators will accordingly be less: Instead of 50 million EUR annually37, it is likely that only some 19 million EUR annually can be anticipated.
26
VIEREGG - RÖSSLER GmbH MB
2.6 Competing Transport Carriers
The forecasts for 2015 examine all means of transport that come into question in Baltic Sea crossings as passenger traffic between Germany and Denmark/Sweden/Norway: 38
- Automobiles - Omnibus - Train - Aircraft - Walk-on passengers
The final category indicates passengers who board the Baltic Sea ferries as pedestrians - and probably also as cyclists - and also leave the ship in the same manner, i.e., without using a road or rail vehicle.
It must be noted of the completed forecasts that air travel is not appropriately considered. For example, in an overview of the airline connections from Germany to Denmark/Sweden/Norway in 2015, the increasingly important airport in Munich was thoroughly "forgotten",39 from which today already 7 aircraft take off on a daily basis with Scandinavian destinations (excluding Finland and Iceland).40 By the same token, the differentiation implied for 2015 between airports used by established airlines and markedly low-cost airports is already outdated today, since on the one hand low-cost airlines are increasingly taking off from and landing at the regular, large, relatively centrally located airports, i.e., not only at peripheral airports such as Hahn (in Hunsrück), Lübeck-Blankensee or Memmingen (Allgäu). On the other hand, with corresponding advance booking, airlines such as Lufthansa and SAS are also offering airline tickets whose prices bear little or no difference to those of the low-cost airlines. It can be anticipated with a high level of certainty that by 2015 the previously-mentioned amalgamation of both airline categories will continue as ever more low-cost flights depart and land at large airports. As such, the forecast figures on the air traffic volume between Germany and Denmark/Sweden/Norway in 2015 have little significance, and probably represent a clear underestimate of the actual air travel volume, and therefore an overestimation of the volume in road-bound passenger traffic.
In the forecasts specially focused on the FFBL, air travel is not even considered at all, although air travel, particularly in the Hamburg - Copenhagen corridor, and as such also for crossing the Fehmarnbelt, is an attractive means of transport.
27
VIEREGG - RÖSSLER GmbH MB
Consequently, the forecast results for 2015 as they relate to passenger traffic via Fehmarnbelt are incomplete and subsequently even more diminished in their significance than the results on overall traffic between Germany and Denmark/Sweden/Norway.
In the forecasts relating to goods transport between Germany and Denmark/Sweden/Norway in 2015, the following means of transport are considered:
- Heavy goods vehicles - Conventional freight trains - Combined rail traffic freight trains.41
The forecasts focused on the FFBL combine the two types of railroad goods transports into a single category.42
Although these forecasts intentionally address goods transports over the Baltic Sea, i.e., across a sea traveled by ships, the transport of goods by ship – with the exception solely of ferries for road and rail vehicles – is not mentioned at all. At the same time, the cargo shipping industry on the Baltic Sea exhibits above-average growth, thanks above all to the modern ‘RoRo’ ships, which in particular enable very fast, affordable handling of containers and heavy goods vehicle interchangeable bodies, land-based vehicles and ships. Due to this serious deficiency, no reliable statement is possible regarding the completed forecasts on how goods transports crossing the Baltic Sea will develop overall and in particular over the Fehmarnbelt, or how the modal split between RoRo ships, heavy goods vehicles (on ferries or bridges) and freight trains (on ferries or bridges) in Baltic Sea crossings will quantitatively appear in the future.
In this context, the development of goods transport that already took place between 1994 and 2001 is notable: An increase in goods quantities transported via heavy goods vehicles of 41.5%, a decrease in goods transports with conventional freight trains of 15%, and even of 41% with combined rail traffic trains.43 This probably indicates a shift from rail to the road. But it is highly probable that a majority of container transports from freight trains used until 1994 was also replaced by the more affordable, similarly fast RoRo ship by 2001.
In summarizing, it can be said that the forecasts on goods transport over the Fehmarnbelt in 2015 have little significance, because they are incomplete and are founded anyway on a questionable basis; namely, the specification of general growth of 3.2% annually in goods transports crossing the Baltic Sea (cp. Chapter 2.2.4).
28
VIEREGG - RÖSSLER GmbH
2.7 Trends Beyond the 2015 Forecast Horizon
If one takes Basic Scenario A as a basis and assumes that on the one hand, FFBL can start operation in 201244 and that on the other hand traffic grows 1.7% annually during the entire serviceable life of this structure45, then amortization will be completed following an operational period of 37 years,46 in 2049. Overall, this annual growth rate signifies an increase in traffic volume of 86.6%, representing almost a doubling of volume in the bridge’s year of opening. As such, for 2012 a volume of 2,081 million automobiles is predicted,47 which computes to around 5,700 automobiles daily. If, on the basis of the specified growth rate, a projection of automobile volume is conducted, then the number of automobiles for 2049 computes to approximately 10,600 automobiles using the FFBL on a daily basis. Measured against the 2001 volume of some 3,100 automobiles daily, by 2049 an increase of 243% or 3.43 times the 2001 volume emerges, more than tripling. If one also calculates bus and heavy goods vehicle traffic with the specified growth rate, then in 2049, some 300 omnibuses and 2,600 heavy goods vehicles would use the bridge daily, a total therefore of approximately 13,500 vehicles.
But this development, forming the basis of the profitability analysis for the entire project, is more than questionable, and for two different reasons:
(1) The general growth of wealth and the GDP is the prerequisite for any future increase of passenger and goods transports.48 This possible traffic increase is itself dependent upon fuel costs not increasing in price faster than the general rate of inflation. But the actual price trend with gasoline and diesel is shooting straight upwards (see Chapter 2.2.1) and is far more likely in the face of no existing growth in Germany - Scandinavia passenger traffic to in fact lead to a decrease in traffic volume. However, it could emerge that the rising crude oil prices trigger a global recession,49 which in turn would trigger a shrinkage in traffic volume. As such, and due to the rising oil price, in both cases a decrease in road travel, not further growth, is to be anticipated.
29
VIEREGG - RÖSSLER GmbH MB
(2) But even if one were to leave the influence of the oil price out of the picture as it relates to economic development and traffic volume, allowing the implied continuous growth rate of 1.7% annually to have validity, the increase in traffic volume from year to year would in no way be uniform. Instead, the growth would be exponential, distinguished by constantly increasing growth. It is extremely questionable whether by 2049 or even beyond such traffic growth would be politically tolerable in the face of its negative effects on the climate and environment.
Normally, all growth in nature, but also the growth of markets for specific products in business, corresponds with an S-curve that pursues saturation. Such saturation doubtless exists as well in land-based traffic between Germany and Denmark/Sweden/Norway, since the number of people wanting to undertake journeys within a certain time period and within a certain region with automobiles, busses or trains is very limited, particularly in view of the small populations of these Scandinavian countries, the lack of population growth in Europe and the great distances that must be traversed on such journeys.
At best, air traffic between Germany - Scandinavia is not affected by such restrictions: Liberalization in the EU and, more than anything, the emergence of low-cost airlines have created rapid growth in air travel since 2001, also in traffic to and from Scandinavia. If there is growth at all in passenger traffic, it is not on the ground, but in the air. But, as demonstrated above (see Chapter 2.6), precisely the role of air traffic is insufficiently addressed in the forecasts.
It is conspicuous that the overall automobile traffic crossing the western Baltic Sea with ferries or via fixed links from 1990 to 2001 remained generally constant.50 Automobile traffic via ferry crossing the Fehmarnbelt even decreased from 1990 to 1997 and then increased again, back to its approximate original level then around 2001.51 "If the automobile traffic share on the Puttgarden - Rødby line is growing again since the end of the 90s, then this is the effect of the modern ferry concept introduced in 1997 and, in particular, of the Puttgarden Bordershop operated since 1999 by Scandlines for Scandinavian shopping tourists (...) The share of Special Tickets (Day Tickets and Shopping Tickets), which are used almost exclusively by shopping tourists and sold at reduced rates, totaled around 15% in 2001."52 This means that the number of automobiles transported across the Fehmarnbelt without the ferry operator’s marketing measures either sank or at least remained at the already attained low level.
30
VIEREGG - RÖSSLER GmbH MB
The development observable since 2001 of the traffic via the Fehmarnbelt depicts a similar image: If one excludes the additional automobile traffic generated by the Shopping Tickets, then there is no recognizable change in the automobile volume during the years 2001 to 2007 in comparison with each previous year.53 The actual automobile volume on Fehmarnbelt – without the traffic induced by marketing measures – has therefore in fact stagnated for some 17 years.
It cannot however be determined on the basis of the existing data whether the overall automobile traffic crossing the western Baltic Sea has stagnated up to 2007, i.e., not just the Fehmarnbelt route automobile traffic. In any case, this overall automobile traffic has been more or less constant from 1990 to 2001. But this question can only be clarified if there is also a comprehensive investigation of the overall number from 2002 to 2007 of automobile transports by ferry between the German-Danish mainland on the one hand and the Danish islands, as well as Sweden and Norway on the other hand, which would nevertheless exceed the scope of this current study.
If one also assumes a constant number of vehicles until 2007 in relation to the overall automobile traffic and also extrapolates this trend to apply to the future, then growth of automobile traffic via Fehmarnbelt as a consequence of the FFBL would only be possible in the event that traffic from competing ferry lines was drawn off and shifted to the Rødby - Puttgarden route, i.e., through a pure cannibalization of the competing lines crossing the western Baltic Sea. But such a shift of the traffic has its limitations if one considers that the Fehmarnbelt line had already attracted 35% of the total automobile traffic in 2001. The indicated increase by 2049 of 3.43 times would mean in a stagnation of the overall volume that the FFBL would ultimately have to transact 120% of the total automobile traffic between Germany and Denmark/Sweden/Norway - a logical impossibility.
The only realistic perspective in the long-term therefore exists in passenger traffic wherein, after the opening of the FFBL, the market share of the traffic via Fehmarnbelt within the overall Baltic Sea crossing traffic increases for a few years and then stagnates at a somewhat higher level than today’s, whereby the competing ferry companies probably know how to implement corresponding countermeasures for preventing the FFBL from attracting an even higher share of the traffic at the expense of the competition.
It applies similarly as in the case of passenger traffic for Germany - Scandinavia road and rail goods transport, which equally pursues a saturation on structural-economic grounds, when indeed at a later point in time.
31
VIEREGG - RÖSSLER GmbH MB
While aircraft hardly provides an alternative to heavy goods vehicles and trains for most goods transports, nautical shipping will be the most promising means of transport for the future. As regards energy consumption and transport costs, it is significantly less expensive than land-based transport carriers, in particular since nautical shipping via the Baltic Sea is available as a virtually no-cost transportation route, and for most routes it is even significantly shorter than overland transport. Ships however are not addressed at all as a means of transport between Germany and Denmark/Sweden/Norway in all of the forecasts and trend adjustments. For this reason, the trend in goods transport for the FFBL until 2049 represents a serious overestimate: At best, in the initial years following the opening of the Fehmarnbelt Bridge, a notable increase is probable. However, in the long-term, it would likely be replaced by a stagnation at a higher level or even a shrinkage of the traffic volume.
2.8 Comparison of the FFBL with the Fixed Øresund Link
At this point, a reference to the fundamental difference between the Øresund Bridge, erected in 2000, and the proposed Fehmarnbelt Bridge is appropriate, even though this aspect is not addressed at all in the existing studies on the FFBL, while it indeed plays a substantial in the political discussion: The vigorous increase in traffic on the fixed link over the Øresund as a "role model" for the possible development at Fehmarnbelt.
Road traffic (automobiles, omnibuses, heavy goods vehicles, etc.) on the Øresund Bridge opened on July 1st, 2001, increased annually from 2001 to 2006 by 10.0% to 16.2%54 and grew in the first quarter of 2007 alone more than ever before with 21%.55 However, it should in no way be concluded from this development that a similarly heavy growth in traffic would also occur after opening the FFBL, because the traffic corridor over the Fehmarnbelt is fundamentally different in many ways from the route over the Øresund:
� The fixed link over the Øresund represents a quasi-innercity transportation route between the two "city-halves" of Copenhagen and Malmö in the center of the Øresund region population density center, with 3.5 million residents56. While prior to the opening of the Øresund Bridge the population density center’s internal traffic between Copenhagen and Malmö was only inadequately transacted via ferry – with a relatively high level of time expenditure and further complicated by the necessity to transfer twice between land and sea transportation means – there is now a fast, uninterrupted road and rail link capable of handling this local traffic.
32
VIEREGG - RÖSSLER GmbH MB
In contrast to this, no economically strong population density center exists close to or even at a greater distance from the Fehmarnbelt. Instead, there is a region that is relatively sparsely populated, generally characterized by agricultural utilization and, in the summer months, nature-friendly tourism.
Due to the quasi-innercity character of the fixed Øresund link, the automobile traffic on the Øresund Bridge consists of 70% private and commercial customers with a fixed contract,57 i.e., overwhelmingly of commuters and businesspersons regularly undertaking local traffic journeys which are heavily discounted and which as such only yield relatively low returns. The remaining 30% of Øresund Bridge automobile traffic consists of irregular and rare users, i.e., holiday travelers and customers with no discount arrangement.58 In this connection, commuter traffic (14,000 persons daily) increased from 2005 to 2006 by 43%, while the number of irregular customers only increased by a few percent.59 If one submits that one-third of this user group consists of local traffic customers, then long-distance travel via Øresund only has a share of 20%. Due to the economic-geographic structure which exists here, only this latter-specified traffic will play a role in Fehmarnbelt, which will also subsequently demonstrate the same marginal growth rates as the long-distance travel at Øresund.
The bridge plus tunnel at Øresund forms the direct road and rail connection from southern Sweden to the international Copenhagen-Kastrup Airport. Consequently, heavy traffic streams of persons (air passengers and service personnel, airport visitors, employees of the airport, the airlines and other aviation-related businesses) and goods (air freight, goods deliveries to the airport and its shops incl. gastronomy) occur here. In contrast, neither the Danish island of Lolland nor the German island of Fehmarn has an airport, which in itself already heavily narrows the traffic volume of the proposed FFBL.
In the corridor over Øresund, along with the population density center’s own internal local traffic, at least three long-distance travel-routes are also bundled together:
(1) Sweden - western Denmark via the Big Belt (2) Sweden - Lübeck - Hamburg – northwestern Germany via Puttgarden (3) Sweden – northeastern Germany - Berlin via Gedser - Rostock.
33
VIEREGG - RÖSSLER GmbH MB
In contrast, the corridor over the Fehmarnbelt only serves two long-distance travel-routes; namely the two axes from Sweden and from the Danish side of the Øresund to Lübeck - Hamburg – northwestern Germany.
From the above overview alone, it is apparent that the FFBL will only register a fraction of the traffic volume that the Øresund link handles today. But even their traffic volume of almost 16,000 vehicles daily in 200660 does not even use one-third of the capacity of the available 4-lane roadway on the bridge if one considers that a single lane is designed for 13,000 motor vehicles per day (see Chapter 2.9).
2.9 Summary and Conclusions
2.9.1 Result of the Forecasts Review
The forecast automobile figures, heavy goods vehicle figures and freight train figures are excessively high for numerous reasons:
� The forecast constraints are too optimistic and already refuted by the actual development from 1997 and 2007, above all in regard to the changes in fuel costs for automobiles and heavy goods vehicles and in railway ticket prices. As a result of the dampening effects on traffic volume and economic growth as a consequence of the anticipated oil price increases, in the long-term zero growth or even a decrease in land-based passenger and goods traffic between Germany - Scandinavia is to be expected.
� The annual growth in goods transport is established in advance, resulting in the emergence of inevitably increasing goods quantities via Fehmarnbelt. For this reason, the numbers indicated are by no means the result of forecasts, but instead represent a tautology or the result of a logical circular argument. They are therefore insignificant.
� The number of automobiles in the Fehmarnbelt Link in Base Year 2001, i.e., the initial basis of the traffic forecast, is set too high since the traffic-generating effect of the Scandlines ferry operator marketing measures is excluded.
34
VIEREGG - RÖSSLER GmbH MB
The Null Scenario – the FFBL will not be built - is not correctly defined in that the forecast concepts ("Basic Scenarios") integrating crossing time effects that will not even be caused by the proposed project; for example, shortened crossing times in railway traffic as a result of the expansion of the railway lines which are only implied in connection with the FFBL, but not without this measure.
The intensity of the crossing time effect emerging solely as a result of the FFBL is seriously underestimated in regard to road traffic, because the legally required rest breaks for heavy goods vehicle drivers and the break periods desired by automobile and bus passengers during long-distance are not given adequate consideration: While the ferry crossing represents a "rest break during the continuing journey", usage of the Fehmarnbelt Bridge in long-distance travel inevitably leads to a comparably long stoppage time on land in order to take the required rest break.
The automobile loads following the opening of the FFBL is set excessively low in comparison to 2001. With a constant load rate, the number of automobiles to be anticipated in 2015 must be reduced by almost 20% in comparison with the forecast values.
The number of passenger trains is not the result of the forecast at all, but instead represents a determination that was set in advance due to the specific timetable concept. In view of the forecast passenger number, the number of passenger trains is seriously inflated in any case. In freight train traffic, an excessively low load per train is assumed, which equally results in an inflated number of trains.
The competition for land-based passenger traffic from air travel is seriously underestimated; the competition in goods transport from cargo ships, in particular RoRo ships, receives no consideration whatsoever.
While the financial project calculations presume constant growth in traffic volumes until at least 2049, the expected year of amortization, there has in fact been no growth registered at all in Germany - Denmark/Sweden/Norway land-based passenger traffic already since 1990. This zero growth is even likely in the long-term to develop into shrinkage of traffic volume.
The road travel development evident in the case of the Øresund Bridge, with growth of up to 16.2% annually, may in no way be taken as a “role model” for possible development of the FFBL due to the numerous, fundamental differences between the Øresund region and the Fehmarnbelt region.
35
VIEREGG - RÖSSLER GmbH MB
Overall it is demonstrated that the predicted FFBL road and rail traffic volumes represent a serious overestimation of the actual volume. In reality, the opening of this bridge is likely to lead to a short-term, relatively small increase in vehicle numbers, and to do so at the expense of competing links. The FFBL traffic volumes are likely to persist in the long-term at the attained level or even to begin diminishing again, already because of the consistently rising energy and travel fuel costs in the future.
2.9.2 Conclusions Regarding FFBL Dimensioning
The previous comments have demonstrated that with a high level of certainty, no notable increase in road traffic via the Fehmarnbelt will emerge as a result of the FFBL in comparison with today’s ferry crossing, and indeed above all because on the one hand the FFBL serves only long-distance travel, and on the other hand, because it only generates a marginal shortening of the crossing time in long-distance automobile, bus and heavy goods vehicle travel as a result of the elimination of the “rest breaks during the continuing journey" which were possible up to now. Proceeding from the actual traffic volumes of the last 7 years in ferry traffic crossing the Fehmarnbelt (around 3,100 to 3,400 automobiles, 90 to 95 omnibuses and 750 to 1,080 heavy goods vehicles on a daily average61), even many years after the opening of the FFBL, the number of vehicles per day should only stand at some 4,000 automobiles, around 100 omnibuses and some 1,000 heavy goods vehicles, which yields an overall number of around 5,100 vehicles daily. In light of the fact that the 4-lane roadway on the bridge features a capacity for a minimum of 52,000 motor vehicles per day (see below), this elaborate transportation route would not even be utilizing 10% of its capacity.
But even if one does not view the predicted number of vehicles for 2015 as excessive despite the many counterarguments, the calculations for the year 2049 of around 13,500 road vehicles using the FFBL per day (see Chapter 2.7) translate into a load of less than 3,400 vehicles per day for each individual lane, and this 37 years after the opening of this transportation route. As a comparison: According to road construction guidelines in Germany, an innercity road equipped with traffic lights handles 13,000 vehicles per lane on a daily basis without regularly resulting in stagnating traffic or full-blown traffic jams. If one accepts occasional stagnating traffic flow, then the number of vehicles can be significantly higher. For example, already in 1995, in a 4-lane section of Munich’s ‘Mittlerer Ring’ at the ‘Nördliche Isarbrücke’ counting point, 107,000 motor vehicles per 24 hours were registered, i.e., some 8 times as many vehicles as the FFBL is finally supposed to handle over 50 years later.
36
VIEREGG - RÖSSLER GmbH MB
These considerations demonstrate that the FFBL, equipped with 4 lanes, is completely oversized for the road traffic volume, even if one regarded the inflated forecast numbers as correct. Even in the case of the excessively overestimated traffic of 2049, two road lanes would at most be loaded to half of their capacity.
A similar statement can be made for the railway: Even the indicated, seriously inflated number of around 100 trains per day could in principal be handled by the appropriate arrangement of the timetable by a single-rail line. This applies even more if the land-bound sections of the overall Hamburg - Copenhagen route are expanded into two-rails, permitting the trains traveling in both directions to encounter each other unhindered north and south of the Fehmarnbelt. If one takes a profitable rail operation with an appropriate average load of passenger trains and freight trains, then at most one can anticipate 36 trains per day in both directions, or only a good 1/3rd of the number of trains indicated for both rail lines. If all of the trains traveled over the FFBL at a uniform speed as is the case with the English-French Canal Tunnel, then the 2-line railway proposed for the Fehmarnbelt could handle almost 1,000 trains per day in both directions. With the indicated number of a maximum of 36 trains, this massive capacity would only be utilized to 3.6% of its capacity.
The conclusion to be drawn is that the proposed 4 + 2 solution is in no way appropriate for the foreseeable future. But even 2 lanes for road traffic and one line for rail traffic represent an available capacity which, as far as anyone can judge and providing that the forecasts are in line with reality, would never be exhausted. But since every regional road requires at least 2 lanes and every railroad line requires at least one platform, a reduction of the project as a combined-rail solution to a level that is adapted to the actual needs is not even possible. Therefore, from a rational, economical perspective, the retention of ferry operation and the rejection of any fixed Fehmarnbelt link is recommended.
But the somewhat more emotional factor must be considered that the residents of the Danish islands of Seeland, Falster, Lolland and in particular the Danish Capital of Copenhagen harbor a strong desire to have a “fixed”, reliable connection to the south, particularly for journeys with their own cars, because they do not want to be permanently dependent upon the “swaying” boats crossing the sometimes stormy sea.
37
VIEREGG - RÖSSLER GmbH MB
Under these circumstances, a compromise and simultaneously the smallest-scale possible solution of an FFBL with two roadway lanes and one rail line is feasible. Such a 2+1 solution would even provide adequate capacities in the event that the traffic, as assumed in the forecasts, experienced continued exponential growth for the coming four decades.
38
VIEREGG - RÖSSLER GmbH
3. Feasibility Analysis of the Project Costs
3.1 Definition of the Project Costs
In the current political discussion, in the latest trade press articles and in the 2007 daily press, the costs of the FFBL project have been stated with broadly varying sums fluctuating between 4 billion EUR and 5.6 billion EUR, and in each case with the favored solution of a "4 + 2 cable-stayed bridge". In the April edition of the magazine, "Internationales Verkehrswesen" (‘International Transportation’), the investment costs at the 2005 price level are specified at exactly 4.086 billion EUR plus the costs for the rural connections in Denmark (700 million EUR, price level 2005) and Germany (1.095 billion EUR for die railway, 93 million EUR for the road, price level 2003).63 In the daily press, the costs are stated on the one hand at 4.8 billion EUR "including the connection to the Danish side"64, while on the other hand, the construction costs for the bridge alone are declared at 4.8 billion EUR plus "800 million Euros for the expansion of the roads and rail connections leading to the bridge".65 But in another section of the body of text a figure of 5.6 billion EUR is given66 as well as in a headline: "The 5.6 billion EUR crossing should be up by 2018"67.
It is therefore necessary to clearly define the project costs before they can be subjected to an evaluation at all, which includes a clear definition of the project itself:
� The fixed Fehmarnbelt Link project comprises in the following sections the bridge construction from coast to coast as well as short road and railway routes for connection to the existing transport network, but without upgrading the connecting rail and road access routes on the land-based side.
� The FFBL project costs consist on the one hand of the actual construction costs and on the other of costs for planning, construction supervision, project organization, risk premiums, insurance, operational preparations and reserves.68
The costs of the project defined as such at the 2004 price level – the most recent calculation – total 4.805 billion EUR, of which pure construction costs are calculated to total 3.686 billion EUR, comprised of 3.561 billion EUR for
39
VIEREGG - RÖSSLER GmbH MB
"Construction Costs", plus 0.125 billion EUR for "Additional Construction Costs".69
The following feasibility analysis of the project costs is initially limited to the exclusive construction costs, since the other cost components such as planning and construction supervision costs are generally derived directly from the construction costs, while risk premiums, insurance, costs for operational preparations and financial reserves are determined by a number of external factors, and not least as well by political guidelines. The total FFBL project costs are then analyzed regarding their feasibility in a final step.
3.2 Comparison of the Fehmarnbelt Bridge with Similar Bridges in Europe
For analysis of the feasibility of the Fehmarnbelt Bridge construction costs which have been calculated up to now, it makes sense to make use of the experiences with highly comparable structures that have already been erected. In the Denmark region, the Øresund Bridge and the bridges over the Big Belt are suitable. Since the Øresund Bridge is a cable-stayed bridge like the proposed Fehmarnbelt Bridge, while a suspension bridge was erected on the Big Belt, the Øresund Bridge appears to be the most suitable structure for calculating the costs of the Fehmarnbelt Bridge on this basis.
In recent years, a number of other large cable-stayed bridges have been erected in the world, none of which however are as similar to the Fehmarnbelt Bridge project as the Øresund Bridge. The two following bridges represent extreme cases in regard to construction costs:
The Ponte Vasco da Gama in Lisbon, Portugal is currently the longest bridge in Europe at some 17 km, and was put into operation during the Expo 1998. Only 5% of its overall length consists of a broadly spanned, cable-stayed bridge with a relatively generous passage height for ships (45 m). The predominant portion of the bridge runs relatively flat over the water surface of the Tejo. It is equipped exclusively with 6 lanes for road traffic and is currently used by 65,000 vehicles per day. The construction costs were relatively low at 53 million EUR per kilometer (price level 1998).
40
VIEREGG - RÖSSLER GmbH MB
The Rio-Andirrio Bridge near Patras in Greece, opened in 2004, links the mainland with the Peloponnes Peninsula. The main bridge bears a striking resemblance to the proposed main bridge of the Fehmarnbelt Link: Four large cable-stayed pylons equidistant at a pylon interval of 560 m, with a large passage height of approximately 50 m for ships. The Fehmarnbelt main bridge in comparison: Pylon intervals of 724 m each, passage height of 65 m. The sea underneath the Rio-Andirrio Bridge is deeper at 65 m than under the Fehmarnbelt, with a depth of 30 m. The Rio-Andirrio Bridge consists primarily of the main bridge (78%). If one deducts the costs for 3.5 km of connecting roads, tollgate and estimated project administration costs from the total costs of 771 million EUR for the bridge incl. short connecting routes, then the construction costs of only the bridge per kilometer of some 220 million EUR (price level 2004) are relatively high, which is above all qualified by the length ratio from the main bridge to preliminarily bridge sections of 78 : 22.
These two examples clearly demonstrate that in a comparison of the construction costs for bridges, much depends on the ratio of the length of the preliminary bridge sections to the length of the main bridge.
The Øresund Bridge, put into operation in 2000, has a length of 7,845 m and a clearance passage height of 57 m. The construction costs totaled 1.07 billion EUR70, or 133 million EUR per km.
In comparison with the Fehmarnbelt Bridge, the Øresund Bridge demonstrates similarities in several points:
� Four road lanes plus two rail lines � Share of the cable-stayed high-level bridge in relation to the overall
bridge length: 14% (Fehmarnbelt Bridge 17%) � Clearance passage height 57 m (Fehmarnbelt Bridge 65 m) � Similar geological conditions
This is augmented by the fact that the economic conditions (e.g., labor costs) at Øresund and Fehmarnbelt are very similar, while these conditions in Portugal and Greece differ more from those in Denmark and Germany or Sweden.
In regard to the span widths, there are nevertheless clear differences between the Øresund Bridge and the proposed Fehmarnbelt Bridge: The pylon interval on the main bridge at Øresund only totals 490 m, in contrast to Fehmarnbelt at 725 m. The preliminary bridge sections at Øresund have a pylon interval of 140 m, while at Fehmarnbelt this comprises 240 m.
Overall, the Fehmarnbelt Bridge span widths are significantly greater than at Øresund and also greater than in the other two cable-stayed bridges mentioned.
41
VIEREGG - RÖSSLER GmbH MB
However, the Tatara Bridge in Japan (890 m) and the Sutong Bridge in China (1,090 m) represent completed or ‘under construction’ cable-stayed bridges with even greater span widths. This means that the proposed span width of the Fehmarnbelt Bridge of 725 m is no technical breakthrough.
3.3 Projection of the Construction Costs of the Fehmarnbelt Bridge on the Basis of the Øresund Bridge
Since the Øresund Bridge, opened in 2000, bears a great similarity with the proposed Fehmarnbelt Bridge, it lends itself to determine the construction costs of this bridge on the basis of the actual accrued construction costs of the Øresund Bridge by means of a projection.
The construction costs of the Øresund Bridge are stated at 1.07 billion EUR at the 2000 price level.71
These costs contain no planning and project administration costs, but include the construction costs of a tollgate. The additional subsections of the entire Øresund link (tunnel, artificial island, land-based access routes) are also not included in these costs.72
On the basis of the bridge length of 7,845 m, construction costs result for the bridge structure alone without the tollgate (estimated at 25 million EUR) of 133.2 million EUR per kilometer (price level 2000).
If one were to take into account alone the differing length of the Fehmarnbelt Bridge from the Øresund Bridge (18,568 km vs. 7,845 km) – an increase of 2.37 times – then the construction costs at Fehmarnbelt would total 2.473 billion EUR, whereby this sum is related to the 2000 price level (like the Øresund Bridge).
This sum must now be multiplied with three correction factors due to further differences between the two bridges: These are related to (1) the length ratio of the main bridge to preliminary bridge sections, (2) the bridge height and (3) the bridge’s equipment and link with the existing transport network.
42
VIEREGG - RÖSSLER GmbH MB
(1) Ratio of the Main Bridge - Preliminary Bridge Sections
The ratio of the more expensive main bridge to the less costly preliminary bridge sections at the Øresund Bridge totals 14 : 86, while this ratio totals 17 : 83 for the Fehmarnbelt project. Research of a variety of comparable bridges revealed that cable-stayed main bridges are around 4 times as expensive as the preceding preliminary bridge sections featuring lower heights and smaller span widths. On the basis of this factor and the above-mentioned different ratios of main bridge and preliminary bridge, an overall additional costs totaling 6% can be mathematically derived, making the following calculation possible:
2.473 billion EUR x 1.06 = 2.621 billion EUR.
(2) Bridge Height
The Fehmarnbelt Bridge has a greater average pylon height than the bridge over the Øresund. Two effects come together here: For one, the 65 m maximum clearance height of the Fehmarnbelt is greater than Øresund, with 57 m. For another, the water depth of up to some 30 meters is greater than at Øresund, with 19 m. At Øresund, the highest point above the sea floor is calculated with 57 m + 19 m = 76 m; at Fehmarnbelt the calculation is 65 m + 30 m = 95 m, therefore 27% more.
In a comparison of bridge construction costs, the total construction costs can be mathematically broken down into one height-independent part and one height-dependent part, for which the costs proportionally increase with the height of the bridge. Based on a wealth of previous research by the authors, a rule of thumb in bridge construction can be accepted that a bridge of 27 m in height (in this case, above the sea floor, not above sea level) consists in somewhat equal part of height-dependent and height-independent construction costs, while a bridge with 2 times 27 m = 54 m in height leads to a ratio of 2-to-1. If one also takes the bridge heights of the preliminary bridge sections into account, then calculations reveal height-dependent additional costs of 17% for the Fehmarnbelt Bridge in comparison with the Øresund Bridge in accordance with the above-specified correlation.
The second correction calculation is therefore as follows:
2.621 billion EUR x 1.17 = 3.067 billion EUR. Construction costs for
the construction of the bridge of 3.067 billion EUR therefore emerge.
43
VIEREGG - RÖSSLER GmbH MB
(3) Bridge equipment, tollgate and link to the existing transport network
The construction of the bridge structure requires the necessary equipment for rail and road travel throughout its entire length of 18.6 km:
� Costs for the railway lines, their electrification and the signaling technology of some 10 million EUR per km must be calculated, which yields a total of 186 million EUR.
� An overall sum of 37 million EUR must be calculated for the far less expensive roadway (roadway covering, markings, signs, SOS telephones, etc.).
Furthermore, a tollgate for road traffic must be taken into account, which is projected at an overall sum of 25 million EUR (additional costs as opposed to exclusively roadway, incl. additional space requirements).
For the Fehmarnbelt Bridge to receive a connection with the existing transport network, making it usable in the first place, road and rail ramp structures of approximately 1.3 km in length are adjoined at each side of the bridge and newly routed ground level roadways, and rail lines each of 2.5 km in length as access routes to the bridge. If one calculates overall costs per kilometer for the roadway of 9 million EUR and 14 million EUR for the railway, then this amounts to total costs of 175 million EUR.
Taking these three additional items into account, the construction costs increase by 0.423 billion EUR to a total of 3.490 billion EUR.
The underlying construction costs of the Øresund Bridge at the 2000 price level are directly comparable with the 2004 price level of the Fehmarnbelt Bridge data. This is because construction costs have remained stabile during this period due to the downtrend economic trend.
The FFBL construction costs determined in this way with the 2004 price level therefore total 3.490 billion EUR. In contrast, previous calculations of the construction costs for this project totaled 3.686 billion EUR.73 In both cases, no costs have yet been included for planning, construction supervision and project organization. The approximation method applied therefore produces the result that the engineering calculation of the FFBL holds up to a feasibility analysis on the basis of the costs of the Øresund Bridge, and its result actually demonstrates construction costs at 5% lower. For this reason, the officially specified sum of 3.686 billion EUR, which has proven plausible, will provide the basis for the remaining considerations.
44
VIEREGG - RÖSSLER GmbH
3.4 Possible Increased Costs
The following section addresses the question of possible increased costs for the FFBL project, whereby three cost factors must be observed: (1) Wind deflection measures, (2) geological risks and (3) rising prices.
3.4.1 Possible Increased Cost as a Result of Wind Deflection Measures
The proposed large-scale bridge over the Fehmarn runs diagonally to the main wind direction, while the bridges over the Big Belt and over Øresund are situated parallel to the main wind direction. There must therefore be concern that in response to weather conditions, the Fehmarnbelt Bridge will be closed to road travel more often than the bridges at Øresund and Big Belt. One indicator for this suspicion is provided by the Fehmarnsund Bridge, which is closed to light road vehicles for an annual average of 200 hours or 2% of the year.74 In order to clarify this question, the National Laboratory, Roskilde and the German Weather Services in Hamburg conducted an investigation together of the wind sensitivity of the Fehmarnbelt Bridge. This involved applying empirically ascertained data on the wind speed and direction at Fehmarnbelt for projections which revealed the speeds and directions of the wind to be anticipated on the future travel routes of the FFBL.75 According to these calculations, the projected average downtime for road travel totals 170 hours annually, while downtime total 130 hours at Big Belt and 98 hours at Øresund.76
This projected downtime of the Fehmarnbelt Bridge cannot however be compared directly with the actual downtime at Big Belt, because stricter criteria apply in regard to the FFBL for the suspension of vehicle traffic than those which apply for the Big Belt fixed link. The same applies for the obvious comparison with the Fehmarnsund Bridge, which has an annual average of 200 hours downtime, making it higher than the projected value for the Fehmarnbelt Bridge. This is because the German Police shut down the Fehmarnsund bridge to vehicle traffic when a wind speed of 17 m/s (61 km/h) occurs, regardless of the wind direction. As with the Øresund Bridge, a differentiated procedure will be applied for the Fehmarnbelt link: The regulation requiring closing down will only apply in the event of side wind of at lest 17 m/s, while in the case of other wind directions a higher value of 21 m/s will apply as the criterion for closing the bridge. This type of differentiation is thoroughly plausible and has apparently proven itself at Øresund.
45
VIEREGG - RÖSSLER GmbH MB
It is technically possible with the aid of wind deflection walls or screens to substantially diminish the hazard presented to road vehicles by side winds without seriously increasing the wind pressure on the structure itself. These wind deflection installations are perforated for this purpose.77 Such wind deflection systems were installed on the approximately 300 m high Pont de Millau in southern France (opening year 2004) and have proved to be very effective there. If the Fehmarnbelt Bridge is also equipped with such wind deflection walls or screens, then the bridge’s downtimes can be drastically reduced from 2% annually to a predicted 0.25%.78 Closure is then only necessary in the case of wind speeds that are double what would be required without protective installations.
The following investments can be anticipated for furnishing the Fehmarnbelt Bridge with wind deflection walls: If one uses the cost of noise-protection walls for orientation, then a consecutive meter of wind deflection wall could cost up to 2,000 EUR. If these walls are installed on the entire 18.6 km length of the bridge on both sides, then the resulting total costs add up to just short of 75 million EUR. As such, the costs indicated up to now in this regard of only 15 to 50 million EUR79 represent an underestimate.
Altogether however, despite the installation of wind deflection equipment, the FFBL construction costs demonstrate only a minimal increase of around 2%. But this increased cost does not apply at all if one rejects the installation of the specified wind deflection walls and accepts that the bridge is likely to be closed for 170 hours annually.
3.4.2 Possible Increased Cost as a Result of Geological Risks
In the case of several large transport projects which have been completed in recent years or are still under construction, significant increased costs over the calculations conducted prior to construction begin emerged; examples include the Eurotunnel, Berlin’s Nord-Süd-Tunnel, the Big Belt Railway Tunnel, Gotthard-Basistunnel, tunnels of the Austrian Unterinntal Railway Line and multi-tunnel ICE routes Cologne - Frankfurt and Nuremberg - Ingolstadt. It is probable that corners were cut on geological research, particularly when it can be advantageous for national project sponsorship and approval if one does not actually know the genuine construction costs which then first raise their head due to geological difficulties once construction work has already begun, allowing one early on in good conscience to set the costs relatively low.
46
VIEREGG - RÖSSLER GmbH MB
Nevertheless, the construction costs for tunnels can also be calculated precisely, as was the case in the relatively "older" DB ICE routes (Hannover - Würzburg and Mannheim - Stuttgart): In these cases, the actual construction costs came in under the originally calculated costs, whereby the realization of the structures at the end of the 80s took place in a period when construction costs fell due to mild deflation.
The geological conditions for a drilled tunnel below the Fehmarnbelt could be precisely researched at all points thanks to the shallow water depth, the low level of coverage of the tunnel under the sea floor and the good accessibility via ship, in contrast to tunnels in mountains which require extremely deep shafts or drilled holes for geological analysis, for example as in the case of the Gotthard-Basistunnel with coverings of up to 2,500 m.
The risk of increased costs is in any case lower with structures which are not located underground, but which primarily emerge from underground, and this applies in particular for bridges. This is because aside from a firm stabilization of the bridge pylons and abutments, which requires reliable preliminary geological research, the significant construction costs of bridges consist of the bridge length, the type of construction of the bridge-bearing structure, the material used and the number and height of the bridge pylons.
For this reason, it is not anticipated that the proposed Fehmarnbelt Bridge will be confronted with dramatically increased costs due to as yet unknown geological problems, in contrast to innercity railway tunnels and tunnel train stations, as well as Alpine basis tunnels.
3.4.3 Increased Cost as a Result of Rising Prices from 2004 to 2007
While construction costs remained more or less stabile or even fell during the 2000 - 2004 period, 2005 saw a clear increase in costs which accelerated more and more. Construction prices rose from February 2006 to February 2007, i.e., in a single year, by over 7%. The prices for steel construction work, which contain both raw materials and energy as well as labor costs, even rose by 11.3%. The greatest factors driving costs in this regard are the prices of raw materials and energy. The price for scrap and iron ore, the basic materials for the manufacture of steel, increased from 2000 to 2007 by 182%, almost tripling.80
47
VIEREGG - RÖSSLER GmbH MB
The general construction prices determined by the German National Statistics Office rose from 2004 to 2007 by around 15%. In a large-scale project like the Fehmarnbelt Bridge, the share of wages in the total costs is lower and the share of raw materials and energy is greater than in numerically frequent but relatively small projects, such as the construction of a house. For this reason, large structures are disproportionately affected by price increases for raw materials. The German National Statistics Office indicates a growth rate for the price of building materials from May 2003 to May 2007 of 40.9%.81 It can therefore be assumed that the actual price increase since 2004 is indeed over 15%, but under 40%, probably in the range of 25% to 30%. This raises the construction costs of the FFBL, at least as indicated in the equation below proceeding from the already corrected 2004 construction costs (see Chapter 3.4):
3.686 billion EUR x 1.25 billion EUR = 4.608 billion EUR.
The construction costs therefore increase by some 0.9 billion EUR and rise to around 4.6 billion EUR.
If the construction prices on the other hand would only increase within the framework of the normal inflation rate, then this would be immaterial to the decision regarding the realization of the structure. This is because the future earnings from the toll and the tax earnings by the Danish state for servicing the government loans would rise in the same fashion. But in the case of the FFBL construction costs, there is a clear emphasis on the increase in raw material and energy prices, i.e., the increased investments are not countered by correspondingly high yields from toll earnings and general tax income. On the contrary, it must be anticipated that rising energy prices will have a dampening effect on the anticipated traffic volume, resulting in a threatening gap: On the one side, rising investment costs and on the other side sinking returns from the future toll.
3.5 Project Costs Update
As depicted in the previous chapter, the sole construction costs at the 2007 price level total 4.608 billion EUR. In order to be able to comment on the total project costs in relation to the year 2007, the costs for planning and project execution totaling 1.119 billion EUR (price level 2000 or 2004) must be accounted for. For this, only the general price increase rate of around 2% annually applies, bringing the planning and project execution costs in at the 2007 price level to 1.188 billion EUR. Altogether then, the FFBL project in 2007 requires investments of
4.608 billion EUR + 1.188 billion EUR = 5.796 billion EUR.
48
VIEREGG - RÖSSLER GmbH MB
Compared to the 2004 price level, the overall project costs therefore increase from some 4.8 billion EUR by around 1 billion EUR to approximately 5.8 billion EUR.
It must be noted on this point that the stated sum does not yet contain any investments for the proposed expansion of the roadways and railway lines feeding the Fehmarnbelt, for which alone almost 1.9 billion EUR is estimated, and indeed at the price level 2003 or 2005.82 Calculated up the current 2007 price level, these additional costs, which are to be imposed on the public funds in Denmark and Germany, total some 2.3 billion EUR. The overall investment volume (FFBL plus access routes) therefore attains a dimension in 2007 of over 8 billion EUR.
3.6 Possible Project Costs in the Completion
The financial analyses and traffic forecasts still assume that the FFBL will be opened in 2012.83 This would mean that starting today, only 5 years would be available for the entire project approval phase as well as the actual construction work. This time requirement cannot be described as realistic, above all measured against the approval and construction time of the significantly short Øresund bridge: From signing of the Swedish-Danish building contract in 1991, it still took 9 years until the bridge was opened in the Summer of 2000, in which the actual construction of the bridge took 4 years. In light of the fact that there is not yet a firm FFBL building contract between Denmark and Germany, and in particular according to prior experience with similarly large projects that approval for the bridge section on the German side is likely to take several years, the earliest possible opening of the Fehmarnbelt Bridge should be expected in 10 years, i.e., in 2018. This is subject to the construction preparations incl. the approval process taking 4 years and the construction work itself taking 6 years.
In this case, the determination of the average price increase of the entire project in the middle-phase of the construction phase, or 2015, provides the standard. Viewed in this way, from the end of 2007, another 8 years of continuous price increases must be budgeted for. Two scenarios are conceivable for this situation:
49
VIEREGG - RÖSSLER GmbH MB
(1) If the further global and subsequently associated increase in prices dissipates during this period and the project costs rise only within the context of general price inflation (2% annually as before), then further additional costs of almost 1 billion EUR will emerge, raising the total FFBL project costs to around 6.8 billion EUR . These additional costs are also confronted by correspondingly higher earnings in the future, which are also related to inflation. If one accounts for the investments for upgrading the access routes north and south of the Fehmarnbelt (some 2.3 billion EUR at the 2007 price level, around 2.7 billion EUR at the 2015 price level), then costs of around 9.5 billion EUR will accrue until start-up.
(2) If, in contrast, the shortage and subsequent cost increase of energy and raw materials of 2007 continues until 2015, then this well lead to further additional costs for the FFBL project of 1 to 2 billion EUR. The total costs of the project will then stand at a scale of 8 to 9 billion EUR, which can nevertheless only be compensated in small part by increased earnings related to inflation. In the worst but most probable case, traffic volume will decrease as a result of the shortage of and the rise in the price of energy (see Chapter 2.7), with the consequence that the earnings from the bridge toll and railway line fees will even fall. The gap between rising project costs and falling earnings will open dramatically and represent a financial risk for the public budgets. Considering the costs for the expansion of the access routes, which should surpass the 3 billion Euro mark in this situation, the total investments even stand at as much or more than 11 to 12 billion EUR.
The problems indicated will intensify to the extent that the opening of the FFBL is put off to the future, which is by no means the exception in such large-scale projects. Instead, it tends to embody the rule, as demonstrated by the example of the English-French Canal Tunnel and meanwhile its financial difficulties, which can scarcely be remedied at this stage. But while the Canal Tunnel is part of one of the most important corridors in European traffic and is therefore capable of generating relatively high earnings, Fehmarnbelt, with its relatively small road and rail traffic volumes, will in comparison only accrue low levels of revenue.
50
VIEREGG - RÖSSLER GmbH MB
3.7 Summary
By means of a projection of the FFBL construction costs proceeding from the actual costs of the Øresund Bridge, the officially announced project costs of some 4.8 billion EUR at the 2004 price level can be confirmed relatively well. In relation to the 2007 price level however, clearly higher costs emerge and stand at some 5.8 billion EUR, whereby primarily it is the construction of the bridge itself with its relatively high price increases (at least 25%) which is responsible for this rise in costs, while the planning and project execution costs only grow in accordance with the general inflation rate. If one realistically anticipates a continuation of the heavy rise in the cost of energy and raw materials that is currently evident, then the total costs until possible opening of the bridge in 2018 will rise up to around 9 billion EUR, and indeed without investments in the access routes to be expanded. In this regard, the price level of the year in the middle of the building phase, namely 2015, is taken as the basis. In light of these high project costs, a particularly heavy burden on the Danish national budget emerges, despite the prospective subsidies from the EU (only around 10% of the investment sum)84.
51
VIEREGG - RÖSSLER GmbH
4. Summary and Outlook
The traffic volumes indicated in the forecasts or established in advance in the assumptions represent a drastic overestimate for many reasons: Instead of some 8,000 motorized vehicles and around 100 trains per day, only a few years after the FFBL is opened a mere 5,000 or so road vehicles and a maximum of 36 trains can be anticipated. This will result in only 10% utilization of the 4 road lanes of the proposed bridge and only 4% utilization of the two rail lines. Since realistically, there is also no anticipated traffic growth in the long-term, the road-based capacity of this structure will be 90% unused, while over 96% of the rail-based capacity will go unused.
In contrast to the overestimated FFBL traffic volume, the indicated official project costs of around 4.8 billion EUR (price level 2004) appear plausible. In relation to the current 2007 price level however, the total costs of some 5.8 billion EUR are instead significantly higher, which is above all attributable to the very high price increases in the construction sector in the last 3 years. If the current drastic rise in energy and raw material costs continues in the upcoming years, then the total costs until the possible start-up of the bridge in 2018 could rise to around 9 billion EUR. This is augmented by the investments in the access routes to be expanded, which is likely to require over 3 billion EUR.
Later amortization of the high investments undertaken through earnings from the road and rail traffic (bridge toll for automobiles, omnibuses, heavy goods vehicles and rail line usage fees for passenger trains and freight trains) appears to be impossible in light of the relatively low traffic volume on the bridge. If one considers the negative effects of the rising energy prices in regard to traffic development and its trend, then the anticipated tendency is for traffic volume to decrease and consequently the earnings as well from year to year, which will lead to an ever-increasing deficit in the entire FFBL project. This is further complicated by the fact that every postponement of the start-up of the Fehmarnbelt Bridge attributable to the disproportionately rising raw material and energy prices has heavy construction cost increases as a result, while traffic volumes are likely to continue to decline. This is why the gap between the growing construction costs and the shrinking earnings will bring shrinking revenues with each year of delay.
52
VIEREGG - RÖSSLER GmbH MB
A reduction of the project as a combined-rail solution adapted to a level corresponding with the actual, relatively small demand does not seem logically possible: The transportation-related lower limit of two road lanes and one rail line on the bridge cannot be undercut. However, two lanes plus one rail line represent 3 – 5 times the necessary capacity measured against the traffic volumes to be realistically anticipated. From a rational, economical perspective, only the retention of ferry operation and the rejection of any Fehmarnbelt fixed link is appropriate. But if one considers the more emotional factor that the residents of the Danish islands of Seeland, Falster and Lolland and in particular the residents of the Danish capital of Copenhagen have a strong desire for a "fixed", reliable connection directly to the south without the necessity of depending upon the “swaying” ships sailing across the sometimes turbulent sea, then a compromise solution of an FFBL with two road lanes and one rail line is absolutely conceivable. Nonetheless, for this, every opportunity for reducing the costs of the overall project should be sounded out. Since the previous discussion of variations was extensively concentrated on 4 + 2 solutions, the matter must be completely reexamined for an ideal 2 + 1 solution.
The ultimate solution to be implemented for the FFBL must simultaneously not be viewed as separated from the double-problem of the greenhouse gas effect and the threatening crude oil shortage: Low-emission, energy-saving transport carriers should be specifically promoted in long-distance travel between Germany - Denmark/Sweden/Norway. It therefore follows that in general, rail traffic (for persons and goods) – along with goods transport per ship – should be more highly valued in the Hamburg - Lübeck - Copenhagen corridor than previously, and indeed as sustainable alternatives to the booming passenger airline traffic and to heavy goods vehicle traffic, which had been growing up to now. For this reason, the railway access routes to the FFBL in Denmark and Germany require a significantly higher expansion standard than the previously pursued speed level of only 160 km/h.85
The proposed route speed of 160 km/h on the railway axis from Hamburg via Lübeck to Copenhagen can already be designated as too low because comparable routes western Europe between two neighboring metropolitan population density centers such as London - Paris, Amsterdam - Brussels, Brussels - Paris, Lyon - Paris, Barcelona - Madrid, Turin - Milan, Napels - Rome and Cologne - Frankfurt (Main) already have a continuous speed level today for long-distance passenger trains of 250 to 320 km/h, or will have this soon.
53
VIEREGG - RÖSSLER GmbH MB
If the Fehmarnbelt rail connection would upgrade the rail connection on the Danish and German sides for at least a speed of 250 km/h, then without the FFBL at all, the crossing time for EC and ICE trains between Hamburg and Copenhagen could be reduced from their current time of 4 1/2 hours down to 3 hours, representing a crossing time reduction of at least 90 minutes, or 33%. The FFBL between Rødby and Puttgarden then additionally generates a crossing time reduction of around 1 hour, making a crossing time between Hamburg and Copenhagen of 2 hours thoroughly possible. In such case, a majority of today’s passengers flying between large northern German cities and Copenhagen could be won over to the railway, which would lead directly to increased earnings for the FFBL operator company.
In comparison to the expansion already proposed for 160 km/h, the above-mentioned increase in the speed level of the trains to 250 km/h only requires relatively low, rail-related additional costs; after all, even for 160 km/h, large sections of the existing, curved route, some of which even partially resemble a light railway line, must be upgraded anyway. The accruing additional financial expenditure will be more than compensated through the high level of additional benefits which the most genuine possible high-speed transport would generate.
54

VIEREGG - RÖSSLER GmbH MB
Source References