Embed Size (px)
Citation preview
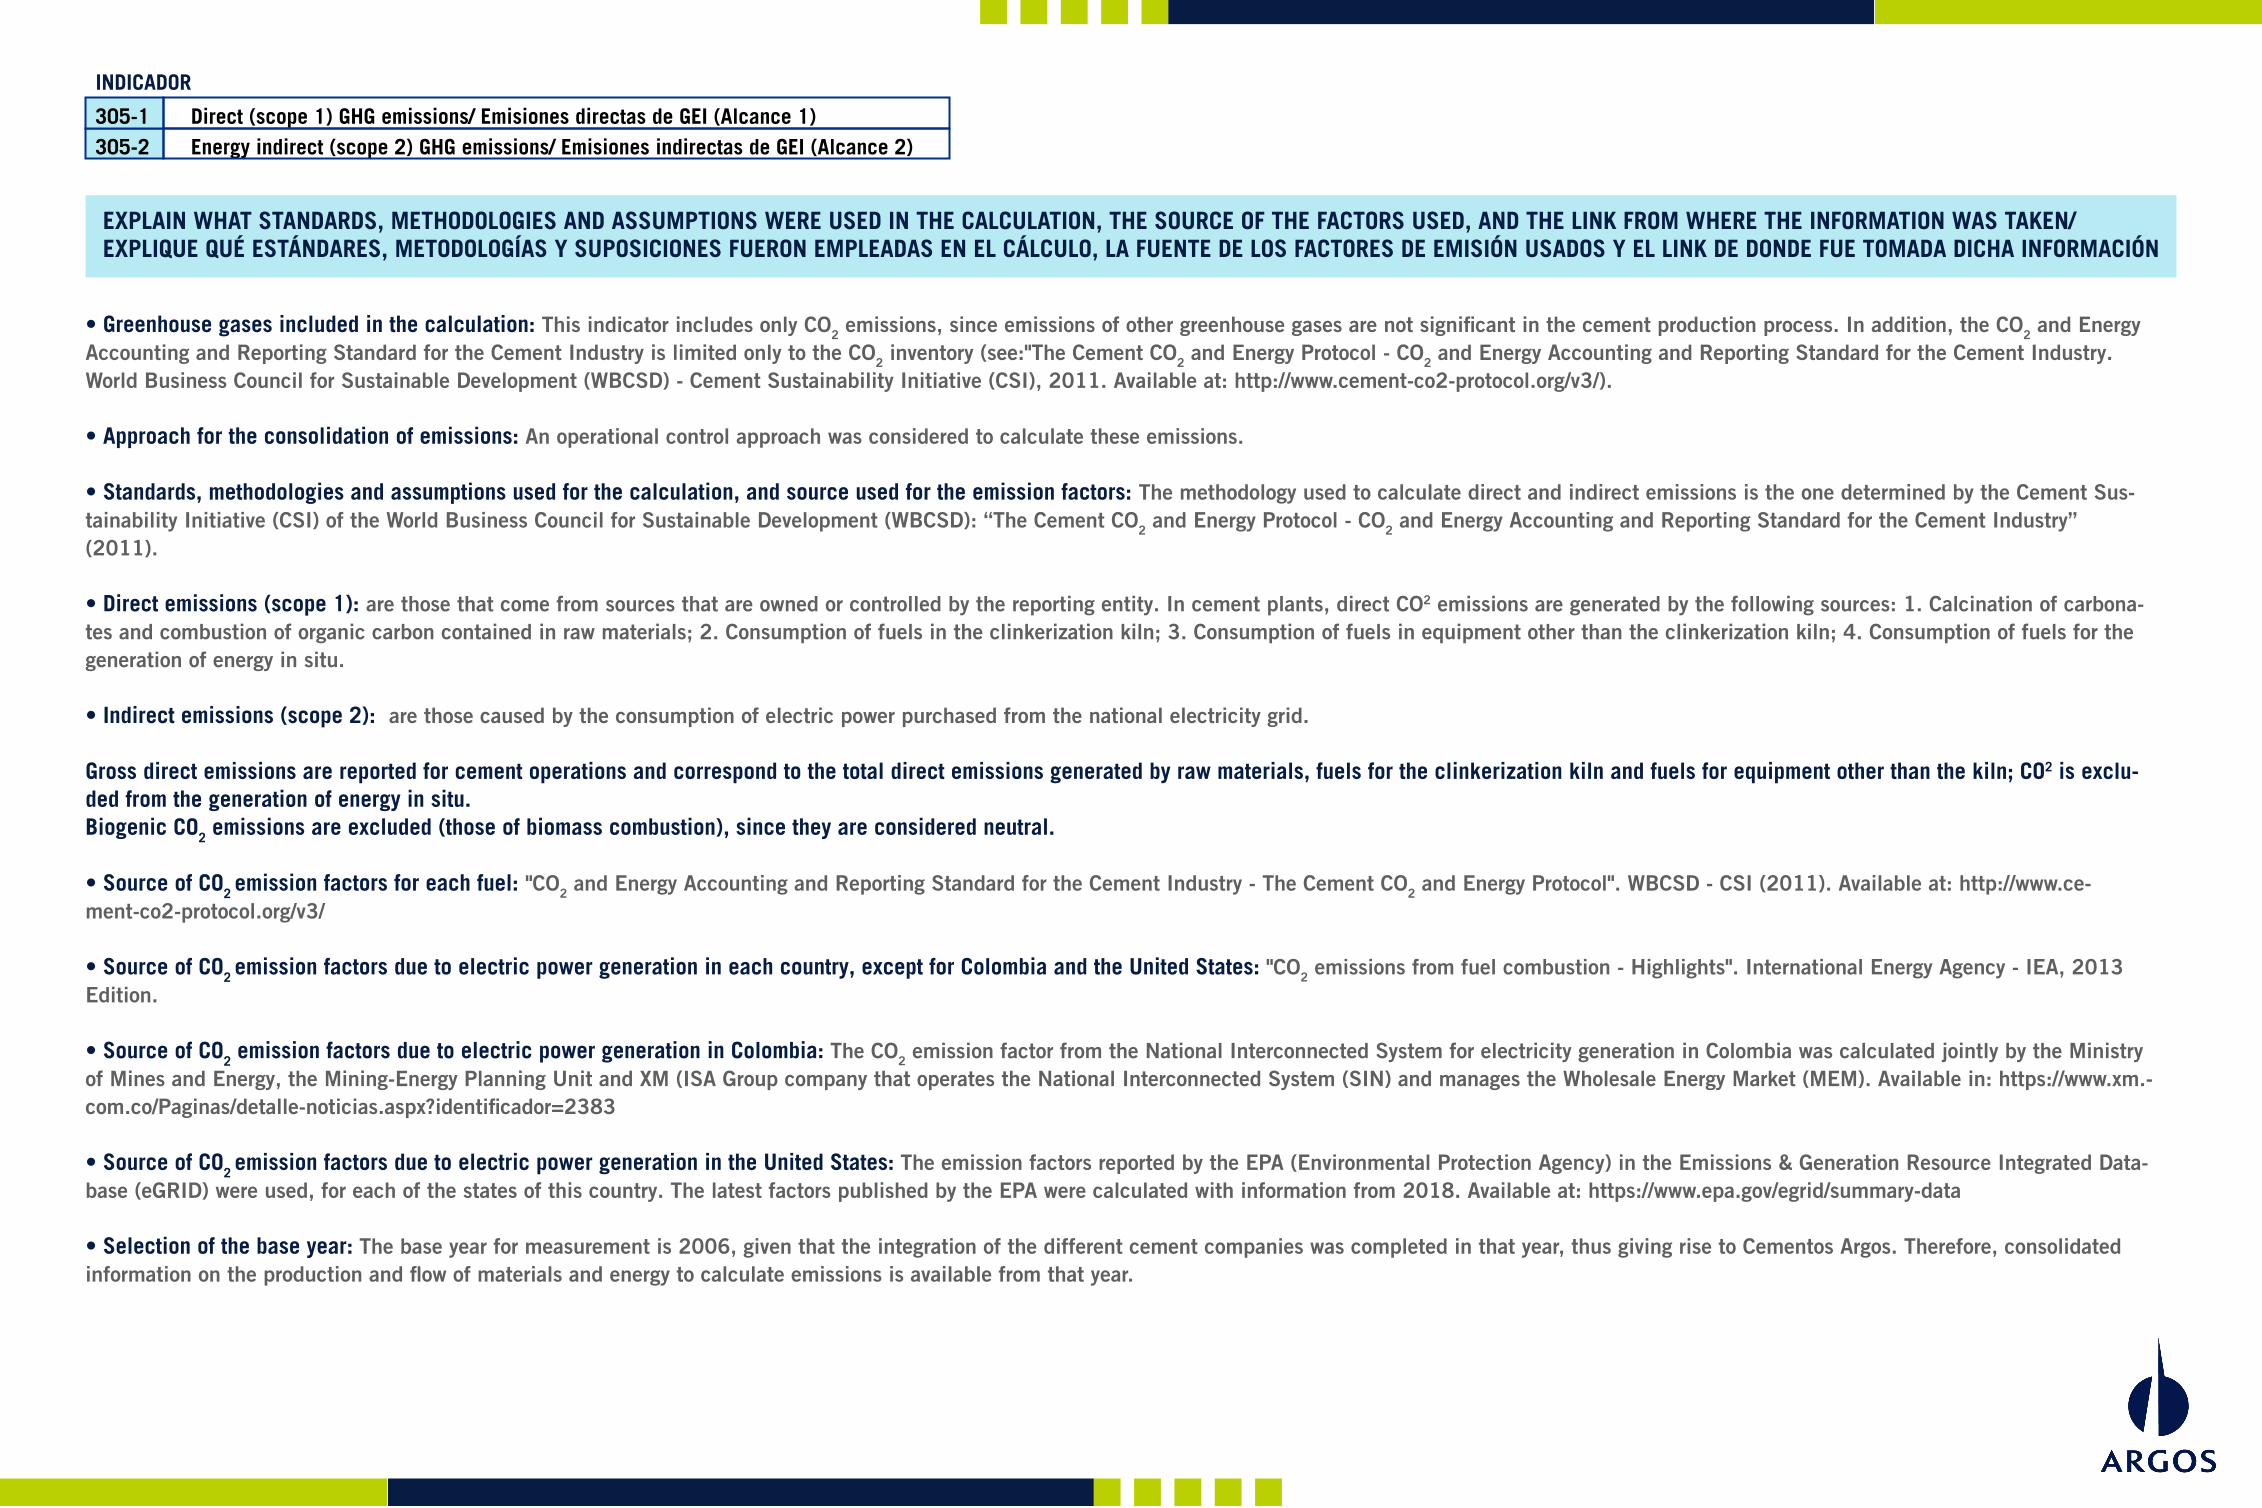
305-1 Direct (scope 1) GHG emissions/ Emisiones directas de GEI (Alcance 1) 305-2 Energy indirect (scope 2) GHG emissions/ Emisiones indirectas de GEI (Alcance 2)
INDICADOR
EXPLAIN WHAT STANDARDS, METHODOLOGIES AND ASSUMPTIONS WERE USED IN THE CALCULATION, THE SOURCE OF THE FACTORS USED, AND THE LINK FROM WHERE THE INFORMATION WAS TAKEN/EXPLIQUE QUÉ ESTÁNDARES, METODOLOGÍAS Y SUPOSICIONES FUERON EMPLEADAS EN EL CÁLCULO, LA FUENTE DE LOS FACTORES DE EMISIÓN USADOS Y EL LINK DE DONDE FUE TOMADA DICHA INFORMACIÓN
• Greenhouse gases included in the calculation: This indicator includes only CO2 emissions, since emissions of other greenhouse gases are not significant in the cement production process. In addition, the CO2 and Energy Accounting and Reporting Standard for the Cement Industry is limited only to the CO2 inventory (see:"The Cement CO2 and Energy Protocol - CO2 and Energy Accounting and Reporting Standard for the Cement Industry. World Business Council for Sustainable Development (WBCSD) - Cement Sustainability Initiative (CSI), 2011. Available at: http://www.cement-co2-protocol.org/v3/).
• Approach for the consolidation of emissions: An operational control approach was considered to calculate these emissions.
• Standards, methodologies and assumptions used for the calculation, and source used for the emission factors: The methodology used to calculate direct and indirect emissions is the one determined by the Cement Sus-tainability Initiative (CSI) of the World Business Council for Sustainable Development (WBCSD): “The Cement CO2 and Energy Protocol - CO2 and Energy Accounting and Reporting Standard for the Cement Industry” (2011).
• Direct emissions (scope 1): are those that come from sources that are owned or controlled by the reporting entity. In cement plants, direct CO2 emissions are generated by the following sources: 1. Calcination of carbona-tes and combustion of organic carbon contained in raw materials; 2. Consumption of fuels in the clinkerization kiln; 3. Consumption of fuels in equipment other than the clinkerization kiln; 4. Consumption of fuels for the generation of energy in situ.
• Indirect emissions (scope 2): are those caused by the consumption of electric power purchased from the national electricity grid.
Gross direct emissions are reported for cement operations and correspond to the total direct emissions generated by raw materials, fuels for the clinkerization kiln and fuels for equipment other than the kiln; CO2 is exclu-ded from the generation of energy in situ.Biogenic CO2 emissions are excluded (those of biomass combustion), since they are considered neutral.
• Source of CO2 emission factors for each fuel: "CO2 and Energy Accounting and Reporting Standard for the Cement Industry - The Cement CO2 and Energy Protocol". WBCSD - CSI (2011). Available at: http://www.ce-ment-co2-protocol.org/v3/
• Source of CO2 emission factors due to electric power generation in each country, except for Colombia and the United States: "CO2 emissions from fuel combustion - Highlights". International Energy Agency - IEA, 2013 Edition.
• Source of CO2 emission factors due to electric power generation in Colombia: The CO2 emission factor from the National Interconnected System for electricity generation in Colombia was calculated jointly by the Ministry of Mines and Energy, the Mining-Energy Planning Unit and XM (ISA Group company that operates the National Interconnected System (SIN) and manages the Wholesale Energy Market (MEM). Available in: https://www.xm.-com.co/Paginas/detalle-noticias.aspx?identificador=2383
• Source of CO2 emission factors due to electric power generation in the United States: The emission factors reported by the EPA (Environmental Protection Agency) in the Emissions & Generation Resource Integrated Data-base (eGRID) were used, for each of the states of this country. The latest factors published by the EPA were calculated with information from 2018. Available at: https://www.epa.gov/egrid/summary-data
• Selection of the base year: The base year for measurement is 2006, given that the integration of the different cement companies was completed in that year, thus giving rise to Cementos Argos. Therefore, consolidated information on the production and flow of materials and energy to calculate emissions is available from that year.
MEASUREMENT BASELINE YEAR 2006
2016 2017 2018 2019 2020
EXPLAIN WHAT STANDARDS, METHODOLOGIES AND ASSUMPTIONS WERE USED IN THE CALCULATION, THE SOURCE OF THE FACTORS USED, AND THE LINK FROM WHERE THE INFORMATION WAS TAKEN
• Greenhouse gases included in the calculation: Only CO2 emissions were included in this indicator.
• Approach for the consolidation of emissions: An operational control approach was considered to calculate these emissions.
• Standards, methodologies and assumptions used for the calculation, and source used for the emission factors: The methodology used to calculate direct and indirect emissions is the one determined by the Corpora-te Accounting and Reporting Standard - The Greenhouse Gas Protocol, of the World Business Council for Sustainable Development (WBCSD) and the World Resources Institute (WRI) (2004).
• The following equation was taken into account for the calculation of direct emissions in concrete operations: Direct concrete emissions = Fuel consumption * Lower calorific value of fuel * CO2 emission factor as-sociated with fuel. Indirect emissions (scope 2) are those caused by the consumption of electric power purchased from the national electricity grid.
• The following equation was taken into account for the calculation of indirect emissions in concrete operations: Indirect concrete emissions = Consumption of electric power purchased from the national grid of each country * CO2 emission factor of the national electricity grid of each country.
• Source of CO2 emission factors for each fuel: "CO2 and Energy Accounting and Reporting Standard for the Cement Industry - The Cement CO2 and Energy Protocol". WBCSD - CSI (2011). Available at: http://www.-cement-co2-protocol.org/v3/.
• Source of CO2 emission factors due to electric power generation in each country, except for Colombia and the United States: "CO2 emissions from fuel combustion - Highlights". International Energy Agency - IEA, 2013 Edition.
• Source of CO2 emission factors due to electric power generation in Colombia: The CO2 emission factor from the National Interconnected System for electricity generation in Colombia was calculated jointly by the Ministry of Mines and Energy, the Mining-Energy Planning Unit and XM (ISA Group company that operates the National Interconnected System (SIN) and manages the Wholesale Energy Market (MEM). Available in: https://www.xm.com.co/Paginas/detalle-noticias.aspx?identificador=2383
• Source of CO2 emission factors due to electric power generation in the United States: The emission factors reported by the EPA (Environmental Protection Agency) in the Emissions & Generation Resource Integra-ted Database (eGRID) were used, for each of the states of this country. The latest factors published by the EPA were calculated with information from 2018. Available at: https://www.epa.gov/egrid/summary-data
DIRECT AND INDIRECT GHG EMISSIONS FROM CEMENT
305-1 Direct GHG emissions tCO2/ Emisiones directas de GEI tCO2
305-2 Indirect GHG Emissions tCO2/ Emisiones indirectas de GEI tCO2
Direct and Indirect GHG Emissions from Cement tCO2
7.610.118 7.4755.44 7.794.246 8.186.930 7.281.478
320.246 417.858 436.090 432.834 399.728
7.930.364 7.893.403 8.230.336 8.619.764 7.681.206
2016 2017 2018 2019 2020DIRECT AND INDIRECT GHG EMISSIONS FROM CONCRETE
305-1 Direct GHG emissions tCO2
305-2 Indirect GHG Emissions tCO2
Direct and Indirect GHG Emissions from Concrete tCO2
68.130 135.921 114.944 126.796 72.026
20.610 17.900 14.968 12.737 14.041
88.741 153.821 129.912 139.533 86.067
2016 2017 2018 2019 2020DIRECT GHG EMISSIONS FROM ELECTRICITY
305-1 Direct GHG emissions t CO2 - Electricity 505.562 553.278 384.307 395.896 416.468
EXPLAIN WHAT STANDARDS, METHODOLOGIES AND ASSUMPTIONS WERE USED IN THE CALCULATION, THE SOURCE OF THE FACTORS USED, AND THE LINK FROM WHERE THE INFORMATION WAS TAKEN
EXPLAIN WHAT STANDARDS, METHODOLOGIES AND ASSUMPTIONS WERE USED IN THE CALCULATION, THE SOURCE OF THE FACTORS USED, AND THE LINK FROM WHERE THE INFORMATION WAS TAKEN
• Greenhouse gases included in the calculation: Only CO2 emissions were included in this indicator.
• Approach to the consolidation of emissions: An operational control approach to calculate emissions was considered.
• Standards, methodologies and assumptions used for the calculation, and source used for the emission factors: The methodology used to calculate direct emissions is determined by the Cement Sustainability Initia-tive (CSI) of the World Business Council for Sustainable Development (WBCSD): “The Cement CO2 and Energy Protocol - CO2 and Energy Accounting and Reporting Standard for the Cement Industry ”(2011). Availa-ble at: http://www.cement-co2-protocol.org/v3/
• The following equation was taken into account for the calculation of direct emissions in on-site power generation operations: Direct emissions from on-site power generation operations = Fuel consumption * Lower calorific value of fuel * Emission emission factor CO2 associated with the fuel.
• Source of CO2 emission factors for each fuel: “Accounting and Reporting Standard for CO2 and Energy for the Cement Industry - Energy and CO2 Protocol in the Cement Industry”. WBCSD - CSI (2011). Available at: http://www.cement-co2-protocol.org/v3/
• Greenhouse gases included in the calculation: Only CO2 emissions were included in this indicator.
• Approach for the consolidation of emissions: An operational control approach was considered to calculate these emissions.
• Standards, methodologies and assumptions used for the calculation, and source used for the emission factors: The methodology used to calculate direct and indirect emissions is the one determined by the Corpora-te Accounting and Reporting Standard - The Greenhouse Gas Protocol, of the World Business Council for Sustainable Development (WBCSD) and the World Resources Institute (WRI) (2004).
• The following equation was taken into account for the calculation of direct emissions in aggregates operations: Direct aggregates emissions = Fuel consumption * Lower calorific value of fuel * CO2 emission factor associated with fuel.
• The following equation was taken into account for the calculation of indirect emissions in aggregates operations: Indirect aggregates emissions = Consumption of electric power purchased from the national grid of each country * CO2 emission factor of the national electricity grid of each country.

• Source of CO2 emission factors for each fuel: "CO2 and Energy Accounting and Reporting Standard for the Cement Industry - The Cement CO2 and Energy Protocol". WBCSD - CSI (2011). Available at: http://www.-cement-co2-protocol.org/v3/.
• Source of CO2 emission factors due to electric power generation in each country, except for Colombia: "CO2 emissions from fuel combustion - Highlights". International Energy Agency - IEA, 2013 Edition.
• Source of CO2 emission factors due to electric power generation in Colombia: The CO2 emission factor from the National Interconnected System for electricity generation in Colombia was calculated jointly by the Ministry of Mines and Energy, the Mining-Energy Planning Unit and XM (ISA Group company that operates the National Interconnected System (SIN) and manages the Wholesale Energy Market (MEM). Available in: https://www.xm.com.co/Paginas/detalle-noticias.aspx?identificador=2383
2016 2017 2018 2019 2020DIRECT AND INDIRECT GHG EMISSIONS FROM AGGREGATES
305-1 Direct GHG emissions tCO2 /Aggregates
305-2 Indirect GHG Emissions tCO2/Aggregates
Direct and Indirect GHG Emissions from Aggregates tCO2
2.554 3.143 4.899 4.009 2.806
1.414 877 1.109 752 656
3.969 4.019 6.007 4.760 3.462
2016 2017 2018 2019 2020
(305-1) Total direct emissions tCO2 -CEMENTOS ARGOS
(305-2) Total Indirect emissions tCO2 - CEMENTOS ARGOS
Total Emissions tCO2 - CEMENTOS ARGOS
8.186.365 8.167.887 506.167 8.713.631 7.772.778
342.271 436.634 452.167 446.322 414.425
8.528.636 8.604.521 958.334 9.159.953 8.187.203

SOURCES OF SCOPE3 EMISSIONS
CATEGORY EVALUATION STATUS
2016 2017 2018 2019 2020PERCENTAGE OF EMISSIONSCALCULATED USING DATAOBTAINED FROMSUPPLIERS OR VALUE CHAIN PARTNERS
STANDARDS, METHODOLOGIES AND ASSUMPTIONS IN THE CALCULATION, GASES INCLUDED IN THE CALCULATION, AS WELL AS THE SOURCE OF EMISSION FACTORS AND GWP
COMMENTS
From 2016 to 2019 Argos' scope 3 emissions calculations were made with Quantis SUITE 2.0 software from Quantis Enterprise, however this application was withdrawn from the market by Quantis in 2020. Due to this fact, Argos con-tracted with this same company the develop-ment of a customized tool that makes the same quantification as Quantis Suite 2.0. Likewise, the tool developed by Quantis for Argos works under the GHG Protocol methodology “Accoun-ting and Reporting Standard for the Corporate Value Chain (Scope 3)” (World Business Council for Sustainable Development (WBCSD) and World Resources Institute (WRI) (2011), and under the "Cement Sector Scope 3 GHG Ac-counting and Reporting Guidance" developed by WBCSD (2016).
Coverage: Cement, concrete and aggregates operations of the Colombia, Caribbean and Cen-tral America and USA regions.
Argos prioritized 5 categories as "Relevant" of the 15 categories that comprise the Scope 3. The prioritization process was based on the results of the study developed by Quantis for Argos, entitled "Calculation of Cementos Argos’ GHG Emissions from priority Sources of Scope 3 Emissions", in addition to the guidelines provided by the "Cement Sector Scope 3 GHG Accounting and Reporting Guidance", developed by the WBCSD - CSI (2016).
Category 1, Purchased Goods and Services, was one of the 5 relevant categories. Of these 5 cate-gories, Category 1 represented 75% of total Scope 3 emissions in 2020.
Purchased goodsand services
Other indirect (Scope 3) GHG emissions
3.006.946 2.701.706 2.698.252 3.373.602 3.096.972
305-3
1 0%
Relevant, calculated / Relevante,calculado
Argos prioritized 5 of the 15 categories that com-pose Scope 3 as relevant; this priorization process was based on the results of the study developed by Quantis for Argos “Calculation of GHG emis-sions from Scope 3 prioritized sources of Cemen-tos Argos” and on the guidelines given by the “Cement Sector Scope 3 GHG Accounting and Reporting Guidance” developed by WBCSD - CSI (2016). The relevant categories calculated were:-Category 1: Purchased goods and services.-Category 3: Fuel and energy related activities.-Category 4: Upstream transportation and distribu-tion.-Category 6: Business travel.-Category 9: Downstream transportation and distri-bution.
Capital goods (Category 2) was not selected as a relevant category considering the share of these emissions within the total Scope 3 emissions of the company.
Capital goods/NA NA NA NA NA NA NA
2 Not relevant / No relevante
INDICADOR

SOURCES OF SCOPE3 EMISSIONS
CATEGORY EVALUATION STATUS
2016 2017 2018 2019 2020PERCENTAGE OF EMISSIONSCALCULATED USING DATAOBTAINED FROMSUPPLIERS OR VALUE CHAIN PARTNERS
STANDARDS, METHODOLOGIES AND ASSUMPTIONS IN THE CALCULATION, GASES INCLUDED IN THE CALCULATION, AS WELL AS THE SOURCE OF EMISSION FACTORS AND GWP
COMMENTS
From 2016 to 2019 Argos' scope 3 emissions calculations were made with Quantis SUITE 2.0 software from Quantis Enterprise, however this application was withdrawn from the market by Quantis in 2020. Due to this fact, Argos con-tracted with this same company the develop-ment of a customized tool that makes the same quantification as Quantis Suite 2.0. Likewise, the tool developed by Quantis for Argos works under the GHG Protocol methodology “Accoun-ting and Reporting Standard for the Corporate Value Chain (Scope 3)” (World Business Council for Sustainable Development (WBCSD) and World Resources Institute (WRI) (2011), and under the "Cement Sector Scope 3 GHG Ac-counting and Reporting Guidance" developed by WBCSD (2016).
Coverage: Cement, concrete and aggregates operations of the Colombia, Caribbean and Cen-tral America and USA regions.
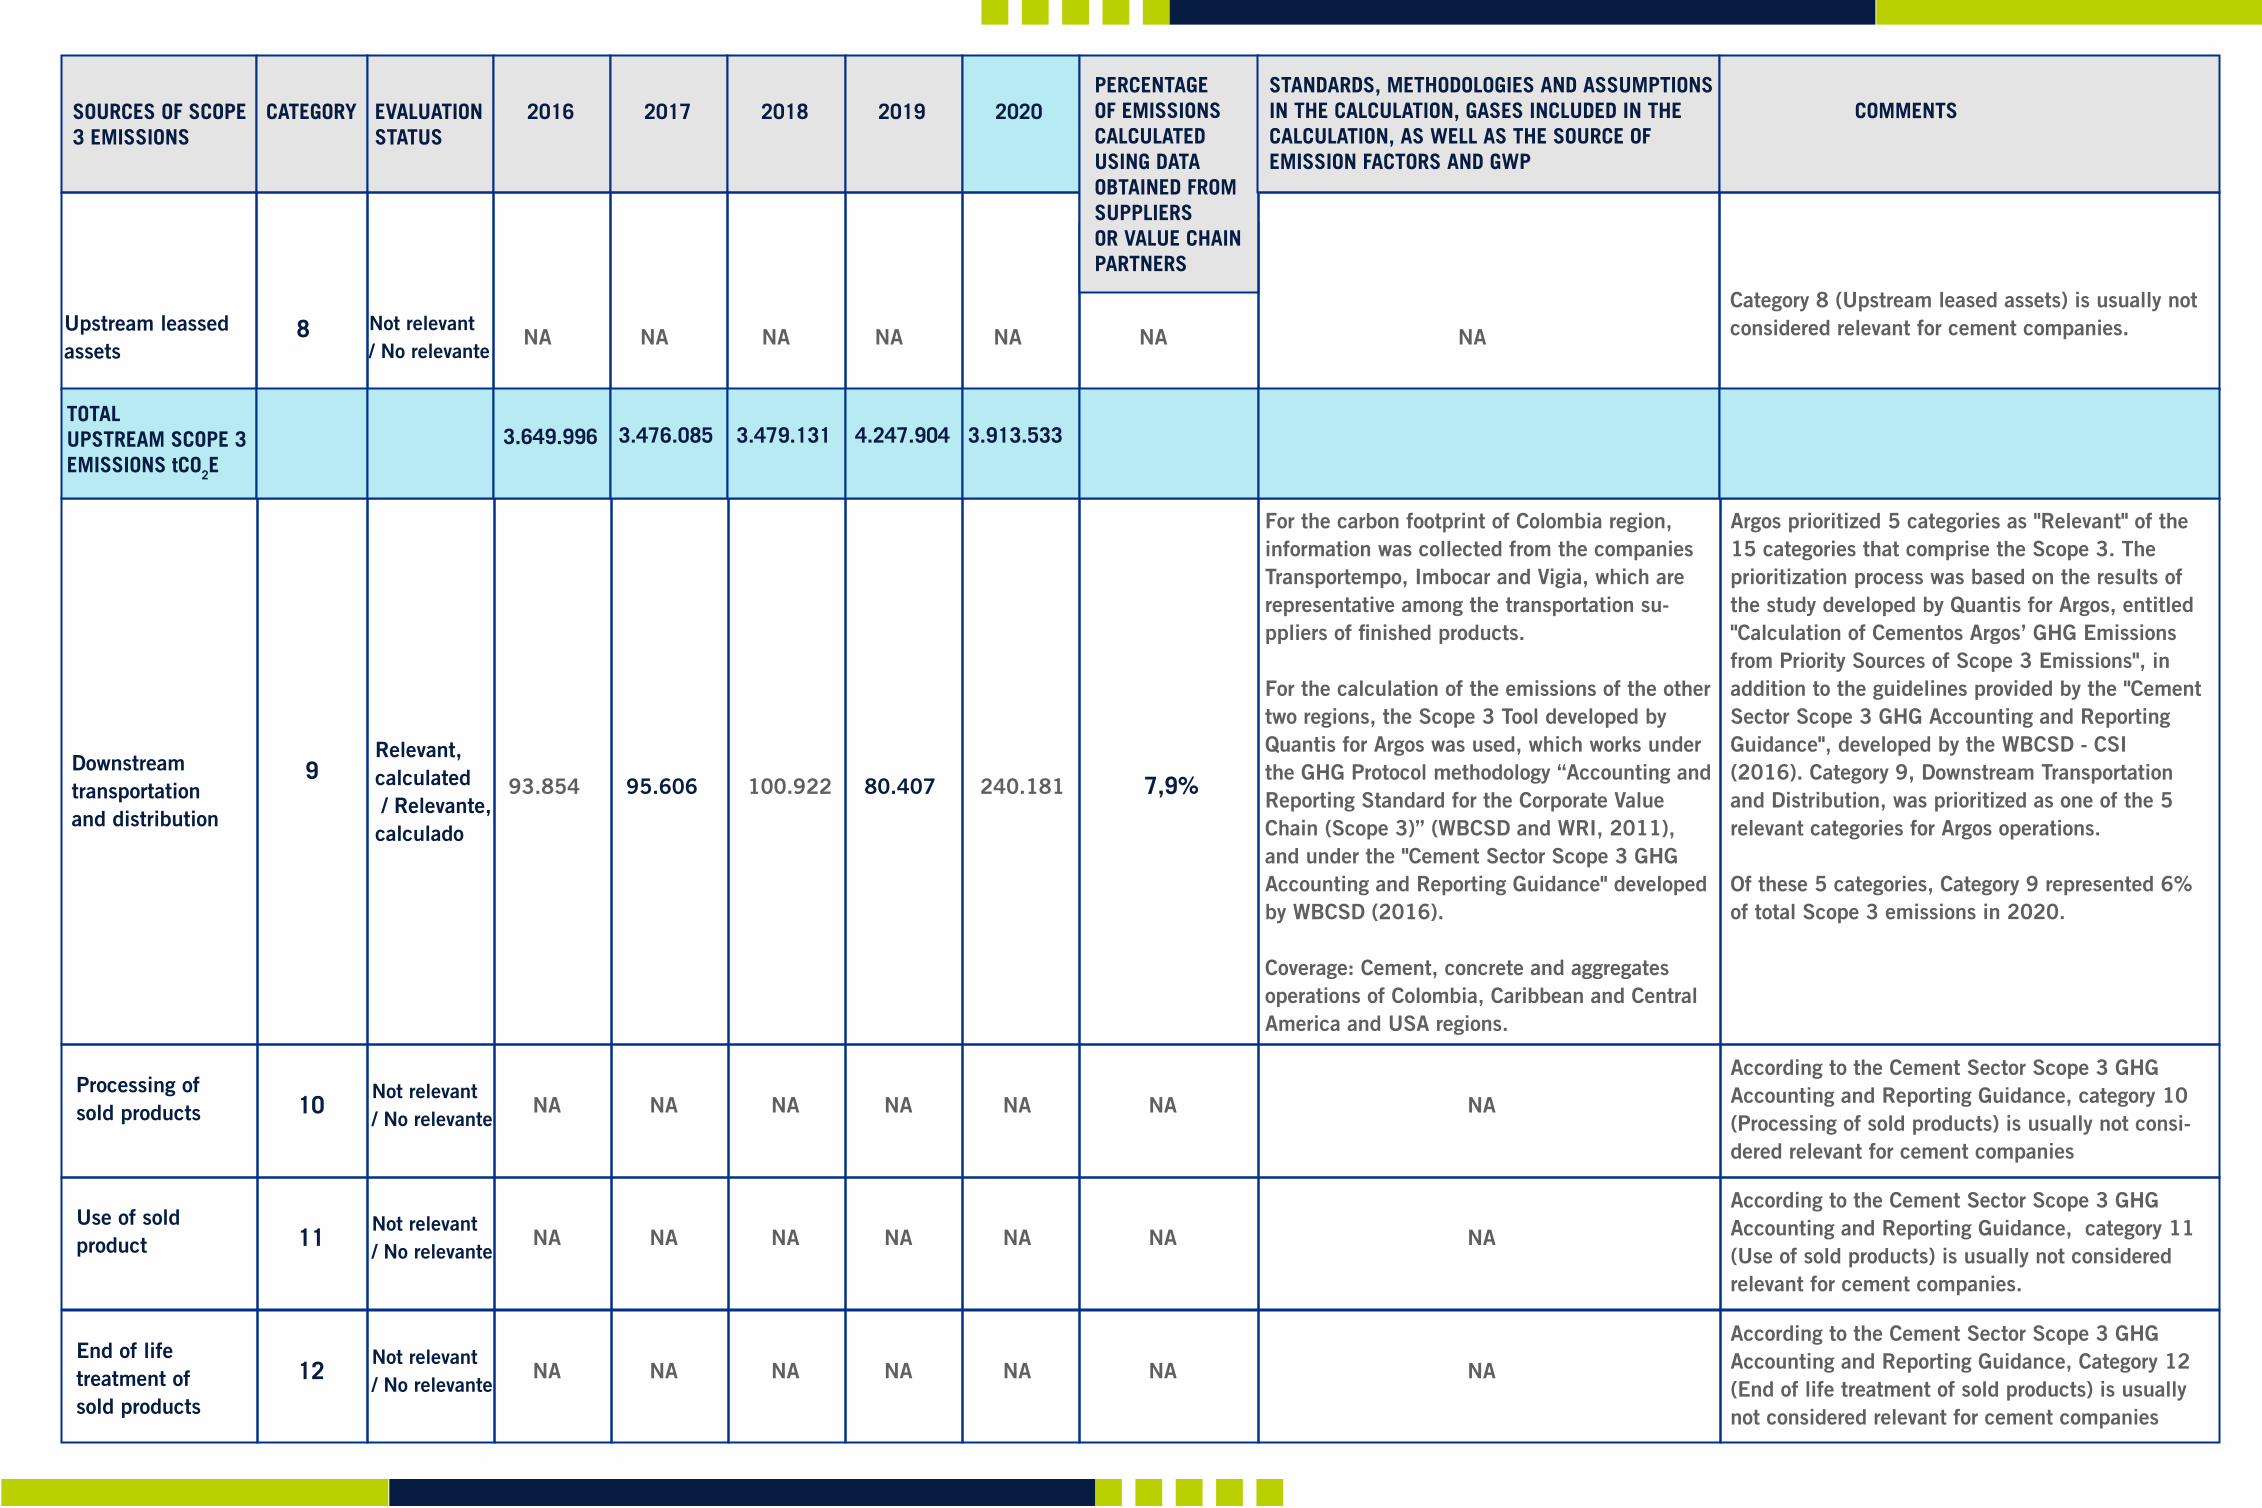
The carbon footprint for the Colombia region was gathered from Logitrans, the most repre-sentative transportation supplier of raw mate-rials and products in process, and from Geodis which is an important supplier of cargo trans-portation by sea and air.For calculation of the emissions of the other two regions (USA and the Caribbean and Central America) the tool developed for Argos by Quan-tis was used, which works works under the GHG Protocol methodology “Accounting and Repor-ting Standard for the Corporate Value Chain (Scope 3)” (World Business Council for Sustai-nable Development (WBCSD) and World Resour-ces Institute (WRI), 2011), and under the "Cement Sector Scope 3 GHG Accounting and Reporting Guidance" developed by WBCSD (2016).
Coverage: Cement, concrete and aggregates operations of Colombia, Caribbean and Central America and USA regions
The company prioritized 5 categories as "Relevant" of the 15 categories that comprise the Scope 3. The prioritization process was based on the results of the study developed by Quantis for Argos, entit-led "Calculation of Cementos Argos’ GHG Emis-sions from Priority Sources of Scope 3 Emissions", in addition to the guidelines provided by the "Cement Sector Scope 3 GHG Accounting and Reporting Guidance", developed by the WBCSD - CSI (2016).
Category 3, Fuel and Energy-Related Activities, was one of the 5 relevant categories. Of these 5 categories, Category 3 represented 10% of total Scope 3 emissions in 2020.
Fuel and energy related activities 442.514 577.917 575.712 674.332 432.360
195.717 193.865 203.439 198.718 383.954
3 0%
17%
Relevant, calculated / Relevante,calculado
Relevant, calculated / Relevante,calculado
Argos prioritized 5 categories as "Relevant" of the 15 categories that comprise the Scope 3. The prioritization process was based on the results of the study developed by Quantis for Argos, entitled "Calculation of Cementos Argos’ GHG Emissions from Priority Sources of Scope 3 Emissions", in addition to the guidelines provided by the "Cement Sector Scope 3 GHG Accounting and Reporting Guidance", developed by the WBCSD - CSI (2016). Category 4 (upstream transportation and distribution) is among the 5 relevant categories.
Of these 5 categories, Category 4 represented 9% of total Scope 3 emissions in 2020.
Upstreamtransportationand distribution
4
SOURCES OF SCOPE3 EMISSIONS
CATEGORY EVALUATION STATUS
2016 2017 2018 2019 2020PERCENTAGE OF EMISSIONSCALCULATED USING DATAOBTAINED FROMSUPPLIERS OR VALUE CHAIN PARTNERS
STANDARDS, METHODOLOGIES AND ASSUMPTIONS IN THE CALCULATION, GASES INCLUDED IN THE CALCULATION, AS WELL AS THE SOURCE OF EMISSION FACTORS AND GWP
COMMENTS
The carbon footprint for Colombia and United States regions was collected from the travel agencies that operate the logistics of corporate travel. For calculation of the emissions of the Caribbean and Central America region the Scope 3 Tool developed by Quantis for Argos was used, which works under the GHG Protocol methodology “Accounting and Reporting Stan-dard for the Corporate Value Chain (Scope 3)” (WBCSD) and WRI, 2011), and under the "Cement Sector Scope 3 GHG Accounting and Reporting Guidance" developed by WBCSD (2016).
Coverage: Cement, concrete and aggregates operations of COL, CCA and USA regions.
Argos prioritized 5 of the 15 categories that com-pose Scope 3 as relevant; this priorization process was based on the results of the study developed by Quantis for Argos “Calculation of GHG emis-sions from Scope 3 prioritized sources of Cemen-tos Argos” and on the guidelines given by the “Cement Sector Scope 3 GHG Accounting and Reporting Guidance” developed by the WBCSD-CSI (2016). The relevant categories cal-culated were:-Category 1: Purchased goods and services.-Category 3: Fuel and energy related activities.-Category 4: Upstream transportation and distribu-tion.-Category 6: Business travel.-Category 9: Downstream transportation and distri-bution.
Category 5 (Waste generated in operations) is usually not consideredrelevant for cement companies.
Waste generated in operation
4.820 2.596 1.728 1.252 248
5
83%
Relevant, calculated / Relevante,calculado
Argos prioritized 5 categories as "Relevant" of the 15 categories that comprise the Scope 3. The prioritization process was based on the results of the study developed by Quantis for Argos, entitled "Calculation of Cementos Argos’ GHG Emissions from Priority Sources of Scope 3 Emissions", in addition to the guidelines provided by the "Cement Sector Scope 3 GHG Accounting and Reporting Guidance", developed by the WBCSD - CSI (2016).
Category 6, Business Travel, was one of the 5 rele-vant categories. Of these 5 categories, Category 6 represented 0.01 % of total Scope 3 emissions in 2020.
Employee commuting (Category 7) was not selec-ted as a relevant category considering the share of these emissions within the total Scope 3 emis-sions for the Company.
Business travels6
NA NA NA NA NA NA NANot relevant / No relevante
Employee commuting 7 NA NA NA NA NA NA NA
Not relevant / No relevante
SOURCES OF SCOPE3 EMISSIONS
CATEGORY EVALUATION STATUS
2016 2017 2018 2019 2020PERCENTAGE OF EMISSIONSCALCULATED USING DATAOBTAINED FROMSUPPLIERS OR VALUE CHAIN PARTNERS
STANDARDS, METHODOLOGIES AND ASSUMPTIONS IN THE CALCULATION, GASES INCLUDED IN THE CALCULATION, AS WELL AS THE SOURCE OF EMISSION FACTORS AND GWP
COMMENTS
For the carbon footprint of Colombia region, information was collected from the companies Transportempo, Imbocar and Vigia, which are representative among the transportation su-ppliers of finished products.
For the calculation of the emissions of the other two regions, the Scope 3 Tool developed by Quantis for Argos was used, which works under the GHG Protocol methodology “Accounting and Reporting Standard for the Corporate Value Chain (Scope 3)” (WBCSD and WRI, 2011), and under the "Cement Sector Scope 3 GHG Accounting and Reporting Guidance" developed by WBCSD (2016).
Coverage: Cement, concrete and aggregates operations of Colombia, Caribbean and Central America and USA regions.
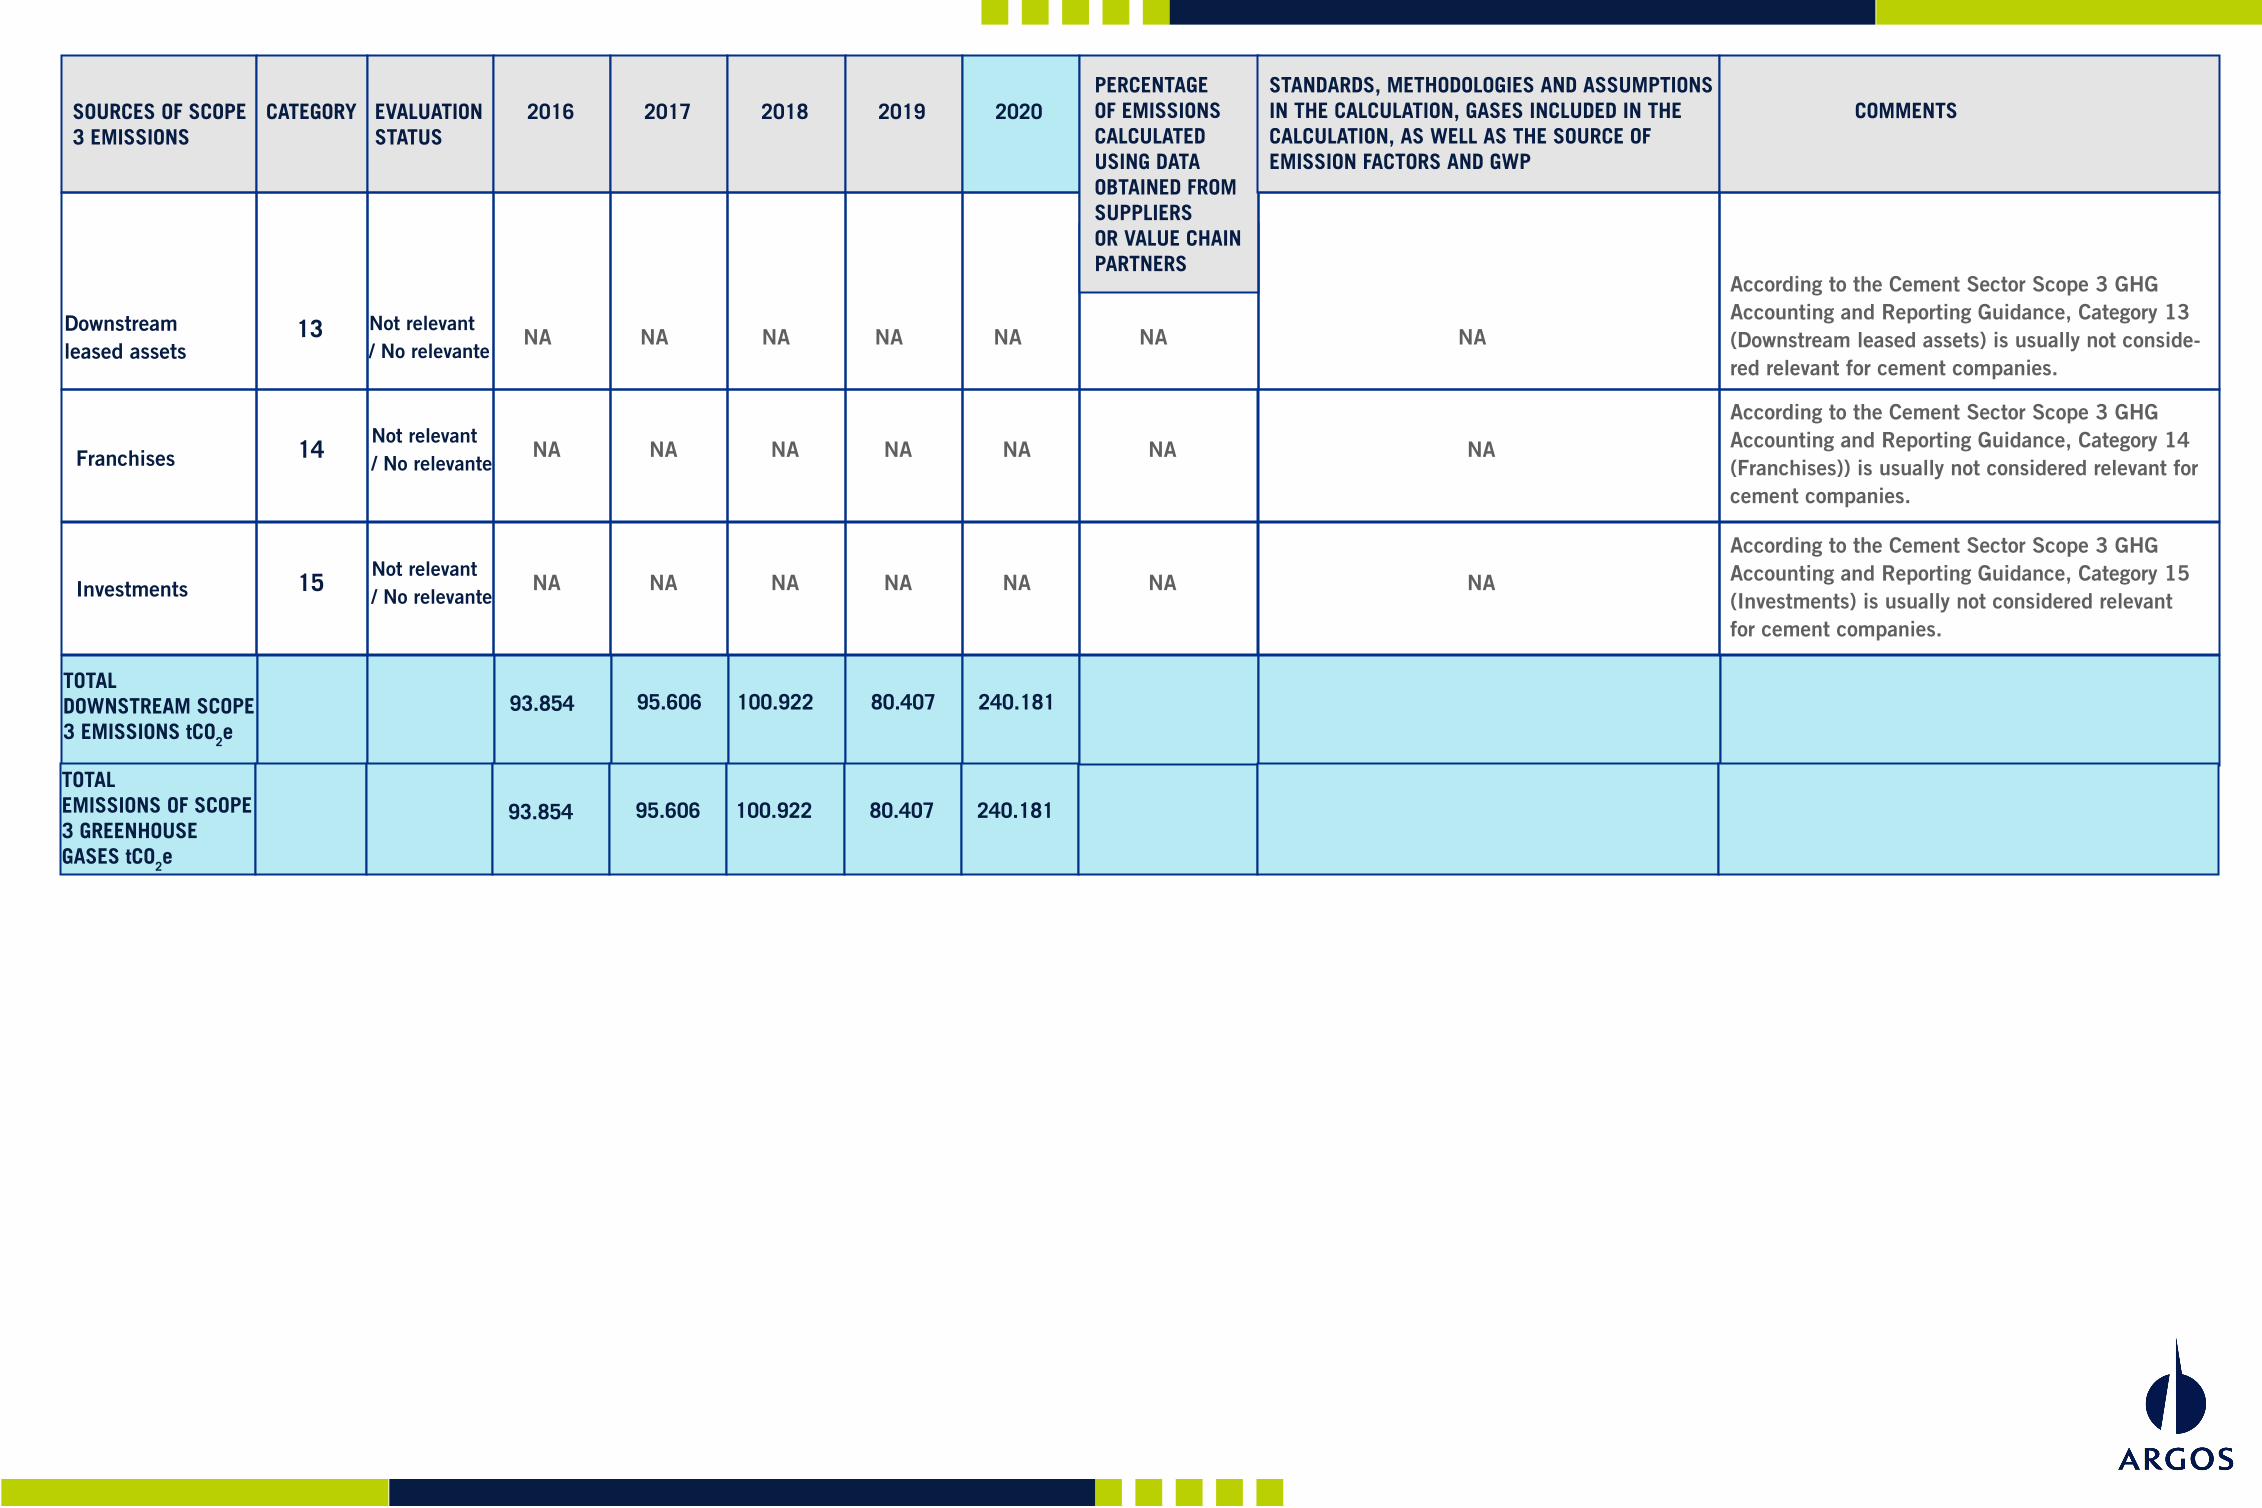
Category 8 (Upstream leased assets) is usually not considered relevant for cement companies.Upstream leassed
assets
93.854 95.606 100.922 80.407 240.181
8
7,9%
Relevant, calculated / Relevante,calculado
Argos prioritized 5 categories as "Relevant" of the 15 categories that comprise the Scope 3. The prioritization process was based on the results of the study developed by Quantis for Argos, entitled "Calculation of Cementos Argos’ GHG Emissions from Priority Sources of Scope 3 Emissions", in addition to the guidelines provided by the "Cement Sector Scope 3 GHG Accounting and Reporting Guidance", developed by the WBCSD - CSI (2016). Category 9, Downstream Transportation and Distribution, was prioritized as one of the 5 relevant categories for Argos operations.
Of these 5 categories, Category 9 represented 6% of total Scope 3 emissions in 2020.
According to the Cement Sector Scope 3 GHG Accounting and Reporting Guidance, category 10 (Processing of sold products) is usually not consi-dered relevant for cement companies
Downstreamtransportation and distribution
9
NA NA NA NA NA NA NANot relevant / No relevante
TOTAL UPSTREAM SCOPE 3 EMISSIONS tCO2E
3.649.996 3.476.085
Processing of sold products 10 NA NA NA NA NA NA NA
Not relevant / No relevante
According to the Cement Sector Scope 3 GHG Accounting and Reporting Guidance, category 11 (Use of sold products) is usually not considered relevant for cement companies.
Use of sold product 11 NA NA NA NA NA NA NA
Not relevant / No relevante
According to the Cement Sector Scope 3 GHG Accounting and Reporting Guidance, Category 12 (End of life treatment of sold products) is usually not considered relevant for cement companies
End of life treatment of sold products
12 NA NA NA NA NA NA NANot relevant / No relevante
3.479.131 4.247.904 3.913.533
SOURCES OF SCOPE3 EMISSIONS
CATEGORY EVALUATION STATUS
2016 2017 2018 2019 2020PERCENTAGE OF EMISSIONSCALCULATED USING DATAOBTAINED FROMSUPPLIERS OR VALUE CHAIN PARTNERS
STANDARDS, METHODOLOGIES AND ASSUMPTIONS IN THE CALCULATION, GASES INCLUDED IN THE CALCULATION, AS WELL AS THE SOURCE OF EMISSION FACTORS AND GWP
COMMENTS
According to the Cement Sector Scope 3 GHG Accounting and Reporting Guidance, Category 13 (Downstream leased assets) is usually not conside-red relevant for cement companies.
Downstream leased assets
13 NA NA NA NA NA NA NANot relevant / No relevante
TOTAL DOWNSTREAM SCOPE 3 EMISSIONS tCO2e
93.854 95.606
According to the Cement Sector Scope 3 GHG Accounting and Reporting Guidance, Category 14 (Franchises)) is usually not considered relevant for cement companies.
Franchises 14 NA NA NA NA NA NA NANot relevant / No relevante
According to the Cement Sector Scope 3 GHG Accounting and Reporting Guidance, Category 15 (Investments) is usually not considered relevant for cement companies.
Investments 15 NA NA NA NA NA NA NANot relevant / No relevante
100.922 80.407 240.181
TOTALEMISSIONS OF SCOPE 3 GREENHOUSE GASES tCO2e
93.854 95.606 100.922 80.407 240.181
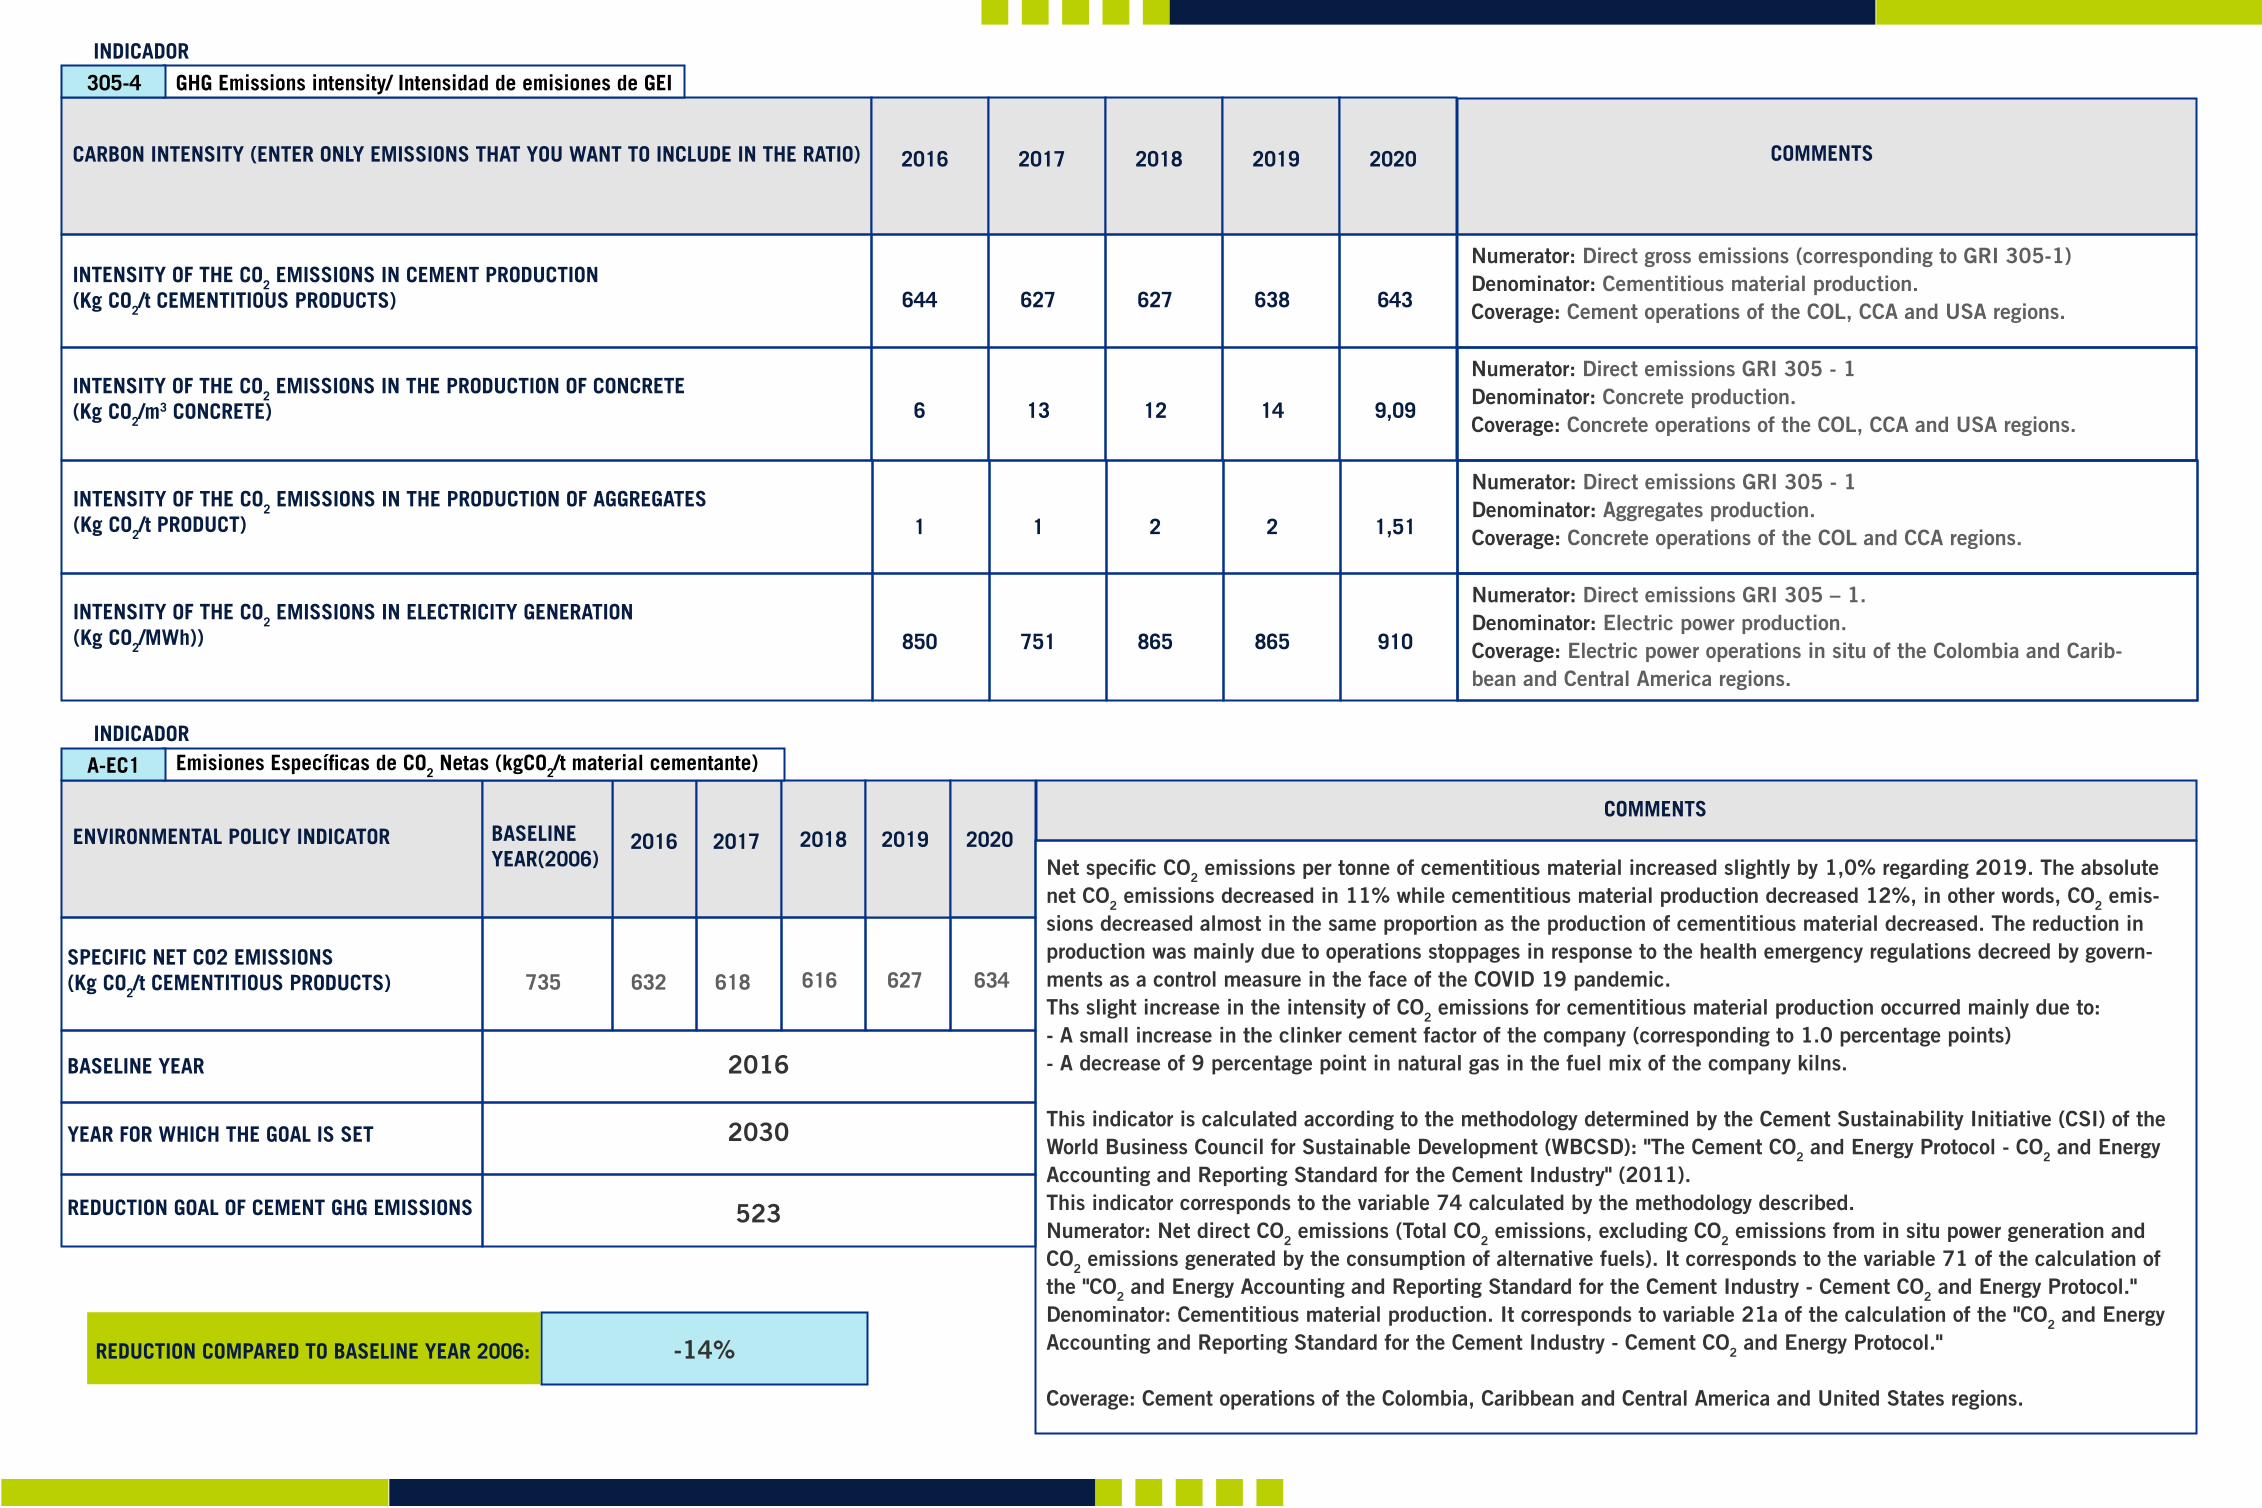
CARBON INTENSITY (ENTER ONLY EMISSIONS THAT YOU WANT TO INCLUDE IN THE RATIO)
INTENSITY OF THE CO2 EMISSIONS IN CEMENT PRODUCTION(Kg CO2/t CEMENTITIOUS PRODUCTS)
INTENSITY OF THE CO2 EMISSIONS IN THE PRODUCTION OF CONCRETE (Kg CO2/m
3 CONCRETE)
2016
644 627 627 638 643
6 13 12 14 9,09
1 1 2 2 1,51
850 751 865 865 910
2017 2018 2019 2020 COMMENTS
Numerator: Direct gross emissions (corresponding to GRI 305-1)Denominator: Cementitious material production.Coverage: Cement operations of the COL, CCA and USA regions.
Numerator: Direct emissions GRI 305 - 1Denominator: Concrete production.Coverage: Concrete operations of the COL, CCA and USA regions.
INTENSITY OF THE CO2 EMISSIONS IN THE PRODUCTION OF AGGREGATES(Kg CO2/t PRODUCT)
Numerator: Direct emissions GRI 305 - 1Denominator: Aggregates production.Coverage: Concrete operations of the COL and CCA regions.
INTENSITY OF THE CO2 EMISSIONS IN ELECTRICITY GENERATION(Kg CO2/MWh))
Numerator: Direct emissions GRI 305 – 1.Denominator: Electric power production.Coverage: Electric power operations in situ of the Colombia and Carib-bean and Central America regions.
GHG Emissions intensity/ Intensidad de emisiones de GEI 305-4INDICADOR
ENVIRONMENTAL POLICY INDICATOR
SPECIFIC NET CO2 EMISSIONS (Kg CO2/t CEMENTITIOUS PRODUCTS)
BASELINE YEAR
2016
2016
2030
523
-14%
BASELINEYEAR(2006)
632 618 634735
2017
616 627
20192018 2020COMMENTS
Net specific CO2 emissions per tonne of cementitious material increased slightly by 1,0% regarding 2019. The absolute net CO2 emissions decreased in 11% while cementitious material production decreased 12%, in other words, CO2 emis-sions decreased almost in the same proportion as the production of cementitious material decreased. The reduction in production was mainly due to operations stoppages in response to the health emergency regulations decreed by govern-ments as a control measure in the face of the COVID 19 pandemic.Ths slight increase in the intensity of CO2 emissions for cementitious material production occurred mainly due to: - A small increase in the clinker cement factor of the company (corresponding to 1.0 percentage points)- A decrease of 9 percentage point in natural gas in the fuel mix of the company kilns.
This indicator is calculated according to the methodology determined by the Cement Sustainability Initiative (CSI) of the World Business Council for Sustainable Development (WBCSD): "The Cement CO2 and Energy Protocol - CO2 and Energy Accounting and Reporting Standard for the Cement Industry" (2011).This indicator corresponds to the variable 74 calculated by the methodology described.Numerator: Net direct CO2 emissions (Total CO2 emissions, excluding CO2 emissions from in situ power generation and CO2 emissions generated by the consumption of alternative fuels). It corresponds to the variable 71 of the calculation of the "CO2 and Energy Accounting and Reporting Standard for the Cement Industry - Cement CO2 and Energy Protocol."Denominator: Cementitious material production. It corresponds to variable 21a of the calculation of the "CO2 and Energy Accounting and Reporting Standard for the Cement Industry - Cement CO2 and Energy Protocol."
Coverage: Cement operations of the Colombia, Caribbean and Central America and United States regions.
YEAR FOR WHICH THE GOAL IS SET
REDUCTION GOAL OF CEMENT GHG EMISSIONS
REDUCTION COMPARED TO BASELINE YEAR 2006:
Emisiones Específicas de CO2 Netas (kgCO2/t material cementante)A-EC1INDICADOR
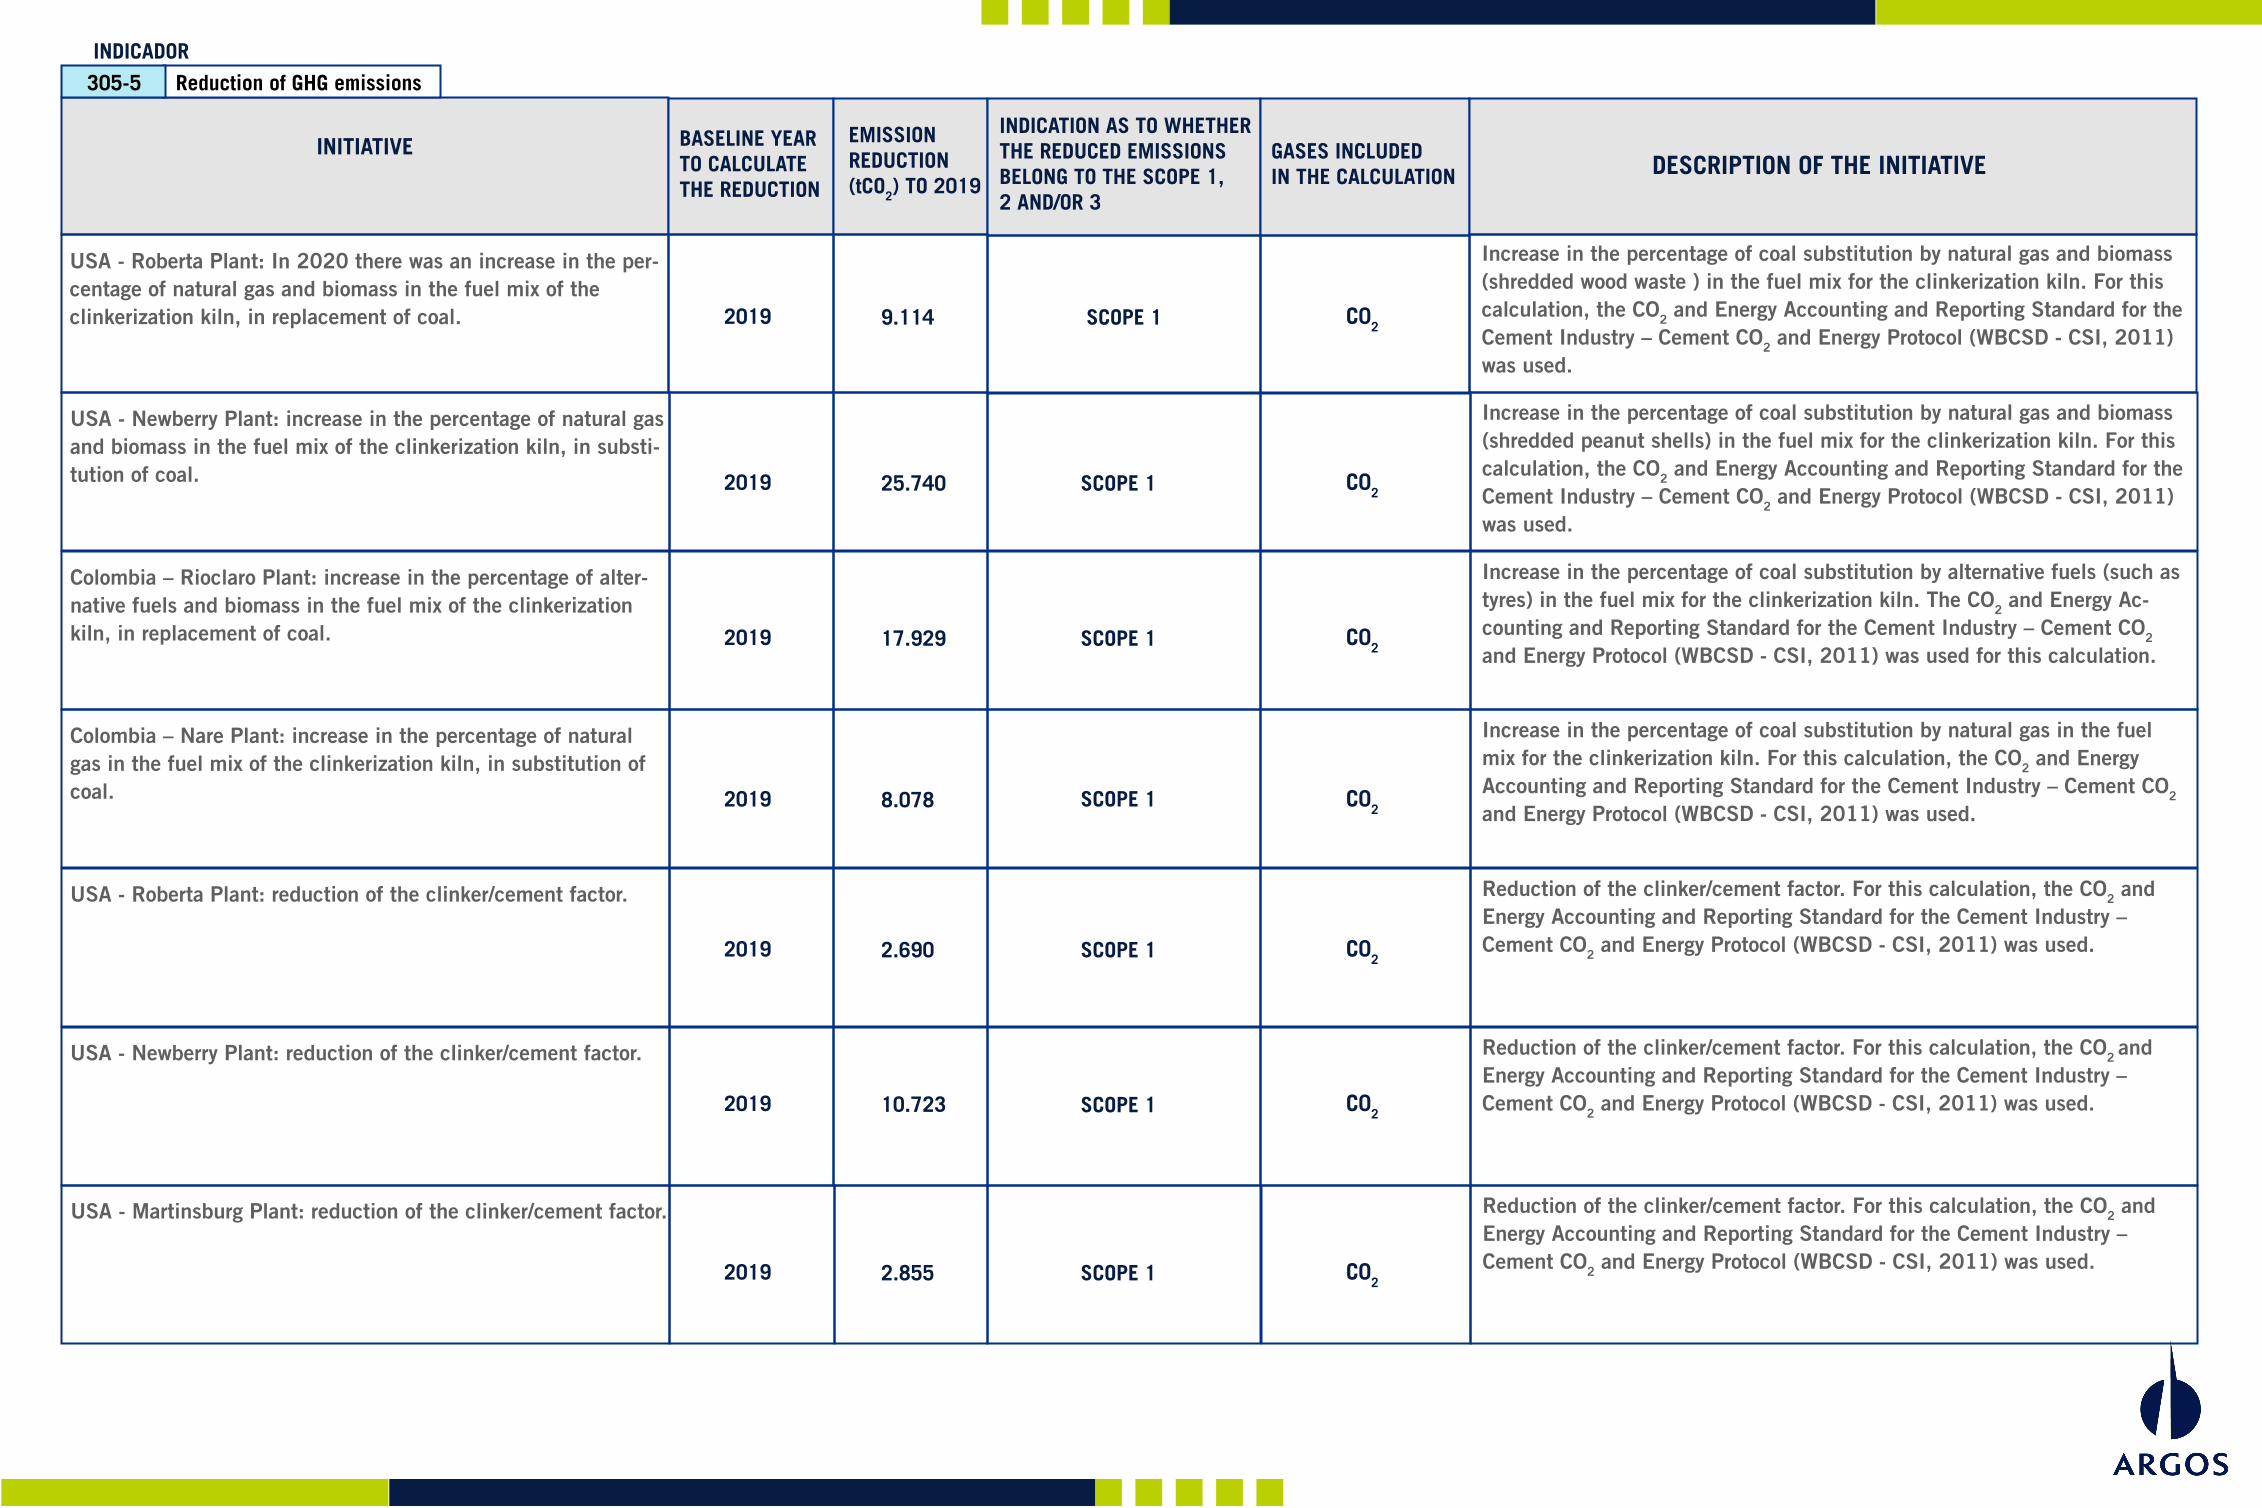
INITIATIVE BASELINE YEAR TO CALCULATE THE REDUCTION
2019 C02
C02
C02
C02
C02
C02
C02
2019
2019
2019
2019
2019
2019
9.114 SCOPE 1
SCOPE 1
SCOPE 1
SCOPE 1
SCOPE 1
SCOPE 1
SCOPE 1
25.740
17.929
8.078
2.690
10.723
2.855
EMISSION REDUCTION (tCO2) TO 2019
INDICATION AS TO WHETHER THE REDUCED EMISSIONS BELONG TO THE SCOPE 1,2 AND/OR 3
GASES INCLUDED IN THE CALCULATION DESCRIPTION OF THE INITIATIVE
USA - Roberta Plant: In 2020 there was an increase in the per-centage of natural gas and biomass in the fuel mix of the clinkerization kiln, in replacement of coal.
Increase in the percentage of coal substitution by natural gas and biomass (shredded wood waste ) in the fuel mix for the clinkerization kiln. For this calculation, the CO2 and Energy Accounting and Reporting Standard for the Cement Industry – Cement CO2 and Energy Protocol (WBCSD - CSI, 2011) was used.
USA - Newberry Plant: increase in the percentage of natural gas and biomass in the fuel mix of the clinkerization kiln, in substi-tution of coal.
Increase in the percentage of coal substitution by natural gas and biomass (shredded peanut shells) in the fuel mix for the clinkerization kiln. For this calculation, the CO2 and Energy Accounting and Reporting Standard for the Cement Industry – Cement CO2 and Energy Protocol (WBCSD - CSI, 2011) was used.
Colombia – Rioclaro Plant: increase in the percentage of alter-native fuels and biomass in the fuel mix of the clinkerization kiln, in replacement of coal.
Increase in the percentage of coal substitution by alternative fuels (such as tyres) in the fuel mix for the clinkerization kiln. The CO2 and Energy Ac-counting and Reporting Standard for the Cement Industry – Cement CO2 and Energy Protocol (WBCSD - CSI, 2011) was used for this calculation.
Colombia – Nare Plant: increase in the percentage of natural gas in the fuel mix of the clinkerization kiln, in substitution of coal.
Increase in the percentage of coal substitution by natural gas in the fuel mix for the clinkerization kiln. For this calculation, the CO2 and Energy Accounting and Reporting Standard for the Cement Industry – Cement CO2 and Energy Protocol (WBCSD - CSI, 2011) was used.
USA - Roberta Plant: reduction of the clinker/cement factor. Reduction of the clinker/cement factor. For this calculation, the CO2 and Energy Accounting and Reporting Standard for the Cement Industry – Cement CO2 and Energy Protocol (WBCSD - CSI, 2011) was used.
USA - Newberry Plant: reduction of the clinker/cement factor. Reduction of the clinker/cement factor. For this calculation, the CO2 and Energy Accounting and Reporting Standard for the Cement Industry – Cement CO2 and Energy Protocol (WBCSD - CSI, 2011) was used.
USA - Martinsburg Plant: reduction of the clinker/cement factor. Reduction of the clinker/cement factor. For this calculation, the CO2 and Energy Accounting and Reporting Standard for the Cement Industry – Cement CO2 and Energy Protocol (WBCSD - CSI, 2011) was used.
Reduction of GHG emissions305-5INDICADOR

INITIATIVE BASELINE YEAR TO CALCULATE THE REDUCTION
2019 C02
C02
C02
C02
C02
C02
C02
2019
2019
2019
2019
2019
2019
6.876 SCOPE 1
SCOPE 1
SCOPE 1
SCOPE 1
SCOPE 1
SCOPE 1
SCOPE 1
4.774
887
44.502
4.177
23.830
2.174
EMISSION REDUCTION (tCO2) TO 2019
INDICATION AS TO WHETHER THE REDUCED EMISSIONS BELONG TO THE SCOPE 1,2 AND/OR 3
GASES INCLUDED IN THE CALCULATION DESCRIPTION OF THE INITIATIVE
USA - Harleyville Plant: Reduction of the clinker/cement factor. Reduction of the clinker/cement factor. For this calculation, the CO2 and Energy Accounting and Reporting Standard for the Cement Industry – Cement CO2 and Energy Protocol (WBCSD - CSI, 2011) was used.
Colombia - Nare Plant: reduction of the clinker/cement factor. Reduction of the clinker/cement factor. For this calculation, the CO2 and Energy Accounting and Reporting Standard for the Cement Industry – Cement CO2 and Energy Protocol (WBCSD - CSI, 2011) was used.
Caribbean and Central America - San Juan/El Dorado Plant (Puerto Rico): Reduction of the clinker/cement factor.
Reduction of the clinker/cement factor. For this calculation, the CO2 and Energy Accounting and Reporting Standard for the Cement Industry – Cement CO2 and Energy Protocol (WBCSD - CSI, 2011) was used.
Colombia - Cairo Plant: operational transformation In 2020 the operational transformation of this plant was consolidated, going from being a plant with wet-type clinker production, to being a grin-ding center of clinker. For this calculation, the CO2 and Energy Accounting and Reporting Standard for the Cement Industry – Cement CO2 and Energy Protocol (WBCSD - CSI, 2011) was used.
Caribbean and Central America - Piedras Azules Plant (Hondu-ras): Reduction of specific heat consumption in clinker produc-tion
A reduction in specific heat consumption of clinker production was obtained as a result of implementing actions to control the instability of raw meal. For this calculation, the CO2 and Energy Accounting and Reporting Standard for the Cement Industry – Cement CO2 and Energy Protocol (WBCSD - CSI, 2011) was used.
Colombia - (Cement Plants: Cartagena, Rioclaro, Toluviejo): im-provements in operations and stability of kilns in various cement plants
Increase in TPD of the kiln 4 at Cartagena Cement Plant. Quality of the coal and increase in MTBF at the Rioclaro plant. Quality of the coal consu-med in the Toluviejo plant.
Colombia - Rioclaro Plant: use of ash in thermally activated clays process at Rioclaro plant
Dosing of ash as a reducing agent in kiln 3 of Rioclaro Plant in which the process of thermal activation of the clays is carried out. These calcined clays are then used as substitutes for clinker in the cement milling process.
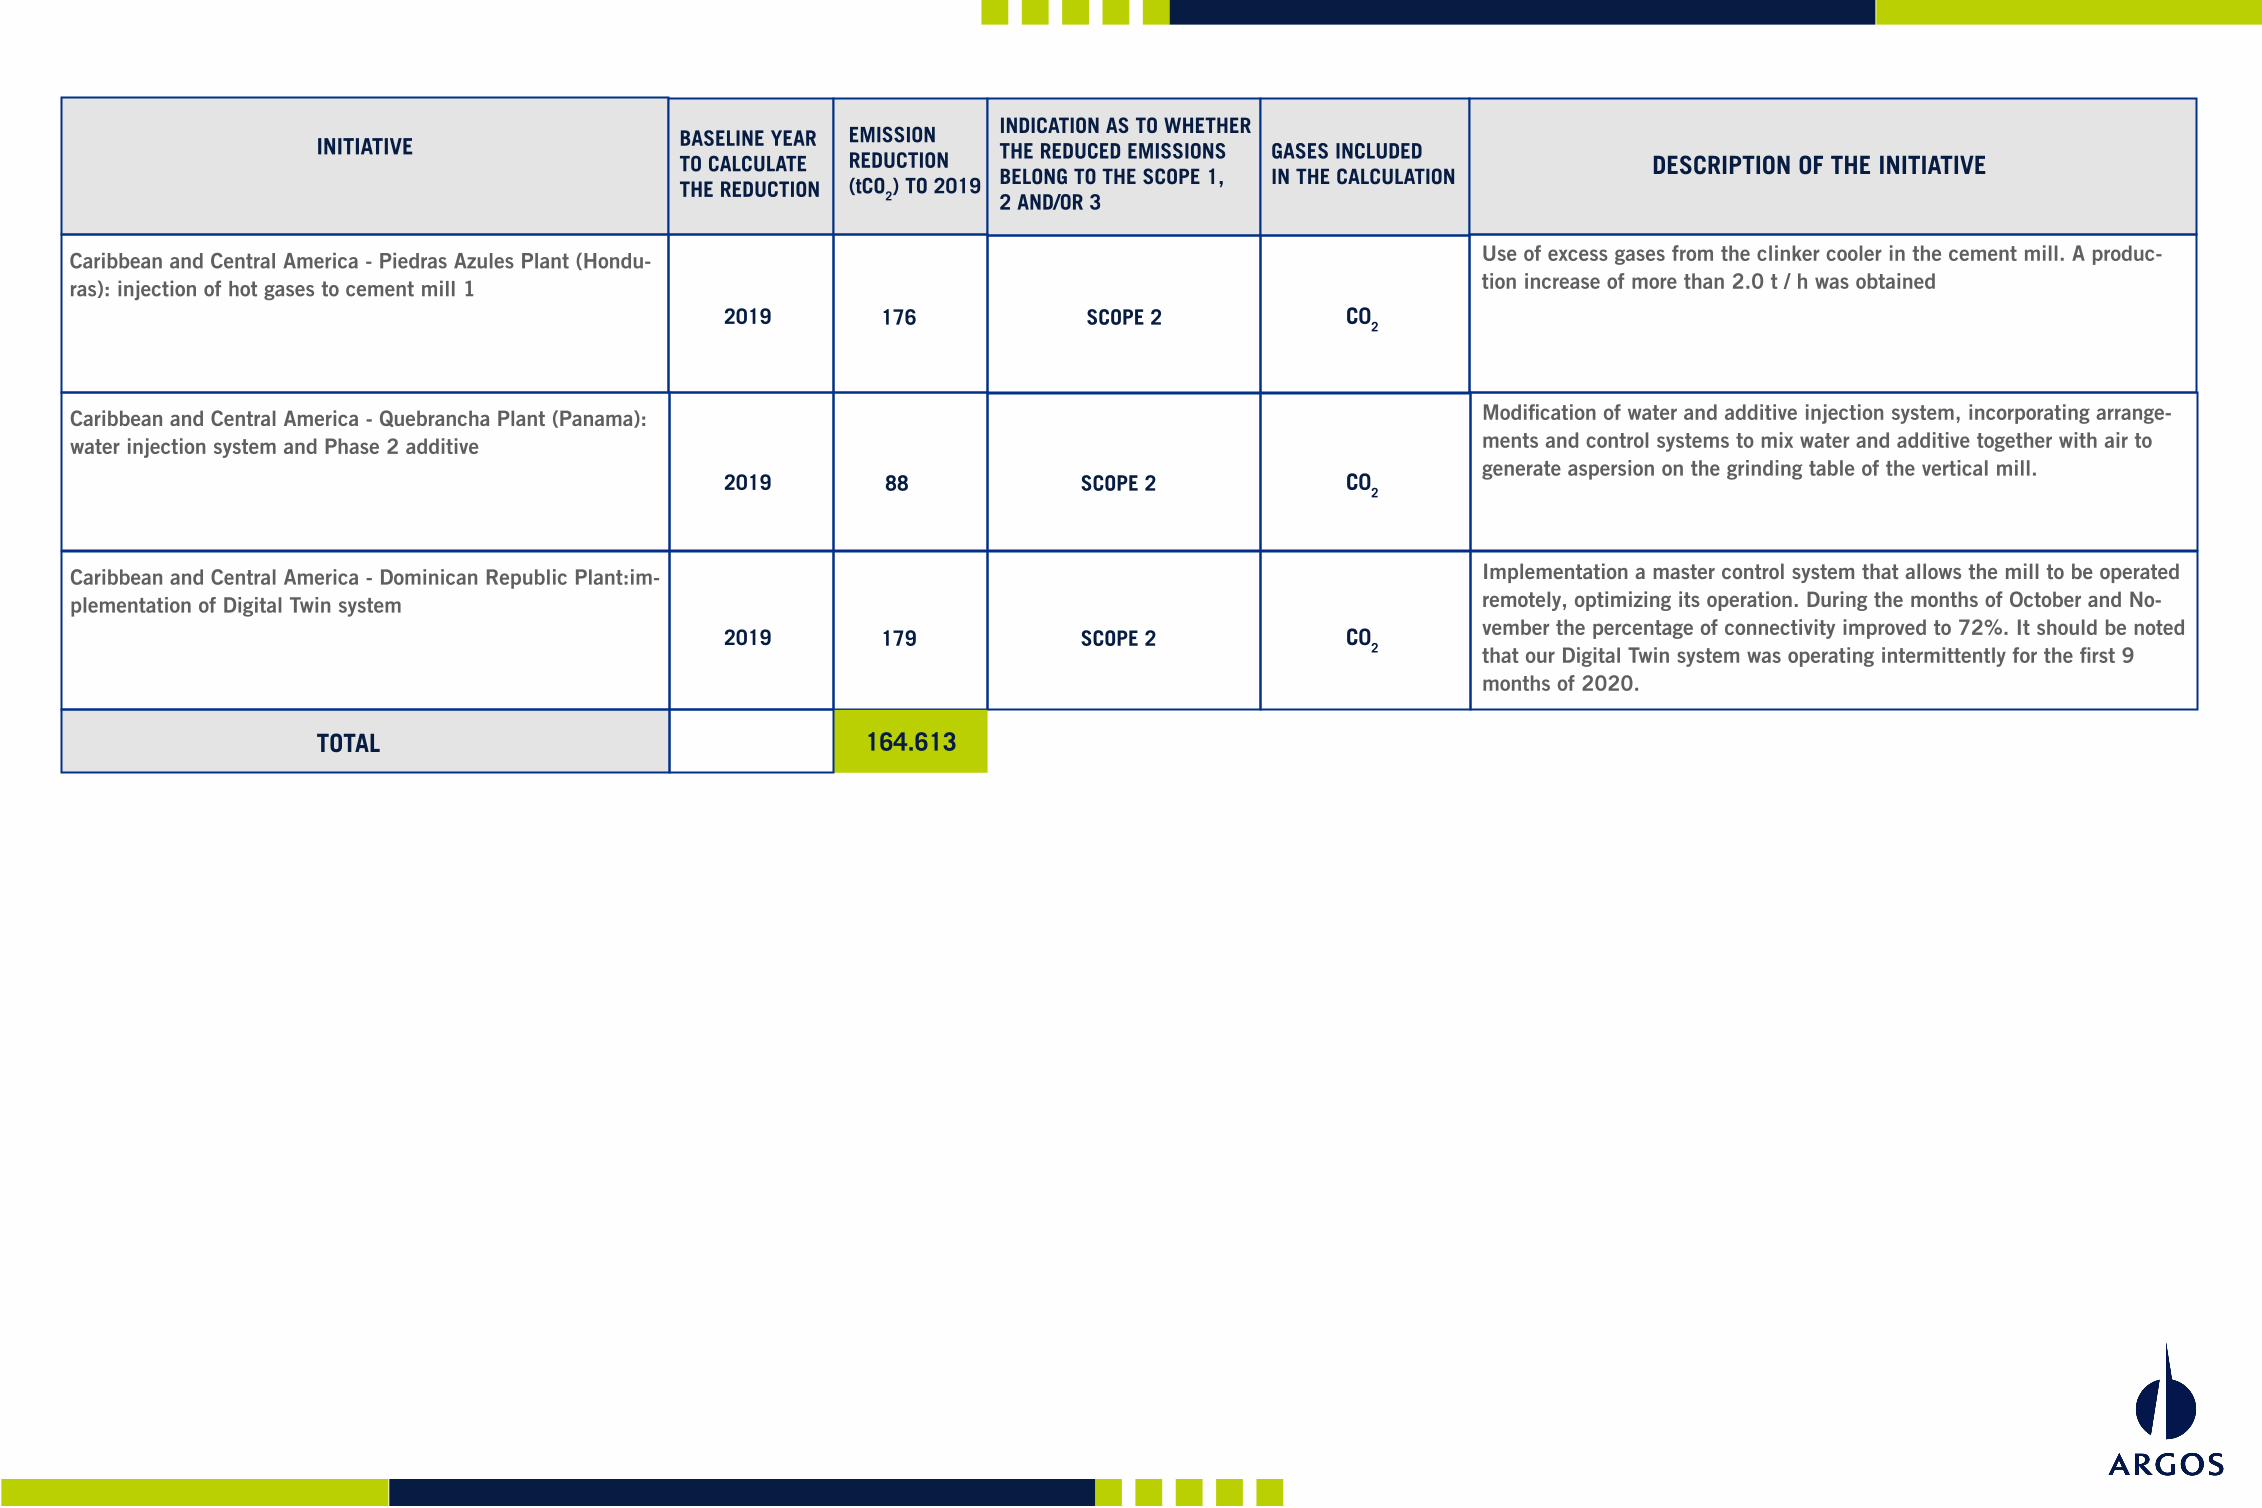
INITIATIVE
TOTAL
BASELINE YEAR TO CALCULATE THE REDUCTION
2019 C02
C02
C02
2019
2019
176 SCOPE 2
SCOPE 2
SCOPE 2
88
179
EMISSION REDUCTION (tCO2) TO 2019
INDICATION AS TO WHETHER THE REDUCED EMISSIONS BELONG TO THE SCOPE 1,2 AND/OR 3
GASES INCLUDED IN THE CALCULATION DESCRIPTION OF THE INITIATIVE
Caribbean and Central America - Piedras Azules Plant (Hondu-ras): injection of hot gases to cement mill 1
Use of excess gases from the clinker cooler in the cement mill. A produc-tion increase of more than 2.0 t / h was obtained
Caribbean and Central America - Quebrancha Plant (Panama): water injection system and Phase 2 additive
Modification of water and additive injection system, incorporating arrange-ments and control systems to mix water and additive together with air to generate aspersion on the grinding table of the vertical mill.
Caribbean and Central America - Dominican Republic Plant:im-plementation of Digital Twin system
Implementation a master control system that allows the mill to be operated remotely, optimizing its operation. During the months of October and No-vember the percentage of connectivity improved to 72%. It should be noted that our Digital Twin system was operating intermittently for the first 9 months of 2020.
164.613
NA NA
Climate-related risks
WHERE IN THE VALUECHAIN DOES THE RISKDRIVER OCCUR?
PRIMARY CLIMATE-RELATED RISK DRIVER
TYPE OF FINANCIALIMPACT
RISK TYPE TIME HORIZON LIKELIHOODMAGNITUDE OF IMPACT COMPANY- SPECIFIC DESCRIPTION
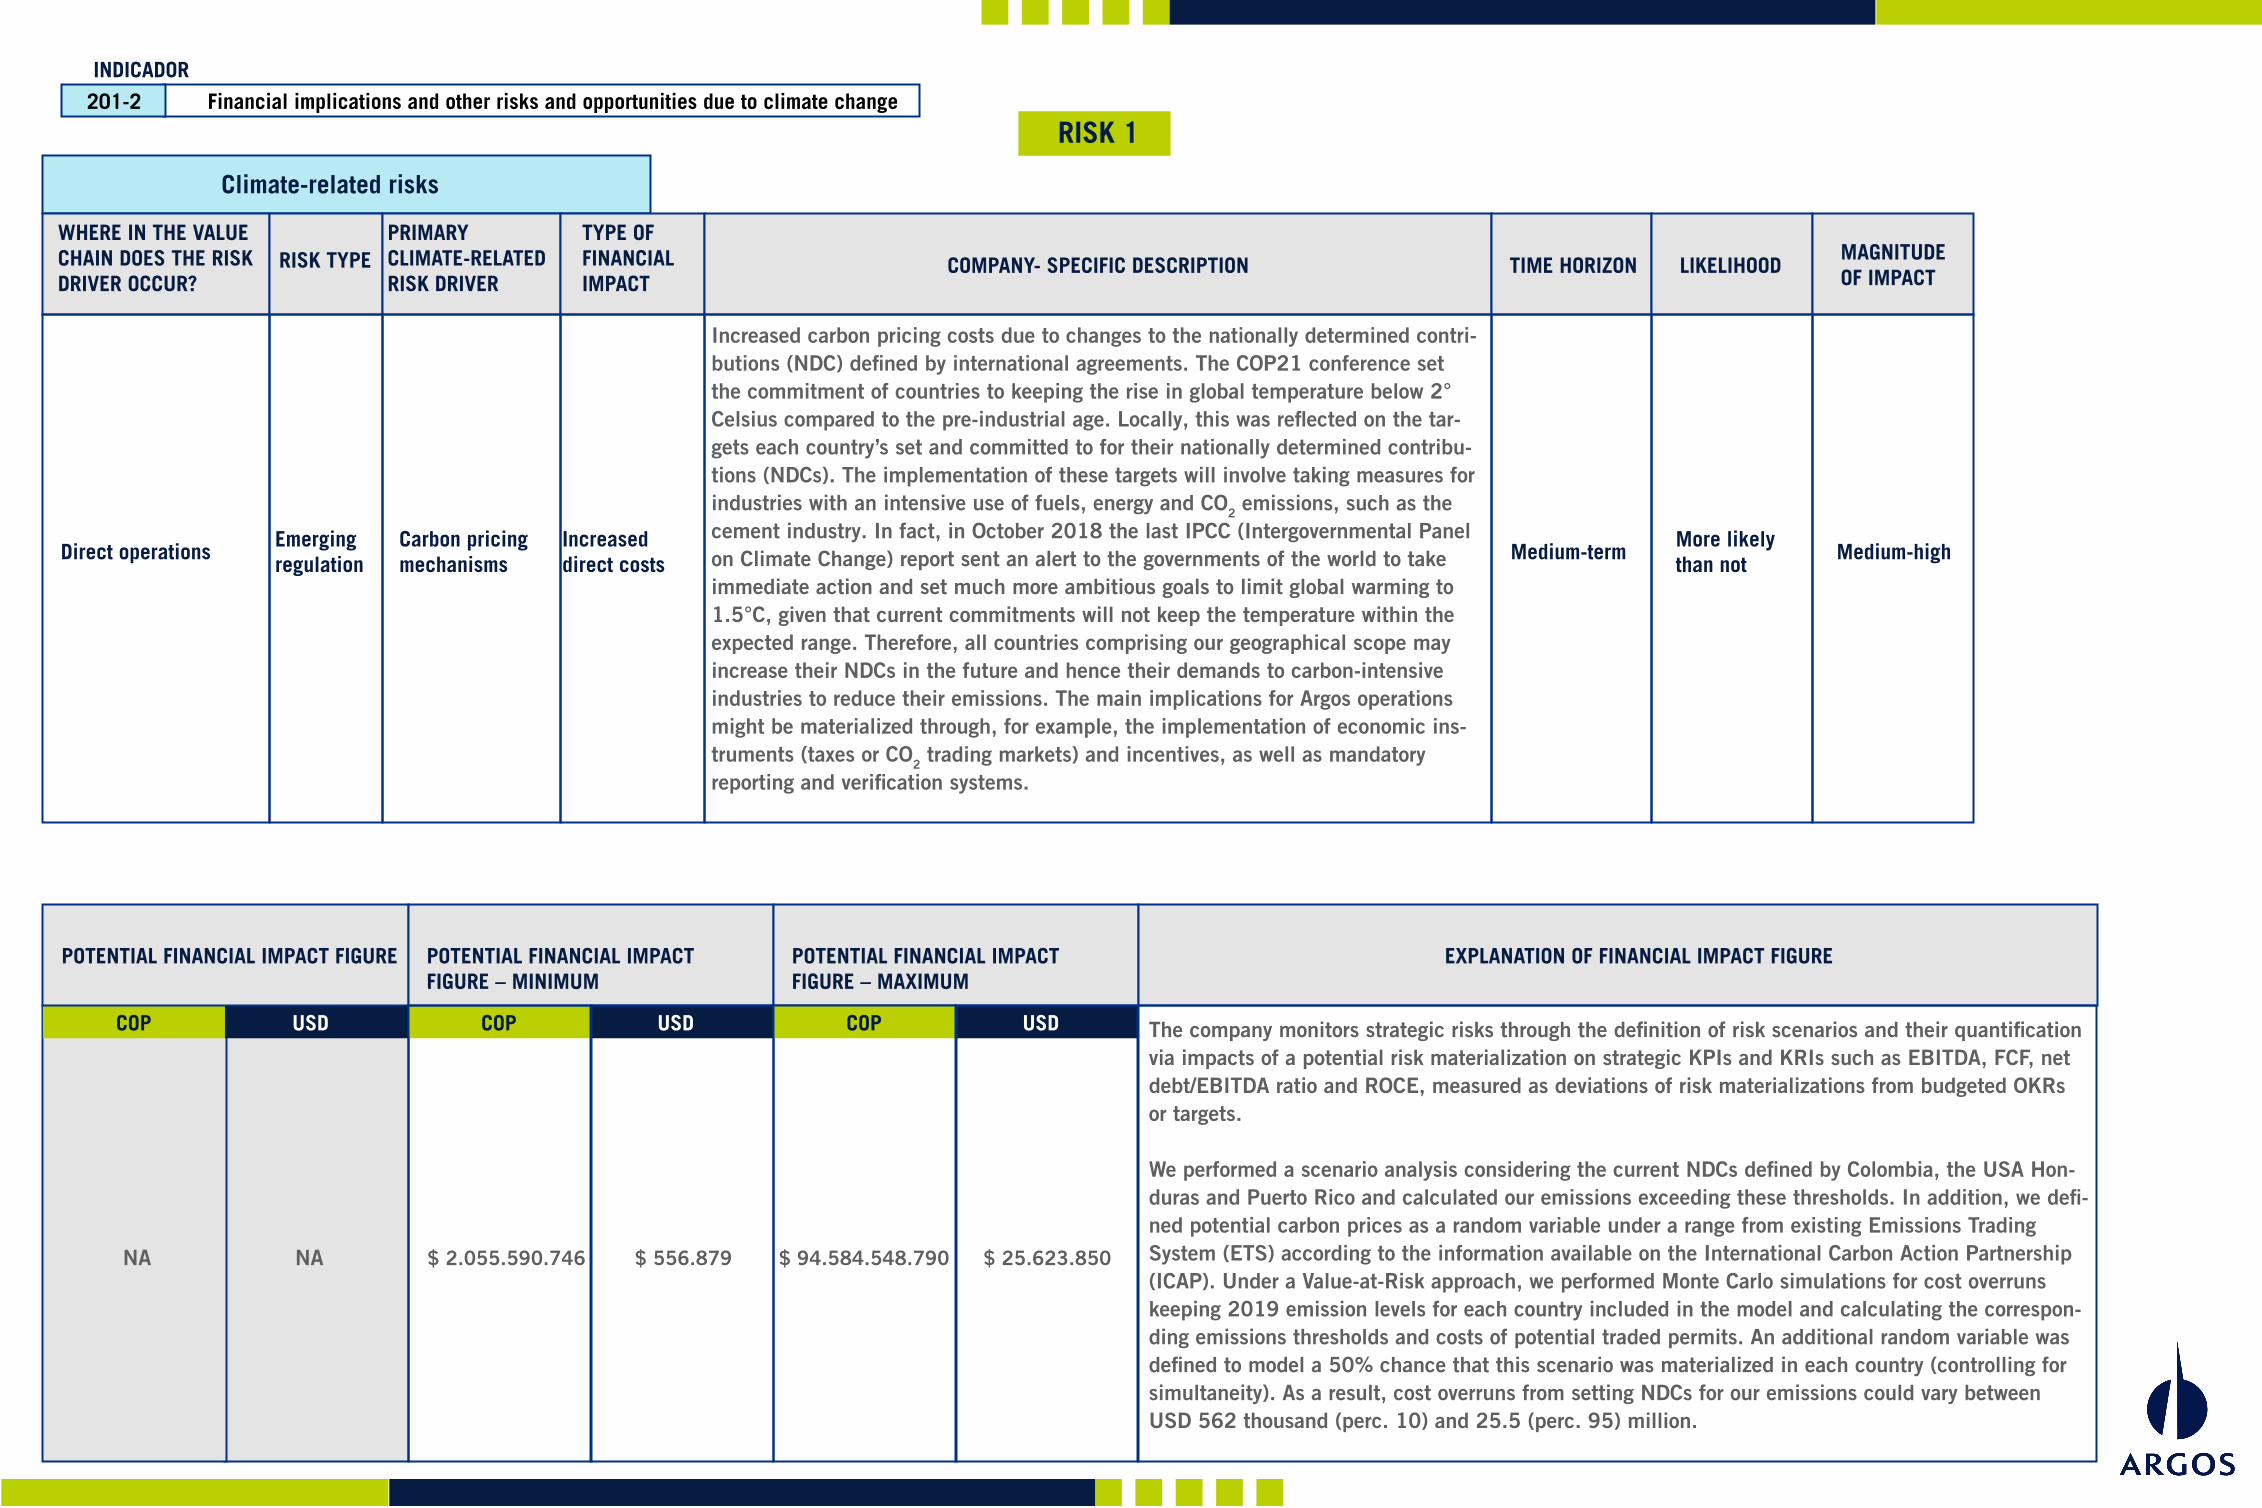
RISK 1
Increased carbon pricing costs due to changes to the nationally determined contri-butions (NDC) defined by international agreements. The COP21 conference set the commitment of countries to keeping the rise in global temperature below 2° Celsius compared to the pre-industrial age. Locally, this was reflected on the tar-gets each country’s set and committed to for their nationally determined contribu-tions (NDCs). The implementation of these targets will involve taking measures for industries with an intensive use of fuels, energy and CO2 emissions, such as the cement industry. In fact, in October 2018 the last IPCC (Intergovernmental Panel on Climate Change) report sent an alert to the governments of the world to take immediate action and set much more ambitious goals to limit global warming to 1.5°C, given that current commitments will not keep the temperature within the expected range. Therefore, all countries comprising our geographical scope may increase their NDCs in the future and hence their demands to carbon-intensive industries to reduce their emissions. The main implications for Argos operations might be materialized through, for example, the implementation of economic ins-truments (taxes or CO2 trading markets) and incentives, as well as mandatory reporting and verification systems.
The company monitors strategic risks through the definition of risk scenarios and their quantification via impacts of a potential risk materialization on strategic KPIs and KRIs such as EBITDA, FCF, net debt/EBITDA ratio and ROCE, measured as deviations of risk materializations from budgeted OKRs or targets.
We performed a scenario analysis considering the current NDCs defined by Colombia, the USA Hon-duras and Puerto Rico and calculated our emissions exceeding these thresholds. In addition, we defi-ned potential carbon prices as a random variable under a range from existing Emissions Trading System (ETS) according to the information available on the International Carbon Action Partnership (ICAP). Under a Value-at-Risk approach, we performed Monte Carlo simulations for cost overruns keeping 2019 emission levels for each country included in the model and calculating the correspon-ding emissions thresholds and costs of potential traded permits. An additional random variable was defined to model a 50% chance that this scenario was materialized in each country (controlling for simultaneity). As a result, cost overruns from setting NDCs for our emissions could vary between USD 562 thousand (perc. 10) and 25.5 (perc. 95) million.
Financial implications and other risks and opportunities due to climate change201-2INDICADOR
Direct operationsEmergingregulation
Carbon pricingmechanisms
Increased direct costs
Medium-termMore likelythan not
Medium-high
POTENTIAL FINANCIAL IMPACT FIGURE
USDCOP
POTENTIAL FINANCIAL IMPACT FIGURE – MINIMUM
USDCOP
POTENTIAL FINANCIAL IMPACT FIGURE – MAXIMUM
EXPLANATION OF FINANCIAL IMPACT FIGURE
USDCOP
$ 2.055.590.746 $ 556.879 $ 94.584.548.790 $ 25.623.850

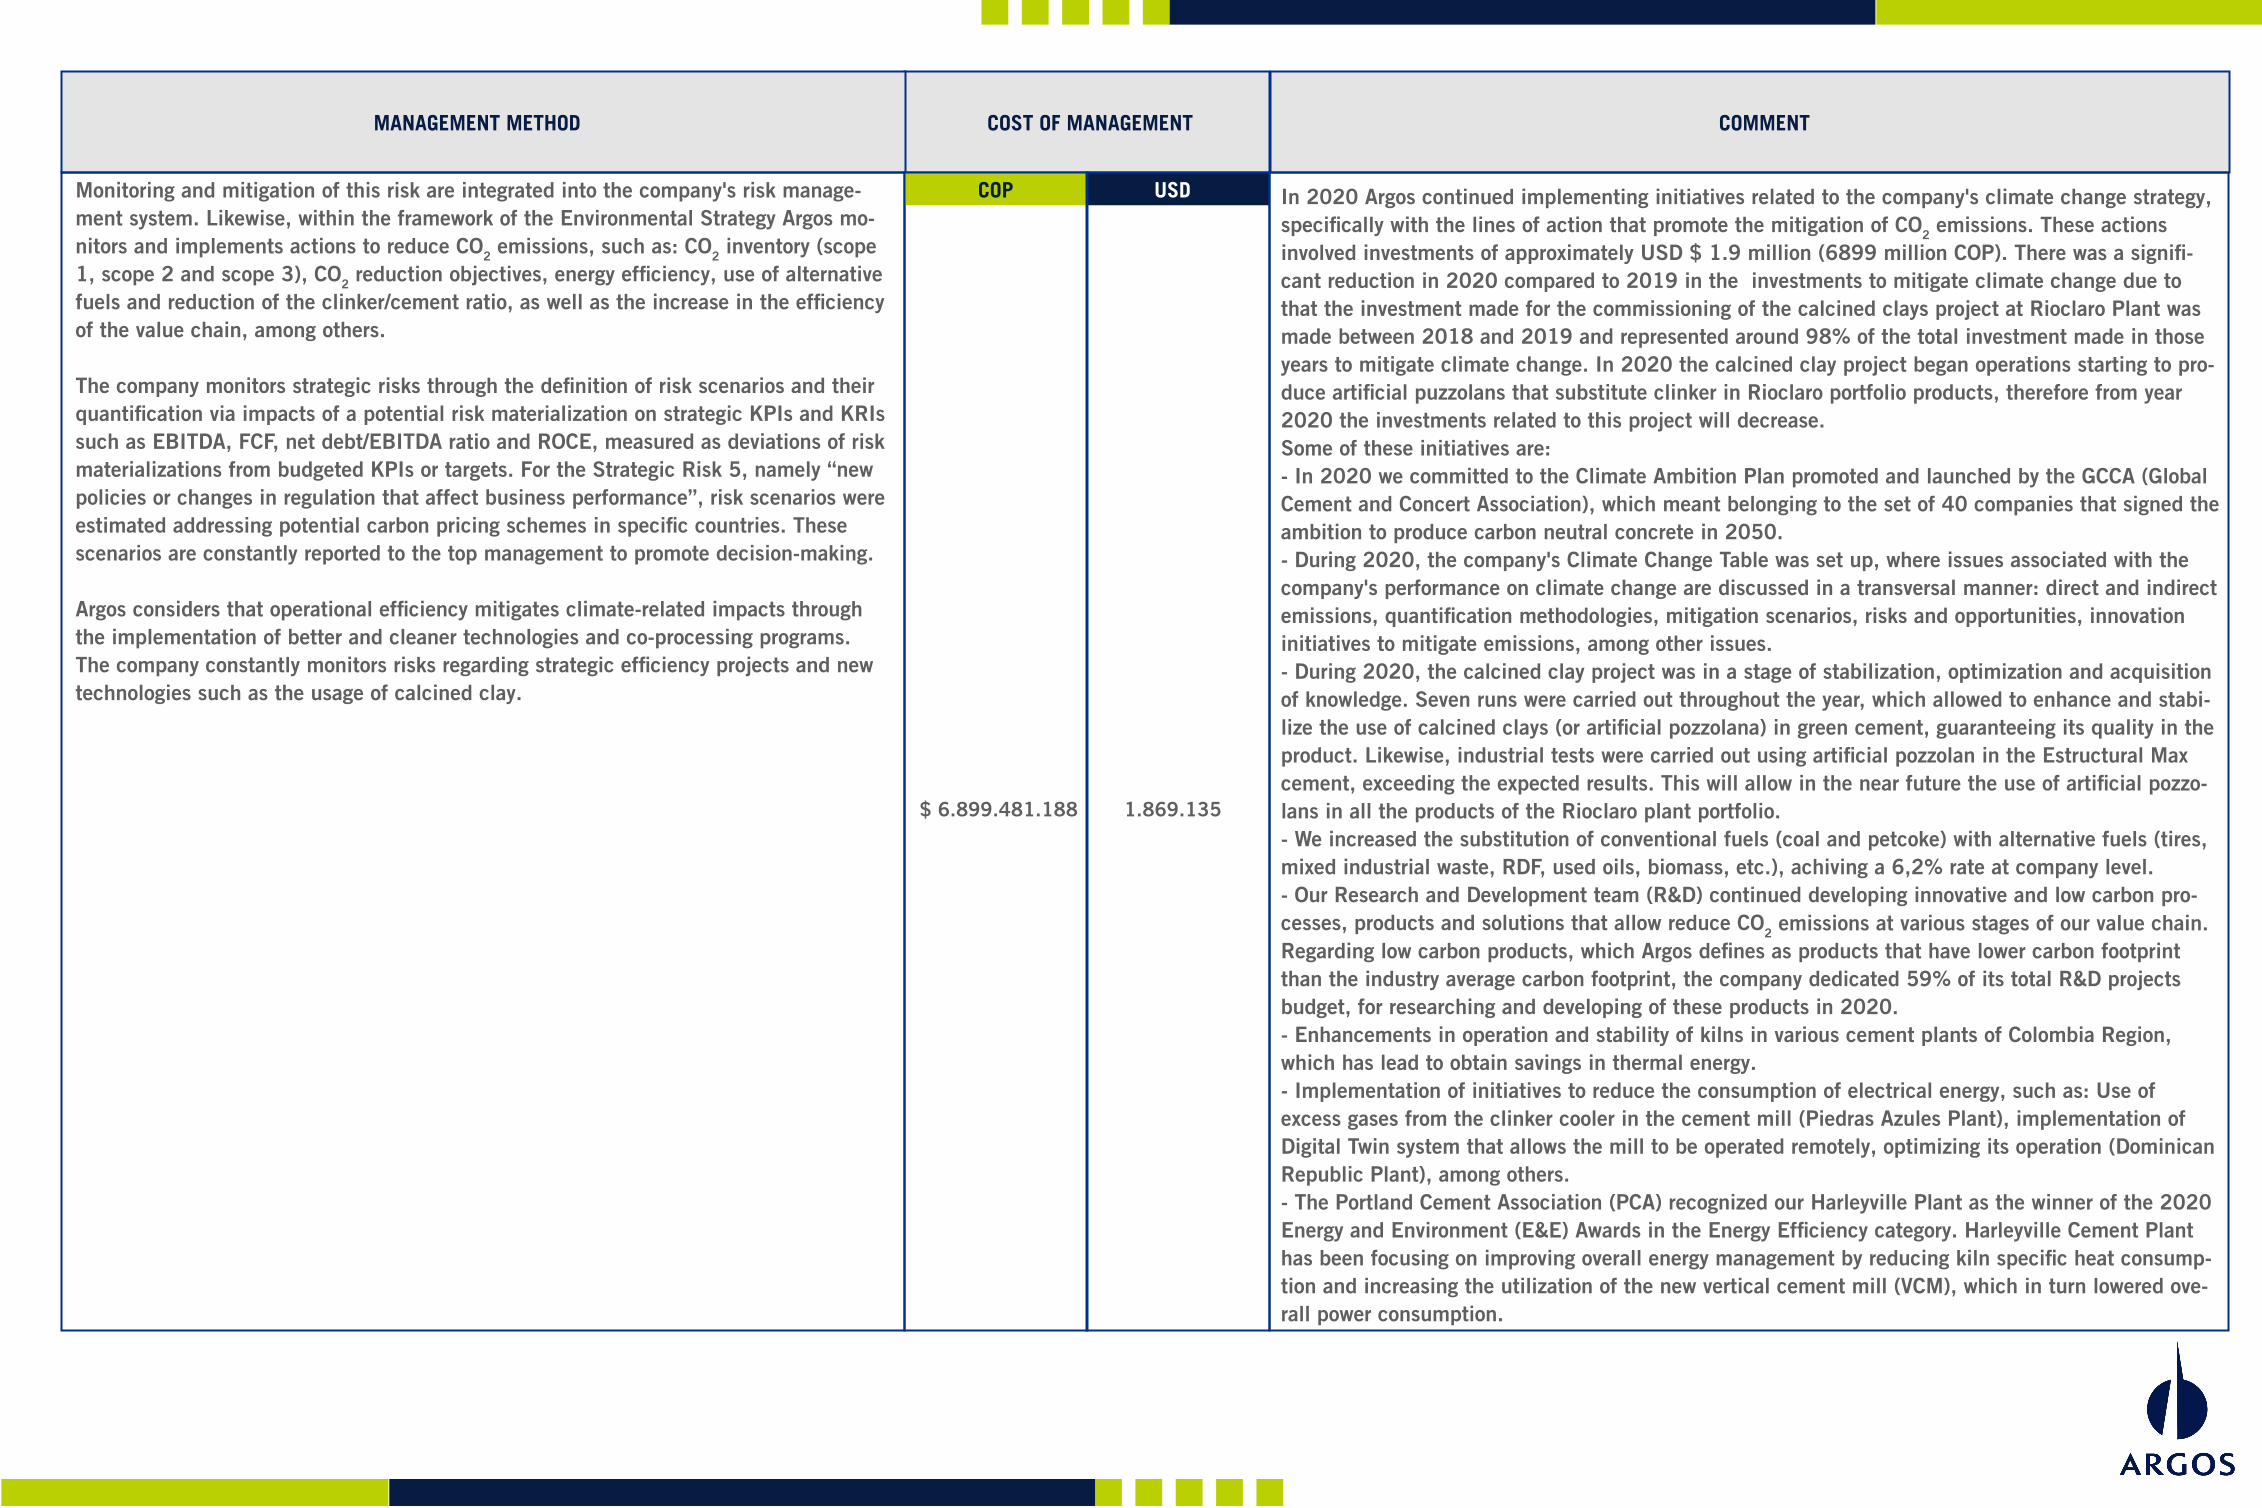
Monitoring and mitigation of this risk are integrated into the company's risk manage-ment system. Likewise, within the framework of the Environmental Strategy Argos mo-nitors and implements actions to reduce CO2 emissions, such as: CO2 inventory (scope 1, scope 2 and scope 3), CO2 reduction objectives, energy efficiency, use of alternative fuels and reduction of the clinker/cement ratio, as well as the increase in the efficiency of the value chain, among others.
The company monitors strategic risks through the definition of risk scenarios and their quantification via impacts of a potential risk materialization on strategic KPIs and KRIs such as EBITDA, FCF, net debt/EBITDA ratio and ROCE, measured as deviations of risk materializations from budgeted KPIs or targets. For the Strategic Risk 5, namely “new policies or changes in regulation that affect business performance”, risk scenarios were estimated addressing potential carbon pricing schemes in specific countries. These scenarios are constantly reported to the top management to promote decision-making.
Argos considers that operational efficiency mitigates climate-related impacts through the implementation of better and cleaner technologies and co-processing programs. The company constantly monitors risks regarding strategic efficiency projects and new technologies such as the usage of calcined clay.
COST OF MANAGEMENTMANAGEMENT METHOD
In 2020 Argos continued implementing initiatives related to the company's climate change strategy, specifically with the lines of action that promote the mitigation of CO2 emissions. These actions involved investments of approximately USD $ 1.9 million (6899 million COP). There was a signifi-cant reduction in 2020 compared to 2019 in the investments to mitigate climate change due to that the investment made for the commissioning of the calcined clays project at Rioclaro Plant was made between 2018 and 2019 and represented around 98% of the total investment made in those years to mitigate climate change. In 2020 the calcined clay project began operations starting to pro-duce artificial puzzolans that substitute clinker in Rioclaro portfolio products, therefore from year 2020 the investments related to this project will decrease.Some of these initiatives are: - In 2020 we committed to the Climate Ambition Plan promoted and launched by the GCCA (Global Cement and Concert Association), which meant belonging to the set of 40 companies that signed the ambition to produce carbon neutral concrete in 2050.- During 2020, the company's Climate Change Table was set up, where issues associated with the company's performance on climate change are discussed in a transversal manner: direct and indirect emissions, quantification methodologies, mitigation scenarios, risks and opportunities, innovation initiatives to mitigate emissions, among other issues.- During 2020, the calcined clay project was in a stage of stabilization, optimization and acquisition of knowledge. Seven runs were carried out throughout the year, which allowed to enhance and stabi-lize the use of calcined clays (or artificial pozzolana) in green cement, guaranteeing its quality in the product. Likewise, industrial tests were carried out using artificial pozzolan in the Estructural Max cement, exceeding the expected results. This will allow in the near future the use of artificial pozzo-lans in all the products of the Rioclaro plant portfolio.- We increased the substitution of conventional fuels (coal and petcoke) with alternative fuels (tires, mixed industrial waste, RDF, used oils, biomass, etc.), achiving a 6,2% rate at company level.- Our Research and Development team (R&D) continued developing innovative and low carbon pro-cesses, products and solutions that allow reduce CO2 emissions at various stages of our value chain. Regarding low carbon products, which Argos defines as products that have lower carbon footprint than the industry average carbon footprint, the company dedicated 59% of its total R&D projects budget, for researching and developing of these products in 2020.- Enhancements in operation and stability of kilns in various cement plants of Colombia Region, which has lead to obtain savings in thermal energy.- Implementation of initiatives to reduce the consumption of electrical energy, such as: Use of excess gases from the clinker cooler in the cement mill (Piedras Azules Plant), implementation of Digital Twin system that allows the mill to be operated remotely, optimizing its operation (Dominican Republic Plant), among others.- The Portland Cement Association (PCA) recognized our Harleyville Plant as the winner of the 2020 Energy and Environment (E&E) Awards in the Energy Efficiency category. Harleyville Cement Plant has been focusing on improving overall energy management by reducing kiln specific heat consump-tion and increasing the utilization of the new vertical cement mill (VCM), which in turn lowered ove-rall power consumption.
COMMENT
USDCOP
$ 6.899.481.188 1.869.135
NA NA
WHERE IN THE VALUECHAIN DOES THE RISKDRIVER OCCUR?
PRIMARY CLIMATE-RELATED RISK DRIVER
TYPE OF FINANCIALIMPACT
RISK TYPE TIME HORIZON LIKELIHOODMAGNITUDE OF IMPACT COMPANY- SPECIFIC DESCRIPTION
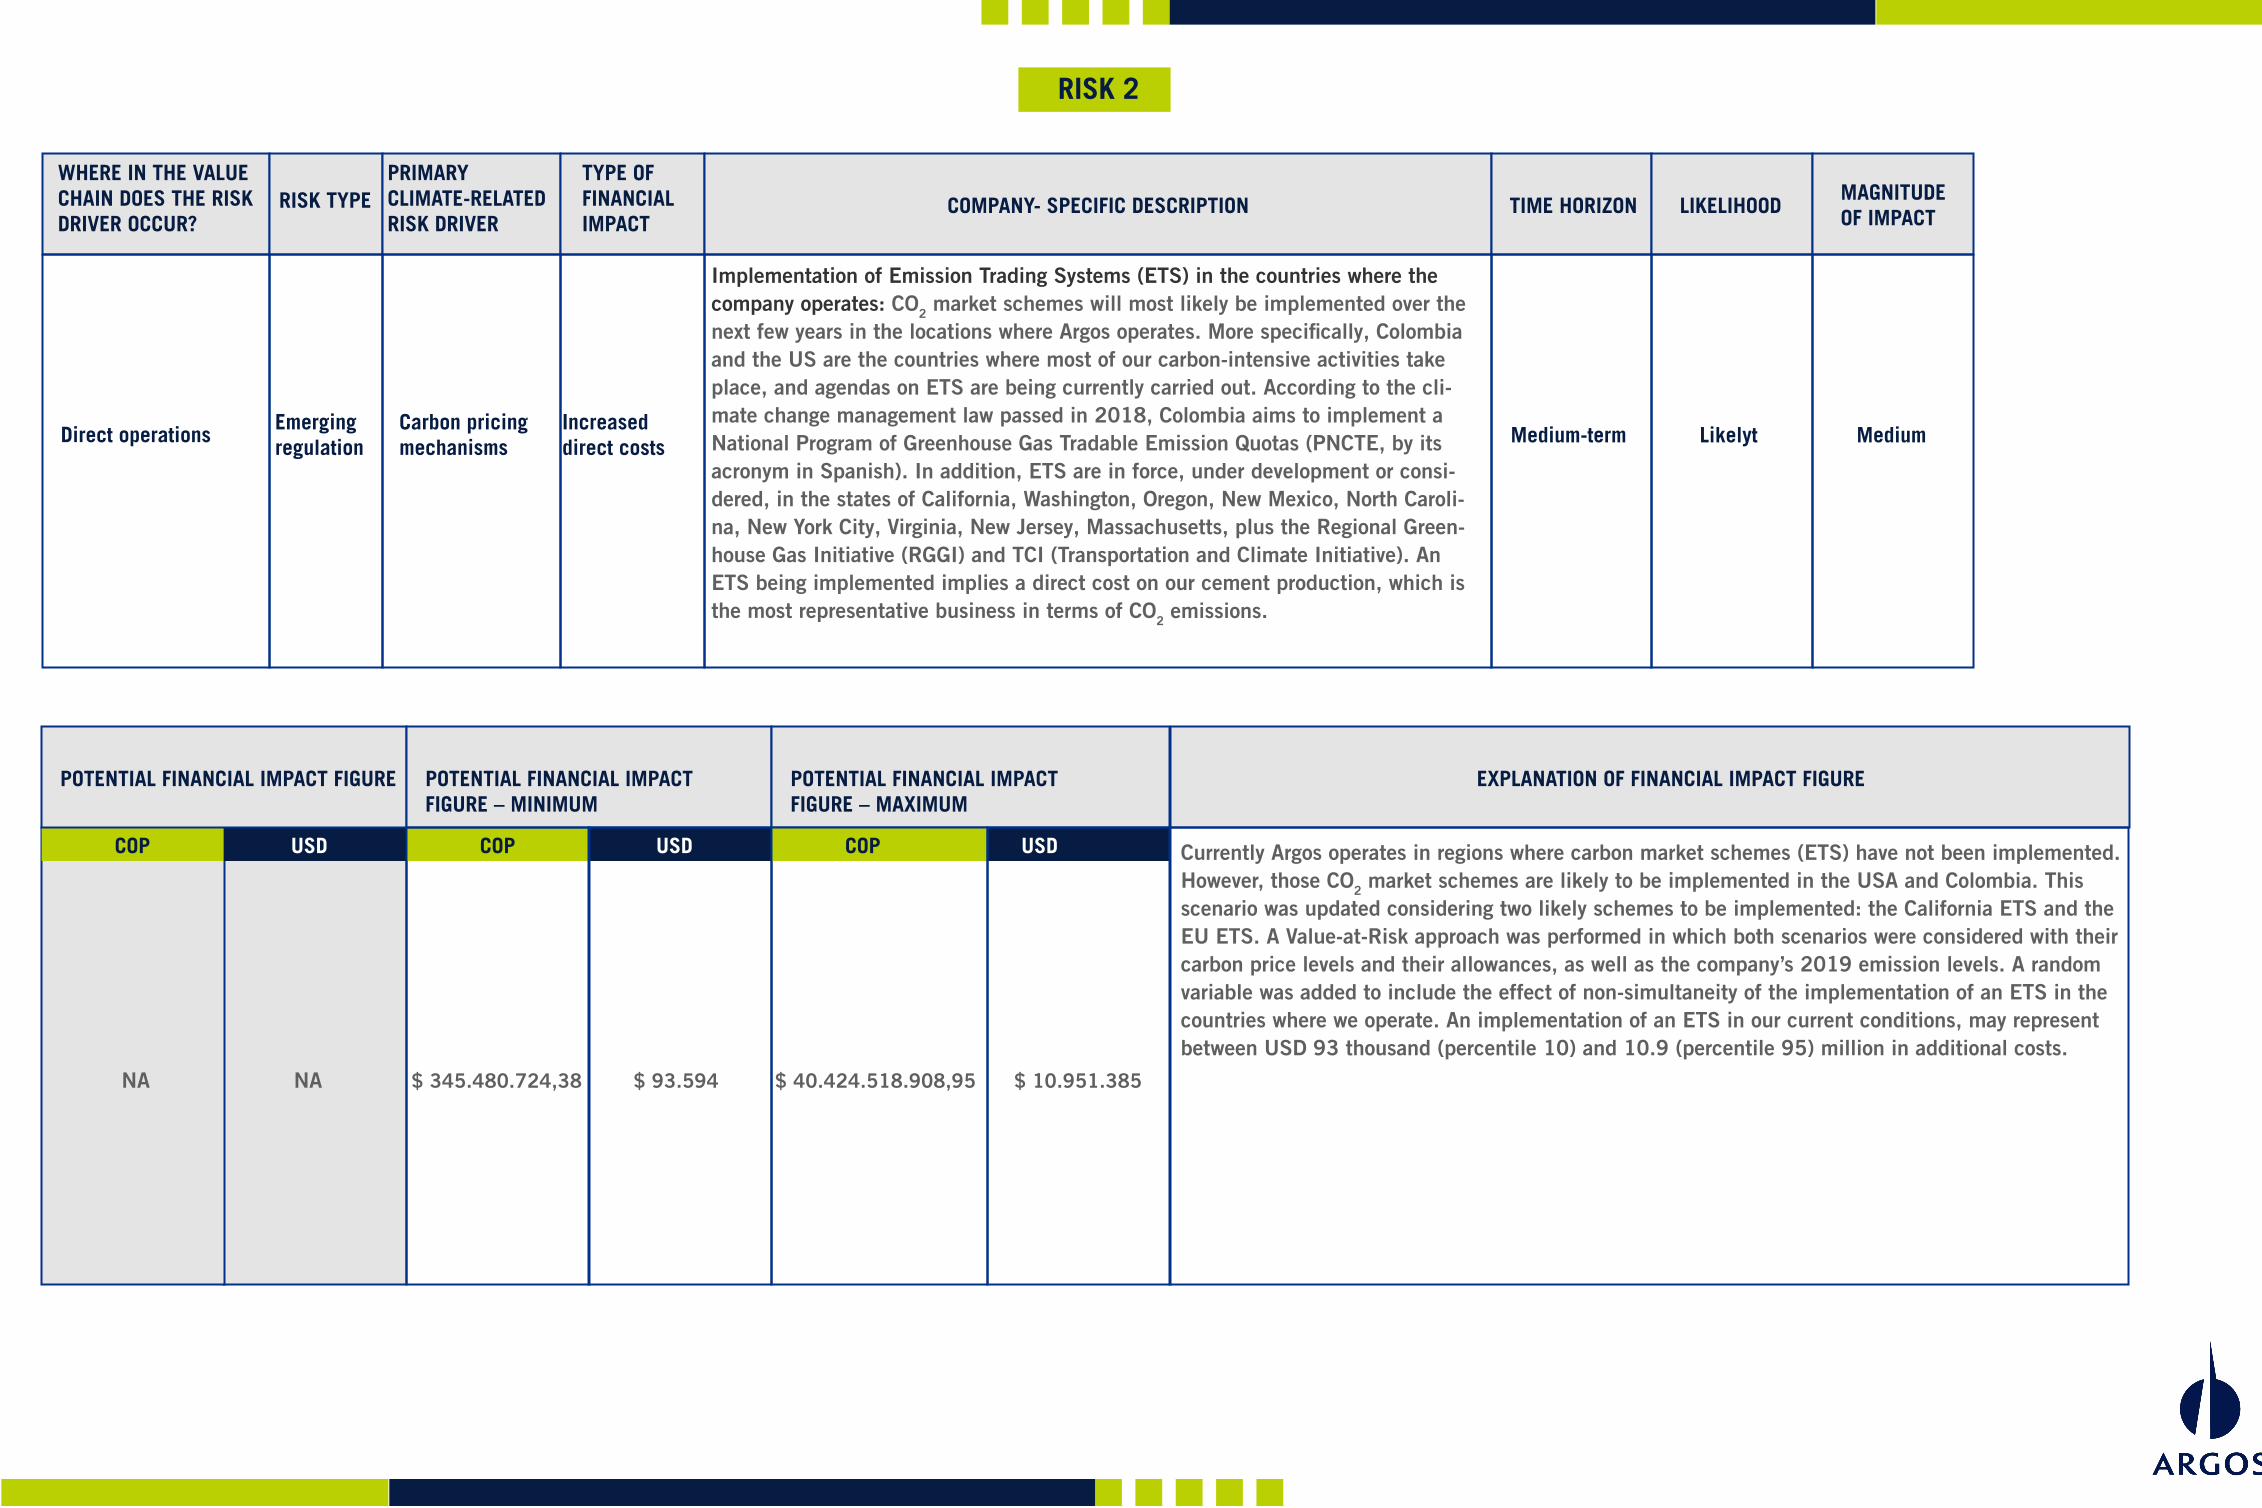
RISK 2
Implementation of Emission Trading Systems (ETS) in the countries where the company operates: CO2 market schemes will most likely be implemented over the next few years in the locations where Argos operates. More specifically, Colombia and the US are the countries where most of our carbon-intensive activities take place, and agendas on ETS are being currently carried out. According to the cli-mate change management law passed in 2018, Colombia aims to implement a National Program of Greenhouse Gas Tradable Emission Quotas (PNCTE, by its acronym in Spanish). In addition, ETS are in force, under development or consi-dered, in the states of California, Washington, Oregon, New Mexico, North Caroli-na, New York City, Virginia, New Jersey, Massachusetts, plus the Regional Green-house Gas Initiative (RGGI) and TCI (Transportation and Climate Initiative). An ETS being implemented implies a direct cost on our cement production, which is the most representative business in terms of CO2 emissions.
Currently Argos operates in regions where carbon market schemes (ETS) have not been implemented. However, those CO2 market schemes are likely to be implemented in the USA and Colombia. This scenario was updated considering two likely schemes to be implemented: the California ETS and the EU ETS. A Value-at-Risk approach was performed in which both scenarios were considered with their carbon price levels and their allowances, as well as the company’s 2019 emission levels. A random variable was added to include the effect of non-simultaneity of the implementation of an ETS in the countries where we operate. An implementation of an ETS in our current conditions, may represent between USD 93 thousand (percentile 10) and 10.9 (percentile 95) million in additional costs.
Direct operationsEmergingregulation
Carbon pricingmechanisms
Increased direct costs Medium-term Likelyt Medium
POTENTIAL FINANCIAL IMPACT FIGURE
USDCOP
POTENTIAL FINANCIAL IMPACT FIGURE – MINIMUM
USDCOP
POTENTIAL FINANCIAL IMPACT FIGURE – MAXIMUM
EXPLANATION OF FINANCIAL IMPACT FIGURE
USDCOP
$ 345.480.724,38 $ 93.594 $ 40.424.518.908,95 $ 10.951.385
Monitoring and mitigation of this risk are integrated into the company's risk manage-ment system. Likewise, within the framework of the Environmental Strategy Argos mo-nitors and implements actions to reduce CO2 emissions, such as: CO2 inventory (scope 1, scope 2 and scope 3), CO2 reduction objectives, energy efficiency, use of alternative fuels and reduction of the clinker/cement ratio, as well as the increase in the efficiency of the value chain, among others.
The company monitors strategic risks through the definition of risk scenarios and their quantification via impacts of a potential risk materialization on strategic KPIs and KRIs such as EBITDA, FCF, net debt/EBITDA ratio and ROCE, measured as deviations of risk materializations from budgeted KPIs or targets. For the Strategic Risk 5, namely “new policies or changes in regulation that affect business performance”, risk scenarios were estimated addressing potential carbon pricing schemes in specific countries. These scenarios are constantly reported to the top management to promote decision-making.
Argos considers that operational efficiency mitigates climate-related impacts through the implementation of better and cleaner technologies and co-processing programs. The company constantly monitors risks regarding strategic efficiency projects and new technologies such as the usage of calcined clay.
COST OF MANAGEMENTMANAGEMENT METHOD
In 2020 Argos continued implementing initiatives related to the company's climate change strategy, specifically with the lines of action that promote the mitigation of CO2 emissions. These actions involved investments of approximately USD $ 1.9 million (6899 million COP). There was a signifi-cant reduction in 2020 compared to 2019 in the investments to mitigate climate change due to that the investment made for the commissioning of the calcined clays project at Rioclaro Plant was made between 2018 and 2019 and represented around 98% of the total investment made in those years to mitigate climate change. In 2020 the calcined clay project began operations starting to pro-duce artificial puzzolans that substitute clinker in Rioclaro portfolio products, therefore from year 2020 the investments related to this project will decrease.Some of these initiatives are: - In 2020 we committed to the Climate Ambition Plan promoted and launched by the GCCA (Global Cement and Concert Association), which meant belonging to the set of 40 companies that signed the ambition to produce carbon neutral concrete in 2050.- During 2020, the company's Climate Change Table was set up, where issues associated with the company's performance on climate change are discussed in a transversal manner: direct and indirect emissions, quantification methodologies, mitigation scenarios, risks and opportunities, innovation initiatives to mitigate emissions, among other issues.- During 2020, the calcined clay project was in a stage of stabilization, optimization and acquisition of knowledge. Seven runs were carried out throughout the year, which allowed to enhance and stabi-lize the use of calcined clays (or artificial pozzolana) in green cement, guaranteeing its quality in the product. Likewise, industrial tests were carried out using artificial pozzolan in the Estructural Max cement, exceeding the expected results. This will allow in the near future the use of artificial pozzo-lans in all the products of the Rioclaro plant portfolio.- We increased the substitution of conventional fuels (coal and petcoke) with alternative fuels (tires, mixed industrial waste, RDF, used oils, biomass, etc.), achiving a 6,2% rate at company level.- Our Research and Development team (R&D) continued developing innovative and low carbon pro-cesses, products and solutions that allow reduce CO2 emissions at various stages of our value chain. Regarding low carbon products, which Argos defines as products that have lower carbon footprint than the industry average carbon footprint, the company dedicated 59% of its total R&D projects budget, for researching and developing of these products in 2020.- Enhancements in operation and stability of kilns in various cement plants of Colombia Region, which has lead to obtain savings in thermal energy.- Implementation of initiatives to reduce the consumption of electrical energy, such as: Use of excess gases from the clinker cooler in the cement mill (Piedras Azules Plant), implementation of Digital Twin system that allows the mill to be operated remotely, optimizing its operation (Dominican Republic Plant), among others.- The Portland Cement Association (PCA) recognized our Harleyville Plant as the winner of the 2020 Energy and Environment (E&E) Awards in the Energy Efficiency category. Harleyville Cement Plant has been focusing on improving overall energy management by reducing kiln specific heat consump-tion and increasing the utilization of the new vertical cement mill (VCM), which in turn lowered ove-rall power consumption.
COMMENT
USDCOP
$ 6.899.481.188 1.869.135
NA NA
WHERE IN THE VALUECHAIN DOES THE RISKDRIVER OCCUR?
PRIMARY CLIMATE-RELATED RISK DRIVER
TYPE OF FINANCIALIMPACT
RISK TYPE TIME HORIZON LIKELIHOODMAGNITUDE OF IMPACT COMPANY- SPECIFIC DESCRIPTION
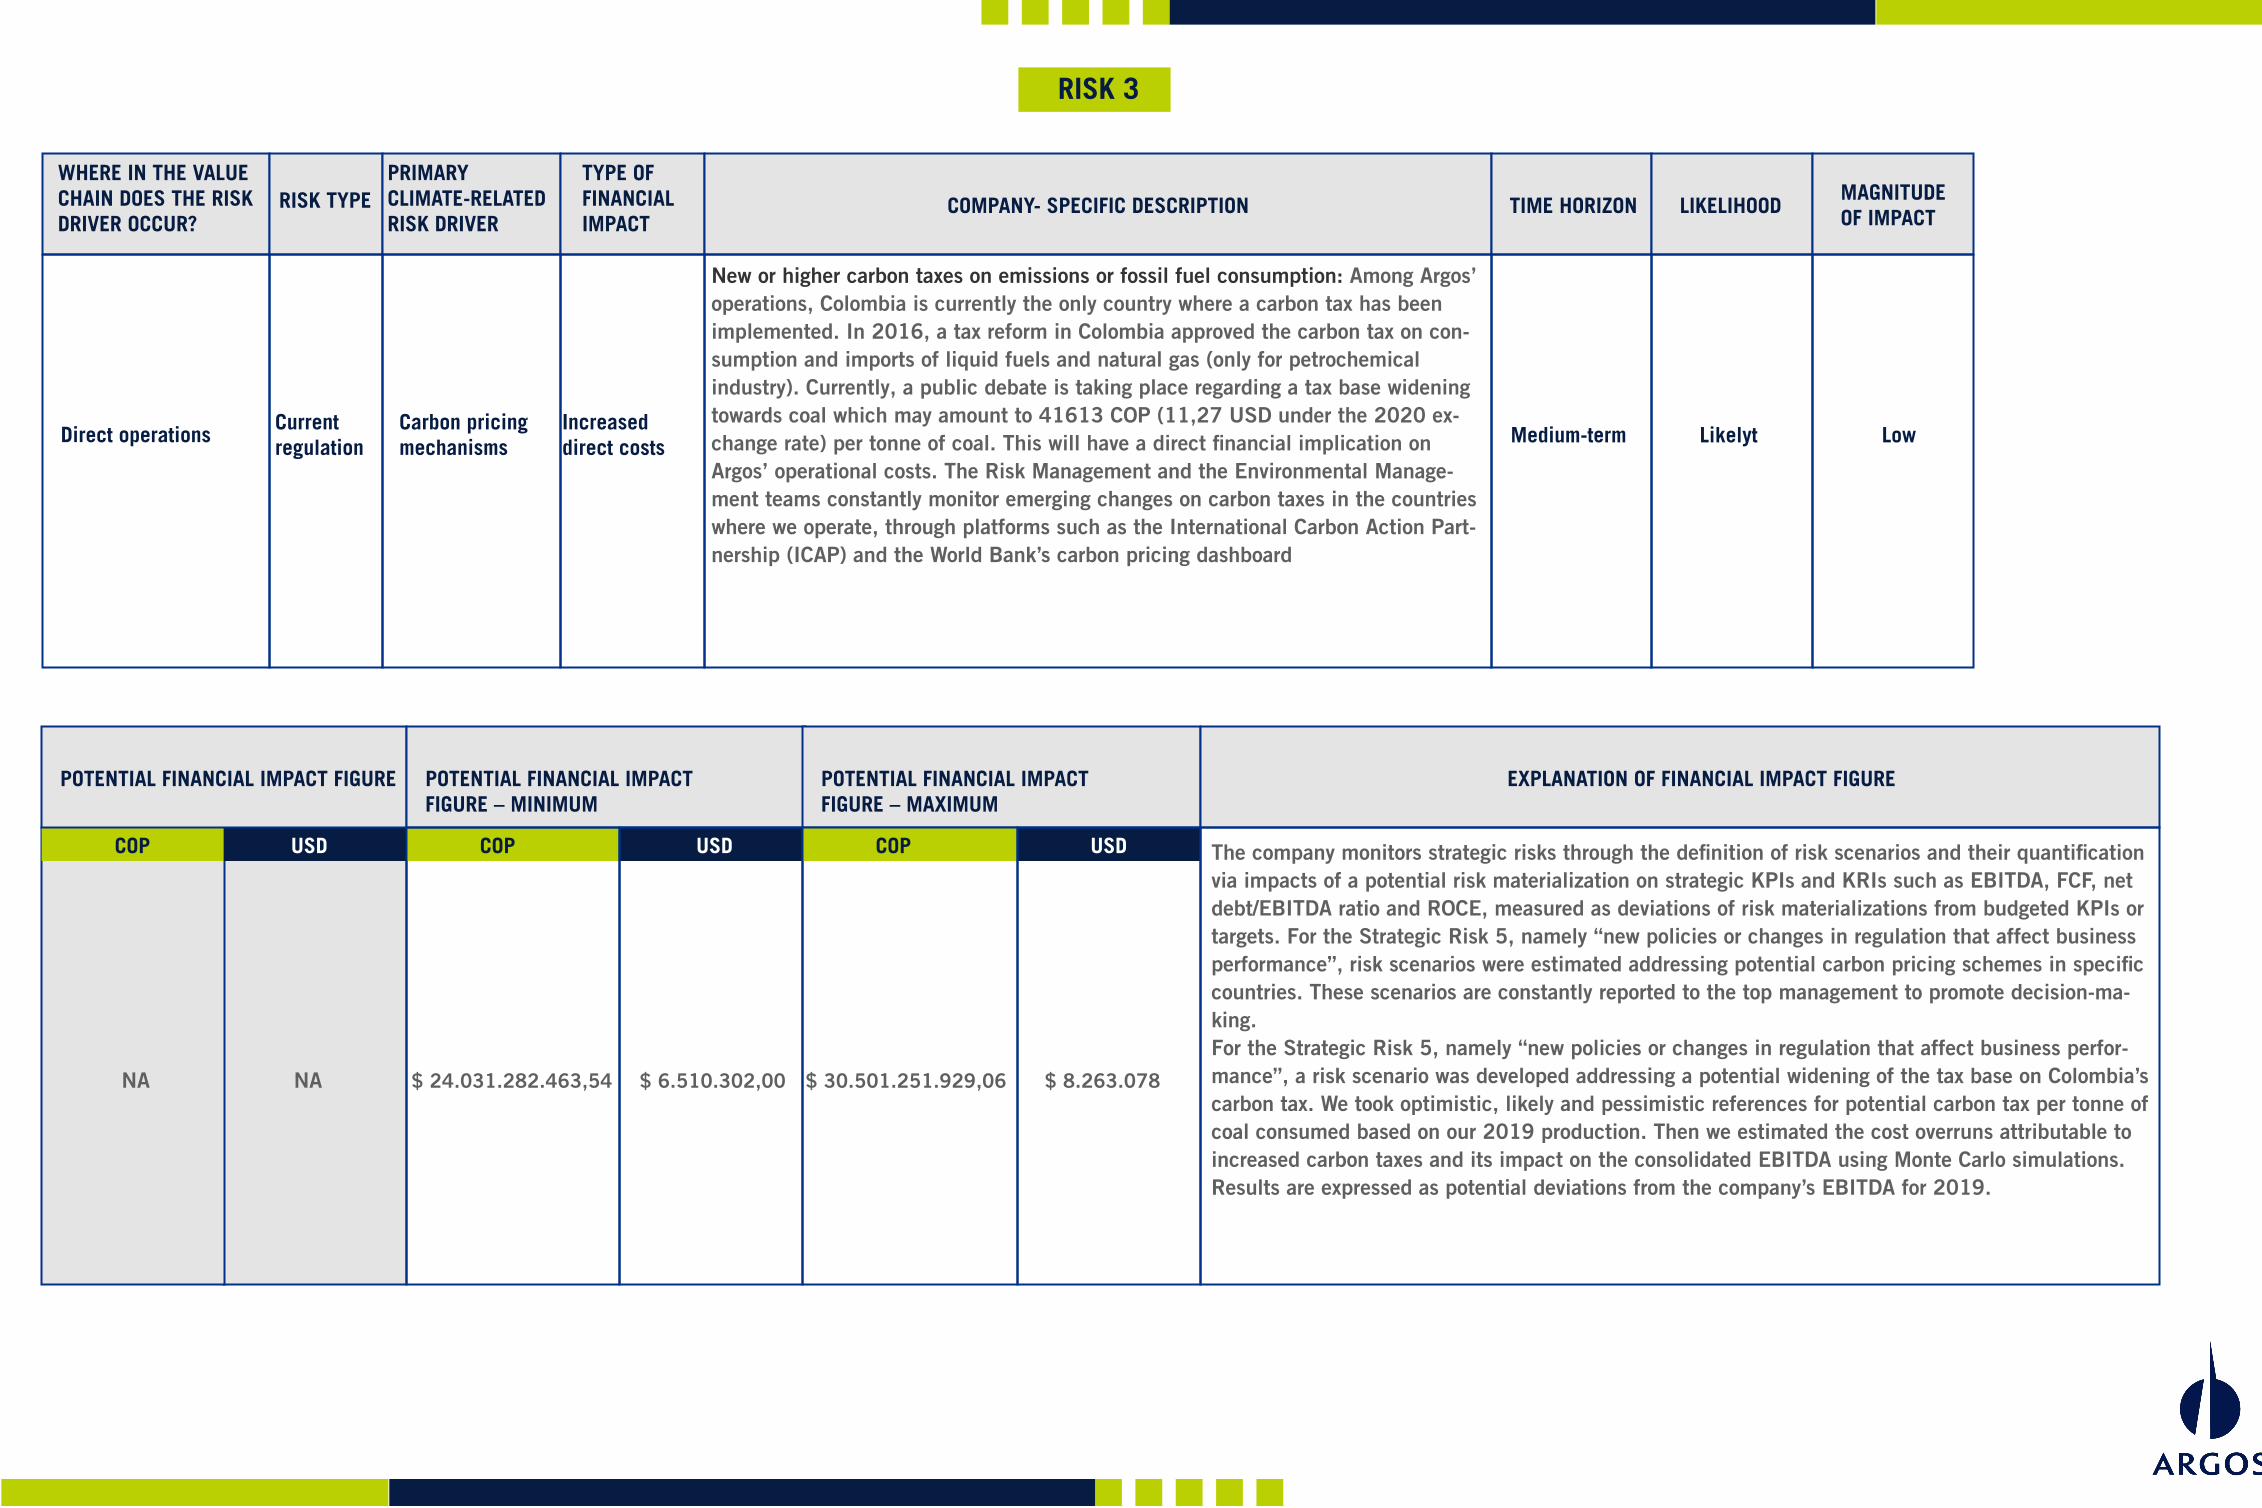
RISK 3
New or higher carbon taxes on emissions or fossil fuel consumption: Among Argos’ operations, Colombia is currently the only country where a carbon tax has been implemented. In 2016, a tax reform in Colombia approved the carbon tax on con-sumption and imports of liquid fuels and natural gas (only for petrochemical industry). Currently, a public debate is taking place regarding a tax base widening towards coal which may amount to 41613 COP (11,27 USD under the 2020 ex-change rate) per tonne of coal. This will have a direct financial implication on Argos’ operational costs. The Risk Management and the Environmental Manage-ment teams constantly monitor emerging changes on carbon taxes in the countries where we operate, through platforms such as the International Carbon Action Part-nership (ICAP) and the World Bank’s carbon pricing dashboard
The company monitors strategic risks through the definition of risk scenarios and their quantification via impacts of a potential risk materialization on strategic KPIs and KRIs such as EBITDA, FCF, net debt/EBITDA ratio and ROCE, measured as deviations of risk materializations from budgeted KPIs or targets. For the Strategic Risk 5, namely “new policies or changes in regulation that affect business performance”, risk scenarios were estimated addressing potential carbon pricing schemes in specific countries. These scenarios are constantly reported to the top management to promote decision-ma-king.For the Strategic Risk 5, namely “new policies or changes in regulation that affect business perfor-mance”, a risk scenario was developed addressing a potential widening of the tax base on Colombia’s carbon tax. We took optimistic, likely and pessimistic references for potential carbon tax per tonne of coal consumed based on our 2019 production. Then we estimated the cost overruns attributable to increased carbon taxes and its impact on the consolidated EBITDA using Monte Carlo simulations. Results are expressed as potential deviations from the company’s EBITDA for 2019.
Direct operationsCurrent regulation
Carbon pricingmechanisms
Increased direct costs Medium-term Likelyt Low
POTENTIAL FINANCIAL IMPACT FIGURE
USDCOP
POTENTIAL FINANCIAL IMPACT FIGURE – MINIMUM
USDCOP
POTENTIAL FINANCIAL IMPACT FIGURE – MAXIMUM
EXPLANATION OF FINANCIAL IMPACT FIGURE
USDCOP
$ 24.031.282.463,54 $ 6.510.302,00 $ 30.501.251.929,06 $ 8.263.078

Monitoring and mitigation of this risk are integrated into the company's risk manage-ment system. Likewise, within the framework of the Environmental Strategy Argos mo-nitors and implements actions to reduce CO2 emissions, such as: CO2 inventory (scope 1, scope 2 and scope 3), CO2 reduction objectives, energy efficiency, use of alternative fuels and reduction of the clinker/cement ratio, as well as the increase in the efficiency of the value chain, among others.
The company monitors strategic risks through the definition of risk scenarios and their quantification via impacts of a potential risk materialization on strategic KPIs and KRIs such as EBITDA, FCF, net debt/EBITDA ratio and ROCE, measured as deviations of risk materializations from budgeted KPIs or targets. For the Strategic Risk 5, namely “new policies or changes in regulation that affect business performance”, risk scenarios were estimated addressing potential carbon pricing schemes in specific countries. These scenarios are constantly reported to the top management to promote decision-making.
Argos considers that operational efficiency mitigates climate-related impacts through the implementation of better and cleaner technologies and co-processing programs. The company constantly monitors risks regarding strategic efficiency projects and new technologies such as the usage of calcined clay.
COST OF MANAGEMENTMANAGEMENT METHOD
In 2020 Argos continued implementing initiatives related to the company's climate change strategy, specifically with the lines of action that promote the mitigation of CO2 emissions. These actions involved investments of approximately USD $ 1.9 million (6899 million COP). There was a signifi-cant reduction in 2020 compared to 2019 in the investments to mitigate climate change due to that the investment made for the commissioning of the calcined clays project at Rioclaro Plant was made between 2018 and 2019 and represented around 98% of the total investment made in those years to mitigate climate change. In 2020 the calcined clay project began operations starting to pro-duce artificial puzzolans that substitute clinker in Rioclaro portfolio products, therefore from year 2020 the investments related to this project will decrease.Some of these initiatives are: - In 2020 we committed to the Climate Ambition Plan promoted and launched by the GCCA (Global Cement and Concert Association), which meant belonging to the set of 40 companies that signed the ambition to produce carbon neutral concrete in 2050.- During 2020, the company's Climate Change Table was set up, where issues associated with the company's performance on climate change are discussed in a transversal manner: direct and indirect emissions, quantification methodologies, mitigation scenarios, risks and opportunities, innovation initiatives to mitigate emissions, among other issues.- During 2020, the calcined clay project was in a stage of stabilization, optimization and acquisition of knowledge. Seven runs were carried out throughout the year, which allowed to enhance and stabi-lize the use of calcined clays (or artificial pozzolana) in green cement, guaranteeing its quality in the product. Likewise, industrial tests were carried out using artificial pozzolan in the Estructural Max cement, exceeding the expected results. This will allow in the near future the use of artificial pozzo-lans in all the products of the Rioclaro plant portfolio.- We increased the substitution of conventional fuels (coal and petcoke) with alternative fuels (tires, mixed industrial waste, RDF, used oils, biomass, etc.), achiving a 6,2% rate at company level.- Our Research and Development team (R&D) continued developing innovative and low carbon pro-cesses, products and solutions that allow reduce CO2 emissions at various stages of our value chain. Regarding low carbon products, which Argos defines as products that have lower carbon footprint than the industry average carbon footprint, the company dedicated 59% of its total R&D projects budget, for researching and developing of these products in 2020.- Enhancements in operation and stability of kilns in various cement plants of Colombia Region, which has lead to obtain savings in thermal energy.- Implementation of initiatives to reduce the consumption of electrical energy, such as: Use of excess gases from the clinker cooler in the cement mill (Piedras Azules Plant), implementation of Digital Twin system that allows the mill to be operated remotely, optimizing its operation (Dominican Republic Plant), among others.- The Portland Cement Association (PCA) recognized our Harleyville Plant as the winner of the 2020 Energy and Environment (E&E) Awards in the Energy Efficiency category. Harleyville Cement Plant has been focusing on improving overall energy management by reducing kiln specific heat consump-tion and increasing the utilization of the new vertical cement mill (VCM), which in turn lowered ove-rall power consumption.
COMMENT
USDCOP
$ 6.899.481.188 1.869.135
NA NA
WHERE IN THE VALUECHAIN DOES THE RISKDRIVER OCCUR?
PRIMARY CLIMATE-RELATED RISK DRIVER
TYPE OF FINANCIALIMPACT
RISK TYPE TIME HORIZON LIKELIHOODMAGNITUDE OF IMPACT COMPANY- SPECIFIC DESCRIPTION
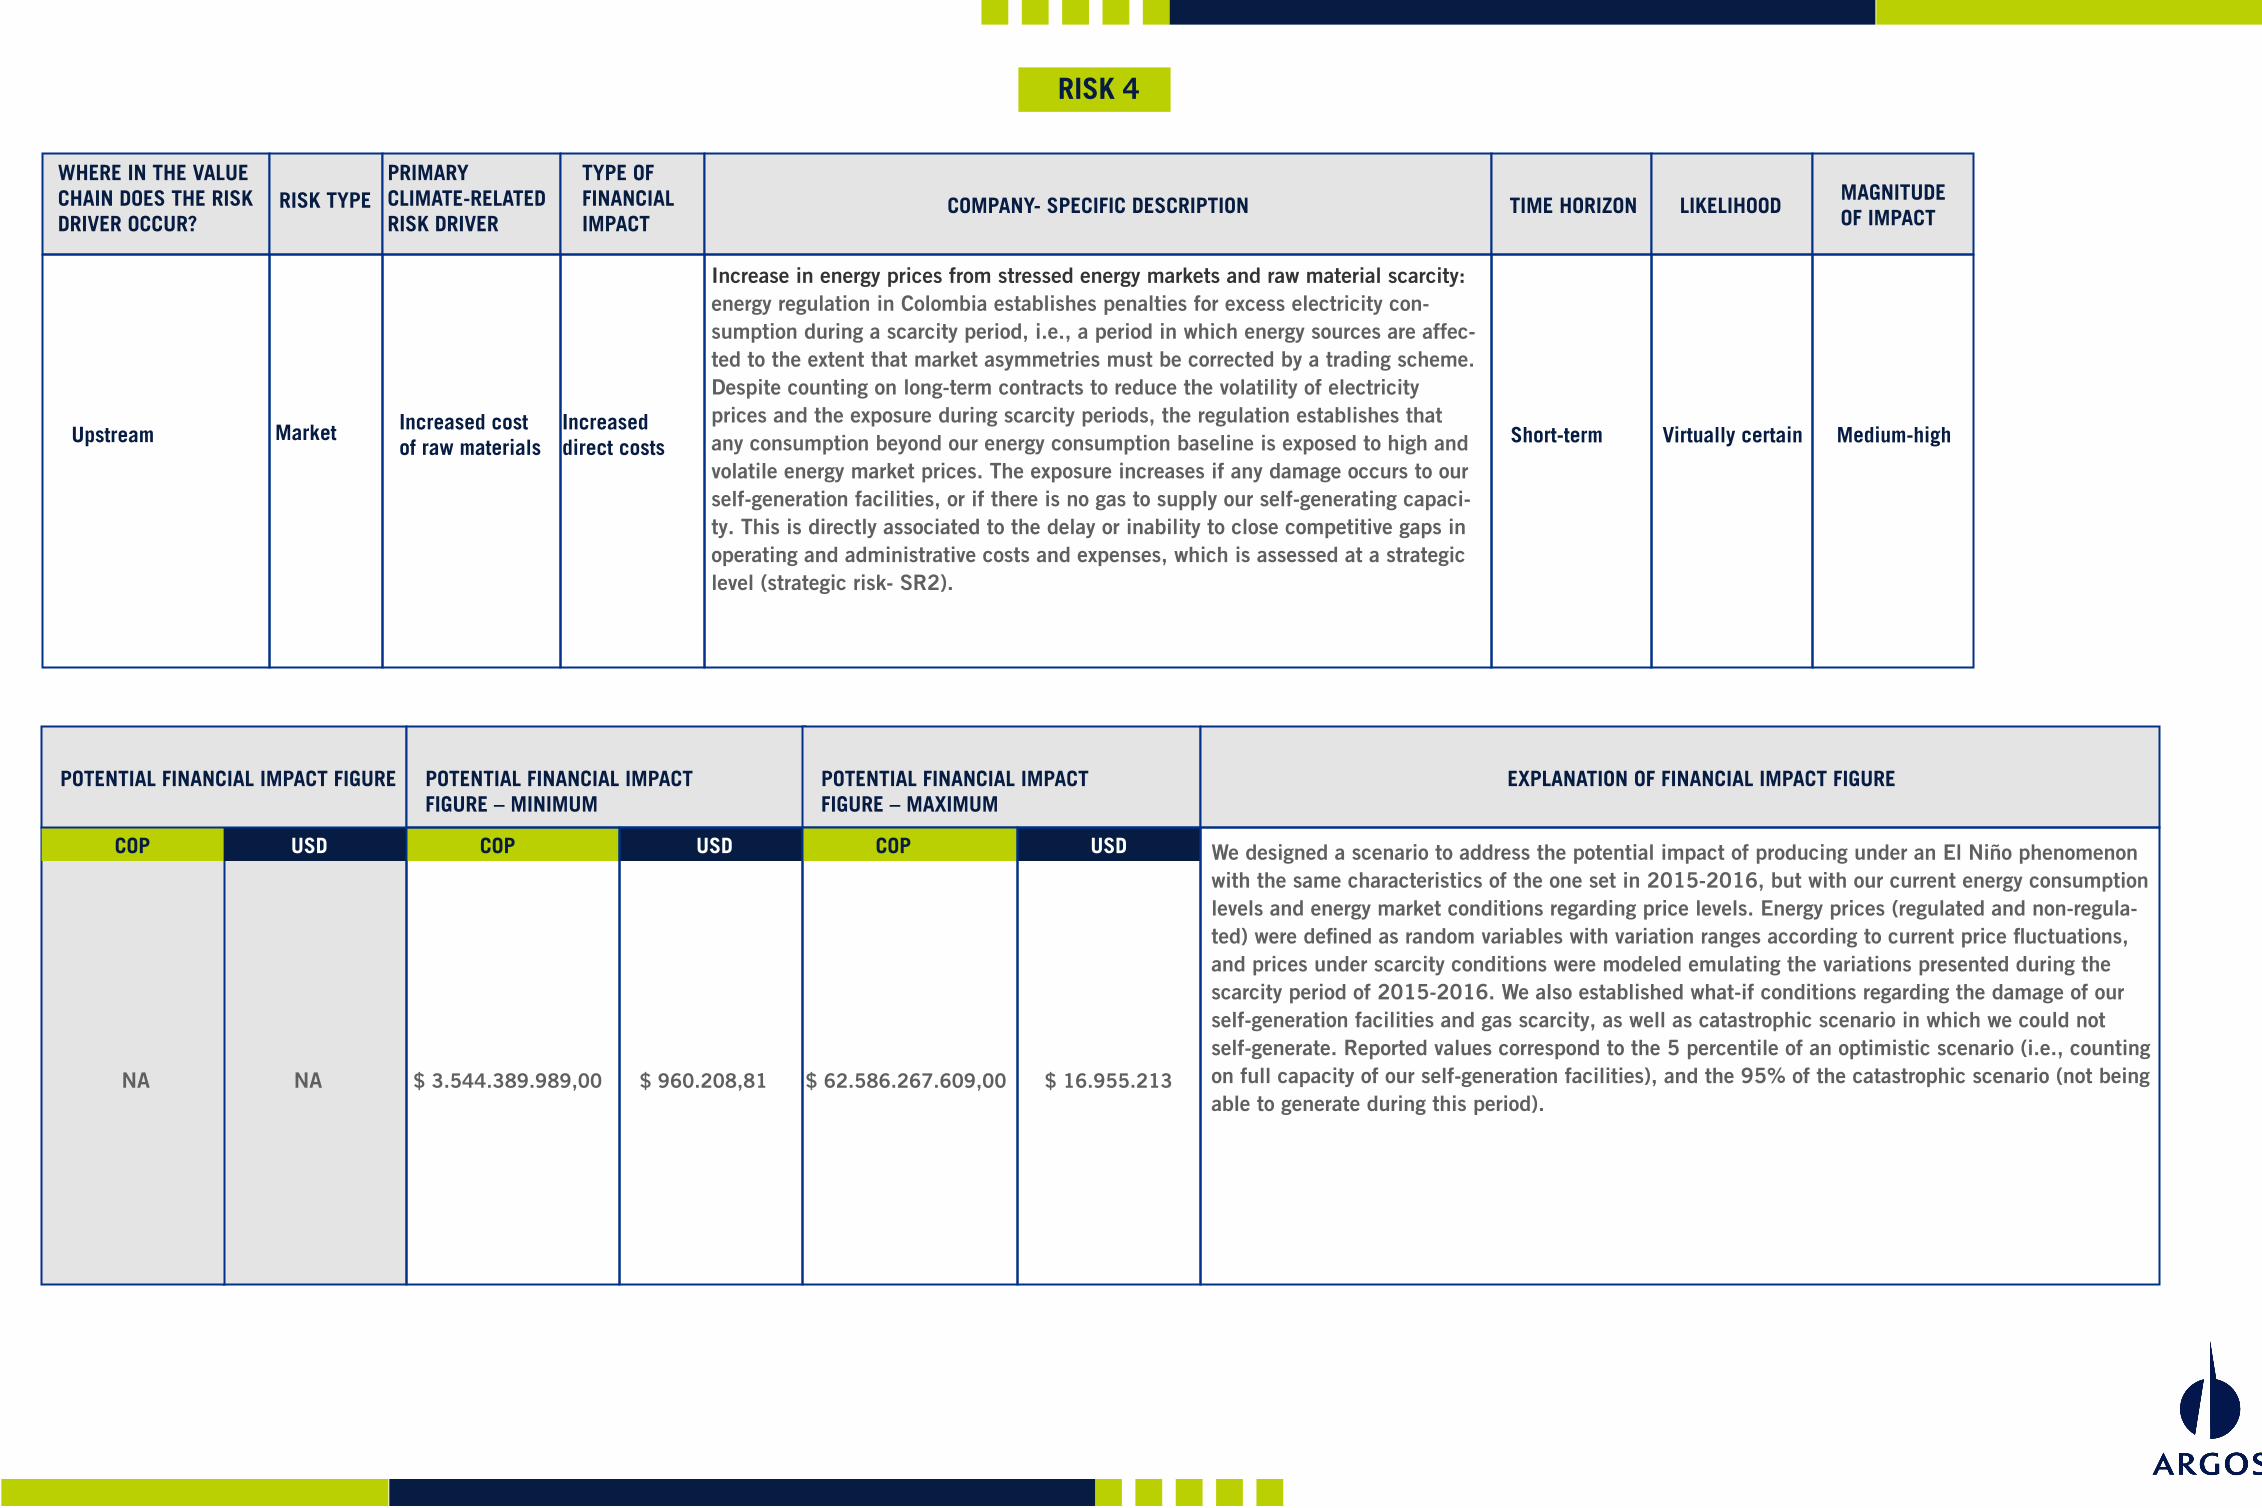
RISK 4
Increase in energy prices from stressed energy markets and raw material scarcity: energy regulation in Colombia establishes penalties for excess electricity con-sumption during a scarcity period, i.e., a period in which energy sources are affec-ted to the extent that market asymmetries must be corrected by a trading scheme. Despite counting on long-term contracts to reduce the volatility of electricity prices and the exposure during scarcity periods, the regulation establishes that any consumption beyond our energy consumption baseline is exposed to high and volatile energy market prices. The exposure increases if any damage occurs to our self-generation facilities, or if there is no gas to supply our self-generating capaci-ty. This is directly associated to the delay or inability to close competitive gaps in operating and administrative costs and expenses, which is assessed at a strategic level (strategic risk- SR2).
We designed a scenario to address the potential impact of producing under an El Niño phenomenon with the same characteristics of the one set in 2015-2016, but with our current energy consumption levels and energy market conditions regarding price levels. Energy prices (regulated and non-regula-ted) were defined as random variables with variation ranges according to current price fluctuations, and prices under scarcity conditions were modeled emulating the variations presented during the scarcity period of 2015-2016. We also established what-if conditions regarding the damage of our self-generation facilities and gas scarcity, as well as catastrophic scenario in which we could not self-generate. Reported values correspond to the 5 percentile of an optimistic scenario (i.e., counting on full capacity of our self-generation facilities), and the 95% of the catastrophic scenario (not being able to generate during this period).
Upstream Market Increased cost of raw materials
Increased direct costs Short-term Virtually certain Medium-high
POTENTIAL FINANCIAL IMPACT FIGURE
USDCOP
POTENTIAL FINANCIAL IMPACT FIGURE – MINIMUM
USDCOP
POTENTIAL FINANCIAL IMPACT FIGURE – MAXIMUM
EXPLANATION OF FINANCIAL IMPACT FIGURE
USDCOP
$ 3.544.389.989,00 $ 960.208,81 $ 62.586.267.609,00 $ 16.955.213
We have an Energy Policy that provides the guidelines to respond to the needs of our operations in terms of electricity and fuels. Through this we commit to minimize the energy intensity of our operations, with emphasis on the stability of costs, quality and supply at a reasonable risk.
Regarding electricity consumption, different responses are structured depending on each country’s profile. For instance, in Colombia and Panama, long-term variations of weather patterns affect water availability and hence the reliability on hydroelectric sources, which are these countries’ main energy providers.
Mitigation actions include long-term contracts with fixed prices. In countries with diver-se non-predominant energy markets, long-term renewable energy projects such as wind and solar farms have been set along with energy companies. In 2018 and together with Celsia, we started implementing a solar farm in Honduras that will supply up to 22 percent of the operation’s demand.
COST OF MANAGEMENTMANAGEMENT METHOD
The reported figure corresponds the project investments for reducing power consumption due to im-provements in electrical efficiency.
COMMENT
USDCOP
$ 274.497.602 74.364
WHERE IN THE VALUECHAIN DOES THE RISKDRIVER OCCUR?
PRIMARY CLIMATE-RELATED RISK DRIVER
TYPE OF FINANCIALIMPACT
RISK TYPE TIME HORIZON LIKELIHOODMAGNITUDE OF IMPACT COMPANY- SPECIFIC DESCRIPTION
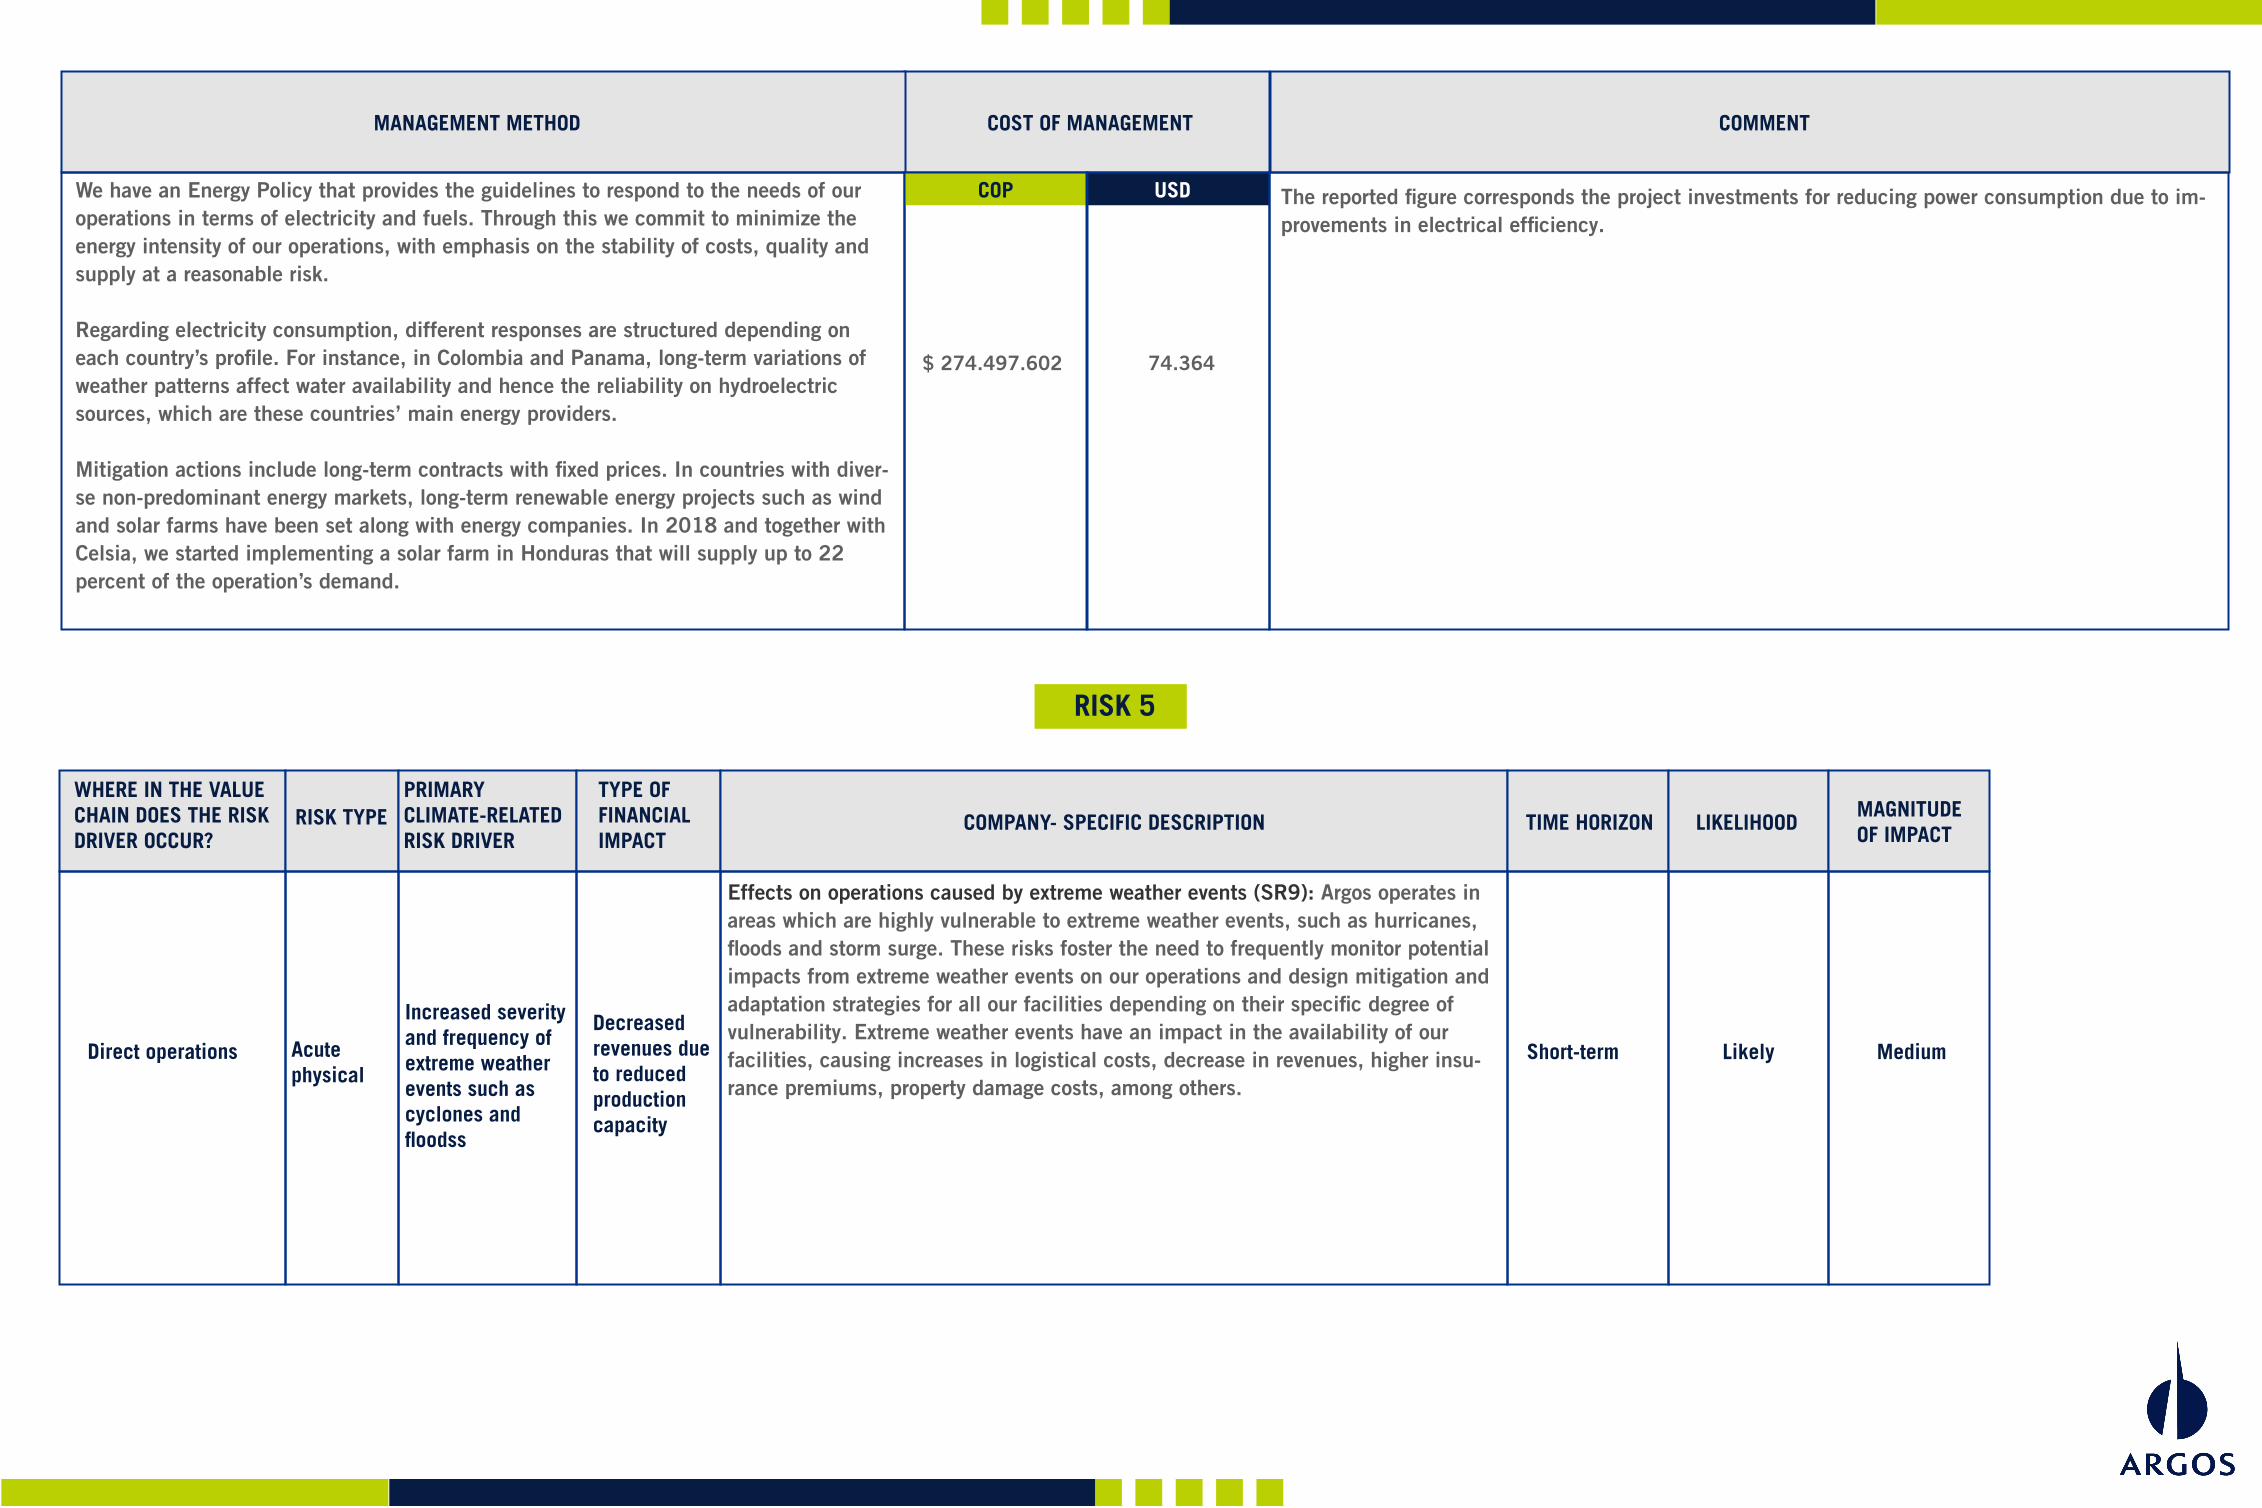
RISK 5
Effects on operations caused by extreme weather events (SR9): Argos operates in areas which are highly vulnerable to extreme weather events, such as hurricanes, floods and storm surge. These risks foster the need to frequently monitor potential impacts from extreme weather events on our operations and design mitigation and adaptation strategies for all our facilities depending on their specific degree of vulnerability. Extreme weather events have an impact in the availability of our facilities, causing increases in logistical costs, decrease in revenues, higher insu-rance premiums, property damage costs, among others.
Direct operations Acute physical
Increased severity and frequency of extreme weather events such as cyclones andfloodss
Decreased revenues dueto reduced production capacity
Short-term Likely Medium
NA NA NA NA
Argos estimates financial impacts of extreme weather events via costs of interrupting operations in key facilities (e.g., logistical, loss of earnings), and potential property damage losses affecting insu-rance premiums. In 2019 the value on annual losses from property damage were updated. Losses for all locations were estimated using the AIR Touchstone and Risk Management Solutions (RMS) models, which enabled us to make better informed risk transfer and retention decisions, as well as to better identify critical operations in order to prioritize climate change adaptation plans. Results for all our facilities account for approximately 19 million USD. Estimations are used internally for deci-sion-making.
POTENTIAL FINANCIAL IMPACT FIGURE
USDCOP
POTENTIAL FINANCIAL IMPACT FIGURE – MINIMUM
USDCOP
POTENTIAL FINANCIAL IMPACT FIGURE – MAXIMUM
EXPLANATION OF FINANCIAL IMPACT FIGURE
USDCOP
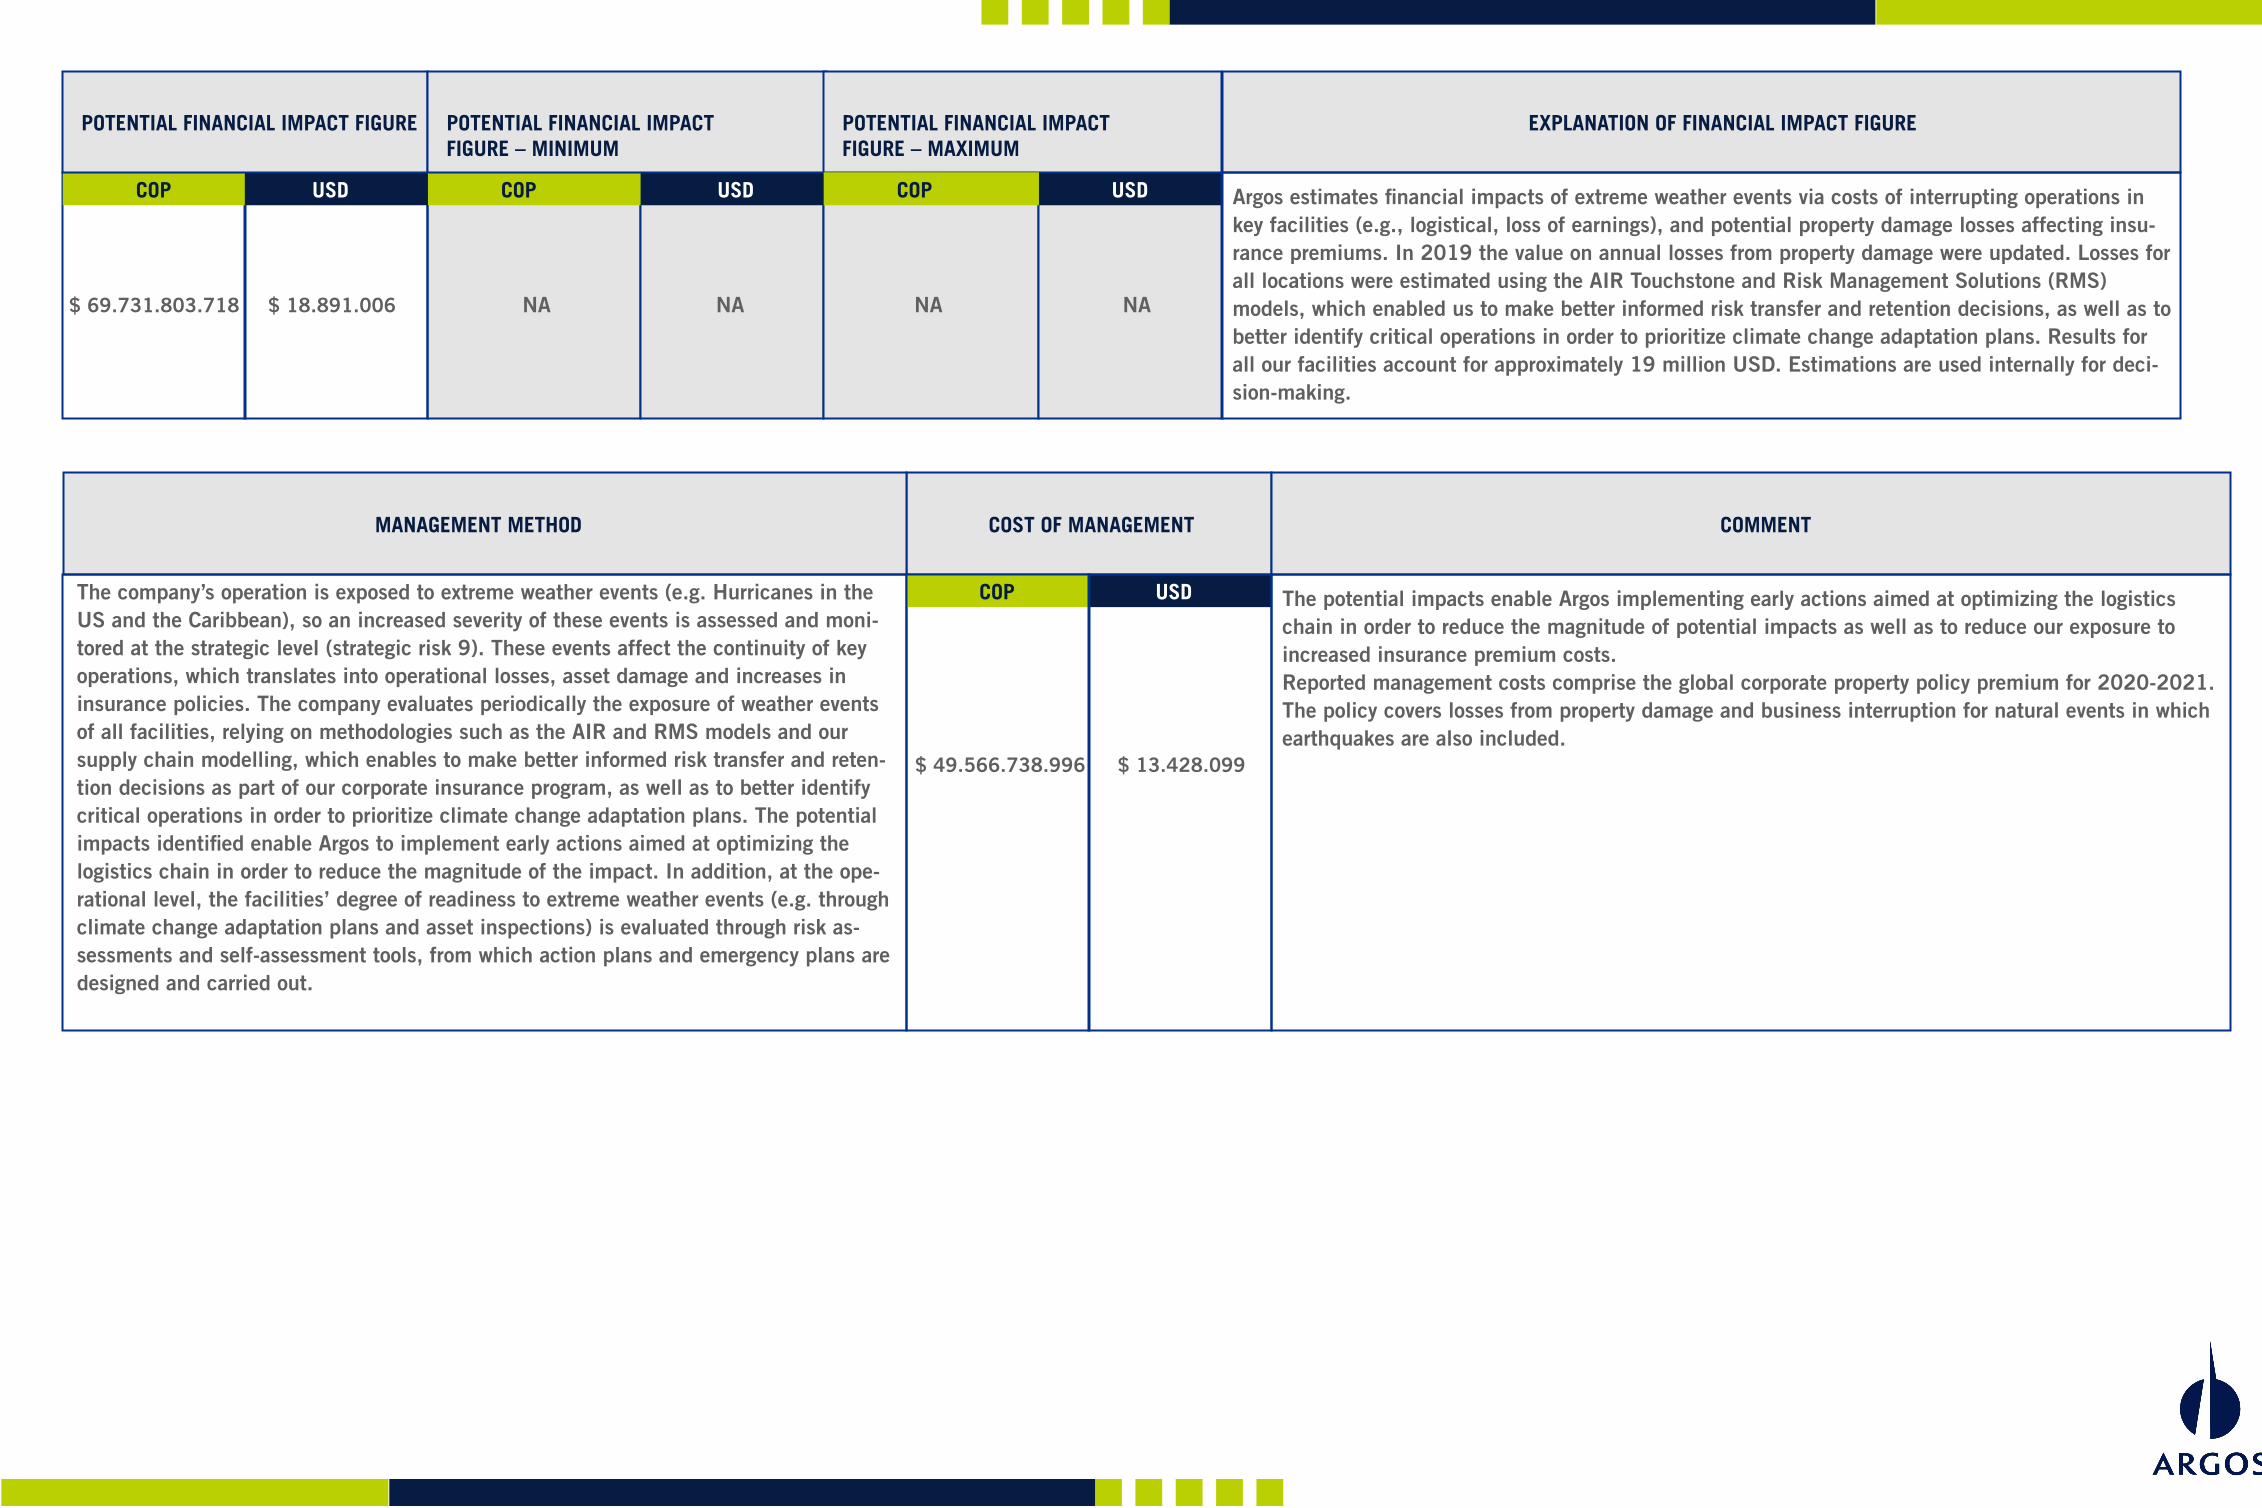
The company’s operation is exposed to extreme weather events (e.g. Hurricanes in the US and the Caribbean), so an increased severity of these events is assessed and moni-tored at the strategic level (strategic risk 9). These events affect the continuity of key operations, which translates into operational losses, asset damage and increases in insurance policies. The company evaluates periodically the exposure of weather events of all facilities, relying on methodologies such as the AIR and RMS models and our supply chain modelling, which enables to make better informed risk transfer and reten-tion decisions as part of our corporate insurance program, as well as to better identify critical operations in order to prioritize climate change adaptation plans. The potential impacts identified enable Argos to implement early actions aimed at optimizing the logistics chain in order to reduce the magnitude of the impact. In addition, at the ope-rational level, the facilities’ degree of readiness to extreme weather events (e.g. through climate change adaptation plans and asset inspections) is evaluated through risk as-sessments and self-assessment tools, from which action plans and emergency plans are designed and carried out.
COST OF MANAGEMENTMANAGEMENT METHOD
The potential impacts enable Argos implementing early actions aimed at optimizing the logistics chain in order to reduce the magnitude of potential impacts as well as to reduce our exposure to increased insurance premium costs.Reported management costs comprise the global corporate property policy premium for 2020-2021. The policy covers losses from property damage and business interruption for natural events in which earthquakes are also included.
COMMENT
USDCOP
$ 49.566.738.996 $ 13.428.099
$ 18.891.006 $ 69.731.803.718
NA NA
WHERE IN THE VALUECHAIN DOES THE RISKDRIVER OCCUR?
PRIMARY CLIMATE-RELATED RISK DRIVER
TYPE OF FINANCIALIMPACT
RISK TYPE TIME HORIZON LIKELIHOODMAGNITUDE OF IMPACT COMPANY- SPECIFIC DESCRIPTION
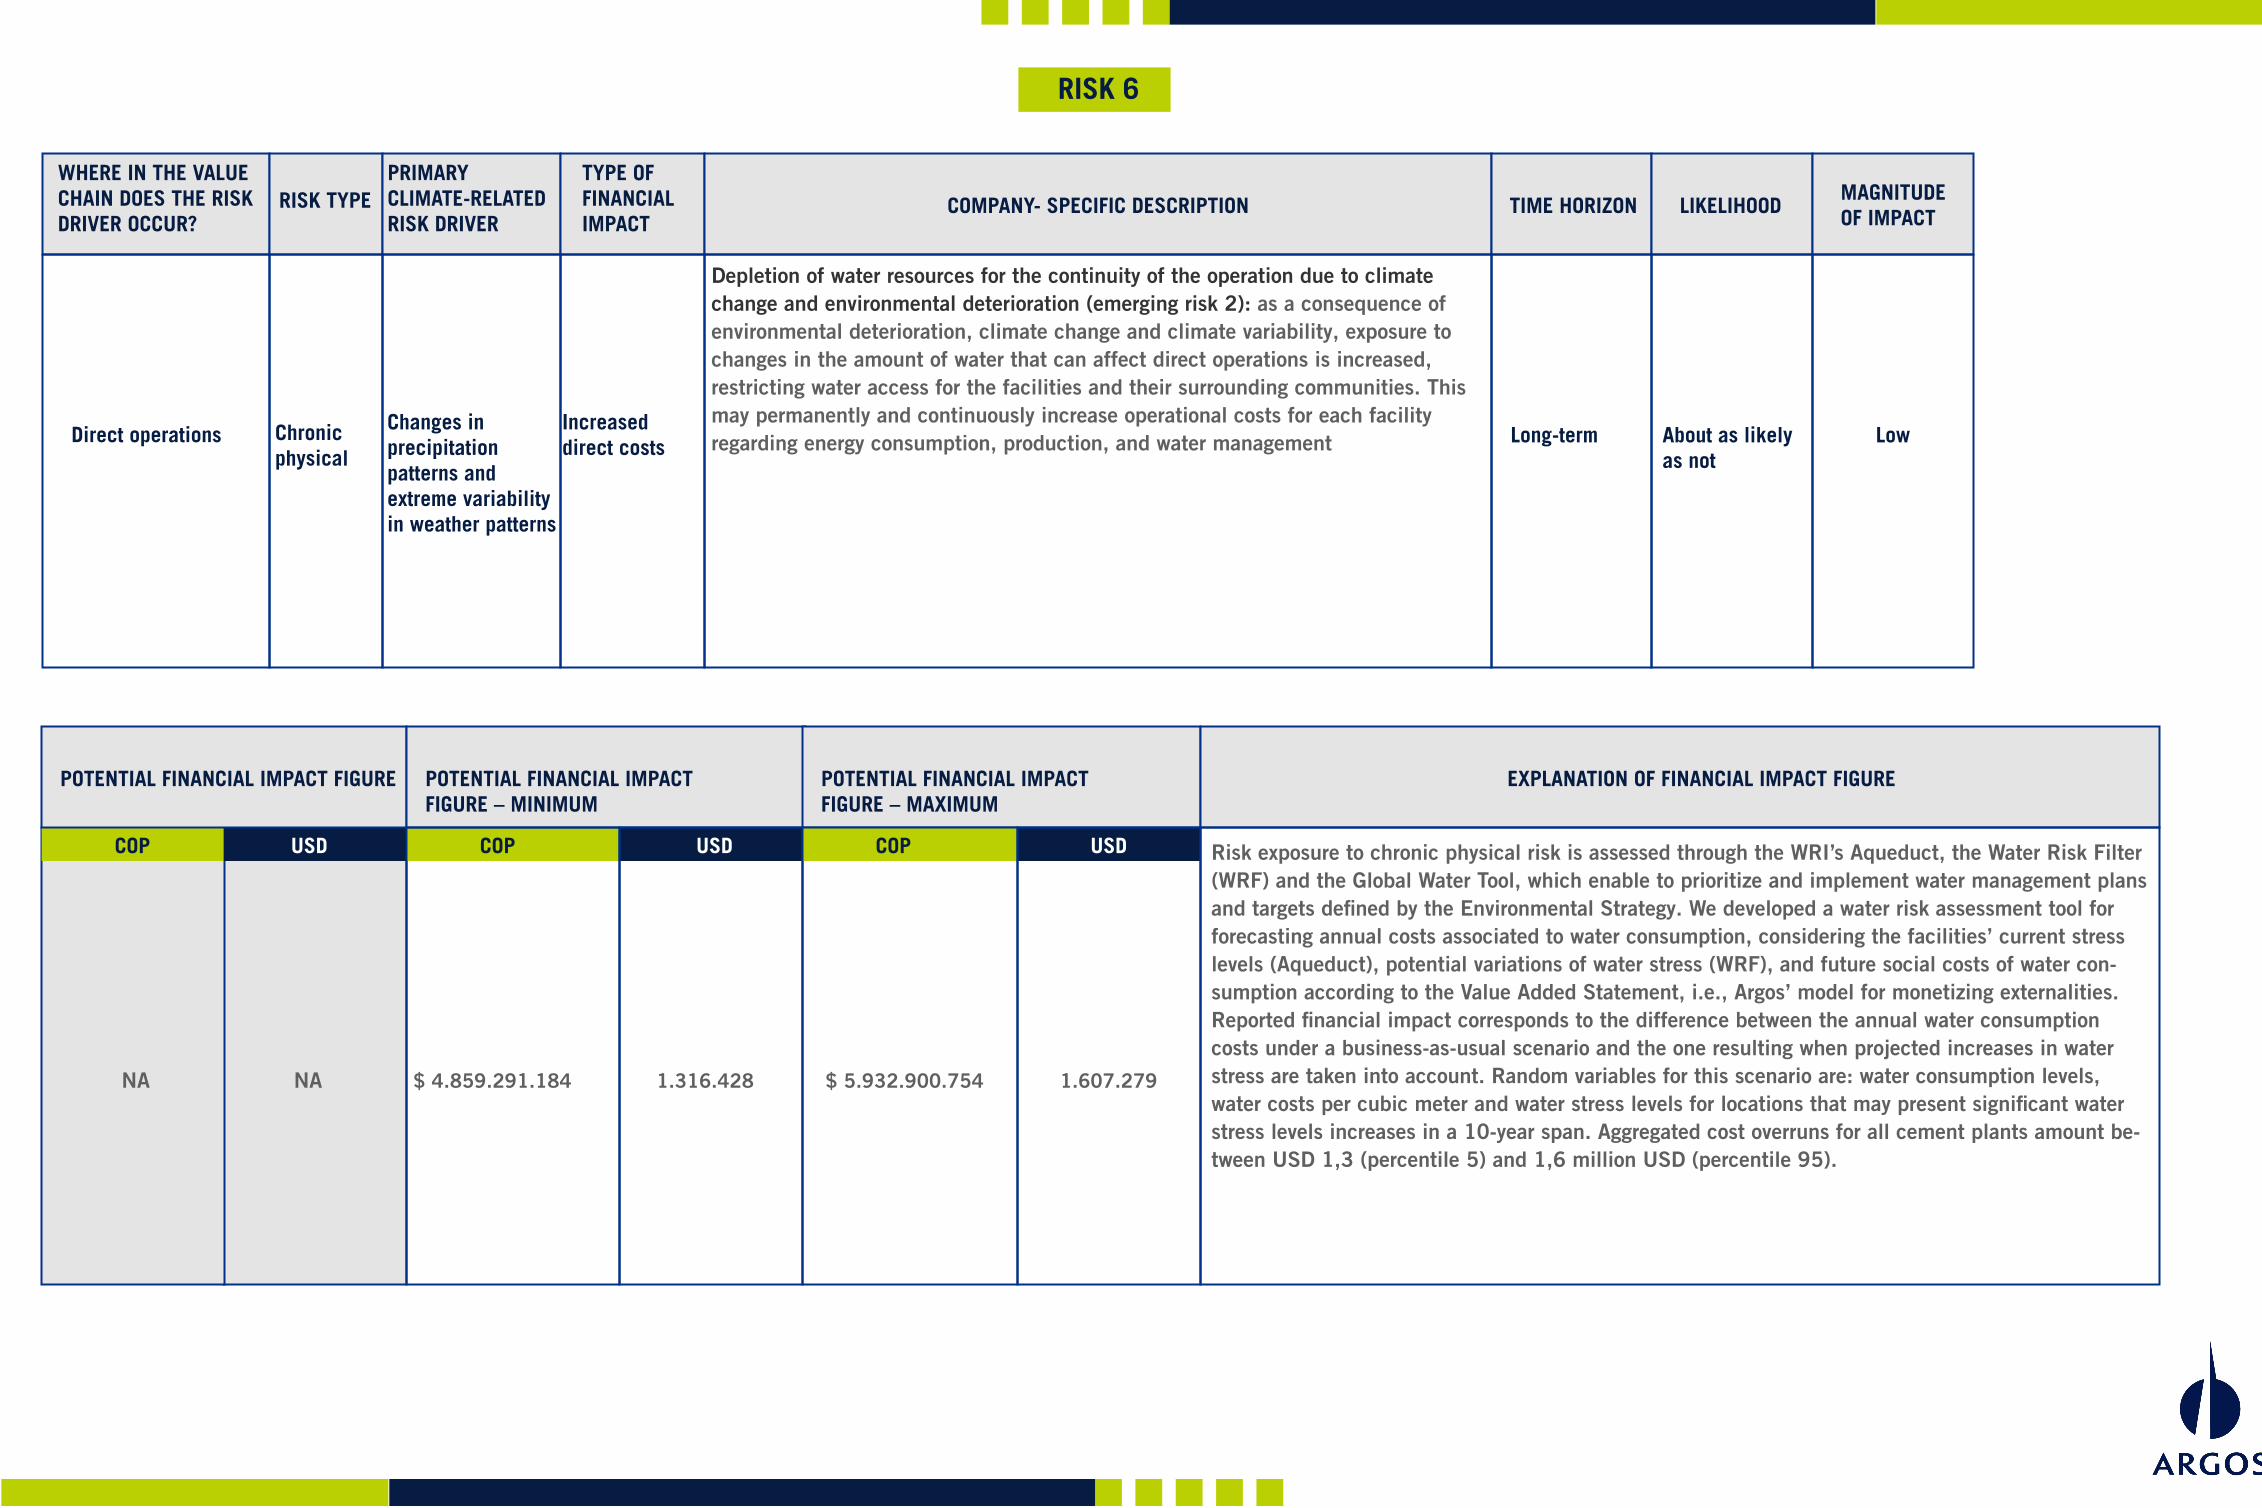
RISK 6
Depletion of water resources for the continuity of the operation due to climate change and environmental deterioration (emerging risk 2): as a consequence of environmental deterioration, climate change and climate variability, exposure to changes in the amount of water that can affect direct operations is increased, restricting water access for the facilities and their surrounding communities. This may permanently and continuously increase operational costs for each facility regarding energy consumption, production, and water management
Risk exposure to chronic physical risk is assessed through the WRI’s Aqueduct, the Water Risk Filter (WRF) and the Global Water Tool, which enable to prioritize and implement water management plans and targets defined by the Environmental Strategy. We developed a water risk assessment tool for forecasting annual costs associated to water consumption, considering the facilities’ current stress levels (Aqueduct), potential variations of water stress (WRF), and future social costs of water con-sumption according to the Value Added Statement, i.e., Argos’ model for monetizing externalities. Reported financial impact corresponds to the difference between the annual water consumption costs under a business-as-usual scenario and the one resulting when projected increases in water stress are taken into account. Random variables for this scenario are: water consumption levels, water costs per cubic meter and water stress levels for locations that may present significant water stress levels increases in a 10-year span. Aggregated cost overruns for all cement plants amount be-tween USD 1,3 (percentile 5) and 1,6 million USD (percentile 95).
Direct operations Chronic physical
Changes inprecipitation patterns and extreme variabilityin weather patterns
Increased direct costs Long-term About as likely
as notLow
POTENTIAL FINANCIAL IMPACT FIGURE
USDCOP
POTENTIAL FINANCIAL IMPACT FIGURE – MINIMUM
USDCOP
POTENTIAL FINANCIAL IMPACT FIGURE – MAXIMUM
EXPLANATION OF FINANCIAL IMPACT FIGURE
USDCOP
$ 4.859.291.184 1.316.428 $ 5.932.900.754 1.607.279
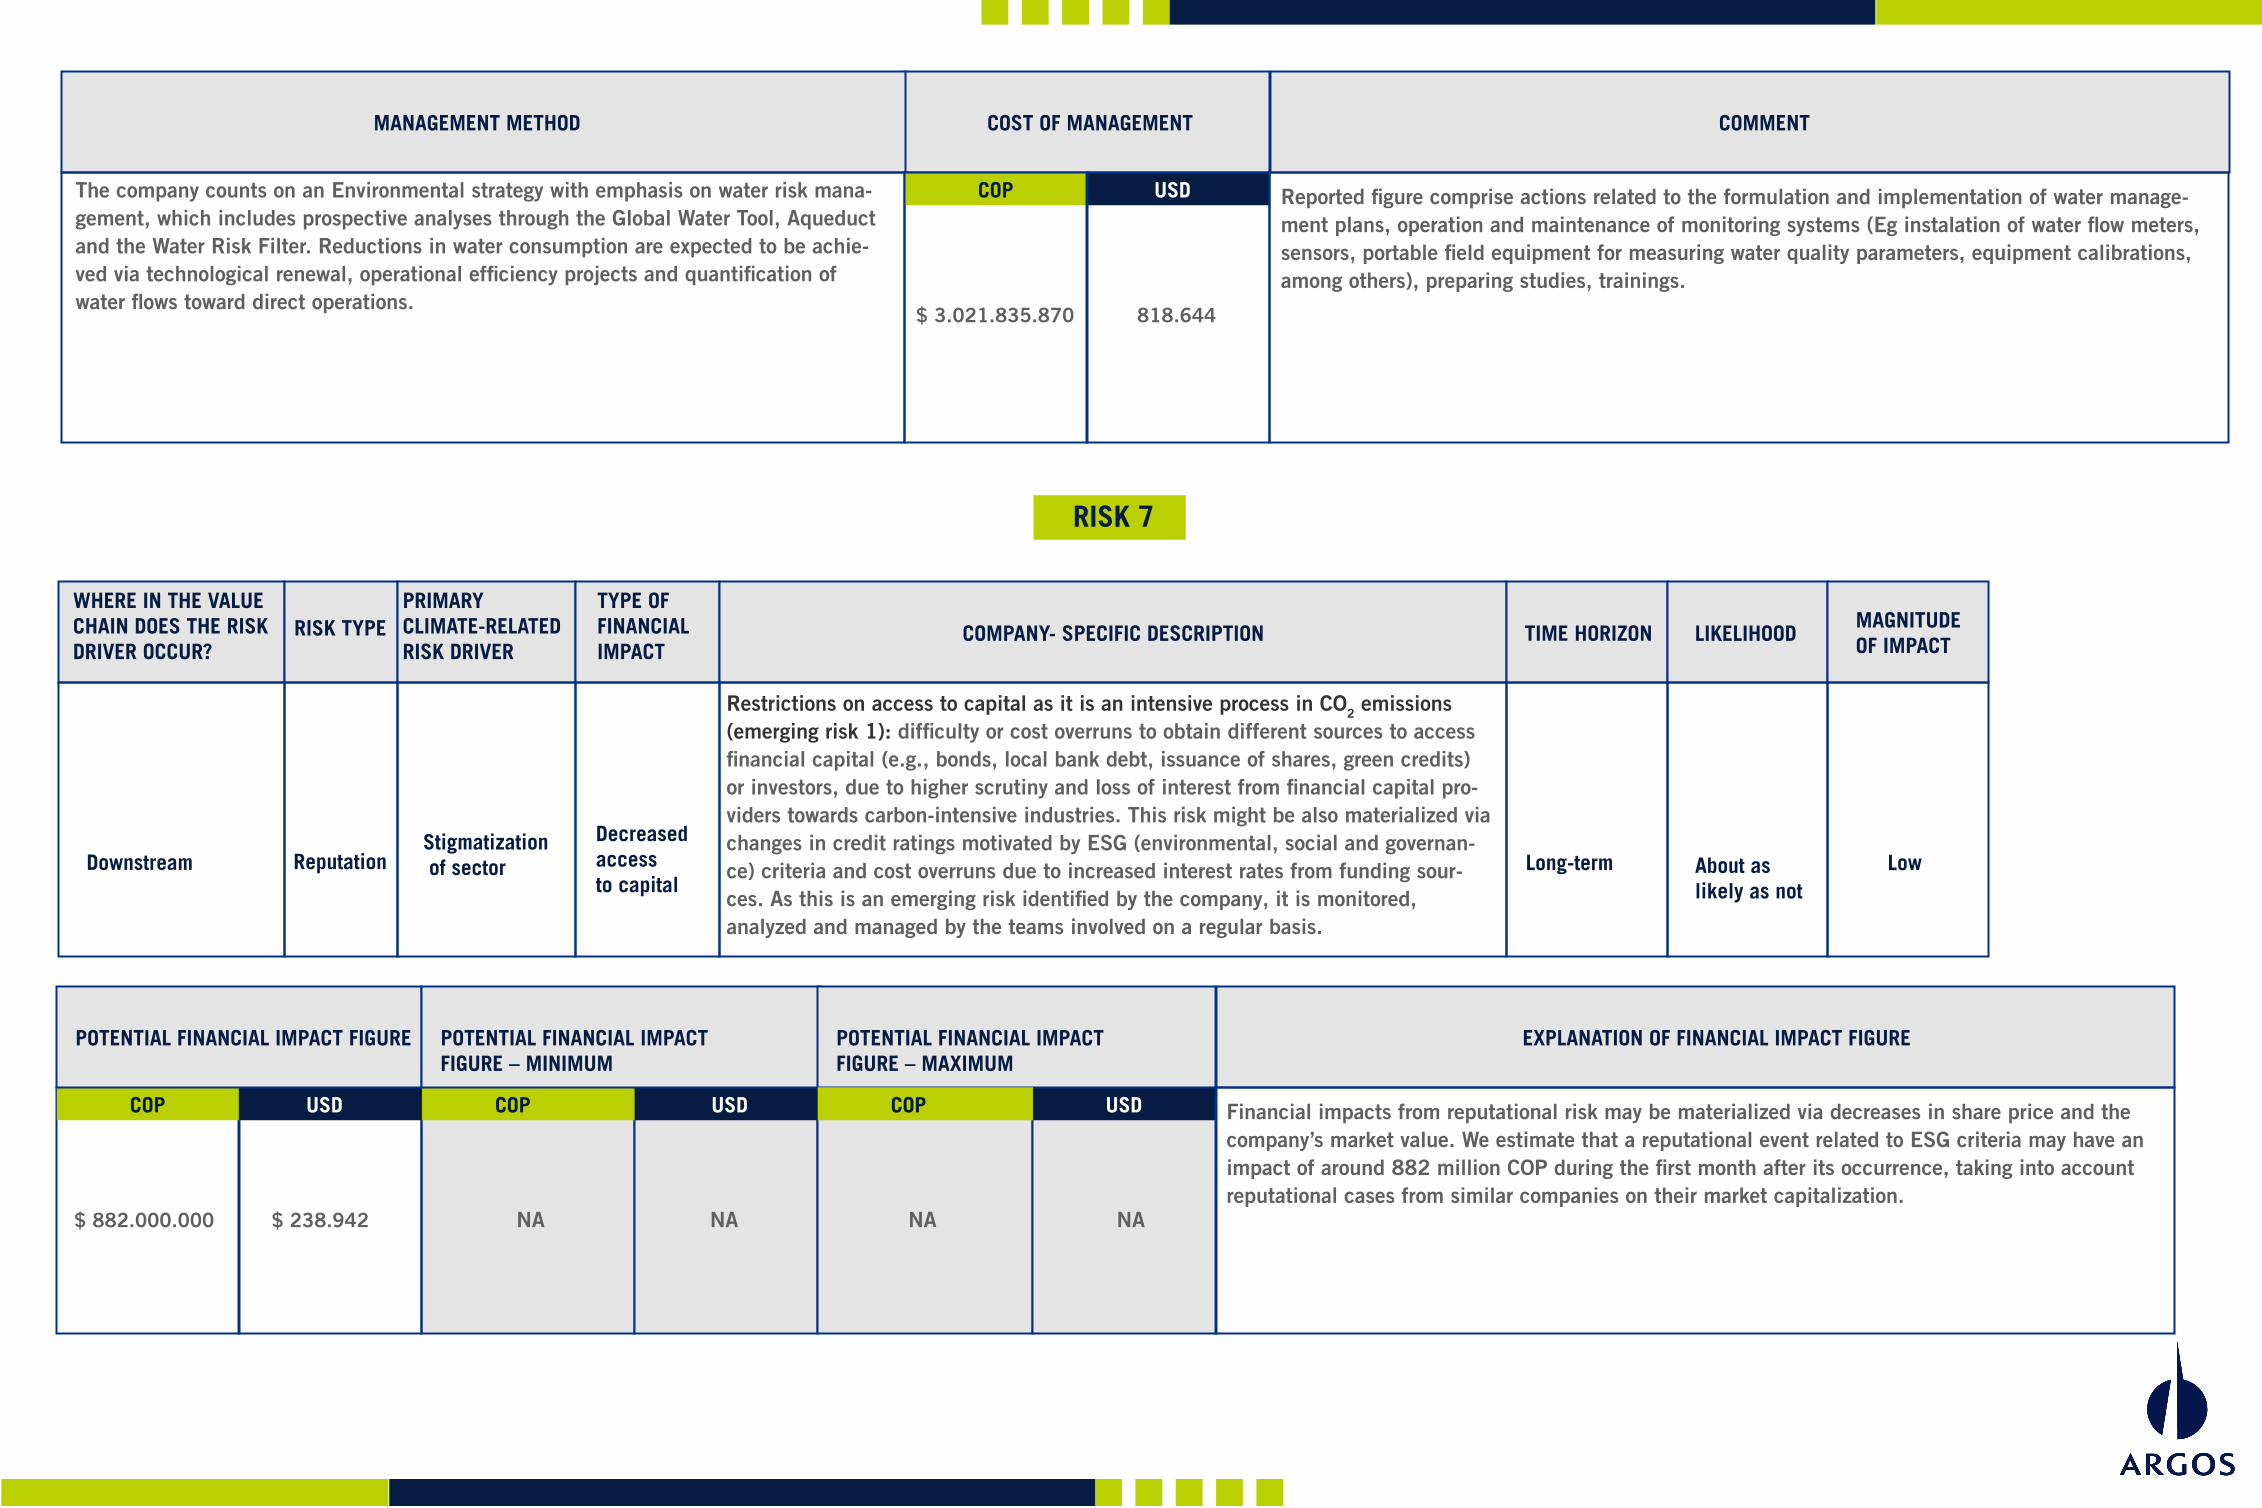
The company counts on an Environmental strategy with emphasis on water risk mana-gement, which includes prospective analyses through the Global Water Tool, Aqueduct and the Water Risk Filter. Reductions in water consumption are expected to be achie-ved via technological renewal, operational efficiency projects and quantification of water flows toward direct operations.
COST OF MANAGEMENTMANAGEMENT METHOD
Reported figure comprise actions related to the formulation and implementation of water manage-ment plans, operation and maintenance of monitoring systems (Eg instalation of water flow meters, sensors, portable field equipment for measuring water quality parameters, equipment calibrations, among others), preparing studies, trainings.
COMMENT
USDCOP
$ 3.021.835.870 818.644
WHERE IN THE VALUECHAIN DOES THE RISKDRIVER OCCUR?
PRIMARY CLIMATE-RELATED RISK DRIVER
TYPE OF FINANCIALIMPACT
RISK TYPE TIME HORIZON LIKELIHOODMAGNITUDE OF IMPACT COMPANY- SPECIFIC DESCRIPTION
RISK 7
Restrictions on access to capital as it is an intensive process in CO2 emissions (emerging risk 1): difficulty or cost overruns to obtain different sources to access financial capital (e.g., bonds, local bank debt, issuance of shares, green credits) or investors, due to higher scrutiny and loss of interest from financial capital pro-viders towards carbon-intensive industries. This risk might be also materialized via changes in credit ratings motivated by ESG (environmental, social and governan-ce) criteria and cost overruns due to increased interest rates from funding sour-ces. As this is an emerging risk identified by the company, it is monitored, analyzed and managed by the teams involved on a regular basis.
Downstream ReputationStigmatization of sector
Decreased access to capital
Long-term About aslikely as not
Low
NA NA NA NA
Financial impacts from reputational risk may be materialized via decreases in share price and the company’s market value. We estimate that a reputational event related to ESG criteria may have an impact of around 882 million COP during the first month after its occurrence, taking into account reputational cases from similar companies on their market capitalization.
POTENTIAL FINANCIAL IMPACT FIGURE
USDCOP
POTENTIAL FINANCIAL IMPACT FIGURE – MINIMUM
USDCOP
POTENTIAL FINANCIAL IMPACT FIGURE – MAXIMUM
EXPLANATION OF FINANCIAL IMPACT FIGURE
USDCOP
$ 238.942 $ 882.000.000
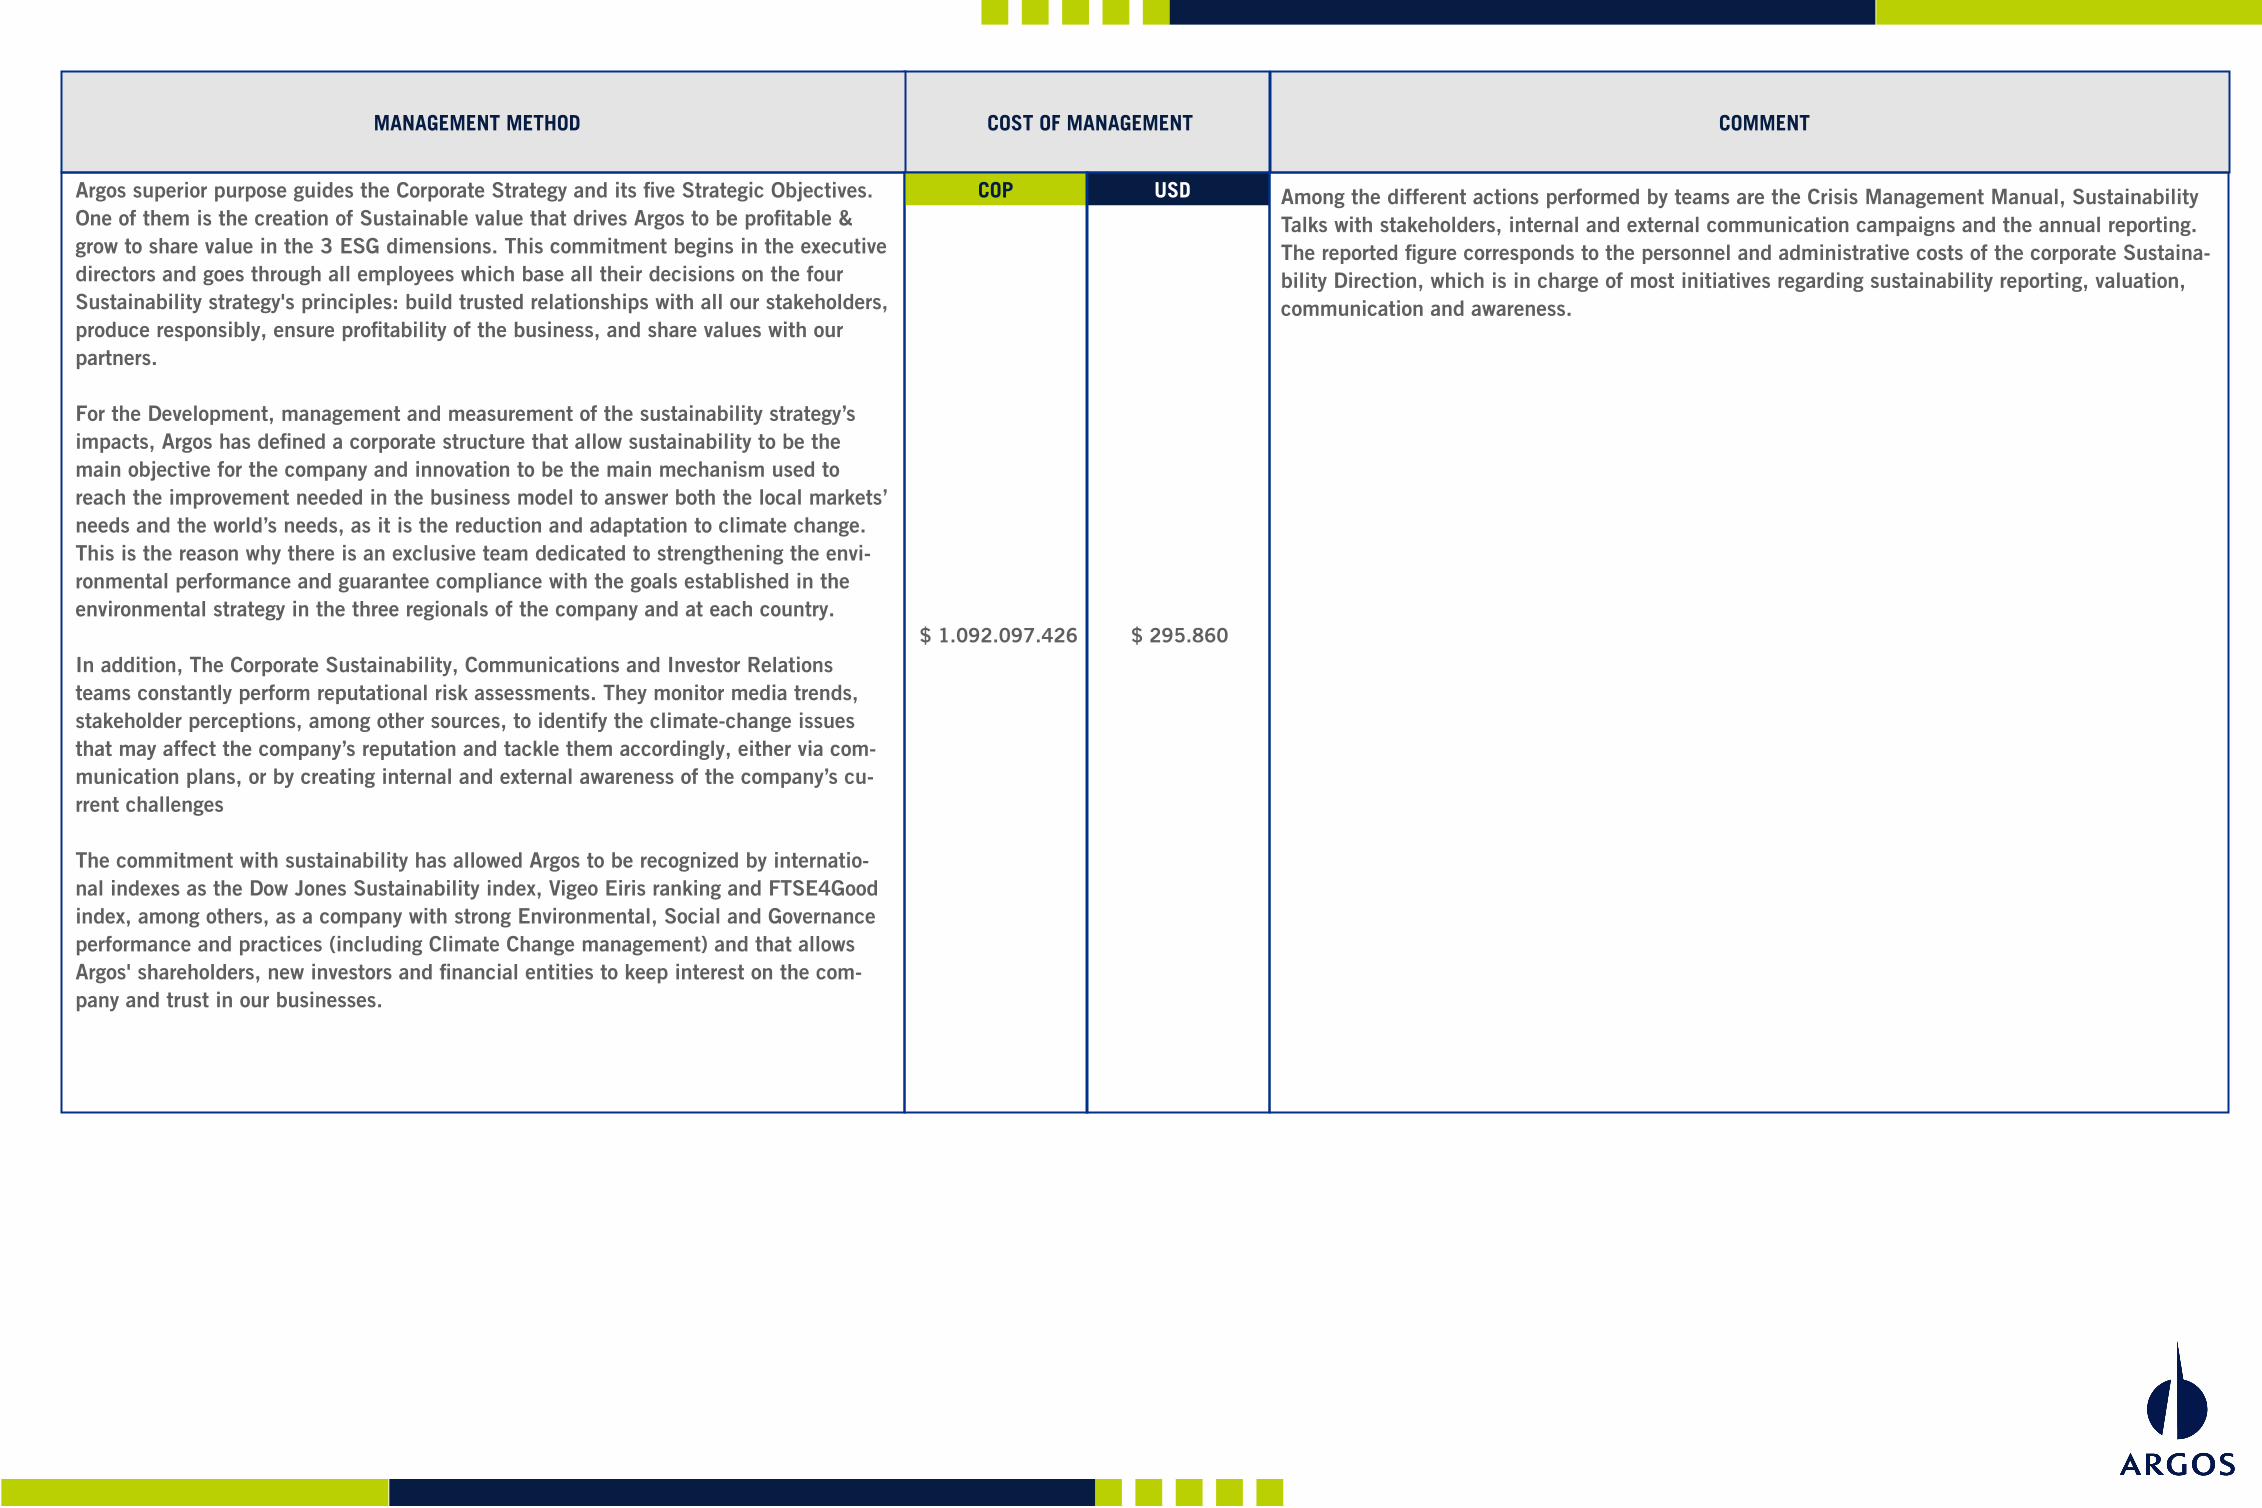
Argos superior purpose guides the Corporate Strategy and its five Strategic Objectives. One of them is the creation of Sustainable value that drives Argos to be profitable & grow to share value in the 3 ESG dimensions. This commitment begins in the executive directors and goes through all employees which base all their decisions on the four Sustainability strategy's principles: build trusted relationships with all our stakeholders, produce responsibly, ensure profitability of the business, and share values with our partners.
For the Development, management and measurement of the sustainability strategy’s impacts, Argos has defined a corporate structure that allow sustainability to be the main objective for the company and innovation to be the main mechanism used to reach the improvement needed in the business model to answer both the local markets’ needs and the world’s needs, as it is the reduction and adaptation to climate change. This is the reason why there is an exclusive team dedicated to strengthening the envi-ronmental performance and guarantee compliance with the goals established in the environmental strategy in the three regionals of the company and at each country.
In addition, The Corporate Sustainability, Communications and Investor Relations teams constantly perform reputational risk assessments. They monitor media trends, stakeholder perceptions, among other sources, to identify the climate-change issues that may affect the company’s reputation and tackle them accordingly, either via com-munication plans, or by creating internal and external awareness of the company’s cu-rrent challenges
The commitment with sustainability has allowed Argos to be recognized by internatio-nal indexes as the Dow Jones Sustainability index, Vigeo Eiris ranking and FTSE4Good index, among others, as a company with strong Environmental, Social and Governance performance and practices (including Climate Change management) and that allows Argos' shareholders, new investors and financial entities to keep interest on the com-pany and trust in our businesses.
COST OF MANAGEMENTMANAGEMENT METHOD
Among the different actions performed by teams are the Crisis Management Manual, Sustainability Talks with stakeholders, internal and external communication campaigns and the annual reporting. The reported figure corresponds to the personnel and administrative costs of the corporate Sustaina-bility Direction, which is in charge of most initiatives regarding sustainability reporting, valuation, communication and awareness.
COMMENT
USDCOP
$ 1.092.097.426
$ 295.860

NA NA NA NA
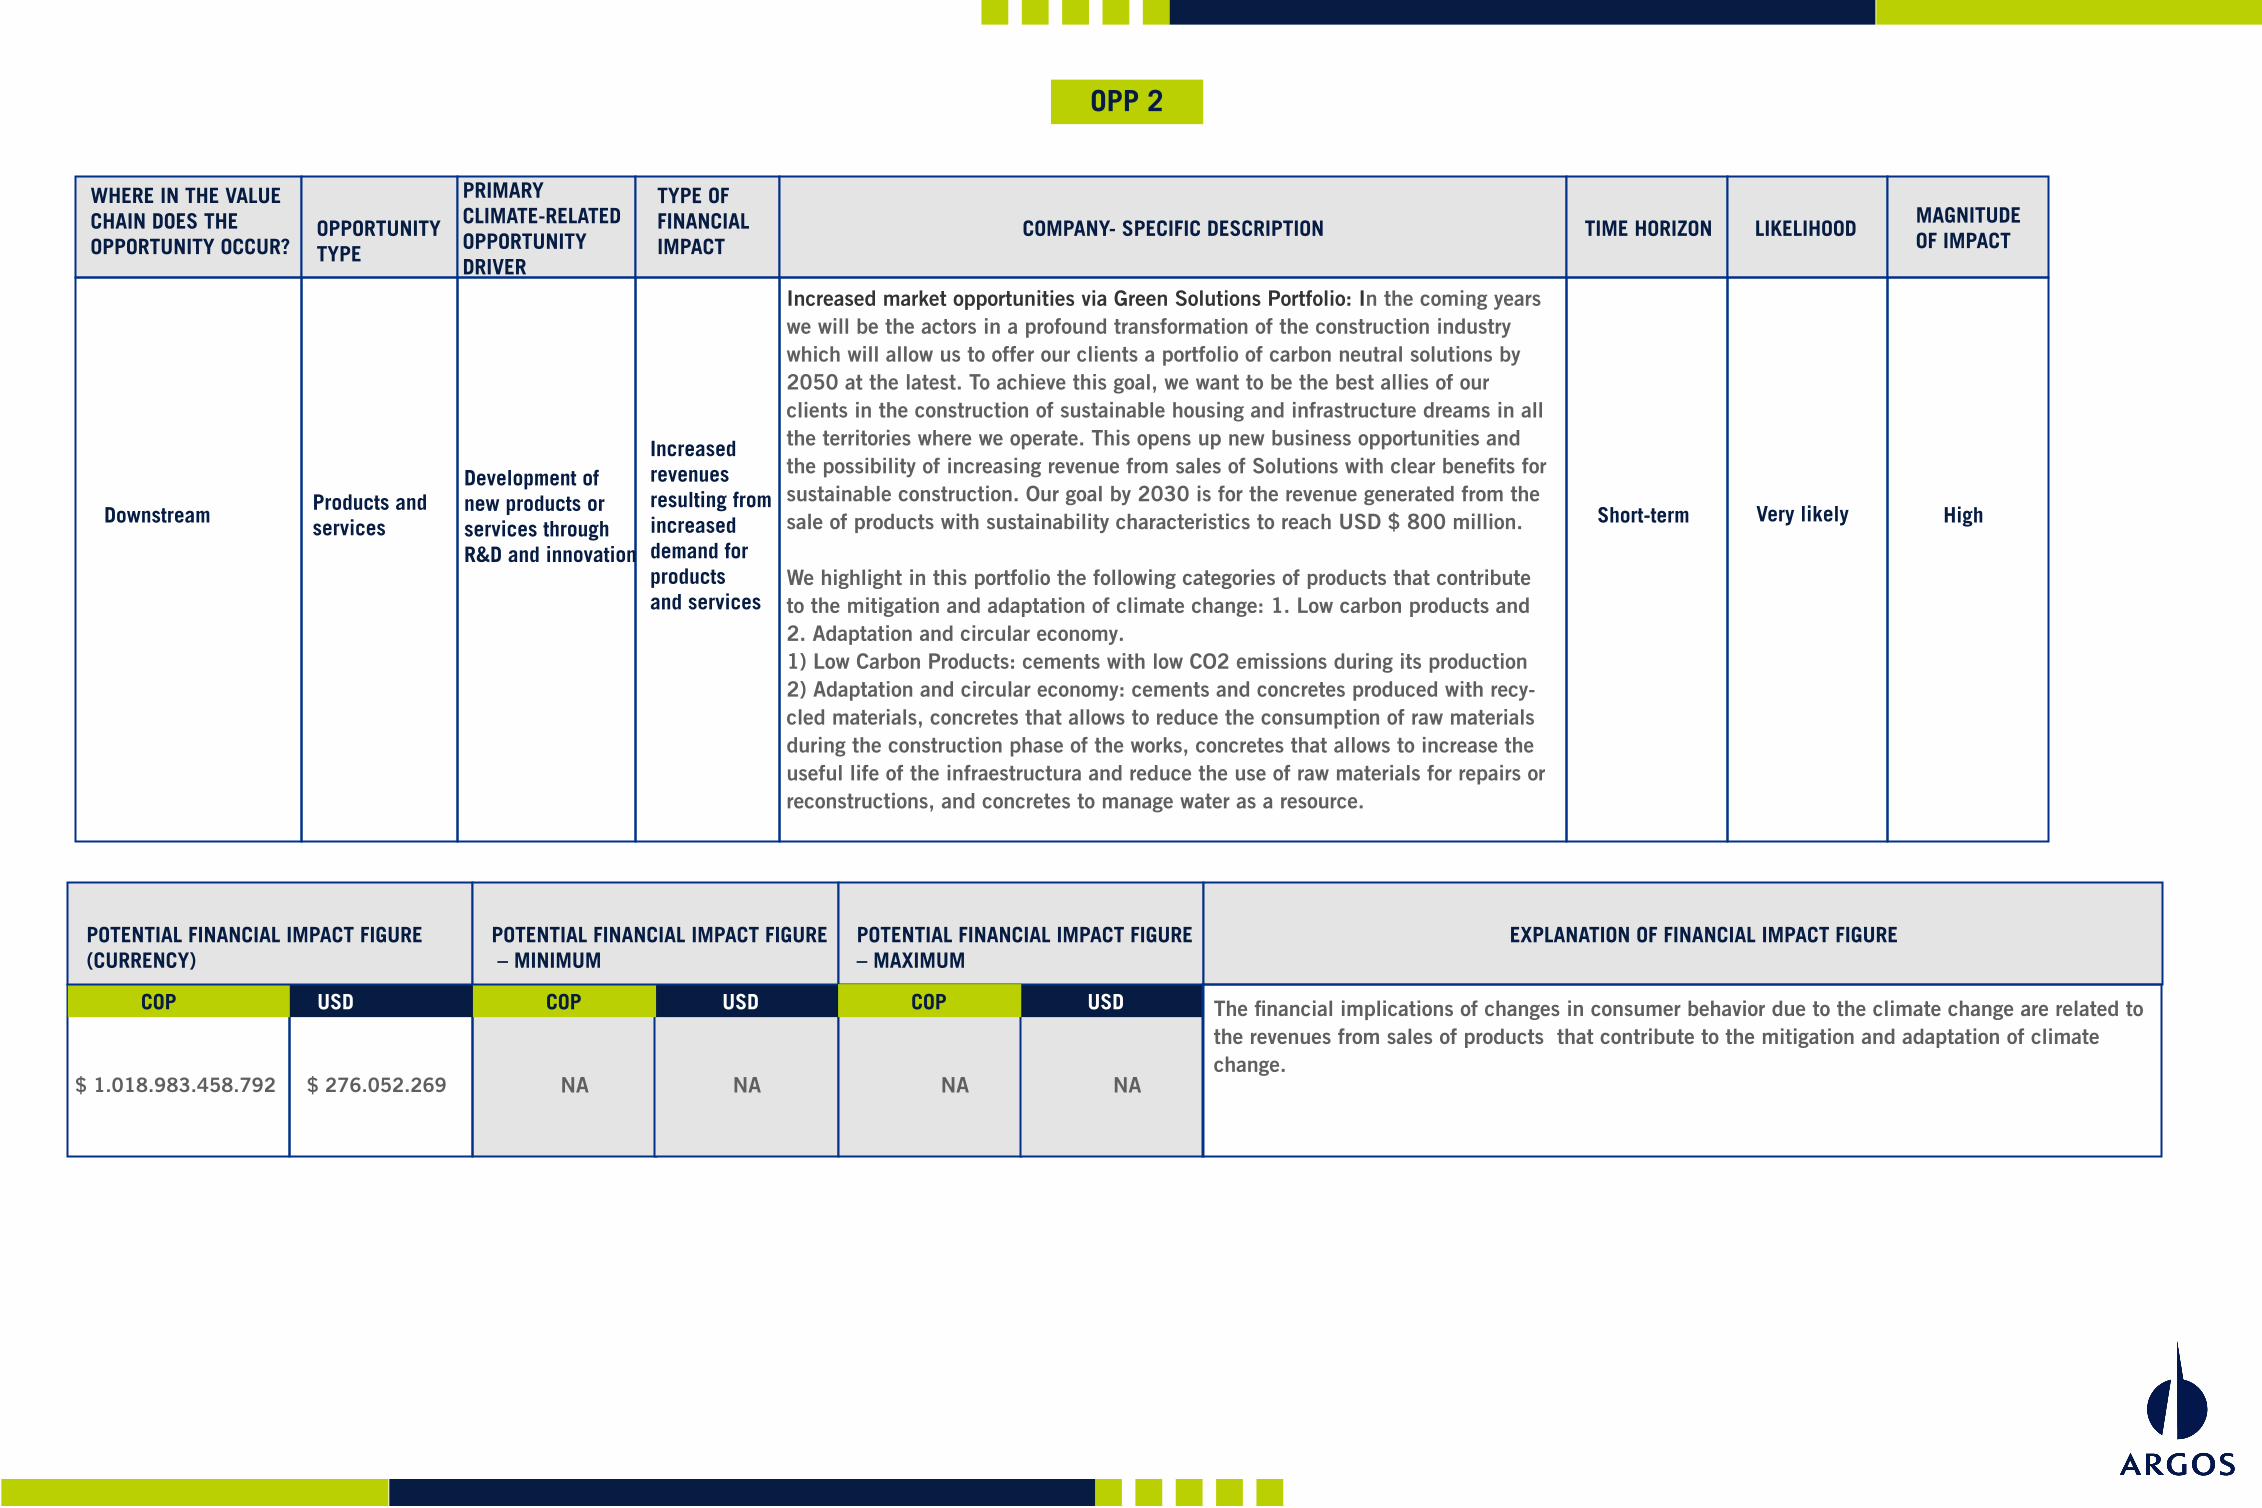
Opportunities from changes in regulation
WHERE IN THE VALUE CHAIN DOES THEOPPORTUNITY OCCUR?
PRIMARY CLIMATE-RELATED OPPORTUNITY DRIVER
TYPE OF FINANCIALIMPACT
OPPORTUNITY TYPE
TIME HORIZON LIKELIHOODMAGNITUDE OF IMPACT COMPANY- SPECIFIC DESCRIPTION
OPP 1
Lower operational costs through more efficient processes: it is possible to have a positive impact on profits through operational efficiency directed to reduce scope 1 and scope 2 CO2 emissions. This can be achieved through the development of projects complying to Argos’ climate strategy drivers, e.g., optimize thermal and electric energy consumption, use of alternative fuels and reduce clinker cement ratio.
Reported figures correspond to expected annual savings by implementing energy efficiencies (ther-mal and electric) and projects related to substituting conventional by alternative fuels. These savings will be generated by achieving the 2025 energy policy goals and the alternative fuels roadmap, e.g., decreasing heat consumption by 10 percent and electricity consumption by 15 percent, plus to substitute conventional with alternative fuels by 18%.
Direct operationsResource efficiency
Use of moreefficient productionand distribution processes
Reduced direct costs
Short-termVirtually certain
Medium
POTENTIAL FINANCIAL IMPACT FIGURE(CURRENCY)
USDCOP
POTENTIAL FINANCIAL IMPACT FIGURE – MINIMUM
USDCOP
POTENTIAL FINANCIAL IMPACT FIGURE – MAXIMUM
EXPLANATION OF FINANCIAL IMPACT FIGURE
USDCOP
Through its Energy Policy and the alternative fuels roadmap, Argos has established specific targets to reduce the consumption of heat and electricity, and to increase the use of alternative fuels, in order to drive the company’s competitiveness and minimize risks. It is expected that by 2025 the company will reduce its heat consumption by 10% and electricity consumption by 15%, taking 2012 as the base year. Likewise, it is expected that by 2025 the company will achieve a rate of 18% in alternative fuels use.
COST TO REALIZE OPPORTUNITYSTRATEGY TO REALIZE OPPORTUNITY
The management cost of this opportunity is budgeted every year and it depends on the ini-tiatives and projects to develop. In addition, Argos counts on teams in each region in charge of managing issues related to each of the identified opportunities, e.g., R&D, energy, environmental and alternative resources management, among others
COMMENT
USDCOP
$ 25.937.359.000
$ 15.100.000 $ 49.576.471.000
$ 7.900.000
WHERE IN THE VALUE CHAIN DOES THEOPPORTUNITY OCCUR?
PRIMARY CLIMATE-RELATED OPPORTUNITY DRIVER
TYPE OF FINANCIALIMPACT
OPPORTUNITY TYPE
TIME HORIZON LIKELIHOODMAGNITUDE OF IMPACT COMPANY- SPECIFIC DESCRIPTION
OPP 2
Increased market opportunities via Green Solutions Portfolio: In the coming years we will be the actors in a profound transformation of the construction industry which will allow us to offer our clients a portfolio of carbon neutral solutions by 2050 at the latest. To achieve this goal, we want to be the best allies of our clients in the construction of sustainable housing and infrastructure dreams in all the territories where we operate. This opens up new business opportunities and the possibility of increasing revenue from sales of Solutions with clear benefits for sustainable construction. Our goal by 2030 is for the revenue generated from the sale of products with sustainability characteristics to reach USD $ 800 million.
We highlight in this portfolio the following categories of products that contribute to the mitigation and adaptation of climate change: 1. Low carbon products and 2. Adaptation and circular economy.1) Low Carbon Products: cements with low CO2 emissions during its production2) Adaptation and circular economy: cements and concretes produced with recy-cled materials, concretes that allows to reduce the consumption of raw materials during the construction phase of the works, concretes that allows to increase the useful life of the infraestructura and reduce the use of raw materials for repairs or reconstructions, and concretes to manage water as a resource.
Downstream Products and services
Development ofnew products or services through R&D and innovation
Increased revenues resulting fromincreased demand forproducts and services
Short-term Very likely High
NA NA NA NA
The financial implications of changes in consumer behavior due to the climate change are related to the revenues from sales of products that contribute to the mitigation and adaptation of climate change.
POTENTIAL FINANCIAL IMPACT FIGURE(CURRENCY)
USDCOP
POTENTIAL FINANCIAL IMPACT FIGURE – MINIMUM
USDCOP
POTENTIAL FINANCIAL IMPACT FIGURE – MAXIMUM
EXPLANATION OF FINANCIAL IMPACT FIGURE
USDCOP
$ 1.018.983.458.792 $ 276.052.269

Through the Sustainable Construction line of work of Argos’ Environmental Strategy, we leverage life-cycle thinking and work to be agents of change and to influence other stakeholders so that this movement grows. Through innovation, we develop specialized cements and concretes, to solve constructive challenges with extraordinary solutions. We work with customers to bring our best proposal to each of their projects and accom-pany the appropriate solution to solve their needs.
Argos has identified smart characteristics in its products, with the potential to generate significant positive environmental impacts and as an adaptation to climate change de-veloping them in every region it is located, these include strategies as: market monito-ring, benchmarking with other companies in the industry, and market intelligence to identify business opportunities for Argos products. The main approach is to improve the capacity to satisfy new market needs (products and services) related to climate change and to develop them in every region where Argos is located. This, in addition to com-municating how the product portfolio contributes to sustainable construction certifica-tion systems, such as LEED®, has opened up new market opportunities.
COST TO REALIZE OPPORTUNITYSTRATEGY TO REALIZE OPPORTUNITY
Reported annual costs correspond to R&D projects for developing products with sustainabi-lity characteristics, such as: resilience, low-carbon products, among others.
Our Research and Development (R&D) team develops projects to reduce CO2 emissions at various points in the value chain. Initiatives range from identifying new raw materials to launching new products, specifically with sustainability characteristics (i.e. products with resilience characteristics). Teamwork across a variety of company areas is essential for sca-ling the laboratory’s developments.
COMMENT
USDCOP
$ 660.261.897
$ 178.871