Embed Size (px)
Citation preview

Explaining job mobility: an integrated analysis of thedeterminants of promotions and �rm separations.
Priscila FerreiraInstitute for Social and Economic Research (ISER), University of Essex, UK
and University of Minho, Portugal
Abstract
This study analyses the determinants of job mobility � both within and between �rms �using a Portugese matched employer-employee data set covering the period 1986-2000. Themain issue addressed is whether the determinants of transitions within �rms and between �rmsdi¤er. We might expect them to do so because promotions depend on employers�decisions, whilemovements between �rms may also depend on decisions by workers. However most previousresearch has focused on one transition type, but not both. One distinctive feature of the data isthat promotions and their dates are reported by the �rm and not by the worker. This reducesthe degree of ambiguity on how promotions are de�ned. Estimates from hazard regressionmodels allowing for �rm-level shared frailty indicate that, depending on the de�nition adoptedwomen may have greater or lower chances of promotion. However, concerning turnover thetime between transitions is longer for women than for men. Compared to full-time workers,part-timers have lower promotion rates but faster inter-�rm mobility rates. Workers who havebeen promoted or moved �rms before are more likely to do so again. While the size of the �rmis a relevant determinant of promotion it is not so for separations. The rates of both events arehigher in �rms with positive growth in terms of number of employees.
Keywords: career paths, promotions, turnover, matched panel data, frailtyJEL Classi�cation: J41, J63
1 Introduction
Seldom is the worker�job match a fairy tale ending with the words and they lived happily ever after.
Rational choice and optimization behaviours determine the decisions of employers and employees
driving the career paths, and mobility of individuals either within one �rm or between �rms. This
study will focus on the determinants of transitions in the labour market and adds to the existing
literature in three distinct ways. First, although promotions and job separations are both part of
job histories they are not often studied jointly. In this study these events will be analyzed in a
competing risks context which allows a comparison of the determinants of di¤erent types of job
1

mobility. Second, in spite of the fact that mobility decisions are in�uenced by both sides of the
market � workers and �rms � and that promotions depend on the employers decision, very rarely
is the �rm taken into consideration. This issue will be addressed by introducing in the model
observable factors of the �rm as well as shared frailty at the �rm level. Moreover, the �rm reports
the date when employees are promoted which as well as providing a clearer de�nition of promotion
may also undisclose promotion policies of the �rm. Third, the information used in this study is
taken from a longitudinal matched employer-employee dataset covering the entire private sector
of the Portuguese economy. Some advantages derive from this fact, such as less issues related
to sampling and follow-up process of workers and �rms; availability of data on both sides of the
market; and the consequent possibility of drawing a set of conclusions applicable to the entire
economy.
Analysis of promotions within �rms has been given some attention in the empirical literature
in terms of the characteristics of promoted workers (Wise 1975, McCue 1996, Pergamit and Veum
1999, Francesconi 2001), the evolution of promotion chances with time (Rosenbaum 1979), di¤er-
ences in promotions probabilities between gender (Lazear and Rosen 1990, Jones and Makepeace
1996, Booth et al. 2003), the importance of performance or/and seniority in promotions decisions
(Abraham and Medo¤ 1985, Bell and Freeman 2001), or the impact of promotions on wages (Mc-
Cue 1996, Pergamit and Veum 1999, Francesconi 2001). Also, some authors model the impact of
promotion on performance and check for the possible occurrence of the Peter principle (Fairburn
and Malcomson 2001, Lazear 2004). The main �ndings in the literature are not consistent for
gender which can have a positive, negative or insigni�cant impact on promotion. Seniority and
education appear to be positively associated with promotion. However, some results suggest that
more educated workers should attain promotion in a short period of time, not being promoted
otherwise. Working full-time, having been promoted at least once, and belonging to large �rms is
expected to increase the probability of promotion. Promotion rates were also found to positively
vary with �rm growth (as measured by the number of employees). Consequences of promotion are
usually measured in terms of wage growth which is expected to be positive, though the magnitude
2
of the increase varies between studies. Another possible outcome of promotion to a di¤erent job is
a loss in terms of performance, that is, workers tend to show lower ability after being promototed.
However, given that demotions are usually rare this outcome is argued not to be associated with
an incorrect promotion decision.
Among these studies the de�nition of promotion varies. Some identify a promotion by observing
its impact. For example, workers who have changed job within the �rm are asked if they were
promoted (McCue 1996, Francesconi 2001, Booth et al. 2003). In others a promotion is self-
reported by the worker (Pergamit and Veum 1999). In any case, a promotion is identi�ed by the
worker. Also, sometimes promotions are identi�ed from changes observed in the data. For example,
observed changes in occupations or levels within the hierarchy (Rosenbaum 1979, Sicherman and
Galor 1990, Jones and Makepeace 1996). However, a promotion represents intra�rm mobility and
is a decision made by the employer. In addition to only having the workers�perception of events,
in several studies there is little information collected about the �rm.
In contrast to intra�rm mobility, inter�rm mobility can be directly determined by the worker.
Why workers move across �rms, the consequences of such movements and comparisons with workers
who remain in the �rm is also an important research topic. Some studies try to identify the
characteristics of workers who move between �rms (Booth et al. 1999). Farber (1994) concludes
that time-aggregation a¤ects the shape of the hazard which is not monotonically decreasing, and
�nds that heterogeneity and state dependence are important determinants of �rm separations.
Topel and Ward (1992) study the determinants of turnover, and the wage growth associated with
this kind of job mobility. The main conclusion is that wages are strong determinants of changes of
�rm, but they are also determined by the process of search and mobility.
Analysis focussing simultaneously on the determinants of promotions and changes of �rm are
less common. Recognizing that job transitions, either de�ned as a change in occupation within �rm
or as changes of �rms, are a part of workers�career path Sicherman and Galor (1990) developed
a theory of career mobility which predicts that schooling, ability and job experience determine
promotions, and that the optimum spell length to quit a �rm is shorter for individuals who were
3

not promoted than for individuals that have received a promotion. Bishop (1990) speci�cally
adresses the importance of performance in the occurrence of both events, and concludes that high
produtivity decreases quit rates and increases the likelihood of promotion. If training costs are
supported by the �rm, additional hours of training reduces the probability of being �red, has no
impact on the probability of quitting the �rm, and increases the probability of being promoted. The
size of the �rm is found to be positively correlated with both quit rates and promotions. Booth and
Francesconi (2000) study gender similarities and di¤erences in the determinants of mobility (quits,
layo¤s, promotion) in the UK. While Bernhardt and Scoones (1993) and Scoones and Bernhardt
(1998) model the relationship between the acquisition of human capital and preemptive wage o¤ers
with promotion and turnover.
When analysing job transitions in the labour market it has not been common to use matched
employer-employee data. Most previous studies are based on information of speci�c �rms, hence
focussing on internal labour markets (Wise 1975, Rosenbaum 1979, Abraham and Medo¤ 1985,
Jones and Makepeace 1996) which has the advantage of allowing for a clearer de�nition of pro-
motion, but the disadvantage of not being representative of the labour market as a whole. Some
others rest upon longitudinal data on individuals (Topel and Ward 1992, Farber 1994, McCue 1996,
Francesconi 2001, Booth et al. 2003).
The majority of previous research focusses on job mobility for the UK and US, the case of
Portugal has not yet been studied. Lima and Pereira (2001) estimate the impact of promotion
on workers� wages in large �rms in Portugal, and Lima and Centeno (2002) relate promotion
probabilities of top executives with the degree of openness of the �rm (measured by the fraction of
hiring in the external labor market). Besides addressing job mobility in Portugal this paper intends
to �ll in the existing gaps in the literature on career paths of employees by considering both types
of job mobility in a competing risks framework and by explicitly modelling the in�uence of the �rm
in such process.
The main empirical �ndings of this study are the following. Observed and unobserved charac-
teristics of �rms are important determinants of job mobility. This converges both in terms of the
4

signi�cance of all observed characteristics of �rms, and in terms of models performing better when
introducing �rm-speci�c frailty than when considering worker-speci�c frailties. It is also found that
the impact of gender is highly dependent on the de�nition of promotion adopted. Compared to
men, women take longer time to change �rms and have greater hazards of receiving automatic
promotions, but smaller hazard to have merit promotions. Job mobility varies positively with
schooling. Survival time to promotion is greater the smaller the �rm is, though the size of �rms
seems not to be a strong determinant of inter�rm mobility. The hazard of job mobility is greater
if the growth of the �rm is positive, however the growth of the �rm has a stronger impact on the
turnover rate.
The rest of the article is organized as follows. Section 2 presents the theoretical background.
Section 3 describes the data and methodology, and section 4 presents the empirical speci�cation.
Empirical results and checks of robustness are discussed in section 5. Section 6 concludes the
analysis.
2 Theoretical background
The essence of labour markets is the interaction of workers and employers which determines the
price (wage) and quantity (employment) to be o¤ered in equilibrium. The neoclassical assumption
that labour markets can be perfectly competitive yields the conclusion that workers can change
job types in response to di¤ering wage rates, and in equilibrium workers earn the value of the
marginal product of labour which is equall in every �rm. If all workers are endowed with the same
characteristics, turnover is not an issue given that �rms can easily �nd an equally skilled worker and
workers can �nd a compatible �rm. However, an important concept in labour economics is human
capital which can be broadly de�ned as a set of characteristics in which workers can invest and
increase their own productivity. On-the-job training, schooling and the acquisition of information
about the economic system (Becker 1962) are examples of activities that improve skills of individuals
and raise their future real income prospects. The human capital accumulated can be general or
speci�c to the �rm. While general human capital increases the marginal productivity of employees
5
by the same amount in every �rm, speci�c human capital increases the marginal productivity more
in the �rm where the worker is located. Investments in �rm speci�c training a¤ect the productivity
of workers and the pro�tability of �rms. Consequently, turnover becomes an important topic. As
�rms pay (at least) part of the training costs they are particularly concerned about the turnover of
employees with �rm-speci�c human capital and, recognizing that quits depend on wages, they may
o¤er these workers a higher wage that could not be easily matched by competing �rms.1 Given
the potential to increase pro�tability, to motivate workers to invest in �rm-speci�c human capital
employers may create a promotion scheme and commit to a wage structure attached to such scheme.
A promotion is then a consequence of human capital investment.
Promotions can also be interpreted in the context of tournaments (Lazear and Rosen 1981,
Rosen 1986, Bognamo 2001). A promotion is a prize that is allocated to workers who rank higher
than all other workers in a group over a given period. Because workers know that not all of them
will be promoted the probability of promotion provides incentive to exert e¤ort without the need
for any formal contract between workers and the �rm. Productivity is the determinant of success.
Winners are moved to higher positions that involve higher prestige, higher responsibility, and higher
earnings. Tournament models, however, rarely consider that external labour markets also provide
incentives for workers and �rms. Chan (1996) extends the model to include external competition
in the tournament. The possibility of recruiting from outside instead of promoting from inside may
reduce the incumbents incentive to exert e¤ort. To overcome such a possibility, �rms can increase
the probability of success of insiders resulting in the fact that, to win, external workers have to be
signi�cantly superior to the internal contestants.
If external competition is allowed, workers may quit the �rm because they �nd better external
alternative wages. Such an alternative is likely to occur if the worker searches while employed
(Burdett 1978). In search models older workers get higher wages not because they have accumulated
more human capital, but because they have received more wage o¤ers. Workers engaging in job
search are expected experience more wage growth than those who do not search either because
1�preemptive wages�as de�ned by Pergamit and Veum (1999).
6
they are o¤ered higher wages when changing �rms or due to possible bargaining within the �rm.
Furthermore, as workers in low wage jobs have potentially more gains from employed search, they
should have higher turnover rates. In the context of search models � if jobs are pure search-
goods � a separation will occur due to the arrival of information about an alternative prospective
match. Job matching models consider jobs as experience goods, i.e., it is by experiencing it that
the quality of the match is identi�ed. Turnover is a consequence of optimal reassignment caused
by the accumulation of better information as time elapses. In the case a worker-�rm pairing is a
mismatch the worker might choose unemployment. On the other hand, the better the match the
greater the investment in �rm-speci�c human capital will be and the less likely it is for the match
to end (Jovanovic 1979 a, b, 1984). Promotion may be the �rm�s optimal response after learning
about a worker�s productivity. These models predict also that job durations are correlated. On
the one hand, successive jobs start at successively higher wages, and consequently the second job
is likely to last longer than the �rst. On the other hand, workers who have quit more often in the
past are less likely to have acquired a history that generates a solid attachment to a �rm of any
type and will have regular quits (MacDonald 1988). Job shopping theory (Johnson 1978) predicts
that mobility occurs to a greater extent early in the career because workers are not aware of their
own abilities or the characteristics of the labour market. Given the uncertainty on the returns in
various jobs, workers will try a variety of jobs. Education reduces job mobility by reducing its role
in acquiring information and quit rates are expected to decline with seniority.
Therefore, a wide range of theories help explain job mobility. More than substitutes these
theories complement themselves. It is natural that evidence in this study will relate not to one
single theory of mobility but to them all in their varied but related scopes.
3 Data and methodology
Lists of personnel is a longitudinal dataset with matched information on workers and �rms. Since
1985, the survey is annually collected (in March until 1993, and in October from 1994 onwards) by
the Portuguese Ministry of Employment and the participation of �rms with registered employees
7

is compulsory. The data includes all �rms (about 200 thousand per year) and employees (about
two million per year) of the Portuguese private sector. The present analysis covers the period
running from 1986 through 2000, with 1990 excluded because the database was not built in that
year. Although the survey is still ongoing, currently the data available for analysis ends in the
year 2000. Each �rm and each worker has a unique registration number which allows them to be
traced over time in the data. All information � on both �rms and workers � is reported by the
�rm. In general, the information refers to the situation observed in the month when the survey
is collected. In some cases, namely information on dates, reported data may be retrospective but
limited to the past within that speci�c �rm. Information on workers includes, for example, gender,
age, education, level of skill, occupation, date of admission in the �rm, date of last promotion, wage
(split into some of its components) and hours of work. Firm and establishment level data include,
for example, the industry, location, number of workers, number of establishments, and legal setting.
From cross section to multivariate survival data
Before constructing the panel, some data cleaning was carried out to guarantee that only one
record per worker per �rm per year exists. The initial panel dataset contains information on
5,784,531 distinct workers corresponding to 27,577,308 observations of workers over time. The
accuracy of the information was checked by making use of three variables: gender, date of birth
and education. A two step procedure was adopted to deal �rst with missing information and then
with inconsistent data. Workers for whom inconsistencies or missing data on gender, birthdate
and education remained after the procedure were dropped from the panel. 10% of the original
dataset was lost with this procedure. To proceed with the study a random sample (clustered by
the worker identi�cation code) of 10% was drawn from the cleaned panel dataset. This sample
contains 2,522,278 observations (related to 520,222 workers over time) and is representative of the
full sample.2
The analysis is based upon two key variables: the date of admission to the �rm and the date
2The sample was created due to computation limitations.
8
of last promotion. The former allows the determination of the beginning of a spell within a �rm.
The latter allows identi�cation of how long it takes for a worker to be promoted within the �rm.
These two variables were also subject to tests of consistency. When possible, date of admission
was imputed by making use of the available information. Observations for which there were still
a) missing, b) decreasing date of admission, c) date of admission later than the reported year, or
d) date of admisson later than date of the survey, were dropped. 2.7% of the sample was lost with
this procedure.
Promotions are identi�ed by the reported date of last promotion within the �rm. This variable
is retrospective and its limit is the date of admission to the �rm. Of the 2,454,194 observations
1,533,458 have a reported date of last promotion. However, some inconsistencies were identi�ed and
replaced to missing.3 438,896 unique dates of last promotion are identi�ed in the dataset. Change
of �rms are identi�ed by combining the identi�cation code of the �rm and the date of admission. If
both these variables change from one record (of the same subject) to the other, then it is understood
that the worker has changed �rm. Using the reference month in which the survey was �lled in, it
is possible to proxy the spell length for separations. Some spells will be censored, either because
the panel ends or due to withdrawal.4 Despite of the fact that the survey is annually collected,
information on dates (date of admission, date of last promotion, date of the survey) is reported in
the format year/month. Therefore, the time unit of this analysis is the month. The length of the
�rst reported event is equal to the di¤erence between the date when the event occurred and the
date of admission. The length of the following events is equal to the di¤erence between the date of
the current event and the date of the previous recorded event.
After constructing the time to promotion further consistency checks were implemented resulting
in dropping 16% of the records.5 Further, only records regarding employees with age within the
338,6% reported dates of last promotion were equal to the date of admission to the �rm. As workers shouldkeep seniority after promotion, these cases were considered misreportings by the �rm and were recoded to missing.And 0,1% of the cases were recoded to missing due to the fact that date of last promotion was earlier than date ofadmission to the �rm.
4Withdrawal can happen for reasons such as retirement, movements to the public sector (which is excluded fromthe data), unemployment, non-employment, and self-employment (without registered employees).
5Because dates can be retrospective, 36% of promotions referred to spells completed before the start of the survey.Some overlapping events (1.5%) were caused by changes in the identi�cation code of the �rm. Due to misreportings,
9
range [14,65[ were kept.
Concepts used: promotion and changes of �rm
Collective agreements are settled between unions and employers for the purpose of regulating em-
ployment relationships. These agreements are the normal source of regulation on the subject of
career progress. In the dataset it is not possible to distinguish between the two di¤erent types of
promotion mentioned in the collective agreements: automatic and merit promotions. Automatic
promotions take place as a consequence of accumulated length of service. However, Pinto et al.
(1996) mention that provisions giving predominance to automatic promotions as a system of career
advancement are becoming less frequent, and that some �exibility can be introduced by rules giving
the employer the possibility of demanding an appraisal of the employee�s abilities (although length
of service remains as a request for promotion). Merit promotions are mostly dependent on the
employers will and, according to legal scholars, merit promotions imply a change to the contract of
employment. The de�nition of career paths signals that occupational category is the subject of the
contract of employment. There are about 1,000 di¤erent occupations (de�ned at the 6 digit level)
which are comparable across waves of the survey. Moreover, the instructions of the survey clearly
request employers to take into consideration the tasks the worker is e¤ectively performing regard-
less of their level of education and to record occupations at the most detailed level possible.6 This
set of instructions supports the conclusion that changes in occupation will be signalling changes in
tasks performed.7 A change in occupation (read jointly with the date of last promotion) is then
used to identify a merit promotion.
Three de�nitions of promotion will be considered in the empirical analysis: i) all promotions
� identi�ed by a reported date of last promotion in year t; ii) merit promotions � identi�ed by a
reported date of last promotion in year t; with an observed change in occupation from year t � 1
some spells had a negative time length.6Occupations are recorded in accordance to the National Classi�cation of Occupations 1994 (compatible with the
International Standard Classi�cation of Occupations, 1988 version).7Sicherman and Galor (1990) use occupation at the two digits level to identify occupational mobility. The main
assumption is that the narrower the number of categories the more likely it is to exist changes in tasks performed bythe worker.
10

to year t; iii) automatic promotions � identi�ed by a reported date of last promotion in year t;
without an observed change in occupation from year t� 1 to year t.8
Changes of �rms are identi�ed by changes in the date of admission and the �rm identi�cation
code. Most common in the literature is to distinguish workers using the reason for leaving the �rm,
either quits or layo¤s. Such a distinction is perhaps used to signal the quality of the match and
the quality of the worker as, for example, Sicherman and Galor (1990) predict that workers with
high probability of promotion are more likely to quit if they do not receive a promotion. In this
sense, �good�workers can quit to improve their career prospects somewhere else. But workers can
also quit �rms for several other reasons, for example, family related reasons. A third reason of
why workers change �rms - which is far less considered in the literature - is that �rms close, and
the characteristics of workers are meaningless in determining the hazard of changing �rms when a
�rm is closing. It is well established that large �rms stand a better chance of survival than small
and medium sized �rms. In the Portuguese market, however, more than 75% of the �rms have
less than 10 workers, meaning that shutdows are likely to occur. Furthermore, Mata and Portugal
(1994) found that only 50% of new �rms survived for a period of four years. Such facts suggest
a great rate of �rm creation and destruction in Portugal, which will induce movements of workers
in the labour market that are not strictly related to a pure mismatch between workers and �rms.
Therefore, what may better distinguish the quality of workers is the length of time to �nd a new
job. Notwithstanding the fact that the stock of vacancies plays an important role, one can expect
that more able and motivated workers will exert greater e¤orts to �nd a job. Alternatively, they can
search while still employed, and consequently experience shorter spells of non-employment. Usually,
in Portugal, a distinction is made between spells of unemployment. Unemployment is considered
to be short run if the spell is of length less than 12 months, and long-run if the spell duration
is equal or greater than 12 months. Using this threshold, separations were disaggregated by the
length of time a worker takes to re-appear in the dataset. Therefore, three kinds of separations will
8Rosenbaum (1979) gives promotions two functions within �rms: i) recruitment to upper levels of the hierarchy;and ii) rewards that can be material or just symbolic status. In any case, organizations can bene�t from greatercompliance and commitment of workers. I assume that automatic promotions are performing the latter function.
11
be analysed: i) all separations; ii) separations with gap length less than 12 months; iii) separations
with gap length greater or equal to 12 months. When promotions and separations are distinguished
in this ways, the analysis is related to four competing risks of failure instead of two.
The analysis is carried out using information on 480,354 distinct workers with 885,795 observa-
tions. Some descriptive statistics of the spells are presented in table 1. Nearly 44% of the records
relate to completed spells with median survival time of 28 months. When two competing risks are
considered, 28% of the completed spells are relative to promotions and the other 16% concern �rm
separations. The median survival time to promotion is 48 months, while the median survival time
to change from �rm is close to 13 years. Less than 75% of the individuals at risk separate from
the current �rm, and this is the reason why no information is provided for the 75th percentile of
survival time for separations. When four competing risks are considered, 9.6% of the completed
spells are related to merit promotions and 18.6% are automatic promotions. 75% of the workers
wait more than 27 months to receive automatic promotions and more than 69 months to be awarded
merit promotions. Separations with non-employment period of length lower than 12 months are the
rarest event (5% of completed records). Separations with period of non-employment with duration
greater than 1 year account for about 11% of the completed spells and in order to experience this
event 75% of the subjects wait more than six years.
[Table 1 about here]
Job mobility is a continuous process in time. Because events are recorded using the month as the
time unit, the time to job mobility is not being exactly measured. Consequently, time aggregation
may cause the estimates of parameters to be biased. However, under some circumstances the time
aggregation bias can be considered negligible, and non-adjusted (inconsistent) estimates will be very
similar to adjusted estimates. Petersen (1991) concludes that when the incidence rate is smaller
than .1 the relative bias (between adjusted and non-adjusted estimates) is small (less than 5%),
and if the incidence rate is smaller than .05 then the relative bias is less than 2%. By inspection
12
of incidence rates of this sample, in about 90% of the possible failure times the rate is less than
.05. It will then be considered that the potential bias arising from time aggregation will not cause
non-adjusted estimates to di¤er from adjusted estimates to a great extent, and no adjustment will
be made.
4 Empirical speci�cation
Theoretically, one is to expect that, for some length of time after the match is formed, both workers
and �rms engage a screening process to identify the quality of the match. Consequently, the hazard
of mobility would increase up to some time and then be monotonically decreasing. Non-parametric
hazard functions (see �gure ??) have this shape.9
[Figure ?? about here]
Hazard plots were used as a preliminary check of the suitability of four di¤erent parametric
distributions: lognormal, loglogistic, weibull and exponential.10 Klein and Moeschberger (2003)
refer that these graphical checks do not prove that a speci�c distribution is the correct one, they
only signal if a model is inappropriate. As for every failure event the weibull and exponential
distributions performed worse than the other two they were discounted and the analysis proceeded
with the lognormal and loglogistic distribution. When the distribution of survival time is assumed
to be either lognormal or loglogistic the model is implemented in the accelerated failure time
metric. This means that a linear relationship between the natural logarithm of survival time and
the characteristics X is assumed.11
9For similar empirical results, in the case of promotions see Rosenbaum (1979) and McCue (1996); and in thecase of changes of �rm see, for example, Farber (1994).
10The procedure follows Nelson (1972, 1982). According to Blossfeld et al. (1989), under the assumption that themodel is valid, OLS estimates can be used to determine the parameters of the distribution and the R2 statistic canbe used to identify which distribution best �ts the data.
11Given the acceleration parameter exp(�XB); a distribution is assumed for = exp(�XB)t: Alternatively,t = exp(XB) and ln(t) = XB + ln( ): In this study, two di¤erent sets of models will be estimated assuming eitherthat follows a loglogistic or a lognormal distribution.
13

Survival times may be correlated because individuals belong to �rms, or because workers can
fail more than once (recurrent events). In the case of recurrent events, correlation comes from two
sources. First, heterogeneity across individuals in�uences the likelihood that they will experience
an event, resulting in within-subject correlation in the occurrence and timing of recurrent events.
Second, there may be event dependence, i.e., the occurrence of one event may make further events
more or less likely. To control for heterogeneity, a conditional frailty model with gamma distributed
random e¤ects will be estimated.12
The parameters of the model are estimated via maximum likelihood.13 The likelihood function
is obtained by calculating the group-level conditional likelihoods and integrating out the frailty.
Given i groups with j observations per group with a trivariate response (t0ij ; tij ; dij) indicating the
start time, end time, and failure/censoring, respectively, for the jth individual in the ith group.
An individual, j, failing at time tj contributes to the likelihood function the value of the density
at time tj : A censored observation contributes to the likelihood function the value of the survival
function at time tj : Both completed and censored spells are conditional on the entry time t0j and
on the intra-group correlation. Given that competing risks are assumed to be independent, the
log-likelihood function is the sum of the the log-likelihoods for each di¤erent event and depends
only on the parameters speci�c to each destination.
As mentioned above, two speci�cations will be considered when analysing the determinants of
job mobility. One with two competing risks, where workers may fail (i.e. experience mobility)
due to promotions or to separations. The other with four competing risks where workers may fail
due to merit promotions, automatic promotions, changes of �rm with non-employment period of
length less than twelve months, or changes of �rm with non-employment duration greater or equal
to twelve months. The speci�cation for the vector of regressors includes observed characteristics of
12Given n groups with the ith group comprised of ni individuals (i = 1; :::; n); frailty introduces an unobservablemultiplicative e¤ect � on the hazard, so that conditional on the frailty the hazard function is hij(tj�i) = �ihij(t) forj = 1; :::; ni; where � is some random positive quantity assumed to have unit mean and variance �: The relationshipbetween the conditional and the unconditional survival functions is Sij(tj�i) = fSij(t)g�i : Consistency of estimatesdepends on the assumption that the error terms are uncorrelated with the explanatory variables in the model. Thisassumption is made here.
13These parameters are (�; ; �) in case the loglogistic distribution is assumed, and (�; �; �) in case the lognormaldistribution is assumed
14
workers and �rms. The regressors related to workers are age (and its squared term) at the beginning
of the spell, gender (dummy variable), a categorical variable for education reported according to
the International Standard Classi�cation of Education (ISCED, 1997 version).14 A dummy variable
reporting whether in the year previous to job mobility the worker was earning a wage greater or
smaller than the median wage paid by the �rm. Workers were also distinguished by whether or not
they were working full time. To control for some overall caracteristics of the economy a dummy
for the year when the event occurred was created. The categories were de�ned according to the
evolution of the unemployment rate which was declining until 1992 (category 1), increased from
1992 to 1996 (category 2) and started to decline again after 1996 (category 3). Regarding the �rms,
a categorical variable was created for the size of �rm. Firms are micro if they employ less than 10
workers, small if they employ more than 9 and less than 50 workers, medium if they employ more
than 49 and less than 250 workers, and are large if the employ more than 249 workers. Another
categorical variable was created for the growth of the �rm (between t� 1 and t) which is measured
by changes in the number of people within the �rm. Three categories were created to account for
negative growth, null growth or positive growth. The legal setting, the region (identi�ed at the
district level) and the industry (at two digit level) were also included. Unobservable characteristics
on workers (ability, motivation, ambition) or �rms (promotion policies, market image) that may
contribute to accelerate or decelerate the survival time to job mobility are considered by including
frailty shared at the �rm level and at the worker level. Summary statistics of the regressors are
presented in table 2. The reference group consists of males, with schooling ISCED level 1, with no
previous event-speci�c mobility. These workers earn a wage inferior or equal to the median wage of
the �rm, work full-time in large limited liability �rms in wholesale and retail trade that experience
no growth and are located in Lisbon.
[Table 2 about here]
14For Portugal, there is no correspondence to ISCED level 4, and ISCED levels 5 and 6 are not possible todistinguish.
15

Although either the worker or the �rm frailty e¤ects are statistically signi�cant, insofar as it
can be ascertained by the likelihood ratio test and the Akaike information criterium the best �tting
speci�cations were those that allowed for correlation within �rms (see table 3). This result signals
that perhaps the observable characteristics are capturing better heterogeneity of workers than the
heterogeneity of �rms, and emphasizes the importance of �rms as a determinant of the job mobility
process. Therefore, one �rst general conclusion is that once analysing career paths it is important
to as much as possible consider characteristics of the �rms. As a consequence, models with �rm
level frailty were chosen.15
[Table 3 about here]
To account for some heterogeneity in the propensity that each worker has to experience job
mobility, a dummy variable was introduced in the set of regressors. This variable assumes the value
one if the worker has previously experienced the type of event under analysis, and zero otherwise.16
Models assuming lognormal and loglogistic distributions with �rm level frailty and a dummy for
previous failure were estimated. As can be ascertained from table 4, because it obtains a smaller
AIC, the speci�cation assuming survival time to be loglogistically distributed is always preferred.
The lognormal distribution was in this way discounted from the possible distributions and only the
estimates obtained under the assumption that survival time follows a loglogistic distribution will
be analyzed in the following section.17
[Table 4 about here]
15This choice is consistent with the suggestion made by Rosenbaum (1979 pp23): "promotion chances may be afundamental determinant of a wide variety of other attitudes and behaviors and are perhaps more important thanindividual personal traits or one�s level in organization." These chances are likely to be captured by �rm-level frailty.
16Although working in a discrete time context, Mincer and Jovanovic (1981) suggest that prior mobility variablesare strong indicators of mobility in the following period. Their inclusion in the model shows the existence of hetero-geneity in mobility behaviour. Also Chamberlain (1985) makes a similar suggestion to account for heterogeneity.
17Any of the other estimates �assuming a lognormal distribution or accounting for workers di¤erences in propen-sities to job mobility �are available upon request from the author.
16

Estimates are displayed in table 5. Columns i) and iv) in the table, contain the coe¢ cients of
the two competing risks model: promotions and changes of �rms, respectively. Columns ii), iii), v)
and vi) contain the coe¢ cients of the model with four competing risks. Given the functional form
of the model, the coe¢ cients measure relative changes in survival time for a given absolute change
(or, in the case of dummy variables, a change from zero to one) in the value of the regressors. Put
it di¤erently, if multiplied by 100 coe¢ cients give the growth rate of survival time given an absolute
change in the regressors. If the signal of a coe¢ cient is positive, survival time is lengthened; if it is
negative survival time is shortened.
[Table 5 about here]
5 Results
The results are sensitive to the de�nition of promotion adopted. The magnitude of coe¢ cients
is, in general, greater when merit promotions (column ii) instead of all promotions or automatic
promotions are considered (columns i) and iii), respectively). Further, the de�nition of promotion
seems to be the driving force in explaining gender di¤erences in the hazard of promotion. Not dis-
tinguishing promotion types yields the result that women have survival time to promotion roughly
equal to men�s. If merit promotions are considered women face a survival time 10% longer than
men�s. If, on the other hand, one is to consider automatic promotions (column iii) women have
a greater hazard of promotion when compared to men. Therefore, women are more likely than
men to have automatic promotions but less likely to receive merit promotions. These �ndings may
help demonstrate why results on the impact of gender on promotion from previous research are
not conclusive. Pergamit and Veum (1999), conclude for the US that women are less likely to
be promoted than men whereas, using British data, Booth and Francesconi (2000) and Booth et
al. (2003) conclude that women are either more or at least as likely as men to be promoted. In
the British data used, the worker is �rst asked if he changed job. However, when asked to give
the reason why he did so, apart from the broad category "other reasons" only promotion �ts the
17
possibility of changes of tasks within �rms.18 The de�nition of promotion used in these studies
seems to have some relevance. In Pergamit and Veum�s (1999) survey respondents are �rst asked
whether they were promoted, and the follow up question relates to the consequences of promotion.
However, the estimates were obtained by using all the outcomes of promotion yielding the result of
an almost not signi�cant coe¢ cient for the covariate on gender. These to ways of de�ning promo-
tion, resemble in the latter case my de�nition of all promotions and in the former the de�nition of
automatic promotion. On the other hand, McCue (1996) presents two sets of estimates, one related
to any change in position and the other related to promotion and change in position. Were the
coe¢ cients to be signi�cant, the conclusion would be that in the former case women would have
greater hazards than men to be promoted (similar to all promotions here), while in the latter case
women would have a lower hazard of promotion (similar to merit promotions).
In Lazear and Rosen (1990) model women are assumed to have better non-market opportunities
and, consequently, are more likely to leave the �rm (or the labour market) while keeping a high level
of utility. For this reason, women would have to meet tougher criteria for promotion, hence being
promoted less and possibly being overlooked for promotion in favour of less able men. Despite of
the fact that women have lower hazard of merit promotions this result does not seem to be caused
by the existence of better non-market opportunities, since the coe¢ cients on the survival time
to leave the �rm are always positive for women (columns iv)-vi)).19 Berthoud (2004) reports that
Portugal has the lowest median income in terms of purchasing power standards in the EU 15 group,
but the highest inequality index and poverty rate. In such a context, it does not seem reasonable
to suppose that women could a¤ord to consider non-labour market opportunities as alternatives to
labour market participation. On the contrary, women could try to deepen the attachment to the
�rm.20 Results are consistent with this hypothesis because although Portuguese women are less
18There is no room, for example, to account for a discretionary reallocation of workers within �rm without apromotion.
19 In an attempt to capture non-market opportunities for women Pergamit and Veum (1999) introduce maritalstatus, number of children and the presence of child with age up to six years in the household. I have no suchdemographic data to apply this type of controls.
20Spiess et al. (2004) document the non-existence of childbirth e¤ect in Portugal �the pattern of average hoursworked by women does not change after the �rst childbirth. Perhaps this �nding is a signal of the non-existence ofbetter non market opportunities.
18
likely than men to change occupation while having a promotion, they do have a greater hazard of
being promoted as a consequence of accumulated length of service. The result for promotions is
also consistent with the results obtained for the survival time to change �rms. On average, the
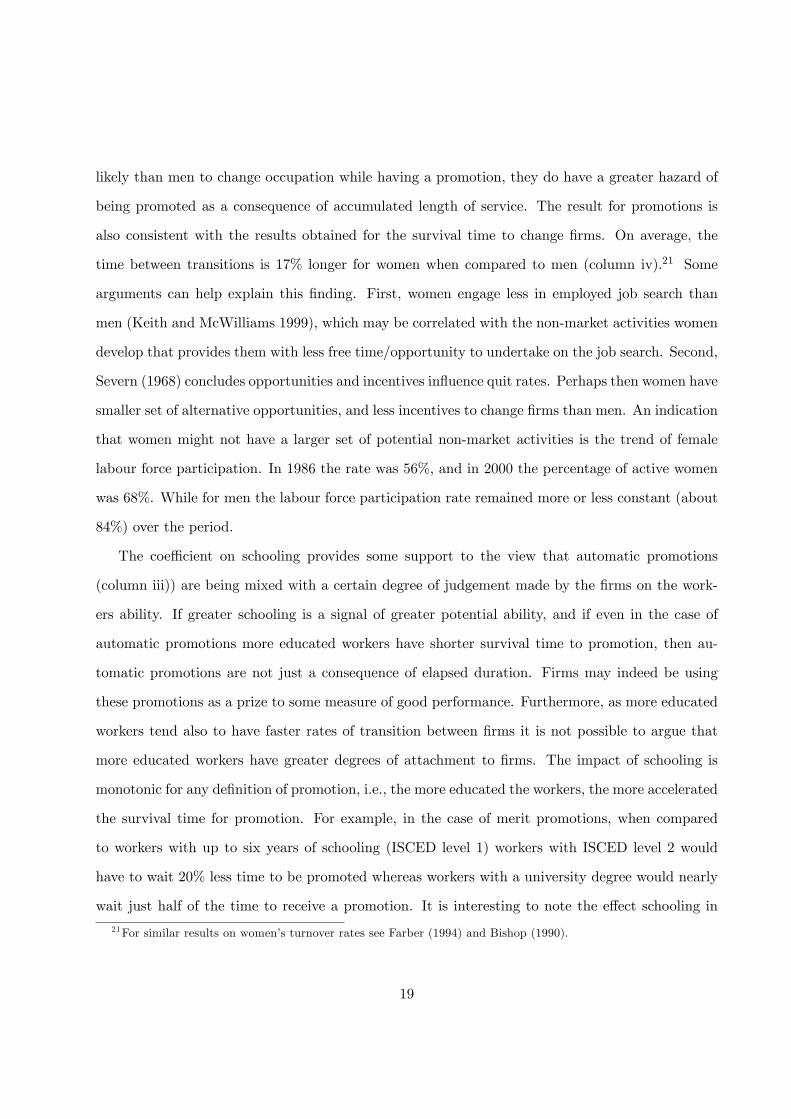
time between transitions is 17% longer for women when compared to men (column iv).21 Some
arguments can help explain this �nding. First, women engage less in employed job search than
men (Keith and McWilliams 1999), which may be correlated with the non-market activities women
develop that provides them with less free time/opportunity to undertake on the job search. Second,
Severn (1968) concludes opportunities and incentives in�uence quit rates. Perhaps then women have
smaller set of alternative opportunities, and less incentives to change �rms than men. An indication
that women might not have a larger set of potential non-market activities is the trend of female
labour force participation. In 1986 the rate was 56%, and in 2000 the percentage of active women
was 68%. While for men the labour force participation rate remained more or less constant (about
84%) over the period.
The coe¢ cient on schooling provides some support to the view that automatic promotions
(column iii)) are being mixed with a certain degree of judgement made by the �rms on the work-
ers ability. If greater schooling is a signal of greater potential ability, and if even in the case of
automatic promotions more educated workers have shorter survival time to promotion, then au-
tomatic promotions are not just a consequence of elapsed duration. Firms may indeed be using
these promotions as a prize to some measure of good performance. Furthermore, as more educated
workers tend also to have faster rates of transition between �rms it is not possible to argue that
more educated workers have greater degrees of attachment to �rms. The impact of schooling is
monotonic for any de�nition of promotion, i.e., the more educated the workers, the more accelerated
the survival time for promotion. For example, in the case of merit promotions, when compared
to workers with up to six years of schooling (ISCED level 1) workers with ISCED level 2 would
have to wait 20% less time to be promoted whereas workers with a university degree would nearly
wait just half of the time to receive a promotion. It is interesting to note the e¤ect schooling in
21For similar results on women�s turnover rates see Farber (1994) and Bishop (1990).
19

the two competing risks for leaving �rms (columns v) and vi)). Were workers to take more than
one year to �nd another job, the hazard to change �rms is independent of the level of schooling.
However, the more schooling a worker has the less time he takes to change between �rms within a
period of one year. For example, workers with a university degree will take just 27% of the time of
workers with 6 years of schooling to change �rms within one year. This result may be due to the
fact that the quality of the match is identi�ed faster for more highly educated workers, hence more
educated workers are either promoted or change �rms sooner. Converging to Rosenbaum�s (1979)
�nding that promotion patterns require more highly educated workers to attain promotions in a
short period of time, otherwise they would not be promoted. But school attainment can also be
correlated with the age of workers. Minimum compulsory schooling was six years from the seventies
until mid eighties. Workers with nine years of compulsory schooling appeared in the mid nineties.
Also, during the nineties Portugal experienced a boom in the supply of workers with university
degrees. It is then reasonable to believe that, on average, more educated workers have lower labour
market experience. The less the labour market experience, according to job shopping theories, the
less the worker is aware of the overall characteristics, his own and the labour market�s, therefore
tending to change jobs frequently.
Workers who earn wages above the median hourly wage of the �rm have lower hazards of job
mobility. One possible explanation for this �nding is that these workers might have acquired �rm
speci�c human capital, were promoted in the past, and are now receiving greater wages as a return
to their past good performance. Another possibility, is that workers receiving higher wages may
be located in a level of the �rm hiererarchy in which ladders are longer, hence their likelihood of
promotion is smaller when compared to workers receiving lower wages (hierarchical level where
ladders are smaller).22 Part-time workers show lower attachment to the �rm. These workers are
very likely to change �rms. On average, to do so, they take 46% less time than full-time workers.
Further, when compared to full-time workers, part-timers have a survival time 50% shorter to move
22Wise (1975) suggests that promotions are dependent on the opening of vacancies, and that this e¤ect is likelyto be more relevant the closer one is to the top of the hierarchy. On the contrary, promotions at low levels are lesslikely to depend on the occurrence of openings.
20

between �rms with a period of non-employment of length greater than one year.
The coe¢ cient of previous promotion is extremely strong, it is -.55 in the case of merit pro-
motions and -.87 in the case of automatic promotions. As some heterogeneity is supposed to be
captured by this variable, it signals that there are some workers with propensity to be promoted,
and suggests the possible existence of fast trackers. However, although negative, the e¤ect of having
changed �rms previously is not so great in the case of separations with periods of non-employment
of length greater than one year. But it is so in the case of separations with gap length inferior
to one year. This result suggests the possibility that some workers are �movers�while some others
would be more prone to be �stayers�.
Regarding �rm size, support is found for hierarchical models of the dynamics of the �rm. The
smaller the �rm, the lower the hazard into merit promotion. Smaller �rms are less likely to have a
structure that supports workers�changes of occupations. Again, opportunity seems to be a relevant
determinant of the likelihood of promotion. As expected, the growth of the �rm is more in�uential
in the occurrence of merit promotions. Intuitively, if the �rm is growing new occupations are likely
to be created. Furthermore, this coe¢ cient may also be signalling the preference of �rms to �ll in
jobs located higher in the hierarchy from within by promoting incumbents and o¤ering entry jobs
at lower levels in the hierarchy. Noticeable is the fact that the growth of �rm increases the hazard of
changes of �rm more than the hazard of promotion, and the impact is greater for separations with
periods of non-employment with length greater than 12 months. This may be correlated with the
health of the particular industry or sector, motivating workers to change �rms seeking for better
career prospects. Some workers may be more aware of their chances of �nding a new job, some
others may be misled and hence have to wait longer for a new job. On the contrary, when the �rm
is downsizing the hazard of both promotions and separations is lower.
The legal setting of the �rm is also a statistically signi�cant predictor of job mobility. In almost
any case, the hazard of promotion is greater in limited liability companies. Workers, however, are
more likely to change �rms if they are located in sole partnerships. One of the disadvantages for
this type of legal setting is the di¢ culty of obtaining credit given that the risk is concentrated in one
21

single individual. Do workers realize that these �rms are potentially less stable, and possibly more
likely to shutdown? This question arises from the fact that, though the hazard of changing �rms
is greater for this speci�c legal setting, it is stronger for separations that involve a period of non-
employment of length lower than twelve months. Realizing the potential instability of these �rms,
workers may act rationally and move between �rms for the sake of �nding more stable employment
relationships.
The shape parameter (gamma) re�ects the pattern of duration dependence. In the case of
the loglogistic distribution hazards can be initially rising, reach a maximum and then decline
monotonically. The loglogistic distribution, however, supports also the possibility for strict negative
duration dependence (when gamma is greater than one). In the case of promotions the hazard is
initially increasing, reaches a peak and then monotonically declines. The same pattern is not so
clear in the case of separations. In the case of all separations and separations with gap length
greater than one year the hazard initially rises (but not as much as in the case of promotions) and
then declines. In the case of separations with a gap of length inferior to one year only negative
duration dependence is observed.23
6 Conclusion
The analysis of the determinants of job mobility in Portugal was the purpose of this study. Job mo-
bility was here de�ned as a possible means of career advancement. Three contributions are made to
the literature. Firstly, two broad types of events were analysed, promotions and turnover. However,
both of these events can be de�ned in a variety of ways. Assuming that the determinants of mobility
may depend on the fashion in which events are de�ned, promotions were split into merit and auto-
matic promotions, and separations were split according to the length of time workers take to �nd
23Conditional and unconditional hazard funtions (not presented here) were plotted. Given that for every type ofevent both hazards had the same shape, it is possible to conclude that unobserved heterogeneity is important butit does not generate deviations of population hazards from mean individual hazards. Given the possible dimensionof left truncation (some spells lasted nearly 800 months) the same estimations were done for a sample of workerswho had started their spell in the �rm after January 1985 (640,131 records). The same results were obtained, i.e.,speci�cations with loglogistic distribution and �rm frailty have always �tted best, and the sign of coe¢ cients did notchange.
22

a new job. This distinction revealed to be fruitful in the sense that sharper di¤erences/similarities
were possible to be observed regarding the impact of observed factors and interesting comparisons
and links were possible between the determinants of promotion and turnover. One �nding that
clearly derived from such a distinction is related to gender di¤erentials in the access to promotion
which heavily depend on the de�nition of promotion adopted. The second contribution made was
introduction of �rms in the analysis. A major conclusion is that, in fact, �rms cannot be ignored
as a explanatory factor of job mobility, for not only were all the coe¢ cients signi�cant, but also
models with unobserved frailty of the �rm always performed best. The third contribution is that
rather than using data from one single �rm, the data set used is economy wide and allows for
conclusions applicable to the labour market as a whole.
Estimates suggest that it does not seem to be the case that, in Portugal, women have attractive
non-market opportunities that would lead them to be less stable workers. This result, associated
to the fact that Portuguese women have a high participation rate in the labour market, opens the
question on the outcomes of participation more than on the participation itself. It was also clear
from the results that, once in the labour market, highly educated workers have greater hazards of
promotion than workers with ISCED level 1, and were they to change �rms they are very likely to
�nd a job within the next year. On the contrary, the lower the education of workers the greater
the risk of being non-employed for more than one year. Therefore, investments in education seem
to be rewarded and incentives to these should be given. Some evidence was found that the less the
stability of the �rm the less likely workers are to have positive job mobility (in the sense of having
a promotion or change from �rm with a non-employment period inferior to one year). As such,
some support on the planning and organization of smallers �rms would be a positive policy.
The models here considered assumed that, conditional on observable characteristics and on �rm
frailty, spells were independent. A relevant extension to this work is to introduce models that relax
this assumption and allow for occurrence dependence and dependent competing risks.
23

Table 1: Summary statistics of eventsIncidence Survival time
Frequence Percent rate 25% 50% 75%
Records: 885,795 100
Censored 497,440 56.2
Completed 388,355 43.8 .01629 12 28 75
Two competing risks:
Promotions 249,341 28.2 .01046 20 48 171
Separations 139,014 15.7 .00583 37 154
Four competing risks:
Merit Promotions 84,683 9.6 .00355 69 531
Automatic Promotions 164,658 18.6 .00691 27 93
Separations, gap<12 45,808 5.2 .00192 203
Separations, gap�12 93,206 10.5 .00391 73 297
Source: Own calculations based on Portugal, MTSS (1986-2000).
24
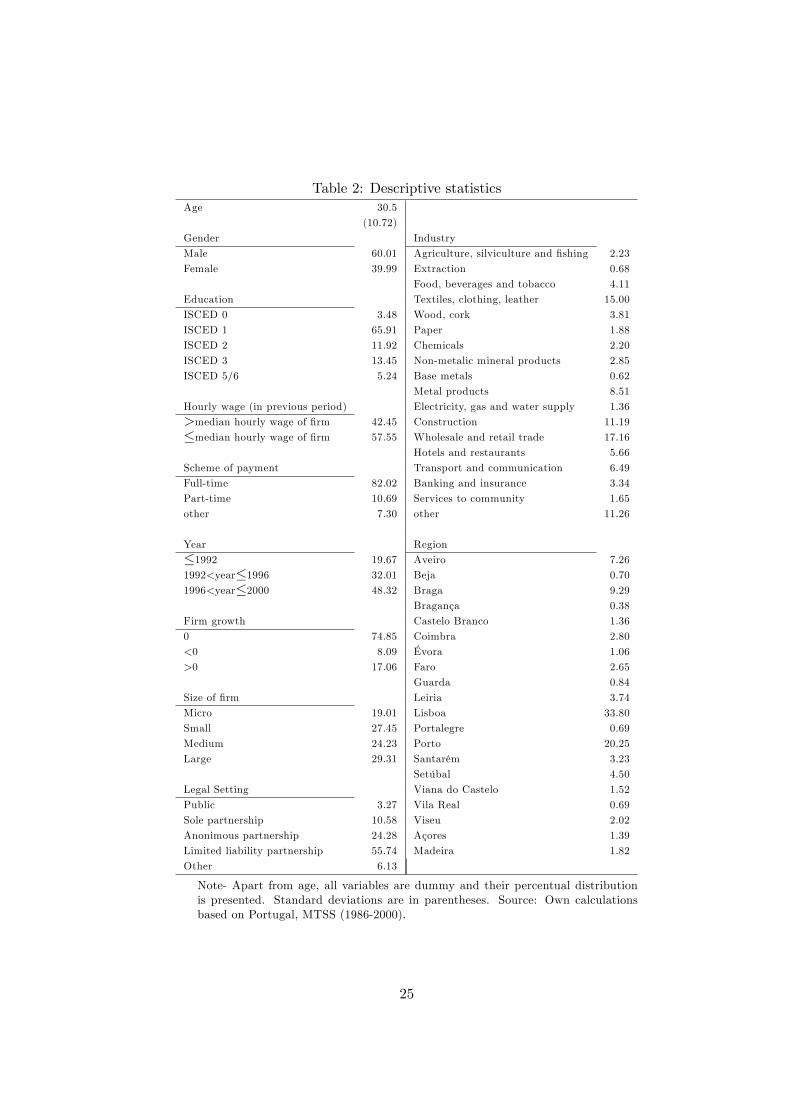
Table 2: Descriptive statisticsAge 30.5
(10.72)
Gender Industry
Male 60.01 Agriculture, silviculture and �shing 2.23
Female 39.99 Extraction 0.68
Food, beverages and tobacco 4.11
Education Textiles, clothing, leather 15.00
ISCED 0 3.48 Wood, cork 3.81
ISCED 1 65.91 Paper 1.88
ISCED 2 11.92 Chemicals 2.20
ISCED 3 13.45 Non-metalic mineral products 2.85
ISCED 5/6 5.24 Base metals 0.62
Metal products 8.51
Hourly wage (in previous period) Electricity, gas and water supply 1.36
>median hourly wage of �rm 42.45 Construction 11.19
�median hourly wage of �rm 57.55 Wholesale and retail trade 17.16
Hotels and restaurants 5.66
Scheme of payment Transport and communication 6.49
Full-time 82.02 Banking and insurance 3.34
Part-time 10.69 Services to community 1.65
other 7.30 other 11.26
Year Region
�1992 19.67 Aveiro 7.26
1992<year�1996 32.01 Beja 0.70
1996<year�2000 48.32 Braga 9.29
Bragança 0.38
Firm growth Castelo Branco 1.36
0 74.85 Coimbra 2.80
<0 8.09 Évora 1.06
>0 17.06 Faro 2.65
Guarda 0.84
Size of �rm Leiria 3.74
Micro 19.01 Lisboa 33.80
Small 27.45 Portalegre 0.69
Medium 24.23 Porto 20.25
Large 29.31 Santarém 3.23
Setúbal 4.50
Legal Setting Viana do Castelo 1.52
Public 3.27 Vila Real 0.69
Sole partnership 10.58 Viseu 2.02
Anonimous partnership 24.28 Açores 1.39
Limited liability partnership 55.74 Madeira 1.82
Other 6.13
Note- Apart from age, all variables are dummy and their percentual distributionis presented. Standard deviations are in parentheses. Source: Own calculationsbased on Portugal, MTSS (1986-2000).
25
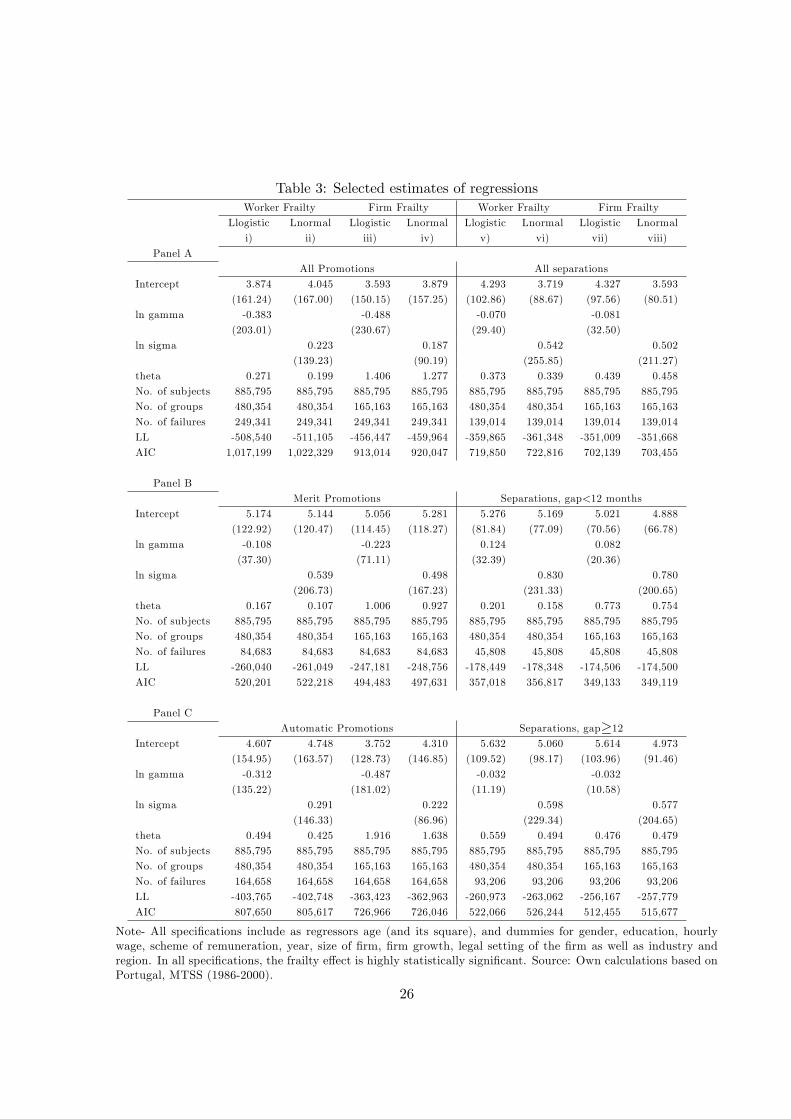
Table 3: Selected estimates of regressionsWorker Frailty Firm Frailty Worker Frailty Firm Frailty
Llogistic Lnormal Llogistic Lnormal Llogistic Lnormal Llogistic Lnormal
i) ii) iii) iv) v) vi) vii) viii)
Panel A
All Promotions All separations
Intercept 3.874 4.045 3.593 3.879 4.293 3.719 4.327 3.593
(161.24) (167.00) (150.15) (157.25) (102.86) (88.67) (97.56) (80.51)
ln gamma -0.383 -0.488 -0.070 -0.081
(203.01) (230.67) (29.40) (32.50)
ln sigma 0.223 0.187 0.542 0.502
(139.23) (90.19) (255.85) (211.27)
theta 0.271 0.199 1.406 1.277 0.373 0.339 0.439 0.458
No. of subjects 885,795 885,795 885,795 885,795 885,795 885,795 885,795 885,795
No. of groups 480,354 480,354 165,163 165,163 480,354 480,354 165,163 165,163
No. of failures 249,341 249,341 249,341 249,341 139,014 139,014 139,014 139,014
LL -508,540 -511,105 -456,447 -459,964 -359,865 -361,348 -351,009 -351,668
AIC 1,017,199 1,022,329 913,014 920,047 719,850 722,816 702,139 703,455
Panel B
Merit Promotions Separations, gap<12 months
Intercept 5.174 5.144 5.056 5.281 5.276 5.169 5.021 4.888
(122.92) (120.47) (114.45) (118.27) (81.84) (77.09) (70.56) (66.78)
ln gamma -0.108 -0.223 0.124 0.082
(37.30) (71.11) (32.39) (20.36)
ln sigma 0.539 0.498 0.830 0.780
(206.73) (167.23) (231.33) (200.65)
theta 0.167 0.107 1.006 0.927 0.201 0.158 0.773 0.754
No. of subjects 885,795 885,795 885,795 885,795 885,795 885,795 885,795 885,795
No. of groups 480,354 480,354 165,163 165,163 480,354 480,354 165,163 165,163
No. of failures 84,683 84,683 84,683 84,683 45,808 45,808 45,808 45,808
LL -260,040 -261,049 -247,181 -248,756 -178,449 -178,348 -174,506 -174,500
AIC 520,201 522,218 494,483 497,631 357,018 356,817 349,133 349,119
Panel C
Automatic Promotions Separations, gap�12Intercept 4.607 4.748 3.752 4.310 5.632 5.060 5.614 4.973
(154.95) (163.57) (128.73) (146.85) (109.52) (98.17) (103.96) (91.46)
ln gamma -0.312 -0.487 -0.032 -0.032
(135.22) (181.02) (11.19) (10.58)
ln sigma 0.291 0.222 0.598 0.577
(146.33) (86.96) (229.34) (204.65)
theta 0.494 0.425 1.916 1.638 0.559 0.494 0.476 0.479
No. of subjects 885,795 885,795 885,795 885,795 885,795 885,795 885,795 885,795
No. of groups 480,354 480,354 165,163 165,163 480,354 480,354 165,163 165,163
No. of failures 164,658 164,658 164,658 164,658 93,206 93,206 93,206 93,206
LL -403,765 -402,748 -363,423 -362,963 -260,973 -263,062 -256,167 -257,779
AIC 807,650 805,617 726,966 726,046 522,066 526,244 512,455 515,677
Note- All speci�cations include as regressors age (and its square), and dummies for gender, education, hourlywage, scheme of remuneration, year, size of �rm, �rm growth, legal setting of the �rm as well as industry andregion. In all speci�cations, the frailty e¤ect is highly statistically signi�cant. Source: Own calculations based onPortugal, MTSS (1986-2000).
26
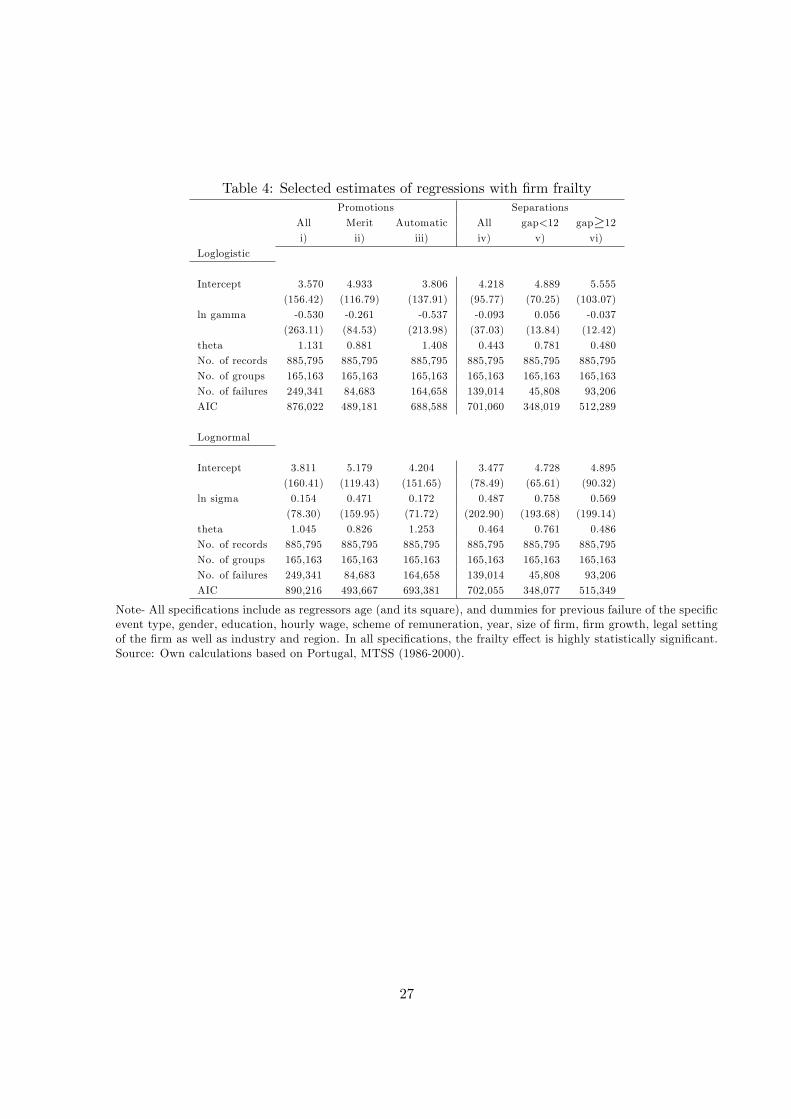
Table 4: Selected estimates of regressions with �rm frailtyPromotions Separations
All Merit Automatic All gap<12 gap�12i) ii) iii) iv) v) vi)
Loglogistic
Intercept 3.570 4.933 3.806 4.218 4.889 5.555
(156.42) (116.79) (137.91) (95.77) (70.25) (103.07)
ln gamma -0.530 -0.261 -0.537 -0.093 0.056 -0.037
(263.11) (84.53) (213.98) (37.03) (13.84) (12.42)
theta 1.131 0.881 1.408 0.443 0.781 0.480
No. of records 885,795 885,795 885,795 885,795 885,795 885,795
No. of groups 165,163 165,163 165,163 165,163 165,163 165,163
No. of failures 249,341 84,683 164,658 139,014 45,808 93,206
AIC 876,022 489,181 688,588 701,060 348,019 512,289
Lognormal
Intercept 3.811 5.179 4.204 3.477 4.728 4.895
(160.41) (119.43) (151.65) (78.49) (65.61) (90.32)
ln sigma 0.154 0.471 0.172 0.487 0.758 0.569
(78.30) (159.95) (71.72) (202.90) (193.68) (199.14)
theta 1.045 0.826 1.253 0.464 0.761 0.486
No. of records 885,795 885,795 885,795 885,795 885,795 885,795
No. of groups 165,163 165,163 165,163 165,163 165,163 165,163
No. of failures 249,341 84,683 164,658 139,014 45,808 93,206
AIC 890,216 493,667 693,381 702,055 348,077 515,349
Note- All speci�cations include as regressors age (and its square), and dummies for previous failure of the speci�cevent type, gender, education, hourly wage, scheme of remuneration, year, size of �rm, �rm growth, legal settingof the �rm as well as industry and region. In all speci�cations, the frailty e¤ect is highly statistically signi�cant.Source: Own calculations based on Portugal, MTSS (1986-2000).
27
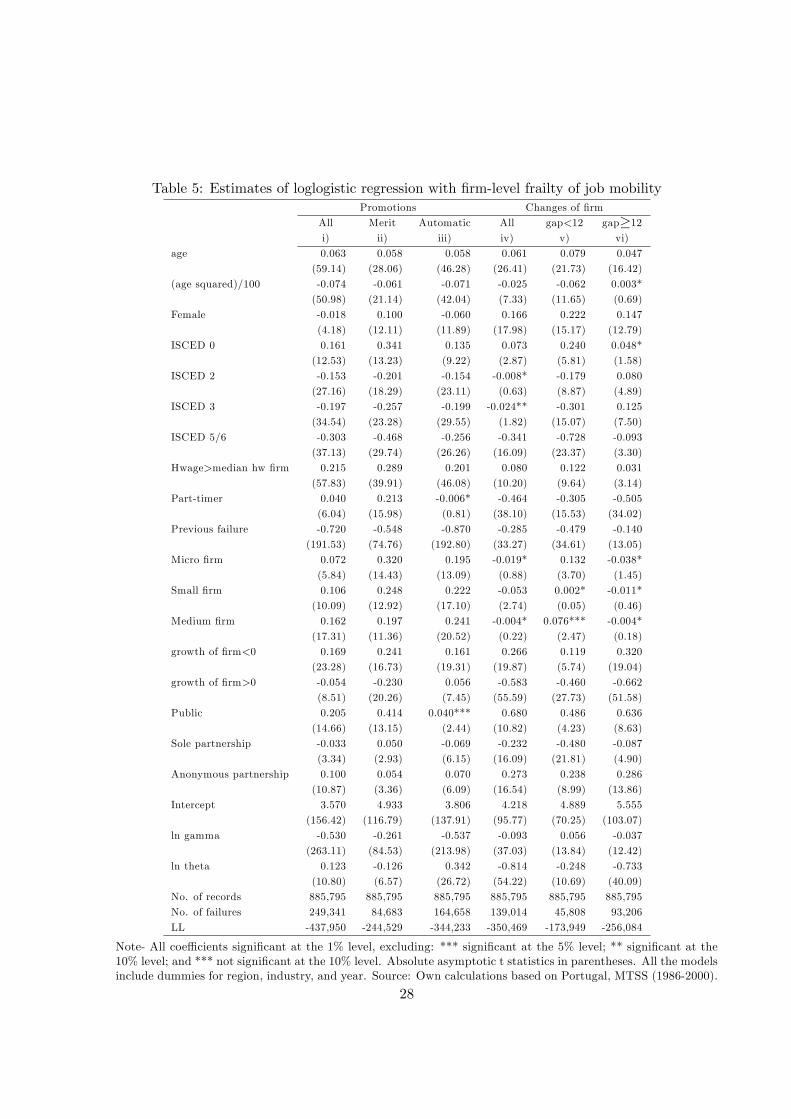
Table 5: Estimates of loglogistic regression with �rm-level frailty of job mobilityPromotions Changes of �rm
All Merit Automatic All gap<12 gap�12i) ii) iii) iv) v) vi)
age 0.063 0.058 0.058 0.061 0.079 0.047
(59.14) (28.06) (46.28) (26.41) (21.73) (16.42)
(age squared)/100 -0.074 -0.061 -0.071 -0.025 -0.062 0.003*
(50.98) (21.14) (42.04) (7.33) (11.65) (0.69)
Female -0.018 0.100 -0.060 0.166 0.222 0.147
(4.18) (12.11) (11.89) (17.98) (15.17) (12.79)
ISCED 0 0.161 0.341 0.135 0.073 0.240 0.048*
(12.53) (13.23) (9.22) (2.87) (5.81) (1.58)
ISCED 2 -0.153 -0.201 -0.154 -0.008* -0.179 0.080
(27.16) (18.29) (23.11) (0.63) (8.87) (4.89)
ISCED 3 -0.197 -0.257 -0.199 -0.024** -0.301 0.125
(34.54) (23.28) (29.55) (1.82) (15.07) (7.50)
ISCED 5/6 -0.303 -0.468 -0.256 -0.341 -0.728 -0.093
(37.13) (29.74) (26.26) (16.09) (23.37) (3.30)
Hwage>median hw �rm 0.215 0.289 0.201 0.080 0.122 0.031
(57.83) (39.91) (46.08) (10.20) (9.64) (3.14)
Part-timer 0.040 0.213 -0.006* -0.464 -0.305 -0.505
(6.04) (15.98) (0.81) (38.10) (15.53) (34.02)
Previous failure -0.720 -0.548 -0.870 -0.285 -0.479 -0.140
(191.53) (74.76) (192.80) (33.27) (34.61) (13.05)
Micro �rm 0.072 0.320 0.195 -0.019* 0.132 -0.038*
(5.84) (14.43) (13.09) (0.88) (3.70) (1.45)
Small �rm 0.106 0.248 0.222 -0.053 0.002* -0.011*
(10.09) (12.92) (17.10) (2.74) (0.05) (0.46)
Medium �rm 0.162 0.197 0.241 -0.004* 0.076*** -0.004*
(17.31) (11.36) (20.52) (0.22) (2.47) (0.18)
growth of �rm<0 0.169 0.241 0.161 0.266 0.119 0.320
(23.28) (16.73) (19.31) (19.87) (5.74) (19.04)
growth of �rm>0 -0.054 -0.230 0.056 -0.583 -0.460 -0.662
(8.51) (20.26) (7.45) (55.59) (27.73) (51.58)
Public 0.205 0.414 0.040*** 0.680 0.486 0.636
(14.66) (13.15) (2.44) (10.82) (4.23) (8.63)
Sole partnership -0.033 0.050 -0.069 -0.232 -0.480 -0.087
(3.34) (2.93) (6.15) (16.09) (21.81) (4.90)
Anonymous partnership 0.100 0.054 0.070 0.273 0.238 0.286
(10.87) (3.36) (6.09) (16.54) (8.99) (13.86)
Intercept 3.570 4.933 3.806 4.218 4.889 5.555
(156.42) (116.79) (137.91) (95.77) (70.25) (103.07)
ln gamma -0.530 -0.261 -0.537 -0.093 0.056 -0.037
(263.11) (84.53) (213.98) (37.03) (13.84) (12.42)
ln theta 0.123 -0.126 0.342 -0.814 -0.248 -0.733
(10.80) (6.57) (26.72) (54.22) (10.69) (40.09)
No. of records 885,795 885,795 885,795 885,795 885,795 885,795
No. of failures 249,341 84,683 164,658 139,014 45,808 93,206
LL -437,950 -244,529 -344,233 -350,469 -173,949 -256,084
Note- All coe¢ cients signi�cant at the 1% level, excluding: *** signi�cant at the 5% level; ** signi�cant at the10% level; and *** not signi�cant at the 10% level. Absolute asymptotic t statistics in parentheses. All the modelsinclude dummies for region, industry, and year. Source: Own calculations based on Portugal, MTSS (1986-2000).
28

Figure 1: Smoothed hazard estimates
0.0
05.0
1.0
15.0
2E
stim
ated
haz
ard
rate
0 200 400 600
All Promotions0
.005
.01
.015
.02
0 200 400 600
Merit promotions
0.0
05.0
1.0
15.0
2
0 200 400 600
Automatic promotions
0.0
05.0
1.0
15.0
2E
stim
ated
haz
ard
rate
0 200 400 600Time since last event
All separations
0.0
05.0
1.0
15.0
2
0 200 400 600Time since last event
Separations (gap<12m)0
.005
.01
.015
.02
0 200 400 600Time since last event
Separations (gap>=12m)
Note. Estimates based on the Epanechnikov kernel with a bandwidth of 7 months.Source: Own calculations based on Portugal, MTSS (19862000).
References
Abraham, Katharine G. and James L. Medo¤ (1985) "Length of service and promotions in union andnonunion work groups." Industrial and Labor Relations Review, 38(3): 408-420.
Baker, George and Bengt Holmstrom (1995) "Internal labor markets: too many theories, too few facts."American Economic Review, 85(2): 255-259.
Becker, Gary S. (1962) "Investment in human capital: a theoretical analysis." Journal of Political Economy,70(5): 9-49.
Bell, Linda A. and Richard B. Freeman (2001) "The incentive for working hard: explaining hours workeddi¤erences in the US and Germany." Labour Economics, 8(2): 181-202.
Bernhardt, Dan and David Scoones (1993) "Promotion, turnover, and preemptive wage o¤ers." AmericanEconomic Review, 83(4): 771-791.
29
Berthoud, Richard (2004) Patterns of Poverty Across Europe. Policy Press, Bristol.
Bishop, John (1990) "Job performance, turnover, and wage growth." Journal of Labor Economics, 8(3):363-386.
Blossfeld, Hans-Peter, Alfred Hamerle and Karl Ilrich Mayer (1989) Event History Analysis. LEA, NewJersey.
Bognamo, Michael L. (2001) "Corporate tournaments." Journal of Labor Economics, 19(2): 290-315.
Booth, Alison L., Marco Francesconi and Je¤ Frank (2003) "A sticky �oors model of promotions, pay andgender." European Economic Review, 47: 295-322.
Booth, Alison L. and Marco Francesconi (2000) "Job mobility in 1990s Britain: does gender matter?"Research in Labor Economics, 19: 173-189.
Booth, Alison L., Marco Francesconi and Carlos Garcia-Serrano (1999) "Job tenure and mobility in Britain."Industrial and Labor Relations Review, 53(1): 43-70.
Burdett, Kenneth (1978) "A theory of employee job search and quit rates." American Economic Review,68(1): 212-220.
Chamberlain, Gary (1985) "Heterogeneity, omitted variables, and duration dependence." in James J. Heck-man and Burton Singer (editors). Longitudinal Analysis of Labor Market Data. Cambrifge UniversityPress, Cambridge. 3-38.
Chan, William (1996) "External recruitment versus internal promotion." Journal of Labor Economics,14(4): 555-570.
Eriksson, Göran (1991) "Human capital investments and labor mobility." Journal of Labor Economics,9(3): 236-254.
Fairburn, James A. and James M. Malcomson (2001) "Performance, promotion and the Peter principle."Review of Economic Studies, 68:45-66.
Farber, Henry S. (1994) "The analysis of inter�rm worker mobility." Journal of Labor Economics, 12(4):554-593.
Francesconi, Marco (2001) "Determinants and consequences of promotions in Britain." Oxford Bulletin ofEconomics and Statistics, 63(3): 279-310.
Johnson, William R. (1978) "A theory of job shopping." Quarterly Journal of Economics, 92(2): 261-278.
Jones, David R. and Gerald H. Makepeace (1996) "Equal worth, equal opportunities: pay and promotionin an internal labour market." Economic Journal, 106 (March): 401-409.
Jovanovic, Boyan (1984) "Matching, turnover, and unemployment." Journal of Political Economy, 92(1):108-122.
30
Jovanovic, Boyan (1979a) "Job matching and the theory of turnover." Journal of Political Economy, 87(5):972-990.
Jovanovic, Boyan (1979b) "Firm-speci�c capital and turnover." Journal of Political Economy, 87(6): 1246-1260.
Keith, Kristen and Abagail McWilliams (1999) "The returns to mobility and job search by gender." Indus-trial and Labor Relations Review, 52(3): 460-477.
Klein, John P. and Melvin L. Moeschberger (2003) Survival Analysis: Techniques for Censored andTruncated Data. 2nd Ed. Springer-Verlag, New York.
Lazear, Edward P. (2004) "The Peter principle: a theory of decline." Journal of Political Economy, 112(1):S141-S163.
Lazear, Edward P. and Sherwin Rosen (1990) "Male-female wage di¤erentials in job ladders." Journal ofLabor Economics, 8(1): S106-S123.
Lazear, Edward P. and Sherwin Rosen (1981) "Rank-order tournaments as optimum labor contracts."Journal of Political Economy, 89(5): 841-864.
MacDonald, Glenn M. (1988) "Job mobility in market equilibrium." Review of Economic Studies, 55(1):153-168.
Mata, José and Pedro Portugal (1994) "Life duration of new �rms." Journal of Industrial Economics,42(3):227-245.
McCue, Kristin (1996) "Promotions and wage growth." Journal of Labor Economics, 14(2): 175-209.
Mincer, Jacob and Boyan Jovanovic (1981) "Labor mobility and wages." in Sherwin Rosen (editor), Studiesin Labor Markets. University of Chicago Press, Chicago. 21-63.
Nelson, Wayne (1972) "Theory and applications of hazard plotting for censored failure data." Technomet-rics, 14(4): 945-966.
Nelson, Wayne (1982) Applied Life Data Analysis. Wiley, New York.
Pergamit, Michael R. and Jonathan R. Veum (1999) "What is a promotion?" Industrial and Labor RelationsReview, 52(4): 581-600.
Petersen, Trond (1991) "Time-aggregation bias in continuous-time hazard-rate models." Sociological Method-ology, 21: 263-290.
Pinto, Mário, Pedro F. Martins and António N. de Carvalho (1996) Glossário de Direito do Trabalho eRelações Industriais. Universidade Católica Editora, Lisboa.
Portugal, Ministério do Trabalho e da Segurança Social (1986 to 2000). Quadros de Pessoal. Data inmagnetic media.
31
Rosen, Sherwin (1986) "Prizes and incentives in elimination tournaments." American Economic Review,76(4): 701-715.
Rosenbaum, James E. (1979) "Organizational career mobility: promotion chances in a corporation duringperiods of growth and contraction." American Journal of Sociology, 85(1): 21-48.
Scoones, David and Dan Bernhardt (1998) "Promotion, turnover, and discretionary human capital acqui-sition." Journal of Labor Economics, 16(1): 121-141.
Topel, Robert H. and Michael P. Ward (1992) "Job mobility and the careers of young men." QuarterlyJournal of Economics, 107(2): 439-479.
Sicherman, Nachum and Oded Galor (1990) "A theory of career mobility." Journal of Political Economy,98(1): 169-192
Spiess, C. Katharina, Maria Iacovou, Karen L. Robson and Wilfred Uunk (2004) "Family e¤ects on em-ployment." in Richard Berthoud and Maria Iacovou (editors). Social Europe: Living Standards andWelfare States. Edward Elgar, Cheltenham. 60-98.
Wise, David A. (1975) "Personal attributes, job performance, and probability of promotion." Econometrica,43(5-6): 913-931.
32