Embed Size (px)
Citation preview
Explaining Productivity Variation among Smallholder Maize Farmers in
Tanz ia1
Graduate School of Economics, Faculty of Economics Kyoto University, Japan
an
Elibariki E. MSUYA, Shuji HISANO, and Tatsuhiko NARIU2
1 This paper was presented in the XII World Congress of Rural Sociology of the
International Rural Sociology Association, Goyang, Korea 2008 with the title “An
Analysis of Technical Efficiency of Smallholder Maize Farmers in Tanzania in the
Globalization Era”
2 Correspondence Address: Elibariki E. Msuya, Graduate School of Economics, Kyoto
University, Yoshida Honmachi, Sakyo-ku, 606-8501, Kyoto, Japan. Tel: +81 (0)90 6052
7344. Email: [email protected]; [email protected]
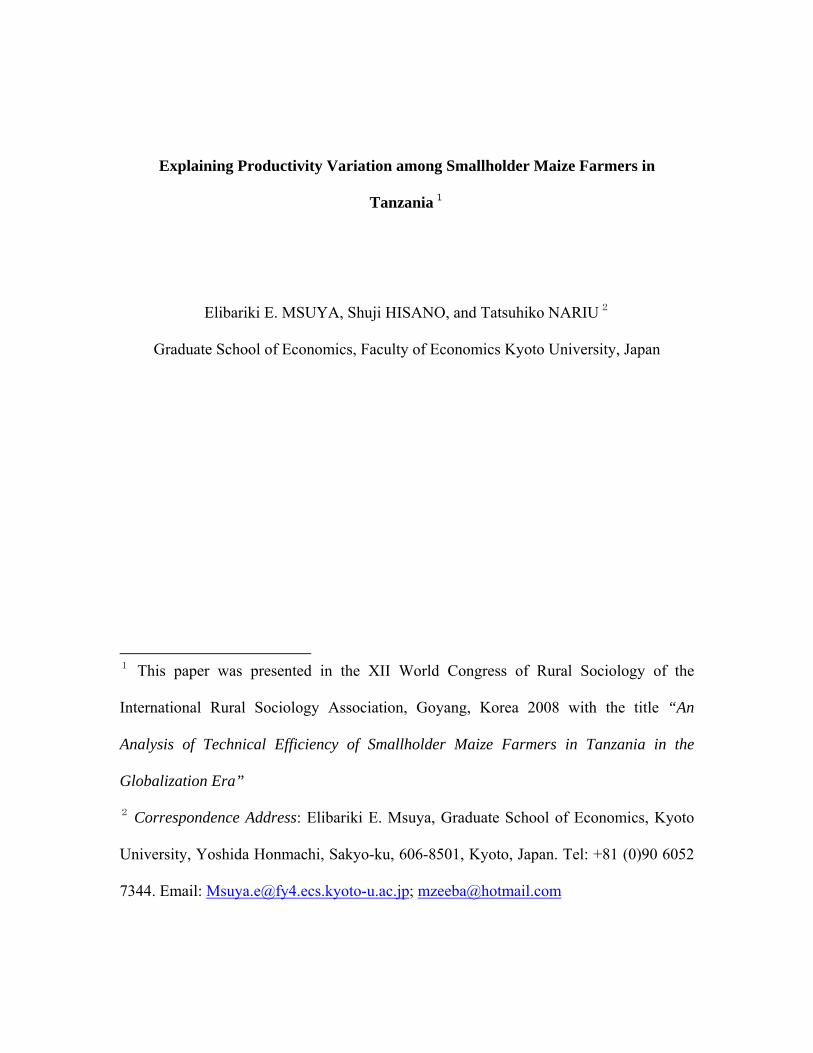
Explaining Productivity Variation among Smallholder Maize Farmers in Tanzania
Abstract
Using a stochastic frontier production model proposed by Battese and Coelli (1995), the
paper estimates the levels of technical efficiency of 233 smallholder maize farmers in
Tanzania and provides an empirical analysis of the determinants of inefficiency with the
aim of finding way to increase smallholders’ maize production and productivity. Results
shows that smallholder productivity is very low and highly variable, ranging form
0.01t/ha to 6.77t/ha, averaging 1.19t/ha. Technical efficiencies of smallholder maize
farmers range from 0.011 to 0.910 with a mean of 0.606. Low levels of education, lack of
extension services, limited capital, land fragmentation, and unavailability and high input
prices are found to have a negative effect on technical efficiency. Smallholder farmers
using hand-hoe and farmers with cash incomes outside their farm holdings (petty
business) are found to more efficient. However, farmers who use agrochemicals are
found to be less efficient. Policy implications drawn from the results include a review of
agricultural policy with regard to renewed public support to revamp the agricultural
extension system, and interventions towards improving market infrastructure in order to
reduce the transaction element in the input and output marketing.
Explaining Productivity Variation among Smallholder Maize Farmers in Tanzania
1. INTRODUCTION
Given the scarcity of livelihood options outside agriculture, smallholder maize farmers in
Tanzania face multiple challenges, which in the short to medium term can be unraveled
by raising productivity1. According to R&AWG (2005) and Msuya (2008), increasing
productivity is crucial for improving the livelihoods of smallholder farmers, who makes
the majority of the rural poor in Tanzania. Msuya (2008: 291) shows that, low
productivity is one of the primary causes of low and unstable value added along the value
chains leading to a stagnant rural economy with persistence of poverty. Hence, increasing
maize productivity is crucial for improving the livelihoods of smallholder farmers in the
country.
Studies carried out by Amani, (2004; 2005); Skarstein, (2005); Isinika et al,
(2003); MAFC, (2006); Nyange and Wobst (2005); and R&AWG, (2005), shows that
smallholder maize productivity in the country is suffering due to the fact that, most
smallholders do not practice high-yield farming methods, and produce mainly for
subsistence. The Poverty and Human Development Report of 2007 (R&AWG, 2007)
showed that 87 percent of Tanzanian farmers interviewed by the research and analysis
group under Tanzania's NSGRP said that they were not using chemical fertilizers; 77
percent said that they were not using improved seeds; 72 percent said that they were not
using pesticides, herbicides or insecticides (agrochemicals), due to the high costs of
agricultural inputs and services. Although studies by Isinika et al (2003) and Skarstein,
1 Improving marketing linkages and upgrading post-harvest systems are also important
1
(2005) among others have gone to length to establish additional factors that are holding
smallholders from achieving their potentials, none of these studies have been able to
address the high variation in productivity among smallholders. According to Ahmad et al
(2002) variations in productivity are due to management factors or in other words
inefficiency gaps. Therefore, in order to accomplish sustained growth in agriculture,
efficiency and productivity differentials have to be reduced. This can be achieved by
having an adequate knowledge and understanding of sources/determinants of the
smallholder farmers’ productivity variations.
Various studies have examined the issues of productivity and technical efficiency
of farmers. However, only a handful of them focus on Sub-Saharan Africa (SSA) and of
these even fewer focus on Tanzania. Of the few studies that have analyzed efficiency in
SSA agriculture include Duvel, Chiche and Steyn (2003); Msuya and Ashimogo (2006);
Shapiro and Muller (1977); Tchale and Sauer (2007); and Seyoum, Battese, and Fleming
(1998) (see Tchale and Sauer (2007) for a longer list). In Tanzania, little empirical work
has been undertaken to quantitatively study the efficiency levels of smallholder farmers
with a purpose of identifying ways of improving their efficiency. While Msuya and
Ashimogo (2006) determined the technical efficiency of smallholder farmers, they
focused on sugarcane production (a cash crop). Shapiro and Muller, (1977) also focused
on a cash crop (cotton). No study which we are aware of have determined the efficiency
of smallholder farmers in Tanzania and focused on a food crop. Therefore, policy
formulation has been hampered by this lack of relevant empirical studies at the farm
level. The policy question therefore is: What is the current level of technical efficiency of
2
smallholder maize farmers in Tanzania and what factors influence this current level of
efficiency?
Given the importance of food crops2 and especially maize3 in Tanzania economy,
the estimation of efficiency will facilitate answering questions on the current farm level
efficiency in smallholder maize production, and factor(s) that are holding back
smallholders from increasing their productivity. An understanding of the relationships
between efficiency, policy indicators and farm-specific practices would provide policy
makers with information to design programmes that can contribute to increasing food
production potential among smallholder farmers, who produce the bulk of the country’s
food. The main objective of this paper is therefore, to analyze maize production systems
in Tanzania, with the aim of finding way to increase production and productivity.
Specifically we estimate the levels of efficiency of Kiteto and Mbozi farmers; provide an
empirical analysis of the determinants of inefficiency by examining the relationship
2 Food production dominates Tanzania’s agriculture economy. It accounts for about 85
percent of over 5 million hectares cultivated per year.
3 Maize is the major and most preferred staple food crop in Tanzania. It accounts for 31
per cent of the total food production and constitutes more than 75 per cent of the cereal
consumption in the country. Maize represents about 30 per cent of the value of crop
production in the country and 10 per cent of total value added in agricultural sector
respectively (Sassi 2004; Amani 2004: 5; and Isinika, Ashimogo and Mlangwa 2003).
3
between efficiency level and various farm- and farmer-specific attributes and; considers
implications for policy and strategies for improving maize production efficiency.
For meaningful results the paper is guided by the following hypotheses: - (i)
Maize smallholder farmers are efficient and have no room for efficient growth; and (ii)
Policy variables and/or socio-economic and demographic variables have no significant
influence on the efficiency of smallholder maize farmers in the study area. The rest of the
paper is organized as follows: The next section presents a short review of technical
efficiency (TE) studies among smallholder farmers as a building block for our
inefficiency model. The analytical framework, data and empirical model are presented in
section 3. The results are discussed in Section 4. Conclusions and the way forward are
presented in Section 5.
2. A BRIEF REVIEW OF TECHNICAL EFFICIENCY STUDIES AMONG
SMALLHOLDER
Technical efficiency is a component of economic efficiency and reflects the
ability of a farmer to maximize output from a given level of inputs (i.e. output-
orientation). One can trace back the beginning of theoretical developments in measuring
(output-oriented) technical efficiency to the works of Debreu (1951 and 1959). Since then
however there is a growing literature on the technical efficiency of smallholder farmers’
agriculture. Notable works focusing on smallholders include Basnayake and Gunaratne
(2002); Barnes (2008); Duvel et al (2003); Shapiro and Muller (1977); and Seyoum et al
(1998). The average technical efficiency of smallholders reported in these studies range
4
between 0.49 among maize farmers in Kenya to 0.76 among Tanzania sugarcane farmers.
This shows smallholder farmers have low and highly variable levels of efficiency
especially in developing countries.
Most studies have associated farmers’ age, farmers’ education, access to
extension, access to credit, agro-ecological zones, land holding size, number of plots
owned, famers’ family size, gender, tenancy, market access, and farmers’ access to
improved technologies such as fertilizer, agrochemicals, tractors and improved seeds
either through the market or public policy interventions with technical efficiency.
Farmers’ age and education, access to extension, access to credit, family size, tenancy,
and farmers’ access to fertilizer, agrochemicals, tractors and improved seeds variables are
reported by many studies as having a positive effect on technical efficiency (Amos 2007;
Ahmad et al 2002; Kibaara 2005; Tchale and Sauer 2007; and Basnayake and Gunaratne
2002).
Although studies by Amos (2007), Raghbendra, Nagarajan and Prasanna (2005),
and Barnes (2008) found the relationship between land holding size and efficiency to be
positive, a clear-cut conclusion on the influence of this variable on efficiency has not
been reached as discussed in Kalaitzadonakes et al (1992) work. On the other hand,
influence of the number of plots on efficiency has been reported by Raghbendra et al
(2005) to be negative. This implies land fragmentation (as measured by number of plots)
have a negative impact on yields. There are conflicting results on the influence of socio-
economic variables such as gender on efficiency. Tchale and Sauer (2007) point out that,
5
while some studies (in Lesotho) report gender of the farmer has no significant influence
on efficiency, other studies found that gender plays an important role.
In our inefficient model discussed in 3.2 below, we do not include all the above
mentioned variables. For example, ‘farmers’ access to market’ is not included in our
model. It is left out due to difficulties associated with smallholder setup in the study area.
About 90% of smallholders in the study area sell their maize at home. However, we have
included other variables we find important in addressing sources of productivity
variability among smallholder farmers. We are assessing the effect of diversification to
off-farm activities on efficiency. Due to lack of formal credit facilities, small businesses
are used by smallholders to raise money which they need as working capital. This might
have a positive effect on efficiency. However, in the long run this practice might not
foster specialization leading to a negative impact on efficiency.
According to Skarstein (2005), R&AWG (2005) and Msuya (2007), producer
associations are very important in transforming the agricultural sector into one with high
productivity and high quality output. While referring to Tanzania, Skarstein (2005: 359)
stress that, if the agriculture sector is to be transformed, producer associations (in form of
farmers’ cooperatives) are needed first and foremost to give the smallholders bargaining
power in the input, output and credit markets. Msuya (2007: 2865) and R&AWG (2005:
89) went a step further and showed integrated producer schemes4 are more suited than
4 An integrated producer scheme is a setup that operates an integrated system that links
production, extension services, transportation, processing and marketing. It has an
6
cooperatives in assisting smallholder farmers to address most of the constraints they face
including low production and productivity. With this in mind we include in the
inefficiency model a variable that take into account involvement of smallholders in
farmer associations. We also include a district dummy variable to account for agro-
ecological and environmental differences between districts, as farming in the study area
is greatly influenced by these factors. This will also ensure we reduce biases as a result of
omitted variable, which leads to over-estimation of technical inefficiency.
3. ANALYTICAL FRAMEWORK, DATA AND EMPIRICAL MODEL
3.1. Analytical Framework
A stochastic frontier production model proposed by Battese and Coelli (1995) in
accordance with the original models of Aigner, Lovell and Schmidt (1977); and Meeusen
and van den Broeck (1977) is applied to cross-sectional data to determine the efficiency
of the maize smallholder in Tanzania. We consider the stochastic frontier approach
because it is capable of capturing measurement error and other statistical noise
influencing the shape and position of the production frontier5. This technique better suit
an agricultural production largely influenced by randomly exogenous shocks as the one
inbuilt supply chain system that allows the realization of value addition for the benefit
of all involved (see Msuya 2007 for an in-depth discussion).
5 Different (deterministic as well as stochastic, parametric as well as non parametric)
techniques to measure relative efficiency are extensively described in the literature, (see
e.g. Battese 1992).
7
found in Tanzania. The technique assumes that farmers may deviate from the frontier not
only because of measurement errors, statistical noise or any non-systematic influence but
also because of technical inefficiency.
Although today the model has been improved to account for panel data, the model
was originally developed to handle cross-sectional data. In Tanzania, Mbelle and Sterner,
(1991) applied the model to analyze the importance of foreign exchange in industries.
Other notable studies include those of Tyler and Lee, (1979); Battese and Coelli (1995);
Taylor and Shonkwiler, (1986); Munroe, (2001); and Raghbendra et al (2005). [See
Battese, (1992: 194-204); Ahmad, et al (2002: 644-645) for a detailed review of the
empirical application of the model]. Stochastic frontier production functions can be
estimated using either the maximum likelihood method or using a variant of the COLS
(corrected ordinary least squares) method suggested by Richmond (1974). But here we
will consider the maximum likelihood method because availability of software such as
the Frontier 4.1 Programme (Coelli, 1996) which has automated the maximum likelihood
method.
3.2. Model Specification
Battese and Coelli (1995) proposed a stochastic frontier production function,
which has firm effects assumed to be distributed as a truncated normal random variable,
in which the inefficiency effects are directly influenced by a number of variables. Given
our objectives we apply a Cobb-Douglas production function and the stochastic frontier is
thus expressed as:
8
ln (maize) = β0 + β1 ln (Falabour) + β2 ln (Hilabour) + β3 ln (Land)
+ β4 ln (Material) + Vi - Ui (1)
Where:
ln Denotes Natural logarithms;
Maize Total amount of maize harvested (2006/07 season) expressed in tons;
Falabour Family labour utilized in various farm activities expressed in man-day6
equivalents;
Hilabour Hired labour utilized in various farm activities expressed in man-day
equivalents;
Land Land area under maize cultivation in the 2006/07 season expressed in
hectares;
Material Expenditures on intermediate materials (seeds, fertilizer, agrochemicals,
fuel, hiring tractor and ox-plough) expressed in Tanzanian shillings7;
βi’s Unknown parameters to be estimated;
Vi Represents independently and identically distributed random errors N (0,
v2). These are factors outside the control of the smallholder; and
6 Number of labourers * hrs/day * No. days
7 It was difficult to collect information about fertilizer, seeds and agrochemicals in terms
of exact amounts used. Most farmers could precisely remember the cost they incurred
but not the exact amount applied due to many plots and varied amount of inputs
purchased depending on money availability.
9
Ui Represents non-negative random variables which are independently and
identically distributed as N (0, u2) i.e. the distribution of Ui is half
normal. Ui > 0 reflects the technical efficiency relative to the frontier
production function. Ui = 0 for a farm whose production lies on the
frontier and Ui > 0 for a farm whose production lies below the frontier.
The focus of this analysis is to provide an empirical analysis of the determinants of
productivity variability/inefficiency gaps among smallholder maize farmers in Tanzania.
Hence knowing that farmers are technically inefficient might not be useful unless the
sources of the inefficiency are identified. Thus, in the second stage of this analysis we
investigate farm- and farmer-specific attributes that have impact on smallholders’
technical efficiency. The inefficiency function can be written as:
Ui = 0 + 1 Age + 2 Mbozi + 3 Noforma + 4 Seceduc + 5 Primeduc
+ 6 Useinfer + 7 Useinsec + 8 Smalbusi + 9 Hhsize + 10 Bohiland
+ 11 Plonumber + 12 Distplot + 13 Hanhoe + 14 Traseva + 15 Nocoext
+ 16 Farmorga +17 Maizlan + 18 Gender + 19 Credito + Wi. (2)
Where:
Age Age of the farmer;
Mbozi Dummy variable for districts, assuming a value of 1 if the farm is
located in Mbozi district and 0 if otherwise;
Noforma Dummy variable for smallholder level of education, assuming a value of
1 if the farmer has no formal education and 0 if otherwise;
10
Seceduc Dummy variable for smallholder level of education, assuming a value of
1 if the farmer has secondary level education and 0 if otherwise;
Primeduc Dummy variable for smallholder level of education, assuming a value of
1 if the farmer has primary level education and 0 if otherwise;
Useinfer Dummy variable showing value of 1 if the smallholder indicated to have
used fertilizers, otherwise zero;
Useinsec Dummy variable showing value of 1 if the smallholder indicated to have
used agrochemicals, otherwise zero;
Smalbusi Dummy variable showing value of 1 if the smallholder owned a small
business as addition source of income, otherwise zero;
Hhsize Household size, (number of people staying together and utilizing scare
resources together)
Bohiland Dummy variable showing value of 1 if the smallholder hired or bought
the land under cultivation, otherwise zero;
Plonumber Measure land fragmentation (number of plots owned by smallholder
under maize cultivation);
Distplot Distance to the plots from homestead expressed in Km;
Hanhoe Dummy variable showing value of 1 if the smallholder indicated to have
used a hand hoe, otherwise zero;
Traseva Dummy variable showing value of 1 if the smallholder indicated to have
used traditional maize seed variety, otherwise zero;
11
Nocoext Dummy variable showing value of 1 if the smallholder indicated has
never had contact with extension officers, otherwise zero;
Farmorga Dummy variable showing value of 1 if the smallholder is a member to
any farmer organization/association, otherwise zero;
Maizlan Land area under maize cultivation in the 2006/07 season expressed in
hectares;
Gender Dummy variable showing value of 1 if the smallholder is a male,
otherwise zero;
Credito Dummy variable showing value of 1 if the smallholder has obtained any
form of agricultural input credit, otherwise zero;
Wi An error term that follows a truncated normal distribution; and
i’s Inefficiency parameters to be estimated.
The C-D production frontier function defined by equation (1) and the inefficiency model
defined by equation (1) are jointly estimated by the maximum-likelihood (ML) method
using FRONTIER 4.1 (Coelli 1996). The FRONTIER software uses a three-step
estimation method to obtain the final maximum-likelihood estimates. First, estimates of
the -parameters are obtained by OLS. A two-phase grid search for γ is conducted in the
second step with -estimates set to the OLS values and other parameters set to zero. The
third step involves an iterative procedure, using the Davidon-Fletcher-Powell Quasi-
Newton method to obtain final maximum-likelihood estimates with the values selected in
the grid search as starting values.
12
3.3. The Data
This study uses data from a Tanzania Maize Value Chain Analysis Survey
conducted by the research team (December 2007 – March 2008). The survey covered two
regions (Mbeya and Manyara) out of five major maize producing regions in the country.
One district each (Kiteto and Mbozi) was selected from Manyara and Mbeya regions
respectively. These districts were selected based on their agricultural potential,
accessibility, agronomic practices and high levels of maize production. Four villages
from each district and 30 farmers per village were randomly selected for detailed
interview. A PRA including key stakeholders in each village was conducted for an in-
depth understanding of variables used in the two models. The overall sample thus was
240 respondents from the two districts. Out of this sample, about 7 cases were found
deficient in displaying reliable farm level information. From the remaining sample (233),
115 and 118 smallholders maize farmers were from Kiteto and Mbozi districts
respectively.
4. RESULTS AND DISCUSSION
4.1. Hypothesis Testing and Model Robustness
Before proceeding to examine the parameter estimates of the production frontier
and the factors that affect the efficiency of the smallholder maize farmers, we investigate
the validity of the model used for the analysis. These various tests of null hypotheses for
the parameters in the frontier production functions and in the inefficiency models are
performed using the generalized likelihood-ratio test statistic defined by: = -2 {log [L
13
(H0) – log [L (H1)]}, where L (H0) and L (H1) denote the values of the likelihood function
under the null (H0) and alternative (H1) hypotheses, respectively. If the null hypothesis is
true, the LR test statistic has an approximately a chi-square or a mixed chi-square
distribution with degrees of freedom equal to the difference between the number of
parameters in the unrestricted and restricted models.
First we tested the null hypothesis H0: γ=δ0=δ1=…= δ19=0, which specifies that
the technical inefficiency effects are not present in the model i.e. smallholder maize
farmers are efficient and have no room for efficiency growth. The hypothesis is rejected
as gamma parameter (Table 2) is 0.96 and significant at 5 percent probability level, which
means about 96 per cent of the disturbance term is due to inefficiency. Thus the inclusion
of the technical inefficiency term is a significant addition to our model. In addition, a
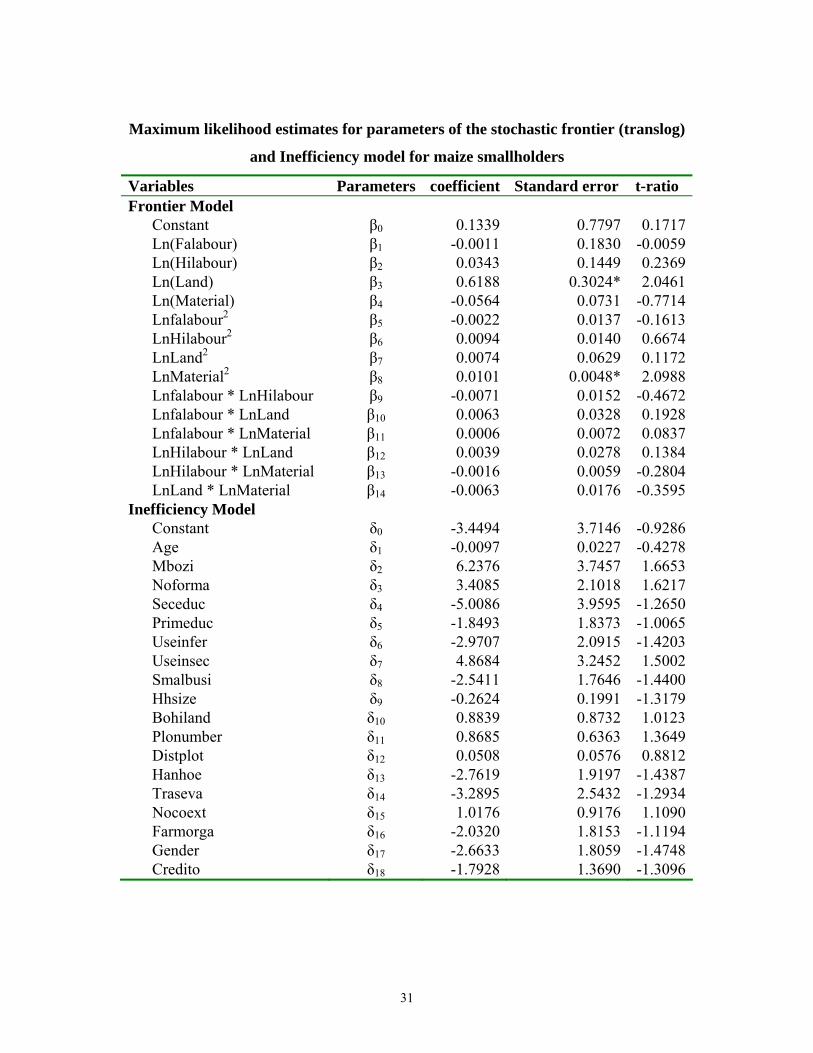
stochastic translog production frontier is estimated as a test of robustness in the choice of
functional form. The form of this model encompasses the Cobb-Douglas form, so test of
preference for one form over the other can be undertaken by analyzing significance of
cross terms in the translog form. The ML estimates of the translog production frontier are
given in Appendix. Only coefficient of land and material square shows significant effect
on output. But the coefficient of material; product of family and hired labour; product of
land and material; and product of hired labour and material are negative. Only one of the
parameters in the inefficiency model showed significant effect on inefficiency
(Appendix). Furthermore, all cross products have t-values less than one or close to zero.
This suggests that there are no interactions amongst the variables. Robustness of the
estimated models can also be indicated by the value of the log-likelihood function. The
14
model that best fits the data is the one with a higher log-likelihood function. The values
of the log-likelihood function for the estimated models are -259.76 and -263.28 for C-D
model and translog model respectively. Given that the C–D frontier model best fits the
data we conclude it to be more appropriate than translog model specification. The results
discussed below (4.2 & 4.3) are only those of the C-D frontier model.
The second null hypothesis which is tested is H0: δ1=…= δ19=0 implying that the
farm-level technical inefficiencies are not affected by the farm- /farmer-oriented
variables, policy variables and/or socio-economic variables included in the inefficiency
model. This hypothesis is also rejected, implying the variables present in the inefficiency
model have collectively significant contribution in explaining technical inefficiency
effects for the maize farmers. The results of a likelihood ratio test (LR = 68.39) confirms
that smallholders’ low and variable productivity predominantly relate to the variance in
farm management (efficient use of available resource).
4.2. Production Frontier and Technical Efficiency Estimates
Table 1 shows the results of both the OLS and MLE estimates. In total 25
parameters were estimated in the stochastic production frontier model including 5 in the
C-D production frontier model, and 20 in the inefficiency model. Out of the 25
parameters estimated, 14 are statistically significant. Eight are significant at five percent
level while the remaining 6 are significant at ten percent level.
Coefficients for land, intermediate materials (material) and hired labour
(Hilabour) have expected positive signs and are all significant at five percent level. Land
15
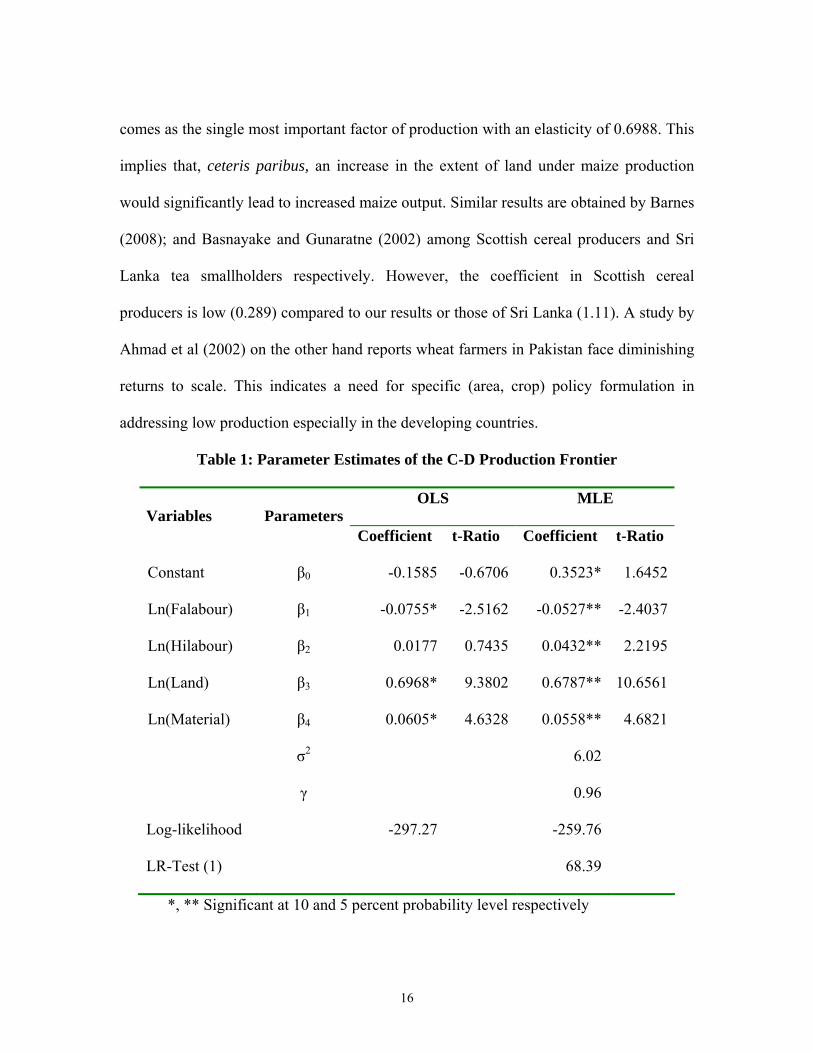
comes as the single most important factor of production with an elasticity of 0.6988. This
implies that, ceteris paribus, an increase in the extent of land under maize production
would significantly lead to increased maize output. Similar results are obtained by Barnes
(2008); and Basnayake and Gunaratne (2002) among Scottish cereal producers and Sri
Lanka tea smallholders respectively. However, the coefficient in Scottish cereal
producers is low (0.289) compared to our results or those of Sri Lanka (1.11). A study by
Ahmad et al (2002) on the other hand reports wheat farmers in Pakistan face diminishing
returns to scale. This indicates a need for specific (area, crop) policy formulation in
addressing low production especially in the developing countries.
Table 1: Parameter Estimates of the C-D Production Frontier
OLS MLE Variables Parameters
Coefficient t-Ratio Coefficient t-Ratio
Constant β0 -0.1585 -0.6706 0.3523* 1.6452
Ln(Falabour) β1 -0.0755* -2.5162 -0.0527** -2.4037
Ln(Hilabour) β2 0.0177 0.7435 0.0432** 2.2195
Ln(Land) β3 0.6968* 9.3802 0.6787** 10.6561
Ln(Material) β4 0.0605* 4.6328 0.0558** 4.6821
σ2 6.02
γ 0.96
Log-likelihood -297.27 -259.76
LR-Test (1) 68.39
*, ** Significant at 10 and 5 percent probability level respectively
16
Similarly increase of hired labour and use of intermediate materials will
significantly and positively increase smallholders maize output. The coefficient for
family labour showed a negative significant value of 0.0522. Most studies reviewed did
not decompose the labour variable into family and hired labour, with exception of
Basnayake and Gunaratne (2002), who reports positive and significant effect of both
family and hired labour on yield. Our result indicates too many family members and or
too much time is spent in the maize production process. This might be due to limited
opportunities for income generating activities outside agriculture especially in rural areas.
Hence, this calls for better utilization of available human resource in rural areas by
creating alternative activities (through agricultural based industries).
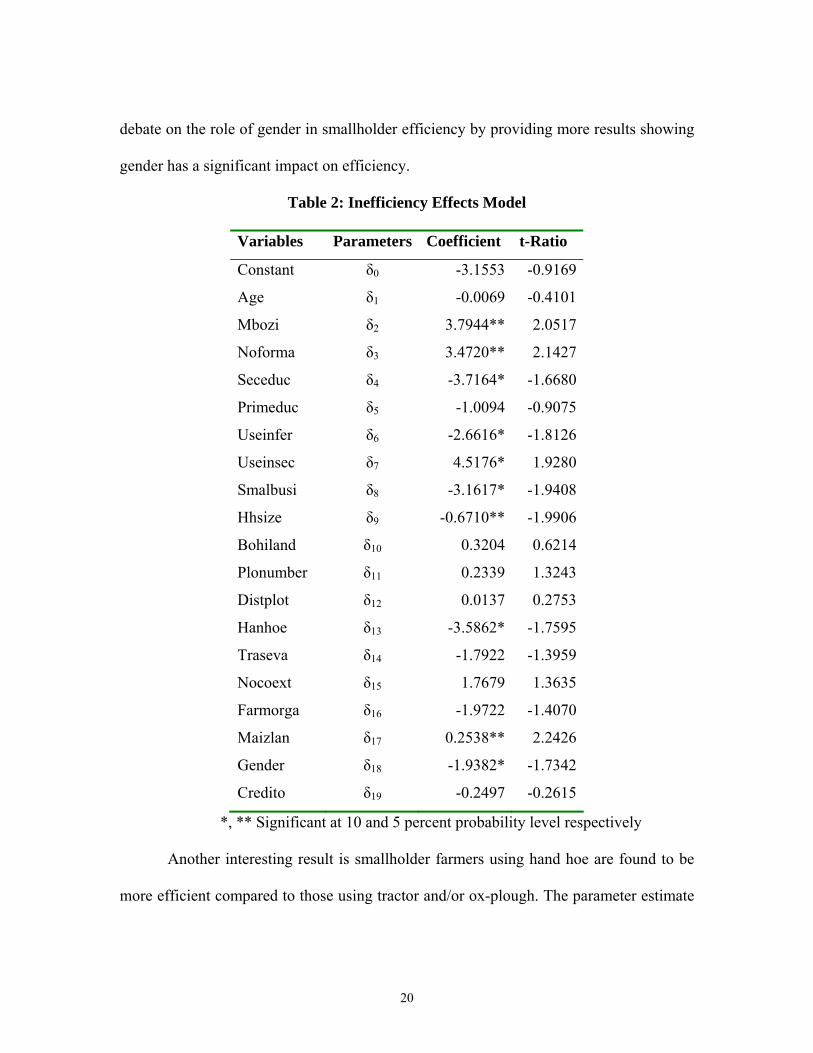
4.3. Determinants of Inefficiency
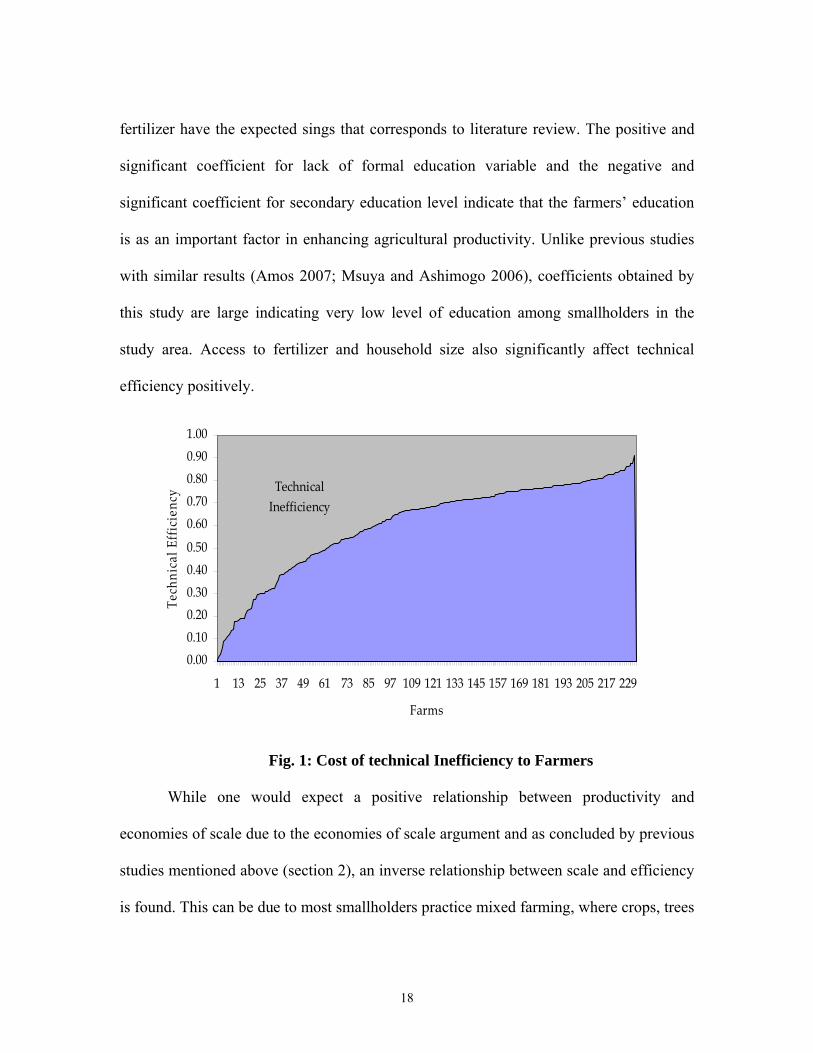
The estimated coefficients in the inefficiency model (2) are presented in Table 2.
The technical efficiencies of smallholder maize farmers ranged from 0.011 to 0.910 with
a mean of 0.606. In other words, on average smallholder maize farmers in the study area
incur about 40 percent loss in output due to technical inefficiency (Fig. 1). This implies
that on average output can be increased by at least 40% while utilizing existing resources
and technology given the inefficiency factors are fully addressed.
It is should be noted that in the inefficiency model (Table 2), variables are
included as inefficiency variables; thus a negative coefficient means an increase in
efficiency and a positive effect on productivity. The coefficients for farmers’ age,
education, access to extension services, access to credit, family size and access to
17
fertilizer have the expected sings that corresponds to literature review. The positive and
significant coefficient for lack of formal education variable and the negative and
significant coefficient for secondary education level indicate that the farmers’ education
is as an important factor in enhancing agricultural productivity. Unlike previous studies
with similar results (Amos 2007; Msuya and Ashimogo 2006), coefficients obtained by
this study are large indicating very low level of education among smallholders in the
study area. Access to fertilizer and household size also significantly affect technical
efficiency positively.
Technical Inefficiency
0.00
0.10
0.20
0.30
0.40
0.50
0.60
0.70
0.80
0.90
1.00
1 13 25 37 49 61 73 85 97 109 121 133 145 157 169 181 193 205 217 229
Farms
Tech
nica
l Eff
icie
ncy
Fig. 1: Cost of technical Inefficiency to Farmers
While one would expect a positive relationship between productivity and
economies of scale due to the economies of scale argument and as concluded by previous
studies mentioned above (section 2), an inverse relationship between scale and efficiency
is found. This can be due to most smallholders practice mixed farming, where crops, trees
18
and livestock are all mixed together in an integrated pattern. This kind of farming is
intense and needs close management, if the farmer is to succeed at all. Battered with
financial hardships, which makes it difficult to acquire more efficient technologies and or
hire labor, the smaller the farm the easier it is for the smallholder to manage well. This
agrees with what Peterson (1997) found while studying the effects of farm size on
efficiency in ten Corn Belt states in USA. He found that;
“…Small family and part-time farms are at least as efficient as larger
commercial operations”….
He also pointed out there was evidences of diseconomies of scale as farm size increases.
Therefore, in order to increase production and productivity, further research on the
appropriate farm size that will enable smallholders to produce maize more efficiently and
not take for granted “bigger is better” is highly recommended. Other variables affecting
efficiency negatively included number of land plots owned by the smallholder, distance
of the plots from homestead and tenancy, implying farm efficiency and thus productivity
would significantly increases with consolidation of farm plots to appropriate size that
farmers can manage. Consolidation of smallholders’ rice farms in the northern part of the
country has shown positive results.
Results on gender variable show male farmers to be more efficient. Kibaara
(2005) found similar results among maize smallholders in Kenya. However, it should be
noted that previous studies as reports by Tchale and Sauer (2007) had found gender to
have no significant impact on efficiency. Hence this paper contributes to the on going
19
debate on the role of gender in smallholder efficiency by providing more results showing
gender has a significant impact on efficiency.
Table 2: Inefficiency Effects Model
Variables Parameters Coefficient t-Ratio
Constant δ0 -3.1553 -0.9169
Age δ1 -0.0069 -0.4101
Mbozi δ2 3.7944** 2.0517
Noforma δ3 3.4720** 2.1427
Seceduc δ4 -3.7164* -1.6680
Primeduc δ5 -1.0094 -0.9075
Useinfer δ6 -2.6616* -1.8126
Useinsec δ7 4.5176* 1.9280
Smalbusi δ8 -3.1617* -1.9408
Hhsize δ9 -0.6710** -1.9906
Bohiland δ10 0.3204 0.6214
Plonumber δ11 0.2339 1.3243
Distplot δ12 0.0137 0.2753
Hanhoe δ13 -3.5862* -1.7595
Traseva δ14 -1.7922 -1.3959
Nocoext δ15 1.7679 1.3635
Farmorga δ16 -1.9722 -1.4070
Maizlan δ17 0.2538** 2.2426
Gender δ18 -1.9382* -1.7342
Credito δ19 -0.2497 -0.2615
*, ** Significant at 10 and 5 percent probability level respectively
Another interesting result is smallholder farmers using hand hoe are found to be
more efficient compared to those using tractor and/or ox-plough. The parameter estimate
20
of means of cultivation variable (hanhoe) is negative and significant at 10 percent level.
The current government agriculture policy pushes farmers toward usage of tractors and
ox-plough, indicating a mismatch between policies and realities at the farm level. The
result obtained could be explained by the fact that, small and fragmented land holdings
make it difficult to attain economies of scale for smallholders using tractors. This implies
given the current landholdings and smallholder’s resource base, investment in highly
mechanized agriculture might not necessarily translate to high productivity.
The coefficient for use of agrochemicals variable is positive and statistically
significant. This implies that, farmers who use agrochemicals are less efficient compared
to farmers who do not spray their farms. This is an interesting result. It can be explained
by the fact that, as few smallholder farmers can afford to purchase agrochemicals it
means only a handful uses them. Thus, when there is an outbreak of pests or harmful
insects smallholders who can spray their farms are still surrounded by many who cannot
afford to spray, making the whole exercise ineffective. According to Baffes (2002), many
smallholders apply their sprays at the wrong time, using wrong ratios and sometimes with
inappropriate chemicals. All of these indicate that, although there are few smallholders
using agrochemicals, they are doing so in a manner that negatively affects their
productivity. This calls for consideration of alternative pest control mechanism such as
Integrated Pest Management (IPM). IPM is an effective and environmentally sensitive
approach to manage pest damage by the most economical means, and with the least
possible hazard to people, property, and the environment. This technique is not expensive
compared to agrochemicals and uses farmers’ local knowledge to combat pests. Hence if
21
planned, promoted and executed well farmers would reduce there cost of production,
increase output due to reduced losses and thus productivity.
Farmers with cash incomes outside their holdings, such as in petty trade, are
found to be more efficient. The estimated coefficient for running a small business
variable is negative and statistically significant at 5 percent level. In the long run too
much diversification to off-farm activities does not foster specialization leading
inefficiency. Of the two groups of smallholders, Mbozi smallholder farmers are found to
engage themselves more in off-farm activities. This might explain why they are found to
be less inefficient compared to counterparts in Kiteto district. The coefficient of a
variable accounting for district (Mbozi) is positive and statistically significant.
Although not statistically significant, the estimated parameter for farmers’
association variable is negative implying a positive effect on productivity. This result
agrees with above discussion which show it is important for smallholders to be well
organized to have a chance to increase production and productivity.
5. CONCLUSION AND THE WAY FORWARD
The primary objective of this paper is to analyze determinants of productivity
variability in smallholder maize production system in Tanzania. This is achieved by
determining the efficiency of smallholder maize farmers and identifying the determinants
of inefficiency. The paper used a stochastic frontier model, employing cross sectional
data covering randomly sampled 233 smallholder maize farmers in two Regions. The
results obtained from the stochastic frontier estimation show that inefficiency is present
22
in maize production among smallholders. Sufficient evidence of positive relationship
between maize productivity and higher use of intermediate materials such as use fertilizer
and seed is present. The results of efficiency analysis show that smallholder farmers are
not only producing at a lower level but are also operating relatively farther from the
production frontier. Thus there is considerable scope to expand output and also
productivity by increasing production efficiency at the relatively inefficient farms and
sustaining the efficiency of those operating at or closer to the frontier.
Given technical efficiency is positively associated with level of education, use of
inorganic fertilizer, household size, engaging in small business, and usage of hand hoe,
policies targeting these variables among others might have a positive impact on
smallholders’ maize production and productivity. The results also show that the
smallholders have varying levels of technical efficiencies across farms, and across
districts.
Above discussed results indicate that improvement in provision of agricultural
credit (to detour smallholders from off-farm activities) along with extension services are
likely to lead to improved smallholder technical efficiency. However, given the
escalating prices of inorganic fertilizers (taking the bigger share of the agriculture sector
budget), alternatives such as integrated soil fertility management which reduces the
effective costs of soil fertility management options are recommended.
Other policy implications drawn from the results include a review of agricultural
policy with regard to renewed public support to revamp the agricultural extension system,
which has been neglected since the mid 1990s. For all these to take place, it is high time
23

that agriculture sector receive due attention and input from the government so as to
advance the country’s objectives of growth and poverty reduction.
24
REFERENCES:
Aigner, D. J., Lovell, C. A. K. and Schmidt, P. 1977. ' Formulation and estimation of
stochastic frontier production function models', Journal of Econometrics 6: 21-37.
Ahmad, Munir, Chaudhry, Ghulam Mustafa and Iqbal, Muhammad. 2002., Wheat
Productivity, Efficiency, and Sustainability: A Stochastic Production Frontier
Analysis. The Pakistan Development Review 41:4 Part II (Winter 2002) pp. 643–
663
Amani, H. K. R. 2004. “Agricultural Development and Food Security in Sub-Saharan
Africa Tanzania Country Report” http://www.fao.org/tc/Tca/work05/Tanzania.pdf
------. 2005. “Making Agriculture Impact on Poverty in Tanzania: The Case on Non-
Traditional Export Crops”. Presented at a Policy Dialogue for Accelerating
Growth and Poverty Reduction in Tanzania, ESRF, Dar es Salaam
http://www.tzonline.org/
Ammon Mbelle and Thomas Sterner. 1991. Foreign Exchange and Industrial
Development: A Frontier Production Function Analysis of Two Tanzanian
Industries World Development, Vol. 19, No. 4, pp. 341-347
Amos T. T. 2007. ‘An Analysis of Productivity and Technical Efficiency of Smallholder
Cocoa Farmers in Nigeria’, Journal of Social Science, 15(2): 127 - 133
Baffes, J. 2002. “Tanzania’s Cotton Sector: Constraints and Challenges in a Global
Environment”, Africa Region Working Paper Series No. 42
Barnes Andrew. 2008. ‘Technical Efficiency Estimates of Scottish Agriculture: A Note’,
Journal of Agricultural Economics, Vol. 59, No. 2, 370–376
25
Basnayake, B. M. J. K., and Gunaratne, L. H. P. 2002. ‘Estimation of Technical
Efficiency and It’s Determinants in the Tea Small Holding Sector in the Mid
Country Wet Zone of Sri Lanka’, Sri Lanka Journal of Agricultural Economics 4:
137-150.
Battese, G. E. 1992. ‘Frontier Production Functions and Technical Efficiency: A Survey
of Empirical Applications in Agricultural Economics’, Agricultural Economics, 7:
185–208.
Battese, G. E. and Coelli, T. J. 1995. ‘A model for technical inefficiency effects in a
stochastic frontier production function for panel data’, Empirical Economics 20:
325-332.
Coelli, T. J. 1996. A Guide To Frontier Version 4.1 A Computer Program For Stochastic
Frontier Production And Cost Function Estimation. CEPA Working Papers,
96/07, University of New England, Australia. 135pp.
Debreu G. 1951. ‘The coefficient of resource utilization, Econometrica, 19(3), pp. 273-
292.
------. 1959. ‘Theory of Value, New York, Wiley.
Duvel G. H., Chiche Y., and Steyn G. J. 2003. ‘Maize production efficiency in the Arsi
Negele farming zone of Ethiopia: a gender perspective’, South African Journal of
Agricultural Extension Vol.32: 60-72
Isinika A., Ashimogo G., and Mlangwa J. 2003. AFRINT Country Report – “Africa in
Transition: Macro Study Tanzania”, Dept of Agricultural Economics and
Agribusiness, Sokoine University of Agriculture, Morogoro
26
Kalaitzadonakes N.G.,Wu S. and Ma J.C. 1992. ‘The relationship between technical
efficiency and firm size revisited, Canadian Journal of Agricultural Economics,
40, pp. 427-442.
Kibaara B. W. 2005. ‘Technical Efficiency in Kenyan’s Maize Production: An
Application of the Stochastic Frontier Approach’, Colorado State University,
USA
MAFC. 2006. Kilimo website http://www.kilimo.go.tz/Agr-Industry/Crops-grown-tz.htm
Meeusen, W. and Van den Broeck, J. 1977. ‘Efficiency Estimation from Cobb-Douglas
Production Function with Composed Error’, International Economic Review 18:
435-444.
Msuya, E. E. and Ashimogo, G. C. 2006. “An estimation of technical efficiency in
Tanzanian sugarcane production: A case study of Mtibwa sugar company
outgrower’s scheme”. Journal of economic development Vol. (1) Mzumbe
University, Tanzania
Msuya, E. E. 2007. ‘Analysis of Factors Contributing to Low FDI in the Agriculture
Sector in Tanzania’, Proceedings of the 10th International Conference of the
Society for Global Business and Economic Development (SGBED), Vol. IV, pp
2846-2865
------. 2008. Reconstructing agro-biotechnologies in Tanzania: smallholder farmers
perspective. In: Reconstructing biotechnologies (Ed. G. Ruivenkamp, S. Hisano,
and J. Jongerden), Wageningen Academic Publishers, 2008.
27
Munroe Darla. 2001. 'Economic Efficiency in Polish Peasant Farming: An International
Perspective', Regional Studies, 35:5, 461 — 471
Nyange, D., and Wobst, P. 2005. “Effects of Strategic Grain Reserve, Trade and Regional
Production on Maize Price Volatility in Tanzania: An ARCH Model Analysis”.
Policy Analysis for Sustainable Agriculture Development (PASAD),
http://www.pasad.uni-bonn.de
Peterson Willis L. 1997. "Are Large Farms More Efficient?" University of Minnesota,
http://ideas.repec.org/p/wop/minnas/9702.html
Raghbendra Jha, Hari K. Nagarajan, and Subbarayan Prasanna. 2005. ‘Land
Fragmentation and its Implications for Productivity: Evidence from Southern
India’, Australia South Asia Research Centre (ASARC) Working Paper 2005/01
R&AWG. 2005. “Poverty and Human Development Report 2005”, Mkuki and Nyota
Publishers, Dar es Salaam
------. 2007. “Poverty and Human Development Report 2007”, Mkuki and Nyota
Publishers, Dar es Salaam
Sassi, M. 2004. “Improving efficiency in the agriculture sector as an answer to
globalization, growth and equity: the case of Tanzania”, Quaderno di ricerca n.4.
Pavia, Italy
Seyoum, E. T., Battese G. E. and Fleming E. M. 1998. ‘Technical Efficiency and
Productivity of Maize Producers in Eastern Ethiopia: A Case Study of Farmers
within and Outside the Sasakawa-Global 2000 Project. Agricultural Economics
19: 341-348.
28
Shapiro K. H. and Muller J. 1977. Sources of technical efficiency: the role of
modernization and information, Econ. Develop. & Cultural Change 25(2)
Skarstein, R. 2005. “Economic Liberalization and Smallholder Productivity in Tanzania;
From Promised Success to Real Failure, 1985–1998, Journal of Agrarian Change,
Vol. 5 (3), 334–362
Taylor G. Timothy and Shonkwller J. Scott. 1986. ‘Alternative Stochastic Specifications
of the Frontier Production Function In the Analysis of Agricultural Credit
Programs and Technical Efficiency’, Journal of Development Economics 21: 149-
160, North-Holland
Tchale Hardwick and Sauer Johannes. 2007. 'The efficiency of maize farming in Malawi:
A bootstrapped translog frontier’, Cahiers d’économie et sociologie rurales, n°
82-83,
Tyler William G. and Lee Lung-Fei. 1979. ‘On Estimating Stochastic Frontier Production
Functions and Average Efficiency: An Empirical Analysis with Columbian Micro
Data’, The Review of Economics and Statistics, Vol. 61, No. 3, pp. 436-438
29
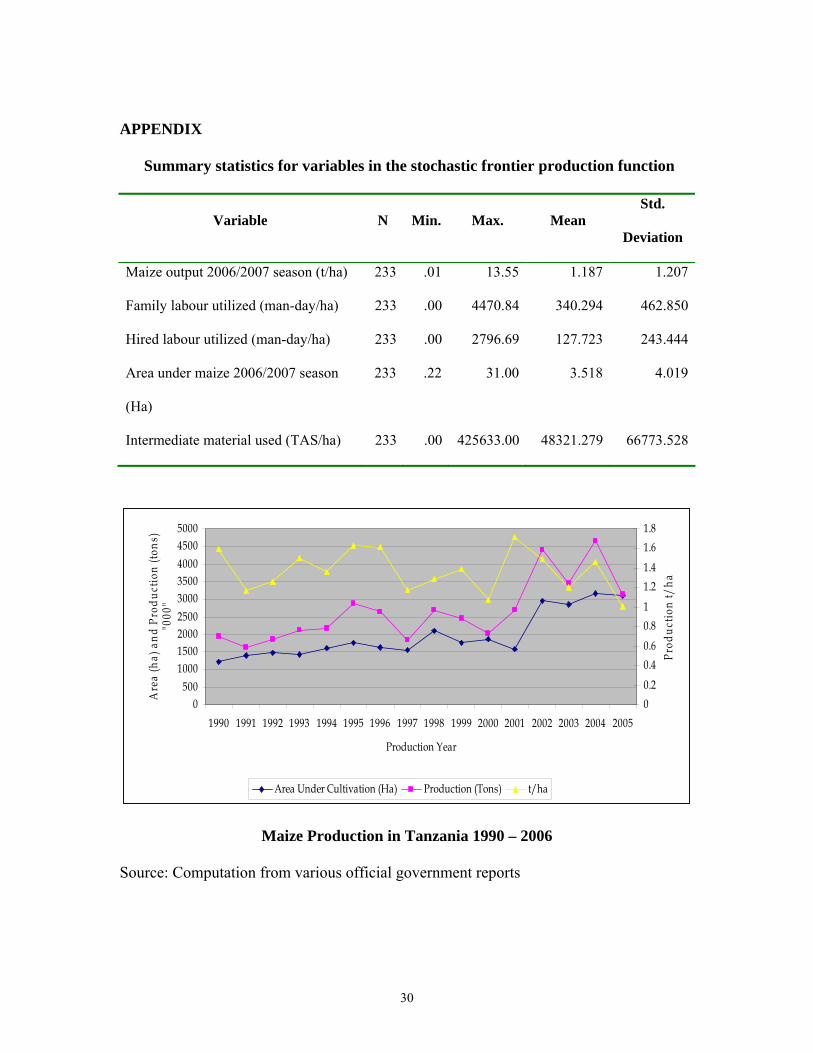
APPENDIX
Summary statistics for variables in the stochastic frontier production function
Variable N Min. Max. Mean Std.
Deviation
Maize output 2006/2007 season (t/ha) 233 .01 13.55 1.187 1.207
Family labour utilized (man-day/ha) 233 .00 4470.84 340.294 462.850
Hired labour utilized (man-day/ha) 233 .00 2796.69 127.723 243.444
Area under maize 2006/2007 season
(Ha)
233 .22 31.00 3.518 4.019
Intermediate material used (TAS/ha) 233 .00 425633.00 48321.279 66773.528
0500
1000150020002500
300035004000
45005000
1990 1991 1992 1993 1994 1995 1996 1997 1998 1999 2000 2001 2002 2003 2004 2005
Production Year
Are
a (h
a) a
nd
Pro
du
ctio
n (t
ons)
"0
00"
0
0.2
0.4
0.6
0.8
1
1.2
1.4
1.6
1.8
Pro
du
ctio
n t/
ha
Area Under Cultivation (Ha) Production (Tons) t/ha
Maize Production in Tanzania 1990 – 2006
Source: Computation from various official government reports
30
31
Maximum likelihood estimates for parameters of the stochastic frontier (translog)
and Inefficiency model for maize smallholders
Variables Parameters coefficient Standard error t-ratio Frontier Model
Constant β0 0.1339 0.7797 0.1717Ln(Falabour) β1 -0.0011 0.1830 -0.0059Ln(Hilabour) β2 0.0343 0.1449 0.2369Ln(Land) β3 0.6188 0.3024* 2.0461Ln(Material) β4 -0.0564 0.0731 -0.7714Lnfalabour2 β5 -0.0022 0.0137 -0.1613LnHilabour2 β6 0.0094 0.0140 0.6674LnLand2 β7 0.0074 0.0629 0.1172LnMaterial2 β8 0.0101 0.0048* 2.0988Lnfalabour * LnHilabour β9 -0.0071 0.0152 -0.4672Lnfalabour * LnLand β10 0.0063 0.0328 0.1928Lnfalabour * LnMaterial β11 0.0006 0.0072 0.0837LnHilabour * LnLand β12 0.0039 0.0278 0.1384LnHilabour * LnMaterial β13 -0.0016 0.0059 -0.2804LnLand * LnMaterial β14 -0.0063 0.0176 -0.3595
Inefficiency Model Constant δ0 -3.4494 3.7146 -0.9286Age δ1 -0.0097 0.0227 -0.4278Mbozi δ2 6.2376 3.7457 1.6653Noforma δ3 3.4085 2.1018 1.6217Seceduc δ4 -5.0086 3.9595 -1.2650Primeduc δ5 -1.8493 1.8373 -1.0065Useinfer δ6 -2.9707 2.0915 -1.4203Useinsec δ7 4.8684 3.2452 1.5002Smalbusi δ8 -2.5411 1.7646 -1.4400Hhsize δ9 -0.2624 0.1991 -1.3179Bohiland δ10 0.8839 0.8732 1.0123Plonumber δ11 0.8685 0.6363 1.3649Distplot δ12 0.0508 0.0576 0.8812Hanhoe δ13 -2.7619 1.9197 -1.4387Traseva δ14 -3.2895 2.5432 -1.2934Nocoext δ15 1.0176 0.9176 1.1090Farmorga δ16 -2.0320 1.8153 -1.1194Gender δ17 -2.6633 1.8059 -1.4748Credito δ18 -1.7928 1.3690 -1.3096