Embed Size (px)
Citation preview
1
Revised Draft June 13, 2015
Explaining Racial Differences in Post-College Aspirations: Evidence from the NLSF
Amanda L. Griffith*
Wake Forest University Department of Economics
Box 7505 Winston Salem, NC 27106
Gary R. Cohen Ronald G. Ehrenberg Cornell University Cornell University Ives Hall 271 Ives Hall Ithaca, NY 14853 Ithaca, NY 14853
Abstract:
As more jobs require advanced degrees beyond a four-year degree, a focus on any disparities in who is obtaining these degrees is warranted. This paper uses the National Longitudinal Survey of Freshmen to investigate the presence of any racial disparities in aspirations for post-graduate study. Our results indicate significant racial differences in graduate aspirations: Black students report a much greater desire to pursue academic post-secondary degrees than others, even though their measured attendance is no different. We argue that this phenomenon may be due in part to those students' aspirations being relatively insensitive to grades. There are also racial differences in intended post-graduate field of study; Black students are less likely to intend to pursue science or engineering fields, and more likely to pursue social sciences and professional degrees.
* Corresponding Author. Email: [email protected]
Our research was supported by a grant from the Andrew W. Mellon Foundation to the Cornell Higher Education Research Institute and we are grateful to the foundation for its support. The conclusions reported here are strictly our own. The National Longitudinal Survey of Freshmen is a restricted access data set and we are unable to share our data with other researchers. Preliminary versions of this paper were presented at the American Education Finance & Policy and Southern Economic Association meetings and we are grateful to our discussants for their helpful comments.
2
I. Introduction & Background
A significant and growing portion of jobs in the U.S. require at least a bachelor’s degree.
However, according to Bureau of Labor Statistics estimates, the highest projected rate of growth is for
jobs requiring a Master’s degree, with a significant increase projected for those requiring a professional
degree as well (BLS, 2012). With this increased demand for graduates with advanced degrees in the
coming years, it is necessary to examine what types of students are pursuing advanced degrees, and
what factors impact on their decision to do so.
The economic literature has found racial differences in both four-year college enrollment and
four-year graduation rates (see for example Black & Sufi, 2002 or Arcidiacono & Koedel, 2014). Given
these racial differences in four-year degree enrollment and completion, it is important to examine
whether there are also racial differences in post-college study as well. While a number of studies have
examined the factors affecting interest in graduate degrees (e.g. Eide et al 1998, Zhang 2004, Bedard
and Herman, 2008), few studies in economics have undertaken in-depth examinations of the way that
race affects graduate aspirations and attendance. In this area, it is apparent that family resources and
behaviors are of prime importance: for example, Perna (2008) finds that Black women are more likely
than White women to enroll in a professional degree program after controlling for financial and
academic resources “as well as measures of cultural and social capital.”
Similarly, despite an ever-growing literature on racial differences in field of study during
college, there is very little research on field of study in graduate school. The college major literature
finds persistent differences in major choice across races. These papers generally show Black students
gravitating away from Science, Technology, Engineering and Mathematics (STEM) fields, and towards
social sciences and the humanities (see for example Arcidiacono, Aucejo, and Spenner, 2012). Some of
these differences in major field have been linked to differences in responses to grades, which may or
may not play the same role when students are considering field of study for graduate school (Rask &
Tiefenthaler, 2008; Griffith, 2010; Ost, 2010; Rask, 2010). Therefore, studying the factors influencing
post-graduate field of study is an important addition to the literature.
This paper seeks to begin filling this hole in the literature by utilizing the National Longitudinal
Study of Freshmen to examine the factors that influence students’ aspirations to attend graduate school,
as well as their decision to enter graduate school post-college. We focus on racial differences, and what
factors, if any, can explain the racial disparities that we find. Our results indicate that Black students are
3
significantly more likely to aspire to a graduate degree at all points during college, but are not any more
likely to have concrete plans to attend graduate school after receiving their four-year degree. It appears
that the higher aspirations of Black students may be partly driven by less of a response to grades
received in college. Similar to the literature on field of study during college, Black students are more
likely than White students to indicate an interest in a social science or professional degree than are
White students, but there are no significant differences in probability of pursuing a science or
engineering post-graduate degree. This paper proceeds as follows: in the second section we present the
data and empirical methods. In the third section we report our results and finally, in the fourth section
we conclude.
II. Data & Methods
To examine the factors influencing post-graduate study, we use the National Longitudinal
Survey of Freshmen (NLSF). The NLSF surveyed roughly 4,000 students entering 28 selective
colleges and universities in the fall of 19991. This initial survey was followed up with subsequent
waves each spring through the spring of 2003. These waves are then supplemented with information
from the National Student Clearinghouse to indicate whether each student in the sample graduated with
a four-year degree.
Background characteristics including race, gender, high school grades and test scores, parental
income and education and initial interest in college field of study are drawn from the first wave in
19992. In each following wave, respondents were asked whether they intended or hoped to attend
graduate schools. In the first year, all types of graduate degrees are lumped together in one category
and students are also asked how likely they think they are to pursue a graduate degree. In following
years post-graduate degrees are separated into either Master’s versus all other doctoral/professional
degrees, or further separated to Master’s, MD, or PhD and other professional degrees. Additionally, in
the final year, students are asked to report what field of study they will be pursuing in graduate school,
and whether they are enrolled for the upcoming year.
1 These 28 institutions are Barnard, Bryn Mawr, Columbia, Denison, Emory, Georgetown, Howard, Kenyon, Miami University of Ohio, Northwestern, Oberlin, Pennsylvania State University, Princeton, Rice, Smith, Stanford, Swarthmore, Tufts, Tulane, University of California Berkeley, University of Michigan, University of North Carolina at Chapel Hill, University of Notre Dame, University of Pennsylvania, Washington University in St. Louis, Wesleyan, Williams, and Yale. 2 Grades received in college are taken from self-reported grades collected in each wave. Massey et al (2003) compare self-reported grades to student transcripts for a subset of the NLSF and find virtually no difference between the self-reported and actual grades.

4
These data are matched by us to school spending data from the Integrated Post-Secondary
Education Dataset (IPEDS). We include measures of spending in the fall of 1999 in the four main
educational categories in full-time student equivalencies: instruction, student services, academic
support, and research.
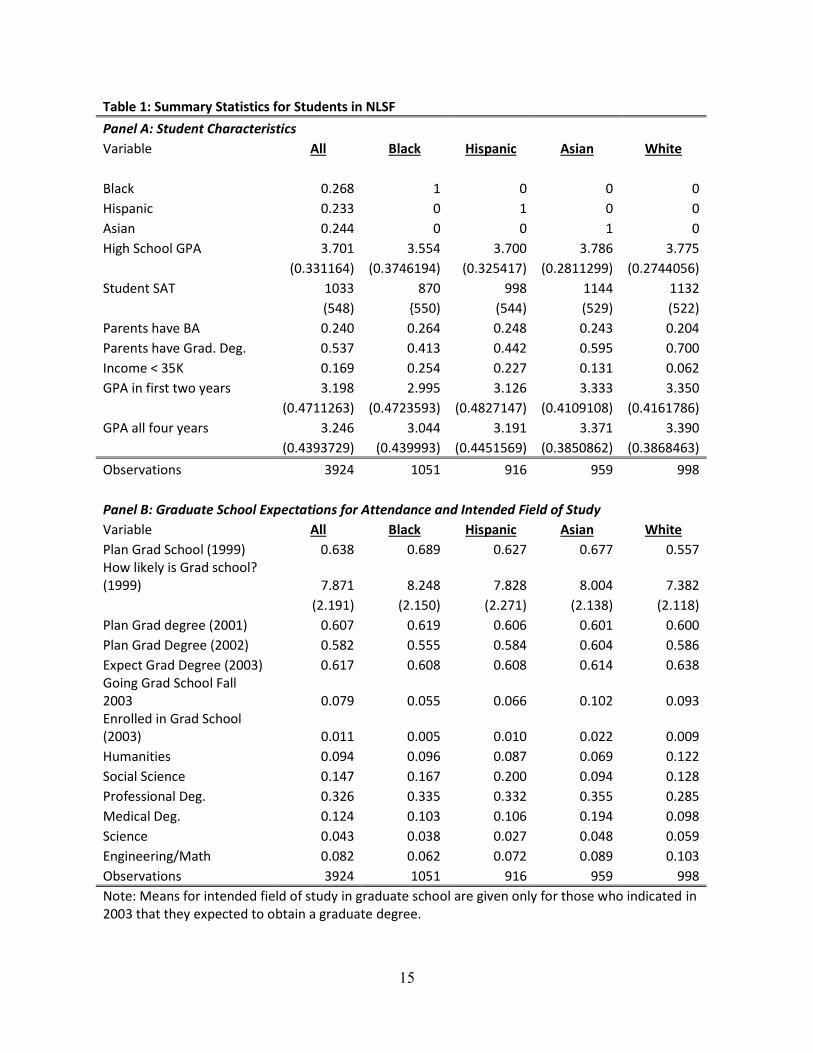
Summary statistics for the variables of interest are shown in Table 1 for the whole sample and
by race. Because the survey was originally developed to answer questions of race, it over-samples
minority students to contain roughly equal groups of White, Black, Hispanic and Asian students,
allowing for large sample sizes for our questions here. In Panel A the student characteristics are
displayed by race. Black and Hispanic students in the sample have slightly lower abilities as measured
by high school GPA and SAT scores, are less likely to have highly educated parents, and earn
correspondingly lower GPAs in college.
Also apparent in Panel A is that the students in the sample are of quite high ability, coming from
selective institutions. Therefore, our analysis will tell us about the factors influencing graduate school
aspirations of relatively higher-ability students at selective institutions. It may be that these factors are
similar for students of all ability levels at all types of institutions, but it is also possible that our results
will be specific to this population of students. However, as it is the most selective institutions that are
the most likely to send their graduates on for graduate study, this is a very relevant population to study3.
In Panel B the descriptive statistics for the students’ post-graduate degree plans for enrollment
and field of study are shown by race. The first thing to note is that a very high proportion (64%) of all
students initially indicate that they plan to pursue a graduate degree. For Black and Asian students this
proportion is even higher. However, as the students progress through college this proportion begins to
drop, rebounding slightly in the senior year (2003), and converging to a similar percentage across the
racial/ethnic groups by senior year. Although the proportion of students that intend to pursue a
graduate degree remains high (roughly 60%) in the senior year, very few students actually report that
they are going to graduate school the following fall (8%), and even fewer report that they are already
enrolled in a graduate program (1.1%). These statistics suggest that there are some interesting
differences in expectations for graduate degrees by race, and these are displayed in Figure 1. Although
Black students start out higher than the rest of the students in the proportion intending to pursue a
graduate degree, it appears that these numbers converge by senior year as fewer Black students report
an interest in graduate school and an increasing number of White students do.
3 See for example Eide et al., 1998 who showed that attending a more selective institution made one more likely to go to graduate school.
5
There are also interesting differences in field of study across races, as can be seen in Panel B of
Table 1 and displayed in Figure 2. Black students interested in graduate school are concentrated in the
fields of social science, professional degrees, and medicine. Although we see a similar pattern for
Hispanic students, they are much more likely to indicate an interest in social science and not as
concentrated within medicine. Asian students show a high proportion interested in a medical degree,
while White students are somewhat more evenly distributed across the fields with a large share
interested in a professional degree.
As the descriptive statistics above show, racial disparities in both graduate school aspirations
and field of graduate study exist. To examine the factors influencing these differences, we estimate
models of the following form:
�2����� � � ����� � ����Where Y is the answer to a question regarding plans to attend graduate school for student i at school s
in wave w. In the Fall of 1999 students are asked whether they plan to attend any graduate school and
on a scale of 1-10 how likely they are to do so. In the sophomore and junior years, students are asked
to consider whether they eventually plan to obtain a Master's or any non-Master's graduate degree,
which is then further broken down into MD versus PhD or other professional degree in subsequent
years. In the senior year students are asked whether they expect to earn a graduate degree both ever and
within the next five years. Seniors in Spring 2003 are also asked whether they are actually enrolled in a
graduate program and whether they will be attending graduate school in Fall 2003. In addition, a final
set of models is estimated splitting the sample into those students who did not report an initial interest
in graduate school in Fall of 1999 but did in the current survey wave, and those who reported an
interest both initially and in the current wave. With the exception of the model of the likelihood of
attending graduate school, asked in the first-year, we estimate all models as Logit models and present
marginal effects.
X is a vector of student characteristics, including race, gender, high school GPA, the student’s
SAT score, parental education and income levels, and initial and current college major. We also include
institution fixed effects to capture any differences across the colleges and universities in graduate
school attendance. Following the literature, students from more selective institutions are more likely to
go to graduate schools, so peer effects and institutional selectivity are likely important in shaping
graduate school aspirations as well. The fixed effects will capture these differences and any others that
exist across the schools in the sample.
We also estimate a model explaining the student’s intended field of study in graduate school,
6
which they provided in the Spring of 2003. All students that indicated in the Spring of 2003 that they
intended to go to graduate school in the next five years answered this question, and the model is
estimated for this subset of students. This model is estimated as a multinomial logit with five
categories: Humanities, Social Sciences, Professional fields, Medicine and the Sciences, and
Math/Engineering and coefficients are reported. The control variables are the same as those listed in
equation (1) with the exception of institution fixed effects. Here institutional differences are controlled
for using total institutional expenditures and median SAT scores, taken from the Integrated Post-
Secondary Education Data System, to preserve degrees of freedom.
III. Results
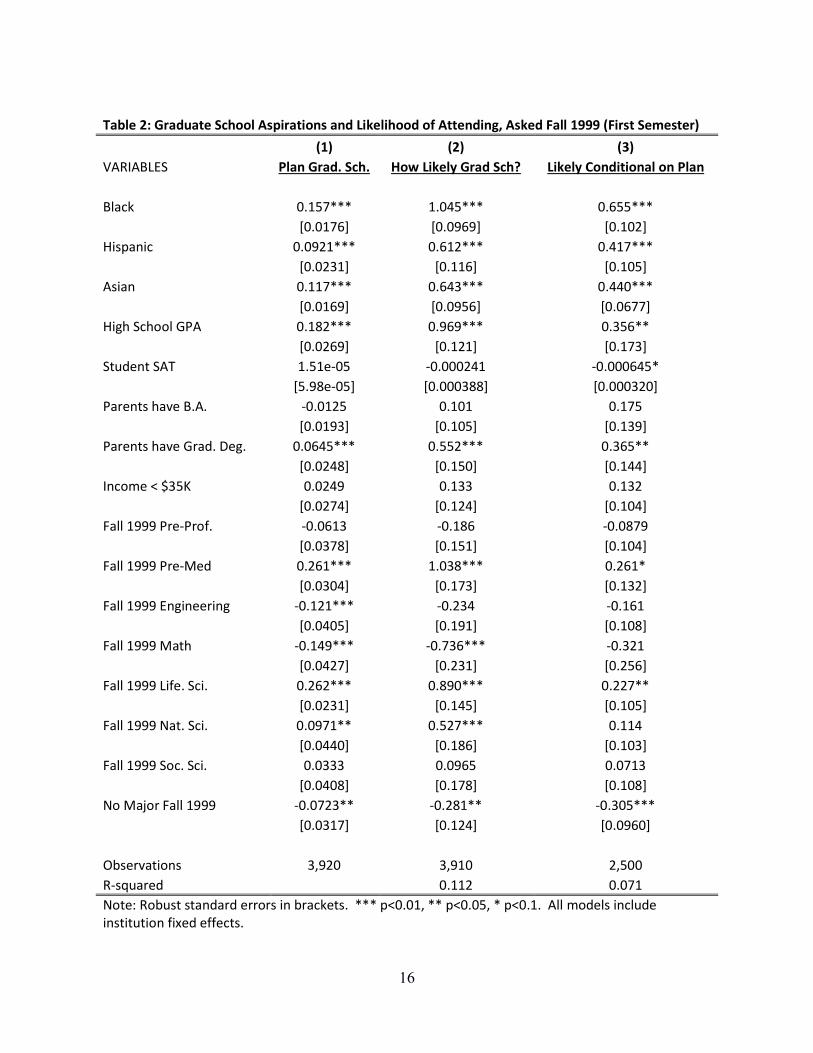
The results of models of first-year college students’ reported plans to attend and likelihood of
attending graduate school are reported in Table 2. Notably, there are large significant differences by
race. Black students are 15.7 percentage points more likely than white students to report that they plan
to attend graduate school. Hispanic and Asian students also are 9.2 and 11.7 percentage points more
likely than White students respectively. In addition to being more likely to aspire to graduate school,
all three groups also report a higher likelihood of going to graduate school than White students, both
for all students and for those that answered yes they planned to attend graduate school following
college. There are also expected differences in graduate school aspirations by parental education –
students with highly educated parents are more likely to indicate a plan for graduate study – but there is
no connection between being from a family with income less than $35,000 and graduate school
aspirations.
Table 2 also indicates that there are slight differences in plans by the students’ initial interest in
field of study by college. Students in Engineering and math fields are less likely than those in the
humanities to report that they plan to pursue a graduate degree, while students interested in pre-medical
and science fields are more likely to indicate an interest in graduate study than those interested in the
humanities. These differences are likely driven by the occupation the student was interested in when
they began college.
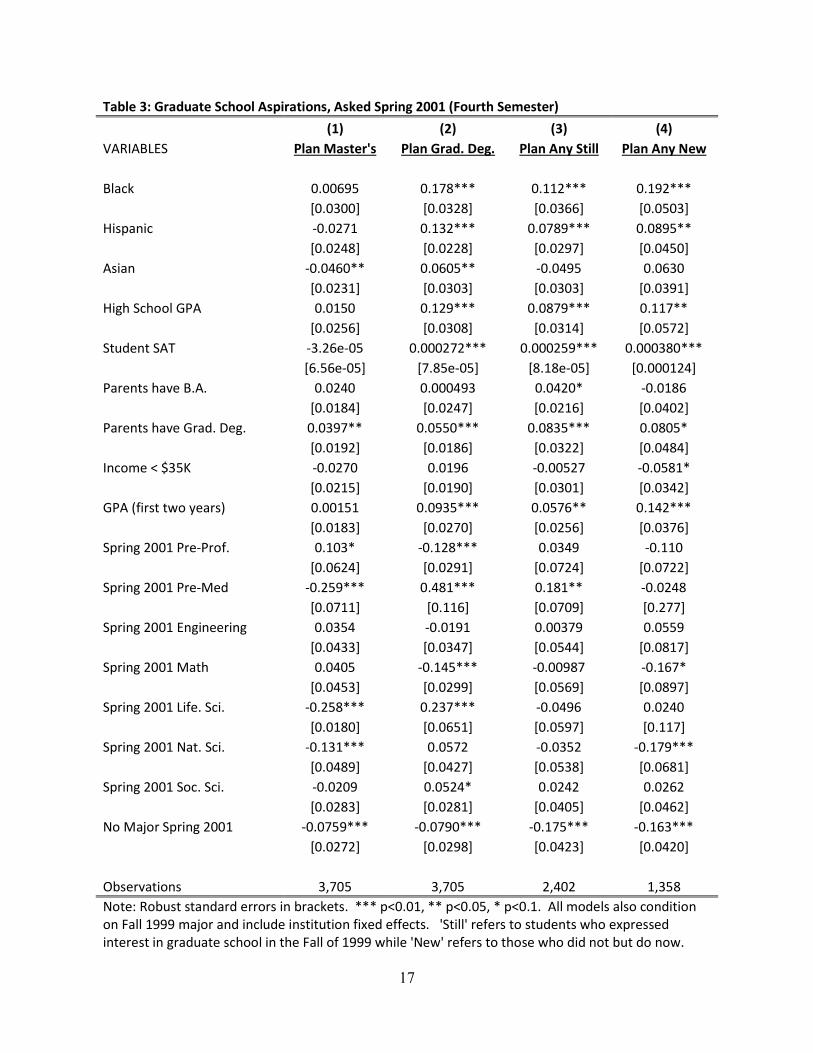
In the sophomore year students were asked about their graduate school aspirations in a more
detailed manner. The results of these models are displayed in Table 3. There is still a large positive
difference in graduate school aspirations by race when examining non-Master’s degrees, but this
difference disappears for Master’s degrees. Black students are 17.8 percentage points more likely to
report an interest in a non-Master’s degree than White students, and Hispanic students are 13.2
7
percentage points more likely to do so. Similarly, although college GPA in the first two years
significantly impacts interest in a non-Master’s degree, it has no significant impact on interest in a
Master’s degree. We see an expected pattern of results regarding current college major and graduate
school aspirations. Students in pre-professional majors are more likely to aspire to a Master’s degree,
while students in Pre-medical and life science majors are more likely to report an interest in a non-
Master’s program.
In columns (3) and (4) of Table 3 we examine changes in students’ post-college aspirations. In
Column (3) we investigate whether students who initially reported an interest in graduate school when
surveyed in their first-year of college are still planning on graduate school. In Column (4) we look at
the group of students who did not indicate an interest in post-graduate study in their first-year to
examine whether they now aspire to a graduate degree after completing two years of college. Large
positive differences exist for Black and Hispanic students in both models, indicating that these students
are both more likely than White students to persist in their interest in a graduate degree and to become
interested in a graduate degree during the course of their college years. High grades earned during the
first two years significantly influences this, as students with higher college GPA are significantly more
likely to persist in their interest and develop an interest in post-graduate study. This likely indicates
that as students learn about their ability in college, as is reflected in their grades, they adjust their post-
graduate aspirations accordingly.
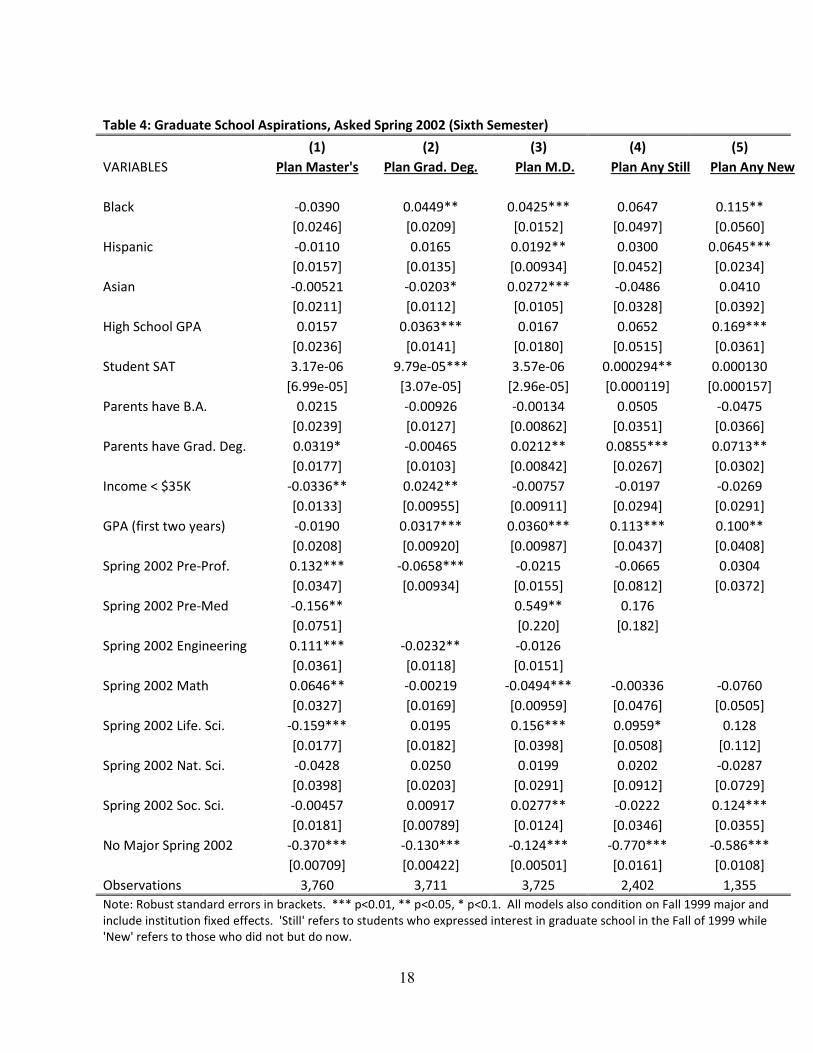
In the junior year, the racial gap in graduate school aspirations starts to lessen, as we can see in
Table 4. Here we are able to examine type of graduate degree in more detail, breaking down non-
Master’s degrees into PhD or professional degrees, and M.D. Black students are no less likely than
White students to indicate an interest in a Master’s degree in their junior year of college, but still
significantly more likely to aspire to a graduate degree of any other type. While Hispanic students are
significantly more likely to aspire to a medical degree, their aspirations are otherwise not significantly
different from those of White students. Black and Hispanic students that did not indicate an interest in
graduate school in their first-year of college are more likely to become interested in the junior year than
white students in the same circumstance, but conversely no more likely to continue to be interested
given an initial interest in graduate study.
Interestingly, although coming from a family with income less than $35,000 had no bearing on
graduate school aspirations in the previous two years, at the end of the junior year students from low-
income backgrounds are significantly less interested in Master’s degrees and more interested in
professional degrees or PhDs, with no difference in medical degrees, than their higher income
8
counterparts. Perhaps as students persist through college and learn more about their potential in the
labor market and for advanced study, pressing factors like cost and ability become more important
factors in students’ post-college interests. Many Master’s programs can be quite expensive, while in a
number of PhD fields graduate education can be obtained at relatively little cost through the receipt of a
fellowship, research assistant or teaching assistant support.
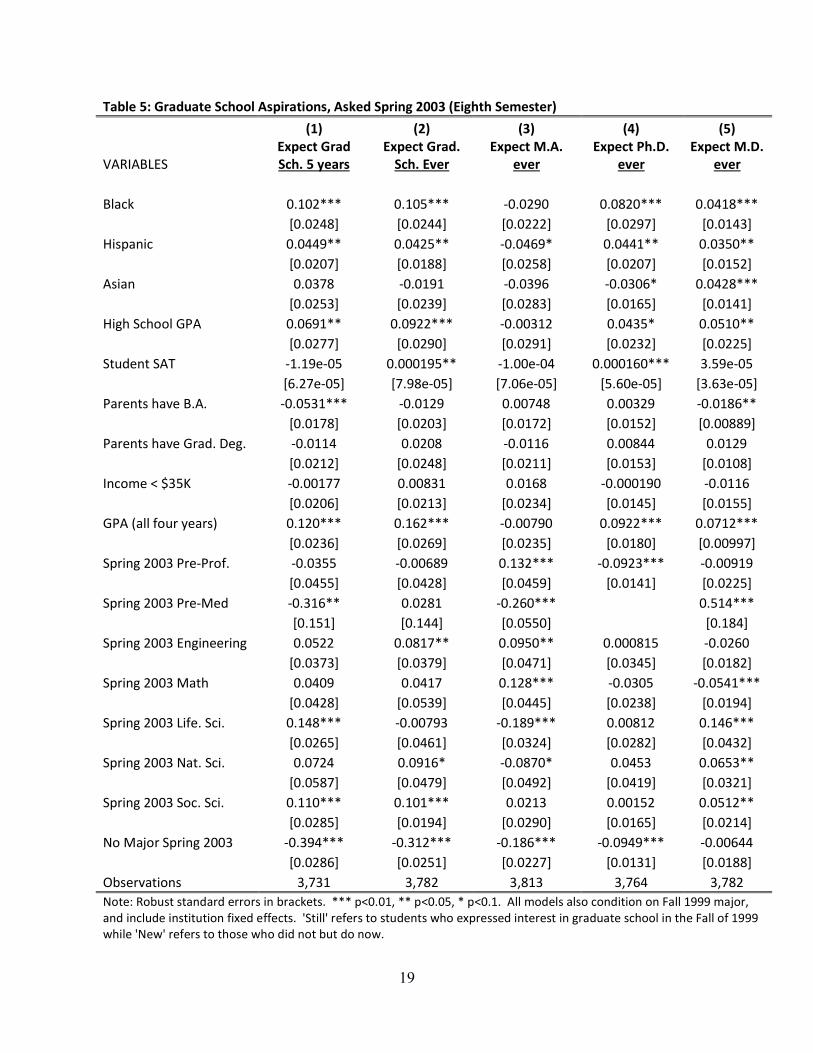
In their senior year, students in the NLSF were asked to report whether they intended to pursue
a graduate degree of any kind in the next five years, as well as whether they planned on obtaining a
Master’s, Ph.D., or M.D. at any point in the future. The results of these estimations are displayed in
Table 5. As with the previous years’ questions, there are racial differences in the probability of
answering yes for most categories of graduate degree. Black students are 10.2 percentage points more
likely to expect to attend graduate school in the next five years than White students, and significantly
more likely to expect a degree of any type except a Master’s as well. Although the differences are
smaller, this same pattern exists for Hispanic students. Unlike in the junior year, there is no
relationship between family income and graduate school expectations. However, there is still a tight
link between academic success in college (GPA) and expectations.
In addition to asking students of their graduate school expectations in their senior year of
college, the survey also asked students if they were enrolled in a graduate program and in a slightly
differently worded question if they were planning on going to graduate school the following fall, with
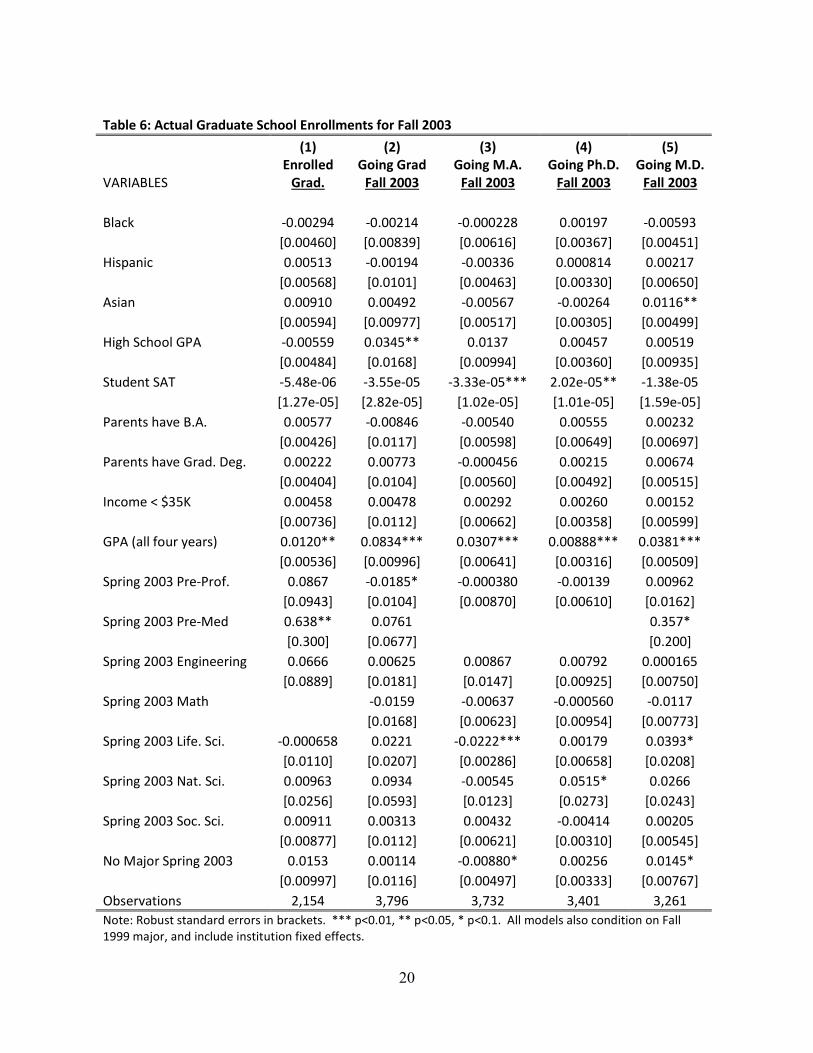
specific questions for each type of graduate degree. The results of these estimations are displayed in
Table 6. What is most notable is that there is no longer any significant difference by race. Despite the
much larger probabilities for Black and Hispanic students of expecting graduate school seen in the
previous tables, when it comes to actual enrollment following graduation, these students are just as
likely as White students to be enrolled. It is possible that Black and Hispanic students are more likely
to take a break between college and graduate school, which would generate these results. It is also
possible that although expectations are high for students in these groups, actual follow-through on the
graduate school application and enrollment process is not higher.
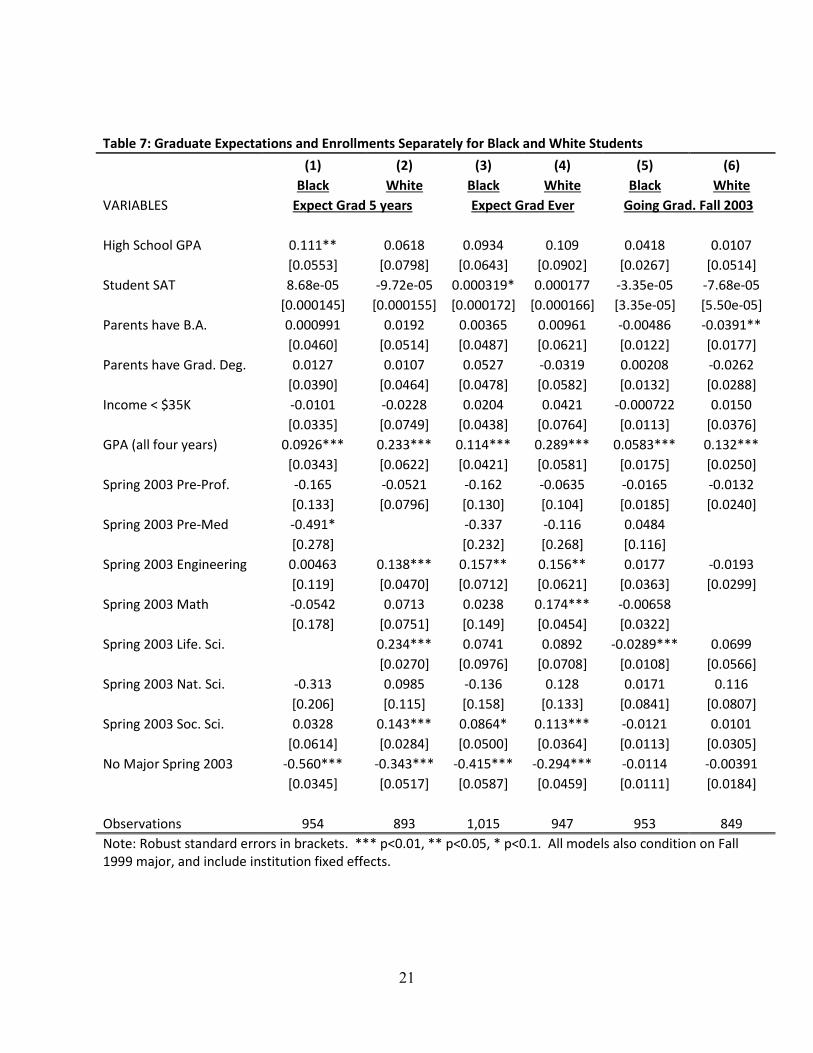
In Tables 7 and 8 we examine why this explanation might be the case. First, in Table 7 we
investigate whether Black and White students respond differently to background characteristics and
college experiences when reporting their expectations and plans for graduate study. Although most
characteristics, such as parental education and income, have a similar effect on graduate school
expectations or plans to enroll for both Black and White students, one variable stands out in particular.
GPA in college has twice to three times the effect on the graduate school expectations of White students
9
as it does for Black students. In particular, although students from both groups are more likely to
aspire to a graduate degree or be planning on enrolling in the fall following college graduation if their
four-year grade point averages are higher, White students respond much more strongly to this signal of
academic success than do Black students. This may indicate that Black and White students are
processing the signals they are receiving through grades in college differently as they assess whether
graduate school is the appropriate option after college.
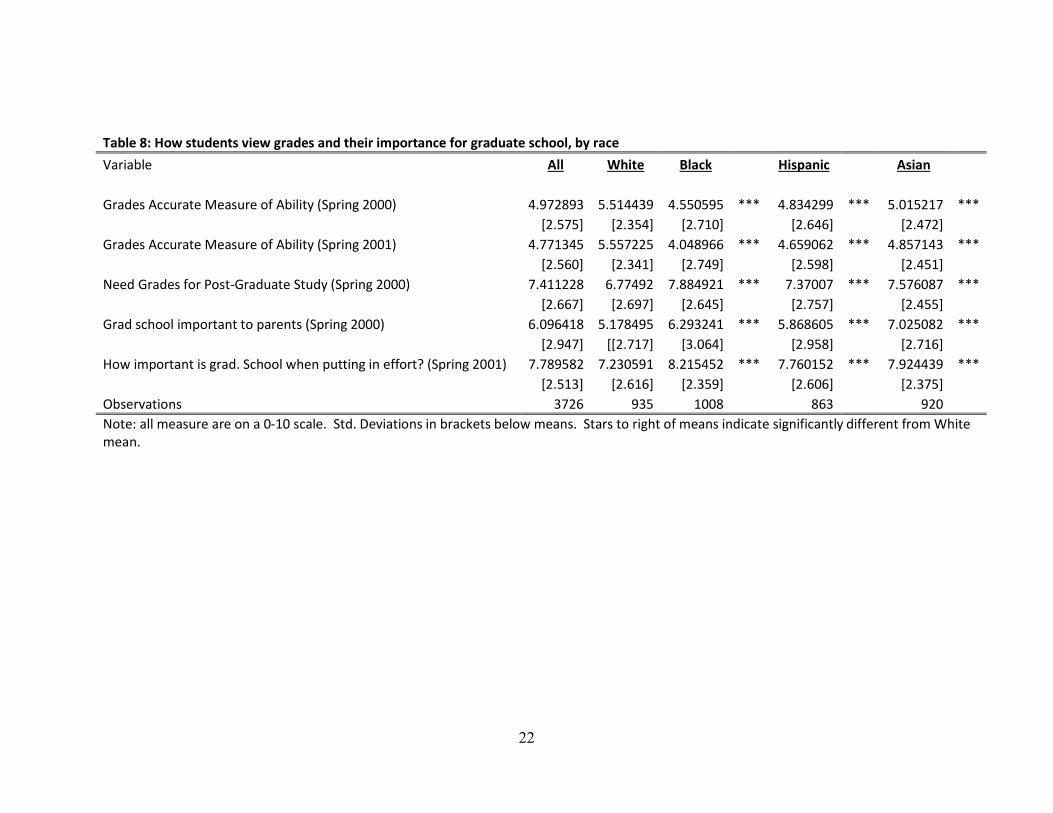
The summary statistics in Table 8 appear to provide support for this hypothesis. In the second
and third waves, administered in the spring of 2000 and spring of 2001, students were asked to rate on
a scale of 0-10 how accurately they felt grades measured their ability. Notably, all students appear to
feel that grades are not the best indicator of their ability, given the low mean of 4.97. However, what
stands out in this table is the difference in the ratings by race. White students report the highest rating
of the accuracy of grades at 5.51, and Black students report a significantly lower 4.55. This gap widens
by sophomore year as White students report an increase in the accuracy of grades, and Black students
report a decrease on average. As Black students are less likely to feel that grades are an accurate
representation of their ability, it is logical that these students are also influenced less strongly by their
GPA in updating their expectations for graduate school.
There are also racial differences in how important students view a number of factors for
graduate school. Interestingly, despite not feeling that grades are as accurate a measure of ability as
white students do, Black students feel that grades are more important for post-graduate study than do
White students. These students also report that graduate study is more important to their parents, and
rate graduate school as more important when putting in effort in school than do White students. These
summary statistics suggest that there is some familial pressure to pursue a graduate degree, but that
Black students may not be using signals such as grades in the same way as White students when
adjusting their expectations for post-graduate study. This disconnect between grades and expectations,
along with high familial expectations may help explain the large differences in aspirations we observe
between races.
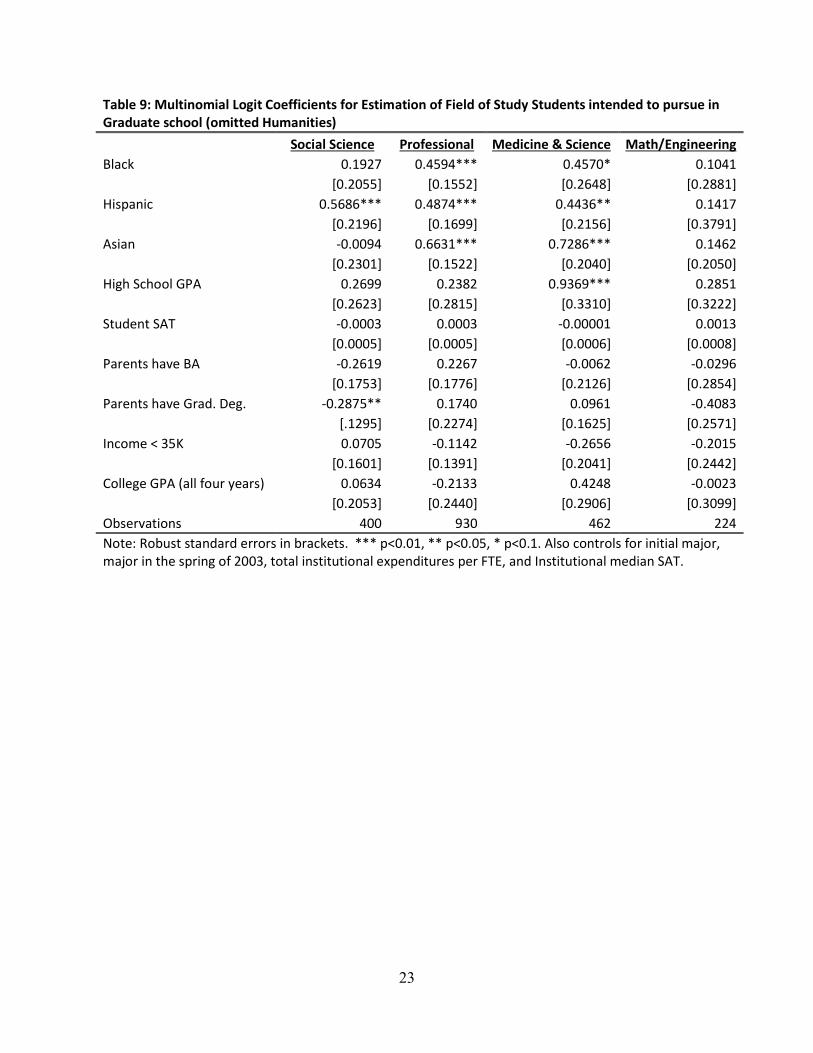
Finally, in Table 9 we examine whether there are any differences across the races in intended
area of study for graduate school, controlling for major choice. Black and Hispanic students are more
likely than White students to indicate an interest in a professional field over one in the humanities.
These students are not significantly less likely to intend to pursue a degree in a social science, math or
engineering field, but are significantly more likely to indicate an interest in a medical or science field.
Unlike the literature on college major choice, it appears that minority students in the NLSF, once
10
controlling for college major, are not less likely to indicate an interest in a STEM field, and if anything
are more likely to pursue a degree in a medical or science-related field. This may indicate that an
important part of the STEM pipeline lies within college, and if students persist in their interest in
STEM during college, they are just as likely to continue their study of the field post-college.
IV. Discussion
This paper has examined a question that is not yet well studied, regarding the aspirations of
college students to pursue a graduate degree. We use the National Longitudinal Survey of Freshmen to
examine racial differences in expectations for post-graduate study and field of study. Our findings
indicate that there is a persistent racial gap in graduate study aspirations, with Black students more
likely to report their interest in a graduate degree throughout college than White students. However,
this does not carry through to actual enrollment in the year following college completion, as no racial
gap exists at this point. Field of study differences also exist, mostly mirroring the literature on college
major choice.
These results are interesting, as they suggest two, not necessarily mutually exclusive, possible
explanations. First, it appears that Black students are less likely to feel that their grades are an accurate
representation of their ability, and accordingly place less weight on college performance when forming
their expectations for graduate study. This is an interesting extension of the literature on grade
sensitivity which has found strong gender differences in responses to grades received in college and
subsequent major choice.
The second possible explanation, and one that we are unable to investigate with this data set, is
that there are racial differences in the propensity to attend graduate school immediately following
college. It may be that Black students who have reported an interest in graduate study but aren’t
enrolled yet will indeed enroll in future years. This may be due to the cost of graduate study, or
differences in preferences or practices for when to attend a graduate program. Future study on this
topic is needed. If certain groups of graduates are delaying entry into graduate programs, they are also
delaying the increase in earnings and job opportunities that come with the graduate degree, affecting
lifetime earnings. Overall, further research with other longitudinal data sets that contain data for a
number of years after college graduation is needed to get a full grasp of the factors that are leading to
the racial differences in aspirations for graduate study that we have observed here.
It is also important to note that the institutions used in this sample are very selective, and
therefore not necessarily representative of four-year colleges in general. It may be the case that the
11
factors that affect graduate school aspirations during the college years are very different for students at
the more selective institutions. For example, our findings indicate that being from a lower-income
family has little impact on graduate school aspirations, but it is possible that the low-income students
that have matriculated at one of these selective institutions are different from a typical low-income
student at a non-selective four-year institution, for whom income may play a much larger role.
Therefore, it is important to recognize that these results pertain to a specific population of students.
Although this is the population of students most likely to be considering graduate study and an
important group to study, it is also very important that future work examines graduate school
aspirations by race for a more representative sample of students and universities.
12
V. References
Arcidiacono, P., and Koedel, C. (2014). “Race and College Success: Evidence from Missouri.” American Economic Journal: Applied Economics. 6(3). Pp. 20-57.
Arcidiacono, P., Aucejo, E.M., Spenner, K., 2012. “What Happens After Enrollment? An Analysis of the Time Path of Racial Differences in GPA and Major Choice.” IZA Journal of Labor Economics 1:5.
Bedard, K., Herman, D. A., 2008. “Who goes to graduate/professional school? The importance of economic fluctuations, undergraduate field, and abillity,” Economics of Education Review
27(2): 197—210.
Black, S. E., and Sufi, A. (2002). “Who Goes to College? Differential Enrollment by Race and Family Background.” NBER Working Paper #1903.
Bureau of Labor Statistics (2012). “Education and Training Outlook for Occupations, 2012-2022.” Division of Occupational Employment Projections.
Eide, E., Brewer, D. J., Ehrenberg, R. G., 1998. “Does it Pay to Attend an Elite Private College? Evidence on the Effects of Undergraduate College Quality on Graduate School Attendance.”
Economics of Education Review 17(4): 371—376.
Griffith, A. L., 2010. “Persistence of women and minorities in STEM field majors: Is it the school that matters?” Economics of Education Review 29(6): 911—922.
Massey, D. S., Charles, C. Z., Lundy, G. F., Fischer, M. J., 2003. Source of the River: The Social Origins of Freshmen at America's Selective Colleges and Universities. Princeton University Press.
Ost, B., 2010. “The role of pers and grades in determining major persistence in the sciences,” Economics of Education Review 29(6): 923—934.
Perna, L.W., 2004. “Understanding the Decision to Enroll in Graduate School: Sex and Racial/Ethnic Group Differences,” The Journal of Higher Education 75(5): 487—527.
Rask, K., 2010. “Attrition in STEM fields at a liberal arts college: The importance of grades and pre-collegiate preferences,” Economics of Education Review 29(6): 892—900.
Rask, K., Tiefenthaler, J., 2008. “The role of grade sensitivity in explaining the gender imbalance in undergraduate economics,” Economics of Education Review 29(6): 676—687.
Staniec, J. F. O., 2004. “The Effects of Race, Sex and Expected Returns on the Choice of College

13
Major.” Eastern Economic Journal 30 (4): 549—562.
Zhang, L., 2004. “Advance to graduate education: the effect of college quality and undergraduate majors,” The Review of Higher Education, 28(3): 313-338.

14
15
Table 1: Summary Statistics for Students in NLSFPanel A: Student Characteristics Variable All Black Hispanic Asian White
Black 0.268 1 0 0 0Hispanic 0.233 0 1 0 0Asian 0.244 0 0 1 0High School GPA 3.701 3.554 3.700 3.786 3.775
(0.331164) (0.3746194) (0.325417) (0.2811299) (0.2744056)Student SAT 1033 870 998 1144 1132
(548) {550) (544) (529) (522)Parents have BA 0.240 0.264 0.248 0.243 0.204Parents have Grad. Deg. 0.537 0.413 0.442 0.595 0.700Income < 35K 0.169 0.254 0.227 0.131 0.062GPA in first two years 3.198 2.995 3.126 3.333 3.350
(0.4711263) (0.4723593) (0.4827147) (0.4109108) (0.4161786)GPA all four years 3.246 3.044 3.191 3.371 3.390
(0.4393729) (0.439993) (0.4451569) (0.3850862) (0.3868463)Observations 3924 1051 916 959 998
Panel B: Graduate School Expectations for Attendance and Intended Field of Study Variable All Black Hispanic Asian White Plan Grad School (1999) 0.638 0.689 0.627 0.677 0.557How likely is Grad school? (1999) 7.871 8.248 7.828 8.004 7.382
(2.191) (2.150) (2.271) (2.138) (2.118)Plan Grad degree (2001) 0.607 0.619 0.606 0.601 0.600Plan Grad Degree (2002) 0.582 0.555 0.584 0.604 0.586Expect Grad Degree (2003) 0.617 0.608 0.608 0.614 0.638Going Grad School Fall 2003 0.079 0.055 0.066 0.102 0.093Enrolled in Grad School (2003) 0.011 0.005 0.010 0.022 0.009Humanities 0.094 0.096 0.087 0.069 0.122Social Science 0.147 0.167 0.200 0.094 0.128Professional Deg. 0.326 0.335 0.332 0.355 0.285Medical Deg. 0.124 0.103 0.106 0.194 0.098Science 0.043 0.038 0.027 0.048 0.059Engineering/Math 0.082 0.062 0.072 0.089 0.103Observations 3924 1051 916 959 998Note: Means for intended field of study in graduate school are given only for those who indicated in 2003 that they expected to obtain a graduate degree.
16
Table 2: Graduate School Aspirations and Likelihood of Attending, Asked Fall 1999 (First Semester) (1) (2) (3)
VARIABLES Plan Grad. Sch. How Likely Grad Sch? Likely Conditional on Plan
Black 0.157*** 1.045*** 0.655*** [0.0176] [0.0969] [0.102]
Hispanic 0.0921*** 0.612*** 0.417*** [0.0231] [0.116] [0.105]
Asian 0.117*** 0.643*** 0.440*** [0.0169] [0.0956] [0.0677]
High School GPA 0.182*** 0.969*** 0.356** [0.0269] [0.121] [0.173]
Student SAT 1.51e-05 -0.000241 -0.000645* [5.98e-05] [0.000388] [0.000320]
Parents have B.A. -0.0125 0.101 0.175 [0.0193] [0.105] [0.139]
Parents have Grad. Deg. 0.0645*** 0.552*** 0.365** [0.0248] [0.150] [0.144]
Income < $35K 0.0249 0.133 0.132 [0.0274] [0.124] [0.104]
Fall 1999 Pre-Prof. -0.0613 -0.186 -0.0879 [0.0378] [0.151] [0.104]
Fall 1999 Pre-Med 0.261*** 1.038*** 0.261* [0.0304] [0.173] [0.132]
Fall 1999 Engineering -0.121*** -0.234 -0.161 [0.0405] [0.191] [0.108]
Fall 1999 Math -0.149*** -0.736*** -0.321 [0.0427] [0.231] [0.256]
Fall 1999 Life. Sci. 0.262*** 0.890*** 0.227** [0.0231] [0.145] [0.105]
Fall 1999 Nat. Sci. 0.0971** 0.527*** 0.114 [0.0440] [0.186] [0.103]
Fall 1999 Soc. Sci. 0.0333 0.0965 0.0713 [0.0408] [0.178] [0.108]
No Major Fall 1999 -0.0723** -0.281** -0.305*** [0.0317] [0.124] [0.0960]
Observations 3,920 3,910 2,500 R-squared 0.112 0.071 Note: Robust standard errors in brackets. *** p<0.01, ** p<0.05, * p<0.1. All models include institution fixed effects.
17
Table 3: Graduate School Aspirations, Asked Spring 2001 (Fourth Semester) (1) (2) (3) (4)
VARIABLES Plan Master's Plan Grad. Deg. Plan Any Still Plan Any New
Black 0.00695 0.178*** 0.112*** 0.192*** [0.0300] [0.0328] [0.0366] [0.0503]
Hispanic -0.0271 0.132*** 0.0789*** 0.0895** [0.0248] [0.0228] [0.0297] [0.0450]
Asian -0.0460** 0.0605** -0.0495 0.0630 [0.0231] [0.0303] [0.0303] [0.0391]
High School GPA 0.0150 0.129*** 0.0879*** 0.117** [0.0256] [0.0308] [0.0314] [0.0572]
Student SAT -3.26e-05 0.000272*** 0.000259*** 0.000380*** [6.56e-05] [7.85e-05] [8.18e-05] [0.000124]
Parents have B.A. 0.0240 0.000493 0.0420* -0.0186 [0.0184] [0.0247] [0.0216] [0.0402]
Parents have Grad. Deg. 0.0397** 0.0550*** 0.0835*** 0.0805* [0.0192] [0.0186] [0.0322] [0.0484]
Income < $35K -0.0270 0.0196 -0.00527 -0.0581* [0.0215] [0.0190] [0.0301] [0.0342]
GPA (first two years) 0.00151 0.0935*** 0.0576** 0.142*** [0.0183] [0.0270] [0.0256] [0.0376]
Spring 2001 Pre-Prof. 0.103* -0.128*** 0.0349 -0.110 [0.0624] [0.0291] [0.0724] [0.0722]
Spring 2001 Pre-Med -0.259*** 0.481*** 0.181** -0.0248 [0.0711] [0.116] [0.0709] [0.277]
Spring 2001 Engineering 0.0354 -0.0191 0.00379 0.0559 [0.0433] [0.0347] [0.0544] [0.0817]
Spring 2001 Math 0.0405 -0.145*** -0.00987 -0.167* [0.0453] [0.0299] [0.0569] [0.0897]
Spring 2001 Life. Sci. -0.258*** 0.237*** -0.0496 0.0240 [0.0180] [0.0651] [0.0597] [0.117]
Spring 2001 Nat. Sci. -0.131*** 0.0572 -0.0352 -0.179*** [0.0489] [0.0427] [0.0538] [0.0681]
Spring 2001 Soc. Sci. -0.0209 0.0524* 0.0242 0.0262 [0.0283] [0.0281] [0.0405] [0.0462]
No Major Spring 2001 -0.0759*** -0.0790*** -0.175*** -0.163*** [0.0272] [0.0298] [0.0423] [0.0420]
Observations 3,705 3,705 2,402 1,358 Note: Robust standard errors in brackets. *** p<0.01, ** p<0.05, * p<0.1. All models also condition on Fall 1999 major and include institution fixed effects. 'Still' refers to students who expressed interest in graduate school in the Fall of 1999 while 'New' refers to those who did not but do now.
18
Table 4: Graduate School Aspirations, Asked Spring 2002 (Sixth Semester) (1) (2) (3) (4) (5)
VARIABLES Plan Master's Plan Grad. Deg. Plan M.D. Plan Any Still Plan Any New
Black -0.0390 0.0449** 0.0425*** 0.0647 0.115** [0.0246] [0.0209] [0.0152] [0.0497] [0.0560]
Hispanic -0.0110 0.0165 0.0192** 0.0300 0.0645*** [0.0157] [0.0135] [0.00934] [0.0452] [0.0234]
Asian -0.00521 -0.0203* 0.0272*** -0.0486 0.0410 [0.0211] [0.0112] [0.0105] [0.0328] [0.0392]
High School GPA 0.0157 0.0363*** 0.0167 0.0652 0.169*** [0.0236] [0.0141] [0.0180] [0.0515] [0.0361]
Student SAT 3.17e-06 9.79e-05*** 3.57e-06 0.000294** 0.000130 [6.99e-05] [3.07e-05] [2.96e-05] [0.000119] [0.000157]
Parents have B.A. 0.0215 -0.00926 -0.00134 0.0505 -0.0475 [0.0239] [0.0127] [0.00862] [0.0351] [0.0366]
Parents have Grad. Deg. 0.0319* -0.00465 0.0212** 0.0855*** 0.0713** [0.0177] [0.0103] [0.00842] [0.0267] [0.0302]
Income < $35K -0.0336** 0.0242** -0.00757 -0.0197 -0.0269 [0.0133] [0.00955] [0.00911] [0.0294] [0.0291]
GPA (first two years) -0.0190 0.0317*** 0.0360*** 0.113*** 0.100** [0.0208] [0.00920] [0.00987] [0.0437] [0.0408]
Spring 2002 Pre-Prof. 0.132*** -0.0658*** -0.0215 -0.0665 0.0304 [0.0347] [0.00934] [0.0155] [0.0812] [0.0372]
Spring 2002 Pre-Med -0.156** 0.549** 0.176 [0.0751] [0.220] [0.182]
Spring 2002 Engineering 0.111*** -0.0232** -0.0126 [0.0361] [0.0118] [0.0151]
Spring 2002 Math 0.0646** -0.00219 -0.0494*** -0.00336 -0.0760 [0.0327] [0.0169] [0.00959] [0.0476] [0.0505]
Spring 2002 Life. Sci. -0.159*** 0.0195 0.156*** 0.0959* 0.128 [0.0177] [0.0182] [0.0398] [0.0508] [0.112]
Spring 2002 Nat. Sci. -0.0428 0.0250 0.0199 0.0202 -0.0287 [0.0398] [0.0203] [0.0291] [0.0912] [0.0729]
Spring 2002 Soc. Sci. -0.00457 0.00917 0.0277** -0.0222 0.124*** [0.0181] [0.00789] [0.0124] [0.0346] [0.0355]
No Major Spring 2002 -0.370*** -0.130*** -0.124*** -0.770*** -0.586*** [0.00709] [0.00422] [0.00501] [0.0161] [0.0108]
Observations 3,760 3,711 3,725 2,402 1,355 Note: Robust standard errors in brackets. *** p<0.01, ** p<0.05, * p<0.1. All models also condition on Fall 1999 major and include institution fixed effects. 'Still' refers to students who expressed interest in graduate school in the Fall of 1999 while 'New' refers to those who did not but do now.
19
Table 5: Graduate School Aspirations, Asked Spring 2003 (Eighth Semester)(1) (2) (3) (4) (5)
VARIABLES Expect Grad Sch. 5 years
Expect Grad. Sch. Ever
Expect M.A. ever
Expect Ph.D. ever
Expect M.D. ever
Black 0.102*** 0.105*** -0.0290 0.0820*** 0.0418*** [0.0248] [0.0244] [0.0222] [0.0297] [0.0143]
Hispanic 0.0449** 0.0425** -0.0469* 0.0441** 0.0350** [0.0207] [0.0188] [0.0258] [0.0207] [0.0152]
Asian 0.0378 -0.0191 -0.0396 -0.0306* 0.0428*** [0.0253] [0.0239] [0.0283] [0.0165] [0.0141]
High School GPA 0.0691** 0.0922*** -0.00312 0.0435* 0.0510** [0.0277] [0.0290] [0.0291] [0.0232] [0.0225]
Student SAT -1.19e-05 0.000195** -1.00e-04 0.000160*** 3.59e-05 [6.27e-05] [7.98e-05] [7.06e-05] [5.60e-05] [3.63e-05]
Parents have B.A. -0.0531*** -0.0129 0.00748 0.00329 -0.0186** [0.0178] [0.0203] [0.0172] [0.0152] [0.00889]
Parents have Grad. Deg. -0.0114 0.0208 -0.0116 0.00844 0.0129 [0.0212] [0.0248] [0.0211] [0.0153] [0.0108]
Income < $35K -0.00177 0.00831 0.0168 -0.000190 -0.0116 [0.0206] [0.0213] [0.0234] [0.0145] [0.0155]
GPA (all four years) 0.120*** 0.162*** -0.00790 0.0922*** 0.0712*** [0.0236] [0.0269] [0.0235] [0.0180] [0.00997]
Spring 2003 Pre-Prof. -0.0355 -0.00689 0.132*** -0.0923*** -0.00919 [0.0455] [0.0428] [0.0459] [0.0141] [0.0225]
Spring 2003 Pre-Med -0.316** 0.0281 -0.260*** 0.514*** [0.151] [0.144] [0.0550] [0.184]
Spring 2003 Engineering 0.0522 0.0817** 0.0950** 0.000815 -0.0260 [0.0373] [0.0379] [0.0471] [0.0345] [0.0182]
Spring 2003 Math 0.0409 0.0417 0.128*** -0.0305 -0.0541*** [0.0428] [0.0539] [0.0445] [0.0238] [0.0194]
Spring 2003 Life. Sci. 0.148*** -0.00793 -0.189*** 0.00812 0.146*** [0.0265] [0.0461] [0.0324] [0.0282] [0.0432]
Spring 2003 Nat. Sci. 0.0724 0.0916* -0.0870* 0.0453 0.0653** [0.0587] [0.0479] [0.0492] [0.0419] [0.0321]
Spring 2003 Soc. Sci. 0.110*** 0.101*** 0.0213 0.00152 0.0512** [0.0285] [0.0194] [0.0290] [0.0165] [0.0214]
No Major Spring 2003 -0.394*** -0.312*** -0.186*** -0.0949*** -0.00644 [0.0286] [0.0251] [0.0227] [0.0131] [0.0188]
Observations 3,731 3,782 3,813 3,764 3,782 Note: Robust standard errors in brackets. *** p<0.01, ** p<0.05, * p<0.1. All models also condition on Fall 1999 major, and include institution fixed effects. 'Still' refers to students who expressed interest in graduate school in the Fall of 1999 while 'New' refers to those who did not but do now.
20
Table 6: Actual Graduate School Enrollments for Fall 2003(1) (2) (3) (4) (5)
VARIABLES Enrolled
Grad. Going Grad
Fall 2003 Going M.A.
Fall 2003 Going Ph.D.
Fall 2003 Going M.D.
Fall 2003
Black -0.00294 -0.00214 -0.000228 0.00197 -0.00593 [0.00460] [0.00839] [0.00616] [0.00367] [0.00451]
Hispanic 0.00513 -0.00194 -0.00336 0.000814 0.00217 [0.00568] [0.0101] [0.00463] [0.00330] [0.00650]
Asian 0.00910 0.00492 -0.00567 -0.00264 0.0116** [0.00594] [0.00977] [0.00517] [0.00305] [0.00499]
High School GPA -0.00559 0.0345** 0.0137 0.00457 0.00519 [0.00484] [0.0168] [0.00994] [0.00360] [0.00935]
Student SAT -5.48e-06 -3.55e-05 -3.33e-05*** 2.02e-05** -1.38e-05 [1.27e-05] [2.82e-05] [1.02e-05] [1.01e-05] [1.59e-05]
Parents have B.A. 0.00577 -0.00846 -0.00540 0.00555 0.00232 [0.00426] [0.0117] [0.00598] [0.00649] [0.00697]
Parents have Grad. Deg. 0.00222 0.00773 -0.000456 0.00215 0.00674 [0.00404] [0.0104] [0.00560] [0.00492] [0.00515]
Income < $35K 0.00458 0.00478 0.00292 0.00260 0.00152 [0.00736] [0.0112] [0.00662] [0.00358] [0.00599]
GPA (all four years) 0.0120** 0.0834*** 0.0307*** 0.00888*** 0.0381*** [0.00536] [0.00996] [0.00641] [0.00316] [0.00509]
Spring 2003 Pre-Prof. 0.0867 -0.0185* -0.000380 -0.00139 0.00962 [0.0943] [0.0104] [0.00870] [0.00610] [0.0162]
Spring 2003 Pre-Med 0.638** 0.0761 0.357* [0.300] [0.0677] [0.200]
Spring 2003 Engineering 0.0666 0.00625 0.00867 0.00792 0.000165 [0.0889] [0.0181] [0.0147] [0.00925] [0.00750]
Spring 2003 Math -0.0159 -0.00637 -0.000560 -0.0117 [0.0168] [0.00623] [0.00954] [0.00773]
Spring 2003 Life. Sci. -0.000658 0.0221 -0.0222*** 0.00179 0.0393* [0.0110] [0.0207] [0.00286] [0.00658] [0.0208]
Spring 2003 Nat. Sci. 0.00963 0.0934 -0.00545 0.0515* 0.0266 [0.0256] [0.0593] [0.0123] [0.0273] [0.0243]
Spring 2003 Soc. Sci. 0.00911 0.00313 0.00432 -0.00414 0.00205 [0.00877] [0.0112] [0.00621] [0.00310] [0.00545]
No Major Spring 2003 0.0153 0.00114 -0.00880* 0.00256 0.0145* [0.00997] [0.0116] [0.00497] [0.00333] [0.00767]
Observations 2,154 3,796 3,732 3,401 3,261 Note: Robust standard errors in brackets. *** p<0.01, ** p<0.05, * p<0.1. All models also condition on Fall 1999 major, and include institution fixed effects.
21
Table 7: Graduate Expectations and Enrollments Separately for Black and White Students (1) (2) (3) (4) (5) (6)
Black White Black White Black White VARIABLES Expect Grad 5 years Expect Grad Ever Going Grad. Fall 2003
High School GPA 0.111** 0.0618 0.0934 0.109 0.0418 0.0107 [0.0553] [0.0798] [0.0643] [0.0902] [0.0267] [0.0514]
Student SAT 8.68e-05 -9.72e-05 0.000319* 0.000177 -3.35e-05 -7.68e-05 [0.000145] [0.000155] [0.000172] [0.000166] [3.35e-05] [5.50e-05]
Parents have B.A. 0.000991 0.0192 0.00365 0.00961 -0.00486 -0.0391** [0.0460] [0.0514] [0.0487] [0.0621] [0.0122] [0.0177]
Parents have Grad. Deg. 0.0127 0.0107 0.0527 -0.0319 0.00208 -0.0262 [0.0390] [0.0464] [0.0478] [0.0582] [0.0132] [0.0288]
Income < $35K -0.0101 -0.0228 0.0204 0.0421 -0.000722 0.0150 [0.0335] [0.0749] [0.0438] [0.0764] [0.0113] [0.0376]
GPA (all four years) 0.0926*** 0.233*** 0.114*** 0.289*** 0.0583*** 0.132*** [0.0343] [0.0622] [0.0421] [0.0581] [0.0175] [0.0250]
Spring 2003 Pre-Prof. -0.165 -0.0521 -0.162 -0.0635 -0.0165 -0.0132 [0.133] [0.0796] [0.130] [0.104] [0.0185] [0.0240]
Spring 2003 Pre-Med -0.491* -0.337 -0.116 0.0484 [0.278] [0.232] [0.268] [0.116]
Spring 2003 Engineering 0.00463 0.138*** 0.157** 0.156** 0.0177 -0.0193 [0.119] [0.0470] [0.0712] [0.0621] [0.0363] [0.0299]
Spring 2003 Math -0.0542 0.0713 0.0238 0.174*** -0.00658 [0.178] [0.0751] [0.149] [0.0454] [0.0322]
Spring 2003 Life. Sci. 0.234*** 0.0741 0.0892 -0.0289*** 0.0699 [0.0270] [0.0976] [0.0708] [0.0108] [0.0566]
Spring 2003 Nat. Sci. -0.313 0.0985 -0.136 0.128 0.0171 0.116 [0.206] [0.115] [0.158] [0.133] [0.0841] [0.0807]
Spring 2003 Soc. Sci. 0.0328 0.143*** 0.0864* 0.113*** -0.0121 0.0101 [0.0614] [0.0284] [0.0500] [0.0364] [0.0113] [0.0305]
No Major Spring 2003 -0.560*** -0.343*** -0.415*** -0.294*** -0.0114 -0.00391 [0.0345] [0.0517] [0.0587] [0.0459] [0.0111] [0.0184]
Observations 954 893 1,015 947 953 849 Note: Robust standard errors in brackets. *** p<0.01, ** p<0.05, * p<0.1. All models also condition on Fall 1999 major, and include institution fixed effects.
22
Table 8: How students view grades and their importance for graduate school, by raceVariable All White Black Hispanic Asian
Grades Accurate Measure of Ability (Spring 2000) 4.972893 5.514439 4.550595 *** 4.834299 *** 5.015217 *** [2.575] [2.354] [2.710] [2.646] [2.472]
Grades Accurate Measure of Ability (Spring 2001) 4.771345 5.557225 4.048966 *** 4.659062 *** 4.857143 *** [2.560] [2.341] [2.749] [2.598] [2.451]
Need Grades for Post-Graduate Study (Spring 2000) 7.411228 6.77492 7.884921 *** 7.37007 *** 7.576087 *** [2.667] [2.697] [2.645] [2.757] [2.455]
Grad school important to parents (Spring 2000) 6.096418 5.178495 6.293241 *** 5.868605 *** 7.025082 *** [2.947] [[2.717] [3.064] [2.958] [2.716]
How important is grad. School when putting in effort? (Spring 2001) 7.789582 7.230591 8.215452 *** 7.760152 *** 7.924439 *** [2.513] [2.616] [2.359] [2.606] [2.375]
Observations 3726 935 1008 863 920Note: all measure are on a 0-10 scale. Std. Deviations in brackets below means. Stars to right of means indicate significantly different from White mean.
23
Table 9: Multinomial Logit Coefficients for Estimation of Field of Study Students intended to pursue in Graduate school (omitted Humanities) Social Science Professional Medicine & Science Math/EngineeringBlack 0.1927 0.4594*** 0.4570* 0.1041
[0.2055] [0.1552] [0.2648] [0.2881]Hispanic 0.5686*** 0.4874*** 0.4436** 0.1417
[0.2196] [0.1699] [0.2156] [0.3791]Asian -0.0094 0.6631*** 0.7286*** 0.1462
[0.2301] [0.1522] [0.2040] [0.2050]High School GPA 0.2699 0.2382 0.9369*** 0.2851
[0.2623] [0.2815] [0.3310] [0.3222]Student SAT -0.0003 0.0003 -0.00001 0.0013
[0.0005] [0.0005] [0.0006] [0.0008]Parents have BA -0.2619 0.2267 -0.0062 -0.0296
[0.1753] [0.1776] [0.2126] [0.2854]Parents have Grad. Deg. -0.2875** 0.1740 0.0961 -0.4083
[.1295] [0.2274] [0.1625] [0.2571]Income < 35K 0.0705 -0.1142 -0.2656 -0.2015
[0.1601] [0.1391] [0.2041] [0.2442]College GPA (all four years) 0.0634 -0.2133 0.4248 -0.0023
[0.2053] [0.2440] [0.2906] [0.3099]Observations 400 930 462 224Note: Robust standard errors in brackets. *** p<0.01, ** p<0.05, * p<0.1. Also controls for initial major, major in the spring of 2003, total institutional expenditures per FTE, and Institutional median SAT.