Embed Size (px)
Citation preview
1
Explaining reforms of assembly sizes
Reassessing the cube root law relationship between population and assembly size
Kristof Jacobs,
Institute of Management Research, Radboud University (NL)
Simon Otjes, Documentation Centre Dutch Political Parties, University of Groningen (NL)
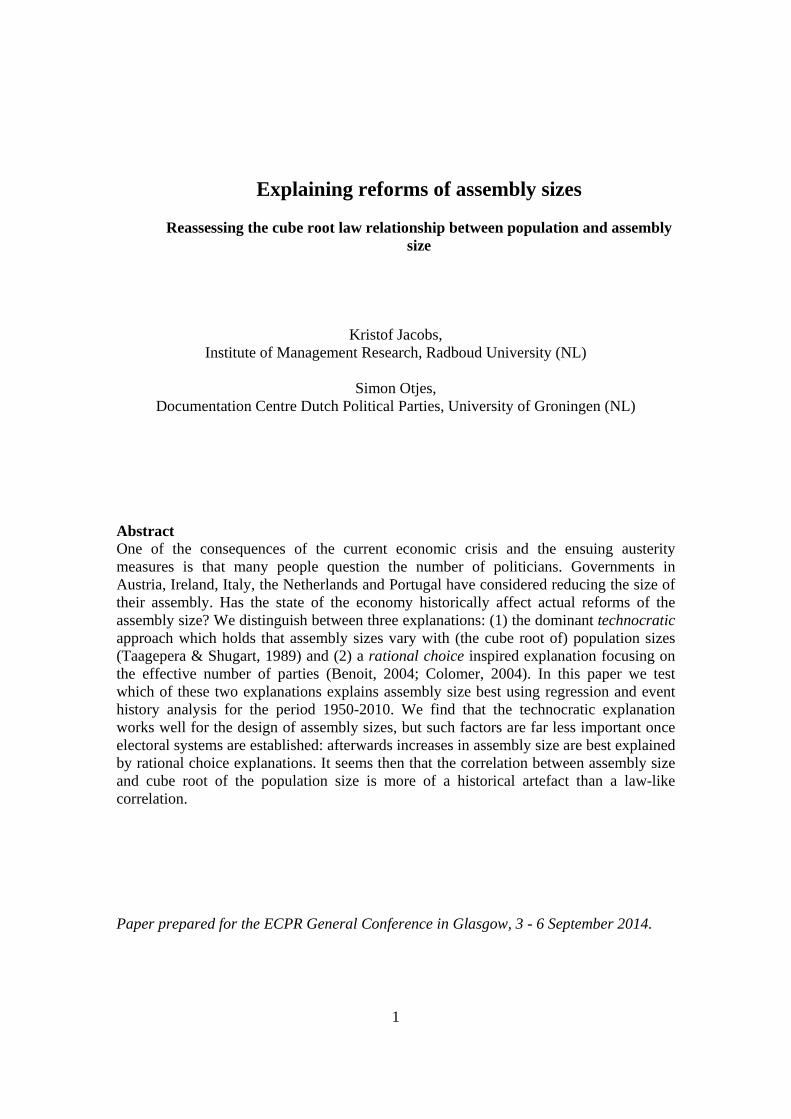
Abstract One of the consequences of the current economic crisis and the ensuing austerity measures is that many people question the number of politicians. Governments in Austria, Ireland, Italy, the Netherlands and Portugal have considered reducing the size of their assembly. Has the state of the economy historically affect actual reforms of the assembly size? We distinguish between three explanations: (1) the dominant technocratic approach which holds that assembly sizes vary with (the cube root of) population sizes (Taagepera & Shugart, 1989) and (2) a rational choice inspired explanation focusing on the effective number of parties (Benoit, 2004; Colomer, 2004). In this paper we test which of these two explanations explains assembly size best using regression and event history analysis for the period 1950-2010. We find that the technocratic explanation works well for the design of assembly sizes, but such factors are far less important once electoral systems are established: afterwards increases in assembly size are best explained by rational choice explanations. It seems then that the correlation between assembly size and cube root of the population size is more of a historical artefact than a law-like correlation. Paper prepared for the ECPR General Conference in Glasgow, 3 - 6 September 2014.
2
1. Introduction
One of the consequences of the current economic crisis and the ensuing austerity
measures is that citizens, journalists and politicians started to wonder: how many
politicians do we really need? In France (2012), Hungary (2010, 2011), Ireland (2011),
Italy (2012), Japan (2012), Mexico (2009, 2012), The Netherlands (2011), Portugal
(2011), Puerto Rico (2011), Romania (2009) and the United Kingdom (2011) bills were
introduced to reduce the number of national MPs.1 Many similar bills dealt with
reductions of regional and/or local MPs. At the same time, while old political regimes
crumbled because of inside pressures or were changed by external interference and new
ones were established in countries such as Afghanistan, Egypt, Iraq, Libya and Tunesia.
In these countries new assembly sizes had to be determined and the same question – how
many MPs do we need? – was asked. In both instances, the reform of existing assembly
sizes and the original design of new assembly sizes, an objective answer to that question
seems pretty difficult to give.
In many cases, political scientists ‘as electoral engineers’ (Farrell, 2011:191) have been
asked to comment or advise on the appropriate size (Lijphart, 1998). Typically, in such
cases political scientists point to the so-called ‘cube root law’ devised by Rein Taagepera,
which states that the number of seats in a given assembly approximates the square root of
its population (Taagepera, 1972; Taagepera and Shugart, 1989; Taagepera and Recchia,
2002; Taagepera, 2007). Taagepera and Shugart label this relation a law by because the
strong empirical connection is based on a deductive rational model. The empirical
argument is twofold: (1) when assembly sizes are originally designed, one can expect the
cube root law to hold, but (2) additionally -in the long term- ‘there should be a noticeable
trend toward larger assemblies’ (Taagepera and Shugart, 1989:179).2 However, so far this
second argument has not been examined rigorously in a longitudinal empirical test. As
1 The authors wish to thank Lidia Nunez for kindly allowing us to use this information. 2 Surely, ‘[a]ssemblies may fall below the predicted size because such nations are late in adjusting assembly size to increased population and literacy’ (Taagepera and Shugart, 1989:179), but in the long term one should see a trend towards increasing assembly sizes.
3
such we do not know whether the relationship is a historical artifact or a genuine law.3
Our central question is therefore:
How is the change in population size over time related to change in assembly size over
time?
Our main argument is that our understanding of assembly sizes can be improved
substantially by differentiating between a design phase (when the assembly is put in
place) and a reform phase (when the size is adapted). This distinction stems from the
electoral systems literature where it is routinely made (Farrell, 2011). We find that the
‘law’ indeed works as expected in the design phase. For as far as assemblies are ever
designed, the context of design is well-suited for the fairly technocratic logic that
underpins the cube-root law since during design the political actors work under great
uncertainty, need to establish a legitimate system and have other more pervasive tools at
their disposal if they want to further their own self-interest. However, once a given
assembly size is agreed upon, adjusting this size is a different game where a political
logic dependent on the number of parties is more important than the earlier technocratic,
population logic.
We will proceed as follows: first we will discuss the theoretical framework and
distinguish between the design and reform phase. In the empirical section we will carry
out an Ordinary Least Squares regression analysis of population and assembly size of
countries that have democratized since 1950. Next, we will use a longitudinal analysis,
namely event history/survival analysis, to estimate whether population increases affect
the assembly size on a unique dataset covering 120 democracies (time frame: 1950 to
2010).
2. Theoretical framework
Arend Lijphart (1985, 3) once judged the study of electoral systems ‘the most
underdeveloped subject in political science.’ Since then studies on the topic have
3 In fact, this is actually what Taagepera (2007) himself suggests: ‘By now we have appreciable time series for growth in population and assembly size. In view of the importance of assembly size in affecting the number of parties, a thorough reanalysis would be desirable.’
4
mushroomed. In the mid-1990s scholars started to look not only at the consequences of
electoral systems, but also at explanations of the origin and changes to these electoral
systems (Farrell, 2011:172). While the focus originally centered on major reforms of the
electoral formula, since the mid 2000s scholars adopted a more comprehensive approach
whereby other elements of the electoral legislation are studied (Leyenaar & Hazan,
2011:438), which opened up ‘a range of interesting questions’ (Farrell, 2011:172).
Nowadays, scholars also try to explain changes to such elements as ballot structure
(Jacobs & Leyenaar, 2011), gender quota (Celis, Krook & Meier, 2011), district
magnitude (Pilet, 2007) or electoral thresholds (Hooghe & Deschouwer, 2011). By doing
so, virtually all ‘major’ dimensions are now covered (Lijphart, 1994:10). There is one
exception though, and that is the assembly size. So far we still have very little insight in
how to explain changes to the assembly size. The little research trying to explain the size
of legislatures is mainly based on the cube root law. In what follows we will first discuss
this law and show why it is likely to only be partly true. Afterwards we offer a theoretical
framework encompassing broader insights from the broader literature on electoral system
design and reforms.
2.1 Assembly size, electoral systems and the cube root law
The core of the cube root law is that the size of a legislature is expected to be close to the
cube root of the population. Or more formally: S = (P)1/3, where S is the size of the
legislature and P the population size. The law consists of two elements: a theoretical,
deductive rationale and an empirical regularity (Taagepera and Shugart, 1989). The
theoretical argument is based on a ‘rational model’ starting from the assumption that
communication with constituents and other members of parliament is the most time-
consuming activity of representatives (Taagepera and Shugart, 1989:173).4 To minimize
the number of ‘communication channels’ an optimal assembly size can be calculated. As
Taagepera and Shugart (1989:179-182) elegantly show, this optimal size approximates
4 Though Taagepera and Shugart call the theoretical mechanism ‘rational’ most electoral reform scholars would call it a principled or technocratic argument based on the principles of representation and the quality of constituency service (Renwick, 2010: 39). Hence in what follows we will call the population size explanation the technocratic explanation. In the remainder of the paper, a ‘rational motivation’ will denote one where politicians maximize their power (Benoit, 2004).
5
the cube root law of the population size.5 Crucially, however, if the cube root law is
genuinely a law, it should also hold in the future and as a consequence assemblies should
adjust to population growth (Taagepera and Shugart, 1989: 179). The empirical part of
the cube root law consists of simple cross-sectional analyses based on population and
assembly size data from 1965 (Taagepera, 1972) and 1985 (Taagepera and Shugart,
1989).6 Both analyses are ‘static’: they compare the sizes of legislatures and population at
one point in time.
There are three reasons why especially the empirical part of the law is vulnerable and can
be strengthened.
(1) The authors suggest that population size is causally related to assembly size. Only
population data from after the establishment the assembly are used (Taagepera, 1972;
Taagepera and Shugart, 1989), A key condition for establishing causality is that the cause
is measured before the effect and not simultaneously. In physics, the rigor of which
Shugart and Taagepera wish to replicate, the causal order is the 'acid test of success'
(Hoover 1993: 693). Taagepera and Shugart (1989: 176) themselves note that this is
problematic because ‘[a]ssemblies may fall below the predicted size because such nations
are late in adjusting.’
(2) The latter statement leads to a second concern, Taagepera and Shugart (1989) suggest
that the relationship between population and assembly size is dynamic in that countries
‘adjust’ their assembly size based on population growth. This would require a
longitudinal empirical test. However, only cross-sectional tests are provided based on
data from 1965 and 1985.
(3) In the final (best-fitting) model, population size is multiplied by literacy rates and
working age population (Taagepera and Shugart, 1989:179). This is not aligned with the
theory underpinning the cube root law, which is built on communication with all
constituents (i.e. the whole electorate) and suggests that other variables may influence the 5 Because communication channels is understood as the one-to-one interaction routinely associated with constituency service and does not consider one-to-many mass media communication, ‘strictly speaking the model only applies to single-member districts’, though Taagepera and Shugart (1989:181) suggest that other systems may also ‘assume a similar relationship.’ 6 Taagepera and Recchia (2002) replicated the relationship for Upper Houses around 2000; Taagepera (2007) also tested the law for the European capitals. In both cases, the fit is lower than with the national legislatures.

6
relationship between population and assembly size. 7,8 All of this does not necessarily
mean that the cube root law is wrong, but suggests that further empirical analyses are
needed and it also suggests that other factors may be at play.9
Which other factors is, however, unclear. Somewhat strangely, so far the study of
explaining assembly sizes has remained understudied and fairly isolated from the rest of
the electoral reform literature. This is strange as Assembly sizes are clearly a part of
electoral systems. Lijphart (1994:12) notes that ‘if electoral systems are defined as
methods of translating votes to seats, the total numbers of seats available for this
translation appears to be an integral and legitimate part of the systems of translation.’
Indeed, the total number of seats available affects the proportionality of the overall
electoral system (Taagepera and Shugart, 1989:182-183; Lijphart, 1994:12-13; Colomer,
2004), especially at the lower end, where smaller assemblies have distinctly higher levels
of disproportionality (Farrell, 2011:158). If assembly size is a part of the electoral system,
one can expect that traditional explanations for changes of electoral systems can be
applied to assembly size as well. As such, it is a good starting point to look for other
factors that may explain changes in the assembly size.
2.2 Explanations of the original design of electoral systems
There are three reasons why the population size has a substantial impact when the
original assembly size is determined, namely uncertainty, legitimacy aspirations and the
relatively limited impact they have on seat shares.
When electoral systems are designed and the ‘original’ assembly size is laid out, this is
often done as part of a transition to democracy. Farrell (2011) distinguishes between three
waves of electoral system designs: a first wave when Western countries introduced
universal suffrage, a second when a substantial number of former colonies gained 7 In all fairness, all three are probably a remnant of data availability and the statistical state of the art at the time of the writing (1972 and 1989 respectively). Taagepera (2007:189) later on explicitly hinted at problems with data availability. 8 Taagepera (1972:385) actually explicitly included a term in his formula referring to unmeasured third variables in his earliest work on the topic. 9 In fact it may well be that the fit of the law is increased when the three problems are addressed.
7
independence and a third one when a number of former autocratic countries became
democratic. During each of these waves the people deciding on the new electoral system
had to operate under a context of uncertainty. The context was uncertain because little
was known about the partisan preferences of the people, but also because typically a
substantial part of the electoral system was designed from scratch, which meant it was
hard to predict how the votes-seat translation would turn out. During each of those waves
the designers also had to establish a legitimate system that symbolized a new, more
democratic reality. Assembly sizes by their very nature have an impact on the
proportionality of the electoral system, but mostly when the assembly size is small: when
an assembly size is increased from one to two the impact is substantial, but when it
increases from 1000 to 1001 (or even doubles to 2000) the impact on the proportionality
is far smaller (Colomer, 2004). Given that during the electoral system design phase the
whole electoral system is under scrutiny of change, at these times the assembly size is
likely to be of relatively minor interest to self-interested politicians. As Jacobs and
Leyenaar (2011) have found, these three elements provide the perfect fertile soil for
principled or more technocratic arguments such as the population size. Hence we can
expect that:
Hypothesis 1. At the time of the original design, population size is associated with
assembly size according to the cube root law.
2.3 Explanations of the reform of electoral systems
However, it is one thing to design an electoral system for a newly established democracy;
it is quite another to change an electoral system for an existing one. Under such
circumstances fairly technocratic arguments such as the ‘optimal assembly size’ may be
less important. There is no research on explanations of changes in the assembly size:
typically researchers take a static view of assembly sizes. There is however an ever-
expanding body of literature dealing with changes to electoral systems in general, which
we will apply to the topic of assembly sizes. Specifically one can distinguish three
schools of thought in the field of electoral reform: the rational choice, institutionalist and
historical comparativist schools (Farrell, 2011; Leyenaar and Hazan, 2011).
8
According to a first school, epitomized by Ken Benoit (2004), reformers are primarily
interested in increasing their vote shares. According to this model, electoral reforms will
occur when reformers have the ability (i.e. the required majority) to change the electoral
system to their benefit. The best example of such a reform is the French 1985 shift to PR
when the ruling French Socialist party was set to lose the upcoming election and wanted
to limit its losses (Renwick, 2010).
A second school, epitomized by Matthew Shugart (Shugart and Wattenberg, 2001;
Shugart, 2008) uses an institutionalist perspective and points to a combination of inherent
and contingent factors. The core of their argument is that electoral systems may have
inherent problems and produce systemic failures and anomalous outcomes. For instance,
majoritarian electoral systems can produce ‘wrong winners’ when that party with the
most seats was not backed by a majority of the voters such as the American presidential
election of 2000 where George W. Bush had more seats in the Electoral College but Al
Gore won the majority of the votes. Such problems often lead to calls for reform, and
incidentally to actual reforms.
A third school, epitomized by Alan Renwick (2010) and Gideon Rahat (2008), integrates
the two earlier ones and focuses on the broader picture using detailed case studies to
examine the actual processes that led to the reform. One of the key insights of the school
is that public opinion can have an impact on electoral reform through so-called ‘elite-
mass interaction’. In such cases, a minority of reformist politicians succeeds in
implementing electoral reform by mobilizing and/or using public dissatisfaction or even
outright public demand for reform (Renwick, 2010: 167).
To sum up, one can expect reforms when (1) reformers increase their seat shares by doing
so and/or (2) when the current electoral system fails to deliver (3) and/or when public
opinion is mobilized to back the reformers.
2.4 Applying electoral reform explanations to increases of the assembly size
How does this all translate to the study of assembly sizes? The more technocratic
reasoning outlined by Taagepera and Shugart fits best with the institutionalist school:
when the number of MPs is too low and when this shortage produces policy failures, the

9
assembly size needs to be increased. Consistent with the simple reasoning outlined by
Taagepera and Shugart (1989) one can thus expect that:
Hypothesis 2a. A wider gap between the population size and the assembly size increases
the likelihood of assembly size enlargement.
Let us now move to the expectation that sees MPs as rational actors seeking to increase
their own benefit. As mentioned earlier assembly size has an impact on the
proportionality of the electoral system: increasing the assembly size typically affects the
district magnitude and thereby the effective electoral threshold. Enlargement of the
legislature therefore typically reduces the seat shares of the larger parties, unless some
form of compensation takes place. However, a bigger assembly size also reduces the
personal power of individual politicians, as they have to compete with an increased
number of other MPs e.g. for seats in the most prestigious parliamentary committees, the
ownership of topics that are most popular with the media and the important positions
within their own party. In sum, the power of individual politicians within the party is
reduced as the number of direct competitors increases. As such one can expect increases
in the assembly size when party leaders want to reduce the power of individual MPs or
when smaller parties in the parliament have the power to negotiate their way into a
coalition government, something which Colomer (2004: 3) calls the ‘micro-mega rule.’
Hence one can expect calls for expanding the assembly size when there are more smaller
parties in the parliament (especially when they enter office in a coalition government).
Under such circumstances, increasing the assembly size grants a relatively limited benefit
in terms of seat shares for the smaller parties, but bigger parties have the benefit of
weakening their MPs and increasing the power of the party leadership, especially in
proportional systems. Therefore we can expect that:
Hypothesis 2b. A higher number of parties increases the likelihood of assembly size
enlargement.

10
What about the support of public opinion? If anything one can expect that citizens
typically do not demand more politicians. In fact, in many instances – especially in times
of economic crisis – a substantial portion of public opinion wants fewer MPs. In most
other instances one would actually expect attempts to reduce the assembly size. This is
indeed what Riera and Montero (2014) find in their study of bills on reductions of the
Assembly size at the regional level. In response to public dissatisfaction, regions
governed by a single-party majority wanted to reduce the assembly size (thereby reducing
the proportionality and their seat share), while in regions governed by a large party that
needed the support of a minor party introduced a bill that combined the reduction of the
assembly with a lowering of the legal electoral threshold to offset the loss of
proportionality. However, so far most of these reform proposals did not lead to actual
reductions. Hence, one can expect that if public opinion has any influence, it will be a
negative one.10
3. Data and method
3.1 Methods
This article combines two different analyses that look at the same data from different
perspectives. First, we carry out an analysis of the effect of population size on the design
of assemblies; that is: the first time these assemblies are ‘formed'. Here we use a bivariate
OLS regression with logged assembly size and population size in order to model the
power law relationship between the two variables. Second, we carry out a survival
analysis examining the effect of population growth on the likelihood of the enlargement
of the legislature. This technique is best-suited to examine factors influencing the
‘survival of cases’ (here: how long it takes before an assembly is enlarged). Additionally
it is also well-fit to carry out longitudinal analyses, something that is central in the cube
root law. As population size and the effective number of parties change over time, we
organized the data in the subject-period format to ensure the independent variables can
10 Unfortunately there are no longitudinal data on public dissatisfaction for a wide range of countries. As such including this variable would reduce the sample size dramatically. There are some data for economic performance, but even here data were only available for 55% of the observations, which seriously damages any analysis. Therefore we do not outline a hypothesis for this expectation.

11
vary over time.11 As our dependent variable is measured per election we apply the
continuous-time models.12 Specifically, we will use a Cox regression in this analysis
given that we have no strong theoretical grounds to expect that the baseline hazard
function has any specific shape, which rules out parametric models. The advantage of
Cox regressions is that they are very flexible regarding the baseline hazard function. They
come at the cost introducing an additional assumption: the proportional hazards
assumption.13 To test whether this assumption is violated we use Schoenfeld residuals.
Lastly, as a country can experience multiple consecutive enlargements of the legislature,
this needs to be controlled for. These so-called repeated events will be accounted for in
the analysis by introducing shared frailties.
3.2 Pool of countries, controls and operationalizations
In the design analysis, the dependent variable is the size of the assembly; in the redesign
analysis, the dependent variable is the increase in size of assemblies. We obtain our
assembly sizes from Bormann and Golder (2013) who have a comprehensive data set of
the electoral system for every legislative election in democratic countries since the
Second World War. This includes the size of the assembly that is elected. It covers 134
democracies and a total of 1197 legislative elections. They select regimes that Cheibub et
al. (2010) have identified as democratic. This conception of democracy depends not only
on the existence of democratically elected institutions but also alternation of power. This
means that it is overly conservative: countries like South Africa, where the same party
has been democratically re-elected to power four times, is not democratic.
A key independent variable is the population size. We derive population sizes from the
United Nations (2013a), which offers authoritative estimates of population sizes in most
UN members and a number of territories. This data is available for the period 1950 and
2010. In the design analysis, we use population size as an independent variable. In the 11 This means we have values per election period nested in countries. 12 Using discrete-time models (i.e. logit regression) would produce biased estimates as the time intervals are not of equal length: some governments fall early, while others last longer; some countries allow a maximum length of four years, while other allow five; which is why continuous-time models are required here (Mills, 2011:188). 13 It is assumed that e.g. when the risk of democratic erosions in Country A is twice that of Country B, this risk ratio should remain more or less the same over time.
12
reform analysis, we start by calculating the assembly size that one would expect (E[S])
based on the cube root law and the population of that country (P1/3).
E[S] = P1/3
The actual assembly size (S) is then subtracted from this expected assembly size. The
resulting number represents the seat gap (G) between the expected and the actual
assembly size. The higher the gap, the more likely an enlargement of the assembly
according to the Taagepera-Shugart model.
G = E[S]-S
The Argentinean legislature for instance counted 149 members in 1951. As there were
17,506,714 Argentines at the time, based on the cube root law we would expect 260 MPs.
The gap between the expected assembly size (260) and the actual assembly size (149) is
thus 111 seats.
In the reform analysis, we use a number of additional variables. Most importantly we use
the effective number of parties in the parliament to test our rational choice hypothesis.
The effective number of parties is included in the Bormann and Golder (2013) data set.
We also add three control variables, namely the number of years a country is democratic
and dummies measuring whether or not a country has a mixed member proportional
system, a single member district electoral system or not. In order to measure the years a
country is democratic we use the polity IV data set (Monty et al. 2014).14 The electoral
system is used as a control variable because multi-member proportional electoral
systems, like the German, tend to change the number of seats in assembly every election
due to the existence of overhang mandates (Überhangmandate). The single member
district dummy is included because the assembly size works differently in such political
systems (i.e. it is directly related to the number of districts; cf. Colomer, 2004).
14 This is obviously only relevant for countries that were already democratic before 1950.

13
This means that our data comes with restrictions: the assembly data is available for 133
countries. However, no UN population data is available for 13 of these; because these
countries no longer exist (e.g. West-Germany), are a micro-state (e.g. Nauru) or it is not a
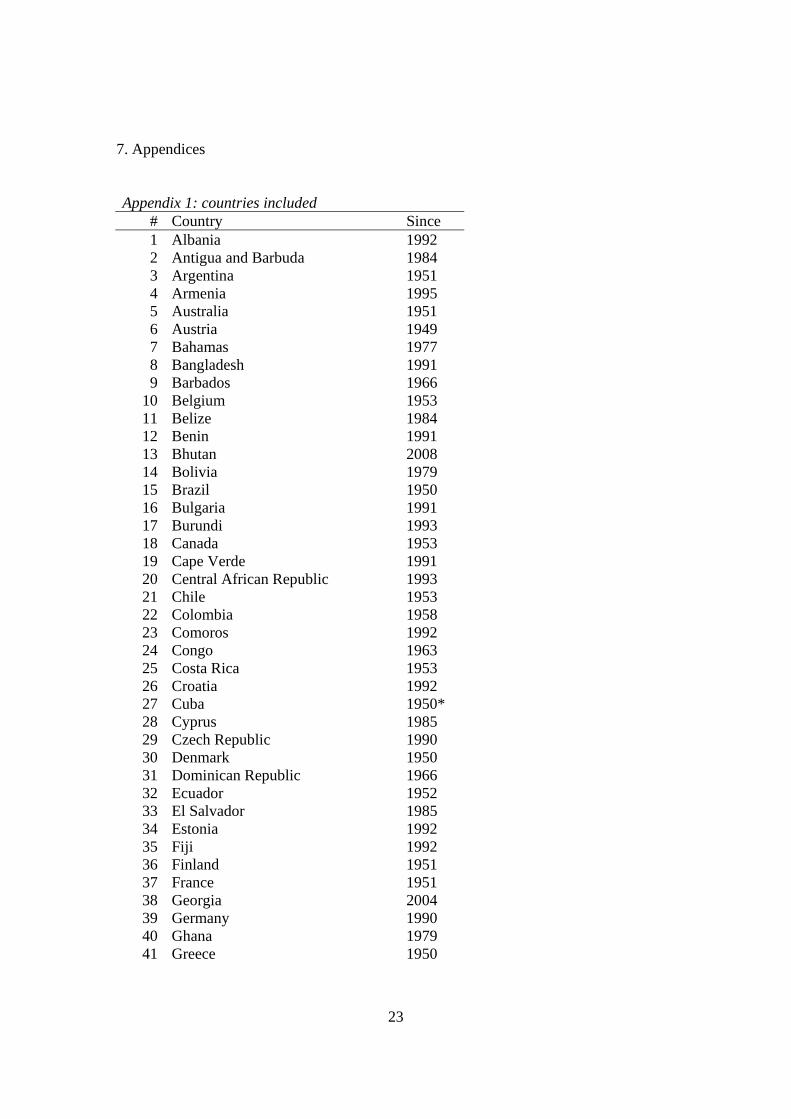
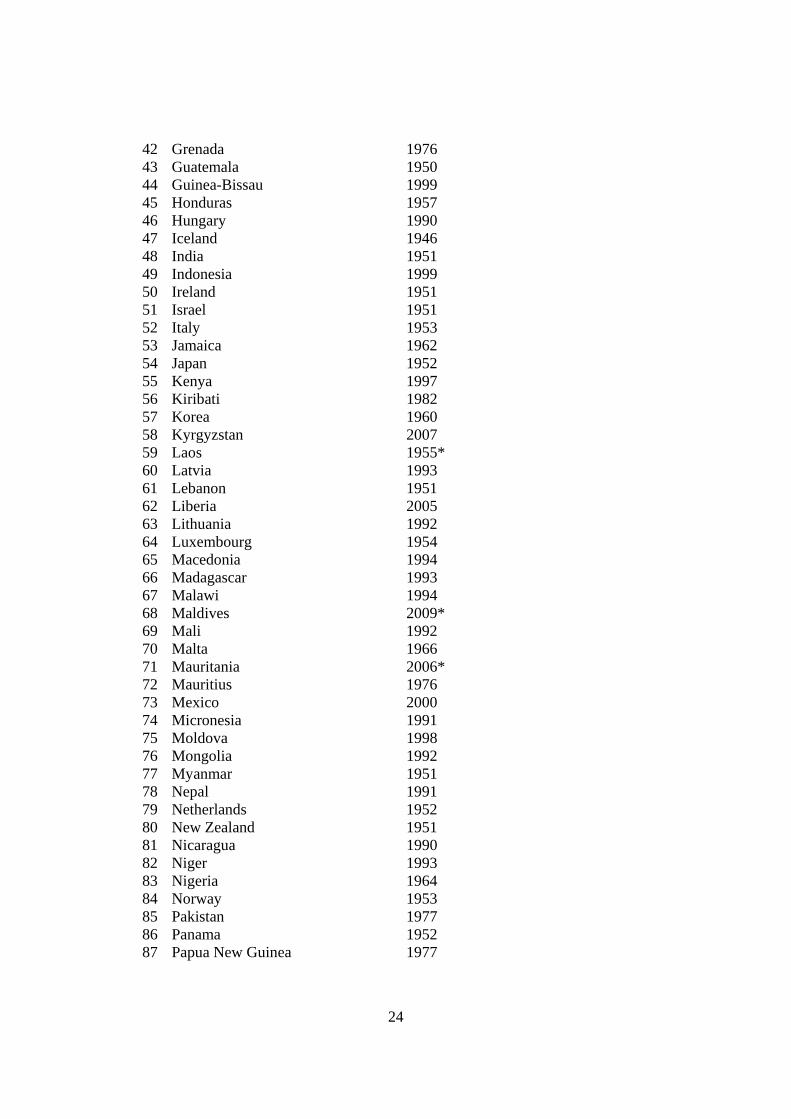
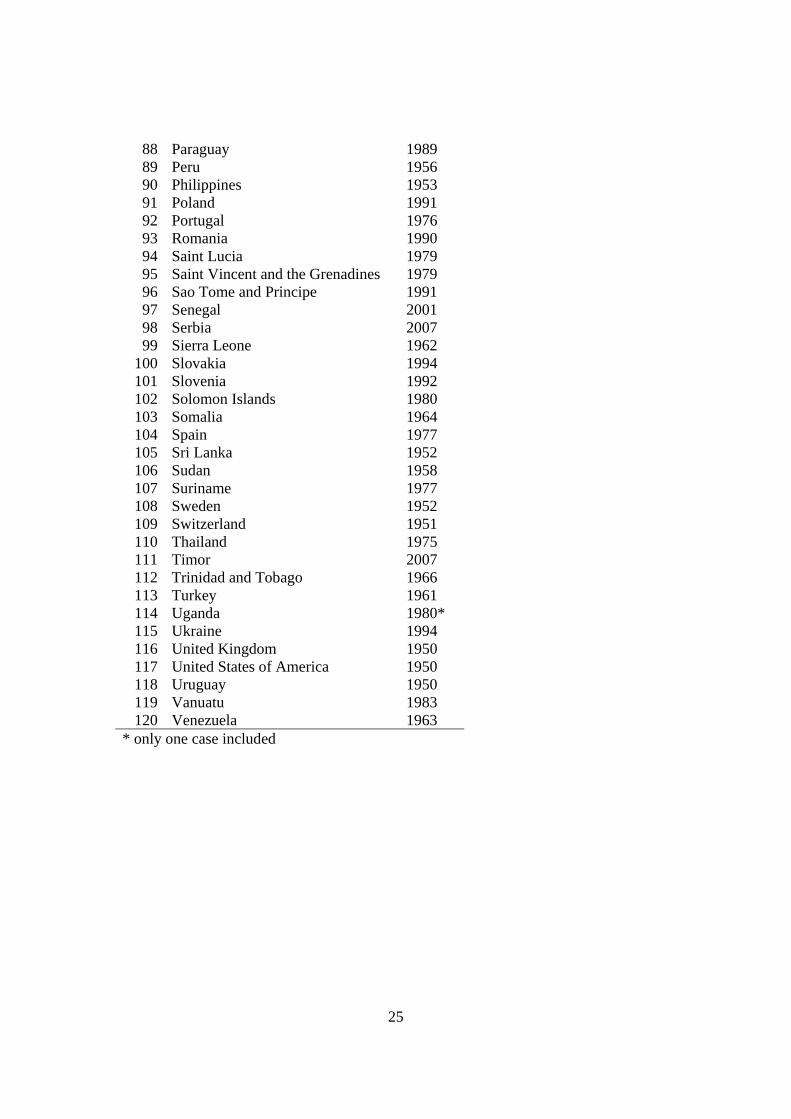
recognized UN-member (e.g. Taiwan). This leaves 120 states (these are listed in
Appendix 1). 81 states that are included by the UN dataset, but they are excluded from
the Bormann and Golder (2013), because they are not democratic or because they are not
independent states. The excluded countries are listed in Appendix 2. An overview of the
countries included in the design analysis is provided in Appendix 3. Lastly, the
descriptives of the variables in the reform analysis can be found in Appendix 4
4. Population size and the ‘design’ of assembly sizes
First we examine the design hypothesis. This proposes that during the design phase the
relationship between population size and assembly size follows the cube root law. The
technocratic model that Taagepera and Shugart (1989) formulated applies to the choices
made during the design of an assembly.
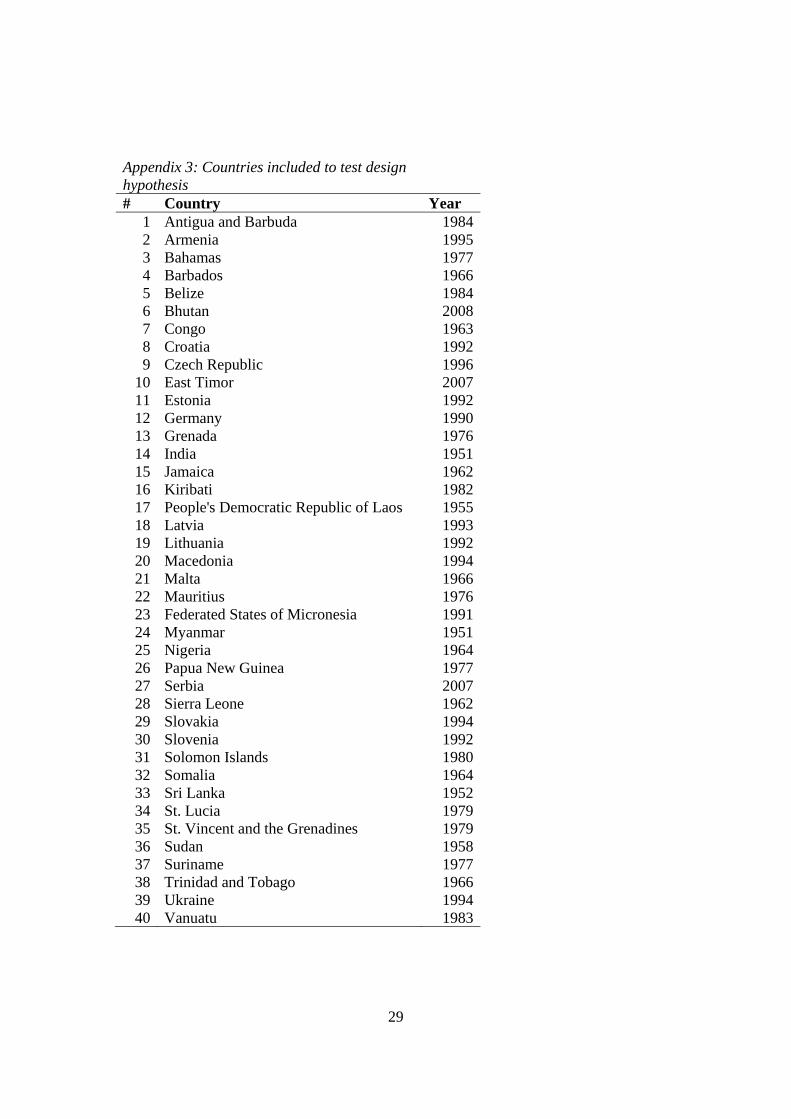
To this end we look at countries that formed their first assembly in the period 1950-2010
for which we have population and assembly size data. Appendix 3 lists 40 countries for
which have this data. These are all countries that became independent between 1950 and
2010 as well as Bhutan, which held its first elections in this period. Many other countries
democratized during this period, but the assembly size was not chosen ex nihilo during
the transition to democracy. There was an (elected) assembly in the autocratic phase. The
number of seats of this assembly was re-evaluated: these were cases of re-design not
design. A number of countries that became independent are not included in this list
because the Bormann and Golder (2013) do not include the first elected assembly.
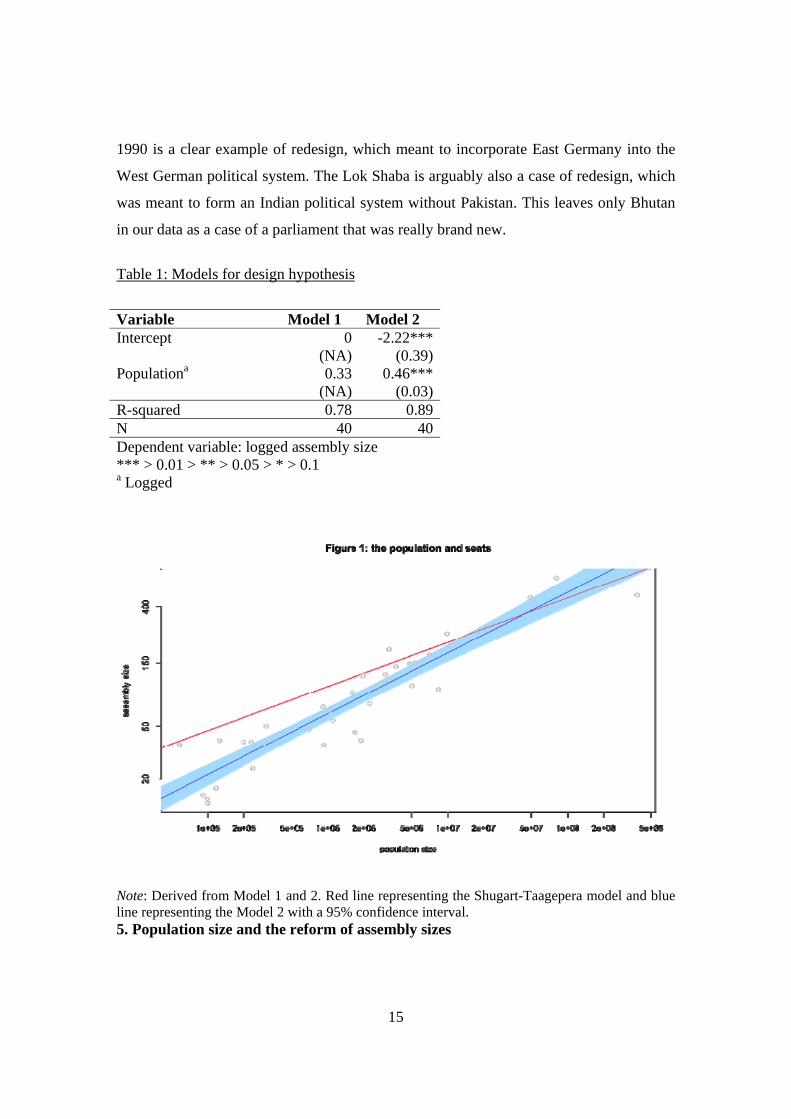
We evaluate two models: first, the Taagepera-Shugart model, which holds that the
relationship between population size and assembly size follows the cube root law. For
this deductively determined estimate we can calculate an r-squared value; we can also
plot it (in Figure 1). As we do not estimate the coefficients deductively they do not come
with standard errors, however. The cube root law explains 78% of the variance of the
sizes of assemblies. As Taagepera and Shugart (1989) already observed, this prediction is
14
poorer for countries with a small number of inhabitants than for countries with a large
number of inhabitants.
We can also take inductive approach, entering the logged population size as the
independent variable in a regression analysis to explain the logged assembly size. We can
see the model in Table 2: there are two crucial differences between Model 2 and Model 1.
There is an intercept that is significantly different from zero. This effectively means that
structurally the assembly sizes are almost 90% smaller than we would predict on basis of
the cube root law. At the same time however, the coefficient for logged population is
significantly higher: It is 0.46 (as compared to 0.33, that Shugart and Taagepera predict).
This implies that the relationship between assembly size and population size is much
steeper than the theory would propose. We can use Zelig to estimate the 95% confidence
intervals (Imai 2008, 2009). The lower offset and the higher coefficient mean that the
predicted values differ significantly between the Shugart-Taagepera model and our model
for all countries with less than ten million inhabitants. 85% of the countries in the
analysis fall within this region. The cube root law explains 78% of the variance of
assembly sizes. The inductive model has a higher explained variance and it explains 89%
of the variance of assembly sizes.
This analyses come with one major caveat: out of the 40 assemblies elected, 37 were
successors to local self-governing councils, either those preparing for home-rule in
decolonizing states (such as the Territorial Assembly that preceded the National
Assembly in the Republic of the Congo) or state councils in federal states (such as Czech
National Council that preceded the Chamber of Deputies). The fact that these are
successor parliaments is evident from the fact that countries do not immediately hold new
elections after they declare independence but elevate the existing regional council to
parliament and allow its term to expire before holding new elections. This means that
these councils are also actually not designed ex nihilo but that they are redesigns of
existing councils. Only three entities are not the direct successor of such as council: the
Bhutan National Assembly which was instituted for the first time, the German Bundestag,
which succeeded the West German Bundestag and the East German People's Chamber,
and the India Lok Shaba, which succeeded the Central Legislative Assembly which
administered both India and Pakistan. Of these three, the German Bundestag elected in
15
1990 is a clear example of redesign, which meant to incorporate East Germany into the
West German political system. The Lok Shaba is arguably also a case of redesign, which
was meant to form an Indian political system without Pakistan. This leaves only Bhutan
in our data as a case of a parliament that was really brand new.
Table 1: Models for design hypothesis
Variable Model 1 Model 2 Intercept 0
(NA)-2.22***
(0.39)Populationa 0.33
(NA)0.46***
(0.03)R-squared 0.78 0.89N 40 40Dependent variable: logged assembly size *** > 0.01 > ** > 0.05 > * > 0.1 a Logged
Note: Derived from Model 1 and 2. Red line representing the Shugart-Taagepera model and blue line representing the Model 2 with a 95% confidence interval. 5. Population size and the reform of assembly sizes

16
The 'static' analysis revealed that population size is clearly related to the assembly size
when these assemblies are first ‘designed’. But Taagepera and Shugart (1989:179) also
expected that assembly sizes would be ‘adjusted’ when population growth entailed that
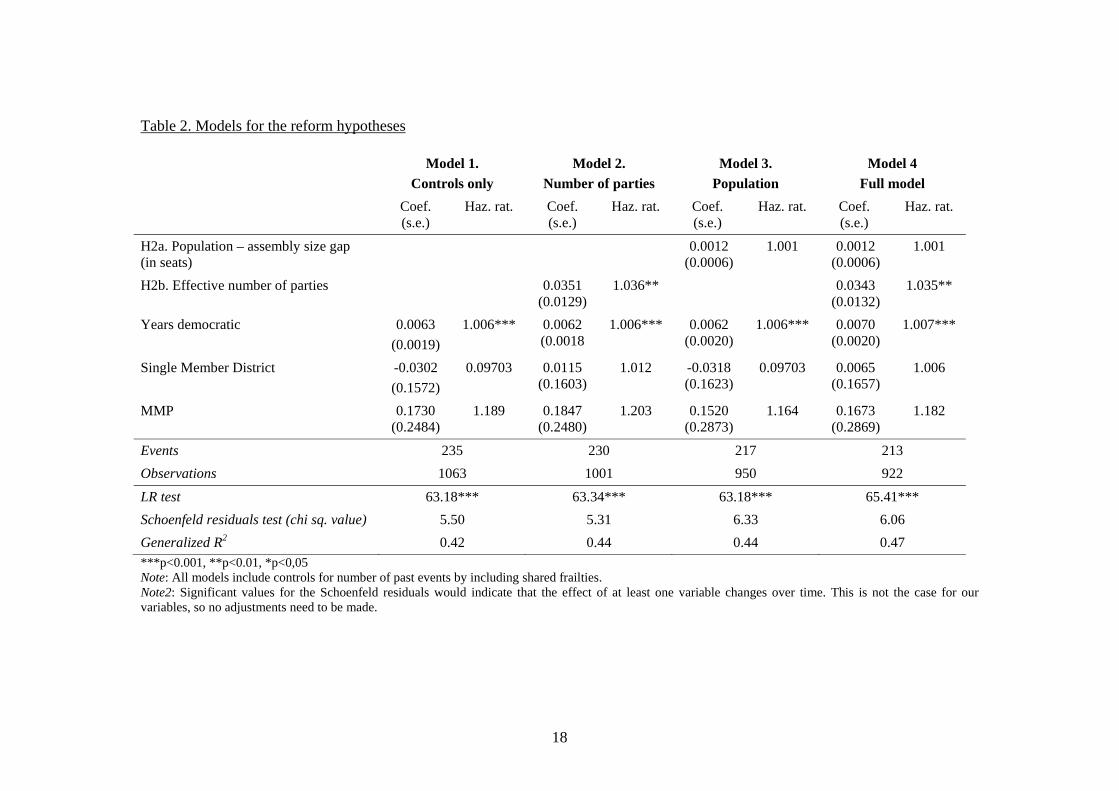
population and assembly size are out of tune. Table 2 shows the results of the Cox'
regressions.
Starting with the control variables, it seems that the type of electoral system does not
matter: countries with mixed member proportional and single member district systems
are not more likely to expand their legislatures than countries with other electoral
systems.15 The number of years that a country is democratic, however, matters quite a lot.
Long-standing democracies are more likely to increase their assembly size than newly
established ones. New democracies often change their electoral systems quite frequently,
but they typically focus on other elements that have a more direct impact on seat shares
(Bielasiak & Hulsey, 2013). In newer democracies, parties apparently have other
priorities than changing the assembly size.
Based on the theory we would expect a positive and significant coefficient of our
population variable (cf. hypothesis 2a). The direction of the coefficient is indeed positive,
as we expected. However, the effect appears to be very small and is only marginally
significant (p = 0.056). Indeed, the hazard ratio coefficient indicates that holding the
other covariates constant, the likelihood of experiencing an enlargement of the legislature
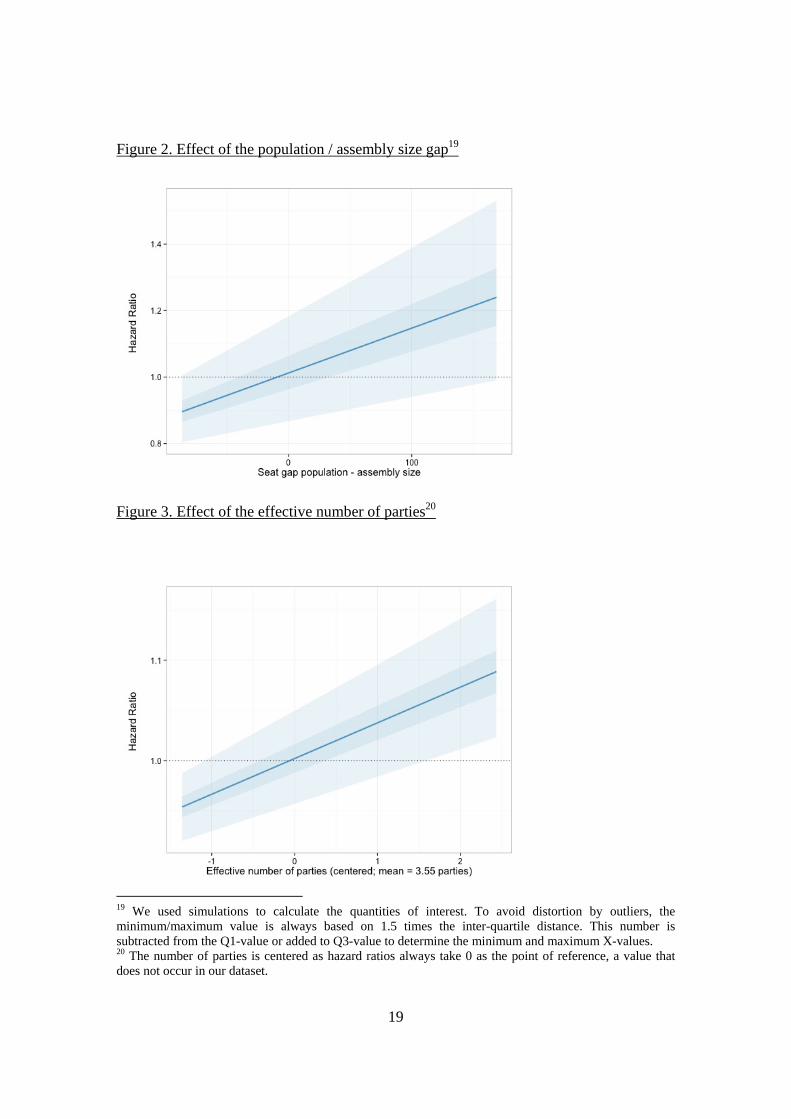
increases by just 0.1% per one-unit increase in our population variable.16 Perhaps the
effect is underestimated because the range of that variable is very wide? Indeed a one-
seat change is very small given that the population variable ranges from -279.40 to
516.70. Figure 2 therefore shows the effect for the full range of meaningful values of our
population variable.17 It highlights that despite the wide range, the effect is very small.
Only when the expected assembly size is 130 seats larger than the actual one, does the
effect of the difference between the actual and expected assembly size become
marginally significant. Even then it is only significant at the 0.1 level (not shown in
15 We use the label ‘likelihood’ to describe hazards/risks/conditional probabilities, as this makes interpretations more intuitive. 16 A one-unit increase here signifies that the difference between the expected assembly size (based on the population size) and the actual assembly size increases by one seat. 17 Meaningful, as in: excluding the outlier values.

17
figure) and it is never significant at the 0.05-level. Countries with a gap of 170 seats are
just 20% more likely to experience an enlargement of the legislature than countries where
the assembly is just the right size according to the cube root law. As such, hypothesis 2a
cannot be corroborated.
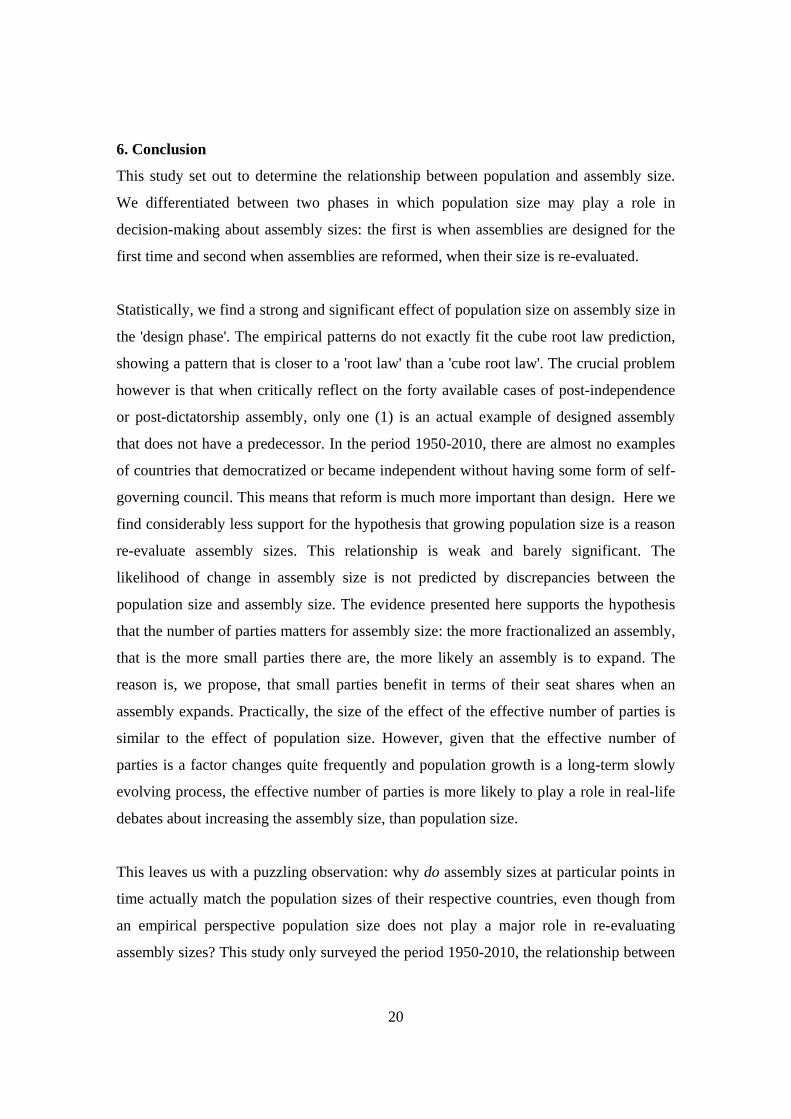
The rational choice perspective suggests that assembly sizes should increase when the
effective number of parties increases. This seems to be the case. The p-value of the
parties variable is below the 0.01 threshold (p = 0.0095) and the effect is positive, as we
expected. The coefficient also suggests that the effect is more substantial: for every
additional party, the likelihood of an enlargement of the legislature increases by 3.5%.
Once again though, this number may be misleading, this time because the range of the
effective number of parties variable is more limited than for the population variable. To
put things in perspective, we therefore plotted the meaningful values for the effective
number of parties variable in Figure 3. It turns out that the effect is somewhat moderate
because in practice most countries have relatively few parties (between two and six to be
precise). A country with six parties is about 14% more likely to experience an increase in
the assembly size than a country with just two parties.18
18 We also carried out analyses including whether or not a country was in recession. Unfortunately, the number of observations then drops to just 663 and whole countries disappear as missing. For the sake of completeness, the results of this analysis are: after correcting for the fact that the variable has non-proportional hazards, the coefficients and p-values for our two main variables, the number of parties and the population size are very similar. The effect of the economic situation is absent at first, but becomes statistically significant and negative after six years of having the same assembly size.
18
Table 2. Models for the reform hypotheses
Model 1.
Controls only
Model 2.
Number of parties
Model 3.
Population
Model 4
Full model
Coef. (s.e.)
Haz. rat. Coef. (s.e.)
Haz. rat. Coef. (s.e.)
Haz. rat. Coef. (s.e.)
Haz. rat.
H2a. Population – assembly size gap (in seats)
0.0012 (0.0006)
1.001 0.0012 (0.0006)
1.001
H2b. Effective number of parties 0.0351 (0.0129)
1.036** 0.0343 (0.0132)
1.035**
Years democratic 0.0063
(0.0019)
1.006*** 0.0062 (0.0018
1.006*** 0.0062 (0.0020)
1.006*** 0.0070 (0.0020)
1.007***
Single Member District -0.0302
(0.1572)
0.09703 0.0115 (0.1603)
1.012 -0.0318 (0.1623)
0.09703 0.0065 (0.1657)
1.006
MMP 0.1730 (0.2484)
1.189 0.1847 (0.2480)
1.203 0.1520 (0.2873)
1.164 0.1673 (0.2869)
1.182
Events 235 230 217 213
Observations 1063 1001 950 922
LR test 63.18*** 63.34*** 63.18*** 65.41***
Schoenfeld residuals test (chi sq. value) 5.50 5.31 6.33 6.06
Generalized R2 0.42 0.44 0.44 0.47
***p<0.001, **p<0.01, *p<0,05 Note: All models include controls for number of past events by including shared frailties. Note2: Significant values for the Schoenfeld residuals would indicate that the effect of at least one variable changes over time. This is not the case for our variables, so no adjustments need to be made.
19
Figure 2. Effect of the population / assembly size gap19
Figure 3. Effect of the effective number of parties20
19 We used simulations to calculate the quantities of interest. To avoid distortion by outliers, the minimum/maximum value is always based on 1.5 times the inter-quartile distance. This number is subtracted from the Q1-value or added to Q3-value to determine the minimum and maximum X-values. 20 The number of parties is centered as hazard ratios always take 0 as the point of reference, a value that does not occur in our dataset.
20
6. Conclusion
This study set out to determine the relationship between population and assembly size.
We differentiated between two phases in which population size may play a role in
decision-making about assembly sizes: the first is when assemblies are designed for the
first time and second when assemblies are reformed, when their size is re-evaluated.
Statistically, we find a strong and significant effect of population size on assembly size in
the 'design phase'. The empirical patterns do not exactly fit the cube root law prediction,
showing a pattern that is closer to a 'root law' than a 'cube root law'. The crucial problem
however is that when critically reflect on the forty available cases of post-independence
or post-dictatorship assembly, only one (1) is an actual example of designed assembly
that does not have a predecessor. In the period 1950-2010, there are almost no examples
of countries that democratized or became independent without having some form of self-
governing council. This means that reform is much more important than design. Here we
find considerably less support for the hypothesis that growing population size is a reason
re-evaluate assembly sizes. This relationship is weak and barely significant. The
likelihood of change in assembly size is not predicted by discrepancies between the
population size and assembly size. The evidence presented here supports the hypothesis
that the number of parties matters for assembly size: the more fractionalized an assembly,
that is the more small parties there are, the more likely an assembly is to expand. The
reason is, we propose, that small parties benefit in terms of their seat shares when an
assembly expands. Practically, the size of the effect of the effective number of parties is
similar to the effect of population size. However, given that the effective number of
parties is a factor changes quite frequently and population growth is a long-term slowly
evolving process, the effective number of parties is more likely to play a role in real-life
debates about increasing the assembly size, than population size.
This leaves us with a puzzling observation: why do assembly sizes at particular points in
time actually match the population sizes of their respective countries, even though from
an empirical perspective population size does not play a major role in re-evaluating
assembly sizes? This study only surveyed the period 1950-2010, the relationship between

21
population growth and assembly size may actually have been set in the period before that.
After that 1950 the relationship continued to exist for the simple reason that the order of
magnitudes of the population sizes and the assembly sizes was set. For instance, the order
of magnitude of the size of the Irish parliament was set in 1922 to reflect the country's
population size then. Since then the population has increased and the size of the Dáil may
have been updated: but the population of Ireland did not increase ten-fold. The very
nature of the cube root calculation allows to absorb quite a lot of population growth.
Therefore the rough cube root law may still hold, reflecting earlier population sizes.
Second, in a similar line of argument the size of many self-governing regional or
territorial bodies that existed before countries became independent may have been set up
to reflect the size of the population in the region when they were first formed. Since then
the population did not change an order of magnitude. Therefore again the cube root law
may still hold, but it reflects much earlier population sizes. The same may also apply for
representative assemblies that were formed during autocratic phases. This does mean,
however, that cube root law is not a law: there is no direct causal relationship between the
current population sizes and the current assembly sizes. The existence of a statistical
relationship may only reflect a relationship between assembly and population sizes when
they were set up. We find no proof of continuous updating of these assembly sizes in the
period 1950-2010. In sum, present correlations between population and assembly size are
probably more of a historical artifact than a sign of an empirical law.
Future research may therefore want to expand their research in two directions: first, we
may want to look in more detail at the size of assemblies when they are actually designed
for the first time. This means that for Western democracies we would have to look at the
pre-War period. We would need to go back to as far as 930 for the Icelandic Althing. For
countries in Asia, Africa and Eastern Europe that, since the Second World War, have
become newly independent, we would need to look at the sizes of regional and territorial
self-governing bodies. And finally for autocracies, we would have to look at the size of
populations and assemblies for the first time at which assemblies were set up -
independent of the level of democracy in that country.
22
Second, future research may also want to provide a more elaborate longitudinal test of the
relationship between population and assembly size. For instance, in this study we could
not test the effect of public opinion, nor of factors that affect public opinion such a
country's economic performance. Given the lack of empirical support for the effect of
population size (from the institutionalist logic) and the relative small impact of the
number of political parties (rational considerations by MPs), the literature would indicate
that these kinds of explanations may be a third and more fruitful avenue.
23
7. Appendices Appendix 1: countries included
# Country Since 1 Albania 1992 2 Antigua and Barbuda 1984 3 Argentina 1951 4 Armenia 1995 5 Australia 1951 6 Austria 1949 7 Bahamas 1977 8 Bangladesh 1991 9 Barbados 1966
10 Belgium 1953 11 Belize 1984 12 Benin 1991 13 Bhutan 2008 14 Bolivia 1979 15 Brazil 1950 16 Bulgaria 1991 17 Burundi 1993 18 Canada 1953 19 Cape Verde 1991 20 Central African Republic 1993 21 Chile 1953 22 Colombia 1958 23 Comoros 1992 24 Congo 1963 25 Costa Rica 1953 26 Croatia 1992 27 Cuba 1950* 28 Cyprus 1985 29 Czech Republic 1990 30 Denmark 1950 31 Dominican Republic 1966 32 Ecuador 1952 33 El Salvador 1985 34 Estonia 1992 35 Fiji 1992 36 Finland 1951 37 France 1951 38 Georgia 2004 39 Germany 1990 40 Ghana 1979 41 Greece 1950
24
42 Grenada 1976 43 Guatemala 1950 44 Guinea-Bissau 1999 45 Honduras 1957 46 Hungary 1990 47 Iceland 1946 48 India 1951 49 Indonesia 1999 50 Ireland 1951 51 Israel 1951 52 Italy 1953 53 Jamaica 1962 54 Japan 1952 55 Kenya 1997 56 Kiribati 1982 57 Korea 1960 58 Kyrgyzstan 2007 59 Laos 1955* 60 Latvia 1993 61 Lebanon 1951 62 Liberia 2005 63 Lithuania 1992 64 Luxembourg 1954 65 Macedonia 1994 66 Madagascar 1993 67 Malawi 1994 68 Maldives 2009* 69 Mali 1992 70 Malta 1966 71 Mauritania 2006* 72 Mauritius 1976 73 Mexico 2000 74 Micronesia 1991 75 Moldova 1998 76 Mongolia 1992 77 Myanmar 1951 78 Nepal 1991 79 Netherlands 1952 80 New Zealand 1951 81 Nicaragua 1990 82 Niger 1993 83 Nigeria 1964 84 Norway 1953 85 Pakistan 1977 86 Panama 1952 87 Papua New Guinea 1977
25
88 Paraguay 1989 89 Peru 1956 90 Philippines 1953 91 Poland 1991 92 Portugal 1976 93 Romania 1990 94 Saint Lucia 1979 95 Saint Vincent and the Grenadines 1979 96 Sao Tome and Principe 1991 97 Senegal 2001 98 Serbia 2007 99 Sierra Leone 1962
100 Slovakia 1994 101 Slovenia 1992 102 Solomon Islands 1980 103 Somalia 1964 104 Spain 1977 105 Sri Lanka 1952 106 Sudan 1958 107 Suriname 1977 108 Sweden 1952 109 Switzerland 1951 110 Thailand 1975 111 Timor 2007 112 Trinidad and Tobago 1966 113 Turkey 1961 114 Uganda 1980* 115 Ukraine 1994 116 United Kingdom 1950 117 United States of America 1950 118 Uruguay 1950 119 Vanuatu 1983 120 Venezuela 1963
* only one case included

26
Appendix 2: countries excluded
# Country Reason of exclusion Included in 1 Afghanistan no democracy included in UN (2013a) 2 Algeria no democracy included in UN (2013a) 3 Andorra too small included in Golder (2013) 4 Angola no democracy included in UN (2013a) 5 Aruba not independent included in UN (2013a) 6 Azerbaijan no democracy included in UN (2013a) 7 Bahrain no democracy included in UN (2013a) 8 Belarus no democracy included in UN (2013a) 9 Bosnia and Herzegovina no democracy included in UN (2013a)
10 Botswana no democracy included in UN (2013a) 11 Brunei Darussalam no democracy included in UN (2013a) 12 Burkina Faso no democracy included in UN (2013a) 13 Cambodia no democracy included in UN (2013a) 14 Cameroon no democracy included in UN (2013a) 15 Chad no democracy included in UN (2013a) 16 Channel Islands not independent included in UN (2013a) 17 China no democracy included in UN (2013a) 18 Hong Kong SAR not independent included in UN (2013a) 19 Macao SAR not independent included in UN (2013a) 20 Côte d'Ivoire no democracy included in UN (2013a) 21 Curaçao not independent included in UN (2013a) 22 Czechoslovakia no longer exists included in Golder (2013) 23 Dem. People's Republic of Korea no democracy included in UN (2013a) 24 Democratic Republic of the Congo no democracy included in UN (2013a) 25 Djibouti no democracy included in UN (2013a) 26 Dominica too small included in Golder (2013) 27 Egypt no democracy included in UN (2013a) 28 Equatorial Guinea no democracy included in UN (2013a) 29 Eritrea no democracy included in UN (2013a) 30 Ethiopia no democracy included in UN (2013a) 31 French Guiana not independent included in UN (2013a) 32 French Polynesia not independent included in UN (2013a) 33 Gabon no democracy included in UN (2013a) 34 Gambia no democracy included in UN (2013a) 35 Guadeloupe no democracy included in UN (2013a) 36 Guam not independent included in UN (2013a) 37 Guinea no democracy included in UN (2013a) 38 Guyana no democracy included in UN (2013a) 39 Haiti no democracy included in UN (2013a) 40 Iran (Islamic Republic of) no democracy included in UN (2013a) 41 Iraq no democracy included in UN (2013a) 42 Jordan no democracy included in UN (2013a) 43 Kazakhstan no democracy included in UN (2013a)

27
44 Kuwait no democracy included in UN (2013a) 45 Lesotho no democracy included in UN (2013a) 46 Libya no democracy included in UN (2013a) 47 Liechtenstein too small included in Golder (2013) 48 Malaysia no democracy included in UN (2013a) 49 Marshall Islands too small included in Golder (2013) 50 Martinique not independent included in UN (2013a) 51 Mayotte not independent included in UN (2013a) 52 Montenegro no democracy included in UN (2013a) 53 Morocco no democracy included in UN (2013a) 54 Mozambique no democracy included in UN (2013a) 55 Namibia no democracy included in UN (2013a) 56 Nauru too small included in Golder (2013) 57 New Caledonia not independent included in UN (2013a) 58 Oman no democracy included in UN (2013a) 59 Palau too small included in Golder (2013) 60 Polynesia not independent included in UN (2013a) 61 Puerto Rico not independent included in UN (2013a) 62 Qatar no democracy included in UN (2013a) 63 Réunion not independent included in UN (2013a) 64 Russian Federation no democracy included in UN (2013a) 65 Rwanda no democracy included in UN (2013a) 66 Saint Kitts and Nevis too small included in Golder (2013) 67 Samoa not independent included in UN (2013a) 68 San Marino too small included in Golder (2013) 69 Saudi Arabia not independent included in UN (2013a) 70 Serbia and Montenegro no longer exists included in Golder (2013) 71 Seychelles no democracy included in UN (2013a) 72 Singapore no democracy included in UN (2013a) 73 South Africa no democracy included in UN (2013a) 74 South Sudan not existent yet included in UN (2013a) 75 State of Palestine not independent included in UN (2013a) 76 Swaziland no democracy included in UN (2013a) 77 Syrian Arab Republic no democracy included in UN (2013a) 78 Taiwan not independent included in Golder (2013) 79 Tajikistan no democracy included in UN (2013a) 80 Tanzania no democracy included in UN (2013a) 81 Togo no democracy included in UN (2013a) 82 Tonga no democracy included in UN (2013a) 83 Tunisia no democracy included in UN (2013a) 84 Turkmenistan no democracy included in UN (2013a) 85 Tuvalu too small included in Golder (2013) 86 United Arab Emirates no democracy included in UN (2013a) 87 United States Virgin Islands not independent included in UN (2013a) 88 Uzbekistan no democracy included in UN (2013a) 89 Viet Nam no democracy included in UN (2013a)
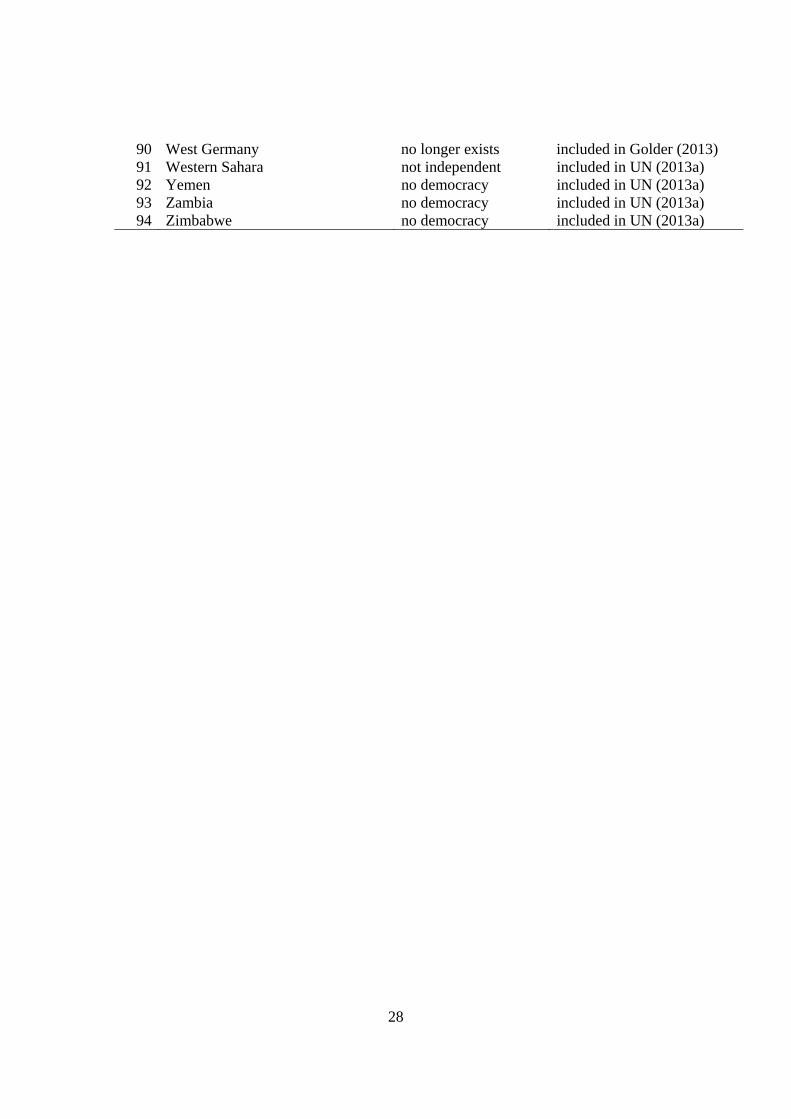
28
90 West Germany no longer exists included in Golder (2013) 91 Western Sahara not independent included in UN (2013a) 92 Yemen no democracy included in UN (2013a) 93 Zambia no democracy included in UN (2013a) 94 Zimbabwe no democracy included in UN (2013a)
29
Appendix 3: Countries included to test design hypothesis # Country Year
1 Antigua and Barbuda 19842 Armenia 19953 Bahamas 19774 Barbados 19665 Belize 19846 Bhutan 20087 Congo 19638 Croatia 19929 Czech Republic 1996
10 East Timor 200711 Estonia 199212 Germany 199013 Grenada 197614 India 195115 Jamaica 196216 Kiribati 198217 People's Democratic Republic of Laos 195518 Latvia 199319 Lithuania 199220 Macedonia 199421 Malta 196622 Mauritius 197623 Federated States of Micronesia 199124 Myanmar 195125 Nigeria 196426 Papua New Guinea 197727 Serbia 200728 Sierra Leone 196229 Slovakia 199430 Slovenia 199231 Solomon Islands 198032 Somalia 196433 Sri Lanka 195234 St. Lucia 197935 St. Vincent and the Grenadines 197936 Sudan 195837 Suriname 197738 Trinidad and Tobago 196639 Ukraine 199440 Vanuatu 1983

30
Appendix 4. Descriptives of the variables
Name variable Minimum Maximum Mean
Increase in assembly size 0 1 (235 observations) 0.20
Population size gap -279.40 516.70 32.29
Effective number of parties 1 52.42 3.55
Years democratic 0 201 43.34
Mixed member proportional 0 1 (55 observations) 0.05
Single member district 0 1 (287 observations) 0.24
Total N: 1197

31
8. References
Bormann, C. and M. Golder (2013) "Democratic Electoral Systems around the world
1946-2011" Electoral Studies 32: 360-369. Data obtained from
https://files.nyu.edu/mrg217/public/elections.html.
Benoit, Kenneth (2004). ‘Models of Electoral System Change’, Electoral Studies, 23:3,
363–89.
Bielasiak, Jack, and John W. Hulsey. (2013). "Party system determinants of electoral
reform in post-communist states." Communist and Post-Communist Studies 46.1:
1-12.
Celis, Karen, Mona Lena Krook, and Petra Meier. (2011). "The rise of gender quota laws:
expanding the spectrum of determinants for electoral reform." West European
Politics 34.3: 514-530.
Cheibub, J.A., J. Gandhi and J.R. Vreeland (2010) "Democracy and dictatorship
revisited" Public Choice 143 (1): 67-101.
Colomer, Josep M. (2004). "Handbook of electoral system choice." Houndmills: Palgrave
Macmillan.
Farrell, David M. (2011). Electoral Systems: A Comparative Introduction. (2nd edition).
Houndmills: Palgrave Macmillan.
Hooghe, Marc, and Kris Deschouwer. (2011). "Veto players and electoral reform in
Belgium." West European Politics 34.3: 626-643.
Hoover, Kevin D.(1993) “Causality and Temporal Order in Macroeconomics or Why
Even Economists Don’t Know How to Get Causes from Probabilities”. The
British Journal for the Philosophy of Science, 44.4: 693-710.
Kosuke, I., G. King and O. Lau (2009) "Zelig: Everyone's Statistical Software"
http://gking.harvard.edu/zelig.
Kosuke, I., G. King and O. Lau (2008) ``Toward A Common Framework for Statistical
Analysis and Development,'' Journal of Computational and Graphical Statistics,
14(7): 892-913.
Leyenaar, Monique, and Reuven Y. Hazan (2011). ‘Reconceptualising Electoral Reform’,
West European Politics, 34:3, 437–55.

32
Lijphart, Arend (1985). "The field of electoral systems research: A critical survey."
Electoral Studies 4.1: 3-14.
Lijphart, Arend (1994). Electoral Systems and Party Systems: A Study of Twenty-Seven
Democracies, 1945–1990. Oxford: Oxford University Press.
Lijphart, Arend (1998) "Reforming the House: Three Moderately Radical Proposals" PS:
Political Science and Politics 31(1): pp.10-13.
Lijphart, Arend (2004) "Constitutional Design for Divided Societies" Journal of
Democracy 15(2): 96-109.
Marshall, M. T.R. Gurr and K. Jaggers (2014) "Polity IV Project. Political Regime
Characteristics and Transitions 1800-2013" Center for Systemic Peace, Vienna,
USA. Data obtained from http://www.systemicpeace.org/inscrdata.html.
Mills, Melinda (2011). Introducing survival and event history analysis. Sage
Publications.
Pilet, Jean-Benoit. (2007). "Strategies under the surface: The determinants of redistricting
in Belgium." Comparative European Politics 5.2: 205-225.
Rahat, G. (2008). The politics of regime structure reform in democracies: Israel in
comparative and theoretical perspective. Albany, NY: State University of New
York Press.
Renwick, Alan (2010). The Politics of Electoral Reform: Changing the Rules of
Democracy. Cambridge: Cambridge University Press.
Riera, Pedro and Montero, José Ramon (2014) “Do Turkeys Vote for Christmas in
Southern Europe? The Tiny Impact of the Economic Crisis on Institutional
Reform in Spain” Paper presented at ECPR Joint Sessions, 10 - 15 April.
Shugart, Matthew (2008). ‘Inherent and Contingent Factors in Reform Initiation in
Plurality Systems’, in André Blais (ed.), To Keep or to Change First Past the
Post? The Politics of Electoral Reform. Oxford: Oxford University Press, 7–60.
Taagepera, Rein. (1972) "The size of national assemblies." Social Science Research 1.4:
385-401.
Taagepera, Rein. (2007) Predicting party sizes: the logic of simple electoral systems.
Oxford University Press.

33
Taagepera, Rein, and Steven P. Recchia. (2002) "The size of second chambers and
European assemblies." European Journal of Political Research 41.2: 165-185.
Taagepera, Rein, and Matthew Soberg Shugart (1989). Seats and votes: The effects and
determinants of electoral systems. New Haven: Yale University Press.
United Nations (2013) "World Population Prospects: The 2012 Revision" United Nations
Population Division: New York http://esa.un.org/unpd/wpp/Excel-
Data/population.htm.
United Nations (2013) "National Accounts Main Aggregates Database" United Nations
Statistics Division: New York http://unstats.un.org/unsd/snaama/introduction.asp.