Embed Size (px)
Citation preview
Makara Hubs-Asia, 2018, 22(1): 29-42 DOI: 10.7454/hubs.asia.2130118
29 July 2018 ½Vol. 22 ½ No.1
Exploratory and Confirmatory Factor Analysis of the Academic Motivation Scale (AMS)–Bahasa Indonesia
Lina Natalya* and Cynthia Vivian Purwanto
Faculty of Psychology, Universitas Surabaya, Surabaya 60293, Indonesia
*E-mail: [email protected]
Abstract
Validity evidence based on internal structure is important for psychological measurements and this internal structure can be evaluated by factor analysis. Two types of factor analysis are often conducted on psychometric tests: confirmatory factor analysis (CFA) and exploratory factor analysis (EFA). This study compared the groupings of the 30-item Indonesian version of the Academic Motivation Scale (AMS–Bahasa Indonesia), using both CFA and EFA. The CFA of the data sample from 1,168 undergraduates indicated that all dimensions and sub dimensions of the AMS–Bahasa Indonesia had good internal structural validity. Each subdimension, dimension, and variable of the AMS–Bahasa Indonesia fulfilled the goodness of fit criteria (RMSEA ≤ 0.08; GFI ≥ 0.9; CR ≥ 0.7). The EFA showed that all items of the three dimensions grouped perfectly as designed by Vallerand et al. (1992), and the factor loading values of all items are greater than or equal to 0.4. Although there are cross loadings of items, it can be explained as why it occurs. The results of the internal consistency analysis showed that the AMS–Bahasa Indonesia is a reliable measurement (α ≥ 0.7). In conclusion the AMS–Bahasa Indonesia is a valid instrument for measuring academic motivation accurately and reliably. Analisis Faktor Eksploratori dan Konfirmatori pada Academic Motivation Scale (AMS)–Bahasa
Indonesia
Abstrak
Pembuktian validitas berdasarkan struktur internal adalah satu dari lima sumber bukti validitas untuk mengevaluasi validitas alat ukur psikologis. Analisis faktor adalah salah satu cara untuk membuktikan validitas berdasarkan sumber bukti struktur internal. Umumnya, terdapat dua jenis analisis faktor digunakan untuk pengujian psikometri, yaitu confirmatory factor analysis (CFA) dan exploratory factor analysis (EFA). Penelitian ini membedakan hasil pengelompokan tiga puluh butir academic motivation scale (AMS)–Bahasa Indonesia bedasarkan CFA dan EFA. Berdasarkan CFA dari sampel sebanyak 1.168 orang mahasiswa, diketahui bahwa semua dimensi dan sub-dimensi AMS-Bahasa Indonesia memiliki validitas struktur internal yang cukup baik. Setiap sub-dimensi, dimensi, dan variabel memenuhi semua ukuran goodness of fit (RMSEA £ 0,08; GFI ³ 0,9; CR ³ 0,7) dan dalam EFA ditemukan bahwa butir-butir dari ketiga dimensi mengelompok secara sempurna seperti yang didesain oleh Vallerand et al. (1992), ditunjukkan dari besaran factor loading semua butir lebih besar sama dengan 0,4. Sekalipun terdapat beberapa butir yang ditemukan cross loading namun pengelompokan tersebut dapat dijelaskan secara konseptual mengapa hal tersebut terjadi. Pada evaluasi validitas ini juga dilakukan pengujian konsistensi internal. Hasilnya menunjukkan bahwa AMS-Bahasa Indonesia adalah alat ukur yang reliabel (α ³ 0,7). Oleh karena itu, dapat disimpulkan bahwa AMS-Bahasa Indonesia adalah alat ukur yang valid sehingga dapat digunakan mengukur motivasi akademik secara akurat dan terpercaya. Keywords: academic motivation scale, confirmatory factor analysis, exploratory factor analysis, validation Citation: Natalya, L. & Purwanto, C. V. (2018). Exploratory and confirmatory factor analysis of the academic motivation scale (AMS)–Bahasa Indonesia. Makara Human Behavior Studies in Asia, 22(1), 29-42. doi: 10.7454/hubs.asia.2130118
30 Natalya & Purwanto
Makara Hubs-Asia. July 2018 ½Vol. 22 ½ No. 1
1. Introduction Motivation is an important latent variable to study, particularly in the field of academia, where motivation greatly influences outcomes (Deci & Ryan, 2008). The Self-Determination Theory (SDT), developed by Deci and Ryan (in Vallerand, Pelletier, Blais, & Briere, 1992) provides an important explanation for academic motiva-tion. In recent decades, SDT has come to be one of the most widely used theoretical approaches for work on academic motivation (Cokley, 2015). This approach identifies three basic psychological needs—competence, autonomy, and relatedness— which are essential for fa-cilitating optimal functioning and well-being (Ryan & Deci, 2000b). Deci and Ryan (2002) found that indi-viduals each have a different self-regulation related to his or her academic motivation that is dependent on levels of personal autonomy. SDT assumes that every person has a natural drive to be intrinsically motivated once his or her basic psychological needs are fulfilled (Deci & Ryan, 1985). According to Deci and Ryan (2000), academic motivation is a continuum variable, beginning with amotivation, moving through extrinsic motivation, and reaching the highest level of motivation, which is intrinsic motivation. Any person may be found on the lowest or highest level of motivation or on one in be-tween. There are six levels of self-regulation in academic motivation, working from the theoretical, functional, and experiential points of view; these are amotivation, external regulation, introjected regulation, identified regulation, integrated regulation, and intrinsic regulation (Deci & Ryan, 2000). Intrinsic motivation is motivation based on non-drive (Deci & Ryan, 1985); it is an internal drive to action, which causes the individual to feel happy and satisfied for having accomplished an activity (Deci & Ryan in Vallerand et al., 1992). When an action is undertaken by intrinsic motivation, it is done not for any separable consequences, but to obtain the inherent satisfaction of having done it (Ryan & Deci, 2000a); it itself is the energy source at the center of an individual’s activity (Deci & Ryan, 1985). Ryan and Stiller (in Ryan & Deci, 2000a) observe that intrinsic motivation is a central phenomenon in education, because higher mo-tivation produces better quality learning and creativi-ty. Intrinsic motivation has three subdimensions: intrin-sic motivation to know (IMTK), intrinsic motivation to accomplish things (IMTA), and intrinsic motivation to experience stimulation (IMES). IMTK is the feeling of happiness and satisfaction expe-rienced while learning and exploring something new. This is in line with Vallerand’s (2004) observation that IMTK arises as a drive to engage in an activity owing to a feeling of delight in learning. IMTA recognizes that a person needs to interact with his or her environment so he or she can has competence to achieve something unique.
IMTA is also the feeling of happiness and satisfaction when working to accomplish, finish, or create something new. A person who has high IMTA will be glad to participate in an activity, because she or he feels happy in the attempt and, ultimately, in successfully performing an activity beyond his or her previous capability, whereas a person with IMES usually prefers to be involved in ac-tivities causing sensory or aesthetic pleasure (Vallerand, 2004). IMES, therefore, is the excitement and enjoyment felt while doing an activity, without consideration for acquiring knowledge or accomplishment. In opposition to intrinsic motivation, extrinsic motivation is the drive to do something to obtain an external reward or other positive external consequence (Deci & Ryan, 2002). Deci (in Stravrou, 2008) stated that a person with only an extrinsic motivation performs something to gain a reward or benefit, not because she or he enjoys it. Although extrinsic motivation can be a powerful form of motivation, scholars have observed that it is a pale and impoverished one (Ryan & Deci, 2000a). According to SDT, extrinsic motivation has three subdimensions: external regulation (EMER), introjected regulation (EMIN), and identified regulation (EMID). EMER is the motivation to pursue an activity that is not self-determined but is the result of an arrangement. A person who has EMER will do something because of an external compulsion or willingness to obtain a reward. This is the lowest level of autonomy, according to SDT (Ryan & Deci, 2000a). In contrast to EMER, EMIN is the motivation to pursue an activity that is partially inter-nalized, even if it is not fully coherent (i.e., related) to the other dimensions of one’s life. Ryan and Deci (2000a) describe the internalization process as the change in moti-vation from reluctance to passive obedience. Building on this, it can be concluded that EMID is the self-determined motivation to pursue an activity based on the feeling that the activity is important. EMID has an integration process through which a person consciously draws the motivation into him- or herself, as if it comes from within (Ryan & Deci, 2000a). Cokley (2015) described amotivation as a type of autono-mous motivation that is at its lowest level. Amotivation lacks the intentionality of both intrinsic and extrinsic mo-tivations. Those experiencing amotivation usually feel a lack of competence (Guay, Morin, Litalien, Valois, & Vallerand 2015) and therefore cannot feel the results or impact of his or her behavior (Deci & Ryan in Valle-rand et al., 1992). The Academic Motivation Scale (AMS) is based on the SDT. AMS is a psychological measurement designed by Vallerand et al. in 1992 to measure academic motiva-tion multi-dimensionally (Guay et al., 2015). AMS measures three dimensions (intrinsic motivation, extrinsic motivation, and amotivation) and the six subdimensions
Validation of the Academic Motivation Scale in Indonesian 31
Makara Hubs-Asia July 2018 ½Vol. 22 ½ No. 1
outlined above, as inspired by SDT (Vallerand et al., 1992).This study examines the results of confirmatory factor analysis (CFA) and exploratory factor analysis (EFA) testing the validity of the AMS in Indonesian. The AMS has already been used and tested in many countries. In 2001, Cokley, Bernard, Cunningham, & Motoike (2001) conducted a validation of the AMS in the United States. Ochoco (2007) validated the AMS for university students in the Philippines. Alivernini and Lucidi (2008) validated the AMS in Italian, and Karaguven (2012) adapted the AMS into Turkish. Lim and Chapman (2014) also conducted a validation of AMS to measure motiva-tion in mathematics for students in the final year of high school in Singapore. Orsini et al. (2015) evaluated the validity of AMS for dental students. Caleon et al. (2015) conducted a cross-cultural validation for high school stu-dents in Singapore, and Cokley (2015) conducted a factor analysis as a validity evidence for the AMS in black col-lege students. The most recent AMS validation is Zhang, Li, Li, Li, & Zhang (2016), who focused on senior high school students in China. These studies all suggest that the AMS is an appropriate and proper measurement of aca-demic motivation. To ensure accurate measurement of academic motivation in Indonesia, the validation of the AMS–Bahasa Indonesia is therefore of great importance. 2. Methods The sample for this study included 1,168 undergraduate students, consisting of 318 males, 587 females, and 263 participants who declined to state their gender. Subjects were chosen from a private university in Surabaya by two non-random sampling techniques, accidental sampling and purposive sampling. More than 50% of the participants were 19–20 years old. Their average GPA was 2.968 out of 4.000. Data collection was conducted using an online survey, which required participants to respond to all items before submitting their answers; this prevented the possibility of missing data. We asked participants to fill out a version of the AMS that had been adapted into Indonesian.
Table 1. Translation of Amotivation Items
Original Item Translated Item
Honestly, I don’t know; I really feel that I am wasting my time in school.
a. Terus terang saja, saya tidak tahu kenapa saya harus mempelajari mata kuliah ini.
b. Entahlah, saya merasa bahwa mata kuliah ini hanyalah mem-buang-buang waktu.
I can’t see why I go to school and frankly, I couldn’t care less.
a. Saya tidak tahu kenapa saya mengambil mata kuliah ini.
b. Saya tidak peduli dengan mata kuliah ini.
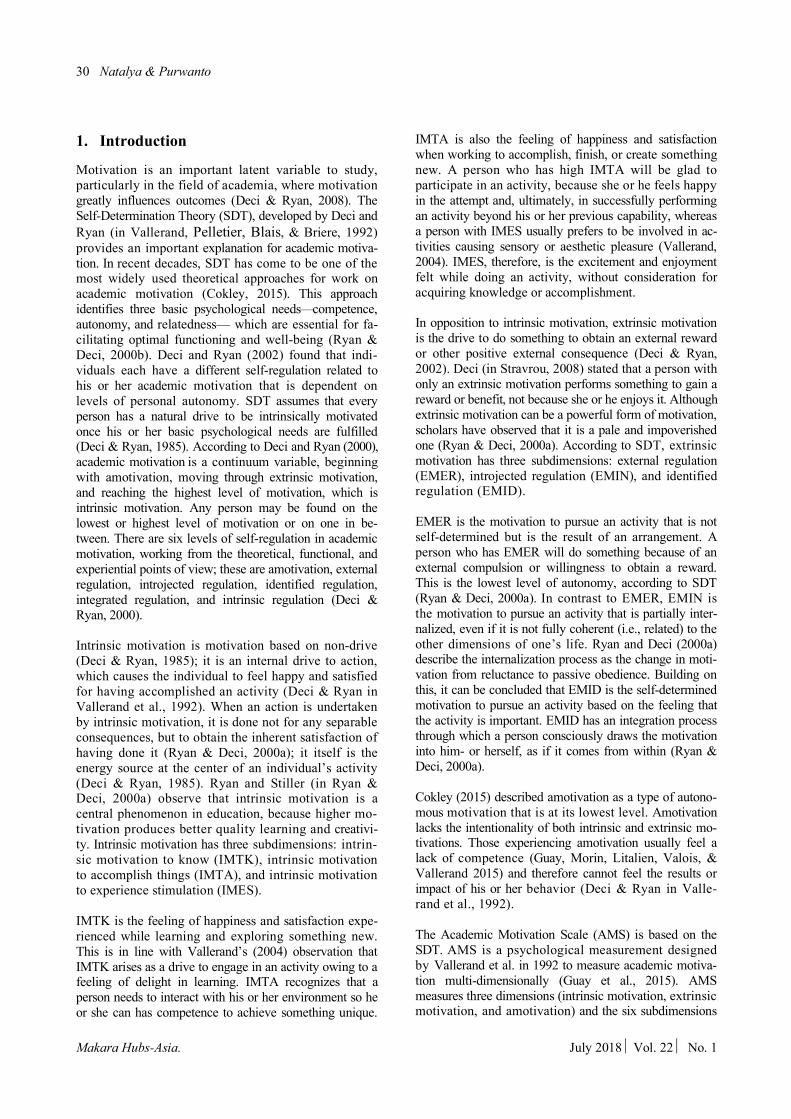
The AMS–Bahasa Indonesia is amotivation measurement in which each subdimension consists of four items, except amotivation, which consists of six items. There are thus 30 total items assessed for academic motivation; this differs from the original version, which only contains 28 items. This difference was necessary because two items assessing amotivation were translated into two alternatives as shown in Table 1. Table 2 illustrates all of the specifications for the AMS–Bahasa Indonesia. Based on the Standards for Educational and Psychological Testing (AERA, APA, & NCNE, 1999), it is necessary to evaluate five sources of evidence when determining the validity of a psychological measurement, which are as follows: test content, response processes, internal structure, relationshipsto other variables, and testing consequences. Not all sources of evidence require evaluation to check the validity of a psychological measurement. This study assesses the validity of the AMS–Bahasa Indonesia based only on internal structure, particularly factor analysis. Factor analysis evaluates the validity of a measurement through the EFA or CFA of an item in a construct (Natalya, 2016). As mentioned above, there are two types of factor analysis, CFA and EFA. CFA evaluates a latent construct developed a priori from a particular Table 2. Specification of Academic Motivation Scale
(AMS)–Bahasa Indonesia
Dimension Items
Total Favorable Unfavorable
Intrinsic Motivation (IM)
1. Intrinsic Motiva-tion to Know (IMTK)
2,10,17,25 - 4
2. Intrinsic Motiva-tion to Accomplish Things (IMTA)
7,14,22,29 - 4
3. Intrinsic Motiva-tion to Experi-enced Stimulation (IMES) 4,12,19,27 - 4
Extrinsic Motivation (EM)
4. External Regula-tion (EMER) 1,9,16,24 - 4
5. Introjected Regula-tion (EMIN)
8,15,23,30 - 4
6. Identified Regula-tion (EMID)
3,11,18,26 - 4
Amotivation (AMOT) 5,6,13,20,21,28 - 6
Total Items
30
32 Natalya & Purwanto
Makara Hubs-Asia. July 2018 ½Vol. 22 ½ No. 1
theory (Byrne, 1998). CFA is used to confirm whether the design of a measurement is appropriateand whether items are grouped appropriately, whereas EFA is used to determine the grouping pattern based on the data obtained (Child, 2006). EFA is used to find multiple factors that affect the items to be analyzed simultaneously (DeCoster in Yong & Pearce, 2013). Although these two types of factor analysis have different purposes, both can be used to support each other and justify the validity evaluation of a measurement. At present, no theory asserts that one of these types of analysis is better than the other (Wiktorowicz, 2016). This study used EFA and CFA simultaneously to ensure that all items of the AMS–Bahasa Indonesia are grouped appropriately by double-check analysis. This is in line with Netemeyer, Bearden, & Sharma’s (2003) opinion that three steps are necessary to conduct avalidation process: EFA, item analysis, and CFA. If the EFA results show that each item is grouped appropriately and is supported by CFA results showing a fit model, then it is safe to conclude that the items in the grouping can accurately measure the intended construct. EFA is a statistical analysis method used to design a model by identifying the correlation between a latent variable and an observed or measured variable. A latent variable cannot be directly measured; several indicators are therefore necessary to representif. The observed or measured variable can be directly measured and is used as an indicator for the latent variable (Natalya, Mashuri, & Siaputra, 2016). EFA is conducted to find out the grouping pattern of indicators (Natalya, 2016); several steps are necessary to conduct EFA, including: choosing the observed to measured variables to be analyzed, extracting the factor, rotating the factor, and naming the formed factor (Chizanah & Hadjam, 2011). There are several primary principles for conducting adequate EFA (Santoso in Utami, 2013). The Kaiser–Meyer–Olkin (KMO) Measure of Sampling Adequacy (MSA) value must be equal to or greater than 0.5 (KMO ≥ 0.5), the significance of Bartlett’s Test of Sphericity has to be equal to or less than 0.05 (sig ≤ 0.05), and each item must have an MSA value greater than 0.5 (MSA > 0.5; Santoso in Utami, 2013). If the items have factor-loading values greater than 0.4 (Velicer & Fava in Wiktorowicz, 2016) and are grouped according to a design that does not include cross or zero loading, then the measurement can be assumed to have good validity. CFA is a statistical analysis method that forms a group with Structural Equation Modeling (SEM; Rios & Wells, 2014). Some conclude that CFA determines the validity of a measurement, but it is insufficient for this purpose, because it is only one of many sources for evidence of validity. CFA is a multivariate analysis method of confirming that variables are conceived in an appropriate and consistent measurement model
(Joreskog & Sorborn, 1993). CFA is thus used to test or confirm that the measurement model that was ultimately designed is the same as the one that had been hypothesized (Efendi & Purnomo, 2012). This hypothesized measurement model usually consists of several latent variables and observed or measured variables as the indicators. By using CFA, data can be confirmed to be the same as the designed theoretical model (a priori model), the construct can be confirmed as appropriately defined, and parsimony can be rewarded. Certain assumptions and criteria need to be fulfilled in conducting CFA; these criteria include that there is a normal distribution of data (Bollen in DiStefano & Hess, 2005), that an accurate parameter estimation is calculated, using the correct method (such as the Maximum Like-lihood Estimator, DiStefano & Hess, 2005), and that it has adequate fit index values (DiStefano & Hess, 2005). If CFA is conducted to prove the grouping of items is the same as a former pattern (Rios & Wells, 2014) and the items are valid enough, some criteria for goodness of fit must be fulfilled. If the grouping is not the same as the previous pattern, the goodness of fit value will be low. Table 3 shows the cutoff point for goodness of fit. To evaluate validity using CFA, multiple indices of fit are necessary to ensure that all items are grouped appropriately. The χ2 is included as an absolute fit measure; an acceptable score on the chi-square, adjusted for degrees of freedom, is defined as smaller than 0.05 (Schermelleh-Engel, Moosbrugger, & Müller 2003). In addition, there are some incremental fit measure values, including the Tucker–Lewis Index (TLI), Normed Fit
Table 3. Cutoff Value of Goodness of Fit
Group Goodness of Fit Cutoff Value
Absolute Fit Meas-ure
χ2
As small as possible
p-value of χ2
0.05–1.00 Good Fit 0.01–0.05 Acceptable (Schermelleh-Engel, et al., 2003)
RMSEA
0–0.05 Good Fit 0.05–0.08 Acceptable (Schermelleh-Engel et al., 2003)
Incremental Fit Measure
TLI
≥0.90
NFI
≥0.90
CFI
0.97–1.00 Good Fit 0.90–0.97 Acceptable (Schermelleh-Engel et al., 2003)
GFI
≥0.90
AGFI
≥0.90 Note: χ2 = chi-square, RMSEA = Root Mean Square Error of Approximation, TLI = Tucker–Lewis index, NFI = Normed Fit Index, CFI = Comparative Fit Index, GFI = Goodness of Fit Index, AGFI = Adjusted Goodness of Fit.
Validation of the Academic Motivation Scale in Indonesian 33
Makara Hubs-Asia July 2018 ½Vol. 22 ½ No. 1
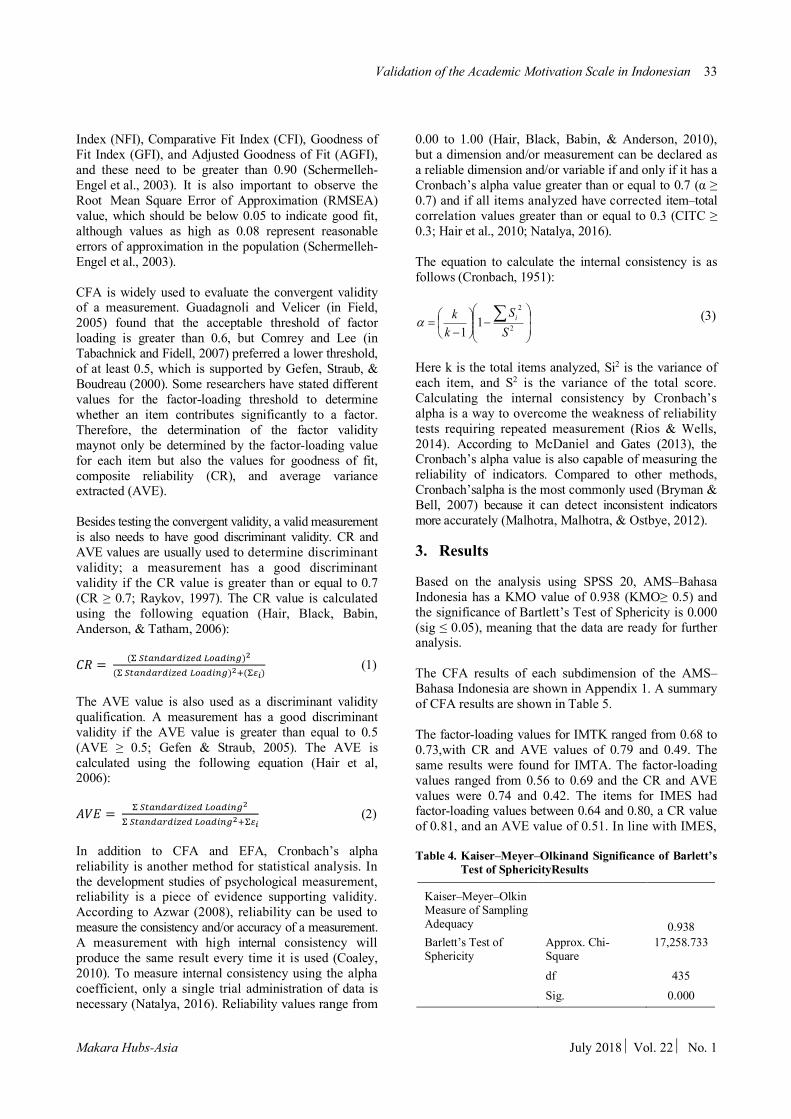
Index (NFI), Comparative Fit Index (CFI), Goodness of Fit Index (GFI), and Adjusted Goodness of Fit (AGFI), and these need to be greater than 0.90 (Schermelleh-Engel et al., 2003). It is also important to observe the Root Mean Square Error of Approximation (RMSEA) value, which should be below 0.05 to indicate good fit, although values as high as 0.08 represent reasonable errors of approximation in the population (Schermelleh-Engel et al., 2003). CFA is widely used to evaluate the convergent validity of a measurement. Guadagnoli and Velicer (in Field, 2005) found that the acceptable threshold of factor loading is greater than 0.6, but Comrey and Lee (in Tabachnick and Fidell, 2007) preferred a lower threshold, of at least 0.5, which is supported by Gefen, Straub, & Boudreau (2000). Some researchers have stated different values for the factor-loading threshold to determine whether an item contributes significantly to a factor. Therefore, the determination of the factor validity maynot only be determined by the factor-loading value for each item but also the values for goodness of fit, composite reliability (CR), and average variance extracted (AVE). Besides testing the convergent validity, a valid measurement is also needs to have good discriminant validity. CR and AVE values are usually used to determine discriminant validity; a measurement has a good discriminant validity if the CR value is greater than or equal to 0.7 (CR ≥ 0.7; Raykov, 1997). The CR value is calculated using the following equation (Hair, Black, Babin, Anderson, & Tatham, 2006): 𝐶𝑅 = (&'()*+),+-./+01)+-*2)4
(&'()*+),+-./+01)+-*2)45(&67) (1)
The AVE value is also used as a discriminant validity qualification. A measurement has a good discriminant validity if the AVE value is greater than equal to 0.5 (AVE ≥ 0.5; Gefen & Straub, 2005). The AVE is calculated using the following equation (Hair et al, 2006): 𝐴𝑉𝐸 = &'()*+),+-./+01)+-*24
&'()*+),+-./+01)+-*245&67 (2)
In addition to CFA and EFA, Cronbach’s alpha reliability is another method for statistical analysis. In the development studies of psychological measurement, reliability is a piece of evidence supporting validity. According to Azwar (2008), reliability can be used to measure the consistency and/or accuracy of a measurement. A measurement with high internal consistency will produce the same result every time it is used (Coaley, 2010). To measure internal consistency using the alpha coefficient, only a single trial administration of data is necessary (Natalya, 2016). Reliability values range from
0.00 to 1.00 (Hair, Black, Babin, & Anderson, 2010), but a dimension and/or measurement can be declared as a reliable dimension and/or variable if and only if it has a Cronbach’s alpha value greater than or equal to 0.7 (α ≥ 0.7) and if all items analyzed have corrected item–total correlation values greater than or equal to 0.3 (CITC ≥ 0.3; Hair et al., 2010; Natalya, 2016). The equation to calculate the internal consistency is as follows (Cronbach, 1951):
(3)
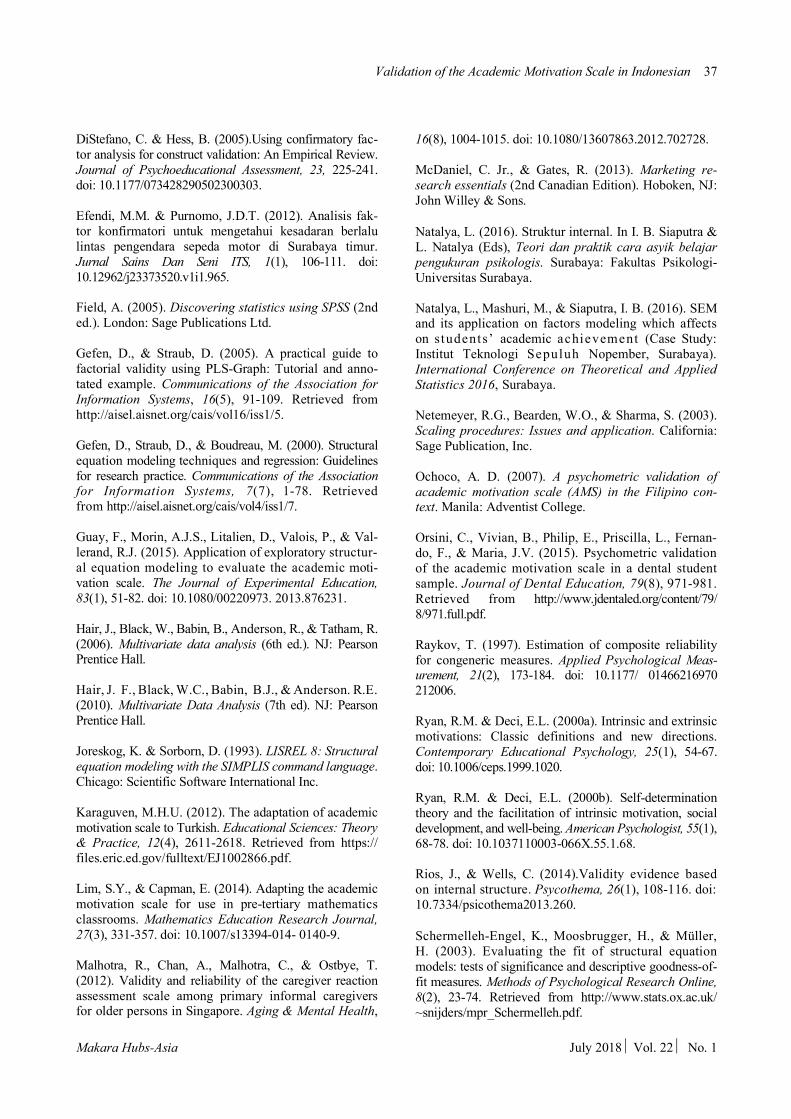
Here k is the total items analyzed, Si2 is the variance of each item, and S2 is the variance of the total score. Calculating the internal consistency by Cronbach’s alpha is a way to overcome the weakness of reliability tests requiring repeated measurement (Rios & Wells, 2014). According to McDaniel and Gates (2013), the Cronbach’s alpha value is also capable of measuring the reliability of indicators. Compared to other methods, Cronbach’salpha is the most commonly used (Bryman & Bell, 2007) because it can detect inconsistent indicators more accurately (Malhotra, Malhotra, & Ostbye, 2012). 3. Results Based on the analysis using SPSS 20, AMS–Bahasa Indonesia has a KMO value of 0.938 (KMO≥ 0.5) and the significance of Bartlett’s Test of Sphericity is 0.000 (sig ≤ 0.05), meaning that the data are ready for further analysis. The CFA results of each subdimension of the AMS–Bahasa Indonesia are shown in Appendix 1. A summary of CFA results are shown in Table 5. The factor-loading values for IMTK ranged from 0.68 to 0.73,with CR and AVE values of 0.79 and 0.49. The same results were found for IMTA. The factor-loading values ranged from 0.56 to 0.69 and the CR and AVE values were 0.74 and 0.42. The items for IMES had factor-loading values between 0.64 and 0.80, a CR value of 0.81, and an AVE value of 0.51. In line with IMES, Table 4. Kaiser–Meyer–Olkinand Significance of Barlett’s
Test of SphericityResults
Kaiser–Meyer–Olkin Measure of Sampling Adequacy
0.938 Barlett’s Test of Sphericity
Approx. Chi-Square
17,258.733
df
435 Sig.
0.000
÷÷ø
öççè
æ-÷
øö
çèæ
-= å
2
2
11 S
Skk ia
34 Natalya & Purwanto
Makara Hubs-Asia. July 2018 ½Vol. 22 ½ No. 1
Table 5. CFA Results Summary of Each Subdimension of AMS–Bahasa Indonesia
Subdimension Item Factor Loading Goodness of Fit CR AVE IMTK IMTK_02 0.68 c2 = 3.507; p = 0.173; RMSEA = 0.025TLI =
0.996; NFI = 0.997; CFI = 0.999; GFI = 0.998; AGFI = 0.992
0.79 0.49 IMTK_10 0.69 IMTK_17 0.67 IMTK_25 0.73
IMTA IMTA_07 0.66 c2 = 0.817; p = 0.366; RMSEA = 0.000; TLI = 1.001; NFI = 0.999; CFI = 1.000; GFI =
1.000; AGFI = 0.997
0.74 0.42 IMTA_14 0.69 IMTA_22 0.56 IMTA_29 0.64
IMES IMES_04 0.75 c2 = 1.623; p = 0.444; RMSEA = 0.000; TLI = 1.001; NFI = 0.999; CFI = 1.000; GFI =
0.999AGFI = 0.996
0.81 0.51 IMES_12 0.80 IMES_19 0.64 IMES_27 0.64
EMER EMER_01 0.72 c2 = 4.067; p = 0.044; RMSEA = 0.051; TLI = 0.988; NFI = 0.997; CFI = 0.998; GFI =
0.998; AGFI = 0.983
0.81 0.52 EMER_09 0.80 EMER_16 0.52 EMER_24 0.80
EMIN EMIN_08 0.60 c2 = 7.271; p = 0.007; RMSEA = 0.073; TLI = 0.972; NFI = 0.995; CFI = 0.995; GFI =
0.997; AGFI = 0.969
0.78 0.47 EMIN_15 0.59 EMIN_23 0.64 EMIN_30 0.87
EMID EMID_03 0.72 c2 = 1.130; p = 0.288; RMSEA = 0.011; TLI = 1.000; NFI = 0.999; CFI = 1.000; GFI =
1.000; AGFI = 0.995
0.85 0.59 EMID_11 0.68 EMID_18 0.78 EMID_26 0.85
AMOT AMOT_05 0.68
c2 = 7.612; p = 0.055; RMSEA = 0.036; TLI = 0.993; NFI = 0.998; CFI = 0.999; GFI =
0.998; AGFI = 0.985
0.87 0.52 AMOT_06 0.78 AMOT_13 0.74 AMOT_20 0.70 AMOT_21 0.65 AMOT_28 0.72
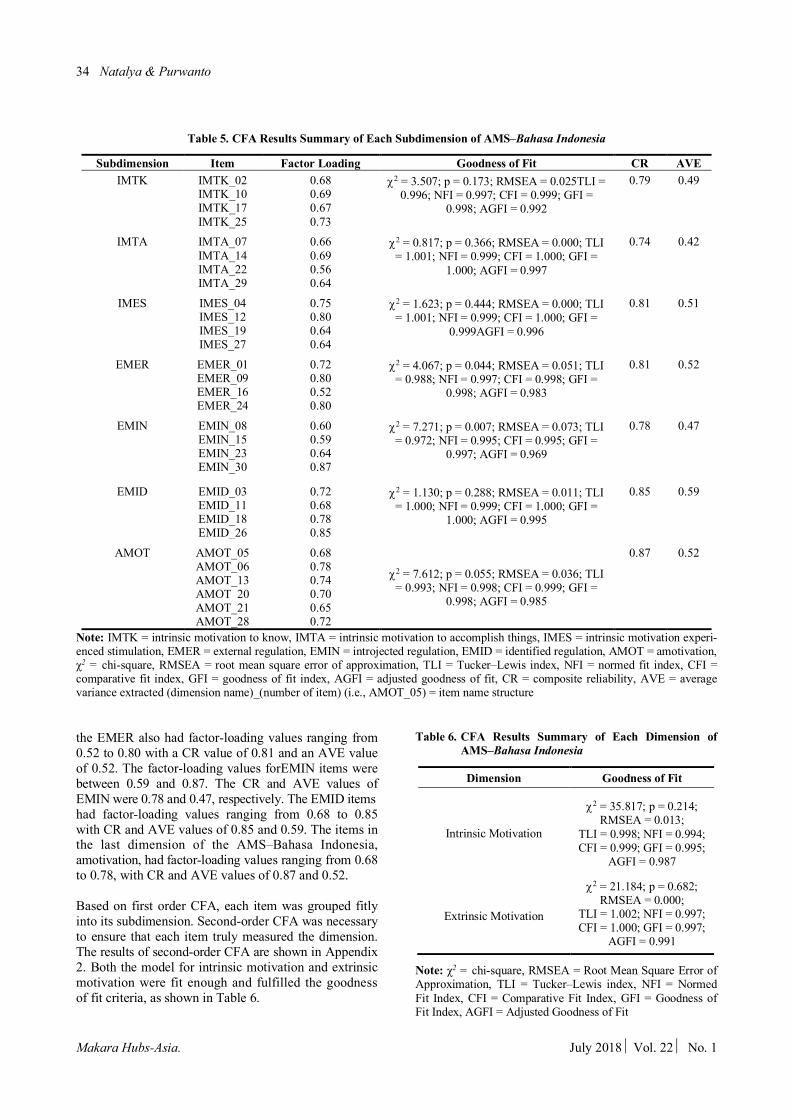
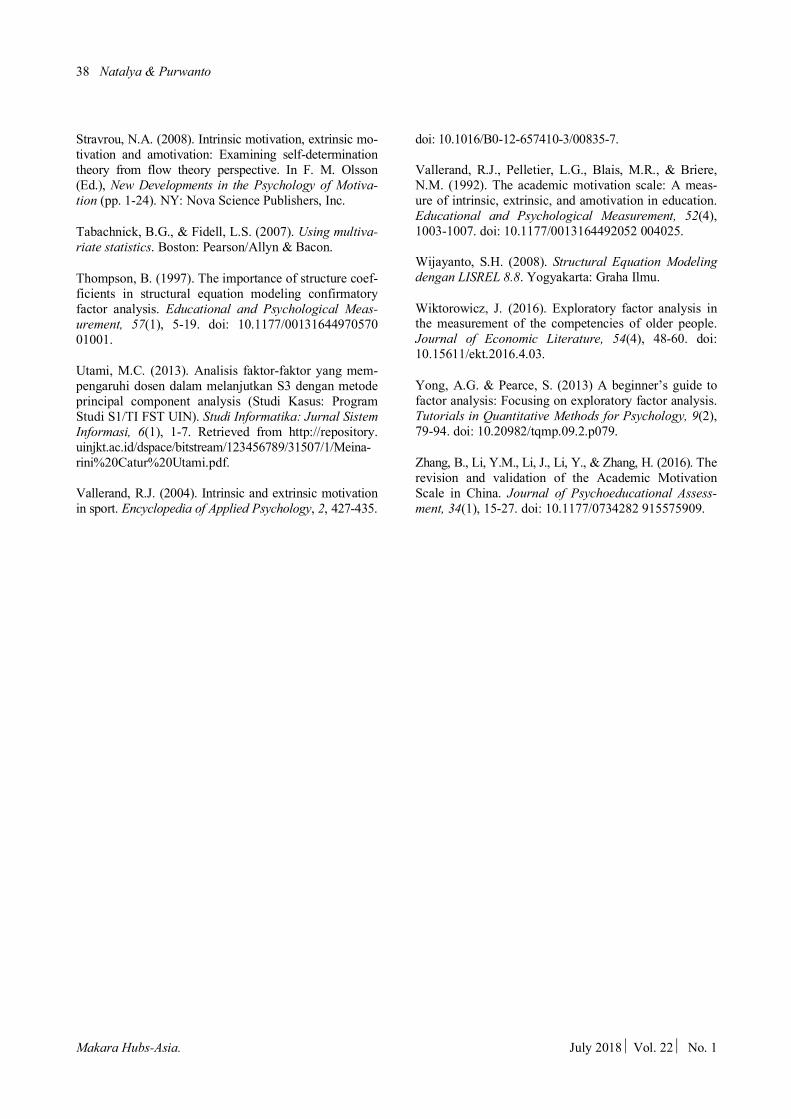
Note: IMTK = intrinsic motivation to know, IMTA = intrinsic motivation to accomplish things, IMES = intrinsic motivation experi-enced stimulation, EMER = external regulation, EMIN = introjected regulation, EMID = identified regulation, AMOT = amotivation, χ2 = chi-square, RMSEA = root mean square error of approximation, TLI = Tucker–Lewis index, NFI = normed fit index, CFI = comparative fit index, GFI = goodness of fit index, AGFI = adjusted goodness of fit, CR = composite reliability, AVE = average variance extracted (dimension name)_(number of item) (i.e., AMOT_05) = item name structure the EMER also had factor-loading values ranging from 0.52 to 0.80 with a CR value of 0.81 and an AVE value of 0.52. The factor-loading values forEMIN items were between 0.59 and 0.87. The CR and AVE values of EMIN were 0.78 and 0.47, respectively. The EMID items had factor-loading values ranging from 0.68 to 0.85 with CR and AVE values of 0.85 and 0.59. The items in the last dimension of the AMS–Bahasa Indonesia, amotivation, had factor-loading values ranging from 0.68 to 0.78, with CR and AVE values of 0.87 and 0.52. Based on first order CFA, each item was grouped fitly into its subdimension. Second-order CFA was necessary to ensure that each item truly measured the dimension. The results of second-order CFA are shown in Appendix 2. Both the model for intrinsic motivation and extrinsic motivation were fit enough and fulfilled the goodness of fit criteria, as shown in Table 6.
Table 6. CFA Results Summary of Each Dimension of AMS–Bahasa Indonesia
Dimension Goodness of Fit
Intrinsic Motivation
c2 = 35.817; p = 0.214; RMSEA = 0.013;
TLI = 0.998; NFI = 0.994; CFI = 0.999; GFI = 0.995;
AGFI = 0.987
Extrinsic Motivation
c2 = 21.184; p = 0.682; RMSEA = 0.000;
TLI = 1.002; NFI = 0.997; CFI = 1.000; GFI = 0.997;
AGFI = 0.991
Note: χ2 = chi-square, RMSEA = Root Mean Square Error of Approximation, TLI = Tucker–Lewis index, NFI = Normed Fit Index, CFI = Comparative Fit Index, GFI = Goodness of Fit Index, AGFI = Adjusted Goodness of Fit
Validation of the Academic Motivation Scale in Indonesian 35
Makara Hubs-Asia July 2018 ½Vol. 22 ½ No. 1
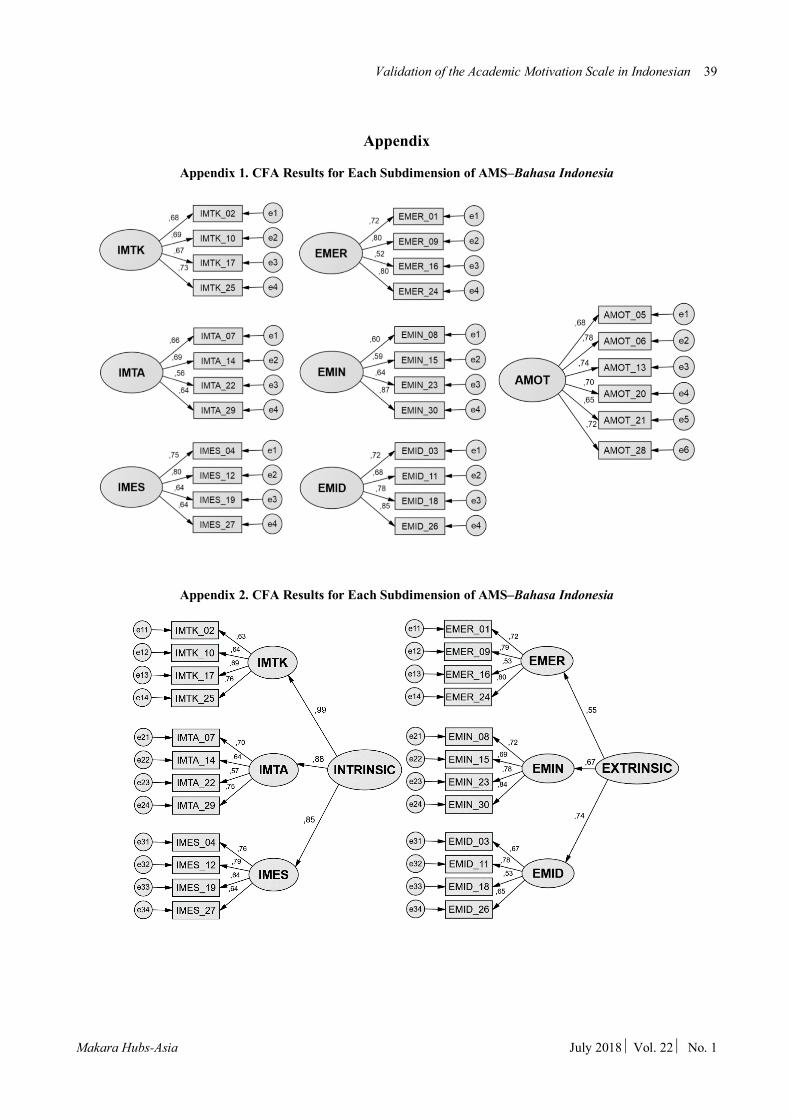
Table 7. CFA Results Summary for the AMS–Bahasa Indonesia
Goodness of Fit Value c2
p RMSEA
TLI NFI CFI GFI
AGFI
270.043 0.403 0.004 1.000 0.984 1.000 0.985 0.974
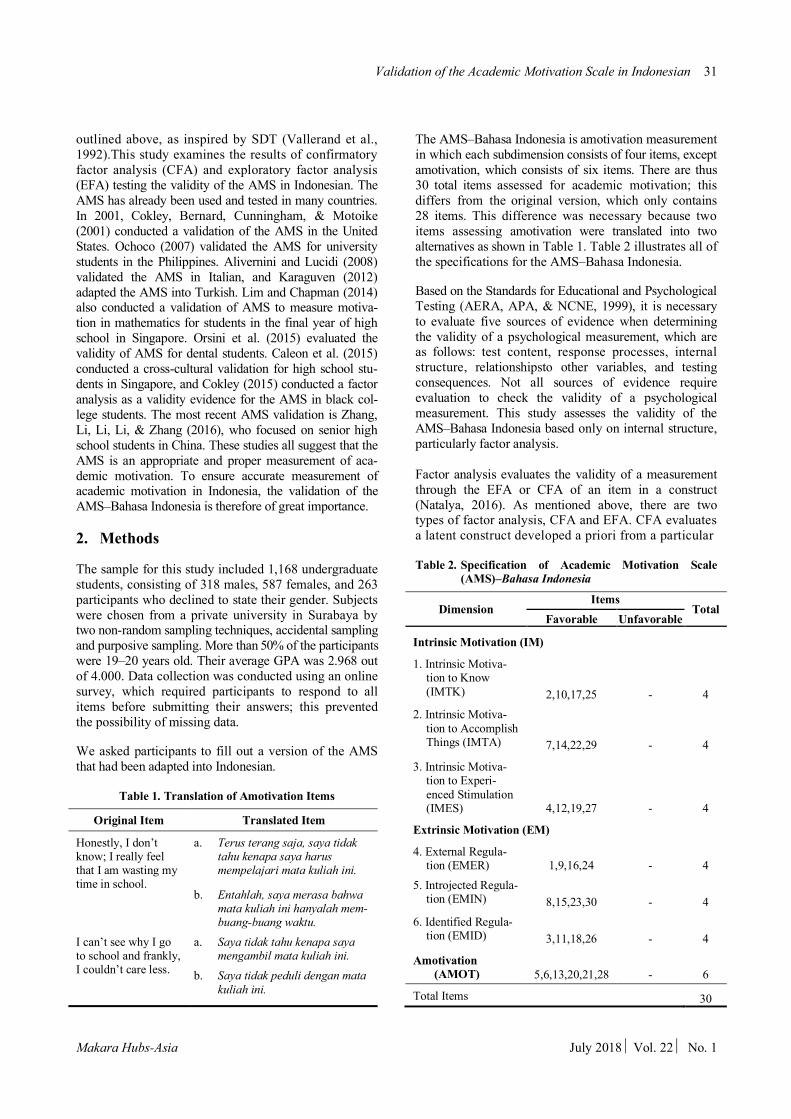
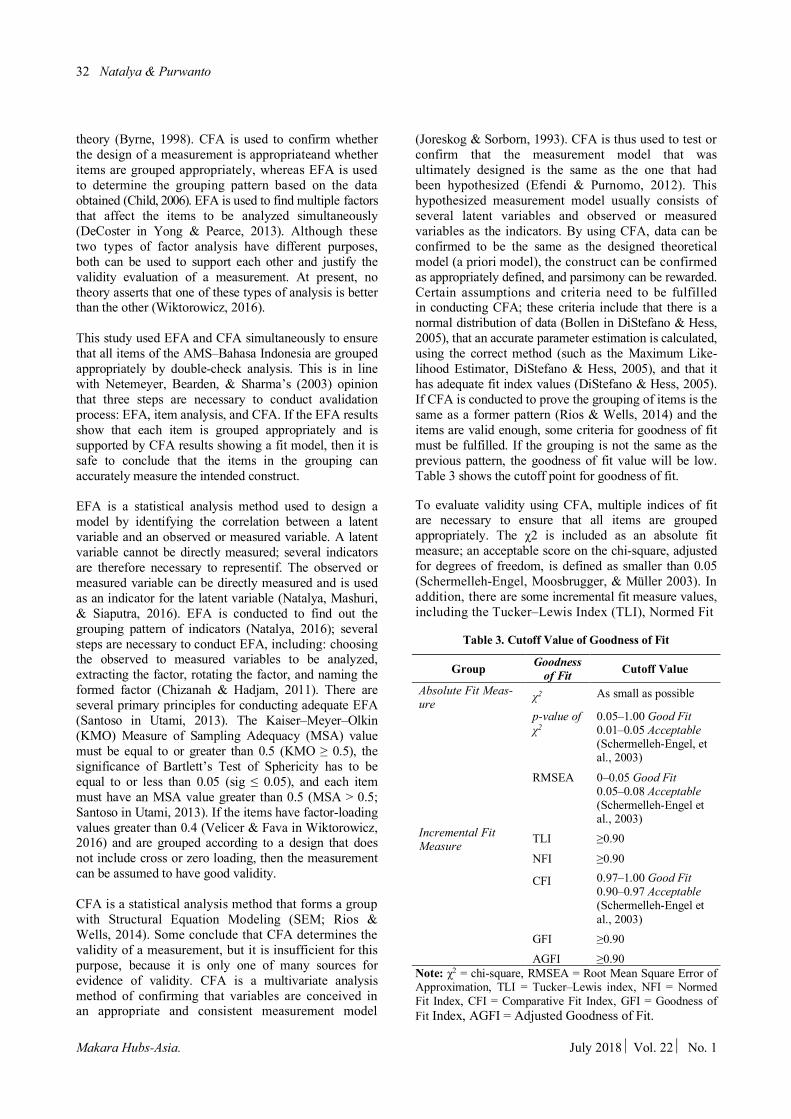
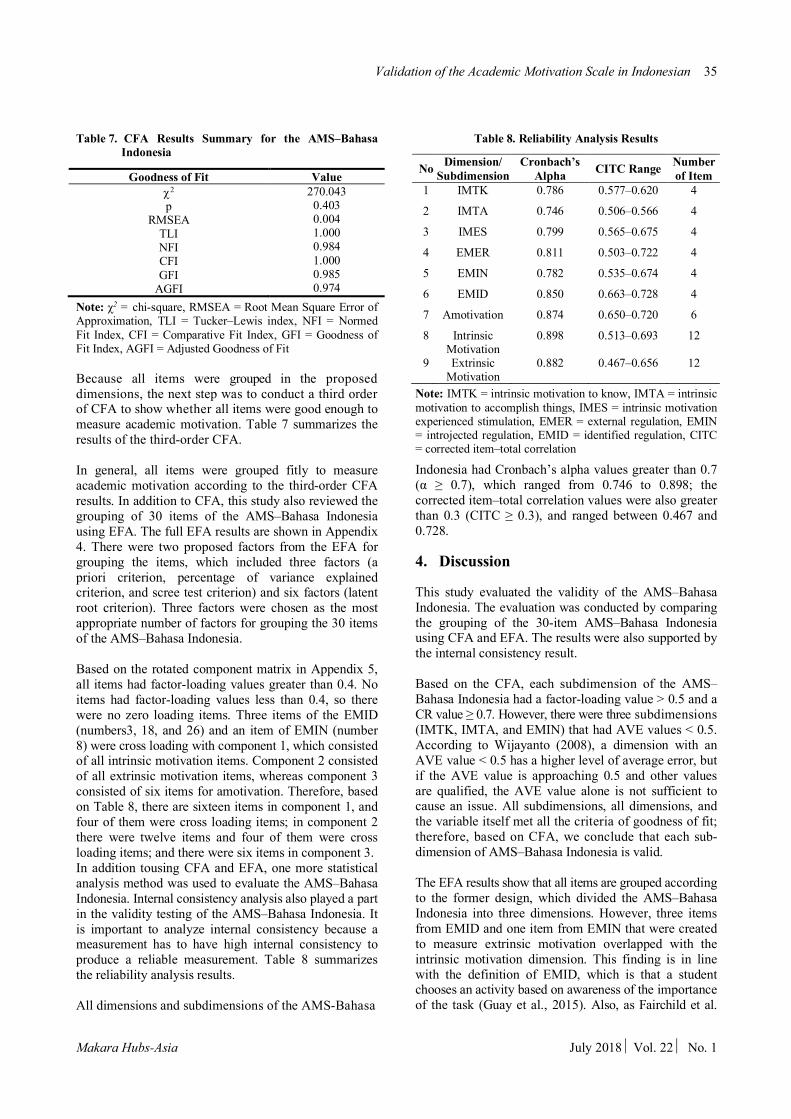
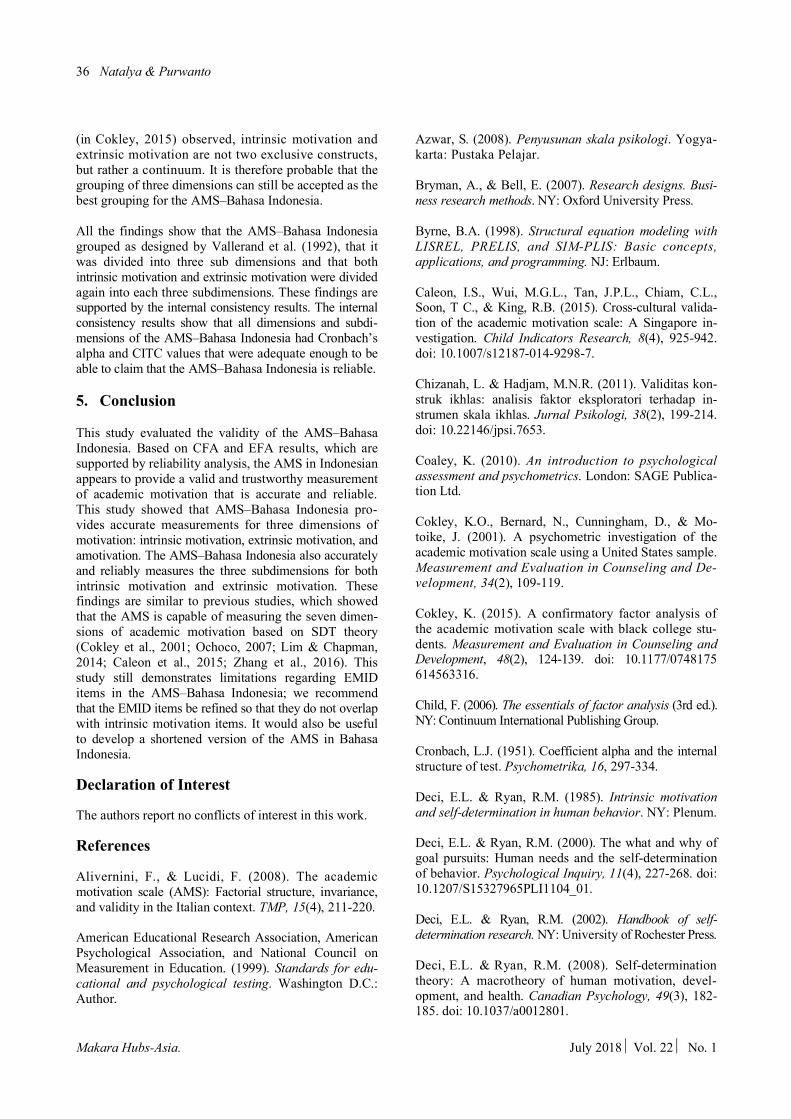
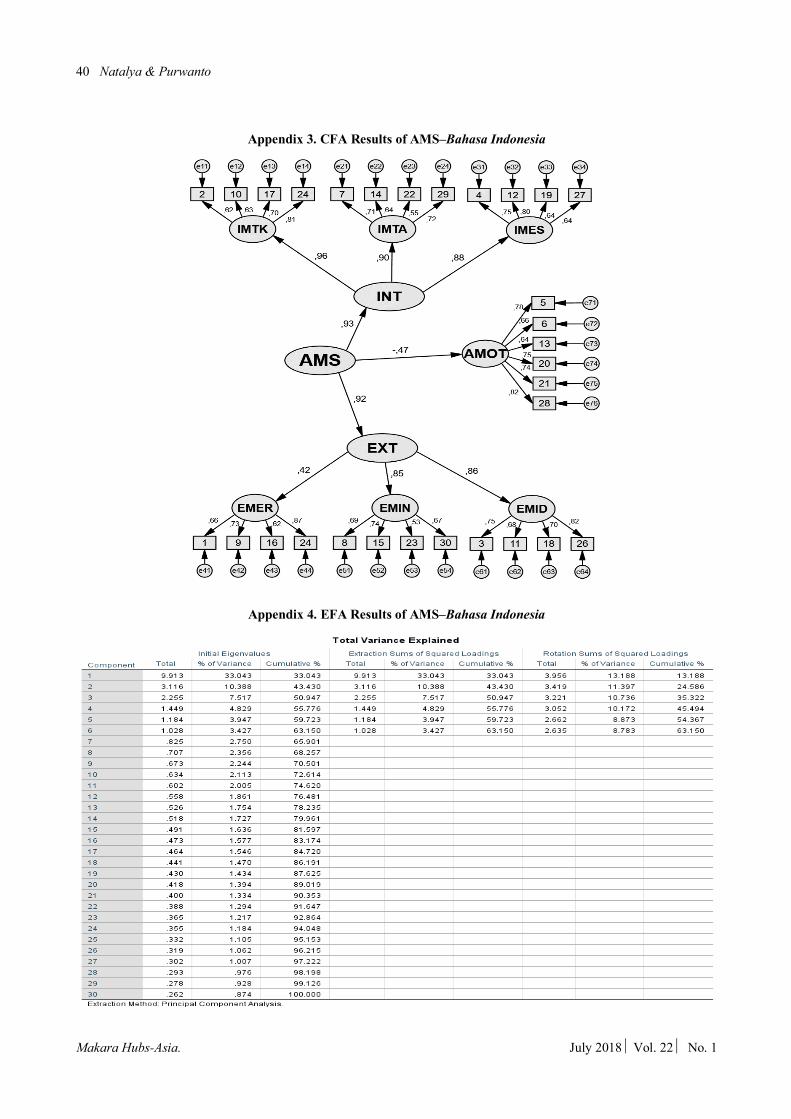
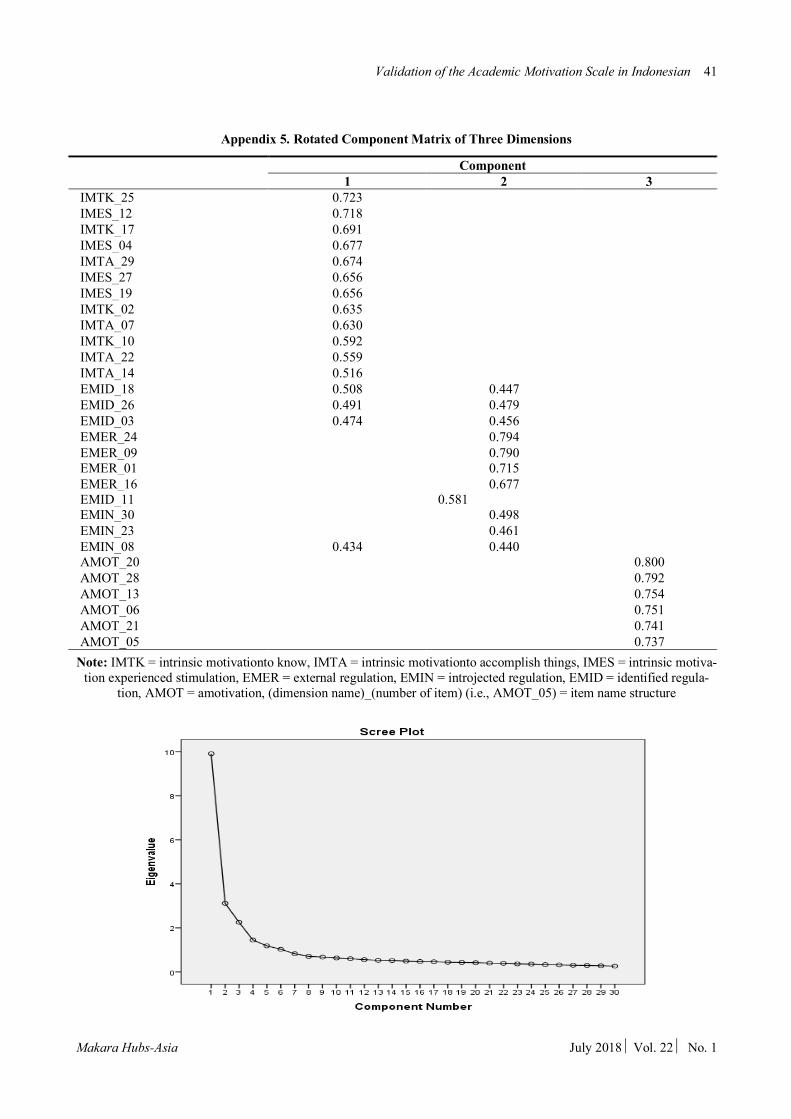
Note: χ2 = chi-square, RMSEA = Root Mean Square Error of Approximation, TLI = Tucker–Lewis index, NFI = Normed Fit Index, CFI = Comparative Fit Index, GFI = Goodness of Fit Index, AGFI = Adjusted Goodness of Fit Because all items were grouped in the proposed dimensions, the next step was to conduct a third order of CFA to show whether all items were good enough to measure academic motivation. Table 7 summarizes the results of the third-order CFA. In general, all items were grouped fitly to measure academic motivation according to the third-order CFA results. In addition to CFA, this study also reviewed the grouping of 30 items of the AMS–Bahasa Indonesia using EFA. The full EFA results are shown in Appendix 4. There were two proposed factors from the EFA for grouping the items, which included three factors (a priori criterion, percentage of variance explained criterion, and scree test criterion) and six factors (latent root criterion). Three factors were chosen as the most appropriate number of factors for grouping the 30 items of the AMS–Bahasa Indonesia. Based on the rotated component matrix in Appendix 5, all items had factor-loading values greater than 0.4. No items had factor-loading values less than 0.4, so there were no zero loading items. Three items of the EMID (numbers3, 18, and 26) and an item of EMIN (number 8) were cross loading with component 1, which consisted of all intrinsic motivation items. Component 2 consisted of all extrinsic motivation items, whereas component 3 consisted of six items for amotivation. Therefore, based on Table 8, there are sixteen items in component 1, and four of them were cross loading items; in component 2 there were twelve items and four of them were cross loading items; and there were six items in component 3. In addition tousing CFA and EFA, one more statistical analysis method was used to evaluate the AMS–Bahasa Indonesia. Internal consistency analysis also played a part in the validity testing of the AMS–Bahasa Indonesia. It is important to analyze internal consistency because a measurement has to have high internal consistency to produce a reliable measurement. Table 8 summarizes the reliability analysis results. All dimensions and subdimensions of the AMS-Bahasa
Table 8. Reliability Analysis Results
No Dimension/ Subdimension
Cronbach’s Alpha CITC Range Number
of Item 1 IMTK 0.786 0.577–0.620 4
2 IMTA 0.746 0.506–0.566 4
3 IMES 0.799 0.565–0.675 4
4 EMER 0.811 0.503–0.722 4
5 EMIN 0.782 0.535–0.674 4
6 EMID 0.850 0.663–0.728 4
7 Amotivation 0.874 0.650–0.720 6
8 Intrinsic Motivation
0.898 0.513–0.693 12
9 Extrinsic Motivation
0.882 0.467–0.656 12
Note: IMTK = intrinsic motivation to know, IMTA = intrinsic motivation to accomplish things, IMES = intrinsic motivation experienced stimulation, EMER = external regulation, EMIN = introjected regulation, EMID = identified regulation, CITC = corrected item–total correlation
Indonesia had Cronbach’s alpha values greater than 0.7 (α ≥ 0.7), which ranged from 0.746 to 0.898; the corrected item–total correlation values were also greater than 0.3 (CITC ≥ 0.3), and ranged between 0.467 and 0.728. 4. Discussion This study evaluated the validity of the AMS–Bahasa Indonesia. The evaluation was conducted by comparing the grouping of the 30-item AMS–Bahasa Indonesia using CFA and EFA. The results were also supported by the internal consistency result. Based on the CFA, each subdimension of the AMS–Bahasa Indonesia had a factor-loading value > 0.5 and a CR value ≥ 0.7. However, there were three subdimensions (IMTK, IMTA, and EMIN) that had AVE values < 0.5. According to Wijayanto (2008), a dimension with an AVE value < 0.5 has a higher level of average error, but if the AVE value is approaching 0.5 and other values are qualified, the AVE value alone is not sufficient to cause an issue. All subdimensions, all dimensions, and the variable itself met all the criteria of goodness of fit; therefore, based on CFA, we conclude that each sub-dimension of AMS–Bahasa Indonesia is valid. The EFA results show that all items are grouped according to the former design, which divided the AMS–Bahasa Indonesia into three dimensions. However, three items from EMID and one item from EMIN that were created to measure extrinsic motivation overlapped with the intrinsic motivation dimension. This finding is in line with the definition of EMID, which is that a student chooses an activity based on awareness of the importance of the task (Guay et al., 2015). Also, as Fairchild et al.
36 Natalya & Purwanto
Makara Hubs-Asia. July 2018 ½Vol. 22 ½ No. 1
(in Cokley, 2015) observed, intrinsic motivation and extrinsic motivation are not two exclusive constructs, but rather a continuum. It is therefore probable that the grouping of three dimensions can still be accepted as the best grouping for the AMS–Bahasa Indonesia. All the findings show that the AMS–Bahasa Indonesia grouped as designed by Vallerand et al. (1992), that it was divided into three sub dimensions and that both intrinsic motivation and extrinsic motivation were divided again into each three subdimensions. These findings are supported by the internal consistency results. The internal consistency results show that all dimensions and subdi-mensions of the AMS–Bahasa Indonesia had Cronbach’s alpha and CITC values that were adequate enough to be able to claim that the AMS–Bahasa Indonesia is reliable. 5. Conclusion This study evaluated the validity of the AMS–Bahasa Indonesia. Based on CFA and EFA results, which are supported by reliability analysis, the AMS in Indonesian appears to provide a valid and trustworthy measurement of academic motivation that is accurate and reliable. This study showed that AMS–Bahasa Indonesia pro-vides accurate measurements for three dimensions of motivation: intrinsic motivation, extrinsic motivation, and amotivation. The AMS–Bahasa Indonesia also accurately and reliably measures the three subdimensions for both intrinsic motivation and extrinsic motivation. These findings are similar to previous studies, which showed that the AMS is capable of measuring the seven dimen-sions of academic motivation based on SDT theory (Cokley et al., 2001; Ochoco, 2007; Lim & Chapman, 2014; Caleon et al., 2015; Zhang et al., 2016). This study still demonstrates limitations regarding EMID items in the AMS–Bahasa Indonesia; we recommend that the EMID items be refined so that they do not overlap with intrinsic motivation items. It would also be useful to develop a shortened version of the AMS in Bahasa Indonesia. Declaration of Interest The authors report no conflicts of interest in this work. References Alivernini, F., & Lucidi, F. (2008). The academic motivation scale (AMS): Factorial structure, invariance, and validity in the Italian context. TMP, 15(4), 211-220. American Educational Research Association, American Psychological Association, and National Council on Measurement in Education. (1999). Standards for edu-cational and psychological testing. Washington D.C.: Author.
Azwar, S. (2008). Penyusunan skala psikologi. Yogya-karta: Pustaka Pelajar. Bryman, A., & Bell, E. (2007). Research designs. Busi-ness research methods. NY: Oxford University Press. Byrne, B.A. (1998). Structural equation modeling with LISREL, PRELIS, and SIM-PLIS: Basic concepts, applications, and programming. NJ: Erlbaum. Caleon, I.S., Wui, M.G.L., Tan, J.P.L., Chiam, C.L., Soon, T C., & King, R.B. (2015). Cross-cultural valida-tion of the academic motivation scale: A Singapore in-vestigation. Child Indicators Research, 8(4), 925-942. doi: 10.1007/s12187-014-9298-7. Chizanah, L. & Hadjam, M.N.R. (2011). Validitas kon-struk ikhlas: analisis faktor eksploratori terhadap in-strumen skala ikhlas. Jurnal Psikologi, 38(2), 199-214. doi: 10.22146/jpsi.7653. Coaley, K. (2010). An introduction to psychological assessment and psychometrics. London: SAGE Publica-tion Ltd. Cokley, K.O., Bernard, N., Cunningham, D., & Mo-toike, J. (2001). A psychometric investigation of the academic motivation scale using a United States sample. Measurement and Evaluation in Counseling and De-velopment, 34(2), 109-119. Cokley, K. (2015). A confirmatory factor analysis of the academic motivation scale with black college stu-dents. Measurement and Evaluation in Counseling and Development, 48(2), 124-139. doi: 10.1177/0748175 614563316. Child, F. (2006). The essentials of factor analysis (3rd ed.). NY: Continuum International Publishing Group. Cronbach, L.J. (1951). Coefficient alpha and the internal structure of test. Psychometrika, 16, 297-334. Deci, E.L. & Ryan, R.M. (1985). Intrinsic motivation and self-determination in human behavior. NY: Plenum. Deci, E.L. & Ryan, R.M. (2000). The what and why of goal pursuits: Human needs and the self-determination of behavior. Psychological Inquiry, 11(4), 227-268. doi: 10.1207/S15327965PLI1104_01. Deci, E.L. & Ryan, R.M. (2002). Handbook of self-determination research. NY: University of Rochester Press. Deci, E.L. & Ryan, R.M. (2008). Self-determination theory: A macrotheory of human motivation, devel-opment, and health. Canadian Psychology, 49(3), 182-185. doi: 10.1037/a0012801.
Validation of the Academic Motivation Scale in Indonesian 37
Makara Hubs-Asia July 2018 ½Vol. 22 ½ No. 1
DiStefano, C. & Hess, B. (2005).Using confirmatory fac-tor analysis for construct validation: An Empirical Review. Journal of Psychoeducational Assessment, 23, 225-241. doi: 10.1177/073428290502300303. Efendi, M.M. & Purnomo, J.D.T. (2012). Analisis fak-tor konfirmatori untuk mengetahui kesadaran berlalu lintas pengendara sepeda motor di Surabaya timur. Jurnal Sains Dan Seni ITS, 1(1), 106-111. doi: 10.12962/j23373520.v1i1.965. Field, A. (2005). Discovering statistics using SPSS (2nd ed.). London: Sage Publications Ltd. Gefen, D., & Straub, D. (2005). A practical guide to factorial validity using PLS-Graph: Tutorial and anno-tated example. Communications of the Association for Information Systems, 16(5), 91-109. Retrieved from http://aisel.aisnet.org/cais/vol16/iss1/5. Gefen, D., Straub, D., & Boudreau, M. (2000). Structural equation modeling techniques and regression: Guidelines for research practice. Communications of the Association for Information Systems, 7(7), 1-78. Retrieved from http://aisel.aisnet.org/cais/vol4/iss1/7. Guay, F., Morin, A.J.S., Litalien, D., Valois, P., & Val-lerand, R.J. (2015). Application of exploratory structur-al equation modeling to evaluate the academic moti-vation scale. The Journal of Experimental Education, 83(1), 51-82. doi: 10.1080/00220973. 2013.876231. Hair, J., Black, W., Babin, B., Anderson, R., & Tatham, R. (2006). Multivariate data analysis (6th ed.). NJ: Pearson Prentice Hall. Hair, J. F., Black, W.C., Babin, B.J., & Anderson. R.E. (2010). Multivariate Data Analysis (7th ed). NJ: Pearson Prentice Hall. Joreskog, K. & Sorborn, D. (1993). LISREL 8: Structural equation modeling with the SIMPLIS command language. Chicago: Scientific Software International Inc. Karaguven, M.H.U. (2012). The adaptation of academic motivation scale to Turkish. Educational Sciences: Theory & Practice, 12(4), 2611-2618. Retrieved from https:// files.eric.ed.gov/fulltext/EJ1002866.pdf. Lim, S.Y., & Capman, E. (2014). Adapting the academic motivation scale for use in pre-tertiary mathematics classrooms. Mathematics Education Research Journal, 27(3), 331-357. doi: 10.1007/s13394-014- 0140-9. Malhotra, R., Chan, A., Malhotra, C., & Ostbye, T. (2012). Validity and reliability of the caregiver reaction assessment scale among primary informal caregivers for older persons in Singapore. Aging & Mental Health,
16(8), 1004-1015. doi: 10.1080/13607863.2012.702728. McDaniel, C. Jr., & Gates, R. (2013). Marketing re-search essentials (2nd Canadian Edition). Hoboken, NJ: John Willey & Sons.
Natalya, L. (2016). Struktur internal. In I. B. Siaputra & L. Natalya (Eds), Teori dan praktik cara asyik belajar pengukuran psikologis. Surabaya: Fakultas Psikologi-Universitas Surabaya. Natalya, L., Mashuri, M., & Siaputra, I. B. (2016). SEM and its application on factors modeling which affects on students’ academic achievement (Case Study: Institut Teknologi Sepuluh Nopember, Surabaya). International Conference on Theoretical and Applied Statistics 2016, Surabaya. Netemeyer, R.G., Bearden, W.O., & Sharma, S. (2003). Scaling procedures: Issues and application. California: Sage Publication, Inc. Ochoco, A. D. (2007). A psychometric validation of academic motivation scale (AMS) in the Filipino con-text. Manila: Adventist College. Orsini, C., Vivian, B., Philip, E., Priscilla, L., Fernan-do, F., & Maria, J.V. (2015). Psychometric validation of the academic motivation scale in a dental student sample. Journal of Dental Education, 79(8), 971-981. Retrieved from http://www.jdentaled.org/content/79/ 8/971.full.pdf. Raykov, T. (1997). Estimation of composite reliability for congeneric measures. Applied Psychological Meas-urement, 21(2), 173-184. doi: 10.1177/ 01466216970 212006. Ryan, R.M. & Deci, E.L. (2000a). Intrinsic and extrinsic motivations: Classic definitions and new directions. Contemporary Educational Psychology, 25(1), 54-67. doi: 10.1006/ceps.1999.1020. Ryan, R.M. & Deci, E.L. (2000b). Self-determination theory and the facilitation of intrinsic motivation, social development, and well-being. American Psychologist, 55(1), 68-78. doi: 10.1037110003-066X.55.1.68. Rios, J., & Wells, C. (2014).Validity evidence based on internal structure. Psycothema, 26(1), 108-116. doi: 10.7334/psicothema2013.260.
Schermelleh-Engel, K., Moosbrugger, H., & Müller, H. (2003). Evaluating the fit of structural equation models: tests of significance and descriptive goodness-of-fit measures. Methods of Psychological Research Online, 8(2), 23-74. Retrieved from http://www.stats.ox.ac.uk/ ~snijders/mpr_Schermelleh.pdf.
38 Natalya & Purwanto
Makara Hubs-Asia. July 2018 ½Vol. 22 ½ No. 1
Stravrou, N.A. (2008). Intrinsic motivation, extrinsic mo-tivation and amotivation: Examining self-determination theory from flow theory perspective. In F. M. Olsson (Ed.), New Developments in the Psychology of Motiva-tion (pp. 1-24). NY: Nova Science Publishers, Inc.
Tabachnick, B.G., & Fidell, L.S. (2007). Using multiva-riate statistics. Boston: Pearson/Allyn & Bacon.
Thompson, B. (1997). The importance of structure coef-ficients in structural equation modeling confirmatory factor analysis. Educational and Psychological Meas-urement, 57(1), 5-19. doi: 10.1177/00131644970570 01001.
Utami, M.C. (2013). Analisis faktor-faktor yang mem-pengaruhi dosen dalam melanjutkan S3 dengan metode principal component analysis (Studi Kasus: Program Studi S1/TI FST UIN). Studi Informatika: Jurnal Sistem Informasi, 6(1), 1-7. Retrieved from http://repository. uinjkt.ac.id/dspace/bitstream/123456789/31507/1/Meina-rini%20Catur%20Utami.pdf. Vallerand, R.J. (2004). Intrinsic and extrinsic motivation in sport. Encyclopedia of Applied Psychology, 2, 427-435.
doi: 10.1016/B0-12-657410-3/00835-7. Vallerand, R.J., Pelletier, L.G., Blais, M.R., & Briere, N.M. (1992). The academic motivation scale: A meas-ure of intrinsic, extrinsic, and amotivation in education. Educational and Psychological Measurement, 52(4), 1003-1007. doi: 10.1177/0013164492052 004025. Wijayanto, S.H. (2008). Structural Equation Modeling dengan LISREL 8.8. Yogyakarta: Graha Ilmu.
Wiktorowicz, J. (2016). Exploratory factor analysis in the measurement of the competencies of older people. Journal of Economic Literature, 54(4), 48-60. doi: 10.15611/ekt.2016.4.03.
Yong, A.G. & Pearce, S. (2013) A beginner’s guide to factor analysis: Focusing on exploratory factor analysis. Tutorials in Quantitative Methods for Psychology, 9(2), 79-94. doi: 10.20982/tqmp.09.2.p079.
Zhang, B., Li, Y.M., Li, J., Li, Y., & Zhang, H. (2016). The revision and validation of the Academic Motivation Scale in China. Journal of Psychoeducational Assess-ment, 34(1), 15-27. doi: 10.1177/0734282 915575909.
Validation of the Academic Motivation Scale in Indonesian 39
Makara Hubs-Asia July 2018 ½Vol. 22 ½ No. 1
Appendix
Appendix 1. CFA Results for Each Subdimension of AMS–Bahasa Indonesia
Appendix 2. CFA Results for Each Subdimension of AMS–Bahasa Indonesia
40 Natalya & Purwanto
Makara Hubs-Asia. July 2018 ½Vol. 22 ½ No. 1
Appendix 3. CFA Results of AMS–Bahasa Indonesia
Appendix 4. EFA Results of AMS–Bahasa Indonesia
Validation of the Academic Motivation Scale in Indonesian 41
Makara Hubs-Asia July 2018 ½Vol. 22 ½ No. 1
Appendix 5. Rotated Component Matrix of Three Dimensions
Component 1 2 3
IMTK_25 0.723 IMES_12 0.718 IMTK_17 0.691 IMES_04 0.677 IMTA_29 0.674 IMES_27 0.656 IMES_19 0.656 IMTK_02 0.635 IMTA_07 0.630 IMTK_10 0.592 IMTA_22 0.559 IMTA_14 0.516 EMID_18 0.508 0.447 EMID_26 0.491 0.479 EMID_03 0.474 0.456 EMER_24 0.794 EMER_09 0.790 EMER_01 0.715 EMER_16 0.677 EMID_11 0.581 EMIN_30 0.498 EMIN_23 0.461 EMIN_08 0.434 0.440 AMOT_20 0.800 AMOT_28 0.792 AMOT_13 0.754 AMOT_06 0.751 AMOT_21 0.741 AMOT_05 0.737
Note: IMTK = intrinsic motivationto know, IMTA = intrinsic motivationto accomplish things, IMES = intrinsic motiva-tion experienced stimulation, EMER = external regulation, EMIN = introjected regulation, EMID = identified regula-
tion, AMOT = amotivation, (dimension name)_(number of item) (i.e., AMOT_05) = item name structure
42 Natalya & Purwanto
Makara Hubs-Asia. July 2018 ½Vol. 22 ½ No. 1
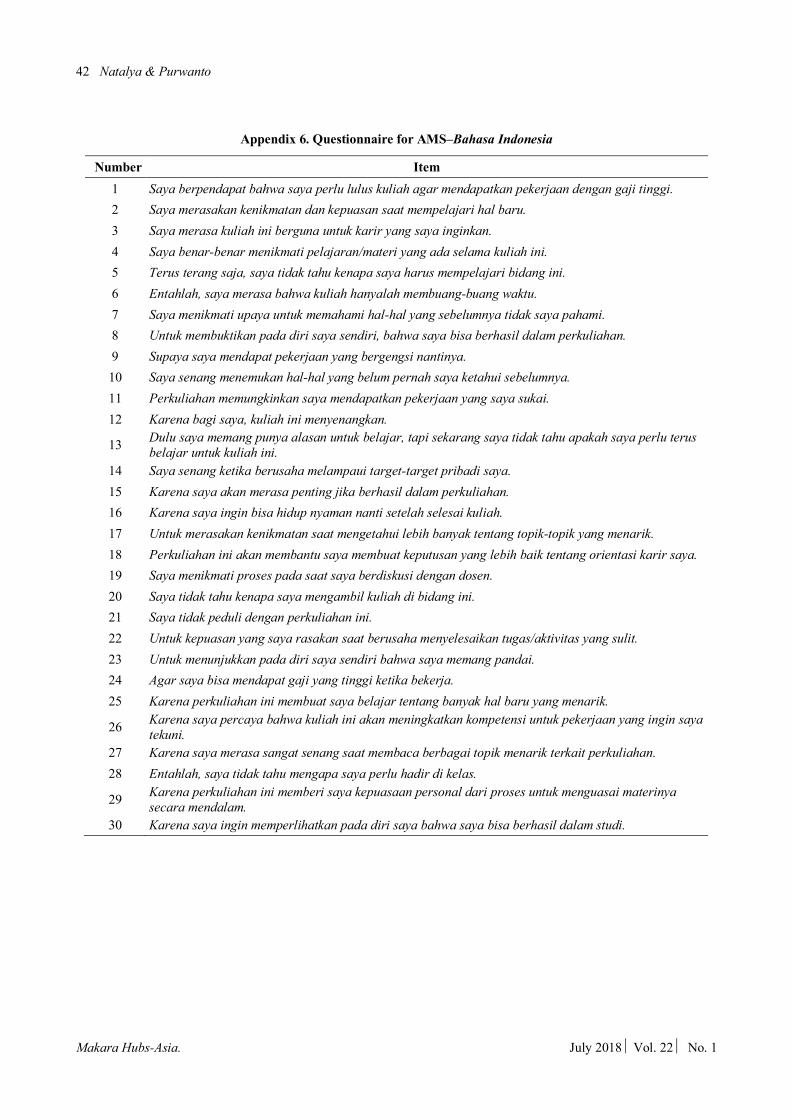
Appendix 6. Questionnaire for AMS–Bahasa Indonesia
Number Item 1 Saya berpendapat bahwa saya perlu lulus kuliah agar mendapatkan pekerjaan dengan gaji tinggi. 2 Saya merasakan kenikmatan dan kepuasan saat mempelajari hal baru. 3 Saya merasa kuliah ini berguna untuk karir yang saya inginkan. 4 Saya benar-benar menikmati pelajaran/materi yang ada selama kuliah ini. 5 Terus terang saja, saya tidak tahu kenapa saya harus mempelajari bidang ini. 6 Entahlah, saya merasa bahwa kuliah hanyalah membuang-buang waktu. 7 Saya menikmati upaya untuk memahami hal-hal yang sebelumnya tidak saya pahami. 8 Untuk membuktikan pada diri saya sendiri, bahwa saya bisa berhasil dalam perkuliahan. 9 Supaya saya mendapat pekerjaan yang bergengsi nantinya. 10 Saya senang menemukan hal-hal yang belum pernah saya ketahui sebelumnya. 11 Perkuliahan memungkinkan saya mendapatkan pekerjaan yang saya sukai. 12 Karena bagi saya, kuliah ini menyenangkan.
13 Dulu saya memang punya alasan untuk belajar, tapi sekarang saya tidak tahu apakah saya perlu terus belajar untuk kuliah ini.
14 Saya senang ketika berusaha melampaui target-target pribadi saya. 15 Karena saya akan merasa penting jika berhasil dalam perkuliahan. 16 Karena saya ingin bisa hidup nyaman nanti setelah selesai kuliah. 17 Untuk merasakan kenikmatan saat mengetahui lebih banyak tentang topik-topik yang menarik. 18 Perkuliahan ini akan membantu saya membuat keputusan yang lebih baik tentang orientasi karir saya. 19 Saya menikmati proses pada saat saya berdiskusi dengan dosen. 20 Saya tidak tahu kenapa saya mengambil kuliah di bidang ini. 21 Saya tidak peduli dengan perkuliahan ini. 22 Untuk kepuasan yang saya rasakan saat berusaha menyelesaikan tugas/aktivitas yang sulit. 23 Untuk menunjukkan pada diri saya sendiri bahwa saya memang pandai. 24 Agar saya bisa mendapat gaji yang tinggi ketika bekerja. 25 Karena perkuliahan ini membuat saya belajar tentang banyak hal baru yang menarik.
26 Karena saya percaya bahwa kuliah ini akan meningkatkan kompetensi untuk pekerjaan yang ingin saya tekuni.
27 Karena saya merasa sangat senang saat membaca berbagai topik menarik terkait perkuliahan. 28 Entahlah, saya tidak tahu mengapa saya perlu hadir di kelas.
29 Karena perkuliahan ini memberi saya kepuasaan personal dari proses untuk menguasai materinya secara mendalam.
30 Karena saya ingin memperlihatkan pada diri saya bahwa saya bisa berhasil dalam studi.