Embed Size (px)
Citation preview
Portland State University Portland State University
PDXScholar PDXScholar
Dissertations and Theses Dissertations and Theses
Winter 1-6-2016
Exploratory Study of the Adoption and Use of the Exploratory Study of the Adoption and Use of the
Smartphone Technology in Emerging Regions: Case Smartphone Technology in Emerging Regions: Case
of Saudi Arabia of Saudi Arabia
Fahad Abdulaziz Aldhaban Portland State University
Follow this and additional works at: https://pdxscholar.library.pdx.edu/open_access_etds
Part of the Communication Technology and New Media Commons, Other Operations Research,
Systems Engineering and Industrial Engineering Commons, and the Science and Technology Studies
Commons
Let us know how access to this document benefits you.
Recommended Citation Recommended Citation Aldhaban, Fahad Abdulaziz, "Exploratory Study of the Adoption and Use of the Smartphone Technology in Emerging Regions: Case of Saudi Arabia" (2016). Dissertations and Theses. Paper 2651. https://doi.org/10.15760/etd.2647
This Dissertation is brought to you for free and open access. It has been accepted for inclusion in Dissertations and Theses by an authorized administrator of PDXScholar. Please contact us if we can make this document more accessible: [email protected].
Exploratory Study of the Adoption and Use of the Smartphone Technology in Emerging
Regions: Case of Saudi Arabia
by
Fahad Abdulaziz Aldhaban
A dissertation submitted in partial fulfillment of the
requirements for the degree of
Doctor of Philosophy in
Technology Management
Dissertation Committee: Tugrul U. Daim, Chair
Robert L. Fountain Robert Harmon
Kenny Phan
Portland State Universtiy 2016
i
Abstract
Users’ acceptance of a new information technology (IT) is considered to be a key
determinant factor of its success. Also, studying users’ adoption and use of new IT plays
an important role in determining users’ needs and reducing business risk, especially in
industry segments with rapid changes in IT such as Smartphone technology. Such rapid
evolution is influencing consumers’ behaviors, their daily lifestyle, the manner of
conducting their activities and their ways of consuming and using information.
Smartphone technology holds a promising future with an expected global market
that could reach US $258 billion by the end of year 2015 [1]. Besides the mobile
industry, Smartphone technology introduces a wide range of opportunities and
challenges for many related industries that participate directly or indirectly in producing
and providing Smartphone services/products to the end users. Moreover, the
Smartphone technology is relatively new technology with plenty of room for
improvement.
Better understanding of users’ intentions and their behaviors regarding the
adoption and use of the Smartphone technology plays a critical role in determining its
success and benefiting all stakeholders. Significant efforts have been made to study and
explain users’ adoption and use of Smartphone technology. However, most of the
empirical research focused on only a limited number of Smartphone aspects or on a
ii
specific profession such as doctors and nurses which may neglect other important
factors.
In emerging regions such as Jordan and China, cultural and social influence
showed significant relationships with users’ adoption and use of the Smartphone and its
related technologies. Saudi Arabia is a developing country that has different cultural and
social contexts that could influence users' intention to adopt and use the Smartphone
technology. The key factors that influence general users' intention to adopt and use
Smartphone technology in Saudi Arabia have not yet been studied and explored in a
comprehensive manner. Therefore, the main purpose of this dissertation is to
empirically study and explore the key factors that influence general users’ adoption and
use of the Smartphone in a comprehensive manner in Saudi Arabia.
This dissertation starts with a literature review of existing research related to the
adoption and use of Smartphone technology. Taxonomy is developed that includes
factors that were identified as important in previous research and related to the
adoption and use of the Smartphone technology. By using the developed taxonomy and
reviewing literature related to the IT adoption theories, a preliminary theoretical
research model is developed based on the Unified Theory of Acceptance and Use of
Technology (UTAUT). A number of qualitative methods, namely brainstorming, focus
group and individual interviews, have been conducted to evaluate, select and validate
the existing factors, as well as introduce new factors, and to identify only the most
related factors to be included in the preliminary research model. A survey questionnaire
iii
has been developed and validated to survey general users of the Smartphone in Saudi
Arabia. A web-based survey has been designed and sent through email to 5,000
randomly selected smartphones users in Saudi Arabia. Data has been statistically
analyzed using Structural Equation Modeling (SEM). The results indicate that
performance expectancy factor, effort expectancy factor, brand influence factor,
perceived enjoyment factor and design factor have a positive and significant
relationship with users’ intention to adopt and use smartphones in Saudi Arabia. Also,
the results indicate that the social influence factor has a significant and positive
relationship with use behavior or actual use of smartphones in Saudi Arabia. The results
of this dissertation provide more insights to practitioners in the smartphones domain
and information that contributes to the body of knowledge regarding information
technology adoption and its related research, especially in Saudi Arabia.
iv
Dedication
To my father Sheikh Abdulaziz Aldhaban and Mother Fatima Althobait, for their
unlimited love and support throughout my life, my brothers Dr. Saud Aldhaban and
Muhammad Aldhaban for their inspiration and continued support. To my beloved wife
Ebtesam Alasbli and my children, Melaf, Shodoown, Lamar and Abdulaziz who are my
strength, inspiration and joy of my life.
v
Acknowledgments
I would like to express my sincere gratitude to my advisor and committee chair
Dr. Tugrul Daim and committee members Dr. Robert Fountain, Dr. Robert Harmon and
Dr. Kenny Phan for their continuous efforts in encouraging and guiding me throughout
my dissertation. From the first day I arrived at ETM, Dr. Daim’s vision, experience, and
guidance contributed generously to my work and research.
Dr. Fountain’s experience, useful comments and feedback helped me to better
understand and use analytical methods in my dissertation and greatly enhanced my
experience with statistical analysis. His detailed comments and feedback contributed
highly to my dissertation. Dr. Harmon’s positivity, continued encouragement, and
contributions guided me and enhanced my dissertation process. Dr. Phan’s
encouragement useful feedback, support and advice were invaluable.
I sincerely thank all of my committee members for their time, effort and patience,
throughout my research. They are all always positive and ready to help in any way. Their
experience, knowledge, and vision contributed to my success. I would also like to thank
all of ETM faculty, staff and students for making my experience at the ETM one of the
best chapters in my life.
vi
Table of Contents
Abstract ................................................................................................................................ i
Dedication ........................................................................................................................... iv
Acknowledgments................................................................................................................ v
List of Tables ....................................................................................................................... xi
List of Figures .................................................................................................................... xiv
1 Chapter One: Research Objectives and Overview ........................................................... 1
1.1. Smartphone Technology .............................................................................................. 1
1.2 Users’ adoption and use of the Smartphone technology ............................................. 3
1.3 Studying the adoption and use of Smartphone and its related technologies in
emerging regions ................................................................................................................ 6
1.4 Saudi Arabia; its Economy and Telecom Sector ........................................................... 9
1.5 Language, Cultural differences and the Needs for Graduate Level Research ............ 12
1.6 Research related to Smartphone technology in Saudi Arabia .................................... 14
1.7 Studying Smartphone in Saudi Arabia ........................................................................ 15
1.8 Research Objectives .................................................................................................... 16
1.9 Research Approach ..................................................................................................... 16
2 Chapter Two: Literature Review .................................................................................... 18
2.1 Relevant Theories Used to Study the Adoption and Use of (IT) ................................. 19
2.2 Research Related to the Adoption and Use of Smartphone ...................................... 27
2.3 Taxonomy of Factors Related to The Adoption and Use of Smartphones ................. 46
2.4 Research Gaps ............................................................................................................. 51
2.5 Research Questions .................................................................................................... 53
3 Chapter Three: Developing Research Model and Research Hypotheses ...................... 56
3.1 Brainstorming.............................................................................................................. 62
vii
3.2 Focus Group ................................................................................................................ 65
3.3 Individual Interviews ................................................................................................... 67
3.4 Conducting Brainstorming session ............................................................................. 72
3.5 Conducting Focus Group Session ................................................................................ 76
3.6 Conducting Individual Interviews ............................................................................... 80
3.7 Results of the Qualitative methods that have been conducted ................................. 83
3.8 Developing Research Model ....................................................................................... 90
3.9 Developing Research hypotheses ............................................................................... 96
4 Chapter Four: Research Approach ............................................................................... 110
4.1 Research Design ........................................................................................................ 110
4.2 Survey Instrument Development .............................................................................. 110
4.2.1 Survey Design ......................................................................................................... 112
4.2.2 Developing the survey instrument ........................................................................ 113
4.2.3 Questionnaire Design............................................................................................. 113
4.2.4 Designing the type and form of the survey questions ........................................... 114
4.3 Validity and Reliability............................................................................................... 116
4.3.1 Validity ................................................................................................................... 116
4.3.2 Expert Panel Design ............................................................................................... 118
4.3.3 Reliability ................................................................................................................ 123
4.4 Instrument Validation ............................................................................................... 124
4.4.1 Validation Plan ....................................................................................................... 125
4.5 Instrument Administration ....................................................................................... 142
4.5.1 Sampling ................................................................................................................. 144
viii
4.5.2 Survey Administration ........................................................................................... 151
4.5.3 Response Rate ........................................................................................................ 154
4.5.4 Respondent Profile ................................................................................................ 156
4.5.5 Non-Response Error: Wave Analysis...................................................................... 157
4.5.6 Nonresponse Error: Item Nonresponse ................................................................. 159
4.5.7 Post-Survey Adjustments ....................................................................................... 160
4.5.8 Data Screening ....................................................................................................... 160
4.5.9 Reliability ................................................................................................................ 161
5 Chapter Five: Research Methodology .......................................................................... 162
5.1 Structural Educational Modeling (SEM) .................................................................... 162
5.2 Reflective Measurement ........................................................................................... 165
5.3 Use of SEM in IT adoption Research ......................................................................... 167
5.3 SEM Process, Assumptions and Limitations ............................................................. 167
6 Chapter Six: Analysis .................................................................................................... 175
6.1 Measurement Model ................................................................................................ 176
6.2 Structural Model ....................................................................................................... 180
7 Chapter Seven: Results ................................................................................................ 183
7.1 Performance Expectancy Factor ............................................................................... 183
7.2 Effort Expectancy Factor ........................................................................................... 184
7.3 Economic Factors Factor ........................................................................................... 185
7.4 Brand Influence Factor .............................................................................................. 186
7.5 Perceived Enjoyment Factor ..................................................................................... 187
7.6 Design Factor ............................................................................................................ 188
7.7 Facilitating Conditions Factor ................................................................................... 189
ix
7.8 Social Influence Factor .............................................................................................. 191
7.9 Behavioral Intentions Factor ..................................................................................... 192
8 Chapter Eight: Hypotheses Testing and Discussion ..................................................... 193
8.1 Performance expectancy factor ................................................................................ 193
8.2 Effort expectancy Factor ........................................................................................... 194
8.3 Economic factors Factor ........................................................................................... 196
8.4 Brand Influence Factor .............................................................................................. 198
8.5 Perceived Enjoyment Factor ..................................................................................... 199
8.6 Design Factor ............................................................................................................ 200
8.7 Social Influence Factor .............................................................................................. 201
8.8 Facilitating conditions factor .................................................................................... 203
8.9 Behavioral Intention Factor ...................................................................................... 205
9 Chapter nine: Conclusion, Research Contribution, Limitation and Future Research .. 210
9.1 Conclusion ................................................................................................................. 210
9.2 Research Contributions ............................................................................................. 213
9.3 Limitation and Future Research ................................................................................ 217
References: ..................................................................................................................... 220
Appendix A: Brainstorming Session ................................................................................ 240
invitation for targeted participants in brainstorming session ........................................ 240
Main question for the brainstorming session................................................................. 247
Conference room reservation confirmation email ......................................................... 248
sample slides of the presentation in the brainstorming session .................................... 249
Appendix B: Focus Group Session ................................................................................... 250
Details provided to participants in the focus group session .......................................... 251

x
Questions for the participants in the focus group .......................................................... 257
Example of the slides of the presentation presented in the focus group session ......... 258
Appendix C: Individual Interviews ................................................................................. 259
Main Interview Questions ............................................................................................... 266
Appendix D: Consent Form ............................................................................................. 267
Appendix E: An Example of the Validation Tool Developed to be Used by Experts....... 269
Appendix F: Example of the Translation Validation Tool................................................ 279
Appendix G: Email Invitation Sent to Invite Participants to Participate in the Survey ... 286
Appendix H: Examples of Proportion of Respondent to Items and Items Statistics ...... 287
Appendix I: Screen Captures of The Web-based Survey ................................................ 293
Appendix J: Survey Items English Version ...................................................................... 303
Appendix K: Survey Items Arabic Version ....................................................................... 305
xi
List of Tables
Table 1: Summary of relevant IT theoretical models ....................................................... 26
Table 2: Summary of empirical research related to the adoption of Smartphone
technology ........................................................................................................................ 43
Table 3 Definitions and explanations for the main factors that were identified through
literature ........................................................................................................................... 49
Table 4: Summary of the Research Gaps, Objectives and Questions (explained in more
details above) .................................................................................................................... 55
Table 5: Adoption factors derived through literature review .......................................... 57
Table 6: Summary of descriptions steps conducted to develop the research model ...... 60
Table 7: Summary of the steps conducted to develop the research model .................... 72
Table 8: Participants in the Brainstorming session ........................................................... 75
Table 9: Participants in the focus group session .............................................................. 79
Table 10: Participants in the individual’s interviews ........................................................ 82
Table 11: Factors related to the adoption smartphones derived from literature............ 84
Table 12: Number of factors introduced in each method ................................................ 85
Table 13: New factors introduced by participants in the qualitative methods ................ 86
Table 14: Factors selected by participants in the qualitative methods ............................ 88
Table 15: Definition of the main research model’ factors ................................................ 92
Table 16: Origin models used to develop the UTAUT model & the specific factors that
were integrated into each factor ...................................................................................... 95
Table 17: Research Questions and the preliminary hypotheses .................................... 109
Table 18: An example of the Survey Testing and Validation Tool .................................. 118
Table 19: An example of translation validating tool ....................................................... 122
xii
Table 20: Developing and validating the English version of the survey instrument ...... 125
Table 21: Developing and validating the Arabic version of the survey instrument ....... 126
Table 22: Content Validation Results .............................................................................. 132
Table 23: Experts participated in the first expert panel ................................................. 133
Table 24: Experts participated in the second expert panel – validating survey translation
......................................................................................................................................... 138
Table 25: Experts panel 3 – validating survey translation back to English ..................... 139
Table 26: Example of scenarios to Estimate the minimum sample size required for this
dissertation ..................................................................................................................... 151
Table 27: Respondent age .............................................................................................. 157
Table 28: Respondent level of education ....................................................................... 157
Table 29: Performance Expectancy (PE) item (PE1) ....................................................... 158
Table 30: Expected Effort (EE) item (EE1) ....................................................................... 158
Table 31: Social Influence (SI) item (SI1) ......................................................................... 158
Table 32: Brand Influence (BIF) item (BIF1) .................................................................... 159
Table 33: Economic Factors (EF) item (EF1) ................................................................... 159
Table 34: Reliability of factors and its specification ....................................................... 161
Table 35: Recommended indices to obtain a goodness of model fit indicators ............ 176
Table 36: Model fit indices - Results of the model measurement fit ............................. 178
Table 37: Proportion of respondent for item PE1 .......................................................... 183
Table 38: PE1 statistics .................................................................................................... 184
Table 39: Proportion of respondent for item EE1 .......................................................... 184
Table 40: EE1 statistics .................................................................................................... 185
Table 41: Proportion of respondent for item EF1.......................................................... 186
xiii
Table 42: EF1 statistics .................................................................................................... 186
Table 43: Proportion of respondent for item BIF1 ........................................................ 187
Table 44: BIF1 statistics ................................................................................................... 187
Table 45: Proportion of respondent for item PJ1 ........................................................... 188
Table 46: PJ1 statistics .................................................................................................... 188
Table 47: Proportion of respondent for item DS1 .......................................................... 189
Table 48: DS1 statistics ................................................................................................... 189
Table 49: Proportion of respondent for item FC1 ......................................................... 190
Table 50: FC1 statistics .................................................................................................... 190
Table 51: Proportion of respondent for item SI1 ........................................................... 191
Table 52: SI1 statistics ..................................................................................................... 191
Table 53: Proportion of respondent for item BI1 ........................................................... 192
Table 54: BI1 statistics .................................................................................................... 192
Table 55: hypotheses testing results .............................................................................. 207
Table 56: Hypotheses testing results - Standardized Regression Weights ..................... 208
Table 57: Full structural model ....................................................................................... 209
xiv
List of Figures
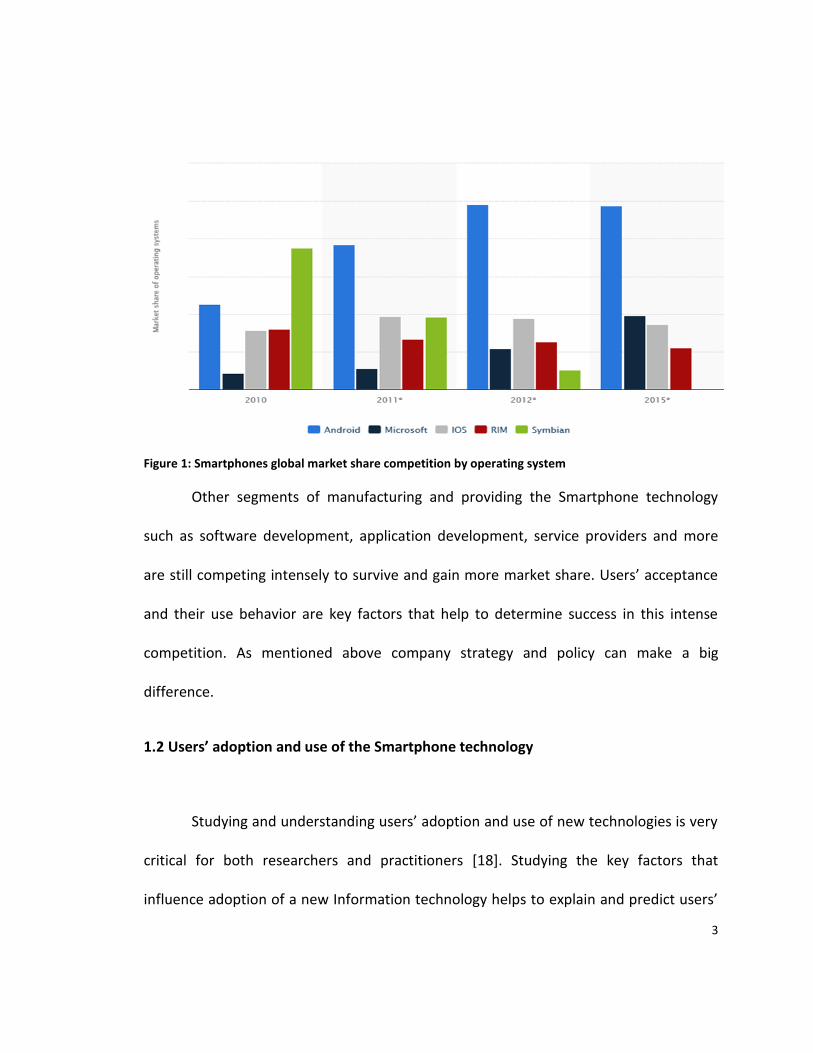
Figure 1: Smartphones global market share competition by operating system ................ 3
Figure 2: Theory of Reasoned Action (adapted from Ajzen) [75] ..................................... 22
Figure 3: Technology Acceptance Model (TAM) (adopted from Davis) [3, 75, 76] .......... 23
Figure 4: Theory of Planned Behaviors (TPB) (adopted from Ajzen) [73] ........................ 24
Figure 5: Taxonomy of factors related to the adoption and use of the Smartphone ...... 48
Figure 6: Factors selected by participants in the qualitative methods ............................ 89
Figure 7: Research model ................................................................................................. 91
Figure 8: A Screen-shot of the Pilot Test of the survey questionnaire – English version.
......................................................................................................................................... 135
Figure 9: A Screen-shot of the web based survey questioner the Arabic version ......... 141
Figure 10: Effect of sample size on fit indices CFI [235] ................................................ 149
Figure 11: A screenshot of the invitation email .............................................................. 153
Figure 12 Response rate over time ................................................................................. 155
Figure 13: An example of measurement model (CFA) model [214]. .............................. 171
Figure 14: Measurement Model ..................................................................................... 179
Figure 15: Structural model ............................................................................................ 181
Figure 16: The research model with the results ............................................................. 182
1
1 Chapter One: Research Objectives and Overview
1.1. Smartphone Technology
Smartphone technology is defined in two ways: 1) as “a hand-held computer
capable of multiple functions in addition to placing calls” [2]; and 2) as “a mobile phone
offering advanced capabilities, often with PC-like functionality (PC mobile handset
convergence)” [3]. Smartphone technology is based mainly on a well-integrated
combination of hardware, software and network.
Blackberry mobile was introduced by Research In Motion (RIM) in 1999 [4]. It
enabled users to send and receive email which appealed to business users as a
productive tool [4]. In 2000, Microsoft realized that the smartphone could be a real
competitor to the laptop and it released its first operating system (OS), the Pocket 2000,
for mobile devices [5]. The introduction of Microsoft Pocket 2000 OS for mobile devices
is considered to be the first major move by a software company into the mobile market
[6, 5]. To compete in the early smartphones market, a number of hardware
manufacturers, namely Nokia, Ericsson, Panasonic, and Samsung collaborated on a
single operating system called Symbian OS to be used in their devices [6].
In 2007, Apple released the iPhone, which provided more and advanced options
such as an adjustable touch screen interface, music, and a gaming platform, which
appealed to the general community [7]. Google noticed the trend of internet search by
mobile devices [6] and quickly decided to enter the mobile market by acquiring a
2
company that develops software for mobile devices called Android [6]. They decided to
adopt a different strategy than Apple OS’s 'closed source policy' and built an open
source operating system based on Linux [8, 6]. Google embedded its own search site
into its OS, provided its OS free for manufacturers and enabled any application
developer to develop applications [6]. Researchers credited the success of the Google
OS (Android) to Google’s ability to better understand their customers and provide them
with products/services accordingly [6].
Smartphone technology is a relatively new technology that is rapidly evolving
and gradually impacting consumers’ behavior, their daily activities, their social activities,
the mobile industry, business activities, marketing, education, healthcare and more [9-
11]. Smartphone technology offers the potential to improve efficiency and productivity,
reduce cost, improve users’ satisfactions and enhance their experience in a number of
related industries including, healthcare, finance, ecommerce, education, entertainment,
tourism [12-14]. The Smartphone market is expected to reach $258 billion globally by
the end of year 2015 [1]. Company spending on mobile promotions and advertisement
is expected to increase sharply to reach more than US$50 billion by year 2015 [11].
Competition among manufacturers, developers and providers in the Smartphone
industry is still very intense. Device manufacturers such as Apple, Samsung and LG are
competing to gain market share. Global competition for manufacturing Smartphone
operating system is still fierce. There are many competitors including Apple, Android,
Microsoft, Symbian, and RIM as indicated in the figure below [15-17].
3
Figure 1: Smartphones global market share competition by operating system
Other segments of manufacturing and providing the Smartphone technology
such as software development, application development, service providers and more
are still competing intensely to survive and gain more market share. Users’ acceptance
and their use behavior are key factors that help to determine success in this intense
competition. As mentioned above company strategy and policy can make a big
difference.
1.2 Users’ adoption and use of the Smartphone technology
Studying and understanding users’ adoption and use of new technologies is very
critical for both researchers and practitioners [18]. Studying the key factors that
influence adoption of a new Information technology helps to explain and predict users’
4
attitudes toward adopting or rejecting that new technology. Users’ acceptance of a new
information technology (IT) is considered to be a key determinant of its success and
their lack of acceptance is considered to be an obstacle to its success [19]. Moreover,
understanding users’ adoption and use of new IT plays an important role in determining
users’ needs and reducing business risk, especially with rapid changes in IT such as
Smartphone technology [20].
Smartphone users’ acceptance and behavior are considered to be key factors to
continue successful growth for the Smartphone technology and its stakeholders [21,
22]. Consequently, evaluating and better understanding the key factors that influence
users’ adoption and use of Smartphone technology has become more important to all
stakeholders. Designers, developers, and manufacturers need to improve related
products/services, and to meet consumers’ expectations [21, 23]. Scholars from
different fields and interests agree on the importance of Smartphone technology as a
critical part of the evolution of the information technology domain [24].
A number of research studies have been conducted to explore users’ adoption
and use of Smartphone technology. However, most of the existing empirical research
focused on only a limited number of factors such as the fun aspects of using the
Smartphone [24] or the effect of the enjoyment aspect on the adoption of the
Smartphone [25]. Moreover, a number of empirical studies considered the Smartphone
as if it were a tool to be used in executing a specific task such as using the Smartphone
in the healthcare sector [26]. Other researchers focused on a specific profession such

5
studying adoption of smartphones among doctors and nurses [27, 28], studying the
adoption of smartphones among employees in delivery services [29] or studying the
adoption and use of smartphones among college students [30].
Studying only one or few factors that influence users' adoption of Smartphone
technology will result in neglect of other important factors and make it harder to gain a
complete perspective. It is more appropriate to examine and compare all related
characteristics within the same research in a holistic and comprehensive manner [31]. In
a number of studies, scholars pointed out the important role of cultural and social
factors and their influence on the adoption and use of new information technologies
[32-36]. Saudi Arabia is a developing country and it has different social and cultural
contexts. It can be characterized as a society that is relatively collectivist in nature as
individuals have closer ties and high influence among and between them [32]. In a
number of empirical studies, scholars studied the adoption and use of Smartphone
technologies in Saudi Arabia, including the adoption of mobile internet [9], adoption and
use of e-services [37], and acceptance and use of Information Technology (IT) [32]. Their
results showed that a number of factors, namely social influences, facilitating conditions
and language, showed significant relationships with users’ adoption and use of IT in
Saudi Arabia. In emerging regions, specifically Saudi Arabia, little or no effort has been
made to study and explore the key factors that influence users to adopt and use the
Smartphone technology. The Saudi Arabian economy is growing fast and it is supporting
the significant expansion of its telecommunication sector which has had less than ten
6
years of experience in an open competition market [38]. With this environment,
understanding users’ intention to adopt and use the Smartphone technology has
become a very important factor that needs to be better understood, especially when
creating and providing mobile products, services, contents, applications and its related
products [39]. However, there has been very little effort to empirically study the factors
that influence the adoption and use of the Smartphone technology in Saudi Arabia. In
fact, there does not appear to be any research that studied these in a holistic manner.
Therefore, the main purpose of this dissertation is to develop a research model
and to conduct empirical research to advance existing knowledge toward a better
understanding of the key factors that influence users’ adoption and use of the
Smartphone technology in Saudi Arabia.
1.3 Studying the adoption and use of Smartphone and its related technologies in
emerging regions
Arpaci et al. [40] investigated the impacts of cultural differences on Smartphone
adoption by organizations in Canada and Turkey. Their finding showed that cultural
differences have a significant influence on adoption behavior. Their results indicated
that there are significant differences in factors that influence the adoption of
Smartphone between countries [40]. Alnajjar et al. [41] studied the influence of cultural
and social factors on individuals’ intention to adopt and use mobile commerce in Jordan.
Their finding showed that cultural and social factors have positive and significant
relationship with individuals' intention to adopt and use m-commerce in Jordan. A
7
number of empirical research studies were conducted to study the key factors that
influence users’ adoption and use of the Smartphone and its related technologies in
China, also an emerging region. In most of these studies, cultural and social influences
showed a significant relationship with users’ adoption and use the Smartphone and its
related technologies.
Pan et al. [42] empirically investigated the key factors that influence the
adoption of the Smartphone among college students in China. Their results showed that
social influence has a significant and positive influence on users’ adoption of the
Smartphone [42]. Ling and Yuan [43] utilized the Theory of Reasoned Action (TRA) to
empirically study the factors that influence users’ adoption and use of the Smartphone
in China and found that subjective norms were among the significant factors that have
positive effects on the use of the Smartphone [43]. Lai and Lai studied the factors that
influence users’ adoption and use of mobile commerce in China [44]. Their results show
that social influences were among the significant factors that influence users to adopt
and use mobile commerce in China-Macau [44]. Park et al. [45] empirically studied the
factors that influence users’ adoption of mobile technologies in China. They found that
social influence shows a significant influence on users’ adoption of mobile technology in
China [45]. Pan and March [46] studied the factors that influence the older adults’
adoption of the internet in China. Subjective norms were among the significant factors
that influence the adoption of the internet [46].
8
Zhou et al. [127] integrated the Technology Task Fit (TTF) model with the Unified
Theory of Acceptance and Use of Technology (UTAUT) model to explain the key factors
that influence users’ adoption of mobile banking in China. Their finding indicated that
social influence was among the key factors that have significant effects on user adoption
of mobile banking in China [127]. Lu et al. [47] conducted an empirical study to explore
the key factors that influence users’ acceptance of wireless internet via mobile
technology in China. Social influence and facilitating conditions were among the
significant factors that influenced users’ acceptance of the wireless internet via mobile
technology [47]. Dai and Palvia [21] conducted a cross cultural empirical research to
study the factors that influence users’ adoption of mobile commerce in the United
States and China. Their results showed a number of significant differences among
factors that influence users’ adoption of mobile commerce which include that subjective
norms showed more influence on users’ adoption in China than in the United States
[21].
In Summary:
Hill et al. [48] stated: “As most technology is designed and produced in
developed countries, it is culturally-biased in favor of those developed countries’ social
and cultural systems.“ Also, they indicated that differences in Arabic culture and society
have an influence on how new IT is accepted, viewed and utilized among users [48].
Factors that influenced users’ adoption and use of the Smartphone and its related
technologies in other emerging regions, such as China, showed significant differences
9
among factors based on the users’ perspective and their cultural and regional
differences. As mentioned in the previous paragraph, cultural and social factors showed
a significant influence on users’ adoption and use of Smartphone and its related
technologies in China. Saudi Arabia is a country that is witnessing rapid development
and has different cultural and social contexts, which may influence users’ adoption and
use of the Smartphone and its related technologies. Moreover, it has been indicated
that there is a need for more empirical research to identify the key factors that
influence users’ behavioral intention to adopt and use the Smartphone technology in a
comprehensive manner [49-51]. A number of scholars mentioned the lack of research
investigating the key factors that influence the acceptance and use of Smartphone
technology in Saudi Arabia [52, 53, 14, 54]. To date, there is no holistic and
comprehensive empirical research regarding the key factors that influence general
users’ intention to adopt and use the Smartphone. Therefore, this dissertation aims to
identify and explore the key factors that influence general users’ adoption and use of
the Smartphone technology in Saudi Arabia.
1.4 Saudi Arabia; its Economy and Telecom Sector
Saudi Arabia is considered to be a central pillar of Arab nations. It is located in
the Arabian Peninsula in the Middle East [53] and is the largest state of the Gulf
Cooperation Council (GCC) with a total area of 2,149,690 square kilometers and a
population of about 21 million [55, 53, 56]. Saudi Arabia is one of the world’s largest oil
producers and it has about twenty percent of the world’s proven oil reserves [57]. Oil
10
export accounts for about 90% of the country’s revenue, and the economy continues to
improve, especially with the increase in the price of oil and the rise in demand for oil
worldwide [58, 59]. The government is working toward diversifying the economy away
from its reliance on oil; therefore, it is encouraging and supporting growth in the private
sector [60].
The Saudi government is focusing on a number of sectors to play a critical role in
the economic diversification effort including the telecommunications sector [60]. Due to
the continued increase in its oil production, Saudi Arabia is witnessing a continuous
growth in gross domestic product (GDP) accompanied by noticeable increase in its
population [61]. The growth of GDP and the increases in population in Saudi Arabia
indicates a healthy economy that holds a promising future, especially for the mobile
industry.
The Saudi government’s long-term vision is to transform into an information
society with a global, modernized and digital economy [59, 62]. Competition in the
mobile market is a relatively new trend in Saudi Arabia as the market was monopolized
by a government-owned company, Saudi Telecommunication Company (STC), until it
was changed into partial competition in 2005 [38]. With this new, relatively open
competition in the Saudi telecom market, understanding users and their preferences
has become a very important factor that needs to be carefully considered and better
understood when creating and providing mobile products, services, contents,
applications and any related products [39]. Telecommunication companies in Saudi
11
Arabia have started to partner with companies from other countries to gain competitive
advantage and increase their revenue [55].
Even though Saudi Arabia’s telecommunications industry is growing, it still needs
improvement in many of the mobile services provided compared to other GCC
countries. Saudi Arabia is the largest telecom market of all the GCC states; however,
Saudi consumers spend less on telecom services compared to other countries in the GCC
region as a trade-off for the limits on services [39].
There are a number of existing challenges in the Saudi Arabian telecom industry.
For instance, only around eight percent of commercial organizations have online
purchase channels that consumers can use to buy their product online, which indicates
a challenge for electronic commerce including mobile commerce [63]. To improve its
performance, enhance users’ experience and reduce cost, the government of Saudi
Arabia is attempting to provide its services electronically in a number of its sectors;
however, this is still in a very early stage of adoption [53]. According to the Saudi
Communications and Information Technology Commission (CITC) mobile payments are
considered a key challenge for electronic payment systems in Saudi Arabia [64].
Moreover, English language content is still considered as a challenge and the lack of
Arabic content is seen as a barrier for many Saudi users to use the internet [64].
With the continuous evolution of Smartphone technology, mobile industry
revenue has been changing: revenue from voice and texting services are shrinking while
revenue from value added services and data services are rising [65, 66]. Data revenue in
12
Saudi telecom companies accounts for only about 15 percent of total revenues, which is
still low compared to 40 percent in the developed market [67]. Electronic government
services are still a new trend and it still has a number of challenges to deal with such as
the lack of training and the lack of information security [68]. Better understanding of
smartphones’ users and their use behavior will provide meaningful advantages that can
help the government, private sector and all stakeholders to provide users with better
services/products and improve their experience.
1.5 Language, Cultural differences and the Needs for Graduate Level Research
Arabic is the main language of Saudi Arabia’s population. Numerous scholars
mentioned that lack of English language was one of the major holdups in the adoption
and use of the internet and e-services in Saudi Arabia [37]. The majority of IT services’
contents are designed with English version interfaces and intended mostly for English
speaking consumers [37]. Even though many Saudis are eager to study and speak
English, only about ten percent of the Saudi population presently speaks English [69]. In
many studies, scholars pointed out the important role of cultural factors and their
influence on the adoption and use of new information technologies [32-36]. Saudi
Arabia has different cultural contexts than Western nations. It is characterized as society
that is more collectivist in nature. Individuals and family have closer ties resulting in
high influence among and between them [32]. Gahtani et al. [32] studied the effects of
13
the cultural aspects on the acceptance and use of IT in Saudi Arabia. They found that
subjective norms positively influence users’ intention to use IT.
Around 22% of Saudi people have a bachelor’s degree, approximately 1% have a
master's degree and about .5% have a Doctorate [70]. Higher education and academic
research are very important aspects that the government of Saudi Arabia is pursuing
and highly encouraging, especially in recent years [71]. Nevertheless, there is less effort
spent on academic research at the graduate level and the connection between the
private sector and academic institutions in Saudi Arabia is very poor [72]. There is an
obvious need for academic research at the graduate level that addresses the problems,
challenges and benefits in Saudi society [71].
In recent years, the government is working to fulfill the need for graduate level
research in Saudi Arabia with special emphasis on science and technology. This can be
seen in a number of steps taken by the government to encourage and obtain good
quality research, including starting the King Abdullah Program for Scholarship in
countries around the world [73]. There are around 111,000 Saudi students in the United
States [74]. Moreover, Saudi Arabia established a new graduate level research
university, King Abdullah University of Science and Technology (KAUST). It’s budget is
only exceeded by that of Harvard University and it has gained a well-known reputation
in specific research fields around the world in a short time [75].
Adams et al. [76] explored the research challenges in a number of Middle
Eastern countries including Saudi Arabia. They indicated that there is a notable growth

14
in academic research in a number of countries in the region including Turkey and Iran.
However, in Saudi Arabia, academic research activity is still very low and there is a need
for improvement. Also, some of these sources mentioned the importance of strong
research to improve and develop a more robust education system that benefits the
society, especially with the availability of rich human capacity and other resources [76].
1.6 Research related to Smartphone technology in Saudi Arabia
Numerous studies have been conducted in subjects related to the Smartphone
technology in Saudi Arabia. Al-Meshal and Almotairi [52] studied the factors that
influence users’ acceptance of mobile marketing among female users in Saudi Arabia
including: providing information, sharing content, accessing content, personal
attachments and perceived value. Alwahaishi and Snasel studied the factors that
influenced users to adopt mobile internet in Saudi Arabia [9]. They indicated that the
Smartphone represented about 12 percent of the total handset traffic worldwide. They
found that performance expectancy and perceived playfulness are the strongest
influential factors on users’ behavioral intention to use mobile internet.
Seliaman and Al-Turki [54] studied mobile learning in Saudi Arabia. They
mentioned the lack of published research that studied adoption of mobile technology in
Saudi Arabia. Saddik et al. [14] studied the adoption of PDA and the Smartphone among
physicians and dentists in King Saud Medical Hospital in Saudi Arabia. Also, they
mentioned the need for research to study the adoption of the Smartphone, which may
15
help to increase users’ productivity and decrease costs, especially in the healthcare
sector.
1.7 Studying Smartphone in Saudi Arabia
Smartphone technology proposes to contribute to Saudi society and its economy
by improving users’ efficiency and productivity. Also, it can play a critical role in reducing
cost, improving electronic communication channels and enhancing users’ experience in
Saudi Arabia. Providing Smartphone technology to end users requires a great deal of
cooperative work and effort that involves many stakeholders, including services
providers, device providers, software developers, contents developers operating
systems/platforms developers and more. Even with highly designed and advanced
technology, users' acceptance is still a very important key that determines its success
[77]. Saudi Arabia has different cultural and social contexts which many influence users
differently, therefore understanding users’ perspectives of the Smartphone plays a key
role in developing and providing more successful and more valuable Smartphone
products and services [39]. Numerous scholars mentioned the lack of research that
investigates and explores the key factors that influence the acceptance and use of
Smartphone technology in Saudi Arabia in a holistic manner [52, 53, 14, 54]. Therefore,
the aim of the dissertation is to explore and study the key factors that influence general
users’ adoption and use of the Smartphone technology in Saudi Arabia.
16
1.8 Research Objectives
This dissertation intends to conduct empirical research to advance existing
knowledge toward a better understanding of the key factors that influence general
users’ intention to adopt and use Smartphone technology in Saudi Arabia. A research
model will be developed and utilized in this research to obtain a better understanding
and more insight into the key factors that are associated with this process. The research
surveyed general users of the Smartphone in Saudi Arabia. The objectives of this
dissertation can be summarized into the following main goals:
G1- Developing a research model that can be used to obtain a better
understanding and more insight regarding the key factors that are associated
with users’ adoption and use of the Smartphone in Saudi Arabia. This research
model is developed based on the existing IT theoretical adoption models, related
adoption factors’ taxonomy developed based on previous related research and
opinions of experienced users and those who work in sectors related to
Smartphone technology.
G2- Explore and better understand the key factors that may have relationships
with general users’ adoption and use the Smartphone technology in Saudi Arabia
based on users’ perspectives.
1.9 Research Approach
This dissertation is conducted in a number of steps summarized below:
17
An overview of the importance of studying users’ adoption and use of IT in
general and the Smartphone in particular. Research objective and the
purpose of this dissertation as to why adoption of Smartphone technology in
Saudi Arabia is important. Background about Saudi Arabia and its IT and
mobile sector.
A literature review on research related to the adoption and use of
Smartphones to review and obtain more insight on: existing research and
scope; factors related to the adoption and use of the Smartphone identified
in literature; and, the IT theories and methodology used in existing research.
Also, research gaps and questions that have been identified in, and
regarding, past research.
The development of hypotheses and a research model. The research model
has been developed based on review of the existing IT theoretical adoption
models, plus factors identified and classified from existing literature review.
Moreover, a number of qualitative methods have been conducted:
brainstorming sessions, focus groups and individual interviews to introduce
new factors, evaluate, validate and select the most important factors to be
included in the research model.
The research methodology, Structural Equation Modeling (SEM), has been
discussed in more details.
18
Research design has been discussed and a survey instrument has been
developed, tested and validated. A web-based survey has been developed
and administered to a randomly selected sample of Smartphones users in
Saudi Arabia. Data has been collected and statistically analyzed using SEM.
Results and hypotheses testing have been provided. Conclusions and
potential contributions of future research are discussed and provided.
2 Chapter Two: Literature Review
19
The purpose of this chapter is to provide a comprehensive review of the existing
research related to the adoption and use of the Smartphone technology. Based on the
literature review, taxonomy has been developed to classify factors that were identified
in the literature as important and related to the adoption and use of Smartphone
technology. Additionally, this chapter provides a review of the IT theoretical models that
are related to the adoption of IT.
2.1 Relevant Theories Used to Study the Adoption and Use of (IT)
Scholars’ interest in studying and understanding users’ adoption and use of new IT
at both the organizational level and the individual level has been evolving for decades
[78]. With the evolution of IT, a number of theories have been developed and modified
to better study and understand users’ acceptance and use of new IT. Dillon and Morris
[77] defined users’ acceptance as “the demonstrable willingness within users group to
employ information technology for the tasks it is designed to support.” Rogers [79]
defined diffusion of innovation as “Diffusion is the process by which an innovation is
communicated through certain channels over time among the members of a social
system. “ Also, Rogers [70] highlights four elements of diffusion namely innovation, time
communication channels and social systems. Rogers stated that: “Innovations that are
perceived by individuals as having greater relative advantage, compatibility, trialability,
and observability, and less complexity will be adopted more rapidly than other
innovation” [79]. Innovation diffusion theory (IDT) was introduced in 1995 by Rogers
20
and it specifies five characteristics of innovation (relative advantage, compatibility,
complexity, observability, and trialability) that influences diffusion of innovation [79].
Rogers also mentioned that these five attributes are very important explaining an
innovation adoption. He defined them as follows [79]:
(1) Relative advantage: refers to the level to which an innovation is perceived by an
individual to be a superior option among other available options.
(2) Compatibility: refers to the level to which an innovation is perceived by an
individual as being in line with his or life style.
(3) Complexity: refers to the level of difficulty which individuals perceived to be
associated with innovation or use and understanding of the innovation.
(4) Observability: refers to the level of benefits or attributes of an innovation that is
visible to other possible adopters.
(5) Trialability: refers to the level of ease for individuals to experience the innovation
before they adopt it.
In Rogers’ definition of diffusion he identified four main elements: innovation, time,
communication channels and social systems. Each of these elements play a role in the
adoption of technology [79]. Moreover ten characteristics were specified by Tornatzky
and Klein [31], including the five that were identified by Rogers. They added five more
attributes namely: cost, communicability, divisibility, profitability, and social approval.
Alavi and Joachimsthaler mentioned that cognitive style, personality, demographic and
user situational variables are the most relevant user factors that can help to determine
21
the acceptance of technology [80]. Rogers categorized adopters into five categories with
regard to the time in which they take to adopt new technology; innovators, early
adopters, early majority, late majority and laggards. Each of those users has distinct
characteristics that were identified by Rogers [79]. As information technologies evolve
and the nature of each technology changes, theories of IT adoption evolve as well. In
attempt to better understand, predict and explain users’ adoption and use of new
technologies at both the organization’s level and the individual’s level, a number of
theoretical models were introduced, developed and tested including the following:
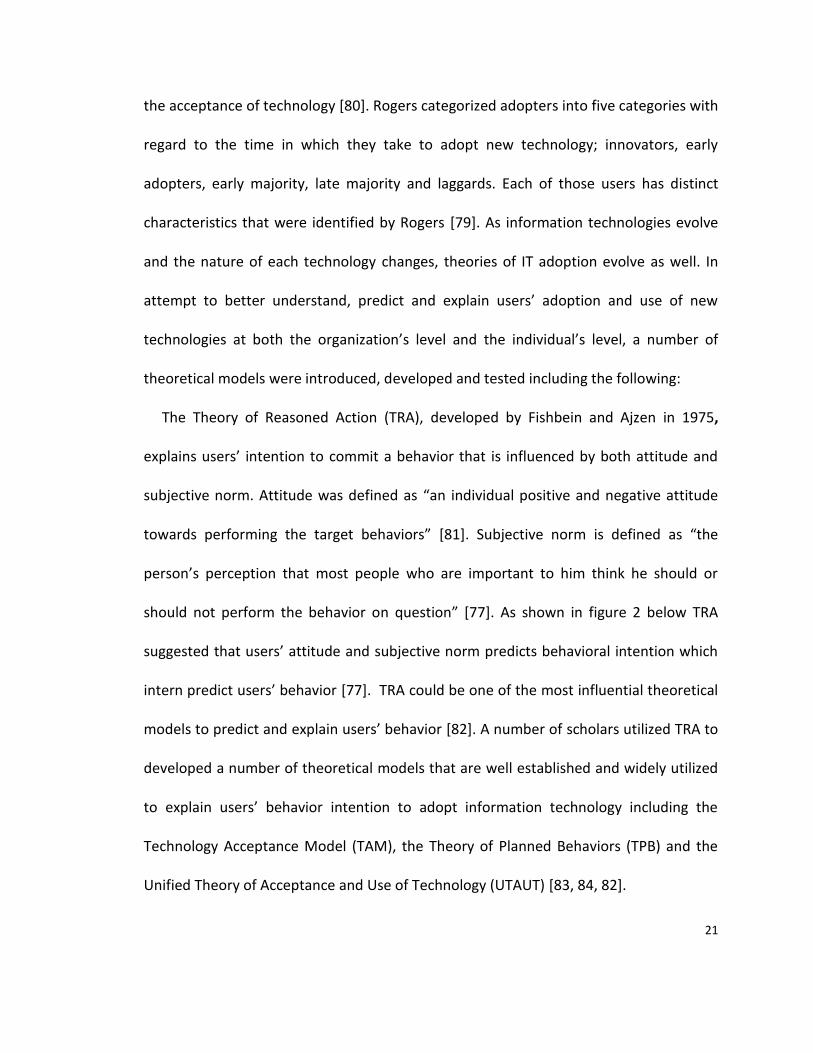
The Theory of Reasoned Action (TRA), developed by Fishbein and Ajzen in 1975,
explains users’ intention to commit a behavior that is influenced by both attitude and
subjective norm. Attitude was defined as “an individual positive and negative attitude
towards performing the target behaviors” [81]. Subjective norm is defined as “the
person’s perception that most people who are important to him think he should or
should not perform the behavior on question” [77]. As shown in figure 2 below TRA
suggested that users’ attitude and subjective norm predicts behavioral intention which
intern predict users’ behavior [77]. TRA could be one of the most influential theoretical
models to predict and explain users’ behavior [82]. A number of scholars utilized TRA to
developed a number of theoretical models that are well established and widely utilized
to explain users’ behavior intention to adopt information technology including the
Technology Acceptance Model (TAM), the Theory of Planned Behaviors (TPB) and the
Unified Theory of Acceptance and Use of Technology (UTAUT) [83, 84, 82].
22
Figure 2: Theory of Reasoned Action (adapted from Ajzen) [75]
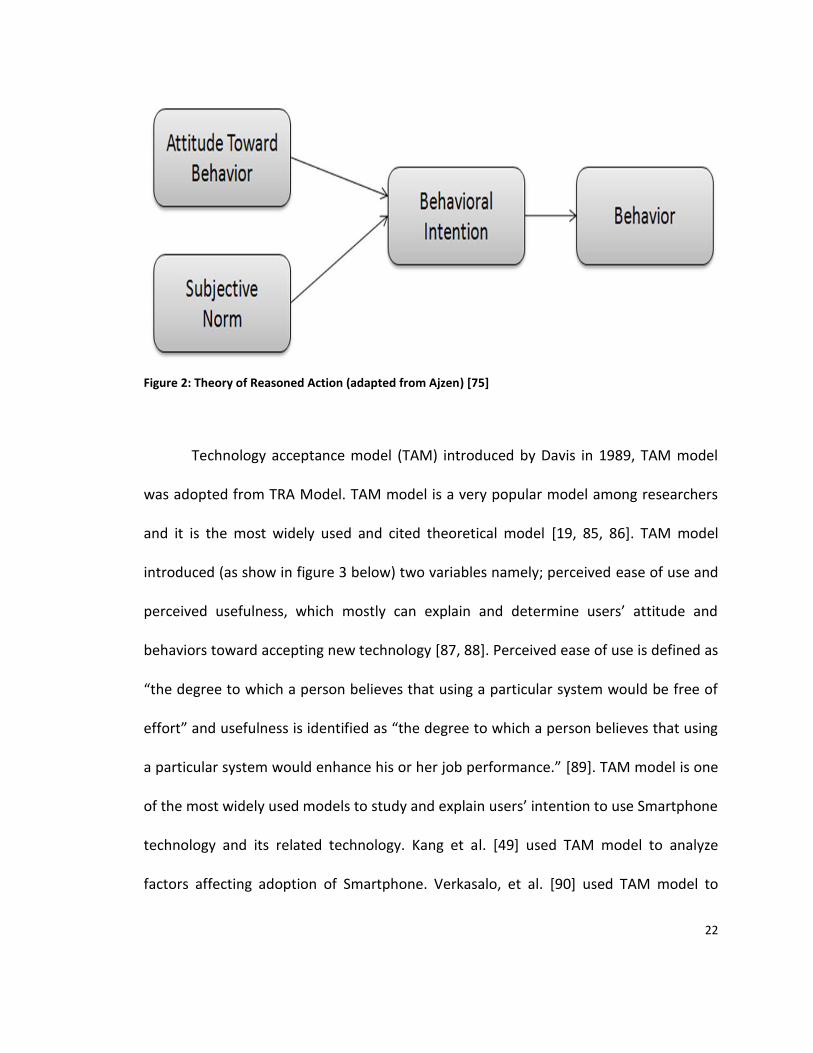
Technology acceptance model (TAM) introduced by Davis in 1989, TAM model
was adopted from TRA Model. TAM model is a very popular model among researchers
and it is the most widely used and cited theoretical model [19, 85, 86]. TAM model
introduced (as show in figure 3 below) two variables namely; perceived ease of use and
perceived usefulness, which mostly can explain and determine users’ attitude and
behaviors toward accepting new technology [87, 88]. Perceived ease of use is defined as
“the degree to which a person believes that using a particular system would be free of
effort” and usefulness is identified as “the degree to which a person believes that using
a particular system would enhance his or her job performance.” [89]. TAM model is one
of the most widely used models to study and explain users’ intention to use Smartphone
technology and its related technology. Kang et al. [49] used TAM model to analyze
factors affecting adoption of Smartphone. Verkasalo, et al. [90] used TAM model to
23
study users’ intention to use specific Smartphone’ applications. Kim [91] extended TAM
model to study users’ intention to adopt mobile wireless technology (MWT) -
Smartphone. Chen et al. [29] combined IDT and the TAM model to explain the users’
adoption of Smartphone. However, TAM model is able to explain only about 40% of
variances of technology acceptance [82]. Moreover, scholars have specified a number of
limitations in the TAM model and highlighted the need for adding more variables to the
model especially related to human and social factors [92].
Figure 3: Technology Acceptance Model (TAM) (adopted from Davis) [3, 75, 76]
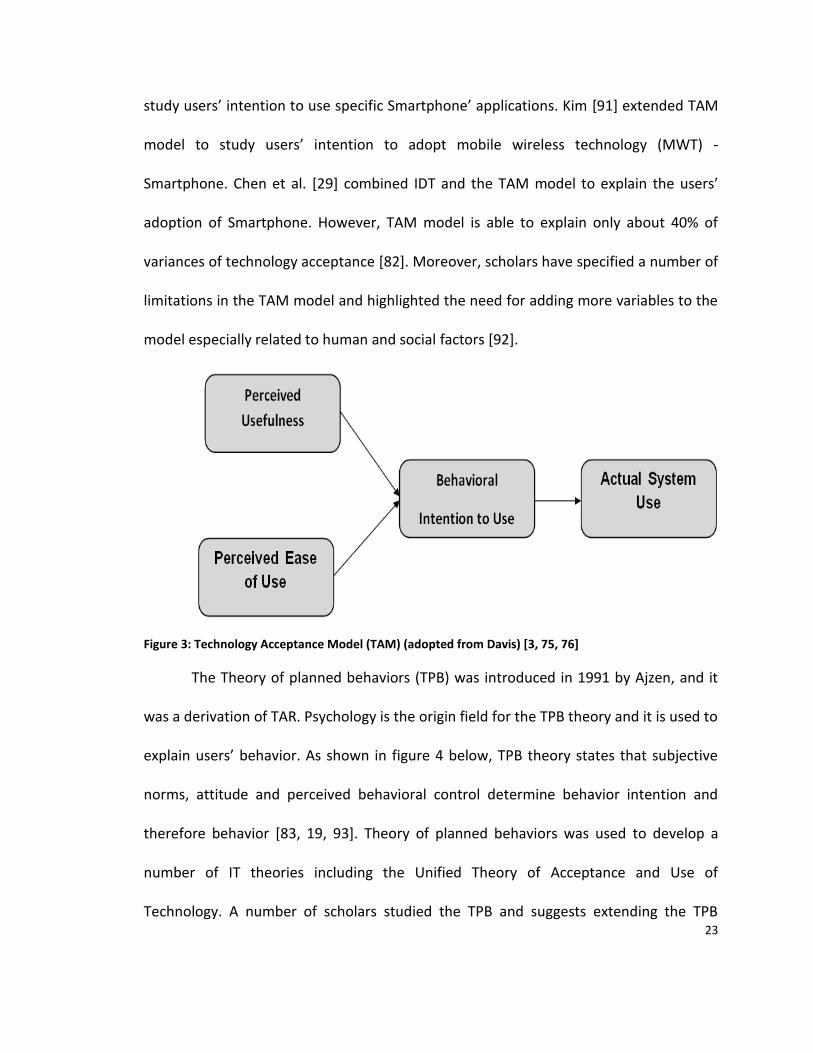
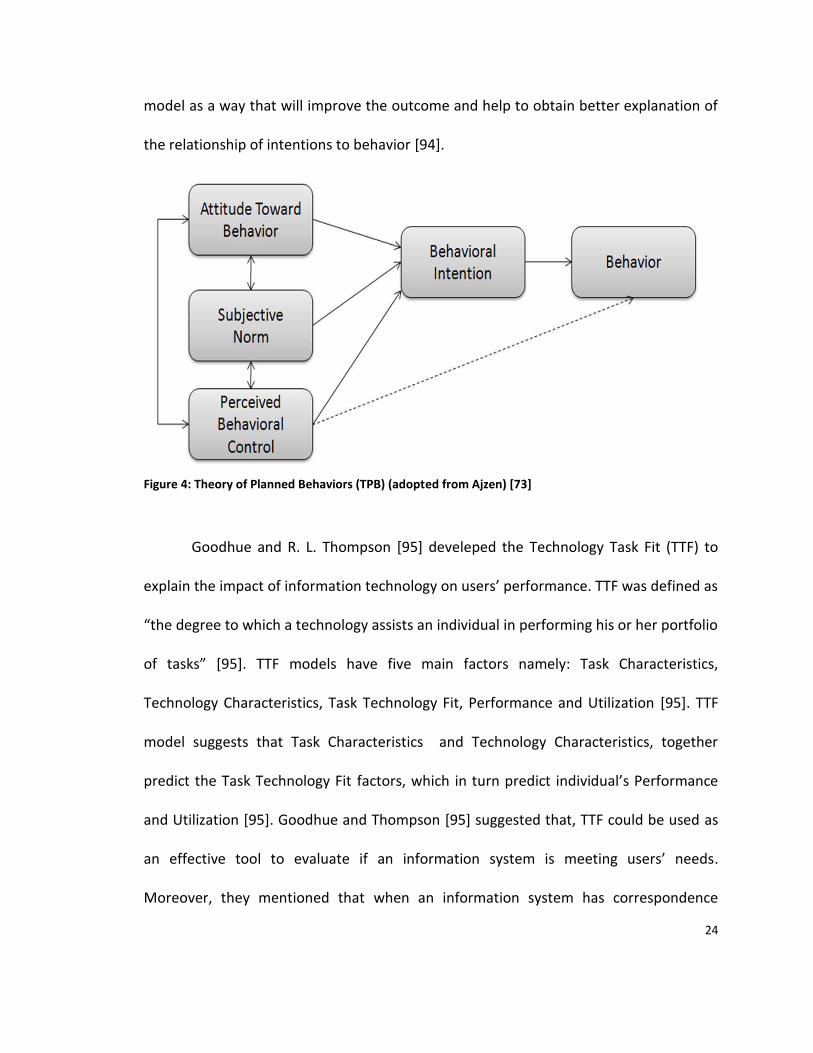
The Theory of planned behaviors (TPB) was introduced in 1991 by Ajzen, and it
was a derivation of TAR. Psychology is the origin field for the TPB theory and it is used to
explain users’ behavior. As shown in figure 4 below, TPB theory states that subjective
norms, attitude and perceived behavioral control determine behavior intention and
therefore behavior [83, 19, 93]. Theory of planned behaviors was used to develop a
number of IT theories including the Unified Theory of Acceptance and Use of
Technology. A number of scholars studied the TPB and suggests extending the TPB
24
model as a way that will improve the outcome and help to obtain better explanation of
the relationship of intentions to behavior [94].
Figure 4: Theory of Planned Behaviors (TPB) (adopted from Ajzen) [73]
Goodhue and R. L. Thompson [95] develeped the Technology Task Fit (TTF) to
explain the impact of information technology on users’ performance. TTF was defined as
“the degree to which a technology assists an individual in performing his or her portfolio
of tasks” [95]. TTF models have five main factors namely: Task Characteristics,
Technology Characteristics, Task Technology Fit, Performance and Utilization [95]. TTF
model suggests that Task Characteristics and Technology Characteristics, together
predict the Task Technology Fit factors, which in turn predict individual’s Performance
and Utilization [95]. Goodhue and Thompson [95] suggested that, TTF could be used as
an effective tool to evaluate if an information system is meeting users’ needs.
Moreover, they mentioned that when an information system has correspondence
25
between its functionality and users’ task requirements it positively affects their
performance [95]. Task Technology Fit factors found to have a positive and significant
relationship with individual’s Performance [95].
Venkatesh [82] introduced the Unified Theory of Acceptance and Use of Technology
(UTAUT) which is based on the integration of TRA, TAM, TPB, motivational Model (MM),
model of PC Utilization (MPCU) IDT and Social Cognitive Theory (SCT). UTAUT is been
used to study and explain users’ acceptance of information technology in many fields.
UTAUT consists of four main factors namely: performance expectancy, effort
expectancy, social influence and facilitating conditions that can explain and predict an
individual’s behavioral intention and use behavior [82]. Performance expectancy is
defined as the degree to which an individual believes that using a Smartphone will help
him or her to attain benefits in their overall performance. Effort expectancy is defined as
the degree of ease associated with the use of the Smartphone. Social influence is
defined as the extent to which an individual perceives that important others to believe
he or she should use a Smartphone. Facilitating conditions are defined as the degree to
which an individual believes that technical and infrastructure supports are available to
support the use of a system. UTAUT suggest that performance expectancy, effort
expectancy, and social influence factors can predict behavior intention factor which in
return predict the use behavior factor.
Today’s information technologies such as the Smartphone and its related
technologies are developing at a fast rate. Thus a great effort has been made to develop
26
a more reliable and comprehensive theoretical model that can explain and predict
users’ adoption and use of IT. It is observed from this literature review that theoretical
models have been developed to gain better results and account for the changes in
technologies and users’ behaviors. Older model such as TRA play a big role in the
development of the next models as shown in table 1 below. As shown in Table 1 below
many of the newer IT theoretical models such as UTAUT are based on derivations from
older models and consist of more and improved factors which make them more mature
and more suitable to study the newer technologies such as the Smartphone and its
related technologies. Table 1 below lists a number of relevant IT adoption theoretical
models.
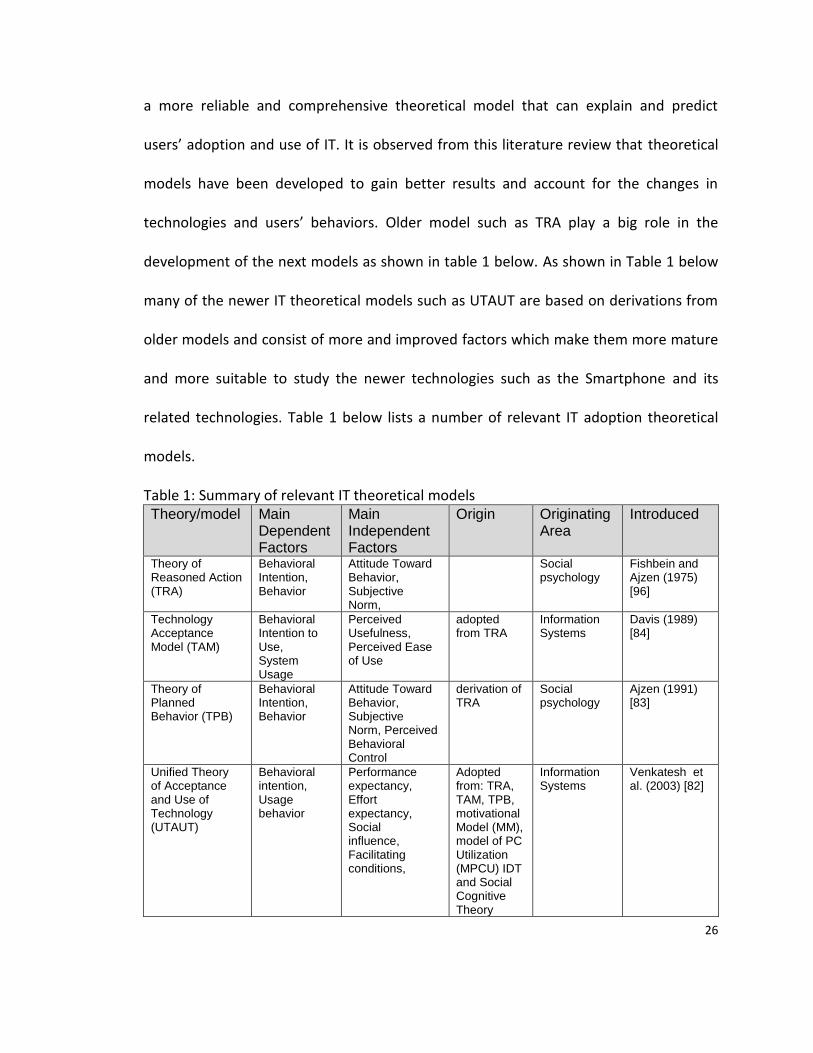
Table 1: Summary of relevant IT theoretical models Theory/model Main
Dependent Factors
Main Independent Factors
Origin Originating Area
Introduced
Theory of Reasoned Action (TRA)
Behavioral Intention, Behavior
Attitude Toward Behavior, Subjective Norm,
Social psychology
Fishbein and Ajzen (1975) [96]
Technology Acceptance Model (TAM)
Behavioral Intention to Use, System Usage
Perceived Usefulness, Perceived Ease of Use
adopted from TRA
Information Systems
Davis (1989) [84]
Theory of Planned Behavior (TPB)
Behavioral Intention, Behavior
Attitude Toward Behavior, Subjective Norm, Perceived Behavioral Control
derivation of TRA
Social psychology
Ajzen (1991) [83]
Unified Theory of Acceptance and Use of Technology (UTAUT)
Behavioral intention, Usage behavior
Performance expectancy, Effort expectancy, Social influence, Facilitating conditions,
Adopted from: TRA, TAM, TPB, motivational Model (MM), model of PC Utilization (MPCU) IDT and Social Cognitive Theory
Information Systems
Venkatesh et al. (2003) [82]
27
(SCT).
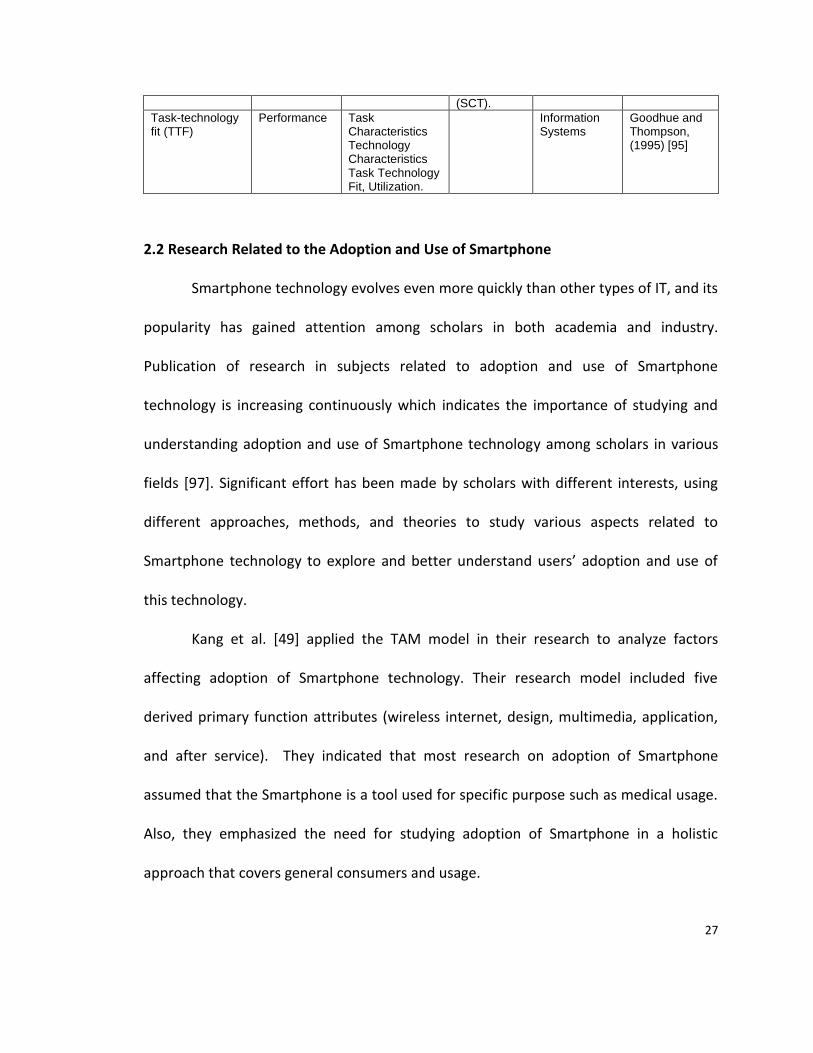
Task-technology fit (TTF)
Performance Task Characteristics Technology Characteristics Task Technology Fit, Utilization.
Information Systems
Goodhue and Thompson, (1995) [95]
2.2 Research Related to the Adoption and Use of Smartphone
Smartphone technology evolves even more quickly than other types of IT, and its
popularity has gained attention among scholars in both academia and industry.
Publication of research in subjects related to adoption and use of Smartphone
technology is increasing continuously which indicates the importance of studying and
understanding adoption and use of Smartphone technology among scholars in various
fields [97]. Significant effort has been made by scholars with different interests, using
different approaches, methods, and theories to study various aspects related to
Smartphone technology to explore and better understand users’ adoption and use of
this technology.
Kang et al. [49] applied the TAM model in their research to analyze factors
affecting adoption of Smartphone technology. Their research model included five
derived primary function attributes (wireless internet, design, multimedia, application,
and after service). They indicated that most research on adoption of Smartphone
assumed that the Smartphone is a tool used for specific purpose such as medical usage.
Also, they emphasized the need for studying adoption of Smartphone in a holistic
approach that covers general consumers and usage.
28
Verkasalo, et al. [90] studied adoption of Smartphone’ applications using the
TAM model to understand users’ intention to use specific Smartphone’s applications
including internet access, mapping services, and games. Their research model included
the following variables: behavioral control, technical barriers, social norms, perceived
enjoyment. They highlighted the needs for further research that investigate the impacts
of social norms factors on adoption of Smartphone adoptions. Kim [91] indicated that
even though the mobile wireless technology (MWT) market is rapidly growing, studies
on key factors affecting its adoption are limited. They extended the TAM model to study
users’ intention to adopt MWT - Smartphone. This research model tested the effect of
perceived cost saving, company’s willingness to fund, job relevance and experience
factors on users adoption of Smartphone. The study focused on a group of employees in
an organization.
Combining IT theoretical models was an approach that numerous researchers
used in an attempt to more comprehensively study and predict adoption of Smartphone
technology. Chen et al. [29] combined Innovation Diffusion Theory (IDT) and TAM
models to study and explain the adoption of Smartphone. Their study was limited to the
logistics industry, specifically on delivery employees in a delivery service company. Their
research model tested the effects of self-efficacy, compatibility, observable, testability,
task, individual, and organization environment factors on adoption of Smartphones.
Choudrie et al. [98] combined a number of theories namely: Unified Theory of
Acceptance and Use of Technology (UTAUT), the Diffusion of Innovations theory (DoI),
29
and TAM to study the adoption and use of the Smartphone by older adults in the United
Kingdom. Also, Ho et al. [99] combined the TAM model and Status Quo Theory to build a
theoretical framework that considers technological and economic perspectives that
explain users’ intention to continue using mobile data services MDS. This framework
included factors such as perceived service availability, switching benefits and switching
cost. Their research did not study the effects of psychological factor on adoption of MDS
which they considered as research' limitation that can be further studied.
Based on adopter categories in diffusion models, Aarnio et al. [100] analyzed
survey using the clustering process in an SPSS statistical package to explore adoption of
mobile services focusing on a specific group of users in a certain age cohort. Their
findings highlighted the importance of pricing as a crucial factor for higher diffusion.
Moreover, Kargin et al. [101] used conjoint analysis to studied user’ adoption of mobile
Value Add Services (VAS) and to identify important factors affecting users’ intention to
adopt VAS. They analyzed factors influencing adoption of VAS including personalization,
content, cost, screen size and service speed.
In a qualitative research approach that was based on interviews, Kargin and
Basoglu [65] studied factors affecting users’ adoption of mobile’ Value Added Services.
They proposed a mobile services adoption’ taxonomy that include two aspects: Service
characteristics (content, cost, enjoyment and mobility) and social factors (social
influences and user characteristics). Swar et al. [102] used the Bass Diffusion Model to
investigate the effect of national cultural factors on adoption of mobile phone services
30
by studying the pattern of mobile phones’ service adoptions in different counties and
comparing them to observe the effect of cultural differences on adoption of mobile
services.
Other approaches to studying and understanding the adoption and use of
Smartphone were introduced. Verkasalo [51] introduced MobiTrack, a framework to
conduct real-life data to analyze Smartphone users’ behaviors. MobiTrack is a research
application that Smartphone users’ download into their Smartphone to monitor and
collect data on device and services usage such as: communication usage, multimedia
usage, apps usage, and internet traffic. He indicated the need for more comprehensive
data on Smartphone users and their behavior in using it that can be used to develop
better products. The MobiTrack approach seems to focus on people who had already
adopted Smartphone technology and monitoring their behavior in usage of Smartphone
device and services.
Also, Cherubini et al. [103] conducted an ethnographic observation study to
explore the adoption and refusal of mobile contextual services. They identified 24 user
needs that can be fulfilled by these applications and they discussed nine barriers of
adoption of contextual services. Moreover, Huang et al. [104] believe that a Smartphone
could become a suitable substitute for a traditional computer, yet the performance of
Smartphone applications is poorly understood. So, they used systematic methodology to
study and to better understand factors that impact users’ perceived performance of
some Smartphone applications.
31
Kim and Garrison [105] investigated key factors that influenced users’ adoption
of mobile wireless technology (MWT). MWT is used by mobile users as a vehicle to surf
the web, text message, perform mobile commerce activities, and more. They extended
TAM by incorporating three variables, namely: job relevance, perceived reachability and
perceived ubiquity. Moreover, they indicated the need for further studies to identify
more new key factors that influence adoption of MWT as it advanced.
Studying adoption and use of Smartphone technology by focusing on just one
Smartphone device or brand such as the Apple iPhone was an approach that a number
of scholars used in their research [106, 107]. Based on Ganesh and Kumar’s work, Chris
Maloney [107] developed a framework to explore the learning effects’ influence on the
rate of adoption in the market to better explain the impact of the learning effect on
adoption rate of the iPhone [107].
Also, Kim and Song [106] investigated the adoption and use of Blueberry
Smartphone. They developed their own research model that investigated the social,
economic, and technological characteristics that influence individuals’ attitude toward
adoption of a specific Smartphone device, namely Blueberry. Even though Smartphone
device brands such as Nokia, HTC, and Samsung have their own unique differences in
their combination of hardware/software, and they may influence user’s acceptance and
attitude toward adoption of Smartphone differently, the iPhone was the most studied
Smartphone device by scholars in articles reviewed [108-111, 7].
32
Focusing on or studying only a single factor or aspect that impacts users’
adoption and use of Smartphone technology was an approach that a number of scholars
used. Chtourou and Souiden [24] used the TAM model to study the effect of one factor,
namely the entertainment of using the Smartphone in browsing the internet. They
found that pleasure is an important factor that affects user attitudes toward the use of
the mobile internet. Moreover, they emphasized the importance of including emotional
motivations when studying users’ adoption of innovation. Their study was limited to the
use of mobile internet and they suggested a further study to modify and include other
products/services.
Also, Song and Han [25] used UTAUT to study the importance of the enjoyment
aspect of the users’ adoption of new technology in mobile services. They examined the
relationship between content quality and perceived enjoyment. Also they examined the
effect of social influence and the quality system on behavior intention of the user. They
emphasized on the importance of the enjoyment aspect on mobile services acceptance.
Moreover, Yoo et al. [112] identified the Smartphone device based on its characteristics
as a convergence device; therefore, users experience on Smartphone devices play a
crucial role in their adoption. They conducted a conjoint analysis using SPSS to
investigate the factor or aspect of positive reputation on adoption of smartphones. They
studied four groups of consumers (personal, expert, consumers, and mass media) as
their source of the external reputation of Smartphone. Also, a single factor or aspect,
33
namely aesthetic design, was studied to observe how it affects users’ emotional reaction
towards adoption of the Smartphone device[113].
Adoption and usage of Smartphone multimedia’ services and applications were
studied and investigated in number of articles. Bouwman et al. [114] used a sampling
and measurement model to study users’ intention to adopt mobile TV application for
Smartphones. They studied the effect of four variables (being alone, social, transit and
personal innovativeness) that initiate the use of Mobile TV.
In an empirical observational study, Verkaslo [115] studied consumers’ real
usage patterns of mobile multimedia’ services and application to understand users’
behaviors toward multimedia adoption in Smartphones. In another study, using survey
and cluster analysis, scholars explored the usages and adoption rates of Smartphone
multimedia in four clustered users: youngster, female, male and the older users [116].
In a number of articles scholars studied the mobile learning aspect. They believe
that mobile learning is a revolutionary technology that can open advanced avenues to
reach education and can influence the use and adoption of smartphones. Liu et al. [117]
indicated the lack of understanding factors affecting adoption of m-learning. They
applied the TAM model to explore factors influencing the adoption of mobile learning.
Factors identified and studied in their model included personal innovation, near-term
usefulness and long-term usefulness.
Usability of an object could be defined as "the quality of use that a user
experiences when in contact with the object" [118]. Page, [118] studied the usability of
34
text input interfaces in smartphones. He reviewed and compared a number of
smartphone typing methods to evaluate their usability. He indicated that there is a lack
of innovative soft keyboard development which he considered as a weak point of
smartphones when compared to laptops.
Also, Shin et al. [119] indicated that Smartphone technology is not yet ubiquitous
in the educational sector. They also mentioned the limitations of academic research on
Smartphone technology as a learning tool. They examined factors that influence users’
intentions to use smartphones as a ubiquitous learning tool. In their research model,
they modified unified theory of acceptance and use technology (UTAUT) and they used
factors from Expectation Confirmation Theory (ECT).Their research focused on ten
universities where a survey was distributed to faculty, staff and students. They
highlighted that limited aspects of users’ experience with Smartphones were reflected
upon, also they suggested that including additional factors in future research would
enable better understanding of Smartphone users’ behaviors.
In an observational study, Schepman et al. [95] explored the adoption of mobile
note-taking software that can be used on smartphones. Their research was focused on
undergraduate students who were observed over a period of eight weeks.
Adoption of Smartphone technology is a popular subject among researchers in
the healthcare industry. Researchers in a number of articles looked at Smartphone
technology as a very useful tool that could be utilized to improve performance and
35
quality of work in that environment. Park and Chen [27] used the TAM model to study
the adoption of Smartphone technology in the healthcare sector and they investigated
the factors that affect the adoption of Smartphone technology among doctors and
nurses. Their research model included the following factors: compatibility, observability,
trialability, and task individual organization environment factors. They indicated the
need for further research to investigate the adoption of Smartphone technology.
Also, Putzer and Park [28] investigated factors that affect individuals’ decision in
healthcare profession to adopt Smartphone. Their research model incorporated aspects
of the TAM model and DOI theory. The effects compatibility, observability, job
relevance, personal demographics, personal experience, internal environment, and
external environment on adoption of Smartphone technology among nurses were
investigated. The study focused on nurses in two community hospitals and it included
organizational factors that may affect adoption of Smartphone in healthcare
environments.
In a descriptive approach, Boulos et al. [120] discussed barriers of adoption to
smartphones applications in healthcare, including cost, network bandwidth, battery
efficiency, privacy and usability. Moreover, numerous scholars in descriptive
approaches recognized and discussed medically-related factors affecting adoption of
Smartphone technology in the healthcare industry where it is used as a tool to enable
better services and practices such as using the smartphones to help in obesity
prevention [121], patients’ activity recognizer while in the go [122], and as a suitable
36
platform to act as the real time assessment for cardiovascular disease [123]. Also
scholars recognize the benefits of Smartphone technology in the healthcare industry.
They discussed the critical factors that influence its success in healthcare as well as the
challenges facing its adoption in the healthcare sector [124].
Other important aspects of Smartphone technology that scholars looked at as
critical to affecting adoption are networking and connectivity. Researchers proposed
solutions to improve connectivity and performance as an important factor supporting
Smartphone capabilities with the increasing use of internet and computing on
Smartphone [125]. Shin [126] applied the TAM model to study factors effecting the
adoption of mobile internet. Factors, including perceived availability, quality,
enjoyment, and social pressure, were analyzed to explain users’ behavioral intention to
adopt and use mobile internet. Also, WiMAX is a promising technology to support the
growing demands for high speed and cost effective broadband mobile services, A
number of scholars looked at the adoption and diffusion of mobile WiMAX using
scenario planning and Bass Model methods [127]. Researchers utilized the Bass Model
to examine the market acceptance of the satellite digital multimedia broadcasting DMA,
a mobile communication service [89].
In descriptive approaches, a number of networking and connectivity issues were
discussed including IEEE 802.11g WLAN [128], and adoption of Delay/Disruptive-
Tolerant Networking (DTN) architecture as an ideal for Smartphone’ connectivity,
providing more robust network security [129]. Also, researchers discussed and
37
evaluated challenges facing Smartphone connectivity that impact the user’s adoption of
smartphones [130-133] and barriers to wider adoption of Voice over Internet Protocols
(VoIP) over Wi-Fi in Smartphone [134]. Challenges coming with wide adoption of mobile
broadband services by users of Smartphones and users’ expectations were identified
and discussed [135]. Moreover, scholars discussed challenges facing the diffusion of 3G,
and pricing models of data services and the impact on usages of mobile data
services[136].
With regards to security and other related supporting software, scholars
discussed and explained a number of factors that directly and indirectly effect adoption
of Smartphone technology. Researchers proposed architecture on management of
service in an Intelligent Environment (IE) to make the Smartphone aware of its
surroundings [137]. Also, scholars introduced a strategy to better detect malware in
smartphones [138]. Moreover, versatile reconfigurable architecture to reduce some
technical and usability limitation was proposed [139].
A number of researchers discussed the improvements of Smartphone users’
privacy and data sensitivity and proposed DiffUser; a differentiated user access control
model [140]. Also, researchers proposed a common visual representation protocol to
help overcome challenges that international users face with Smartphone [141]. Scholars
described Qplus, a middleware, and applications that make it easier for users to operate
Smartphone’ functions [142]. Scholars proposed an automated system to support
Smartphone live memory dynamic properties analysis on applications [143]. Moreover,
38
scholars identified and proposed solutions to some security challenges in mobile devices
to improve users’ acceptance of Smartphone devices [144].
Scholars presented Quality of Service (QoS), a model that improves the quality of
service as an important factor affecting Smartphone adoptions [145]. Scholars also
investigated the increase in diffusion of mobile internet and its impact on other mobile
services [146].
Smartphone technology is evolving rapidly, providing users with more solutions,
and enhancements of their experiences such as improved performances, more
tools/features, solutions, and applications. Consequently, in a number of research
papers, researchers studied and tried to explain the effects of such improvements and
enhancements on users’ acceptance and use of Smartphone technology.
Jeong and Yoo [147] compared the TAM model and Warshaw’s purchase
intention model to explore users’ intention to buy mobile RFID-tag reader’ services.
According to this research model, perceived need and purchasability factors could
collectively explain user intention to purchase mobile RFID services. Their study focused
on graduate students in two universities in Korea.
Cherubini et al. [103] conducted ethnographic observations to study the
adoption and refusal of mobile contextual services. They identified 24 users’ needs that
can be fulfilled by these applications and discussed nine barriers of adoption of
contextual services. Also, some scholars Introduced a nomadic device in a vehicle
39
environment telemetric to enhance and evaluate users’ acceptance of Smartphone
technology [148].
Many new applications of Smartphone technology are being discussed and
tested. Some scholars proposed a Smartphone-based system that gives users’ authority
to access rooms using their Smartphone and tested users’ behaviors [149]. Other
scholars proposed a smart phone system that automatically chooses the right channel
and device to reach their callee [150]. Other scholars proposed a novel system, SMART,
that is meant to improve the accuracy of indoor maps [151]. Also, to assist users’
experience, a middleware platform was proposed that enhances Smartphone’ internet
connectivity while in the go [152]. Moreover, a machine using learning techniques called
Darwin was proposed to improve Smartphone’ performance and therefore boost its
adoption [153].
Many scholars looked at the adoption of Smartphone with regards to their roles
in finance, marketing and business activities. Smartphone technology can be utilized to
improve company to customer relationships. Marketing applications are still in the early
stage of adoptions [13]. With the advancement of Smartphone technology and its ability
to handle data and commercial transactions, banks have become aware of Smartphone
advancements and popularity among consumers and started to act accordingly. In a
number of articles, scholars tried to study and understand consumers’ adoption of
mobile banking and related issues. Many banks started to have mobile banking options
40
for their customers to insure better future position as the popularity of Smartphone
increase.
Zhou et al. [154] integrated the task technology fit (TTF) model and the unified
theory and use technology (UTAUT) to study the adoption of mobile banking. They
analyzed the following factors: task characteristics, technology characteristic,
performance expectancy, effort expectancy, social influence, and facilitating conditions
to determine users’ adoption of mobile banking. They highlighted the importance of the
task technology fit where a new technology has to fulfill users’ task requirements in
order to be adopted by that user.
Koenig-Lewis et al. [155] examined adoption of mobile banking using the TAM
model. They investigated the influence of trust, credibility, compatibility, perceived risk
and cost factors on users’ behavioral intention to adopt mobile banking services. Their
study targeted groups of individuals in Germany who are mostly going to adopt mobile
banking. Their research indicated that trust and risk factors can be more or less
influential depending on other factors such as technological infrastructure that was not
included in their study. Moreover, in a qualitative approach, Mallat [156] used focus
group interviews to explore factors that influence adoption of mobile payments. He
studied the following adoption factors: relative advantage, compatibility, complexity,
costs, network externalities, trust, perceived security and risk.
Bauer et al., [157] highlighted the lack of academics research that allowed for
better understanding of mobile marketing as new trend in marketing. They used the
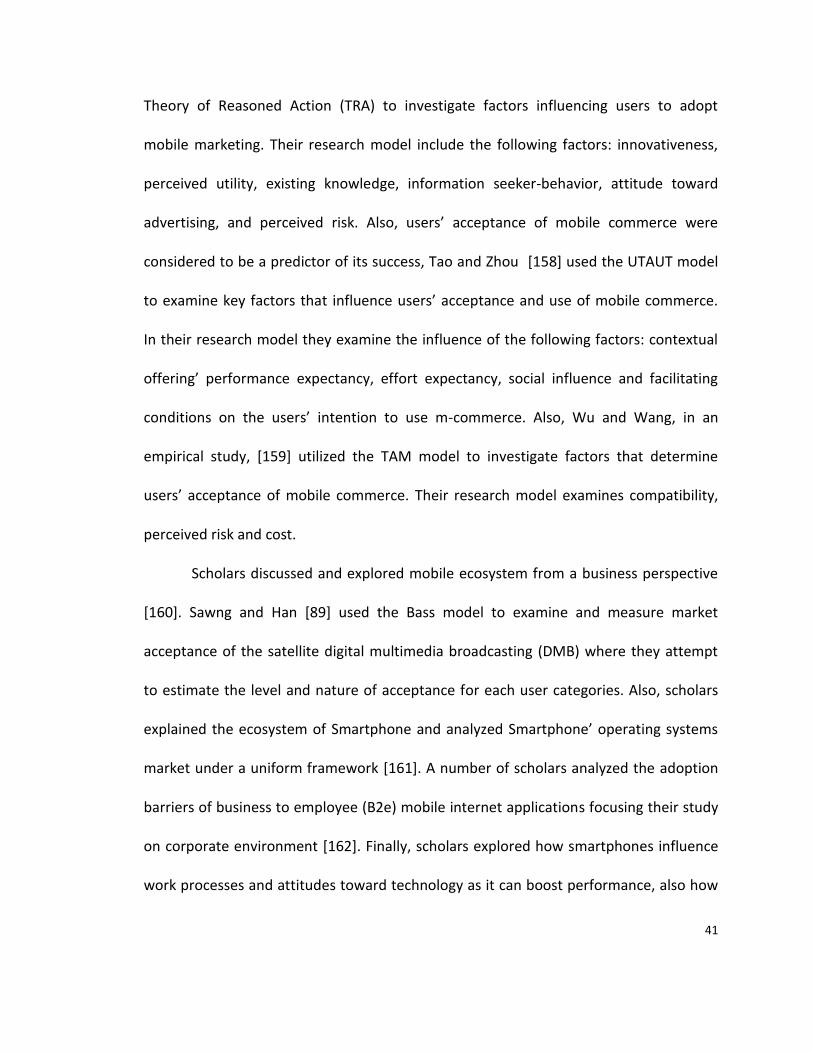
41
Theory of Reasoned Action (TRA) to investigate factors influencing users to adopt
mobile marketing. Their research model include the following factors: innovativeness,
perceived utility, existing knowledge, information seeker-behavior, attitude toward
advertising, and perceived risk. Also, users’ acceptance of mobile commerce were
considered to be a predictor of its success, Tao and Zhou [158] used the UTAUT model
to examine key factors that influence users’ acceptance and use of mobile commerce.
In their research model they examine the influence of the following factors: contextual
offering’ performance expectancy, effort expectancy, social influence and facilitating
conditions on the users’ intention to use m-commerce. Also, Wu and Wang, in an
empirical study, [159] utilized the TAM model to investigate factors that determine
users’ acceptance of mobile commerce. Their research model examines compatibility,
perceived risk and cost.
Scholars discussed and explored mobile ecosystem from a business perspective
[160]. Sawng and Han [89] used the Bass model to examine and measure market
acceptance of the satellite digital multimedia broadcasting (DMB) where they attempt
to estimate the level and nature of acceptance for each user categories. Also, scholars
explained the ecosystem of Smartphone and analyzed Smartphone’ operating systems
market under a uniform framework [161]. A number of scholars analyzed the adoption
barriers of business to employee (B2e) mobile internet applications focusing their study
on corporate environment [162]. Finally, scholars explored how smartphones influence
work processes and attitudes toward technology as it can boost performance, also how

42
adoption of Smartphone technology improved collaboration between the workforce
and their organization [163].
Based on the research reviewed in the above literature review, taxonomy has
been developed that includes examples of the related research reviewed earlier as
shown it in Table 2 below. It presents research topics, theory or model used, variables
identified in the research, and a summary of the results. As mentioned earlier in the
literature review, a number of points can be recognized in Table two below such as:
- The Technology Acceptance Model is one of the most used models in research
that studies the adoption and use of smartphones and its related technology.
- A number of researchers who studied smartphones focused only on one
profession such as physicians, dentists, nurses and employees in delivery services.
- A number researchers studied smartphones as if they were a tool to be used in
executing a specific task such as the use of smartphones in healthcare, electronic
learning or delivery services.
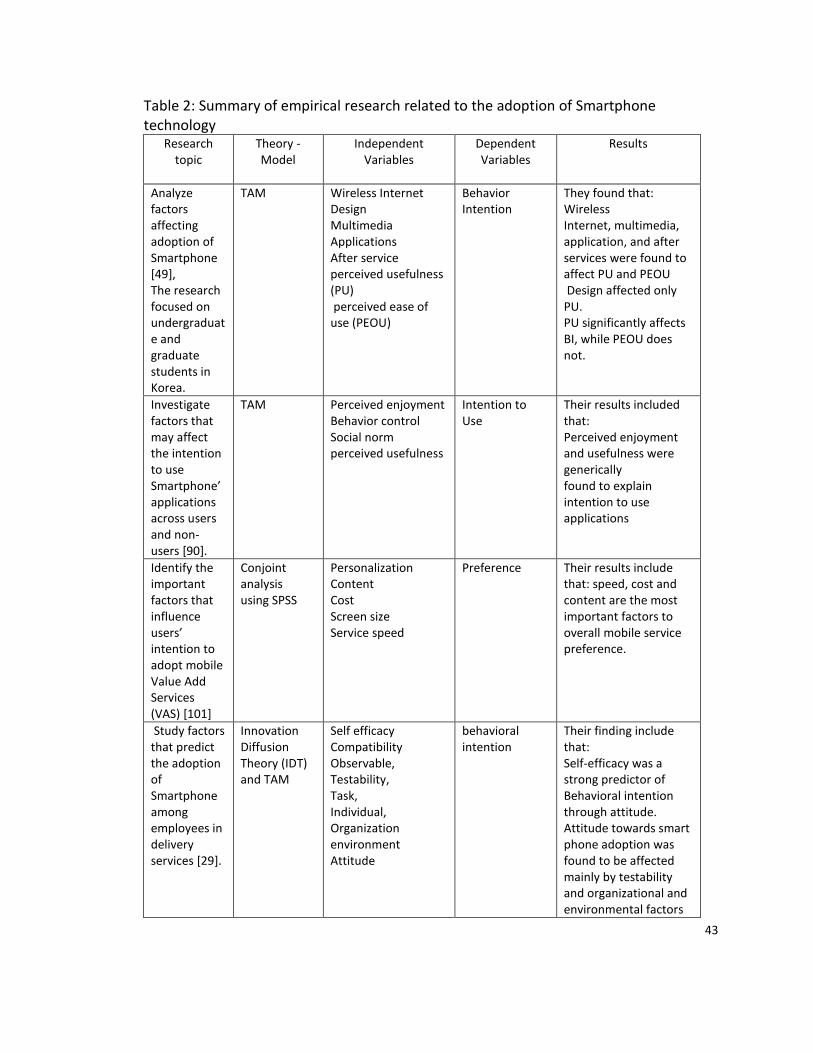
43
Table 2: Summary of empirical research related to the adoption of Smartphone technology
Research topic
Theory - Model
Independent Variables
Dependent Variables
Results
Analyze factors affecting adoption of Smartphone [49], The research focused on undergraduate and graduate students in Korea.
TAM Wireless Internet Design Multimedia Applications After service perceived usefulness (PU) perceived ease of use (PEOU)
Behavior Intention
They found that: Wireless Internet, multimedia, application, and after services were found to affect PU and PEOU Design affected only PU. PU significantly affects BI, while PEOU does not.
Investigate factors that may affect the intention to use Smartphone’ applications across users and non-users [90].
TAM Perceived enjoyment Behavior control Social norm perceived usefulness
Intention to Use
Their results included that: Perceived enjoyment and usefulness were generically found to explain intention to use applications
Identify the important factors that influence users’ intention to adopt mobile Value Add Services (VAS) [101]
Conjoint analysis using SPSS
Personalization Content Cost Screen size Service speed
Preference Their results include that: speed, cost and content are the most important factors to overall mobile service preference.
Study factors that predict the adoption of Smartphone among employees in delivery services [29].
Innovation Diffusion Theory (IDT) and TAM
Self efficacy Compatibility Observable, Testability, Task, Individual, Organization environment Attitude
behavioral intention
Their finding include that: Self-efficacy was a strong predictor of Behavioral intention through attitude. Attitude towards smart phone adoption was found to be affected mainly by testability and organizational and environmental factors
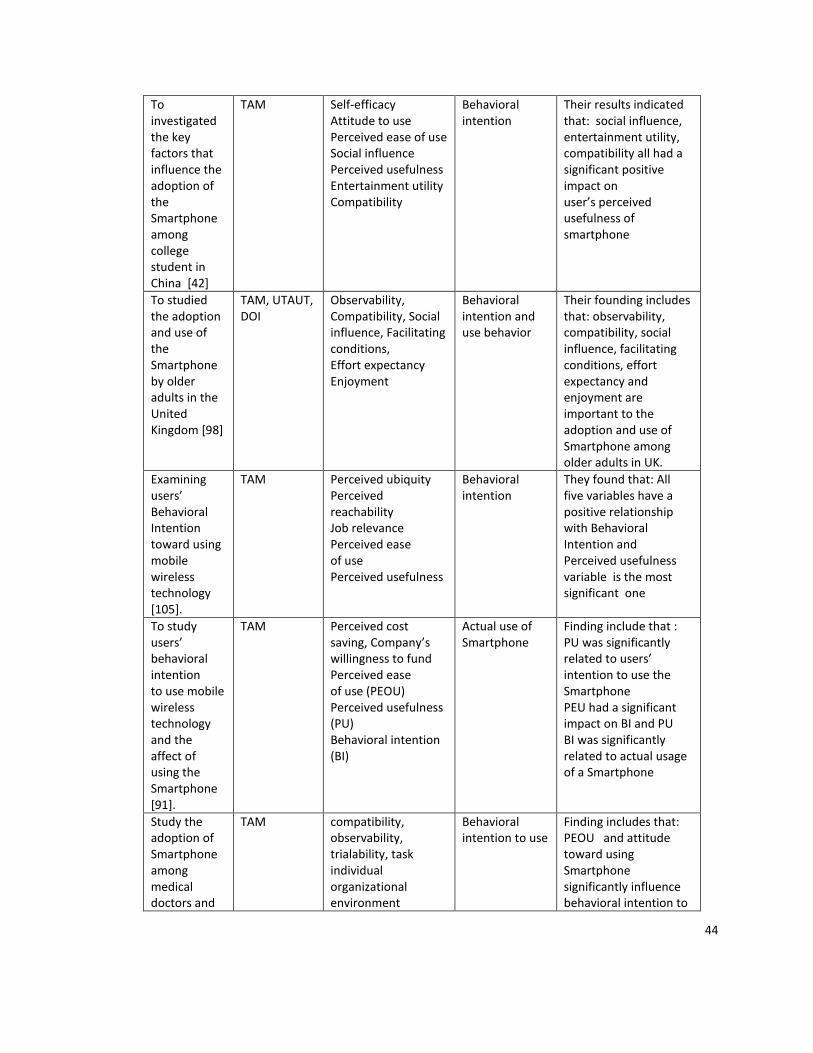
44
To investigated the key factors that influence the adoption of the Smartphone among college student in China [42]
TAM Self-efficacy Attitude to use Perceived ease of use Social influence Perceived usefulness Entertainment utility Compatibility
Behavioral intention
Their results indicated that: social influence, entertainment utility, compatibility all had a significant positive impact on user’s perceived usefulness of smartphone
To studied the adoption and use of the Smartphone by older adults in the United Kingdom [98]
TAM, UTAUT, DOI
Observability, Compatibility, Social influence, Facilitating conditions, Effort expectancy Enjoyment
Behavioral intention and use behavior
Their founding includes that: observability, compatibility, social influence, facilitating conditions, effort expectancy and enjoyment are important to the adoption and use of Smartphone among older adults in UK.
Examining users’ Behavioral Intention toward using mobile wireless technology [105].
TAM Perceived ubiquity Perceived reachability Job relevance Perceived ease of use Perceived usefulness
Behavioral intention
They found that: All five variables have a positive relationship with Behavioral Intention and Perceived usefulness variable is the most significant one
To study users’ behavioral intention to use mobile wireless technology and the affect of using the Smartphone [91].
TAM Perceived cost saving, Company’s willingness to fund Perceived ease of use (PEOU) Perceived usefulness (PU) Behavioral intention (BI)
Actual use of Smartphone
Finding include that : PU was significantly related to users’ intention to use the Smartphone PEU had a significant impact on BI and PU BI was significantly related to actual usage of a Smartphone
Study the adoption of Smartphone among medical doctors and
TAM compatibility, observability, trialability, task individual organizational environment
Behavioral intention to use
Finding includes that: PEOU and attitude toward using Smartphone significantly influence behavioral intention to
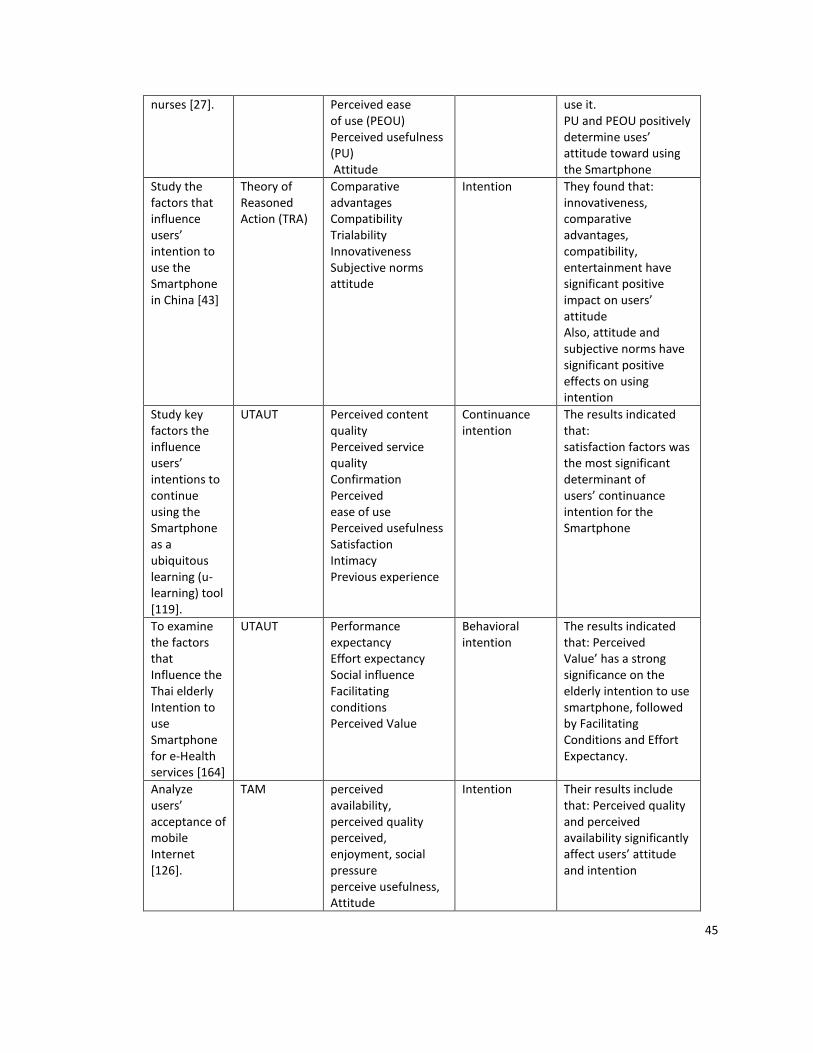
45
nurses [27]. Perceived ease of use (PEOU) Perceived usefulness (PU) Attitude
use it. PU and PEOU positively determine uses’ attitude toward using the Smartphone
Study the factors that influence users’ intention to use the Smartphone in China [43]
Theory of Reasoned Action (TRA)
Comparative advantages Compatibility Trialability Innovativeness Subjective norms attitude
Intention They found that: innovativeness, comparative advantages, compatibility, entertainment have significant positive impact on users’ attitude Also, attitude and subjective norms have significant positive effects on using intention
Study key factors the influence users’ intentions to continue using the Smartphone as a ubiquitous learning (u-learning) tool [119].
UTAUT Perceived content quality Perceived service quality Confirmation Perceived ease of use Perceived usefulness Satisfaction Intimacy Previous experience
Continuance intention
The results indicated that: satisfaction factors was the most significant determinant of users’ continuance intention for the Smartphone
To examine the factors that Influence the Thai elderly Intention to use Smartphone for e-Health services [164]
UTAUT Performance expectancy Effort expectancy Social influence Facilitating conditions Perceived Value
Behavioral intention
The results indicated that: Perceived Value’ has a strong significance on the elderly intention to use smartphone, followed by Facilitating Conditions and Effort Expectancy.
Analyze users’ acceptance of mobile Internet [126].
TAM perceived availability, perceived quality perceived, enjoyment, social pressure perceive usefulness, Attitude
Intention Their results include that: Perceived quality and perceived availability significantly affect users’ attitude and intention

46
Examine the effect of the fun aspect on users’ attitude to use mobile internet [24].
TAM
Fun Market Usefulness Ease of Use
Users’ Attitude fun aspect effects users’ attitude toward the use of mobile internet
Investigate the barriers for adopting mobile banking services [155]
TAM and IDT trust, credibility, compatibility, perceived risk cost Perceived ease of use (PEOU) Perceived usefulness (PU)
Users’ behavioral intention
The results includes that: Compatibility, PU and risk are Significant indicators of users’ adoption of mobile banking services
Study the adoption of PDA and smartphones among physicians and dentists at King Saud Medical City Hospitals (KSMCH) in Saudi Arabia
Statistical Package for Social Sciences (SPSS) software
Usefulness (PU), Perceived ease of use (PEOU),performance and productivity
Adoption and Use of PDA and smartphones
The results show that: the adoption and use of PDA and smartphones improved their performance and their productivity.
2.3 Taxonomy of Factors Related to The Adoption and Use of Smartphones
According to Sekaran [165], identifying factors that were determined as
important in previous research accompanied with rational relationships and
connections that can be logically conceptualized, form the basis of a theoretical
research framework or model. Thus, factors that were determined in previous research
to be important and related to the adoption and use of the Smartphone and its related
technologies have been logically conceptualized, evaluated, validated and utilized to
develop a research model in this dissertation. A taxonomy of factors related to the
47
adoption and use of smartphone technology has been developed which classifies
related factors under five main factors/variables as shown in figure 5 below.
Each of the five main factors identified in the taxonomy have a theoretical basis
and were determined to have a relationship with the users’ intention to adopt and use a
new IT such as Smartphone technology [166, 82]. A number of factors are classified
under the technology characteristics and performance because they were associated
with it either directly or through other factors such as perceived usefulness and relative
advantage [156], which may improve users’ performance when using the Smartphone
technology [82]. The factors that are classified under technology characteristics and
performance include: perceived usefulness [29, 167, 49, 155, 126, 25, 82], Job
relevancies [105, 126], relative advantage [156], perceived ubiquity [168, 105],
perceived reachability [105], mobility [65], accuracy [168], security [156], perceived
availability [167, 126], perceived quality [126], content [101, 65], screen size [101],
service speeds [65], multimedia [49], applications [49], and wireless Internet [49]. These
factors are related to technology characteristics and performance; therefore, they are
classified under it in the developed taxonomy. Further evaluations, validating and
selecting of only the most important factors, have been conducted using brainstorming
sessions, focus group sessions and individual interviews. Table 3 below provides
definitions and explanations for the main factors that were identified through literature.
(More details are provided in later chapter of this dissertation).

48
Figure 5: Taxonomy of factors related to the adoption and use of the Smartphone
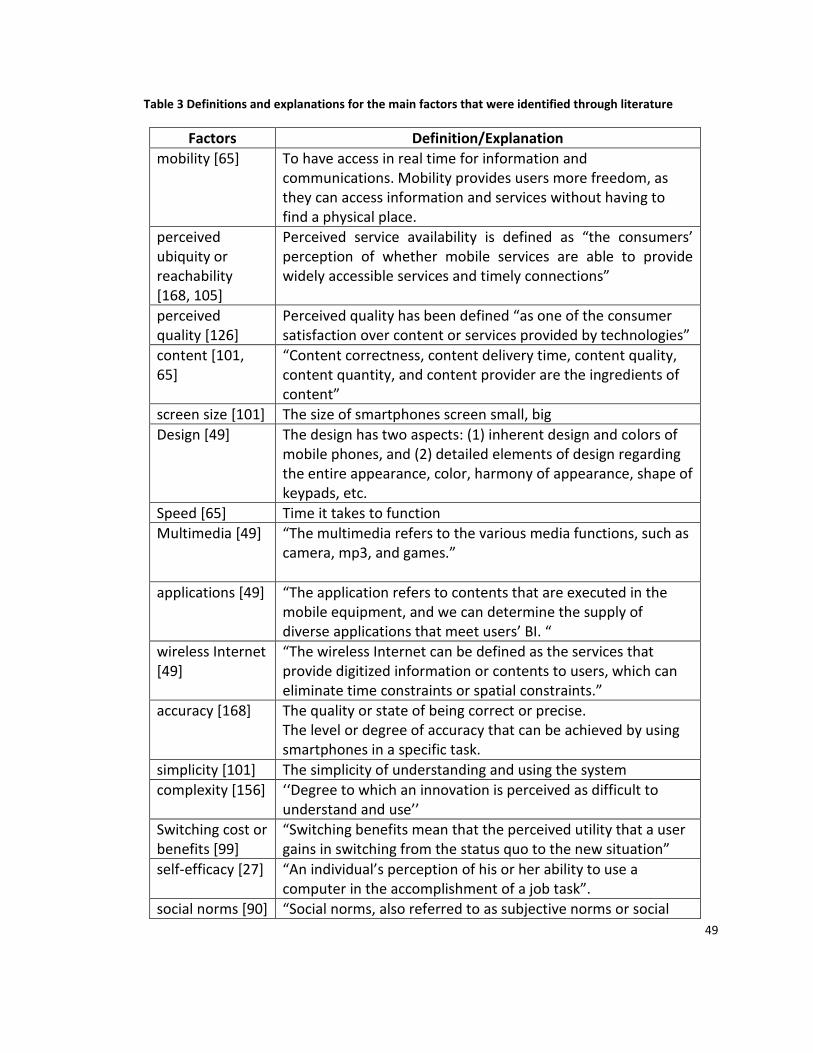
49
Table 3 Definitions and explanations for the main factors that were identified through literature
Factors Definition/Explanation
mobility [65] To have access in real time for information and communications. Mobility provides users more freedom, as they can access information and services without having to find a physical place.
perceived ubiquity or reachability [168, 105]
Perceived service availability is defined as “the consumers’ perception of whether mobile services are able to provide widely accessible services and timely connections”
perceived quality [126]
Perceived quality has been defined “as one of the consumer satisfaction over content or services provided by technologies”
content [101, 65]
“Content correctness, content delivery time, content quality, content quantity, and content provider are the ingredients of content”
screen size [101] The size of smartphones screen small, big
Design [49]
The design has two aspects: (1) inherent design and colors of mobile phones, and (2) detailed elements of design regarding the entire appearance, color, harmony of appearance, shape of keypads, etc.
Speed [65] Time it takes to function
Multimedia [49] “The multimedia refers to the various media functions, such as camera, mp3, and games.”
applications [49] “The application refers to contents that are executed in the mobile equipment, and we can determine the supply of diverse applications that meet users’ BI. “
wireless Internet [49]
“The wireless Internet can be defined as the services that provide digitized information or contents to users, which can eliminate time constraints or spatial constraints.”
accuracy [168] The quality or state of being correct or precise. The level or degree of accuracy that can be achieved by using smartphones in a specific task.
simplicity [101] The simplicity of understanding and using the system
complexity [156] ‘‘Degree to which an innovation is perceived as difficult to understand and use’’
Switching cost or benefits [99]
“Switching benefits mean that the perceived utility that a user gains in switching from the status quo to the new situation”
self-efficacy [27] “An individual’s perception of his or her ability to use a computer in the accomplishment of a job task”.
social norms [90] “Social norms, also referred to as subjective norms or social
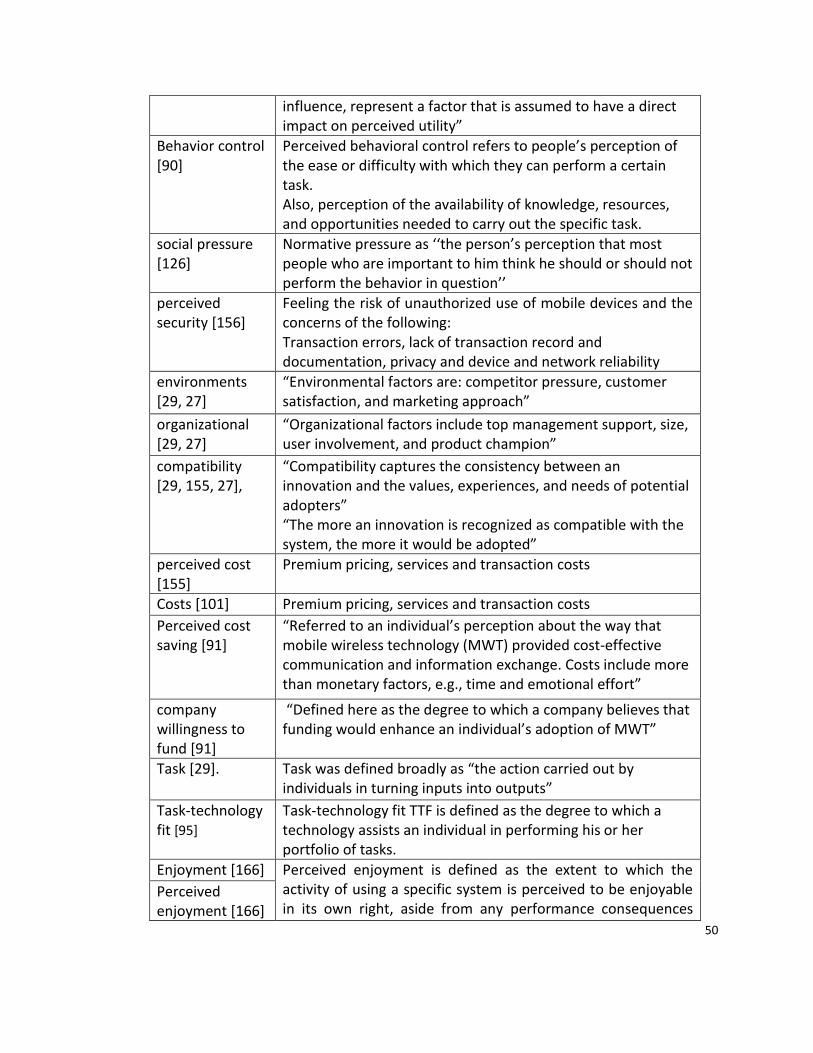
50
influence, represent a factor that is assumed to have a direct impact on perceived utility”
Behavior control [90]
Perceived behavioral control refers to people’s perception of the ease or difficulty with which they can perform a certain task. Also, perception of the availability of knowledge, resources, and opportunities needed to carry out the specific task.
social pressure [126]
Normative pressure as ‘‘the person’s perception that most people who are important to him think he should or should not perform the behavior in question’’
perceived security [156]
Feeling the risk of unauthorized use of mobile devices and the concerns of the following: Transaction errors, lack of transaction record and documentation, privacy and device and network reliability
environments [29, 27]
“Environmental factors are: competitor pressure, customer satisfaction, and marketing approach”
organizational [29, 27]
“Organizational factors include top management support, size, user involvement, and product champion”
compatibility [29, 155, 27],
“Compatibility captures the consistency between an innovation and the values, experiences, and needs of potential adopters” “The more an innovation is recognized as compatible with the system, the more it would be adopted”
perceived cost [155]
Premium pricing, services and transaction costs
Costs [101] Premium pricing, services and transaction costs
Perceived cost saving [91]
“Referred to an individual’s perception about the way that mobile wireless technology (MWT) provided cost-effective communication and information exchange. Costs include more than monetary factors, e.g., time and emotional effort”
company willingness to fund [91]
“Defined here as the degree to which a company believes that funding would enhance an individual’s adoption of MWT”
Task [29]. Task was defined broadly as “the action carried out by individuals in turning inputs into outputs”
Task-technology fit [95]
Task-technology fit TTF is defined as the degree to which a technology assists an individual in performing his or her portfolio of tasks.
Enjoyment [166] Perceived enjoyment is defined as the extent to which the activity of using a specific system is perceived to be enjoyable in its own right, aside from any performance consequences
Perceived enjoyment [166]
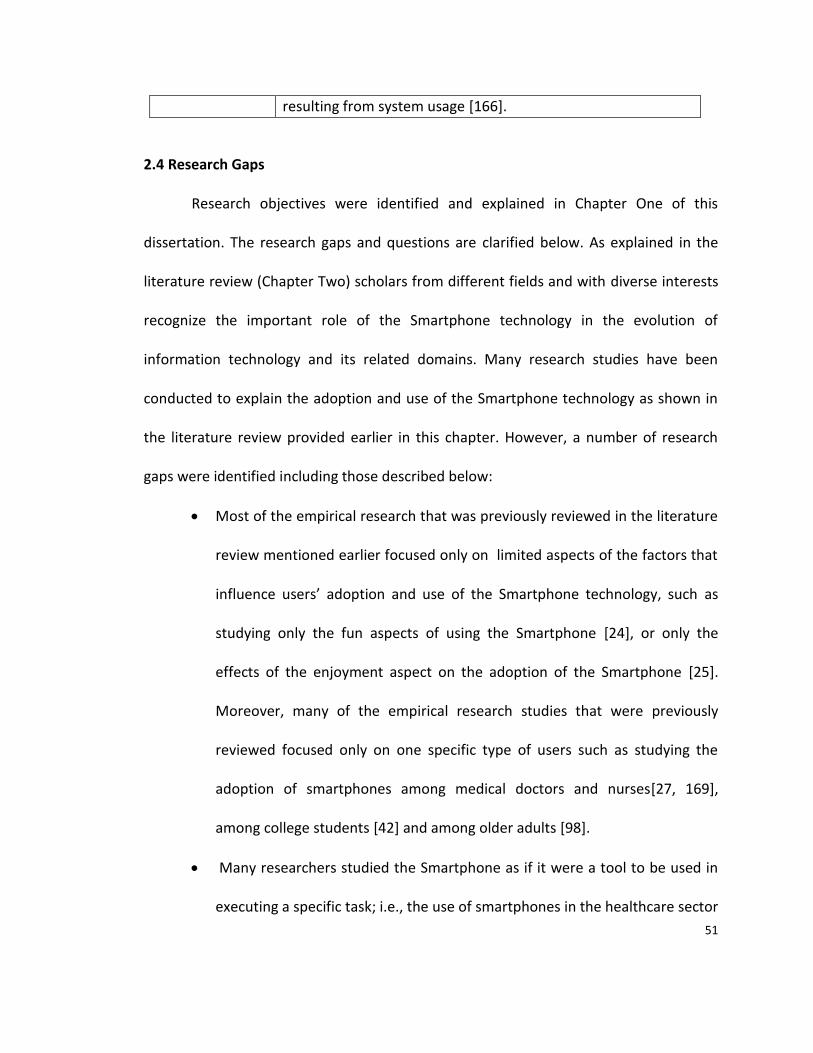
51
resulting from system usage [166].
2.4 Research Gaps
Research objectives were identified and explained in Chapter One of this
dissertation. The research gaps and questions are clarified below. As explained in the
literature review (Chapter Two) scholars from different fields and with diverse interests
recognize the important role of the Smartphone technology in the evolution of
information technology and its related domains. Many research studies have been
conducted to explain the adoption and use of the Smartphone technology as shown in
the literature review provided earlier in this chapter. However, a number of research
gaps were identified including those described below:
Most of the empirical research that was previously reviewed in the literature
review mentioned earlier focused only on limited aspects of the factors that
influence users’ adoption and use of the Smartphone technology, such as
studying only the fun aspects of using the Smartphone [24], or only the
effects of the enjoyment aspect on the adoption of the Smartphone [25].
Moreover, many of the empirical research studies that were previously
reviewed focused only on one specific type of users such as studying the
adoption of smartphones among medical doctors and nurses[27, 169],
among college students [42] and among older adults [98].
Many researchers studied the Smartphone as if it were a tool to be used in
executing a specific task; i.e., the use of smartphones in the healthcare sector
52
and in delivery services [164, 29, 26, 123]. It is felt that studying only a
limited number of factors that influence users' adoption and use of
Smartphone technology will result in neglecting other important factors that
may have an equally important influence. The literature indicates that
examining only limited characteristics of a technology makes it harder to gain
a complete perspective and it is more appropriate to examine and compare
as many characteristics as reasonable within the same research [31].
Therefore, it is appropriate to study the key factors that influence general
users’ adoption and use of the Smartphone in a holistic and comprehensive
manner.
Researchers have mentioned the important influence of characteristics of
both the individual and the innovation on the users’ acceptance and use of a
technology [77]. The literature indicates that there is a lack of theoretical
models, which can provide an appropriate link between individual and
innovation to offer a better perspective of the links between user acceptance
and use of technology [77]. Most of the empirical research studies related to
the adoption of the Smartphone technology have applied the Technology
Acceptance Model (TAM). However, a number of scholars indicated that
TAM is able to explain only about 40% of variances in technology acceptance
[82]. Moreover, several researchers have specified some limitations in the
53
TAM model and highlighted the need for adding more variables to the model,
especially as related to human and social factors[92].
It has been indicated that there is a need for more empirical research to
identify the key factors that influence user behavioral intention to adopt and
use the Smartphone technology in a comprehensive manner [49-51].
Moreover, there is a lack of research that studies and investigates the key
factors that influence the acceptance and use of Smartphone technology,
particularly in Saudi Arabia [52, 53, 14, 54].
2.5 Research Questions
The impacts of the Smartphone technology on the way that information is
distributed, consumed, and created are obvious. They affect the IT domain and its
ecosystem. The previous discussion makes it clear that there is an increased need for
more empirical research to better understand general users and identify the key factors
that influence users’ intention to adopt and use the Smartphone technology, and that
this information is especially limited in Saudi Arabia. To address some of these research
gaps, the author is interested in conducting empirical research to explore the key factors
that influence users’ adoption and use of Smartphone technology, with a focus on the
Saudi Arabian market.
Based on an extensive literature review and existing theoretical models a
research model was developed. The model was then modified based on the utilization
of qualitative methods including a brainstorming session, a focus group and individual
54
face-to-face interviews. This modified model was used in this dissertation to better
explore and understand key factors that may have a relationship with users’ intention to
adopt and use Smartphone technology, especially in Saudi Arabia. The following
research questions have been identified to address the research gaps:
Q1: What are the key factors that are associated with general users’ behavioral
intention to adopt and use the Smartphone technology in Saudi Arabia?
Q2: How can general users’ experience with the Smartphone technology be
enhanced in Saudi Arabia?
Table 4 (below) provides a summary and shows connections between research gaps,
objectives and questions which was explained in more detail above.

55
Table 4: Summary of the Research Gaps, Objectives and Questions (explained in more details above)
56
3 Chapter Three: Developing Research Model and Research Hypotheses
Sekaran suggested identifying factors that were determined as important by
previous research, accompanied with rational relationships and connections that can be
logically conceptualized [165]. These factors should be used to form the basis of a
theoretical research framework or model with taxonomy of factors identified in
previous research as important, and which may have relationships with the users’
adoption and use of Smartphone technology. These factors were classified under five
main factors, namely: technology characteristics and performance, effort factors, social
influence factors, facilitating condition, and hedonic factors. Table 5 below presents the
five main factors and the factors that were integrated directly or indirectly into each
main factor from previous model.
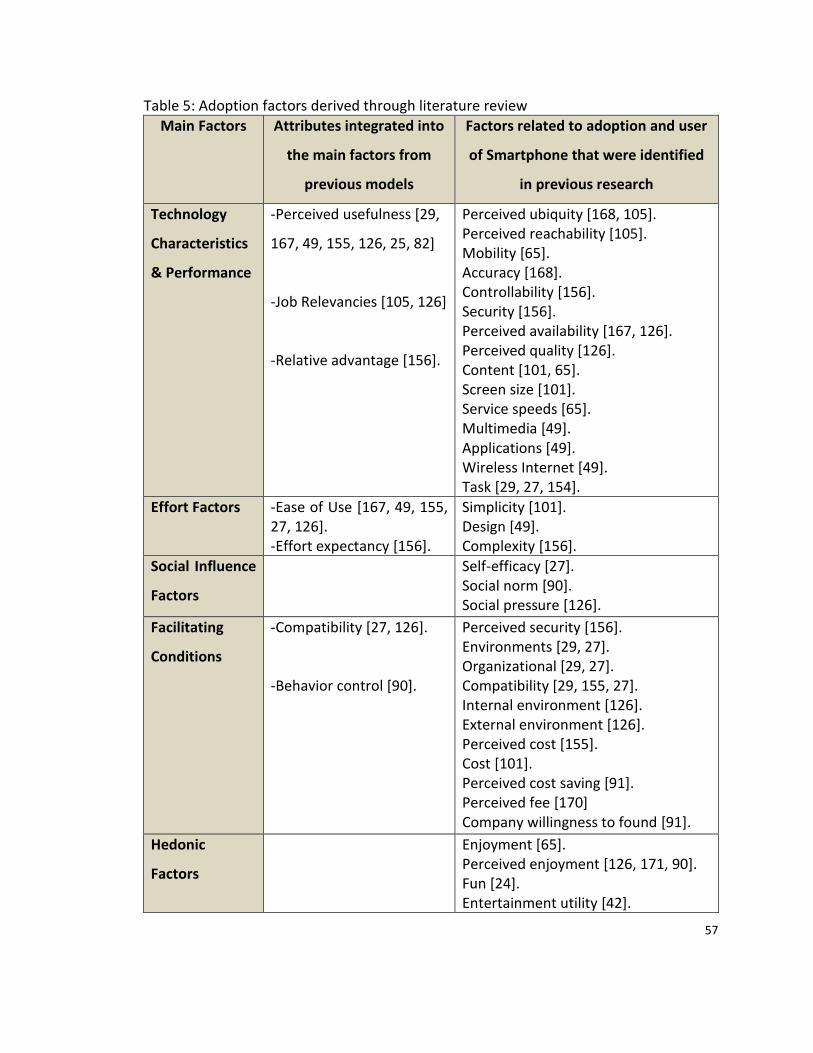
57
Table 5: Adoption factors derived through literature review
Main Factors Attributes integrated into
the main factors from
previous models
Factors related to adoption and user
of Smartphone that were identified
in previous research
Technology
Characteristics
& Performance
-Perceived usefulness [29,
167, 49, 155, 126, 25, 82]
-Job Relevancies [105, 126]
-Relative advantage [156].
Perceived ubiquity [168, 105]. Perceived reachability [105]. Mobility [65]. Accuracy [168]. Controllability [156]. Security [156]. Perceived availability [167, 126]. Perceived quality [126]. Content [101, 65]. Screen size [101]. Service speeds [65]. Multimedia [49]. Applications [49]. Wireless Internet [49]. Task [29, 27, 154].
Effort Factors -Ease of Use [167, 49, 155, 27, 126]. -Effort expectancy [156].
Simplicity [101]. Design [49]. Complexity [156].
Social Influence
Factors
Self-efficacy [27]. Social norm [90]. Social pressure [126].
Facilitating
Conditions
-Compatibility [27, 126].
-Behavior control [90].
Perceived security [156]. Environments [29, 27]. Organizational [29, 27]. Compatibility [29, 155, 27]. Internal environment [126]. External environment [126]. Perceived cost [155]. Cost [101]. Perceived cost saving [91]. Perceived fee [170] Company willingness to found [91].
Hedonic
Factors
Enjoyment [65]. Perceived enjoyment [126, 171, 90]. Fun [24]. Entertainment utility [42].
58
Two primary steps have been conducted in this research to develop a suitable
research model:
(1) To build the research model based on a suitable existing adoption model that
has an adequate theoretical basis; and
(2) To identify related factors that may have associations with users’ adoption of
smartphone technology and can be used to modify the research model.
After reviewing many related research studies and theoretical models, the
UTAUT appeared to be the most suitable theoretical model as a basis for this research
model. Through an extensive literature review, more than forty Smartphone adoption-
related factors were initially identified. These factors were quantitatively and
qualitatively reviewed, evaluated, filtered and validated to select the factors to be
included in this research model.
There are a number of methods that have been used to help researchers
evaluate, validate and select the most important factors out of a list of factors.
Quantitative approaches such as statistical analysis, including factor analysis, can be
used to select and reduce the number of factors. A factor analysis technique, such as
exploratory factor analysis (EFA), can be utilized to filter and reduce the set of factors
identified. Scholars recommend using EFA when trying to work with variables/factors
that have no theoretical or hypothesis basis [172]. However, when the source of factors
59
under consideration is based on existing theory or a literature review, such as the set of
factors identified in this dissertation, EFA may not be an effective approach to reducing
and selecting the more important factors [173]. Scholars indicated that, to overcome
some of the EFA limitations, the researcher must thoughtfully apply sound judgment to
factor reduction and selection [174].
Qualitative analysis is another method that can be used to filter and select the
more important factors among a set of factors. Qualitative methods such as
brainstorming, focus groups, and individual interviews have been widely used to obtain
an individual’s personal perspective and opinions regarding an issue under
consideration [175]. Qualitative methods can be very useful to obtain opinions and
perspectives of users’ experience with smartphones, for both personal and work
sectors. This is the preferred method of selecting the more related factors to be used in
developing and modifying the research model, since the factors identified are based on
existing theories and identified through the literature review. Therefore, qualitative
methods such as brainstorming sessions, focus groups and individual interviews were
conducted to aid in reviewing, evaluating, validating and selecting the more related
factors to be used in modifying the research model.
A theoretical model can be developed through a literature review of the
previous research related to the subject under consideration and through conducting
interviews with people who are knowledgeable of the specific subject [165]. In the
present case, a literature review was conducted to explore research related to the
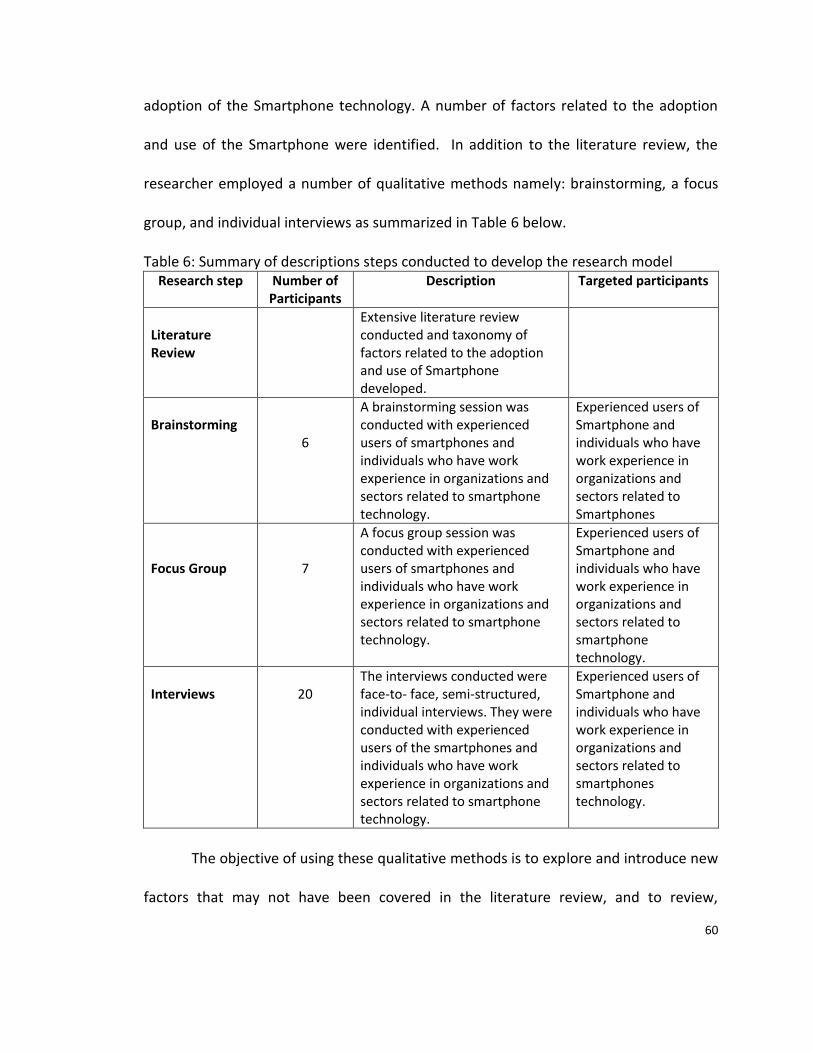
60
adoption of the Smartphone technology. A number of factors related to the adoption
and use of the Smartphone were identified. In addition to the literature review, the
researcher employed a number of qualitative methods namely: brainstorming, a focus
group, and individual interviews as summarized in Table 6 below.
Table 6: Summary of descriptions steps conducted to develop the research model Research step Number of
Participants Description Targeted participants
Literature Review
Extensive literature review conducted and taxonomy of factors related to the adoption and use of Smartphone developed.
Brainstorming
6
A brainstorming session was conducted with experienced users of smartphones and individuals who have work experience in organizations and sectors related to smartphone technology.
Experienced users of Smartphone and individuals who have work experience in organizations and sectors related to Smartphones
Focus Group
7
A focus group session was conducted with experienced users of smartphones and individuals who have work experience in organizations and sectors related to smartphone technology.
Experienced users of Smartphone and individuals who have work experience in organizations and sectors related to smartphone technology.
Interviews
20
The interviews conducted were face-to- face, semi-structured, individual interviews. They were conducted with experienced users of the smartphones and individuals who have work experience in organizations and sectors related to smartphone technology.
Experienced users of Smartphone and individuals who have work experience in organizations and sectors related to smartphones technology.
The objective of using these qualitative methods is to explore and introduce new
factors that may not have been covered in the literature review, and to review,
61
evaluate, validate and select the factors that are most associated with users’ adoption
and use of the Smartphone. These qualitative methods have been used in many studies
in different disciplines including research related to IT adoption [176], in research
related to the healthcare sector [177] , in research related to the education sector [178]
and many more.
Experienced users of the Smartphone with different education levels and
different working backgrounds can be valuable sources providing more insight into the
factors that may have a relationship with users’ adoption and use of the Smartphone.
Also, individuals who work in the Smartphone industry and its related sectors can be a
valuable source that could provide useful information about factors associated with
users’ adoption and use of the Smartphone. Therefore, the researcher has targeted
experienced users of the Smartphone from different backgrounds and individuals who
work in the Smartphone industry and its related sectors. They have been invited to
participate in the brainstorming, focus group and individual interviews based on the
need for each method. The researcher used a number of approaches to identify and find
possible participants including visiting related organizations, sectors, and industries as
well as other options such as the Snowball method [179]. The researcher has identified
a number of sectors related to the Smartphone industry and visited them in person. The
Snowball method is a popular approach that has frequently been used in research which
involved individual experts who identify or refer other experts [179].
62
3.1 Brainstorming
Brainstorming is defined as “group sessions in which people share ideas on some
issue or problem” [180]. Brainstorming can be thought of as a means to increase
creativity by generating a wide range of ideas regarding solving or discussing a particular
issue [181, 182]. Brainstorming approaches have been used by a number of scholars to
introduce and evaluate factors related to mobile technologies [176]. The brainstorming
session aims to gather as many ideas and thoughts as possible related to the issue under
consideration [183]. There are a number of general rules usually applied in the process
of conducting a brainstorming session including [183]:
Focus on quantity: Participants are encouraged to come up with any thoughts or
ideas related to the issue.
Withhold criticism: Participants should not be judged or criticized on their ideas
and thoughts.
Welcome unusual ideas.
Combine and improve ideas: All ideas and thoughts should be combined,
discussed and improved.
The aim of this brainstorming session was to obtain experienced users’ creative
ideas and thoughts regarding introduction of new factors that may have a relationship
with users’ adoption and use of the Smartphone and to evaluate the identified factors.
63
Brainstorming plan
Experienced Smartphone users from different backgrounds, who have been
using the Smartphone for at least three years, and individuals who have work
experience in sectors related to smartphones technology have been targeted, contacted
and invited to participate in this brainstorming session. (Please see invitation in
Appendix A). The researcher has contacted all individuals who agreed to participate in
the brainstorming session and provided them with all details related to the issue under
consideration to ensure that all participants understand and agree with the aim of the
brainstorming session (please see the email of the details in Appendix A).
Experts recommend having six to ten participants in a brainstorming group to
obtain a balance between control and productivity [184, 175]. Therefore, this researcher
recruited six participants when conducting the brainstorming session. Scholars
mentioned the value of having participants with diversified backgrounds, which could
bring alternative views and more insight into the issue under consideration [180].
Therefore the researcher targeted experienced users of Smartphones with varied
backgrounds. All participants were contacted to schedule a convenient meeting time
and place. Once all participants agreed on the time and place for the meeting, the
researcher contacted each participant to confirm the date, time and place for the
brainstorming session. The brainstorming session was expected to take about an hour to
be completed. All needed material such as pencils, papers and light refreshments were
64
provided and distributed among participants by the researcher. A brief presentation was
prepared, which included an introduction to the research, issues to be discussed, and
brief descriptions of the brainstorming session and what is expected of participants. The
researcher provided participants with a hard copy that included more explanation of the
subject under consideration as well as the process of brainstorming and how it should
proceed. The researcher developed a tool to be used by participants to provide their
answers, ideas and point of view.
Participants in the brainstorming session were expected to share thoughts and ideas
regarding important factors that they believe are associated with users’ adoption and
use of the Smartphone as well as review, evaluate and validate the existing factors
provided to them. Discussion and thoughts in the brainstorming session revolved
around three main questions that were provided to the participants:
Q1: Participants were asked take around five minutes to review the list of factors that
were provided to them. After the five minutes, participants were asked (1) to state
their thoughts and opinions about these factors; and, (2) if they knew of any new
relevant factors that may have a relationship with users’ intention to adopt and use
Smartphone technology that are not mentioned on the provided list.
Q2: Participants were then asked to review the list of factors provided including the
new factors generated from step one, and remove any factors that they believe are
similar or duplicated to narrow the list down to only the more important factors.
65
Q3: Participants were asked to brainstorm further in order to re-evaluate and validate
all factors including those originally provided to them in the preliminary research
model. They were then asked to link the selected most important factors.
3.2 Focus Group
Scholars indicate that there is value in using a variety of qualitative approaches.
Also, they mentioned the usefulness of combining in-depth interviews and focus group
approaches [175]. The focus group interview technique can be utilized as a way to raise
and explore relevant key issues related to the subject under consideration and has been
used extensively in many fields. The identified issues can then be discussed more fully
using in-depth individual interviews [185, 175]. Therefore, the author conducted a focus
group session to obtain participants’ opinions and perspective about factors that are
closely associated with users’ intentions to adopt and use Smartphone technology and
explore new factors that are not found in the list of factors derived from literature. The
focus group session is typically conducted to obtain participants’ impressions, points of
view, and opinions as the participants are invited to discuss and talk about a specific
issue [165].
Styles of focus group and preparations [186]:
Moderators use a variety of styles when conducting focus groups. These styles
may differ based on the degree of control used, ranging from nondirective to extremely
66
directive. In the nondirective style the moderator or researcher starts the discussion
and only participates when necessary to make sure that the discussion is kept on track.
In contrast, in the extreme directive style the only exchange is between the moderator
or researcher and one group participant at a time. In this study, the researcher acted as
moderator for the focus group and used a moderate control approach or style rather
than the extreme. The researcher started the discussion, introduced the topic and
talked about the aim of the focus group session and what information was needed.
A brief presentation was prepared that included a brief introduction to the
research, issues to be discussed and brief descriptions of the focus group session and
the expectations of participants in this session. The researcher provided each
participant with a hard copy document with information related to the subject under
concentration, the main questions that focus groups should be discussing, and space to
write notes regarding their final selections.
Size of the focus group [184, 175]:
It is recommended that a focus group have between six to ten participants to
allow the researcher or moderator to have reasonable control on the discussion and
sustain the discussion. Having more than ten participants may negatively affect the
moderator’s ability to maintain firm control of the group discussion, while having less
than six may not support a sustained discussion. As recommended, the author obtained
six participants when conducting the focus group session for this research.
67
The researcher targeted experienced users of Smartphone and individuals who
have work experience in organizations and sectors related to smartphone technology.
Targeted potential participants were contacted and invited to participate in the focus
group session. Participants who agreed to participate were provided with more details
related to the research and the issue to be discussed in the focus group session as
shown in Appendix B.
3.3 Individual Interviews
After completing the focus groups, in-depth individual interviews were
conducted. The target participants were experienced users of Smartphone technology
and individuals who were currently working in organizations and sectors related to
smartphone technology. Each interviewee was provided with the list of factors that
were developed through the literature review, brainstorming sessions and focus group
sessions. They were asked a number of questions regarding their perspective about the
identified factors and they were asked to carefully review, filter, select and validate the
most important factors that are most associated with users’ intentions to adopt and use
the Smartphone.
Interviews are a qualitative research method used to collect data and are
defined as a type of conversation with purpose [175]. Individual in-depth interviews
primarily provide an opportunity for the researcher to obtain more detailed
investigation on each individual’s personal perspective about the issue under
consideration and are one of the most widely used methods in qualitative research
68
[175]. There are two main types of interviews, unstructured and structured. There are a
number of ways that interviews can be conducted including, face-to-face, telephone,
chat/messaging, and online, and so on [165].
Unstructured interviews aim to introduce new issues so that the researcher can
determine what aspects need more in-depth exploration [165]. When conducting
unstructured interviews, usually the researcher begins the interview with no specific
sequence of questions to ask the participant and uses answers to guide the interview
content towards new material [165]. In structured interviews, the researcher knows
what information is needed and uses predetermined questions to explore certain areas
of content that are specifically interesting to the study [165]. The interviews conducted
for this research study were semi-structured in that the researcher had a number of
questions that were the focus of the interviews but allowed for follow-up on any new
thoughts uncovered in the interview process. (Please see the questions as shown in
Appendix C). The interviews were intentionally more flexible so that the interviewee had
the time and opportunity to reflect on the whole issue and on each question as needed.
Scholars mentioned a number of stages that are usually followed when
conducting interviews including [175]:
Arrival
The arrival stage can be a very important, allowing the researcher to welcome
the interviewee and establish a good relationship. The researcher’s role at this stage is
69
to try to make the interviewee feel more comfortable, confident and relaxed. He
should avoid any conversation about the research topic until the interview begins.
Introducing the Research
At this stage the researcher starts introducing the research topic, background,
purpose, and making sure that the environment is appropriate and quiet so the
interview can be conducted without any distractions.
Beginning the Interview
Most interviews begin by asking personal demographic questions such as age
and status. These first questions can be an opportunity to obtain important contextual
information. In this stage it is possible for the researcher to set the scene of the
interview and get a sense of the background and skills the interviewee brings to the
table along with the possibility of more detailed information.
During the Interview
The researcher should guide the interviewee through the issues under
consideration and their key themes. Any interesting point can be explored in more
depth by asking the interviewee additional questions and requiring more details.
Ending the Interview
It is important at this stage to check for anything related to the issue under
consideration that was not mentioned during the interview. A few minutes before the
end of the interview, the researcher can start gradually bringing the conversation into a
general conversational level as a signal that the interview is ending.
70
The researcher followed these recommended stages when conducting individual
interviews for this research, anticipating an optimal outcome of the interviews.
Forming the interview questions [175]:
The objective of conducting in-depth interviews is to obtain wider coverage of
and deeper insights into the key issues under consideration. To achieve this, two main
types of questions are recommended: content mapping questions and content mining
questions, which can be combined and used in conducting the interview. Content
mapping refers to questions that aim to define the territory of the issue, identify the
issue boundaries and raise related (possibly new) issues. Content mining questions aim
to explore key issues in more detail.
The aim of the interviews in this research was to obtain the participants’ deep
perspectives and thoughts about the key factors they believe are associated with
adoption and use of Smartphone technology. Experienced users of the Smartphone and
individuals working in sectors related to the Smartphone industry have been targeted
and invited to participate in this interview (please see the invitation presented in
Appendix C). The targeted participants were contacted by phone, email or in person and
invited to participate. The time and place of the interview was scheduled at their
convenience. Documents that include all related details have been handed to each
interviewee in person or sent by email. The researcher thanked each participant for
participating in the interview process and provided them with details about the issues
71
discussed (please see email presented in Appendix C). They may also be provided with
results when the study is complete, if desired.
Based on the literature review, results of the brainstorming session, focus group
and the individual interviews, the preliminary research model was modified. Factors
that were selected as important by at least two thirds of the participants in the
brainstorming, focus group and interviews were included in the research model and the
research model has been modified accordingly [187].
A theoretical model can be developed through a literature review of previous
research related to the subject and through conducting interviews with the people who
are knowledgeable of the specific subject under consideration [165]. Such a literature
review was conducted to identify and explore research related to the adoption of
Smartphone technology as shown earlier in this research. In addition, the researcher
employed a number of qualitative methods namely: brainstorming, focus groups and
individual interviews as shown in Table 7 below. The purpose of using these methods
was to explore and introduce new factors that were not covered in the literature review
and to review, filter and select the important factors that are most closely associated
with users’ adoption and use of Smartphone technology. Qualitative methods have been
used by many researchers in different disciplines including research related to IT
adoption [176], healthcare [177], education, and many other disciplines [178].
Experienced users of the Smartphone with different work backgrounds are a
valuable resource that can provide more insight into the factors that may have a

72
relationship with users’ adoption and use of the Smartphone. Also, individuals who work
in the Smartphone industry and its related sectors can be a valuable source of valuable
information about factors associated with users’ adoption and use of the Smartphone.
Therefore, the researcher targeted experienced users of the Smartphone from different
backgrounds and individuals who work in the Smartphone industry and its related
sectors.
Table 7: Summary of the steps conducted to develop the research model
Research step Description Targeted participants
Literature Review
An extensive literature review has been conducted and taxonomy of factors related to the adoption and use of Smartphone technology was developed.
Brainstorming
A 70-minute brainstorming session was conducted with six participants.
Experienced users of Smartphone ( with at least 3 years of usage) and individuals who work in Smartphone
industry and its related sectors
Focus Group
A 1 hour focus group session was conducted with 7 participants.
Interviews
Face to face individual interviews were conducted with 20 participants. Interviews took 15 to 50 minutes each.
3.4 Conducting Brainstorming session
Brainstorming is a useful approach that has been used as a means to initiate and
establish creativity and stimulate thinking to generate a wide range of ideas. It is used
to explore potential solutions, discuss options and consequences, or deal with a given
73
issue [181, 182]. Researchers have utilized brainstorming to introduce and evaluate
factors related to mobile technologies [176]. Conducting a brainstorming session is a
great approach to gather a wide range of ideas and thoughts regarding an issue under
consideration [183]. The purpose of conducting the brainstorming session in this
research is: 1) to obtain experienced users’ opinions, creative ideas and thoughts; 2) to
introduce new factors that may have relationship with users’ adoption and use of the
Smartphone; and to evaluate and validate factors identified in the literature review.
After inviting participants and obtaining their agreement on the time and place,
the researcher visited the Hillsboro main library and reserved a conference room to
conduct the brainstorming session (see reservation conformation email in Appendix A).
However, the first attempt to form and conduct a brainstorming session had to be
cancelled and postponed because of unexpected changes in a number of participants'
schedules. The second attempt was successful and the number of participants was
sufficient to accomplish a productive session. The researcher arrived at the reserved
conference room one hour before the starting time to prepare all needed materials and
set up a selection of light beverages for the participants.
The brainstorming session started with a brief presentation in which the
researcher welcomed the participants and introduced himself and his research
(Appendix A). A brief explanation of the main purpose of the brainstorming session was
given and the participants were asked to introduce themselves before starting the
actual discussion.
74
The three main research questions mentioned earlier were the focus of the
discussion. These questions helped define the boundaries of the discussion. The
researcher led the group discussion, working to maintain productivity, focus and group
synergy during the session. An interesting and informative interaction took place
among the participants as they shared thoughts and ideas regarding factors that could
influence users’ adoption and use of Smartphone technology. Participants reviewed and
evaluated a list of factors developed from the literature review combined with some
factors newly introduced through the discussion process. They selected and validated
specific factors for inclusion in the research model.
During the meeting a white board had been used to outline participants’
statements, comments, agreements, and disagreements. This visual aid helped to keep
the discussion on track and assisted in reaching conclusions. All participants participated
actively in the discussion. The hard copy of the questions and lists provided to each
participant plus notes of additional factors were then used to identify their selections
for the final cut. Each participant made his/her own final decision as to which factors to
validate and select. The researcher took notes during the whole meeting and
documented the final conclusions.
The researcher closed the session by asking the participants if they had any final
thoughts or comments and then he thanked them and expressed his appreciation for
their participation in the session. Participants seemed very excited to participate and
showed their interest in the Smartphone technology and how it is rapidly evolving. The
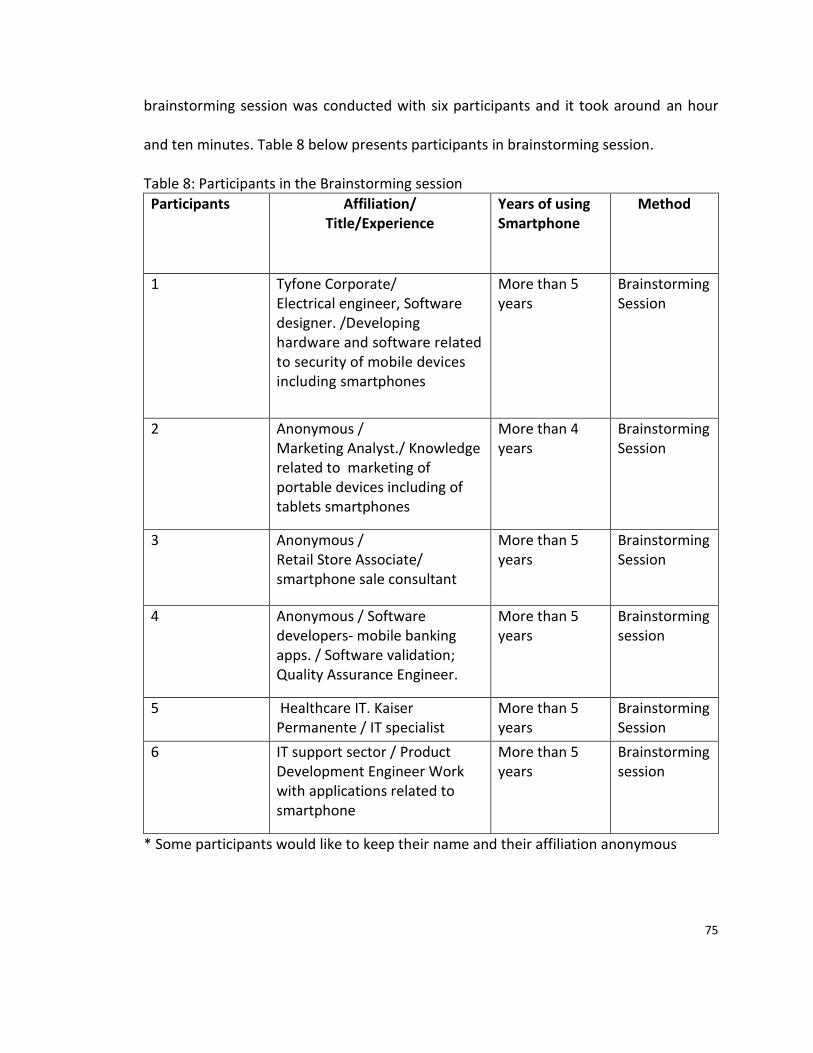
75
brainstorming session was conducted with six participants and it took around an hour
and ten minutes. Table 8 below presents participants in brainstorming session.
Table 8: Participants in the Brainstorming session
Participants Affiliation/ Title/Experience
Years of using Smartphone
Method
1 Tyfone Corporate/ Electrical engineer, Software designer. /Developing hardware and software related to security of mobile devices including smartphones
More than 5 years
Brainstorming Session
2 Anonymous / Marketing Analyst./ Knowledge related to marketing of portable devices including of tablets smartphones
More than 4 years
Brainstorming Session
3 Anonymous / Retail Store Associate/ smartphone sale consultant
More than 5 years
Brainstorming Session
4 Anonymous / Software developers- mobile banking apps. / Software validation; Quality Assurance Engineer.
More than 5 years
Brainstorming session
5 Healthcare IT. Kaiser Permanente / IT specialist
More than 5 years
Brainstorming Session
6 IT support sector / Product Development Engineer Work with applications related to smartphone
More than 5 years
Brainstorming session
* Some participants would like to keep their name and their affiliation anonymous
76
An example of the discussion during brainstorming session:
Participants thought:
“Durability of the smartphones can be a factor that would be related to users’
intention to adopt and use smartphones. Durability of the technology can be a
factor that encourage more people adopt it and use it”
Another participant replied, “I think durability and quality are the same and
quality is mentioned here in the list of the factors provided to us” the first
participant agreed with the thought that quality is the same is durability.
Another participant thought “Social networking is one factor that may drive
many people to adopt and use smartphones, smartphones provide users with
many way of connecting and networking with other”
A number of participants in the brainstorming session agreed with this thought.
The researcher added this thought into the list and included it in the discussion in
the focus group session and the individuals’ interviews.
3.5 Conducting Focus Group Session
Focus group is a useful qualitative method that can help the researcher obtain
valuable data. It is a very valuable approach combined with in-depth individual
interviews and focus group approaches [175]. Scholars support the use of focus groups
to raise and explore relevant key issues related to the subject and then these key issues
can be discussed in more depth using individual interviews [185, 175]. In this research,
the focus group session was implemented to obtain participants’ opinions and
perspectives about identified factors that are associated with users’ adoption and use of
77
smartphones as well as giving them the chance to introduce new related factors. Focus
groups are used extensively in research studies and typically used to obtain
participants’ impressions, points of view and opinions as the participants are invited to
discuss and talk about a specific issue [185] [165].
The researcher targeted possible participants and invited them to this focus
group session. The nine individuals who agreed were contacted to set a time and place
that was convenient for them; however, two eventually opted out for personal reasons,
leaving seven participants. The researcher reserved a conference room at the Hillsboro
Main Library. He arrived one hour before the starting time, prepared all needed
materials, and provided water and light beverages for participants.
The session started with a brief presentation in which the researcher welcoming
the participants, introducing himself and his research and giving a brief description of
the main aim of conducting the focus group session (see Appendix A). The researcher
asked the participants to briefly introduce themselves and their background.
In a group discussion, participants exchanged thought and ideas, reviewed,
evaluated and discussed the list of factors provided to them. An interesting, energetic
and informative discussion was unleashed among participants that included all factors in
the list provided to them. Participants reviewed, evaluated and expressed their thoughts
and ideas regarding each of the factors provided to them. The three main questions
mention earlier were the focus of the discussion and they helped to create a boundary
for the session.
78
Participants reviewed and evaluated the list of factors provided to them. They
selected and validated a number of factors that they believed were most important to
be included in the research model. All participants actively participated, sharing
thoughts and ideas. Each participant made his/her final decision to which factors to
validate and select, using the hard copy of the focus group questions and factors
provided to each participant. The selected factors were included in the research model.
During the focus group session, in addition to the hard copy documents provided
to each participant, a whiteboard was used to note participants’ statement, comments,
agreement, and disagreement and record their conclusions. The researcher also took
personal notes during the meeting and documented the final conclusions of the group.
The researcher led the group discussion, trying to make it easier and working to
maintain productivity and focus and to create group synergy during the session.
The session was closed by asking the participants if they had any final thoughts
or comments. The researcher then thanked them and expressed his appreciation for
their time and effort. This session took around an hour. The seven participants seemed
very excited to participate and showed their interest in the Smartphone technology and
its rapid evolution. (See the table 9 of participants below).
An example of a statement by a participant to support his idea:
Performance expectancy factor is certainly one of the most important
factors that can influence users’ intention to adopt and use smartphones.
Smartphones have become more efficient and allow users to do many
things without the need for a laptop.
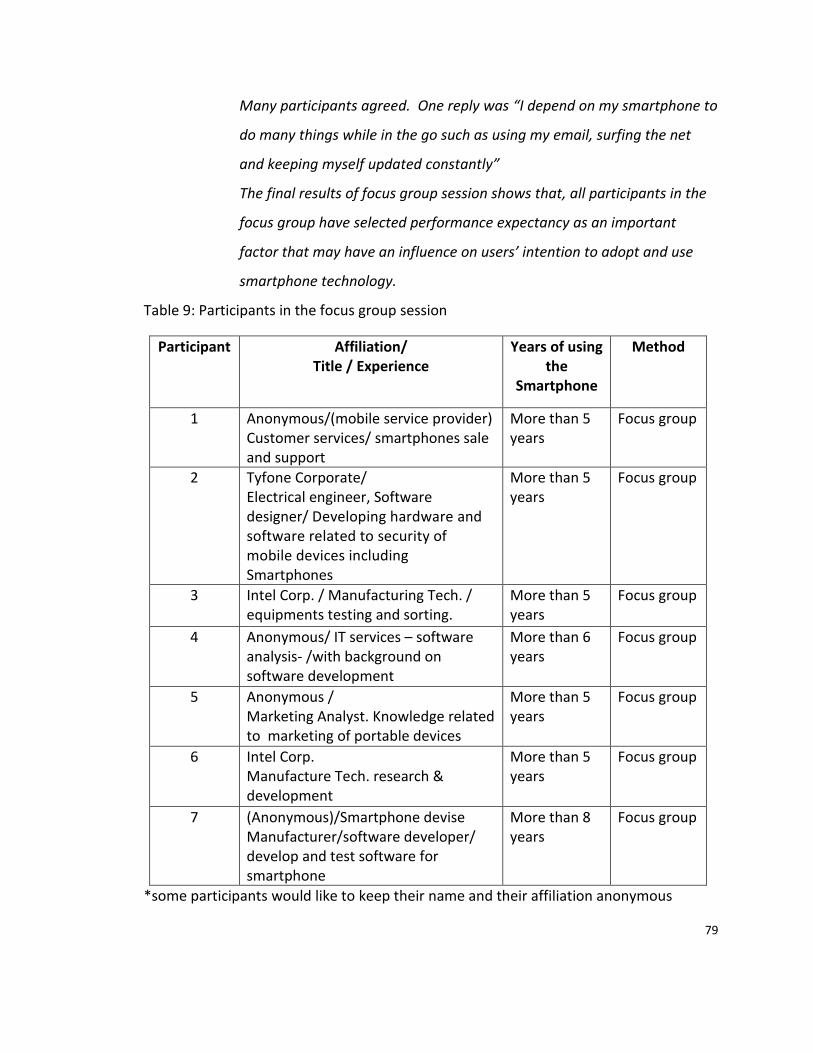
79
Many participants agreed. One reply was “I depend on my smartphone to
do many things while in the go such as using my email, surfing the net
and keeping myself updated constantly”
The final results of focus group session shows that, all participants in the
focus group have selected performance expectancy as an important
factor that may have an influence on users’ intention to adopt and use
smartphone technology.
Table 9: Participants in the focus group session
Participant Affiliation/ Title / Experience
Years of using the
Smartphone
Method
1 Anonymous/(mobile service provider) Customer services/ smartphones sale and support
More than 5 years
Focus group
2 Tyfone Corporate/ Electrical engineer, Software designer/ Developing hardware and software related to security of mobile devices including Smartphones
More than 5 years
Focus group
3 Intel Corp. / Manufacturing Tech. / equipments testing and sorting.
More than 5 years
Focus group
4 Anonymous/ IT services – software analysis- /with background on software development
More than 6 years
Focus group
5 Anonymous / Marketing Analyst. Knowledge related to marketing of portable devices
More than 5 years
Focus group
6 Intel Corp. Manufacture Tech. research & development
More than 5 years
Focus group
7 (Anonymous)/Smartphone devise Manufacturer/software developer/ develop and test software for smartphone
More than 8 years
Focus group
*some participants would like to keep their name and their affiliation anonymous
80
3.6 Conducting Individual Interviews
Individual interviews are a popular qualitative method that has been used widely
to conduct in-depth discussions in which more detailed information can be obtained
[175]. It is known that in-depth interviews provide an opportunity for researchers to
obtain more detailed investigation of each individual’s personal perspective about the
issue under consideration [175]. After conducting a brainstorming session and a focus
group session, as mentioned earlier, the researcher followed up with in-depth
individual interviews to obtain more details that could provide a better outcome as
recommended by a number of scholars [185, 175].
Experienced users of the Smartphone and individuals who work in sectors
related to the Smartphone were invited to participate in these individual interviews. The
aim of conducting the individual interviews is to obtain participants’ deep perspectives,
opinions, and evaluations about factors identified in this research and ask them to select
and validate the factors that they believe are more associated with users’ adoption and
use of the Smartphone technology. The place and the time of each interview have been
arranged based on the participant’s preference.
Each interview started with a brief introduction in which the researcher
introduced himself and his research with a brief description of the main aim of
conducting the interview. The researcher politely asked each participant to briefly
introduce him/herself and give some background information in return. Individual
interviews allowed the researcher to engage in a relaxed but in-depth, interesting, and
81
informative discussion that included all factors in the list that had been provided to each
participant in advance. The three main research questions mentioned earlier helped put
boundaries of the discussion; however, getting each participant’s personal reactions and
conclusions as to which factors were more valid and should be included in the research
model was the ultimate goal. A number of participants introduced new factors that they
believed had a strong relationship with users’ adoption and use of smartphones and had
not been previously considered.
The researcher closed the interview by asking the participants if they had any
final thoughts or comments on the subject and then he thanked them and expressed his
appreciation for their participation in the interview. A total of twenty individual face-to-
face interviews were conducted ranging from about 20 minutes to 35 minutes each.
An example of one of the individual interviewees’ comments:
One interviewee, in supporting his view and explaining the importance of
including the brand influence factor into the research model stated: “I believe
that brand influence is very important and should be included in the model. A
number of smartphone users come to us asking about some features that they
are looking for and we told them that ‘the Smartphone device that [you] have
does not have or support this feature but if you want to change, and get a
smartphone device which is another brand, that device has and supports this
feature that you looking for.’ Their answer was NO; they are willing to wait for
the next generation of the brand that they like, hoping that the new generation
of the same brand will have that feature. They would rather wait a longer time
on a hope and they are not willing to use any brand other than the one that they
believe in”.
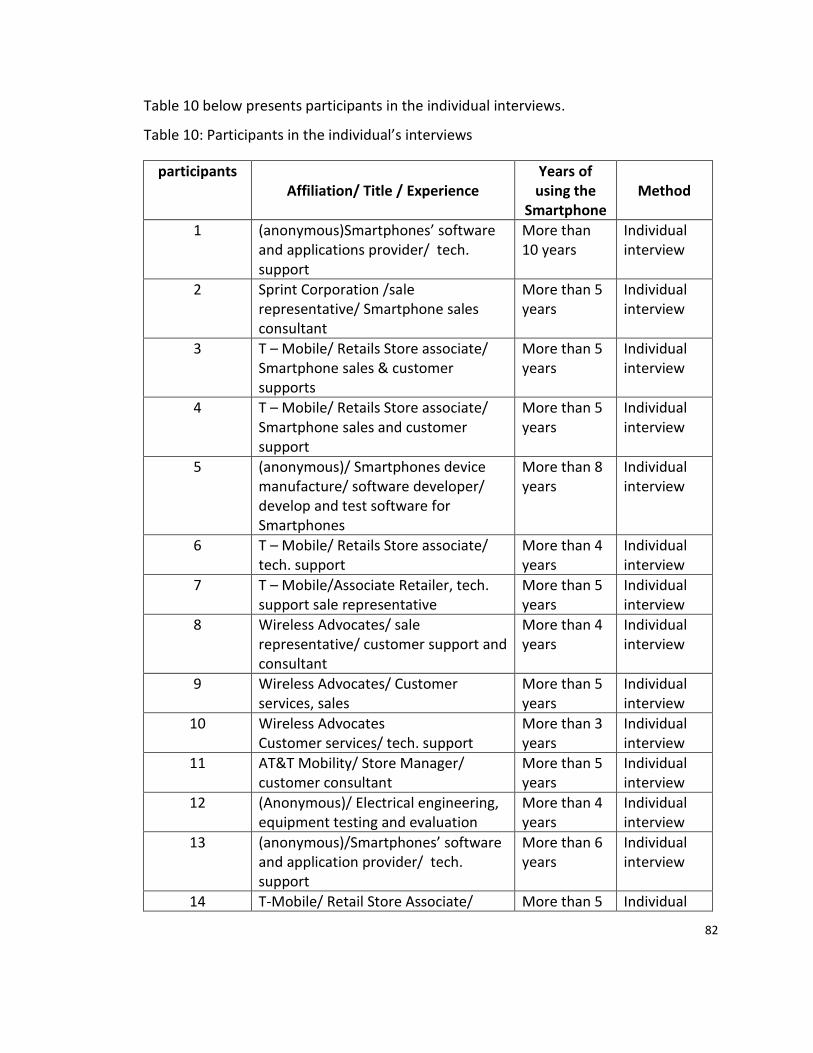
82
Table 10 below presents participants in the individual interviews.
Table 10: Participants in the individual’s interviews
participants Affiliation/ Title / Experience
Years of using the
Smartphone
Method
1 (anonymous)Smartphones’ software and applications provider/ tech. support
More than 10 years
Individual interview
2 Sprint Corporation /sale representative/ Smartphone sales consultant
More than 5 years
Individual interview
3 T – Mobile/ Retails Store associate/ Smartphone sales & customer supports
More than 5 years
Individual interview
4 T – Mobile/ Retails Store associate/ Smartphone sales and customer support
More than 5 years
Individual interview
5 (anonymous)/ Smartphones device manufacture/ software developer/ develop and test software for Smartphones
More than 8 years
Individual interview
6 T – Mobile/ Retails Store associate/ tech. support
More than 4 years
Individual interview
7 T – Mobile/Associate Retailer, tech. support sale representative
More than 5 years
Individual interview
8 Wireless Advocates/ sale representative/ customer support and consultant
More than 4 years
Individual interview
9 Wireless Advocates/ Customer services, sales
More than 5 years
Individual interview
10 Wireless Advocates Customer services/ tech. support
More than 3 years
Individual interview
11 AT&T Mobility/ Store Manager/ customer consultant
More than 5 years
Individual interview
12 (Anonymous)/ Electrical engineering, equipment testing and evaluation
More than 4 years
Individual interview
13 (anonymous)/Smartphones’ software and application provider/ tech. support
More than 6 years
Individual interview
14 T-Mobile/ Retail Store Associate/ More than 5 Individual

83
smartphone sale and support years interview
15 (Anonymous)/smartphone device manufacture/ customer service, tech. support
More than 5 years
Individual interview
16 (Anonymous)/ smartphones device manufacturer/ Retails associate/ customer service
More than 5 years
Individual interview
17 AT&T Mobility/ sales representative, tech support customer consultant
More than 5 years
Individual interview
18 AT&T Mobility/ sales representative, customer support
More than 5 years
Individual interview
19 Sprint Corporation /store Manager/ customer support and consultant
More than 6 years
Individual interview
20 Sprint Corporation /sale representative/ Smartphone sales & tech. support
More than 6 years
Individual interview
*Some participants would like to keep their name and their affiliation anonymous
3.7 Results of the Qualitative methods that have been conducted
More than forty factors related to the users’ adoption and use of Smartphones have
been identified through a literature review conducted for this research as shown in
table 11 below:
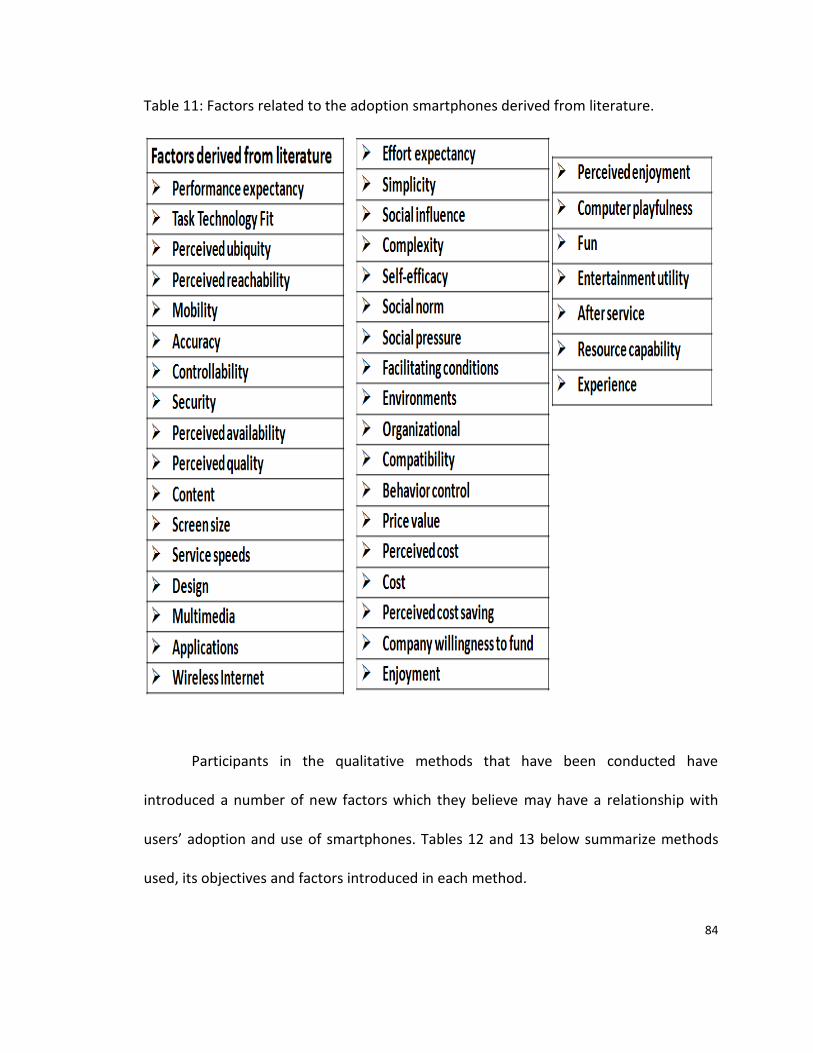
84
Table 11: Factors related to the adoption smartphones derived from literature.
Participants in the qualitative methods that have been conducted have
introduced a number of new factors which they believe may have a relationship with
users’ adoption and use of smartphones. Tables 12 and 13 below summarize methods
used, its objectives and factors introduced in each method.
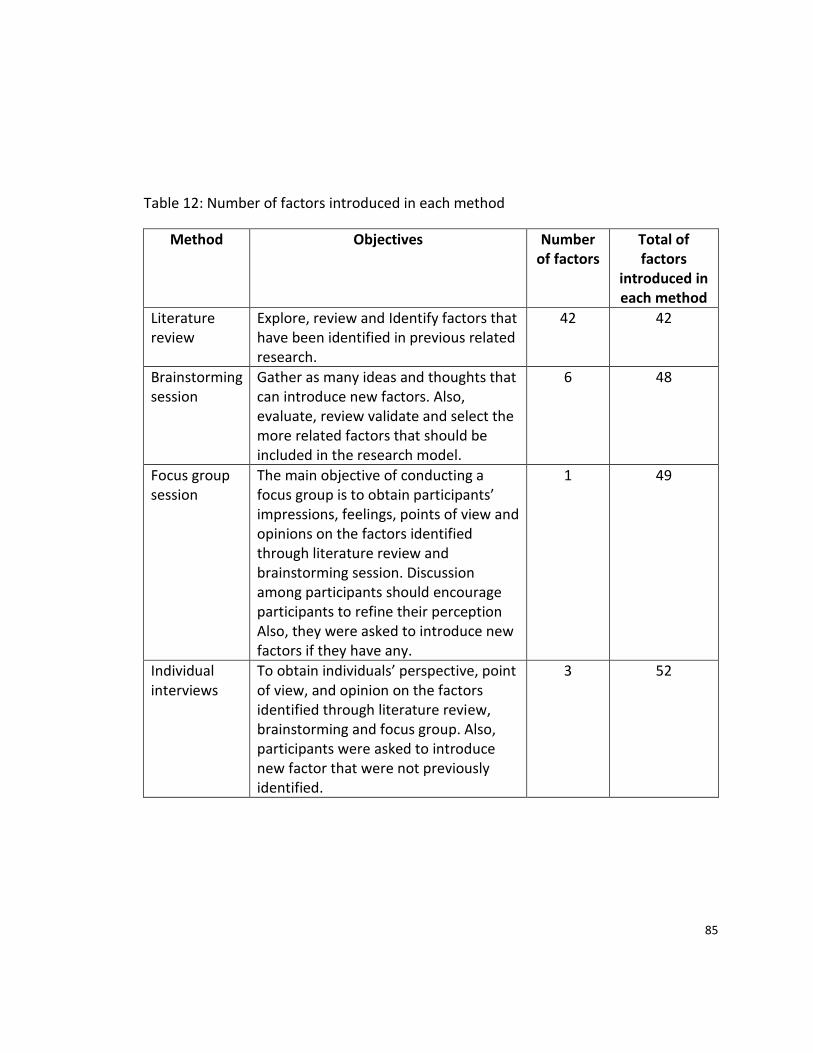
85
Table 12: Number of factors introduced in each method
Method Objectives Number of factors
Total of factors
introduced in each method
Literature review
Explore, review and Identify factors that have been identified in previous related research.
42 42
Brainstorming session
Gather as many ideas and thoughts that can introduce new factors. Also, evaluate, review validate and select the more related factors that should be included in the research model.
6 48
Focus group session
The main objective of conducting a focus group is to obtain participants’ impressions, feelings, points of view and opinions on the factors identified through literature review and brainstorming session. Discussion among participants should encourage participants to refine their perception Also, they were asked to introduce new factors if they have any.
1 49
Individual interviews
To obtain individuals’ perspective, point of view, and opinion on the factors identified through literature review, brainstorming and focus group. Also, participants were asked to introduce new factor that were not previously identified.
3 52
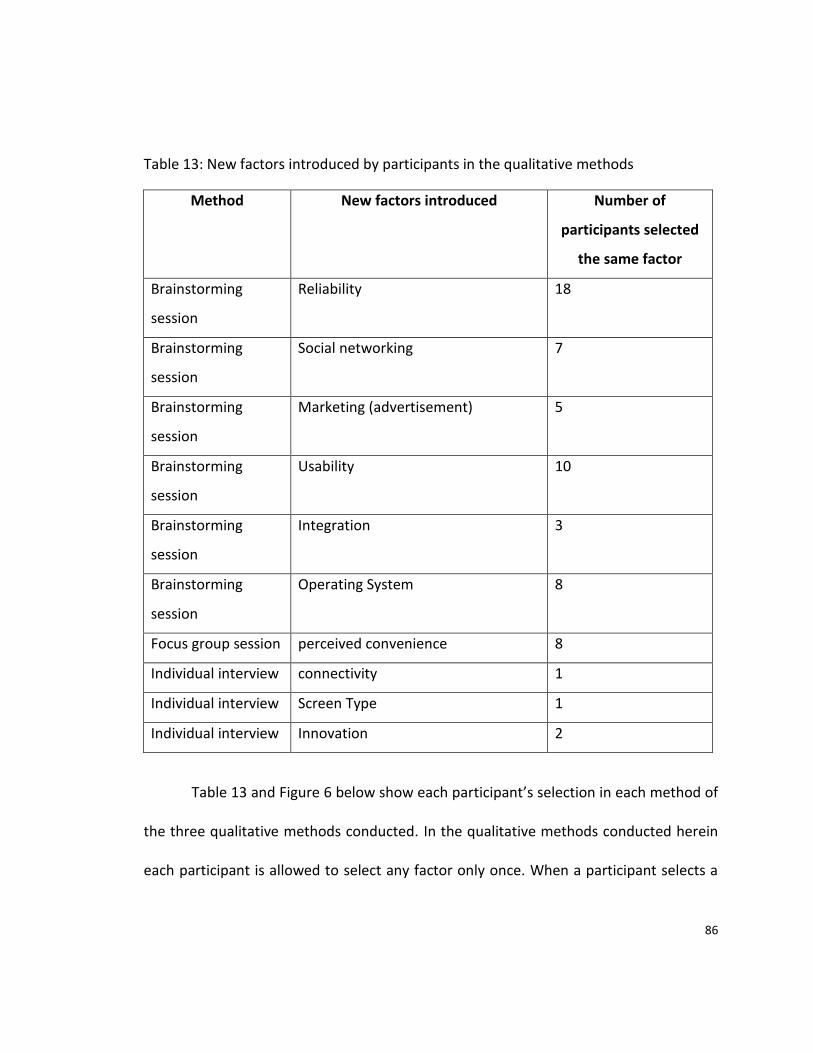
86
Table 13: New factors introduced by participants in the qualitative methods
Method New factors introduced Number of
participants selected
the same factor
Brainstorming
session
Reliability 18
Brainstorming
session
Social networking 7
Brainstorming
session
Marketing (advertisement) 5
Brainstorming
session
Usability 10
Brainstorming
session
Integration 3
Brainstorming
session
Operating System 8
Focus group session perceived convenience 8
Individual interview connectivity 1
Individual interview Screen Type 1
Individual interview Innovation 2
Table 13 and Figure 6 below show each participant’s selection in each method of
the three qualitative methods conducted. In the qualitative methods conducted herein
each participant is allowed to select any factor only once. When a participant selects a

87
factor it is counted number one and factors that are not selected are counted as zero or
left empty. (Table 14 and figure 6 below present experts’ selections).
There were a total of thirty three participants; six participants in the
brainstorming session, seven participants in the focus group session and twenty
participants in the individual face-to-face interviews. Eight factors that were selected by
at least two-thirds (22) of the participants in the qualitative methods have been
included in the research model: performance expectancy, effort expectancy, social
influence, brand influence, economic factors, facilitating conditions, perceived
enjoyment and design. After obtaining the results of the qualitative methods mentioned
above, the research model was modified accordingly.
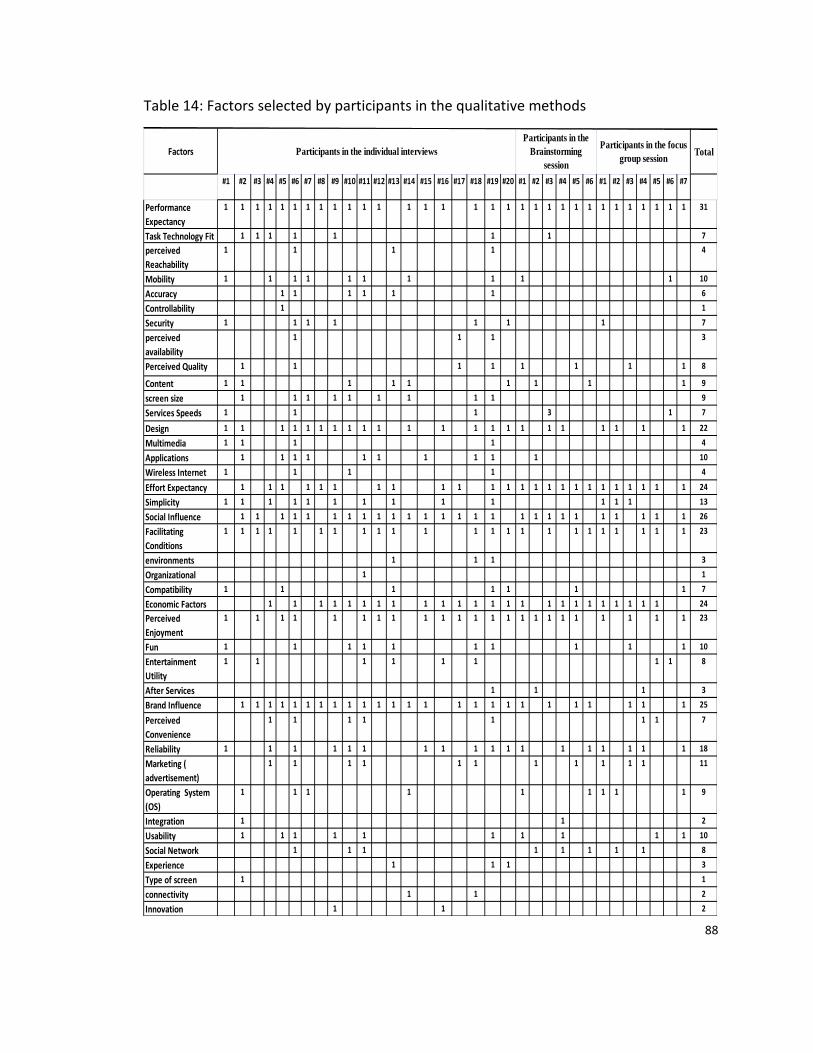
88
Table 14: Factors selected by participants in the qualitative methods
Factors Total
#1 #2 #3 #4 #5 #6 #7 #8 #9 #10 #11 #12 #13 #14 #15 #16 #17 #18 #19 #20 #1 #2 #3 #4 #5 #6 #1 #2 #3 #4 #5 #6 #7
Performance
Expectancy
1 1 1 1 1 1 1 1 1 1 1 1 1 1 1 1 1 1 1 1 1 1 1 1 1 1 1 1 1 1 1 31
Task Technology Fit 1 1 1 1 1 1 1 7
perceived
Reachability
1 1 1 1 4
Mobility 1 1 1 1 1 1 1 1 1 1 10
Accuracy 1 1 1 1 1 1 6
Controllability 1 1
Security 1 1 1 1 1 1 1 7
perceived
availability
1 1 1 3
Perceived Quality 1 1 1 1 1 1 1 1 8
Content 1 1 1 1 1 1 1 1 1 9
screen size 1 1 1 1 1 1 1 1 1 9
Services Speeds 1 1 1 3 1 7
Design 1 1 1 1 1 1 1 1 1 1 1 1 1 1 1 1 1 1 1 1 1 1 22
Multimedia 1 1 1 1 4
Applications 1 1 1 1 1 1 1 1 1 1 10
Wireless Internet 1 1 1 1 4
Effort Expectancy 1 1 1 1 1 1 1 1 1 1 1 1 1 1 1 1 1 1 1 1 1 1 1 1 24
Simplicity 1 1 1 1 1 1 1 1 1 1 1 1 1 13
Social Influence 1 1 1 1 1 1 1 1 1 1 1 1 1 1 1 1 1 1 1 1 1 1 1 1 1 1 26
Facilitating
Conditions
1 1 1 1 1 1 1 1 1 1 1 1 1 1 1 1 1 1 1 1 1 1 1 23
environments 1 1 1 3
Organizational 1 1
Compatibility 1 1 1 1 1 1 1 7
Economic Factors 1 1 1 1 1 1 1 1 1 1 1 1 1 1 1 1 1 1 1 1 1 1 1 1 24
Perceived
Enjoyment
1 1 1 1 1 1 1 1 1 1 1 1 1 1 1 1 1 1 1 1 1 1 1 23
Fun 1 1 1 1 1 1 1 1 1 1 10
Entertainment
Utility
1 1 1 1 1 1 1 1 8
After Services 1 1 1 3
Brand Influence 1 1 1 1 1 1 1 1 1 1 1 1 1 1 1 1 1 1 1 1 1 1 1 1 1 25
Perceived
Convenience
1 1 1 1 1 1 1 7
Reliability 1 1 1 1 1 1 1 1 1 1 1 1 1 1 1 1 1 1 18
Marketing (
advertisement)
1 1 1 1 1 1 1 1 1 1 1 11
Operating System
(OS)
1 1 1 1 1 1 1 1 1 9
Integration 1 1 2
Usability 1 1 1 1 1 1 1 1 1 1 10
Social Network 1 1 1 1 1 1 1 1 8
Experience 1 1 1 3
Type of screen 1 1
connectivity 1 1 2
Innovation 1 1 2
Participants in the
Brainstorming
session
Participants in the focus
group sessionParticipants in the individual interviews
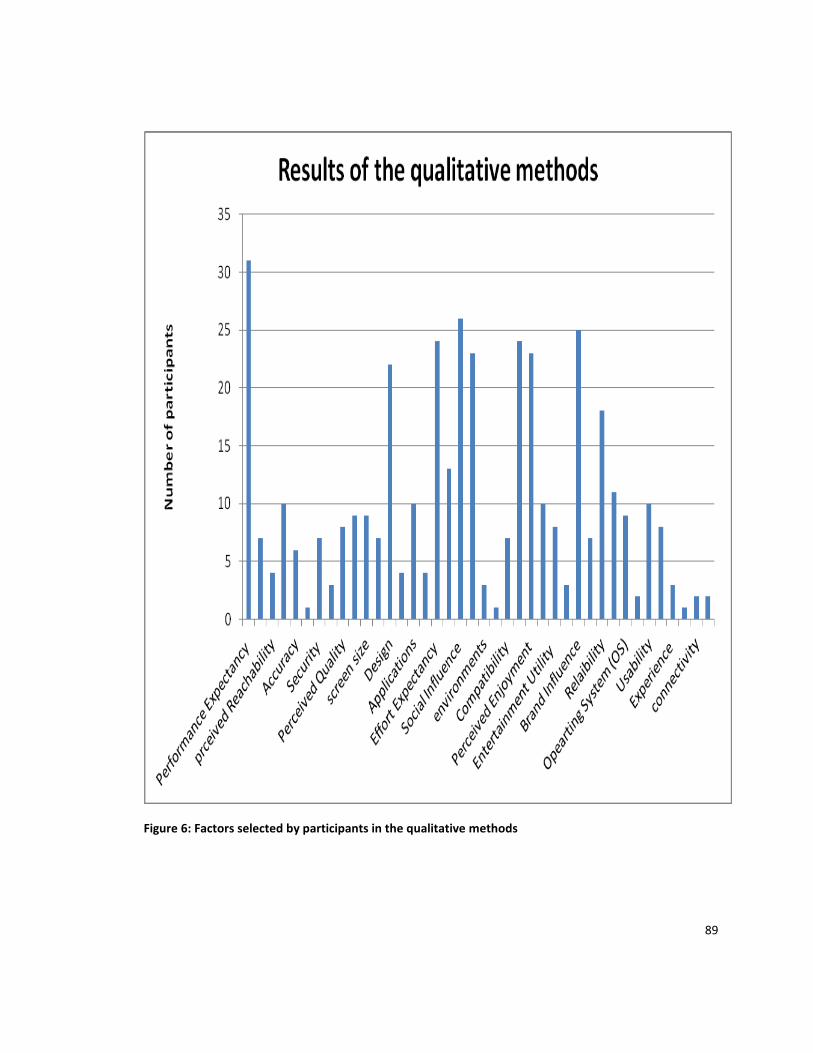
89
Figure 6: Factors selected by participants in the qualitative methods
90
3.8 Developing Research Model
Sekaran [165] defined a theoretical framework or model as “a conceptual model
for how one theorizes or makes logical sense of the relationships among the several
factors that have been identified as important to the research problem.” Also, he
mentioned that identifying factors that were determined as important factors by
previous research accompanied with rational relationships and connections can be
logically conceptualized to form the basis of a research theoretical framework or model
[165]. The research model for this dissertation (as shown in Figure 6 below) is developed
based on modification of the UTAUT model. Besides using the taxonomy developed
through the literature review, a number of qualitative methods have been conducted to
help in developing the final research model. Table 15 below summarizes the definition
of each factor in the preliminary research model.
Research model modification based on the literature review and qualitative methods
that have been conducted for this research
Factors that are selected by at least two-third of participants have been included in
the research model as show in figure 7 below.
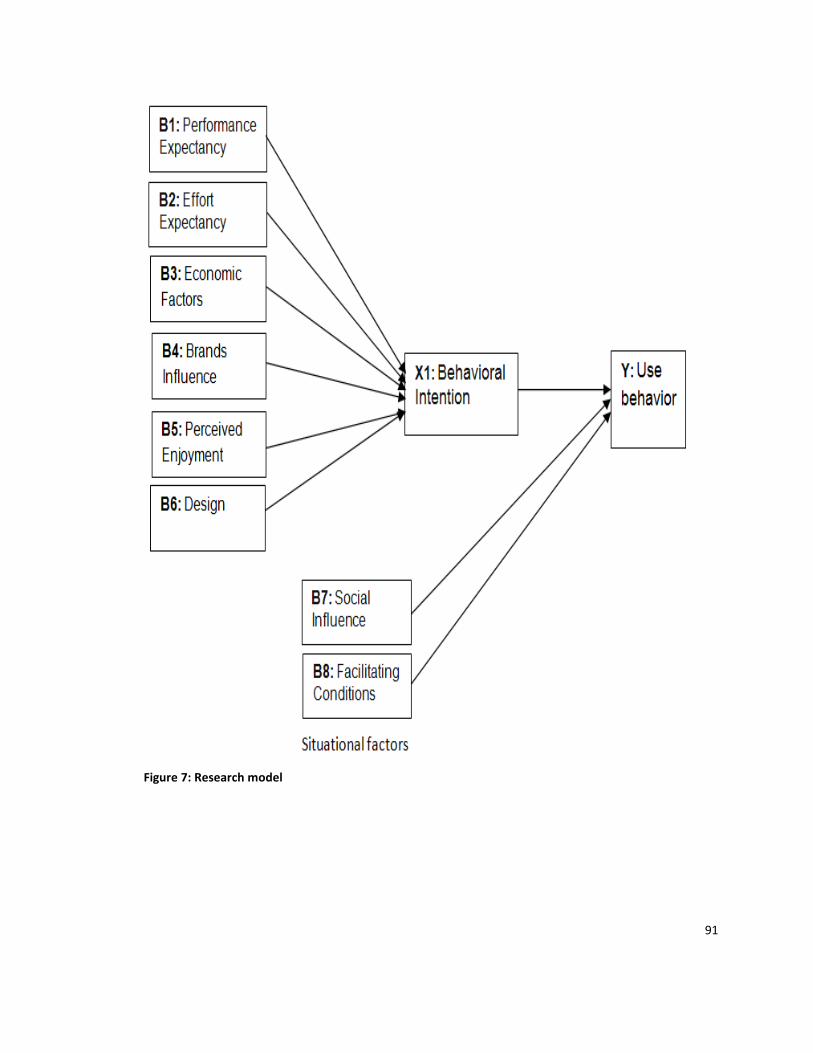
91
Figure 7: Research model
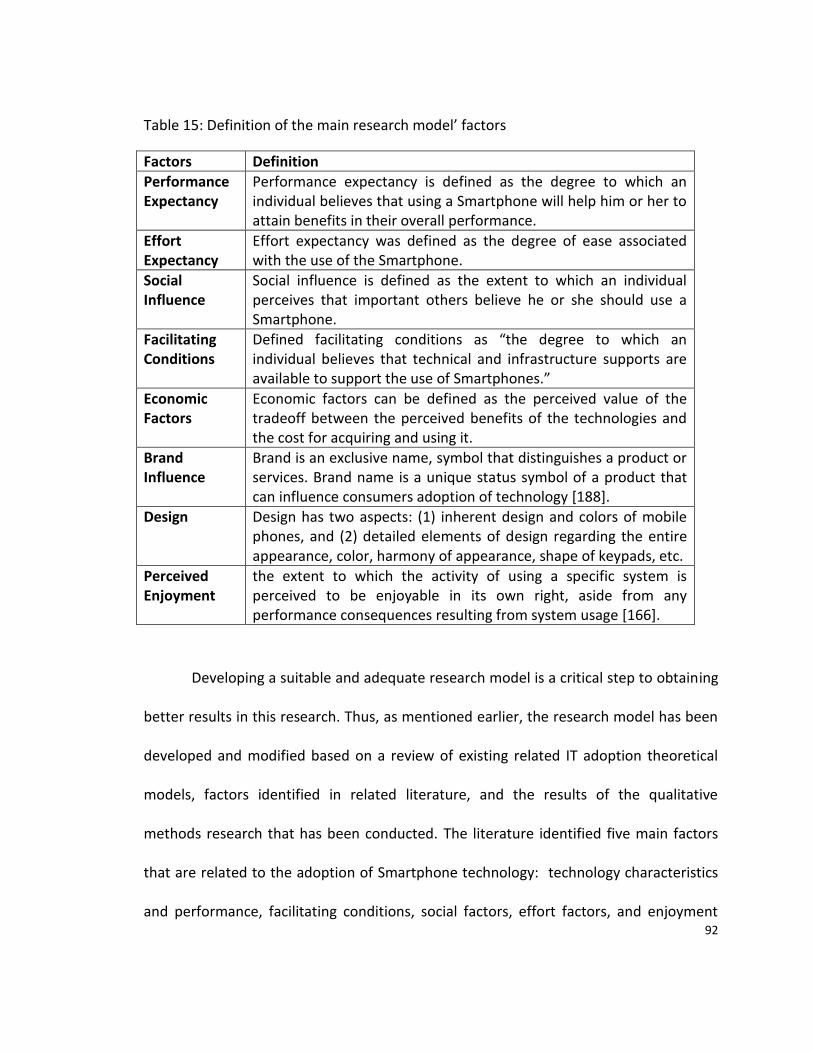
92
Table 15: Definition of the main research model’ factors
Factors Definition
Performance Expectancy
Performance expectancy is defined as the degree to which an individual believes that using a Smartphone will help him or her to attain benefits in their overall performance.
Effort Expectancy
Effort expectancy was defined as the degree of ease associated with the use of the Smartphone.
Social Influence
Social influence is defined as the extent to which an individual perceives that important others believe he or she should use a Smartphone.
Facilitating Conditions
Defined facilitating conditions as “the degree to which an individual believes that technical and infrastructure supports are available to support the use of Smartphones.”
Economic Factors
Economic factors can be defined as the perceived value of the tradeoff between the perceived benefits of the technologies and the cost for acquiring and using it.
Brand Influence
Brand is an exclusive name, symbol that distinguishes a product or services. Brand name is a unique status symbol of a product that can influence consumers adoption of technology [188].
Design
Design has two aspects: (1) inherent design and colors of mobile phones, and (2) detailed elements of design regarding the entire appearance, color, harmony of appearance, shape of keypads, etc.
Perceived Enjoyment
the extent to which the activity of using a specific system is perceived to be enjoyable in its own right, aside from any performance consequences resulting from system usage [166].
Developing a suitable and adequate research model is a critical step to obtaining
better results in this research. Thus, as mentioned earlier, the research model has been
developed and modified based on a review of existing related IT adoption theoretical
models, factors identified in related literature, and the results of the qualitative
methods research that has been conducted. The literature identified five main factors
that are related to the adoption of Smartphone technology: technology characteristics
and performance, facilitating conditions, social factors, effort factors, and enjoyment
93
factors. Each one of the five factors has a number of sub-factors that contribute to its
influence on the adoption and use of Smartphone technology. All factors presented in
this taxonomy were identified in previous research as related to the adoption and use of
the Smartphone technology. One brainstorming session, one focus group session and
20 individual interviews with experienced users and industry insiders were conducted to
explore and add new factors that were not covered in the literature review. All factors
were then evaluated and filtered to select the most important factors that are
associated with users’ intention to adopt and use the Smartphone. The factors that
were selected have been included in the research model and the model has been
modified and finalized accordingly.
This dissertation aims to explore the key factors that influence general users’
intention to adopt and use the Smartphone technology in Saudi Arabia with a more
comprehensive approach. Therefore, a literature review of related IT adoption
theoretical models has been conducted (as mentioned in Chapter Two of this
dissertation) including TRA, TAM, TPB, IDT, TTF and UTAUT. UTAUT is an established
model with four main factors that determine users' intentions towards and use of a new
technology [82].
Venkatesh et al. [82] empirically tested the UTAUT model and confirmed that
UTAUT outperforms each of the eight prominent models initially used in forming
UTAUT. In order to make UTAUT a more comprehensive model, the developer of the
UTAUT model integrated a number of important factors under each main factor of the
94
UTAUT model (table 16 present the origin models used to develop the UTAUT model
and the specific factors that were integrated into each factor in the UTAUT model). For
example, integrating the perceived usefulness factor under the performance expectancy
factor, which indicates that any factor that contributes to the perceived usefulness
factor can perhaps contribute to the performance expectancy factor. UTAUT proposed a
better unified view of the users’ acceptance of a technology and it is expected to explain
about 70% of variances [82].
The survey in this dissertation has been translated into Arabic language and it
has been administered to smartphones users in Saudi Arabia. Therefore, to obtain
better results it is appropriate to base the dissertation research model on a suitable and
robust model such as UTAUT. A number of scholars have tested the robustness of
UTAUT and its ability to withstand translation and use in countries different than its
original country and language of origin [189]. Their finding showed that UTAUT is a
robust model and can withstand translation and use in a different country such as Saudi
Arabia [189].
The UTAUT model has been modified, extended and integrated with other IT
theoretical models to study and explain adoption and use of technology related to the
Smartphone technology. Choudrie et al. [98] combined UTAUT with TAM and DOI to
study the adoption and use of the Smartphone by older adults in the United Kingdom.
Shin et al. [119] extended the UTAUT model study key factors that influence users’
intentions to continue using the Smartphone as a ubiquitous learning (u-learning) tool.
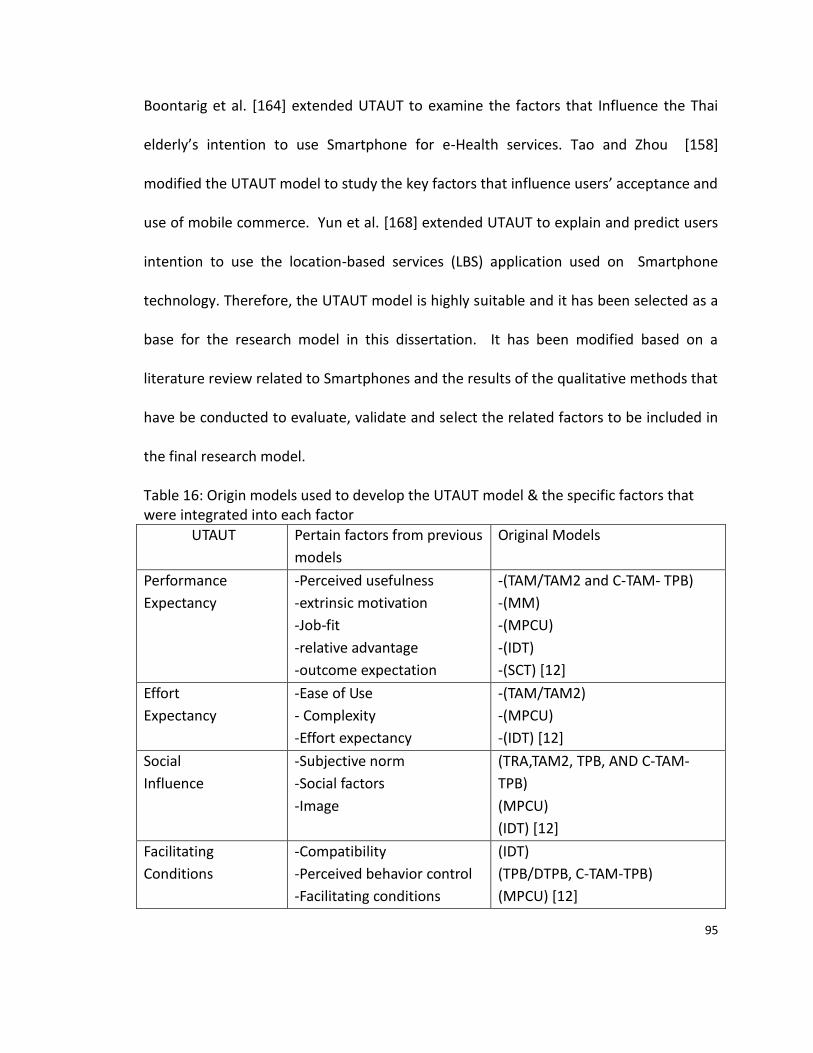
95
Boontarig et al. [164] extended UTAUT to examine the factors that Influence the Thai
elderly’s intention to use Smartphone for e-Health services. Tao and Zhou [158]
modified the UTAUT model to study the key factors that influence users’ acceptance and
use of mobile commerce. Yun et al. [168] extended UTAUT to explain and predict users
intention to use the location-based services (LBS) application used on Smartphone
technology. Therefore, the UTAUT model is highly suitable and it has been selected as a
base for the research model in this dissertation. It has been modified based on a
literature review related to Smartphones and the results of the qualitative methods that
have be conducted to evaluate, validate and select the related factors to be included in
the final research model.
Table 16: Origin models used to develop the UTAUT model & the specific factors that were integrated into each factor
UTAUT Pertain factors from previous
models
Original Models
Performance
Expectancy
-Perceived usefulness
-extrinsic motivation
-Job-fit
-relative advantage
-outcome expectation
-(TAM/TAM2 and C-TAM- TPB)
-(MM)
-(MPCU)
-(IDT)
-(SCT) [12]
Effort
Expectancy
-Ease of Use
- Complexity
-Effort expectancy
-(TAM/TAM2)
-(MPCU)
-(IDT) [12]
Social
Influence
-Subjective norm
-Social factors
-Image
(TRA,TAM2, TPB, AND C-TAM-
TPB)
(MPCU)
(IDT) [12]
Facilitating
Conditions
-Compatibility
-Perceived behavior control
-Facilitating conditions
(IDT)
(TPB/DTPB, C-TAM-TPB)
(MPCU) [12]
96
3.9 Developing Research hypotheses
B1: Performance expectancy factor: defined as “the degree to which an individual
believes that using an information system will help him or her to attain benefits in job
performance” [82]. Smartphone technology can benefit users in their job as well as
other environments. Therefore, for the purposes of this research, the original definition
of performance expectancy will be modified to be “the degree to which an individual
believes that using the Smartphone technology will help him or her to attain benefits in
their overall performance.”
The performance expectancy factor has a strong relationship with intention and
it is a key predictor of the users’ intention to adopt and use a technology [82]. The
Smartphone provides users with many features and benefits that can help to improve
their overall performance. Choudrie et al. [98] studied the adoption and use of the
Smartphone by older adults in the United Kingdom. Their findings showed that the
performance expectancy factor has the strongest influence on intention to adopt and
use Smartphone technology [98].
As explained previously, a number of qualitative methods have been conducted
to review, evaluate, validate and select factors that may have a relationship with users’
adoption and use of Smartphone technology. The performance expectancy factor was
selected by at least two-thirds of the participants in the brainstorming, focus group and
97
interview sessions as an important factor that may have a relationship with users’
adoption and use of the smartphone and should be included in the research model.
Therefore, the following hypothesis has been developed to test the relationship
between the performance expectation factor and the users’ intention to adopt and use
Smartphone technology.
H1: The performance expectancy factor will have a positive relationship with the users’
behavioral intention to use the Smartphone technology.
B2: Effort expectancy factor: defined as “the degree of ease associated with the use of
systems” [82], the effort expectancy factor reflects users’ views or perceptions of the
level or degree of ease of use or simplicity associated with the use of Smartphone
technology. There are three factors that were identified in previous research that are
associated with the level of effort expectancy when using the Smartphone and its
related technologies namely simplicity [101], design [49], and complexity [156]. These
factors were either directly associated with the effort expectancy factor or through
other factors such as the ease of use factor [167, 49, 155, 27, 126].
Boontarig et al. [164] studied the key factors that influence the elderly’s
intention to use the Smartphone for e-Health services in Thailand. Their finding includes
that effort expectancy factor has a significant influence on the Thai elderly’s intention to
use the Smartphone for e-health services [164]. Choudrie et al. [98], in their
investigation of factors that influence adoption and use of Smartphone among older
98
adults, found that effort expectancy factor has a significant influence on users’ intention
to adopt and use the Smartphone.
As previously explained, a number of qualitative methods have been conducted
to review, evaluate, validate and select factors that may have relationships with users’
adoption and use of Smartphone technology. The effort expectancy factor has been
selected by at least two-thirds of the participants in the brainstorming, focus group and
interviews as an important factor that may have a relationship with users’ adoption and
use of the smartphone and should be included in the research model. Therefore, the
following hypothesis has been created to test the relationship between the effort
expectancy factor and users’ intention to adopt and use the Smartphone technology.
H2: The effort expectancy factor will have a positive relationship with the users’
behavioral intention to adopt and use the Smartphone technology.
B3: Economic factors factor: Individual users usually pay close attention to the price and
cost of a technology before considering adopting and using that technology. Economic
factors can be defined as the perceived value of the tradeoff between the perceived
benefits of the technologies and the cost for acquiring and using it [190, 191]. Economic
factors were identified as a factor that can predict users’ behavioral intention to adopt
and use new IT [191]. When the apparent benefits of acquiring and using a technology
are perceived to be greater than the cost, the economic factors are expected to have a
positive relationship with users’ intention to adopt and use a technology [191].
99
The price of the Smartphone’s devices and its services can be costly for some
users, which can negatively influence their intention to adopt and use the Smartphone
[192]. If users perceive Smartphone technology as cost effective, they may be more
willing to adopt and use it. In a number of empirical research studies related to the
adoption and use of Smartphone technology, price or cost of the technology showed a
significant relationship with users’ intention to adopt and use it. Kim [91] studied the
factors that influence users to adopt and use mobile wireless technology (MWT) via the
Smartphone technology. In his results, perceived cost saving showed a positive
relationship with users’ behavioral intention to use the MWT via Smartphone.
Kim et al. [170] also investigated factors that influence the adoption and use of
the mobile internet. They found that, cost, or the price of mobile internet, had a
significant relationship with users’ intention to adopt mobile technology [170]. A
number of factors related to economic factors, perceived cost [155], perceived cost
saving [91], and company willingness to fund [91] were determined as important factors
that are associated with users’ adoption and use of the Smartphone.
As explained previously, a number of qualitative methods were conducted to
review, evaluate, validate and select factors that may have relationships with users’
adoption and use of Smartphone technology. The economic factors factor has been
selected by at least two-thirds of the participants in the brainstorming, focus group and
interviews as an important factor that may have relationships with users’ adoption and
use of the smartphone and should be included in the research model. Therefore, an
100
economic factors factor is added to the research model as a predictor of users’
behavioral intention to adopt and use the Smartphone. Thus, the following hypothesis is
created to test the relationship between the economic factors factor and users’
intention to adopt and use the Smartphone technology.
H3: The economic factors factor will have a positive relationship with the users’
behavioral intention to adopt and use the Smartphone technology.
B4: Brand influence factor: Studying the brand influence on the adoption and use of
Smartphone technology was an approach that a number of scholars used in their
research [106, 107]. Based on Ganesh and Kumar’s work, Chris Maloney [107]
developed a framework to explore the learning effects’ influence on the rate of
adoption in the market and to explain the impact of the learning effect on the adoption
rate of the iPhone [107].
Osman et al. [192] studied users of smartphones in Malaysia and their usage
behaviors. Their results indicated that the brand of smartphones has relationships with
users’ adoption and their usage behaviors [192]. Also, Kim and Song [106] investigated
the adoption and use of the Blueberry Smartphone. They developed their own research
model that investigated the social, economic, and technological characteristics that
influence individuals’ attitude toward adoption of a Blueberry. Even though Smartphone
device brands such as Nokia, HTC, and Samsung have their own unique differences in
101
their combination of hardware/software, and this may influence user’s acceptance and
attitude toward the adoption of smartphones differently.
The iPhone was the most studied Smartphone device in articles reviewed [108-
111, 7]. As explained previously, a number of qualitative methods have been used to
review, evaluate, validate and select factors that are more related and may have
relationships with users’ adoption and use of Smartphone technology. The brand
influence factor has been selected by at least two-thirds of the participants in the
brainstorming, focus group and interviews as an important factor that may have
relationship with users’ adoption and use of the smartphone and should be included in
the research model. Therefore, the following hypothesis has been developed to test the
relationship between the brand influence factor and users’ intention to adopt and use
the Smartphone technology.
H4: The brand influence factor will have a positive relationship with the users’
behavioral intention to adopt and use the Smartphone technology.
B5: Perceived enjoyment: perceived enjoyment is defined as the extent to which the
activity of using a specific system is perceived to be enjoyable in its own right, aside
from any performance consequences resulting from system usage [166]. Perceived
enjoyment has been found to be a significant predictor of users’ intention to adopt and
use information technology [193, 194]. Perceived enjoyment has become a key factor
102
that is associated with individuals’ intention to adopt and use technologies related to
the smartphones.
In a number of previous research studies, scholars studied and explored the
relationship between the perceived enjoyment factor and users’ intention to adopt and
use smartphones and their related technologies. Their findings indicated that the
perceived enjoyment factor was found to be a positive and significant predictor of users’
behavioral intention to adopt and use technology related to the Smartphone [98, 166,
90].
As explained previously, a number of qualitative methods have been conducted
to review, evaluated, validate and select factors that may have relationships with users’
adoption and use of Smartphone technology. The perceived enjoyment factor has been
selected by at least two-thirds of the participants in the brainstorming, focus group and
interviews as an important factor that may have relationships with users’ adoption and
use of the smartphone and should be included in the research model. Therefore, the
following hypothesis is created to test the relationship between the perceived
enjoyment factor and users’ intention to adopt and use the Smartphone technology.
H5: The perceived enjoyment factor will have a positive relationship with users’
behavioral intention to adopt and use the Smartphone technology.
B6: Design: Aesthetic design of smartphones has been studied to observe how it affects
users’ emotional reaction towards adoption of the Smartphone device [113]. Osman et
103
al. studied users of smartphones in Malaysia and their usage behaviors [192]. Their
results indicated that design of smartphones was an important factor that user
considers when buying a smartphone [192]. In research focused on undergraduate and
graduate students in Korea, Kang et al. [49] analyzed the factors that may affect the
adoption of Smartphone. Their findings indicated that design factor has a positive
relationship with perceived usefulness, which, in return, has an effect on behavioral
intention.
As explained previously, a number of qualitative methods have been conducted
to review, evaluate, validate and select factors that may have relationships with users’
adoption and use of Smartphone technology. The design factor has been selected by at
least two-thirds of the participants in the brainstorming, focus group and interviews as
an important factor that may have a relationship with users’ adoption and use of the
smartphone and should be included in the research model. Therefore, the following
hypothesis is created to test the relationship between the design factor and users’
intention to adopt and use the Smartphone technology.
H6: The design factor will have a positive relationship with the users’ behavioral
intention to adopt and use the Smartphone technology.
Situational factors
The consumer or users’ situation can be viewed as comprising "of all those factors
particular to a time and place of observation which do not follow from knowledge of
104
personal (infra-individual) and stimulus (choice alternative) attributes and which have a
demonstrable and systematic effect on current behavior" [195]. Accounting more clearly
for situational variables can greatly improve the researcher’s ability to predict and
understand consumers’ actual behavior [196]. Ward and Robertson stated that
"situational variables may account for considerably more variance than actor related
variables" [197]. it was indicated that key situational variables have shown significant
effects on behavior and it is important to consider it with other related factors to obtain
a better explanation of consumers’ behavior [196]. Both individual and situational
factors must be considered in order to explain consumers’ choices[196]. It was
mentioned that both individual and situational factors must be accounted for to better
explain users’ actual use[196].
Actual behavior of buying or using a technology usually happens within a situational
context and that situation may act as a means to facilitate or to inhibit the occurrence of
that actual behavior or it may not affect it at all [198]. A number of scholars identified a
number of general variables that can be characterized as situational factors including
[196, 198]:
- Physical surroundings;
- Social influence or social surroundings such as other persons present, their
characteristics, their apparent roles, and their interpersonal Interactions;
- Time horizon; and
- Past experience.
105
Alavi and Joachimsthaler mentioned user situational variables as one of the most
relevant user factors that can help to determine the acceptance of technology [80]. A
number of situational factors are presented in the primarily research model, namely
facilitating condition and social influence. Two hypotheses are developed. "Key
situational variables have been demonstrated to have significant effects on behavior."
Situational variables include the following:
Users’ task requirements
Users’ resource capability
Users’ experience with related products
Organizational/Social influences on users
B7: Social influence factor: Social influence is defined as “the extent to which a person
perceives that important others believe he or she should use a new information system”
[82]. Subjective norms and social influence have been recognized as important aspects
that influence users’ adoption of a new technology [96]. A number of factors, namely
self-efficacy [27], social norms [90], and social pressure [126] were determined in
previous research as important factors that are related to social influence on users’
adoption of and use of the Smartphone.
Pan et al. [42] studied the key factors that influence the adoption of the
Smartphone among college students in China and they indicated that social influence
has a significant and positive influence on users’ adoption of the Smartphone [42]. Ling
106
and Yuan [43] empirically studied the factors that influence users’ adoption and use of
smartphones in China and they found subjective norms were among the significant
factors that have positive effects on users’ adoption and use of the smartphones [43].
Scholars pointed out the important role of cultural factors and their influence on the
adoption and use of new information technologies [32-36].
Saudi society has different cultural contexts in that it is characterized as a
society that is more collectivist in nature in which individuals have closer ties and
influential effects among them [32]. As explained previously, a number of qualitative
methods have been conducted to review, evaluate, validate and select factors that may
have relationships with users’ adoption and use of Smartphone technology. The social
influence factor has been selected by at least two-thirds of the participants in the
brainstorming, focus group and the interviews as an important factor that may have
relationships with users’ adoption and use of the smartphone and should be included in
the research model. Therefore, the following hypothesis is created to test the
relationship between the social influence factor and users’ intention to adopt and use
the Smartphone technology.
H7: The social influence factor will have a positive relationship with the use behavior
factor.
B8: Facilitating conditions factor: defined as “the degree to which an individual
believes that an organizational and technical infrastructure exists to support use of the

107
system” [82]. In Smartphone technology, facilitating conditions can include connectivity
and internet service availability, services support, usage information, system
compatibility, individual financial resource, and more factors that facilitate better use of
this technology. A number of factors that are related to facilitating conditions including
perceived security [156], environments [29, 27], organizational [29, 27], compatibility
[29, 155, 27], internal environment [126], and external environment [126], were
determined in previous research as important factors that are associated with users’
adoption and use of the Smartphone.
Boontarig et al. [164] investigated the key factors that influence the Thai
elderlys’ intention to use the Smartphone for e-Health services. They found that the
facilitating conditions factor has a significant influence on the Thai elderlys’ intention to
use the Smartphone for e-health services [164]. Choudrie et al. [98], in their study of
factors that influence adoption and use of Smartphone among older adults, found that
the facilitating conditions factor is an important factor that has a significant influence on
users’ intention to adopt and use the Smartphone.
As explained previously, a number of qualitative methods have been conducted
to review, evaluate, validate and select factors that may have relationships with users’
adoption and use of Smartphone technology. The facilitating conditions factor has been
selected by at least two-thirds of the participants in the brainstorming, focus group and
interviews as an important factor that may have relationships with users’ adoption and
use of the smartphones and should be included in the research model. Therefore, the
108
following hypothesis is created to test the relationship between the facilitating
conditions factor and the use behavior.
H8: Facilitating conditions factor will have a positive relationship with the use behavior
regarding the Smartphone technology.
X1: Behavioral Intention: the behavioral intention factor has been indicated to be a key
predictor of use behavior or actual use of technology [82].
In a number of previous studies, researchers examined the relationship between
the behavioral intention factor and the use behavior factor. They found the behavioral
intention factor to be a strong and important predictor of use behavior (actual use) of
smartphones and their related technologies [199, 82, 159]. Use behavior or actual use of
smartphones is expected to be associated with users’ behavioral intention. Therefore, in
this research, behavioral intention is expected to have a positive relationship with use
behavior factor. Thus, the following hypothesis is created.
H9: The behavioral intentions factor will have a positive relationship with the use
behavior factor.
Table 17 below presents the research questions and the research hypotheses for this
dissertation.
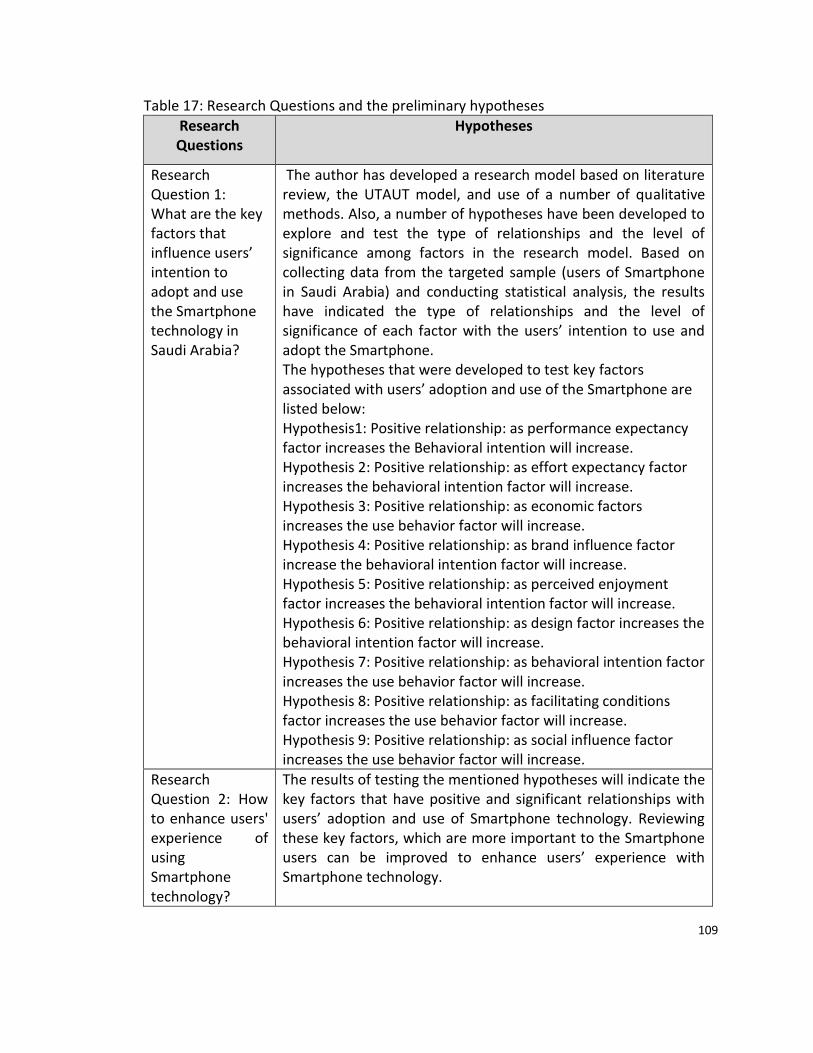
109
Table 17: Research Questions and the preliminary hypotheses
Research Questions
Hypotheses
Research Question 1: What are the key factors that influence users’ intention to adopt and use the Smartphone technology in Saudi Arabia?
The author has developed a research model based on literature review, the UTAUT model, and use of a number of qualitative methods. Also, a number of hypotheses have been developed to explore and test the type of relationships and the level of significance among factors in the research model. Based on collecting data from the targeted sample (users of Smartphone in Saudi Arabia) and conducting statistical analysis, the results have indicated the type of relationships and the level of significance of each factor with the users’ intention to use and adopt the Smartphone. The hypotheses that were developed to test key factors associated with users’ adoption and use of the Smartphone are listed below: Hypothesis1: Positive relationship: as performance expectancy factor increases the Behavioral intention will increase. Hypothesis 2: Positive relationship: as effort expectancy factor increases the behavioral intention factor will increase. Hypothesis 3: Positive relationship: as economic factors increases the use behavior factor will increase. Hypothesis 4: Positive relationship: as brand influence factor increase the behavioral intention factor will increase. Hypothesis 5: Positive relationship: as perceived enjoyment factor increases the behavioral intention factor will increase. Hypothesis 6: Positive relationship: as design factor increases the behavioral intention factor will increase. Hypothesis 7: Positive relationship: as behavioral intention factor increases the use behavior factor will increase. Hypothesis 8: Positive relationship: as facilitating conditions factor increases the use behavior factor will increase. Hypothesis 9: Positive relationship: as social influence factor increases the use behavior factor will increase.
Research Question 2: How to enhance users' experience of using Smartphone technology?
The results of testing the mentioned hypotheses will indicate the key factors that have positive and significant relationships with users’ adoption and use of Smartphone technology. Reviewing these key factors, which are more important to the Smartphone users can be improved to enhance users’ experience with Smartphone technology.
110
4 Chapter Four: Research Approach
4.1 Research Design
The research hypotheses have been developed based on related literature,
modification of the UTAUT theoretical model, and the results of a number of qualitative
methods mentioned earlier in this research. Hypotheses’ testing is mostly associated
with the survey approach which is followed by collecting data for this research. Gable
defined the survey approach as “a group of methods which emphasize quantitative
analysis, where data for a large number of organizations are collected through methods
such as mail questionnaires, telephone interviews or published statistics, and these data
are analyzed using statistical techniques” [200] In order to examine and analyze each of
the hypothesized relationships among factors in the research model, data from
Smartphone’ users have been collected. To collect the needed data, analyze the data
and obtain results, a series of steps have been conducted including the following:
• Development of a survey instrument
• Validation and testing of the survey instrument
• Administration of the survey
• Analysis of the data
• Providing results
4.2 Survey Instrument Development
A survey is defined as “gathering information about the characteristics, actions, or
opinions of a large group of people, referred to as a population” [201]. In survey
111
research there are a number of options for data collection which can be categorized
under self-completion or interviewer-assisted [202-204]. Under the interviewer-assisted
category are personal interviews and telephone interviews. Under the self-completion
type are mail surveys, electronic surveys, or web surveys. In an electronic survey, which
is based on web survey, the researcher can email the electronic link of the electronic
survey to the targeted participants or upload the link into a social network and desired
web sites [202, 205]. An electronic survey is cheaper than alternative methods of survey
distribution and it can be sent to a greater number of participants in a shorter time
[202]. There are some limitations to the electronic survey that need to be considered
when using this method such as getting responses from outside the research sample
frame, especially when uploading the link into a social network or a web site [202].
Survey purpose
There are many objectives or purposes of conducting a survey including description,
explanation and exploration [206, 201]:
Descriptive surveys usually aim to describe a specific distribution about a
population. The researcher is mostly concerned about what the observed
distribution is rather than being concerned about why the distribution exists.
Exploration surveys usually have a loosely structured questionnaire which tends to
be more applicable for researchers just at the start of an exploration or have limited
inquiry about a specific topic that will need additional exploration.
112
In an explanation or explanatory survey, the researchers usually aim to make an
assertion or explanation about a specific population.
The explanatory purpose survey mostly requires multivariate analysis and the
simultaneous examination of multiple variables. Usually the researcher aims to
explain, for example, why some individuals prefer one choice while other has
different preferences.
In this dissertation, the survey objective is explanatory since the purpose of the
research is to explain the users’ behaviors and their preference of choices with regards
to the Smartphone technology.
4.2.1 Survey Design
There are many survey designs including cross sectional survey and longitudinal
survey [206, 201, 207]:
Longitudinal Survey is to collect data at different points in time so the researcher
can report, and describe the changes.
Cross Sectional Survey is to collect of data at one point of time and from a selected
sample which can describe the larger population at that specific time. This survey
design can also be used to determine a relationship between variables at the time
of conducting the study.
This dissertation studies the relationships between variables that may have an
association with users’ adoption and use of smartphones in Saudi Arabia at the time of
conducting the research. Therefore, for this dissertation, the survey design is a cross
113
sectional survey that collect data from smartphone users at one point in time and
analyze it accordingly.
4.2.2 Developing the survey instrument
The process of developing the survey instrument for this dissertation required a
number of steps including the following:
Generating the questions and designing the item scales based on a literature
search and in accordance with research questions.
Evaluating and validating the survey questions using experts and modifying the
questions accordingly.
Translating the survey questions into Arabic language.
Validating the translation using experts in both languages then modifying the
questions accordingly.
Testing the survey instrument with a small group of smartphones users and
modifying it as necessary.
Final review, establishing the final version and launching the survey
4.2.3 Questionnaire Design
When writing survey questions it is recommended to use a previously tested
survey instrument and build upon it [202, 204]. To generate survey questions for this
dissertation, a review of the related literature was conducted to study prior
questionnaires and to gain more insight from related studies that gathered data using
114
similar instruments. There are a number of possible types of research that can be useful
as a base in developing the survey questions including theoretical research which
discusses the developments and validation of the IT adoption theoretical models. For
instance, Venkatesh et al. in their research of user acceptance of new IT, developed a
new IT adoption theoretical model of the UTAUT [82]. In their research, they developed
items (questions) to measure a number of variables such as the performance
expectancy variable, and the social influence variable. These mentioned items can be
useful as a base to develop new questions (items) to measure variables that influence
users’ adoption and use of Smartphone, especially when the research model is based on
UTAUT. Another type of research is empirical research that utilizes similar variables to
study topics related to the adoption and use of Smartphone technology. For instance,
Carlsson et al., in their study of adoption of mobile devices and services, developed a
survey questionnaire that includes questions (items) developed to measure similar
variables such as the performance expectancy variable [208]. Therefore, for this
dissertation, the similar tested survey instruments in previous related research have
been reviewed and built upon to develop survey questions.
4.2.4 Designing the type and form of the survey questions
Survey questions can be grouped under two main types: Open-ended questions
and closed-ended questions [202, 209, 210]. Open-ended questions do not limit
participants in their answer; however, they provide subjects with a frame of reference
115
for their answers [203]. Closed-ended questions limit the participant’s answer to a fixed
possible answer [202, 203].
Since the nature of this dissertation is quantitative, the appropriate type of
questions that have been utilized are structured closed-ended questions. Closed-ended
questions present a fixed set of possible answers for the participants to choose from
[203]. Closed-ended questions include single answer, multiple answer rank order and
Likert-type scale [202, 204]. The Likert-type scale was introduced by Rensis Likert in
1932 as a technique to assess the measurement of survey respondents’ attitudes [211].
Likert-type scale is one of the most used in survey research Likert’s scale is usually
ordinal and each individual item has a range of alternative responses within a five point
scale [212]. For example:
1. Strongly disagree
2. disagree
3. natural
4. agree
5. Strongly agree
The survey questions in this dissertation are based on a 5 point Likert-type scale
with possible answers ranging from 1 to 5. Each question has taken the form of a
statement where the participants are given five possible answers to choose from. Their
answers have been recorded and analyzed on an ordinal scale. An ordinal scale “consists
of a set of categories that are organized in an ordered sequence” [213].
116
4.3 Validity and Reliability
To assess the accuracy of measurement and account for any error that may
present in any measure, two characteristics of a measure have been conducted for this
dissertation instrument namely: validity and reliability [203, 214].
4.3.1 Validity
Validity is defined as “the degree to which a measure accurately represents what
it is supposed to”[214]. There are three major approaches to measure instrument
validity—content validity, criterion-related validity and factor validity [203, 204]:
Content validity measures the degree to which the content of the
instrument items appropriately and comprehensively represents the
content to be assessed. One way to measure the content validity is
through the use of experts’ judgments. An expert panel was formed and
the experts’ judgments and opinions were obtained to help in assessing
the measurement of content validity for the research instrument. More
details are provided later in this chapter.
Criterion-related validity measures how a predictor is appropriate in
capturing the relevant aspects of the criterion. The researcher compares
the performance on the instrument under consideration with the
performance on some other criterion, usually using correlation.
Construct validity aims to “identify the underlying constructs being
measured and how well the test represent them” [203] so that the factor
117
that is being measured is very clearly defined. Experts’ judgment can be
utilized to assess the factors’ validity. An expert panel was formed to
obtain experts’ judgment to test construct validity for the research
instrument. More details are provided later in this chapter.
In order to validate the survey instrument of this dissertation as mentioned
above, an expert panel was formed to assess and validate the survey instrument. An
expert panel is a widely-used method to validate survey instruments used in many
research studies. Ho et al., in their study of the factors influencing the adoption of
mobile data services, used expert judgment to evaluate and validate their research
questionnaire items [167]. An initial version of survey questions has been developed
based on previously related research that used a similar survey instrument. Then a
number of expert panels were used to validate the survey instrument. It is critical to
make sure that the survey instrument is validated and has both construct and content
validity [203, 204]. Based on experts’ opinions and judgments, the survey has been
modified as necessary. A survey testing tool, similar to the one shown in Table 18, was
developed and provided to participants be used in validating the survey instrument.
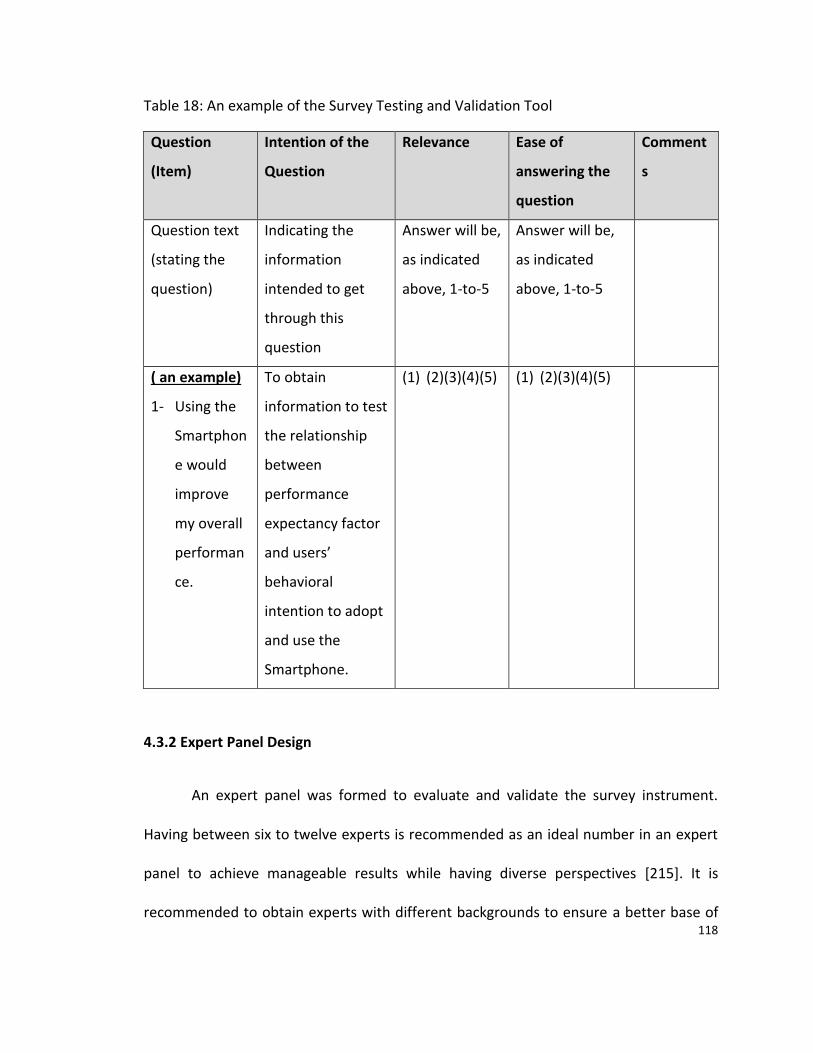
118
Table 18: An example of the Survey Testing and Validation Tool
Question
(Item)
Intention of the
Question
Relevance Ease of
answering the
question
Comment
s
Question text
(stating the
question)
Indicating the
information
intended to get
through this
question
Answer will be,
as indicated
above, 1-to-5
Answer will be,
as indicated
above, 1-to-5
( an example)
1- Using the
Smartphon
e would
improve
my overall
performan
ce.
To obtain
information to test
the relationship
between
performance
expectancy factor
and users’
behavioral
intention to adopt
and use the
Smartphone.
(1) (2)(3)(4)(5) (1) (2)(3)(4)(5)
4.3.2 Expert Panel Design
An expert panel was formed to evaluate and validate the survey instrument.
Having between six to twelve experts is recommended as an ideal number in an expert
panel to achieve manageable results while having diverse perspectives [215]. It is
recommended to obtain experts with different backgrounds to ensure a better base of
119
expertise and knowledge [216]. It is very critical to select experts who have a sufficient
level of experience and knowledge on the subject under consideration. Also, it is
important that the experts are willing and able to provide a useful point-of-view in the
issue under consideration. Scholars provide numerous criteria that can be utilized when
selecting experts and forming an expert panel [217, 218]:
Knowledge and experience in the subject under consideration.
Willingness and availability to participate in the research.
Providing diversity among experts with the field of interest.
Obtaining a balanced viewpoint among experts to compensate for
individual biases on the outcome.
Insuring absence of obvious conflicts among experts and insuring absence
of influence of personality and position.
When selecting individuals to form the expert panel for this research, the above
recommended criteria were considered and utilized to gain better results. Moreover, to
insure diversity and gain better points of view, the experts were selected from related
academia, the mobile industry, mobile services providers and experienced Smartphone
users. Initially around twenty experts were invited to participate in evaluating and
validating the research survey instrument. A total of nine experts actually participated in
this expert panel.
120
This dissertation aims to study and explore the factors that influence users to
adopt and use the smartphones, especially in Saudi Arabia. Therefore, the survey
questionnaire has been translated from the English into Arabic. After experts evaluated
and validated the survey questionnaires, any suggested modifications were
implemented. A pilot test was then conducted. A web survey was developed and
administered to a group of PhD students from the engineering and technology
management (ETM) department who are smartphones users as well. After the
modifications of the English version, the survey questionnaires were translated from
English into Arabic. In order to validate the translation of the survey questions, a second
group of experts were selected to form an expert panel. These experts were asked to
evaluate and validate the translation of the survey questionnaire from English into
Arabic to insure that the survey is clear and has an equivalent norm. When selecting the
experts for validating the translation of the survey questions, the same criteria that
were used in forming the first expert panel were applied in addition to the following
criteria:
Experts should be knowledgeable and fluent in both English and Arabic.
Experts should be willing to participate in the panel.
Experts should have knowledge about terminology involved in the subject
that will be translated.
Experts should be familiar with Smartphone technology
121
There are many ways that experts can be contacted and invited to participate in
survey activities such as email, phone calls, or in-person face-to-face invitations.
Electronic mail is considered as quicker, cheaper and usually more effective as a means
of communication [219, 203, 220]. For this study, a combination of these methods were
used to approach and invite participants in the expert panels and provide them with
related information.
It was anticipated that a number of the experts who initially agreed to
participate in the panel would not actually be able to participate. Therefore, twenty
experts were initially invited with the goal of having six to twelve experts actually
participate. Those who agreed to participate were provided with all information related
to the survey questionnaire. Also, the participants were provided with a validation tool,
such as the one shown in Table 19, to be used in validating the translation of the
questions (validating tool in Appendix E). They were asked to review the translation of
each question and make sure it accurately reflected the English version of the question.
After validating the translation of the survey questionnaire from English into
Arabic, the survey questionnaire was translated back into English and experts were
asked to validate the translation back to English to insure the equivalence norm once
again. Based on the experts’ review, comments and validation regarding the question,
the translation was modified accordingly. A tool was developed and provided to the
experts for use in validating the questions’ translation. It is similar to the questions
translation tool in Table 19 (please see Appendix E). The validation tool was utilized to
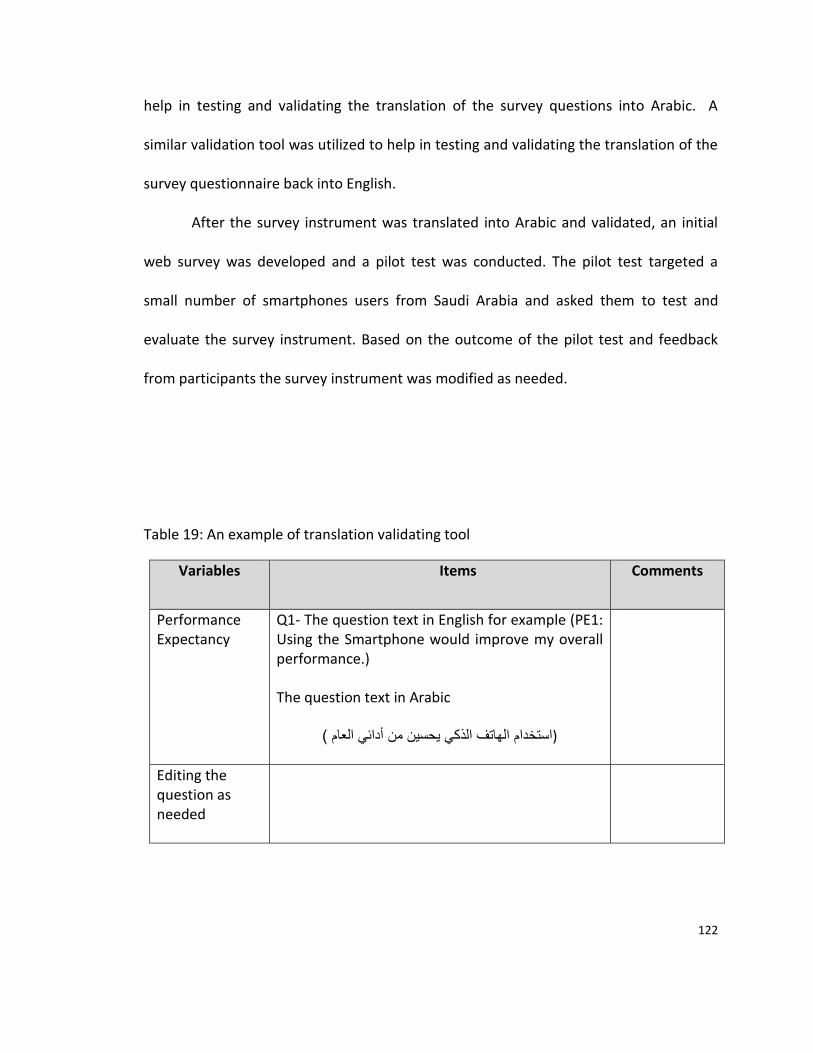
122
help in testing and validating the translation of the survey questions into Arabic. A
similar validation tool was utilized to help in testing and validating the translation of the
survey questionnaire back into English.
After the survey instrument was translated into Arabic and validated, an initial
web survey was developed and a pilot test was conducted. The pilot test targeted a
small number of smartphones users from Saudi Arabia and asked them to test and
evaluate the survey instrument. Based on the outcome of the pilot test and feedback
from participants the survey instrument was modified as needed.
Table 19: An example of translation validating tool
Variables Items Comments
Performance Expectancy
Q1- The question text in English for example (PE1: Using the Smartphone would improve my overall performance.)
The question text in Arabic
(استخدام الهاتف الذكي يحسين من أدائي العام (
Editing the question as needed
123
4.3.3 Reliability
To test and assess the reliability of the survey instrument, a number of
measurement methods have been utilized. Reliability refers to “the consistency of the
scores obtained,” it is concerned with evaluation of how each individual administration
of the survey instruments maintains consistency to another and how consistency is
maintained from one set of items to another set [204]. A number of commonly used
methods are recommended to measure instrument reliability namely the test-retest
method, the equivalent forms method, and the internal consistency method [203, 204]:
The test-retest method tests the reliability of the instrument by testing
the effect in a different time period [203, 204]. Using this method, the
same test will be administrated a second time to the same subjects after
a specific interval of time [203, 204].
Equivalent forms method measures the “degree to which alternative
forms of the same measure produce the same or similar results” [203].
Two identical forms of an instrument are administrated simultaneously to
the same groups of individual [204].
Internal consistency is the measurement of to what degree an
instrument’s items are homogeneous and reflect the same underlying
factor or variable [203]. Internal consistency can be measured using a
split-half, KR20 or Cronbach’s alpha [203, 204]. The Cronbach’s alpha
coefficient was developed by Lee Cronbach in 1951 to assess the
124
reliability measurement [221]. It is a widely-utilized measure to
determine the internal consistency in a survey instrument to test its
reliability [204, 222]. In a Cronbach’s alpha measurement, values range
from 0.0 to 1.0 and a value closer to 1 indicates a higher level of reliability
among the indicators. A Cronbach’s Alpha value greater than 0.7
indicates that the factor and indicators have good and acceptable levels
of internal consistency and reliability [214, 223]. To assess the reliability
of the survey instrument in this dissertation, Cronbach’s alpha
measurement was conducted to test the internal consistency for each
factor.
4.4 Instrument Validation
To insure the quality and validity of the survey for this dissertation, the survey
instrument has been reviewed and validated. Content validation has been assessed an
expert panel in which experts were asked to provide their judgment and opinions about
the survey items regarding two main aspects:
The first aspect was how well each item represents the intention of the
variable/factor it intended to measure.
The second aspect was how easy it was for the targeted participants to answer
each survey item. A tool was developed to obtain experts’ judgments regarding
survey instrument content validation.
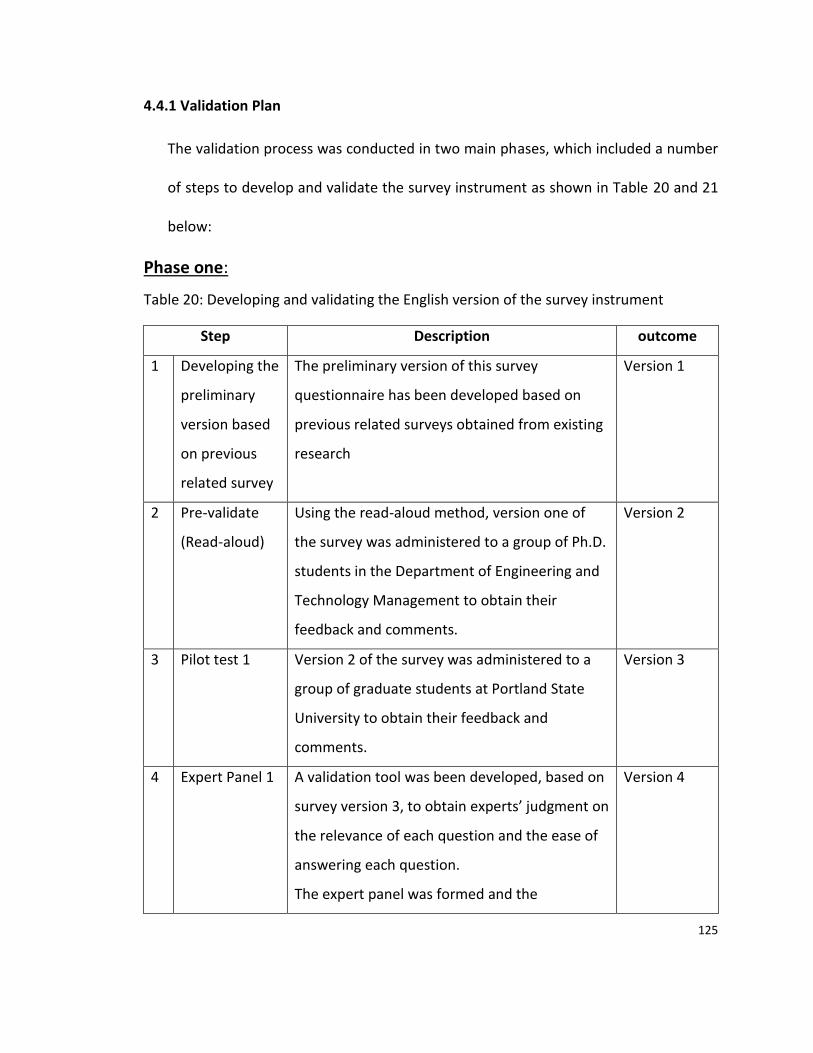
125
4.4.1 Validation Plan
The validation process was conducted in two main phases, which included a number
of steps to develop and validate the survey instrument as shown in Table 20 and 21
below:
Phase one:
Table 20: Developing and validating the English version of the survey instrument
Step Description outcome
1 Developing the
preliminary
version based
on previous
related survey
The preliminary version of this survey
questionnaire has been developed based on
previous related surveys obtained from existing
research
Version 1
2 Pre-validate
(Read-aloud)
Using the read-aloud method, version one of
the survey was administered to a group of Ph.D.
students in the Department of Engineering and
Technology Management to obtain their
feedback and comments.
Version 2
3 Pilot test 1 Version 2 of the survey was administered to a
group of graduate students at Portland State
University to obtain their feedback and
comments.
Version 3
4 Expert Panel 1 A validation tool was been developed, based on
survey version 3, to obtain experts’ judgment on
the relevance of each question and the ease of
answering each question.
The expert panel was formed and the
Version 4
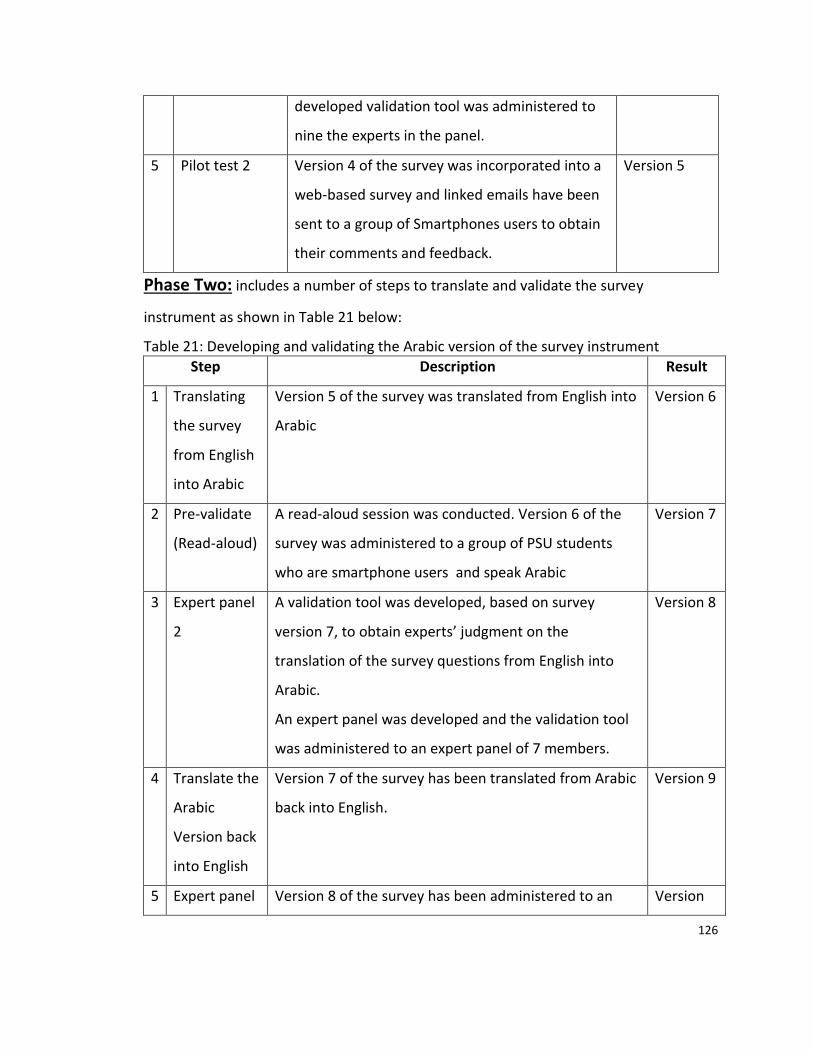
126
developed validation tool was administered to
nine the experts in the panel.
5 Pilot test 2 Version 4 of the survey was incorporated into a
web-based survey and linked emails have been
sent to a group of Smartphones users to obtain
their comments and feedback.
Version 5
Phase Two: includes a number of steps to translate and validate the survey
instrument as shown in Table 21 below:
Table 21: Developing and validating the Arabic version of the survey instrument
Step Description Result
1 Translating
the survey
from English
into Arabic
Version 5 of the survey was translated from English into
Arabic
Version 6
2 Pre-validate
(Read-aloud)
A read-aloud session was conducted. Version 6 of the
survey was administered to a group of PSU students
who are smartphone users and speak Arabic
Version 7
3 Expert panel
2
A validation tool was developed, based on survey
version 7, to obtain experts’ judgment on the
translation of the survey questions from English into
Arabic.
An expert panel was developed and the validation tool
was administered to an expert panel of 7 members.
Version 8
4 Translate the
Arabic
Version back
into English
Version 7 of the survey has been translated from Arabic
back into English.
Version 9
5 Expert panel Version 8 of the survey has been administered to an Version
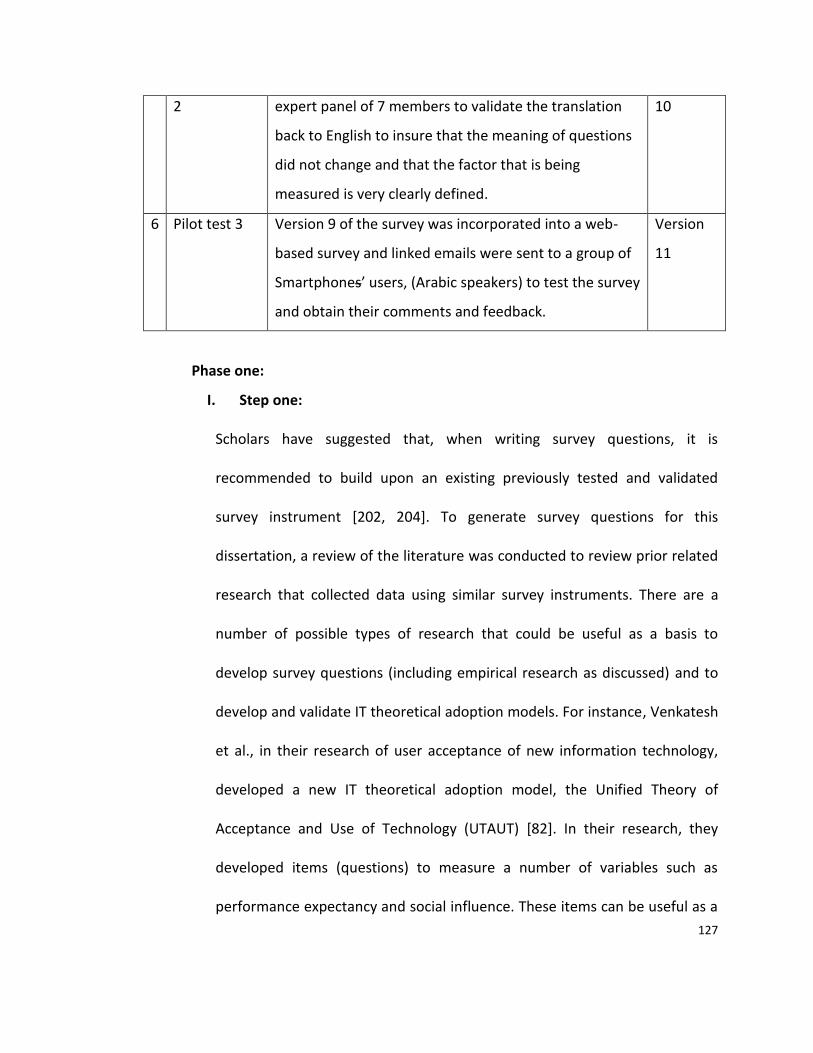
127
2 expert panel of 7 members to validate the translation
back to English to insure that the meaning of questions
did not change and that the factor that is being
measured is very clearly defined.
10
6 Pilot test 3 Version 9 of the survey was incorporated into a web-
based survey and linked emails were sent to a group of
Smartphones’ users, (Arabic speakers) to test the survey
and obtain their comments and feedback.
Version
11
Phase one:
I. Step one:
Scholars have suggested that, when writing survey questions, it is
recommended to build upon an existing previously tested and validated
survey instrument [202, 204]. To generate survey questions for this
dissertation, a review of the literature was conducted to review prior related
research that collected data using similar survey instruments. There are a
number of possible types of research that could be useful as a basis to
develop survey questions (including empirical research as discussed) and to
develop and validate IT theoretical adoption models. For instance, Venkatesh
et al., in their research of user acceptance of new information technology,
developed a new IT theoretical adoption model, the Unified Theory of
Acceptance and Use of Technology (UTAUT) [82]. In their research, they
developed items (questions) to measure a number of variables such as
performance expectancy and social influence. These items can be useful as a
128
basis to build upon and develop new questions (items) to measure similar
variables. Another type of research is empirical research that utilizes similar
variables to study topics related to the adoption and use of Smartphone
technology. For instance, Carlsson et al., in their study of adoption of mobile
devices and services, developed a survey questionnaire that included
questions (items) developed to measure similar variables such as
performance expectancy [208]. Therefore, for this research, a similarly tested
survey instrument used in previous related research was reviewed and
utilized to survey questions. The questions in the initial survey questionnaire
were adopted from a number of survey instruments that were developed
and validated in previous related research [164, 208, 171, 82, 191].
Step Two:
The read-aloud method is a useful approach that has been used to obtain
participants’ opinions and comments in order to develop a survey instrument
[219]. In this case, the read-aloud method has been utilized to obtain
participants’ opinions and help in developing the initial version of the survey
instrument for this dissertation. A group of Ph.D. students from the
Department of Engineering and Technology Management at Portland State
University have been invited to participate in a read-aloud session. Six
students choose to participate. The first version of the survey that was
developed in this process was administrated to the participants.
129
The researcher prepared a conference meeting room at the
department of Engineering and Technology Management and provided the
needed materials to conduct the read-aloud session. A hard copy of the first
modified version of the survey questionnaire was provided to each
participant. The researcher asked participants to voluntarily read aloud each
question in the survey and provide their comments. Participants read each
question, discussed it with the rest of the group and provided their
comments accordingly. The session took around 45 minutes to complete.
The outcome of this read aloud session was reviewed and applied
into the survey questionnaire as applicable. The comments and feedback
from each participant were also reviewed and applied into the survey
questionnaire. Version 2 of the survey was established.
II. Step Three
The researcher contacted a number of graduate students at
Portland State University and invited them to participate in a pilot test for a
survey questionnaire. The researcher explained to the participants that as a
smartphone user he or she would be given a hard copy of the survey and
asked to read the survey questions and provide their feedback about the
survey questionnaire. Thirteen students participated in this pilot test,
reviewing version 2 of the survey questionnaire. Based on participants’
preference and availability, a soft copy of the survey was emailed or a hard
130
copy of the survey was provided in person to each of them. The feedback
from each participant was reviewed. The survey questionnaire was modified
accordingly and version 3 of the survey was established.
III. Step Four
Experts’ panels are a very popular method that has been used in
many previous research studies to assess and validate survey questionnaires.
Six to twelve experts are recommended as an ideal number to achieve
manageable results while having diverse perspectives [215]. Moreover,
scholars suggested obtaining experts with different backgrounds to ensure a
better base of expertise and diversified knowledge [216].
An expert panel was developed and formed to review and validate
the survey questionnaire. The researcher targeted 21 experts from the
academic and industry sectors related to the smartphones industry and
invited them to participate in this expert panel, insuring diverse background
and knowledge. Thirteen experts agreed to participate in the expert panel
and nine ended up as the actual participants (See Table 23 below). Version 3
of the survey questionnaire was used in developing a tool designed to be
used by experts to review, modify and validate the survey instrument (see
Appendix E).
131
The feedback from each expert has been reviewed and applied. The
survey questionnaire has been modified accordingly and version 4 has been
established.
In a number of previous desertions the acceptable score is 4 –
Somewhat Closely for relevance and 4- Somewhat Easy for ease of
answering questions [219, 224]. Accordingly, after incorporating experts’
feedback, the goal in this dissertation is to have all surrey questions score
above 4 – Somewhat Closely for relevance and 4- Somewhat Easy for
ease of answering questions.
Meeting these goals could help demonstrate that the survey is well
developed, suited for the research objective, and easy to answer the
questions. As shown in Table 22, the results were encouraging.
The validation results show that the average relevance score was
(4.50) out of 5 and the average ease of answering was (4.36) of 5. To be
consistent with the goal of having scores above 4 points for both
indicators, relevance and ease of answering question, ease of answering
question 9 (3.78), question 14 (3.67) and relevance question 8 (3.89)
were identified for improvement and modification.
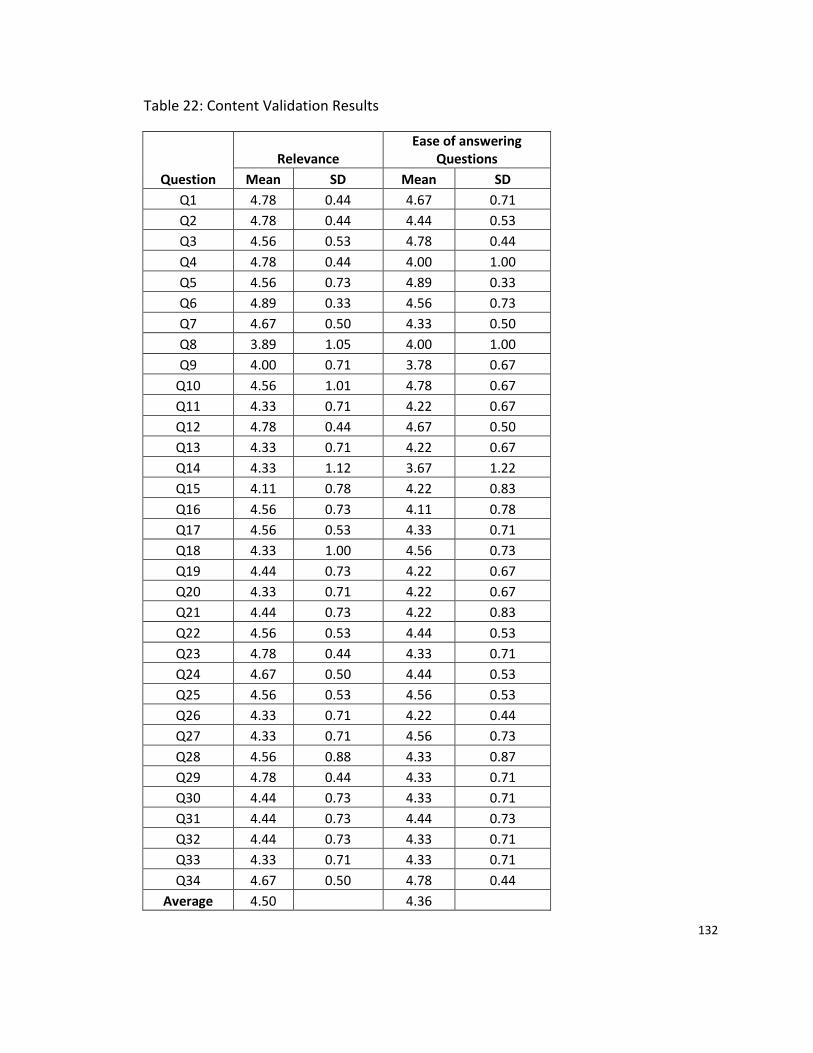
132
Table 22: Content Validation Results
Question
Relevance Ease of answering
Questions
Mean SD Mean SD
Q1 4.78 0.44 4.67 0.71
Q2 4.78 0.44 4.44 0.53
Q3 4.56 0.53 4.78 0.44
Q4 4.78 0.44 4.00 1.00
Q5 4.56 0.73 4.89 0.33
Q6 4.89 0.33 4.56 0.73
Q7 4.67 0.50 4.33 0.50
Q8 3.89 1.05 4.00 1.00
Q9 4.00 0.71 3.78 0.67
Q10 4.56 1.01 4.78 0.67
Q11 4.33 0.71 4.22 0.67
Q12 4.78 0.44 4.67 0.50
Q13 4.33 0.71 4.22 0.67
Q14 4.33 1.12 3.67 1.22
Q15 4.11 0.78 4.22 0.83
Q16 4.56 0.73 4.11 0.78
Q17 4.56 0.53 4.33 0.71
Q18 4.33 1.00 4.56 0.73
Q19 4.44 0.73 4.22 0.67
Q20 4.33 0.71 4.22 0.67
Q21 4.44 0.73 4.22 0.83
Q22 4.56 0.53 4.44 0.53
Q23 4.78 0.44 4.33 0.71
Q24 4.67 0.50 4.44 0.53
Q25 4.56 0.53 4.56 0.53
Q26 4.33 0.71 4.22 0.44
Q27 4.33 0.71 4.56 0.73
Q28 4.56 0.88 4.33 0.87
Q29 4.78 0.44 4.33 0.71
Q30 4.44 0.73 4.33 0.71
Q31 4.44 0.73 4.44 0.73
Q32 4.44 0.73 4.33 0.71
Q33 4.33 0.71 4.33 0.71
Q34 4.67 0.50 4.78 0.44
Average 4.50
4.36
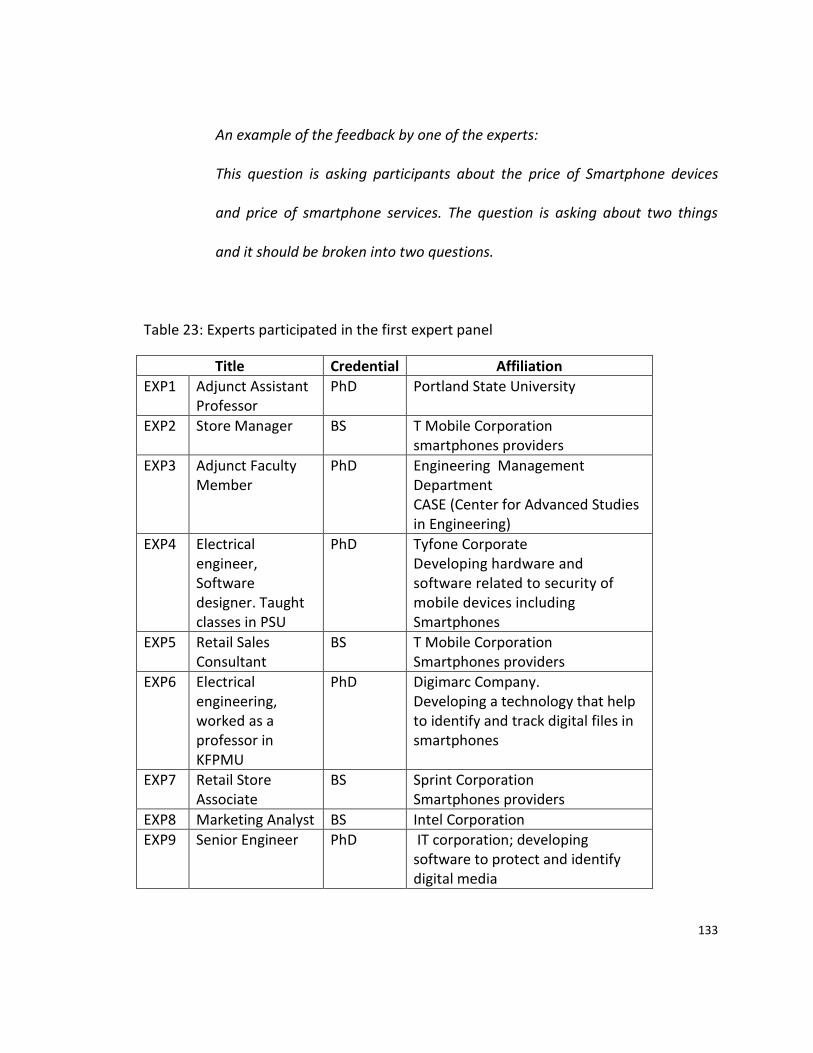
133
An example of the feedback by one of the experts:
This question is asking participants about the price of Smartphone devices
and price of smartphone services. The question is asking about two things
and it should be broken into two questions.
Table 23: Experts participated in the first expert panel
Title Credential Affiliation
EXP1 Adjunct Assistant Professor
PhD Portland State University
EXP2 Store Manager
BS T Mobile Corporation smartphones providers
EXP3 Adjunct Faculty Member
PhD Engineering Management Department CASE (Center for Advanced Studies in Engineering)
EXP4 Electrical engineer, Software designer. Taught classes in PSU
PhD Tyfone Corporate Developing hardware and software related to security of mobile devices including Smartphones
EXP5 Retail Sales Consultant
BS T Mobile Corporation Smartphones providers
EXP6 Electrical engineering, worked as a professor in KFPMU
PhD Digimarc Company. Developing a technology that help to identify and track digital files in smartphones
EXP7 Retail Store Associate
BS Sprint Corporation Smartphones providers
EXP8 Marketing Analyst BS Intel Corporation
EXP9 Senior Engineer PhD IT corporation; developing software to protect and identify digital media
134
IV. Step Five
The Pilot Test approach has been used in a number of previous related
research studies to develop, modify and validate survey instruments. Version
four of the survey questionnaire has been incorporated into a web-based
survey and a link has been emailed to a number of students at Portland State
University who are Smartphone users. Seventeen students have participated
in the web-based pilot test and provided their feedback. Please see the
screenshot of the web-based pilot test in Figure 8 below.
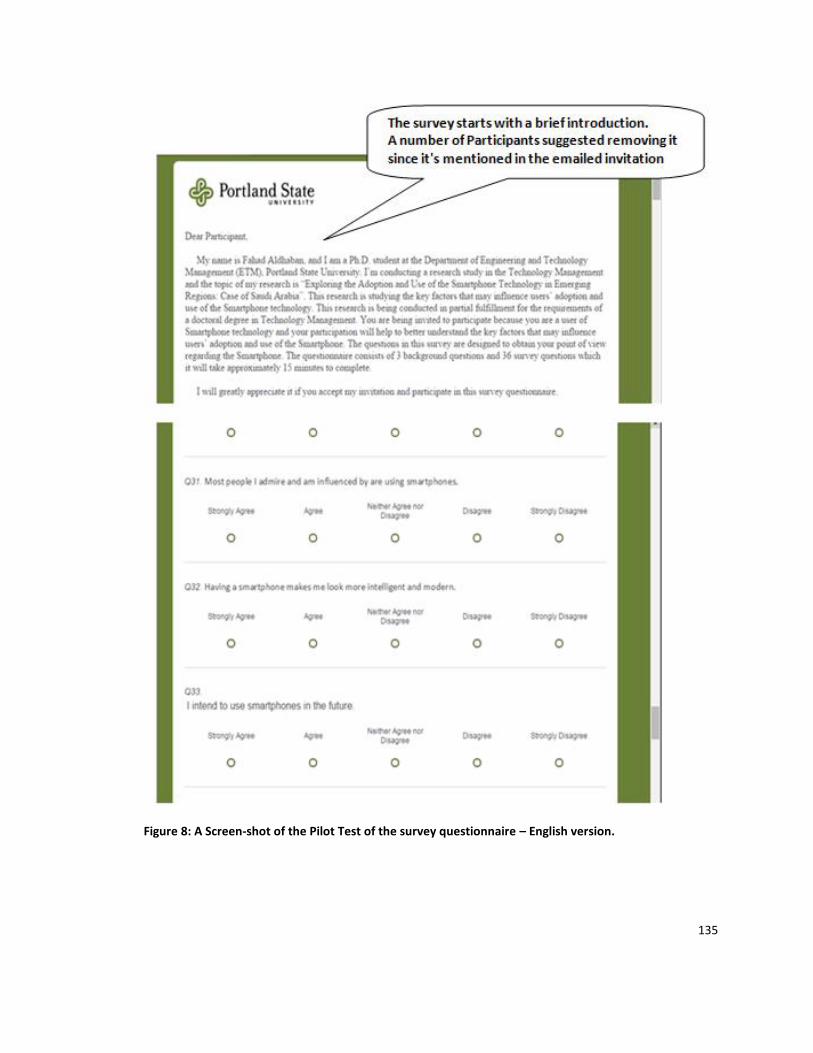
135
Figure 8: A Screen-shot of the Pilot Test of the survey questionnaire – English version.
136
An example of the feedback by participants in the pilot test:
I think the survey questions are good. Since your email invitation
includes all information that you provide in the heading of the Web- based
survey, I think it is better to remove the introduction from the web page and
start with the questions. It is repetitive and it does not provide new
information other than that mentioned in the email invitation.
The researcher discussed this thought with other participants and
they also recommended removing the introduction header from the web-
based survey since it is provided in the email invitation. The researcher
removed the introduction from the survey, thus starting the survey with
questions. Feedback from each participant was reviewed and applied to the
survey questionnaire as applicable. The survey questionnaire was modified
accordingly and Version 5 of the survey was established.
Phase Two:
I. Step One:
This survey instrument is intended to collect data from Smartphone
users in Saudi Arabia, therefore, the final version (5) has been translated from
English into Arabic. The researcher used a number of translation applications
and software, including Google translation, to ensure more accurate
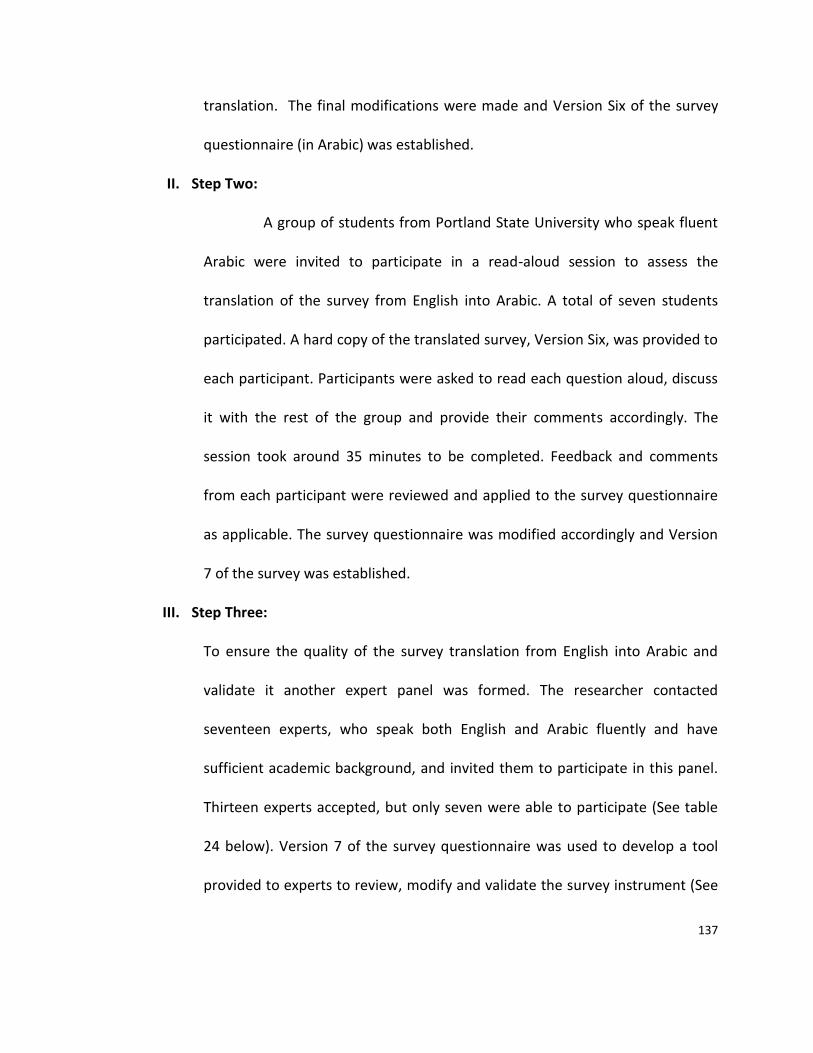
137
translation. The final modifications were made and Version Six of the survey
questionnaire (in Arabic) was established.
II. Step Two:
A group of students from Portland State University who speak fluent
Arabic were invited to participate in a read-aloud session to assess the
translation of the survey from English into Arabic. A total of seven students
participated. A hard copy of the translated survey, Version Six, was provided to
each participant. Participants were asked to read each question aloud, discuss
it with the rest of the group and provide their comments accordingly. The
session took around 35 minutes to be completed. Feedback and comments
from each participant were reviewed and applied to the survey questionnaire
as applicable. The survey questionnaire was modified accordingly and Version
7 of the survey was established.
III. Step Three:
To ensure the quality of the survey translation from English into Arabic and
validate it another expert panel was formed. The researcher contacted
seventeen experts, who speak both English and Arabic fluently and have
sufficient academic background, and invited them to participate in this panel.
Thirteen experts accepted, but only seven were able to participate (See table
24 below). Version 7 of the survey questionnaire was used to develop a tool
provided to experts to review, modify and validate the survey instrument (See
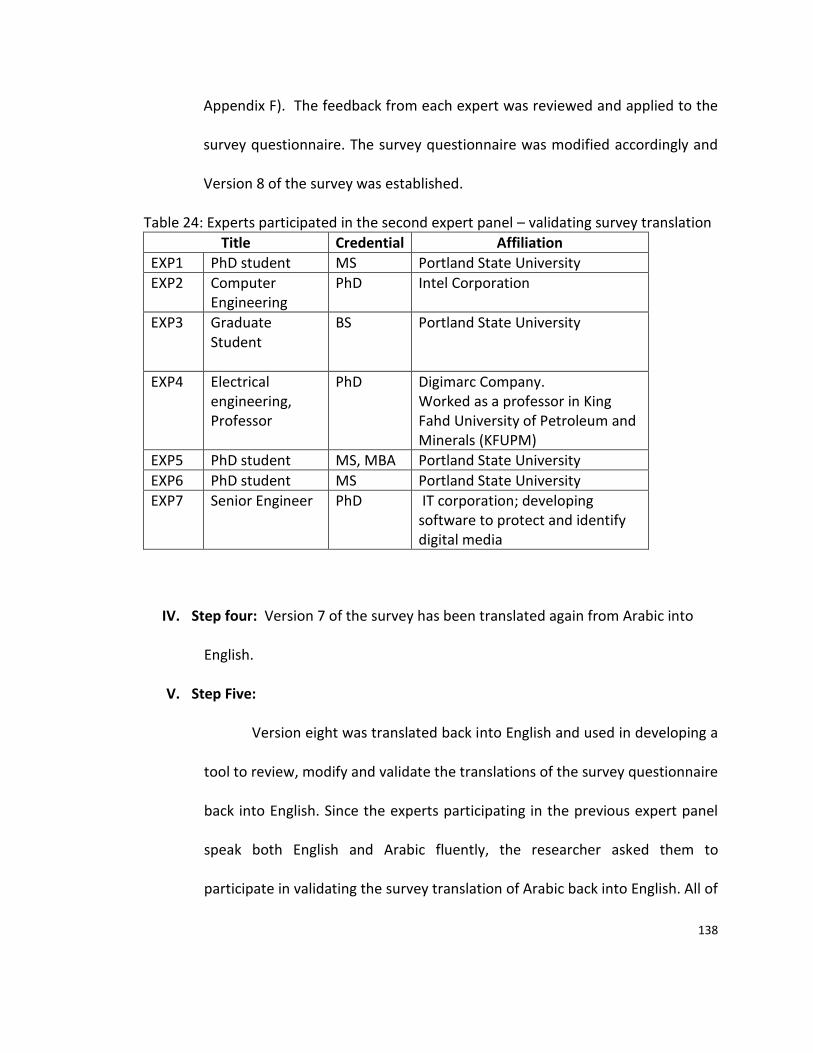
138
Appendix F). The feedback from each expert was reviewed and applied to the
survey questionnaire. The survey questionnaire was modified accordingly and
Version 8 of the survey was established.
Table 24: Experts participated in the second expert panel – validating survey translation
Title Credential Affiliation
EXP1 PhD student MS Portland State University
EXP2 Computer Engineering
PhD Intel Corporation
EXP3 Graduate Student
BS Portland State University
EXP4 Electrical engineering, Professor
PhD Digimarc Company. Worked as a professor in King Fahd University of Petroleum and Minerals (KFUPM)
EXP5 PhD student MS, MBA Portland State University
EXP6 PhD student MS Portland State University
EXP7 Senior Engineer PhD IT corporation; developing software to protect and identify digital media
IV. Step four: Version 7 of the survey has been translated again from Arabic into
English.
V. Step Five:
Version eight was translated back into English and used in developing a
tool to review, modify and validate the translations of the survey questionnaire
back into English. Since the experts participating in the previous expert panel
speak both English and Arabic fluently, the researcher asked them to
participate in validating the survey translation of Arabic back into English. All of
139
the seven experts initially agreed to participate; however, only five actually
participated along with one newly recruited expert (see Table 25 of experts
below). The feedback from each expert was reviewed and applied as
applicable. The survey questionnaire was modified accordingly and Version 9
of the survey was established.
Table 25: Experts panel 3 – validating survey translation back to English
Title Credential Affiliation
EXP1 Graduate
Student
MS Oregon State University
EXP2 Computer
Engineering
PhD Intel Corporation
EXP3 Electrical
engineering,
Professor
PhD Digimarc Company.
Worked as a professor in King
Fahd University of Petroleum and
Minerals (KFUPM)
EXP4 PhD student MS, MBA Portland State University
EXP5 PhD student MS Portland State University
EXP6 Senior Engineer PhD IT corporation; developing
software to protect and identify
digital media
VI. Pilot Test
Version 9 of the survey questionnaire was incorporated into a web-
based survey and a link was emailed to a number of students at Portland State
University who are Smartphone users plus other smartphones users all of
140
whom speak Arabic fluently. Seventeen participants participated in the web-
based pilot test and provided their feedback. Please see the screenshot of the
web-based pilot test.
An example of the feedback by participants in the pilot test:
“the survey questions are all listed in one long page which makes it look like a
long survey. I think it is better to break it into a number of pages where
participants can go to the next page and not feel it is a very long survey.”
The researcher discussed this thought with the other participants and
they also recommended breaking it into several pages. The researcher
therefore broke the survey into more pages. Feedback from each participant
was reviewed and applied to the survey questionnaire, which was modified
accordingly so that the final version of the survey questionnaire could be
established and activated. (A screenshot of the final survey is presented in
figure 9 below)
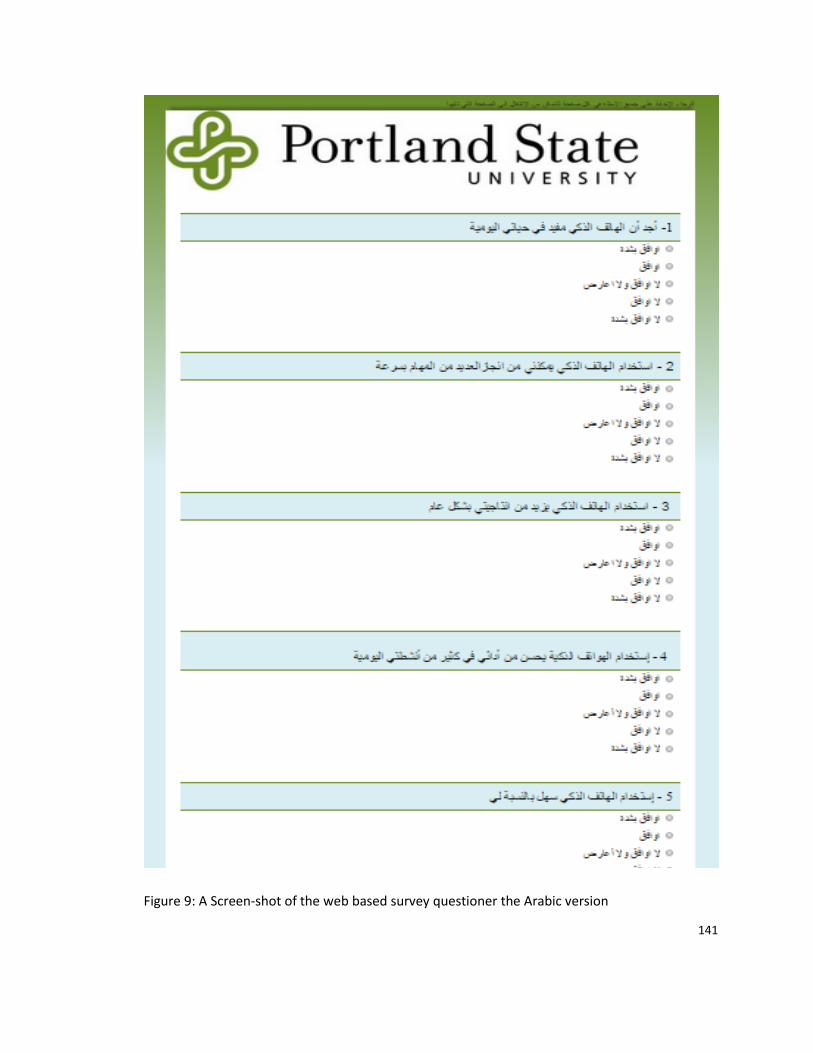
141
Figure 9: A Screen-shot of the web based survey questioner the Arabic version
142
4.5 Instrument Administration
There are two main approaches to administration of a survey: structured
interviews and self-completion questionnaires [225]. When using self-completion
questionnaires, there are three types that can be utilized: supervised, postal, and
internet [225]. The internet web-based survey is growing in popularity and commonly
utilized among researchers for many reasons including the following [226, 225, 227-
229]:
More economical than other methods
Time effective: it can reach a larger group of participants instantly and get their
responses as soon as it is completed
Enables researcher to reach large numbers of participants
Eliminates the distance problem
More manageable
Enables researcher to add audio or video if needed
More flexible
For this dissertation an internet web-based survey was developed and
administered since it has many advantages and it seems to be the most appropriate
approach. A number of principles have been suggested when designing a web-based
survey to improve the quality of the survey and reduce errors [230]:
Design a nice welcoming screen and smooth instruction
Start the survey with the most interesting question
143
Questions should be presented in a form that is similar to a paper-based survey
Use care with color so the clarity of the survey questions is not effected
Provide the needed instruction for various participants
Keep survey appearance consistent
Open ended questions should be avoided
The above suggestions have been applied when designing the survey instrument
for this dissertation to improve quality and reduce errors wherever possible. A number
of major steps have been conducted in designing and conducting data through a web-
based survey including:
• A web-based survey has been designed with Arabic characters using survey
design software available through and provided by Portland State
University which can be seen in (portlandstate.qualtrics.com)
• The targeted respondents have been contacted by email that included a
link to the web-based survey. The email included an invitation for
Smartphone users to participate in the survey by answering the questions.
Also the email included a brief introduction to the research, encouraged
participation and insured them that participation is total voluntarily.
• Reminder emails or follow ups sent to the participant of the web survey is
recommended and has a positive impact on increasing the response rate
144
[231]. Therefore, follow up emails that target participants were sent to
remind participants about the survey and encourage them to participate.
4.5.1 Sampling
The idea of sampling was described as: “by selecting some elements of a
population, we can draw a conclusion about the [overall] population” [203]. The subject
of interest for a research study, from which a sample will be selected, is called
population, which should always be identified in the research [213]. A population is
defined as “the set of all the individuals of interest in a particular study” [213]. A
population can be as large as all the children on the planet earth or it can be more
specific as a set of children in a specific school who have certain type of talent. A
population can be a set of people, animal, plants, products, services or anything that a
researcher wants to study and examine.
Even though the researcher’s interest is about the whole population under
consideration, it is generally impossible to investigate each individual case of the whole
population. Therefore, a smaller group that intended to represent the targeted
population can be selected from the population so that the researcher can manage to
test the majority of individuals in this selected group. The group of individuals that is
selected from a specific population set is called a sample. A sample in a research study
can be defined as a set of selected individuals from a specific population, intended to
145
represent the population of interest [203, 213]. There are a number of issues that
usually associated with sampling process, including:
Sampling error:
Sampling error is identified as “the discrepancy, or amount of error, that exists
between a sample statistic and the corresponding population parameter” [213]. The
sample statistic refers to a value, usually numerical, that describes or represents a
sample. Population parameter is a value that describes a population [213]. In a specific
population there are a number of possible samples that can be selected to represent the
specific population and each of these samples contain different individuals with
different values. Therefore the difference between any two possible samples from the
same population is called a sampling error. This difference, or sampling error, can be
accounted for as a percentage of error that can happen only as a chance of sampling
error. Therefore, the researcher usually defines the percentage of sampling error that
can be acceptable in their particular research.
Reasons for sampling:
There are a number of important reasons for sampling [203, 232, 233]:
Cost is one of the most compelling reasons to use sampling instead of testing the
whole population. It would be very costly to get every individual in a population
to participate in a given research study. Therefore sampling can save the
researcher(s) a considerable amount of cost and still enable them to draw a valid
conclusion about the targeted population.
146
Time effectiveness: sampling can save the researcher a great amount of time and
effort since its less time consuming to test a sample then to test a whole
targeted population.
Availability of population elements: sampling can enable the researcher to test
and study a targeted population especially when the population is large, hard to
reach and infinite.
Better accuracy of results: sampling often has better supervision, processing, and
testing for missing data, which can increase the quality and accuracy of the
results.
When sampling there are recommended steps that researchers usually follow
including: [202, 203, 234] :
Determining the target population
Determining a sampling frame
Choosing a sampling method
Determining the sample size needed
Drawing the sample
Based on the steps above, the sampling for this research has followed a number
of steps and it is as following:
The targeted population: in this dissertation the researcher is aiming to study
the general users of the Smartphone from one of the four main
147
telecommunication companies in Saudi Arabia. The population of Saudi Arabia is
around 21 million Saudi citizens and around 10 million foreigners [56]. According
to the Saudi Communication and Information Technology Commission, the
number of mobile subscribers increased significantly in Saudi Arabia, primarily
the prepaid subscriber type. This indicates that there are around 42% mobile
broadband subscribers in the total population, which includes Smartphone
subscribers [235]. The penetration of smartphones technology in Saudi Arabia is
estimated to be around 51.3% for the year 2014 [236]. Therefore, the targeted
population in this research is Saudi citizens aged 18 years and older who are
smartphones users.
Sampling frame: There are four main telecommunications companies in Saudi
Arabia, which provide mobile services, including Smartphone services. The four
companies are Saudi Telecom Company (STC), Mobily, Zain Telecom and Bravo
Telecom. Each company has an equal chance of providing mobile services,
including Smartphone technology, to all type of customers [237]. Each company
has its own main branches and sub-branches in all major regions of Saudi Arabia.
Due to the time, cost and effort needed to collect data, the author intends to
limit the research sampling frame to 5,000 smartphones users who have been
randomly selected from one of these four Saudi telecommunications companies.
148
Sampling Method: Simple random sampling is that in which every element of
the population has an equal chance to be selected. In this dissertation simple
random sampling has been used when select the targeted sample subjects.
Sample size needed:
When using the Structural Equation Modeling (SEM) method, it is recommended
to obtain at least 10 observations for each indicator (item) to set the lower
boundary for an appropriate sample size [238-242]. Another suggestion
indicated that the minimum sample size can be indicated by the use of the ratio
(r) of indicators to the latent variables where r = P/K; P is the indicator variables
and the K is the latent variables [243, 244]. Based on this ratio suggestion, if r =
3, it would require a sample size of at least 200 cases, and if r = 2 it would
require a sample size of at least 400 cases [245-247]. For setting the lower
boundary of sample size in a medium complexity SEM model, it was suggested to
obtain at least 200 cases [248, 249]. Hair suggested that, when using SEM to
analyze, for a model with seven or less, construction of a minimum sample size
of 300 cases is required and for a model with a larger number of factors and with
fewer than three measured items, a minimum sample size of 500 cases are
required [214].
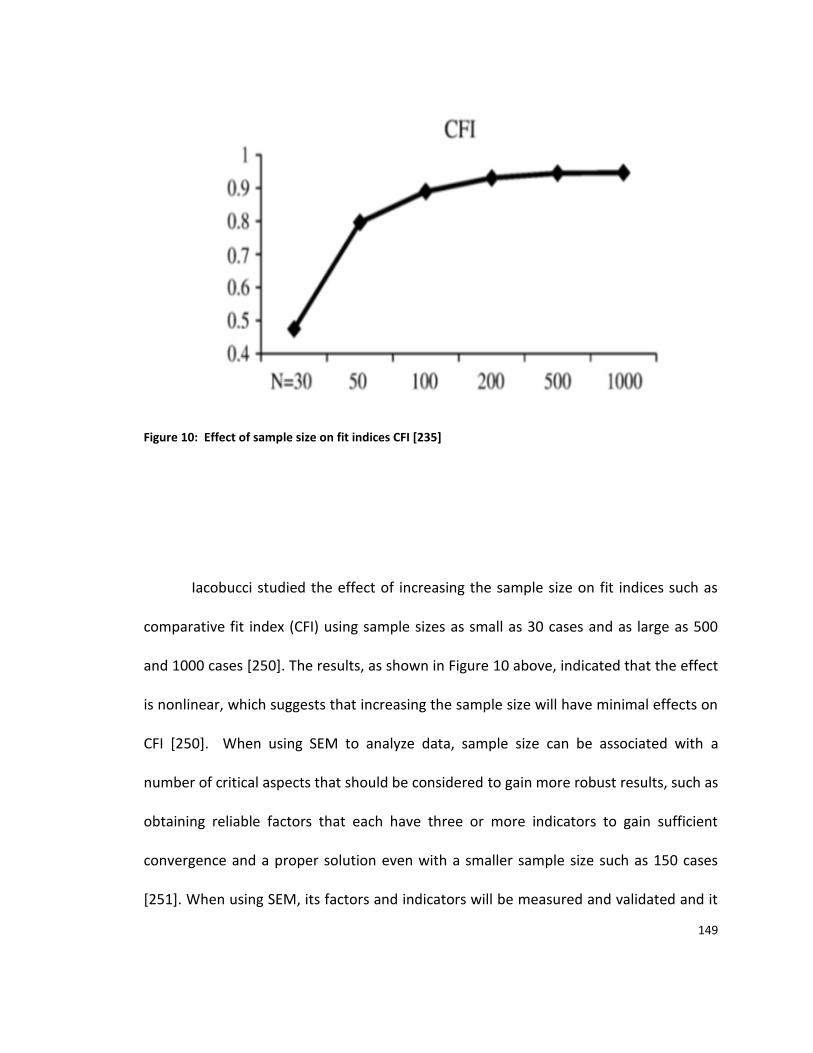
149
Figure 10: Effect of sample size on fit indices CFI [235]
Iacobucci studied the effect of increasing the sample size on fit indices such as
comparative fit index (CFI) using sample sizes as small as 30 cases and as large as 500
and 1000 cases [250]. The results, as shown in Figure 10 above, indicated that the effect
is nonlinear, which suggests that increasing the sample size will have minimal effects on
CFI [250]. When using SEM to analyze data, sample size can be associated with a
number of critical aspects that should be considered to gain more robust results, such as
obtaining reliable factors that each have three or more indicators to gain sufficient
convergence and a proper solution even with a smaller sample size such as 150 cases
[251]. When using SEM, its factors and indicators will be measured and validated and it
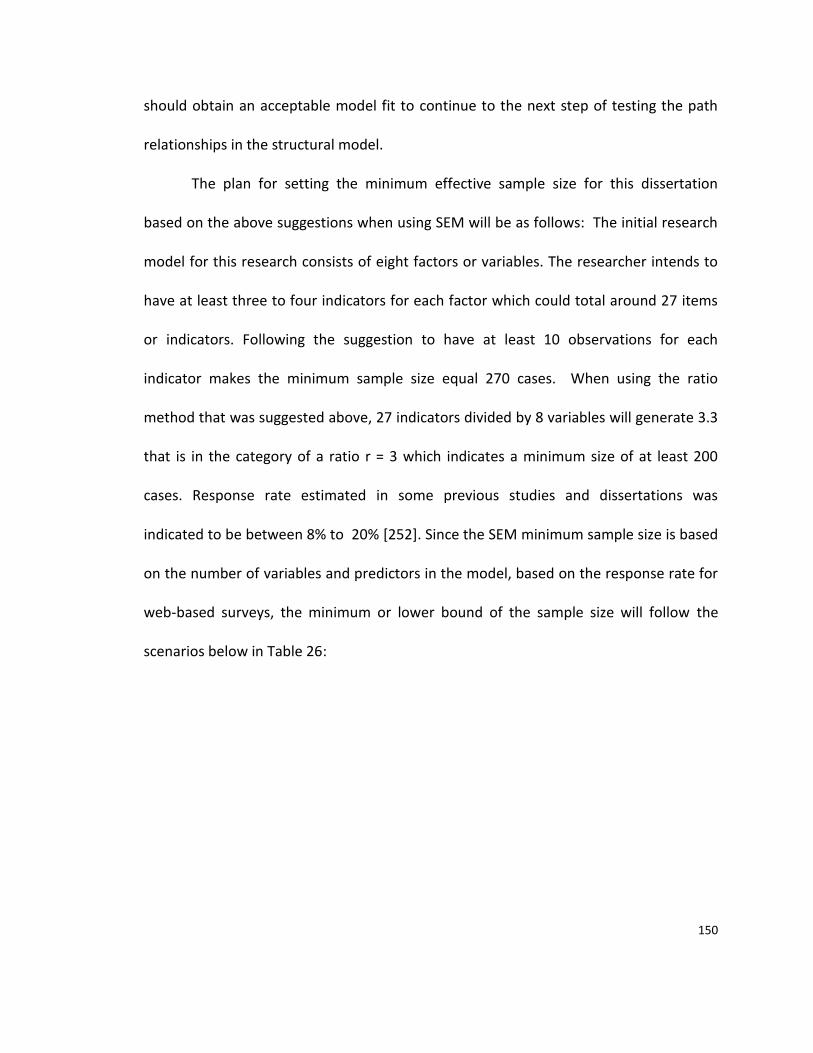
150
should obtain an acceptable model fit to continue to the next step of testing the path
relationships in the structural model.
The plan for setting the minimum effective sample size for this dissertation
based on the above suggestions when using SEM will be as follows: The initial research
model for this research consists of eight factors or variables. The researcher intends to
have at least three to four indicators for each factor which could total around 27 items
or indicators. Following the suggestion to have at least 10 observations for each
indicator makes the minimum sample size equal 270 cases. When using the ratio
method that was suggested above, 27 indicators divided by 8 variables will generate 3.3
that is in the category of a ratio r = 3 which indicates a minimum size of at least 200
cases. Response rate estimated in some previous studies and dissertations was
indicated to be between 8% to 20% [252]. Since the SEM minimum sample size is based
on the number of variables and predictors in the model, based on the response rate for
web-based surveys, the minimum or lower bound of the sample size will follow the
scenarios below in Table 26:
151
Table 26: Example of scenarios to Estimate the minimum sample size required for this dissertation
Number of
possible
Variables in the
model
Expected
Number of
indicators (P)
Minimum
Sample size
(lower bound)
(P×10)
Expected
response rate
N
8 27 216 8% 2700
8 30 240 8% 3000
8 27 216 20% 1080
8 30 240 20% 1200
4.5.2 Survey Administration
After the design for the web-based survey has been finalized and activated, an
invitation email with an electronic link to the web survey has been set to a randomly
selected 5,000 possible participants. As mentioned earlier the 5,000 possible
participants are Saudi citizens age 18 years and older who are smartphones users. There
emails have been randomly selected from one of the four telecommunication
companies in Saudi Arabia.
A number of suggestions were provided that can be useful and help to improve the
quality of the survey and encourage more response from participants including the
following [230, 253] :
Appeal to respondents, indicating that by responding they would be helping
complete a Ph.D. dissertation.
Emphasize that the survey is short and will not be time-consuming.
152
Highlight that the request is from an academic institution, rather than from a
marketing business firm.
Have the survey web address jump out when viewing the email.
Highlight the prize drawing to entice respondents.
Provide clear instructions for how to access the survey.
Provide contact information in case there is a need for recipients to contact
researcher.
The suggested tips have been applied as much as possible in this survey as shown in the
screenshot of the invitation email as shown in figure 11 below.
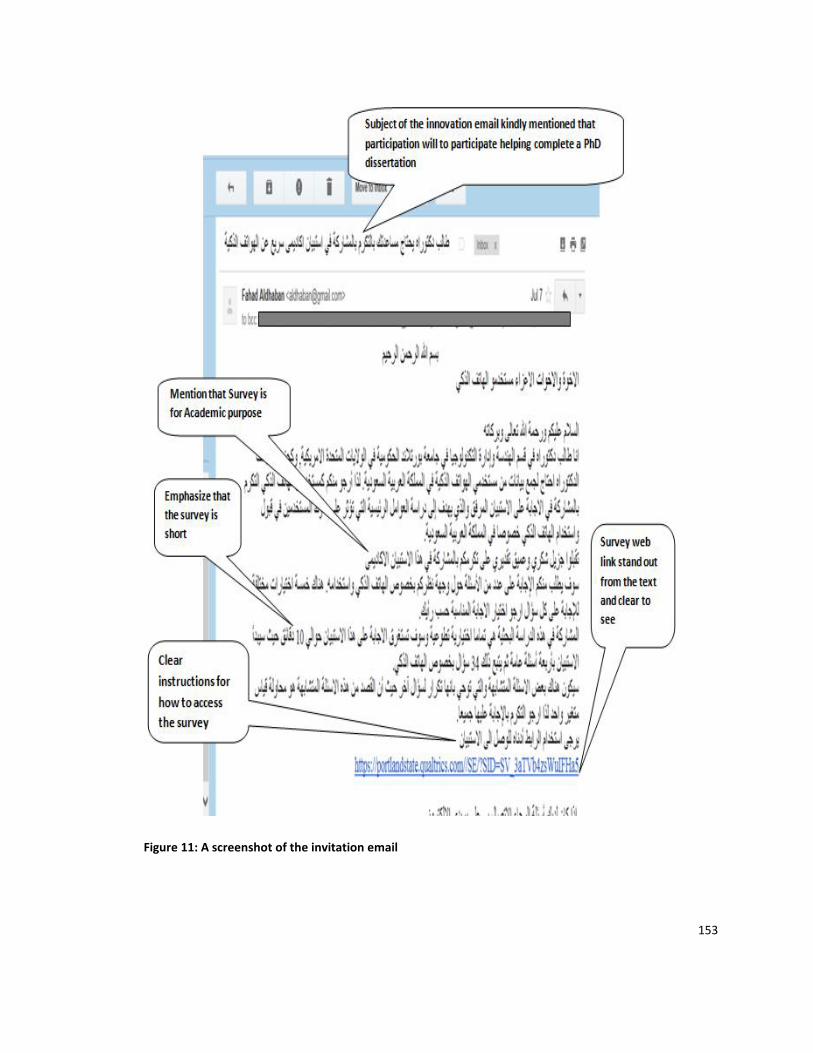
153
Figure 11: A screenshot of the invitation email
154
The survey invitation was emailed out in three rounds, including follow ups. On
June 29th, we started emailing-out the initial round of surveys. On July 12th, we started
to email-out the second round as a first reminder to participants. On July 25th, we
started to email-out the third round, a second survey reminder. 408 responses were
received from the initial survey which is an 8.16% return. The second round (first
reminder) increased the response total to 553 with 145 responses in this round which
accounts for an additional 2.9% response. The third round (second reminder) increased
the total of responses to 657 with 104 responses in this third round, which accounts for
2.08% additional responses as shown in Figure 11 below.
In the invitation emailed to participants, it was indicated that the time expected
to complete the survey was 10 minutes. After analysis, it was revealed that the average
compilation time was 9 minutes.
4.5.3 Response Rate
Cobanoglu et al. [254] indicated, in their study comparing mail, fax and web-
based surveys, that the response rate in web-based sampling methods is expected to be
much higher in the first seven days following the start of the survey. In this research the
pattern of response rate has been much higher in the initial survey, especially in the
earlier days, which is consistent with the findings of Cobangolue et al. [254]. Baruch and
Holtom stated that “researchers who observe a low initial response rate to a survey may
redouble their efforts to increase it and one of the most likely tactics to use as
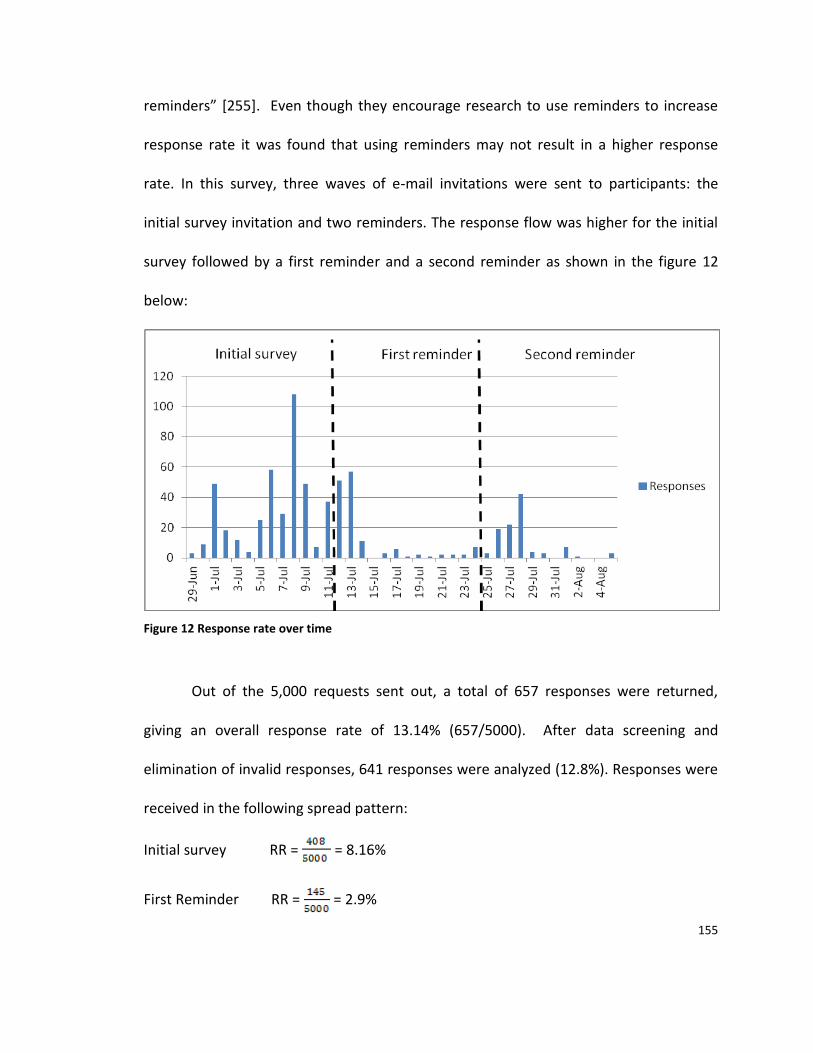
155
reminders” [255]. Even though they encourage research to use reminders to increase
response rate it was found that using reminders may not result in a higher response
rate. In this survey, three waves of e-mail invitations were sent to participants: the
initial survey invitation and two reminders. The response flow was higher for the initial
survey followed by a first reminder and a second reminder as shown in the figure 12
below:
Figure 12 Response rate over time
Out of the 5,000 requests sent out, a total of 657 responses were returned,
giving an overall response rate of 13.14% (657/5000). After data screening and
elimination of invalid responses, 641 responses were analyzed (12.8%). Responses were
received in the following spread pattern:
Initial survey RR = = 8.16%
First Reminder RR = = 2.9%
156
Second Reminder RR = = 2.08%
Combined RR = = 13.14%
When using SEM, it is recommended to obtain at least ten data points for each
item. The survey questionnaire for this research was designed based on the developed
research model and it included a total of 34 items. The minimum suggested sample size
for this model would be 340 data points and the total final responses usable in this
research were 641 (12.8%). It has been indicated that a typical research survey often
obtains no more than a 5 to 10 percent response rate [256] so 12.8% is satisfactory.
Additionally, this response rate is consistent with the response rate of a typical PhD
dissertation survey in the field of engineering and technology management, which
typically obtains a response rate range from 6.1% to 11.4% [252, 257, 224]. Therefore,
the response rate in this dissertation of 12.8 percent is well within the expected and
acceptable range.
4.5.4 Respondent Profile
The completed surveys indicated that a typical respondent could be described as
an individual who owns and uses a smartphone in Saudi Arabia. The subject could be
from any city or part of Saudi Arabia. Subjects were not filtered for age, knowledge, or
academic background. Participants’ age ranged from 18 to 56 years or more. A total of
254 (40%) respondents identified themselves as between the ages of 36 to 45 as shown
in Table 28 below. The respondent level of education ranged from less than high school
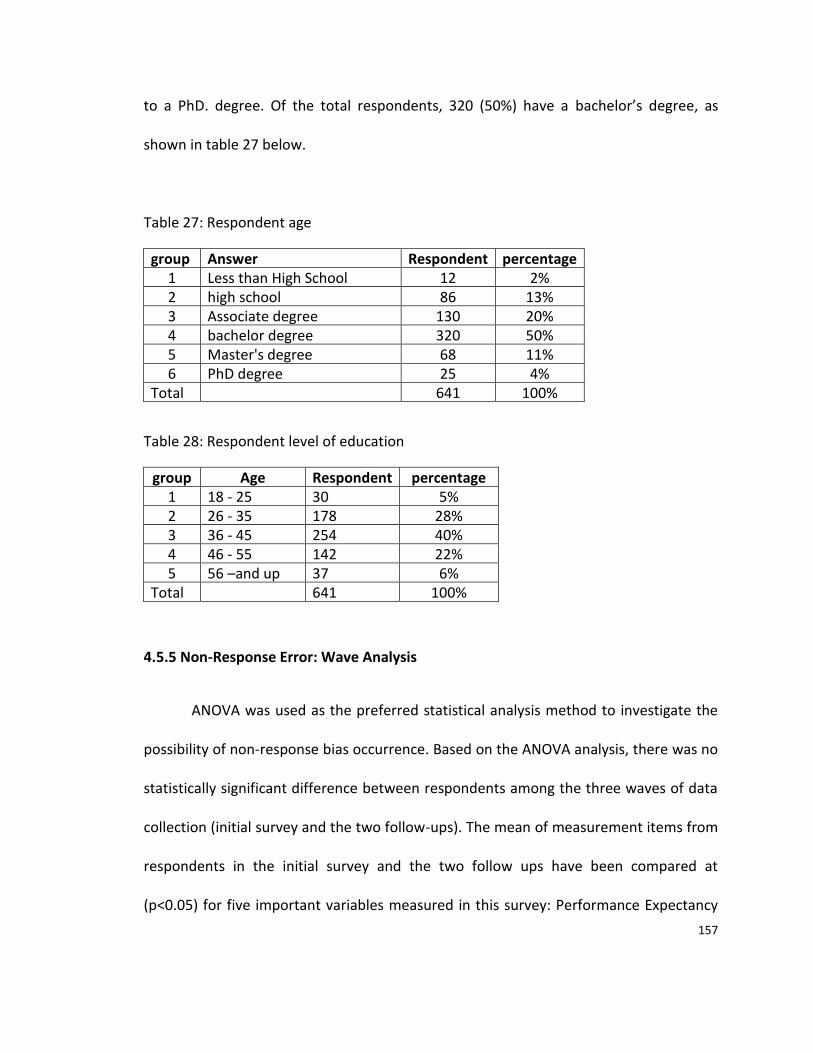
157
to a PhD. degree. Of the total respondents, 320 (50%) have a bachelor’s degree, as
shown in table 27 below.
Table 27: Respondent age
group Answer Respondent percentage 1 Less than High School 12 2% 2 high school 86 13% 3 Associate degree 130 20% 4 bachelor degree 320 50% 5 Master's degree 68 11% 6 PhD degree 25 4%
Total 641 100%
Table 28: Respondent level of education
group Age Respondent percentage 1 18 - 25 30 5% 2 26 - 35 178 28% 3 36 - 45 254 40% 4 46 - 55 142 22% 5 56 –and up 37 6%
Total 641 100%
4.5.5 Non-Response Error: Wave Analysis
ANOVA was used as the preferred statistical analysis method to investigate the
possibility of non-response bias occurrence. Based on the ANOVA analysis, there was no
statistically significant difference between respondents among the three waves of data
collection (initial survey and the two follow-ups). The mean of measurement items from
respondents in the initial survey and the two follow ups have been compared at
(p<0.05) for five important variables measured in this survey: Performance Expectancy
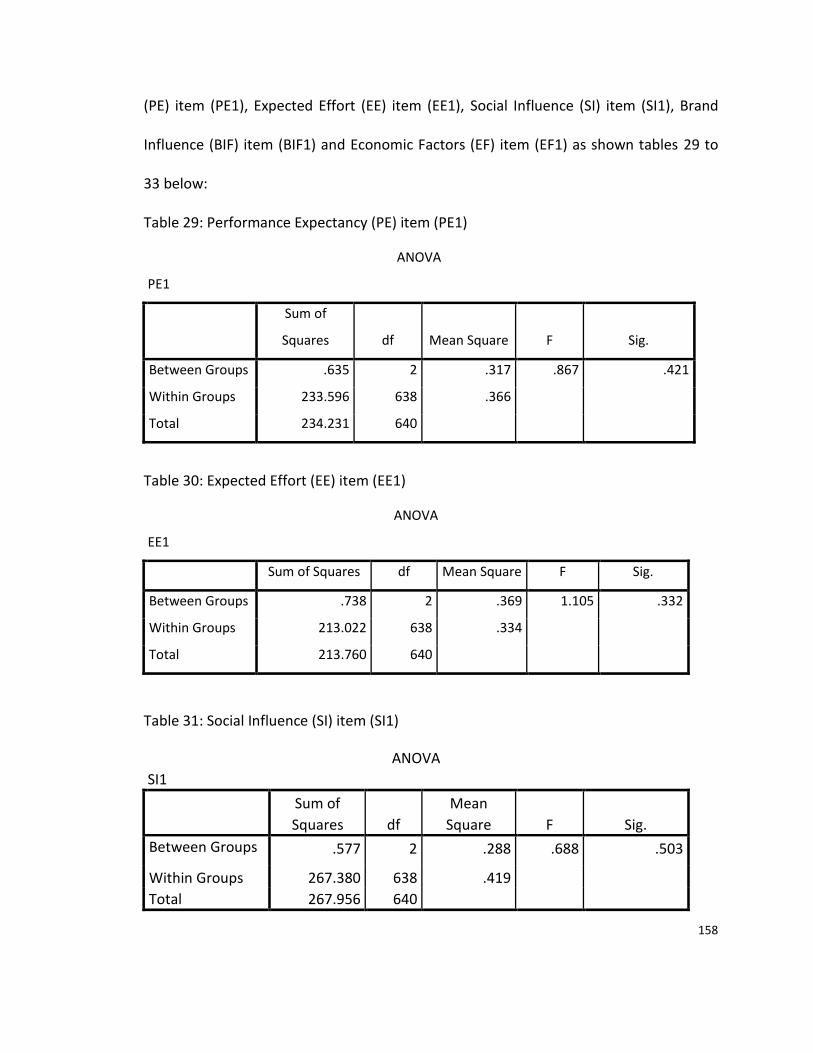
158
(PE) item (PE1), Expected Effort (EE) item (EE1), Social Influence (SI) item (SI1), Brand
Influence (BIF) item (BIF1) and Economic Factors (EF) item (EF1) as shown tables 29 to
33 below:
Table 29: Performance Expectancy (PE) item (PE1)
ANOVA
PE1
Sum of
Squares df Mean Square F Sig.
Between Groups .635 2 .317 .867 .421
Within Groups 233.596 638 .366
Total 234.231 640
Table 30: Expected Effort (EE) item (EE1)
ANOVA
EE1
Sum of Squares df Mean Square F Sig.
Between Groups .738 2 .369 1.105 .332
Within Groups 213.022 638 .334
Total 213.760 640
Table 31: Social Influence (SI) item (SI1)
ANOVA
SI1
Sum of
Squares df
Mean
Square F Sig.
Between Groups .577 2 .288 .688 .503
Within Groups 267.380 638 .419
Total 267.956 640
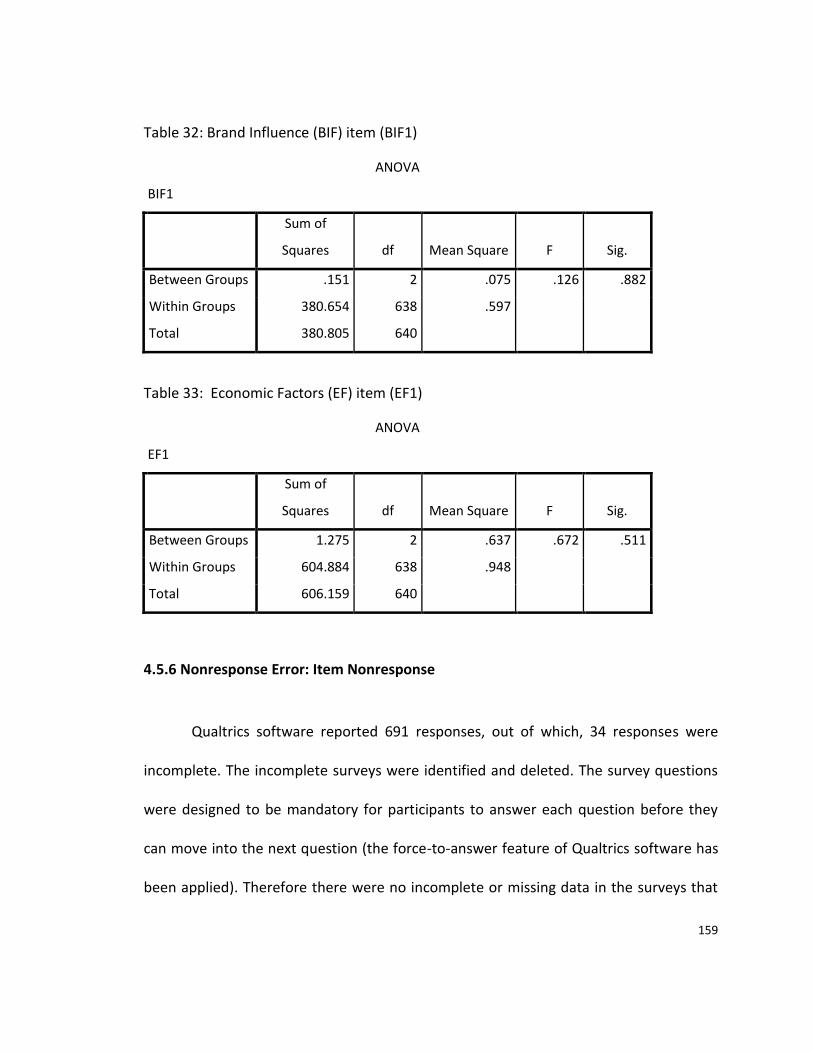
159
Table 32: Brand Influence (BIF) item (BIF1)
ANOVA
BIF1
Sum of
Squares df Mean Square F Sig.
Between Groups .151 2 .075 .126 .882
Within Groups 380.654 638 .597
Total 380.805 640
Table 33: Economic Factors (EF) item (EF1)
ANOVA
EF1
Sum of
Squares df Mean Square F Sig.
Between Groups 1.275 2 .637 .672 .511
Within Groups 604.884 638 .948
Total 606.159 640
4.5.6 Nonresponse Error: Item Nonresponse
Qualtrics software reported 691 responses, out of which, 34 responses were
incomplete. The incomplete surveys were identified and deleted. The survey questions
were designed to be mandatory for participants to answer each question before they
can move into the next question (the force-to-answer feature of Qualtrics software has
been applied). Therefore there were no incomplete or missing data in the surveys that
160
were used in the analysis for this research. After data screening and removing non
usable responses, 641 responses were used.
4.5.7 Post-Survey Adjustments
In this survey, there was no missing data relevant to the research hypothesis; therefore,
no post-survey adjustments were needed.
4.5.8 Data Screening
Outliers: This survey used a Likert scale, which limited the possible answers in a range
from 1 to 5 for each question. Therefore, there will be no outliers because the possible
answer has to be within the range of 1 to 5.
unengaged respondent [258]: when a participant is selecting only one answer for all
questions in the survey. It indicates that this particular participant is not paying
attention to the survey’s questions, which indicates a lack of engagement in the survey.
To improve data quality it is recommended to identify unengaged respondents and
delete them from the data set. There are a number of techniques that can be
implemented to identify unengaged respondent such as calculating the standard
deviations (SD) for each respondent. The SD for each participant has been calculated
using Microsoft excel. In this research, any response that has a SD equal to zero is
identified as a situation of unengaged respondent. Sixteen participants were identified
as unengaged respondents and have been removed from the survey.
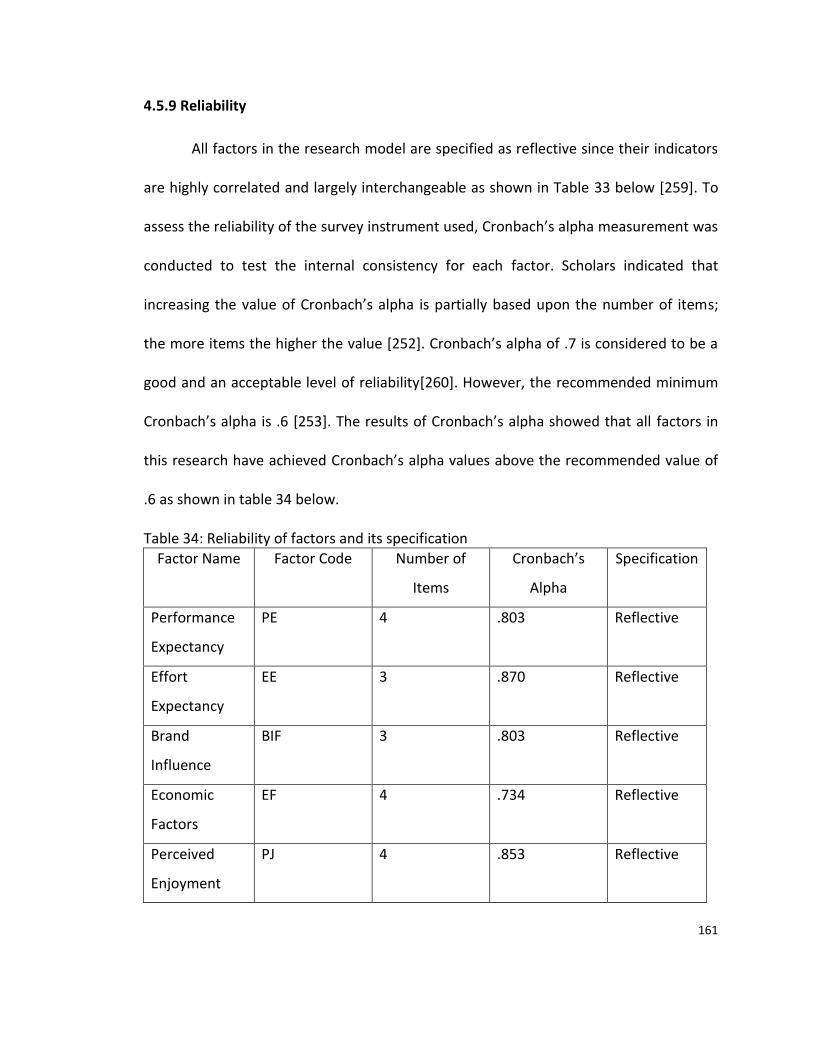
161
4.5.9 Reliability
All factors in the research model are specified as reflective since their indicators
are highly correlated and largely interchangeable as shown in Table 33 below [259]. To
assess the reliability of the survey instrument used, Cronbach’s alpha measurement was
conducted to test the internal consistency for each factor. Scholars indicated that
increasing the value of Cronbach’s alpha is partially based upon the number of items;
the more items the higher the value [252]. Cronbach’s alpha of .7 is considered to be a
good and an acceptable level of reliability[260]. However, the recommended minimum
Cronbach’s alpha is .6 [253]. The results of Cronbach’s alpha showed that all factors in
this research have achieved Cronbach’s alpha values above the recommended value of
.6 as shown in table 34 below.
Table 34: Reliability of factors and its specification
Factor Name Factor Code Number of
Items
Cronbach’s
Alpha
Specification
Performance
Expectancy
PE 4 .803 Reflective
Effort
Expectancy
EE 3 .870 Reflective
Brand
Influence
BIF 3 .803 Reflective
Economic
Factors
EF 4 .734 Reflective
Perceived
Enjoyment
PJ 4 .853 Reflective
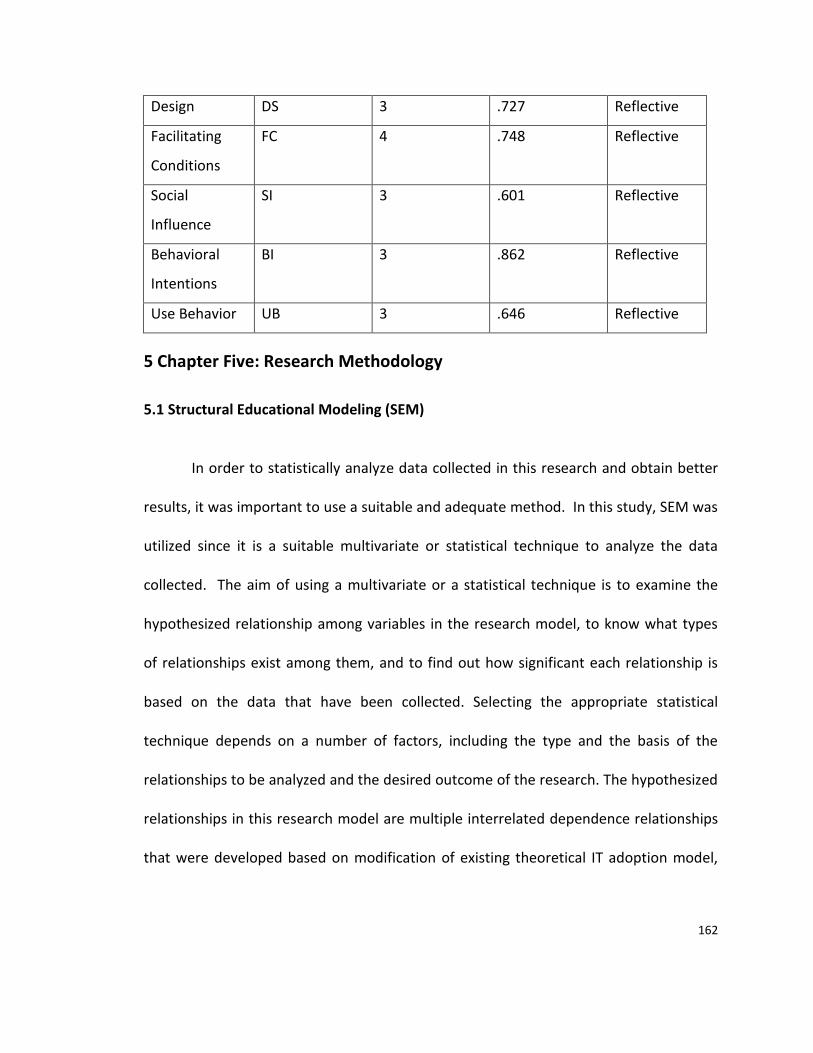
162
Design DS 3 .727 Reflective
Facilitating
Conditions
FC 4 .748 Reflective
Social
Influence
SI 3 .601 Reflective
Behavioral
Intentions
BI 3 .862 Reflective
Use Behavior UB 3 .646 Reflective
5 Chapter Five: Research Methodology
5.1 Structural Educational Modeling (SEM)
In order to statistically analyze data collected in this research and obtain better
results, it was important to use a suitable and adequate method. In this study, SEM was
utilized since it is a suitable multivariate or statistical technique to analyze the data
collected. The aim of using a multivariate or a statistical technique is to examine the
hypothesized relationship among variables in the research model, to know what types
of relationships exist among them, and to find out how significant each relationship is
based on the data that have been collected. Selecting the appropriate statistical
technique depends on a number of factors, including the type and the basis of the
relationships to be analyzed and the desired outcome of the research. The hypothesized
relationships in this research model are multiple interrelated dependence relationships
that were developed based on modification of existing theoretical IT adoption model,
163
UTAUT. Therefore, Structural Equation Modeling (SEM) as a suitable multivariate
technique was used to analyze the data in this dissertation.
The SEM is a suitable multivariate technique to be used in this research for a
number of reasons including [261-263, 203, 264]:
First: SEM is a powerful multivariate technique, especially when it is utilized to
examine or analyze theoretical-based hypotheses with multiple interrelated
dependence relationships [214]. Moreover, SEM was described as a powerful
statistical technique that takes a confirmatory approach, such as hypothesis
testing, rather than an exploratory approach to the analysis of a structural
theory and its effects on a specific phenomenon [262]. When using SEM, the
research foundations of the relationships under study should be based on a
strong theoretical basis [214].
Errors can negatively and critically affect the results and the process of statistical
analysis [265, 264]. Errors are common problems that researchers work hard to
avoid and eliminate as much as possible. Errors can accrue at any point of the
research phase starting from preparing the research instrument to collecting
data and through all the statistical analysis phases. Unlike other statistical
techniques, SEM can provide unique solutions for this problem. SEM can
explicitly estimate errors and the errors’ variance parameters.
SEM analysis starts from the measurements model, which accounts for
and accommodates all indicators (items), independent and dependent variables,
164
continuously through a measurement structural model, while accommodating
for errors in the whole process. SEM establishes a direct correction for
measuring errors to allow for more accurate estimates of the relationships under
consideration. One of the most important and known features of SEM is its
approach to the explicitness of the covariance and errors structure for better
testing of the data and its fit to the model. SEM explicitly specifies observations
and the error variable(s), which greatly enhance the result of the analyses [263].
Unlike alternative multivariate techniques, SEM is a comprehensive technique
that can be used to examine sequences of theoretical dependence relationships
simultaneously [261]. SEM is the only multivariate technique that enables
complete and simultaneous testing of all relationships in a given model, which
gives a more comprehensive explanation for the phenomena under study.
Unlike other multivariate techniques that mostly analyze the variable directly,
SEM distinguishes between variables and factors. SEM utilizes both a
measurement model and a structural model to gain more accurate and
comprehensive results. In SEM, variables or indicators (items) that are collected
and measured using instruments such as surveys, are considered observable and
SEM obtains direct measures of them along the whole process. With regards to
factors, they can be exogenous or endogenous. Exogenous factors are the
independent or latent variables that have a number of indicators, from outside
165
the model, to determine them. The endogenous factors are the dependent
variable in the model.
SEM was explicitly indicated to be the most distinguished multivariate technique
to test behavioral theory. The research model in this research is based on IT
adoption theories and it is a behavioral-based theory. It is intended to
understand and explain factors that influence the behavioral intention of users
to adopt and use the Smartphone. Therefore, SEM is the most appropriate
multivariate technique to be used in this research.
In SEM the structural model is built and analyzed, showing the result in both
tables and structural or path visual diagrams that make it easier to visualize,
follow and understand the paths and effects of all relationship in a given
analyses.
SEM was described as “ the dominant multivariate technique” [266]. SEM is very
widely used in research in the IT adoption domain and related to the adoption
and use mobile.
5.2 Reflective Measurement
For the SEM approach, the items or indicators used to measure the latent
variables (LV) can be a reflective or formative measurement. Reflective
measurement is the most widely used method and one of the key features that
differentiates it from formative measurement is that a change in any LV will be
166
reflected in all the items or indicators [267]. Reflective measures are known to be
consistent with confirmatory factor analysis (CFA) and it accounts for errors [267],
while formative measures can be achieved by using the partial least square (PLS)
method [267]. In reflective measures, indicators should have similar contents, same
antecedent and account for errors in the level of indicators (items) [259]. Reflective
measurement models are mostly used in fit well with factors such as attitude,
personality and behavioral intention [214]. Hair et al. [214] provided an example to
explain reflective measurement in study of medical “symptoms such as shortness of
breath, tiring easily, wheezing, and reduced lung functioning would be considered
indicators that would reflect the latent factor of emphysema”. Unlike formative
measurement, reflective measurement dictates that all indicator items are caused
by the same latent construct therefore, items within the same factor should have a
high correlation with each other [214]. Moreover, in reflective measurement
individual items should be interchangeable so that moving out a single item will not
change the factor [214]. The factors in the research model for this dissertation
related to attitude and behavioral intentions which fit the reflective measurements.
Moreover, the indicators measurement in this dissertation is reflective and the CFA
has been utilized to analyze the data. the measurement for all factors in the
research model are specified as reflective since their indicators are highly correlated
and largely interchangeable as shown previously in Table 33 [259].
167
5.3 Use of SEM in IT adoption Research
The SEM method has been used widely in empirical research related to the use
and adoption of IT. Kim used SEM to study and analyze the effects of job relevance and
experience on the adoption of Smartphone technology by individuals. His model was
based on the technology acceptance model (TAM) [91]. Lewis et al. used the SEM
method to study the potential of young consumers to use mobile banking services [155].
Their research model was based on TAM. Kijsanayotin et al. used SEM to examine the
factors that influence health information adoption [26]. Their research model and
hypotheses were based on UTAUT. Based on TAM, Kim investigated mobile wireless
technology adoption using the SEM method [105]. Kang et al. used the SEM method in
their research studying the adoption of Smartphones in Korea [49]. Their research
model was based on a modification of TAM [49]. Verkasalo et al. utilized the SEM
method in their research to analyze users’ use of Smartphone’ applications[90]. Their
research was based on TAM theory [90]. The popularity of SEM and the frequent use of
it in the domain of IT adoption increases the credibility of SEM and makes it more
appealing, applicable and reliable for use in the IT adoption area.
5.3 SEM Process, Assumptions and Limitations
Structural Equation Modeling (SEM) is defined as “multivariate technique
combining aspects of factor analysis and multiple regression that enables the researcher
to simultaneously examine a series of interrelated dependence relationships among the
168
measured variables and latent construct (variants) as well as between several latent
constructs” [214]. Since 1980, SEM has become increasingly popular among researchers
as one of the preferred alternatives among other multivariate techniques [203, 268].
SEM is described as a statistical method that can be utilized to draw conclusions of
dependency relationships from a combination of observed data and theoretical
assumptions [269, 262, 270]. SEM enables researchers to simultaneously examine a
series of effects and relationships while accounting for measurement errors within the
same process [214].
The term structural equation modeling carries two critical aspects of the
procedure:[271]
First: the interrelated relationships in the research under consideration are being
represented by a sequence of structural equations.
Second: the mentioned structural relationships can be modeled to reflect better
conceptualization of the theory under consideration.
SEM is a very powerful multivariate technique, particularly when used to test
theories that have multiple equations with dependence relationships. [214, 242]. When
using SEM, the researchers should base their research on prior experiences and
theoretical foundations that provide some explanations of which independent variables
predict or influence each dependent variable in a given research framework or model. In
SEM, dependent variables in a set of given relationships can become independent
variables in subsequent relationships in the same model or structure. After that, all of
169
these mentioned relationships are translated into a sequence of structural equations for
each dependent variable in which every relationship is simultaneously accommodated
with differing effects [262, 214]. Unlike other alternative multivariate techniques, SEM is
characterized as a confirmatory approach which means a statistical approach to test or
confirm a set of relationships that was already specified [214]. There are a number of
stages or steps that SEM processes usually go through including: [214]
Defining the individual factors: In this stage the researcher defines what items
measure each variable.
Developing and specifying the measurement model: In this stage, each factor or
variable that is going to be in the model are going to be identified and the
indicators (items) are going to be assigned into their respondent variable. Each
latent variable that is going to be used in the model must be identified.
Designing a study to produce empirical results: In this stage, the researcher has
to assess the adequacy of the data and look at its appropriateness for the model
under consideration to obtain more accurate empirical results.
Assessing the measurement model validity: This is very critical stage and it is
the most fundamental event of the SEM testing process. The analysis will not go
to the next stage until there is an acceptable model fit. Measuring the model
validity depends on obtaining an acceptable level of goodness of fit for the
model under consideration and obtaining specific evidence that shows factor
validity. There are a number of goodness-of-fit indices that can be used to assess

170
the fit between the hypothesized model and the data collected such as: Chi-
square/degrees of freedom (df), Goodness-of-fit Index (GFI), Adjusted Goodness-
of-fit Index (AGFI), Comparative Fit Index (CFI), or Root Mean Square of
Approximation (RMSEA).
In the measurement model, the researcher specifies a number of
indicators for each single dependent or independent variable. Confirmatory
factor analysis (CFA) can be used to perform convergent validity to determine if
each factor can be reflected by its indicators (items). CFA is also used to assess
and test if each factor is statistically valid. As shown in Figure 13 below, all the
variables are treated as latent or dependent variables and all are correlated.
Each factor is linked into its indicators (items) and there are no structural
relationships among variables in this stage (see Figure 13). In this stage, the
researcher is going to form and run the measurement model without linking or
showing the hypothesized relationships in which all variables are correlated and
each variable is linked to its indicators.
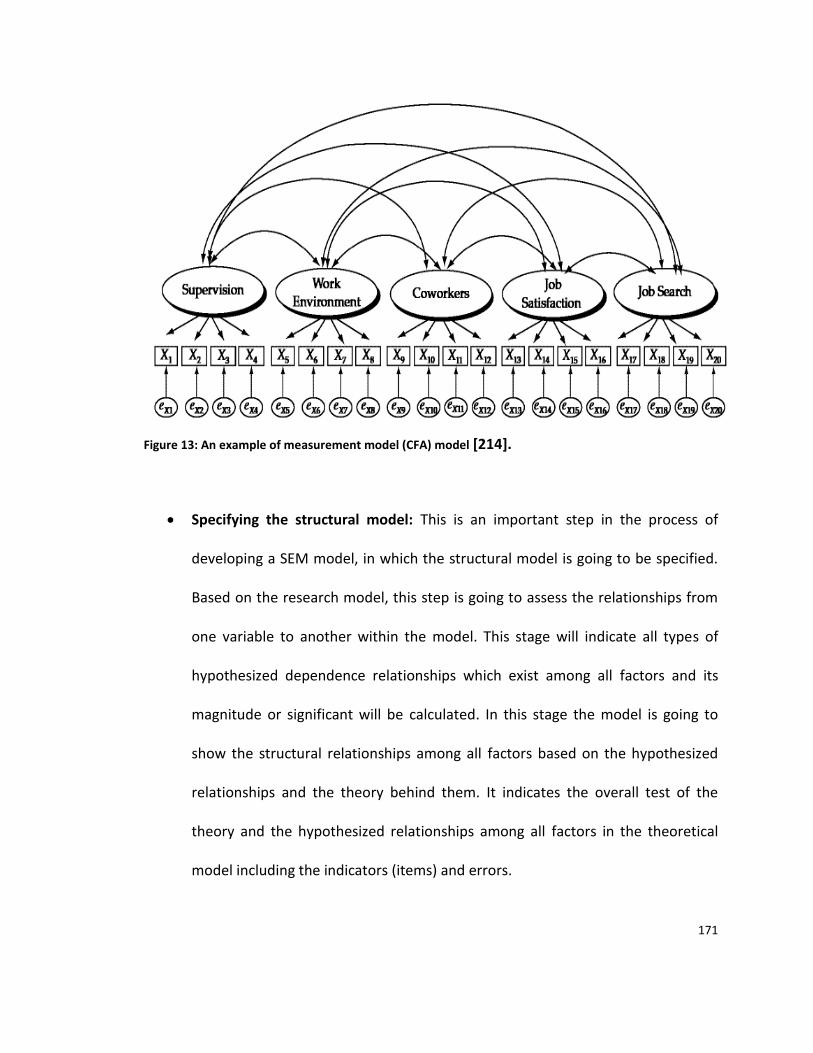
171
Figure 13: An example of measurement model (CFA) model [214].
Specifying the structural model: This is an important step in the process of
developing a SEM model, in which the structural model is going to be specified.
Based on the research model, this step is going to assess the relationships from
one variable to another within the model. This stage will indicate all types of
hypothesized dependence relationships which exist among all factors and its
magnitude or significant will be calculated. In this stage the model is going to
show the structural relationships among all factors based on the hypothesized
relationships and the theory behind them. It indicates the overall test of the
theory and the hypothesized relationships among all factors in the theoretical
model including the indicators (items) and errors.
172
By using CFA to run and test the structural model, the type of
relationships among all model factors and their significance is going to be
presented. The hypothesized relationships are going to be set and the exogenous
or independent as well as the endogenous or dependent variables are identified
in this stage.
After obtaining a good model fit, SEM then will test the nature and
significance of the relationships among all variables in the model that was
hypothesized. In this stage, the measurement model is going to be changed into
a structural model based on the hypothesized research model. In the structural
model, the co-relational relationships are going to be changed into dependence
relationships with unidirectional arrows that show the direction of each
relationship that was hypothesized for each path diagram. Applying SEM will
show the nature of each hypothesis and if each hypothesized path is significant
or not in its assigned direction. After obtaining an acceptable model fit, the
researcher should modify the model by connecting or linking the independent
variables and the dependent variables based on the hypotheses. After all links
and connections have been established, the researcher can run the structural
model to obtain the final results for each hypothesized relationship.
173
Assumptions for SEM
To obtain a more accurate and robust result, there are number of assumptions
that a researcher should consider when using the SEM method to analyze data including
the following [214]:
Having a theoretical basis or prior experience to set or indicate an initial
relationship among variables in the model under consideration,
Having a normal distribution of data,
Having well measured variables with at least three indicators,
Having at least ten cases for each indicator as a minimum sample size.
When the researcher meets the above-mentioned assumptions, it will greatly contribute
to the quality of the outcome that SEM is trying to achieve.
Limitations to SEM
There are number of limitations associated with SEM that a researcher should be
aware of when selecting a multivariate technique in a given research including the
following [238, 214, 250, 242]:
- SEM needs a theoretical or prior experience hypothesis that can set the initial
base of logic for the relationships among variables in the model under
consideration. SEM will test and analyze these hypotheses based on the theory
or the logic behind it.
174
- SEM may not work well with a small sample size. It requires a minimum sample
size based on the number of variables and indicators in the model under
consideration.
- SEM requires at least three indicators for each variable, two indicators per
variable is problematic, and one indicator may not allow the measurement
model to run or it may indicate a poor model fit and require modifications of the
model. In some situations it is difficult to provide the required number of
indicators per variable in SEM.
175
6 Chapter Six: Analysis
This chapter describes the statistical analysis that has been conducted to analyze
the data collected and test the research hypotheses.
Data collected for this research have been screened and organized as detailed in
the previous chapter using a number of methods and software applications such as SPSS
and Microsoft Excel. Structural Equation Modeling (SEM) has been utilized in this
research which included two main steps: 1) Conducting Confirmatory Factor Analysis
(CFA) to verify the measurement of the research model and obtain an acceptable and
adequate model fit; and, 2) Transferring the acceptable model into a full structural
model to analyze the hypothesized relationships among factors in the research model.
Structural Equation Modeling (SEM) is a multivariate technique that combines
aspects of factor analysis and multiple regression, allowing researchers to
simultaneously examine a series of interrelated dependence relationships [214]. As
mentioned in the previous chapter, SEM has become an increasingly popular statistical
approach among researchers and a preferred alternative among other multivariate
techniques [203, 268]. It is a statistical method that can be used to test and explain
dependency relationships by combining observed data and theoretical assumptions
[269, 262, 270]. Using SEM, a researcher can simultaneously examine a series
relationships while accounting for measurement errors at the same process [214].
In this dissertation there are two main components in SEM: first is the measurement
model and second is the structural model.

176
6.1 Measurement Model
In the Measurement Model, CFA enabled the researcher to examine if the
hypothesized relationships between the observed and latent variables do indeed exist.
The main task in the measurement mode phase is to test the model and verify the
goodness-of-fit between the data collected and the hypothesized model. There are a
number of indices that have been developed and recommended as goodness of model
fit indicators as shown in Table 35 below.
Table 35: Recommended indices to obtain a goodness of model fit indicators
Indicators name
Indicators code
Explanation Recommended level
Chi-square/degrees of freedom (df),
χ2 /d.f It is based on ratio between chi square and the degrees of freedom. Compensates for sample size impact on X2 statistic.
<3
Goodness-of-fit Index
GFI Goodness-of-fit Index is Less sensitive to sample size than X2.
>.9
Adjusted Goodness-of-fit Index
(AGFI) (AGFI) corrects the GFI, which is affected by the number of indicators of each latent variable.
>.8
Comparative Fit Index
(CFI) It is one of the indices that assess in to what extent or how well a specified model fits relative to some alternative baseline model (referred to as null model), which assumes that all observed variables are uncorrelated. It represents the improvement in the in model fit by the specification of related multi-item factors.
>.9
Root Mean Square of Approximation
(RMSEA) It takes into account the error of approximation in the population. It explicitly tries to correct for the model complexity and the sample size by including each in its computation.
<.05
177
CFA examined the relationship between latent variables and their observed
measures as shown in Figure 14 below. A theoretical basis and a number of qualitative
methods have been utilized to develop the research model to be tested using CFA. It has
been used to validate the measurement model to obtain an acceptable and adequate
model fit necessary to proceed to next step the structural model.
Figure 14 below shows the measurement model using CFA with SPSS package
and AMOS software. Based on recommended indices, the first model measurement has
shown an acceptable fit in a number of recommended indices. However, a number of
indices showed a lower score than recommended.
To improve model measurement and obtain an acceptable model fit actions had
to be taken. A number of error terms that showed a high covariance within their own
factor namely e33 and e31 were correlated and e18 and e17 were correlated [272].
Moreover a number of items that showed a low loading namely SI3 and EF1 were
removed [272]. After making the recommended changes, the model was run again and
it showed a better model fit with better indices scores as shown in Table 36 below.
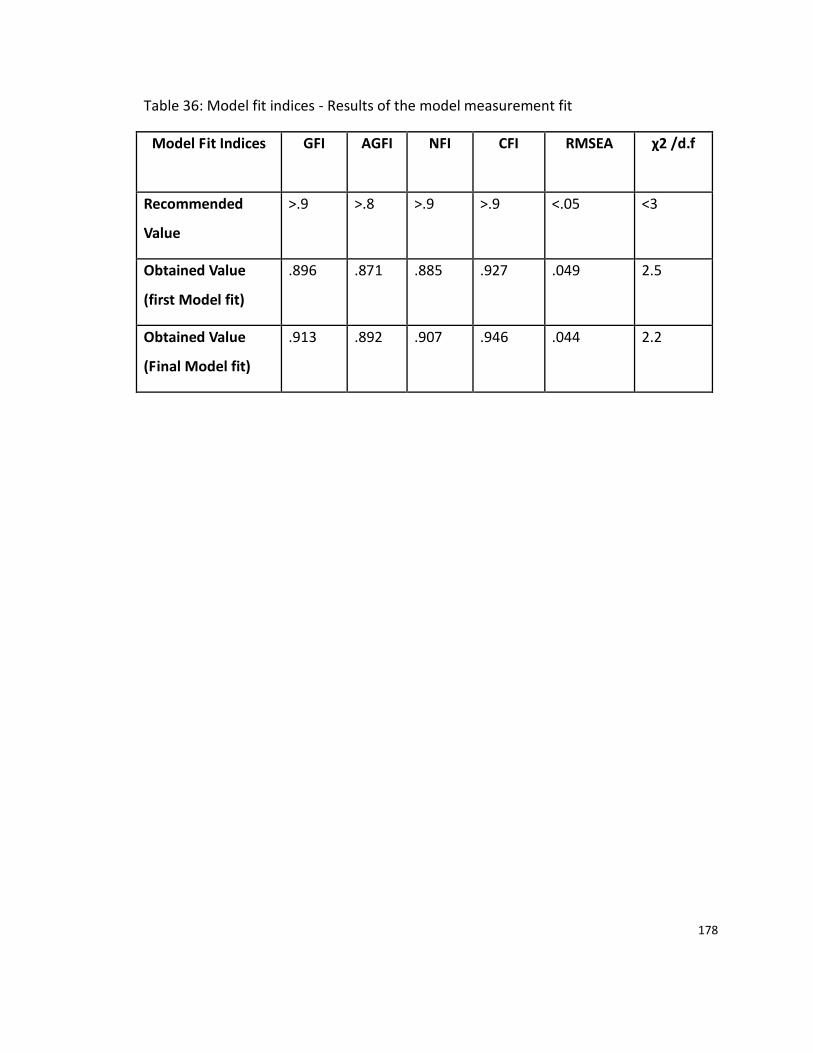
178
Table 36: Model fit indices - Results of the model measurement fit
Model Fit Indices GFI
AGFI NFI CFI RMSEA χ2 /d.f
Recommended
Value
>.9 >.8 >.9 >.9 <.05 <3
Obtained Value
(first Model fit)
.896 .871 .885 .927 .049 2.5
Obtained Value
(Final Model fit)
.913 .892 .907 .946 .044 2.2
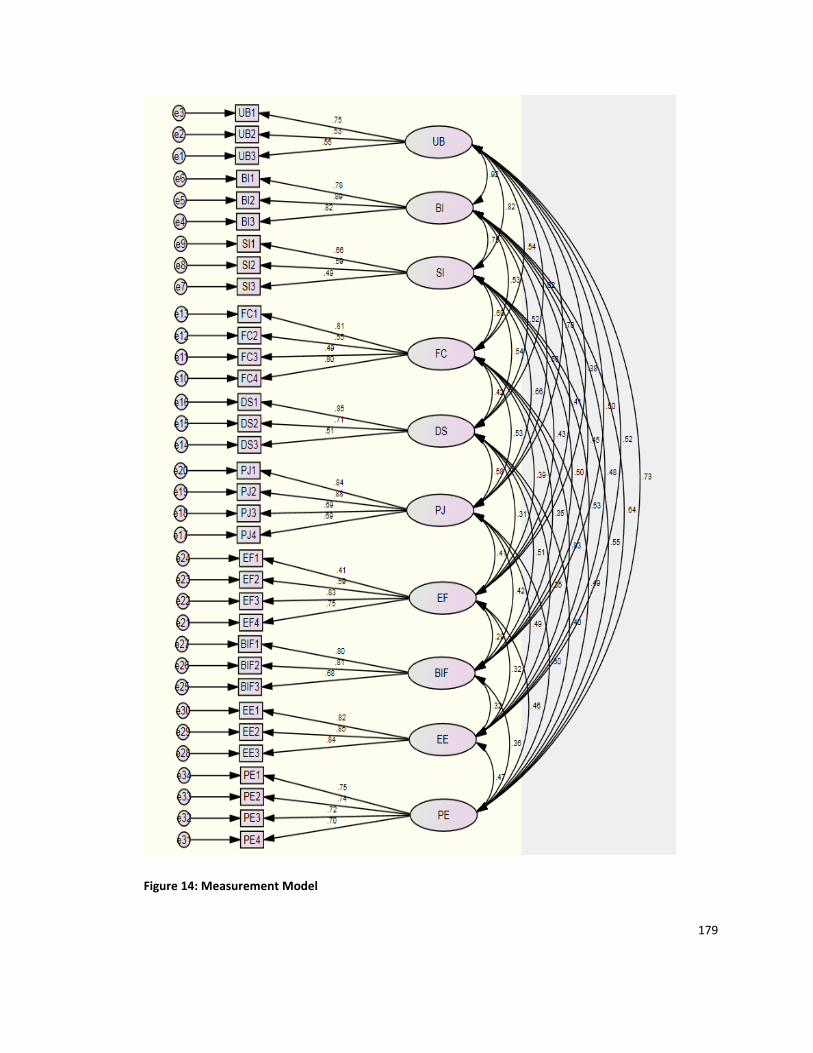
179
Figure 14: Measurement Model
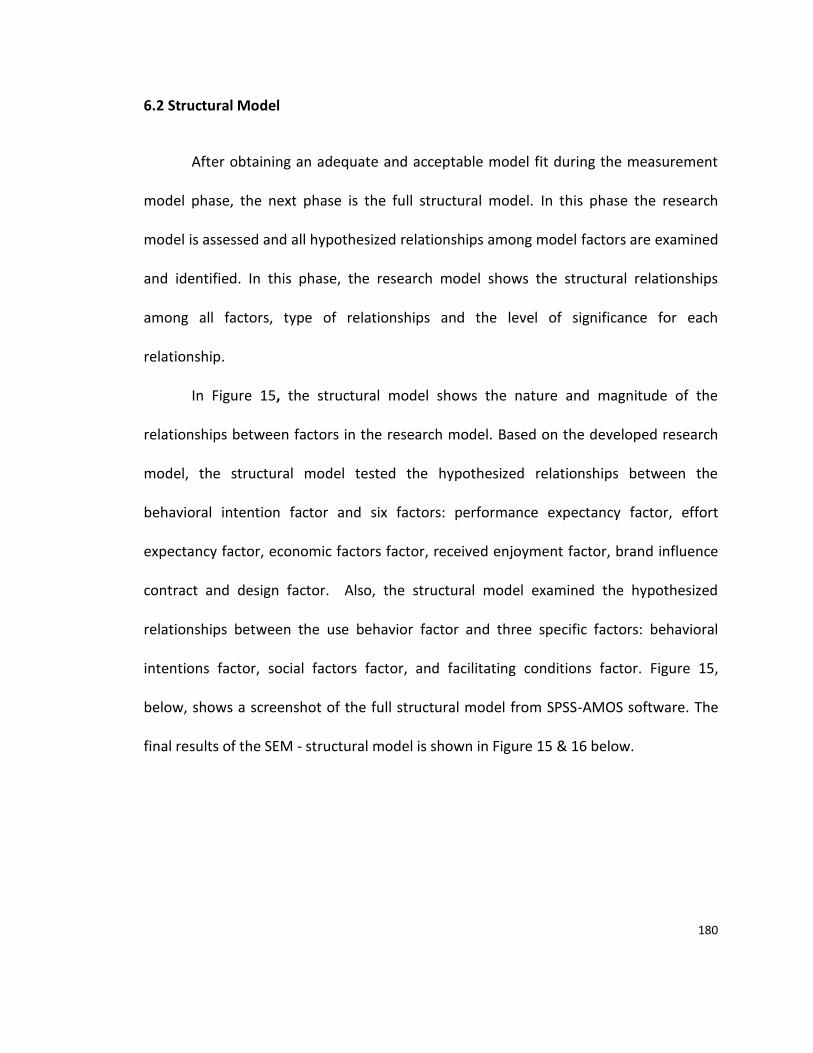
180
6.2 Structural Model
After obtaining an adequate and acceptable model fit during the measurement
model phase, the next phase is the full structural model. In this phase the research
model is assessed and all hypothesized relationships among model factors are examined
and identified. In this phase, the research model shows the structural relationships
among all factors, type of relationships and the level of significance for each
relationship.
In Figure 15, the structural model shows the nature and magnitude of the
relationships between factors in the research model. Based on the developed research
model, the structural model tested the hypothesized relationships between the
behavioral intention factor and six factors: performance expectancy factor, effort
expectancy factor, economic factors factor, received enjoyment factor, brand influence
contract and design factor. Also, the structural model examined the hypothesized
relationships between the use behavior factor and three specific factors: behavioral
intentions factor, social factors factor, and facilitating conditions factor. Figure 15,
below, shows a screenshot of the full structural model from SPSS-AMOS software. The
final results of the SEM - structural model is shown in Figure 15 & 16 below.
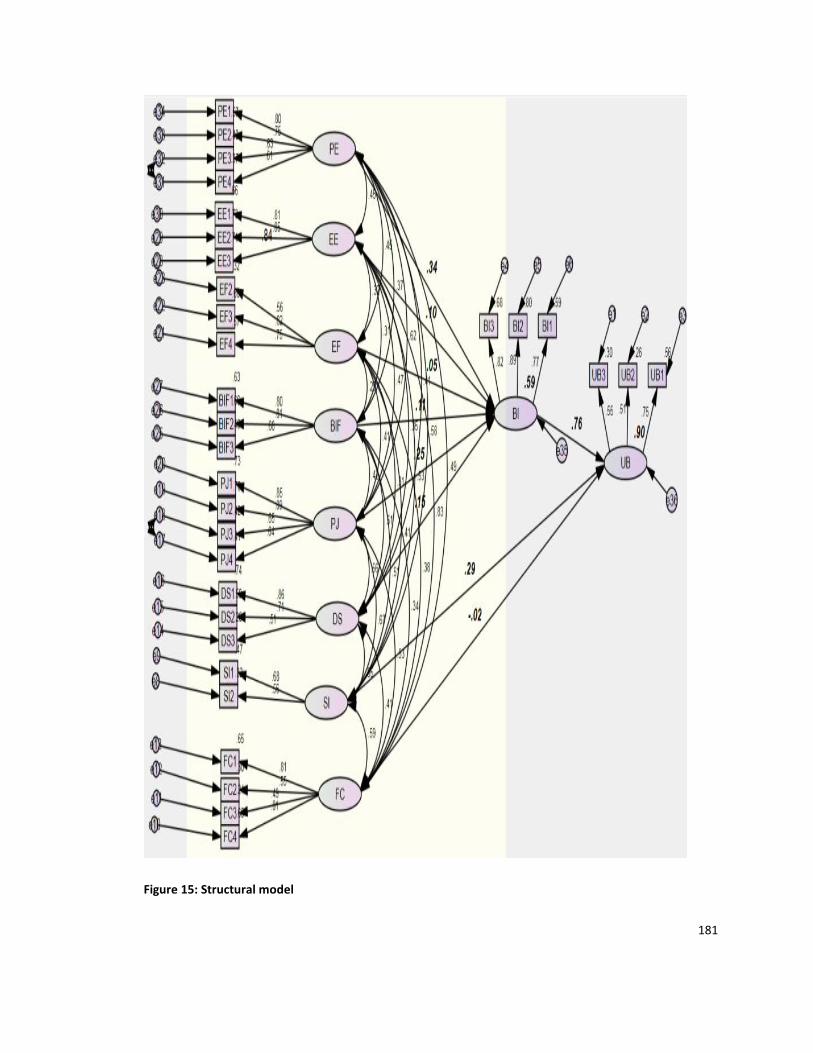
181
Figure 15: Structural model
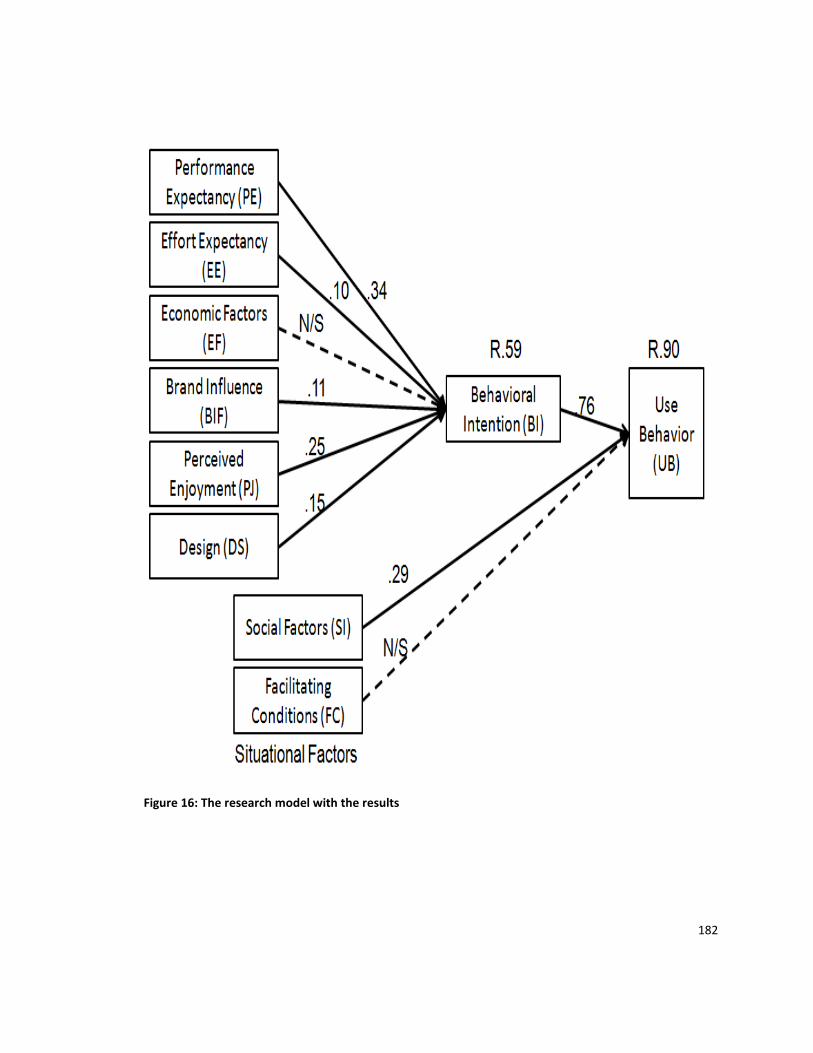
182
Figure 16: The research model with the results
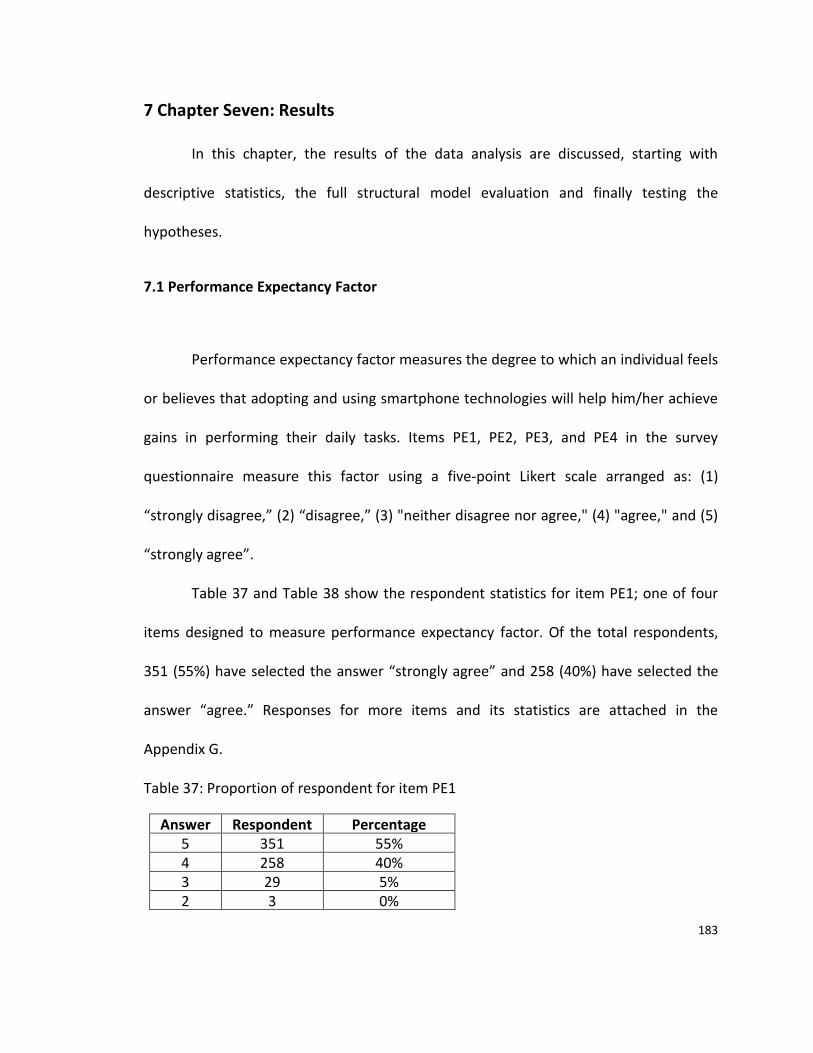
183
7 Chapter Seven: Results
In this chapter, the results of the data analysis are discussed, starting with
descriptive statistics, the full structural model evaluation and finally testing the
hypotheses.
7.1 Performance Expectancy Factor
Performance expectancy factor measures the degree to which an individual feels
or believes that adopting and using smartphone technologies will help him/her achieve
gains in performing their daily tasks. Items PE1, PE2, PE3, and PE4 in the survey
questionnaire measure this factor using a five-point Likert scale arranged as: (1)
“strongly disagree,” (2) “disagree,” (3) "neither disagree nor agree," (4) "agree," and (5)
“strongly agree”.
Table 37 and Table 38 show the respondent statistics for item PE1; one of four
items designed to measure performance expectancy factor. Of the total respondents,
351 (55%) have selected the answer “strongly agree” and 258 (40%) have selected the
answer “agree.” Responses for more items and its statistics are attached in the
Appendix G.
Table 37: Proportion of respondent for item PE1
Answer Respondent Percentage 5 351 55% 4 258 40% 3 29 5% 2 3 0%
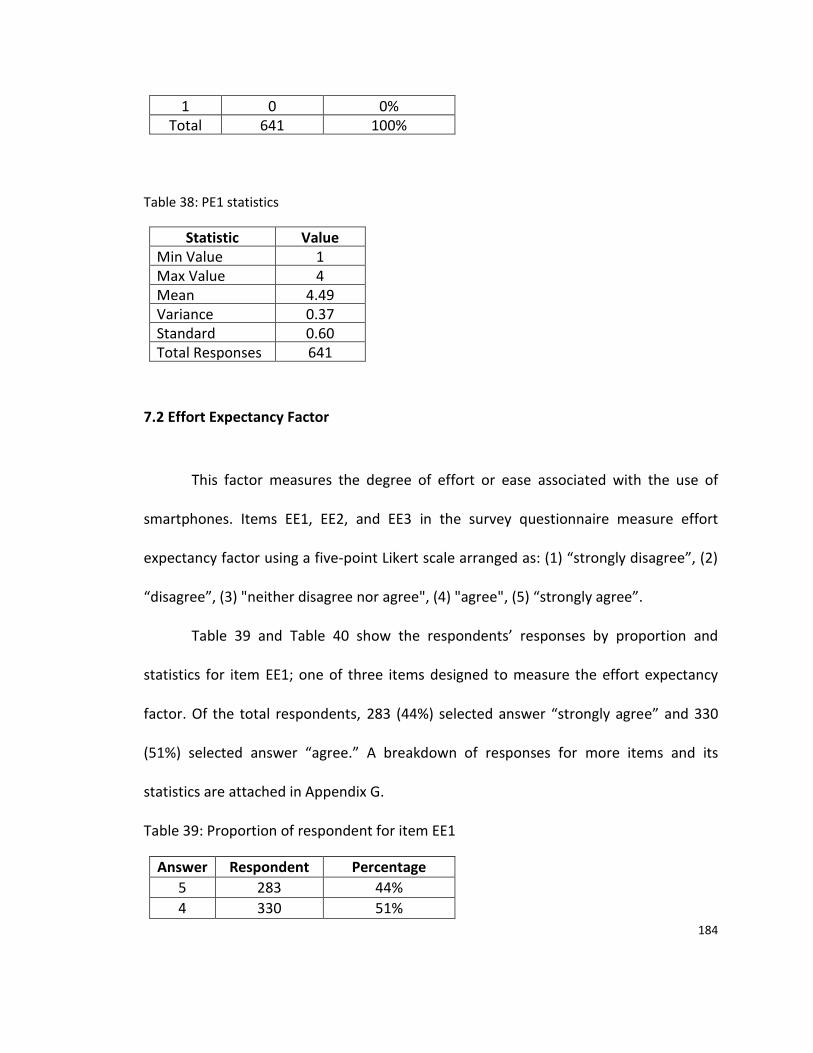
184
1 0 0% Total 641 100%
Table 38: PE1 statistics
Statistic Value Min Value 1 Max Value 4 Mean 4.49 Variance 0.37 Standard
Deviation
0.60 Total Responses 641
7.2 Effort Expectancy Factor
This factor measures the degree of effort or ease associated with the use of
smartphones. Items EE1, EE2, and EE3 in the survey questionnaire measure effort
expectancy factor using a five-point Likert scale arranged as: (1) “strongly disagree”, (2)
“disagree”, (3) "neither disagree nor agree", (4) "agree", (5) “strongly agree”.
Table 39 and Table 40 show the respondents’ responses by proportion and
statistics for item EE1; one of three items designed to measure the effort expectancy
factor. Of the total respondents, 283 (44%) selected answer “strongly agree” and 330
(51%) selected answer “agree.” A breakdown of responses for more items and its
statistics are attached in Appendix G.
Table 39: Proportion of respondent for item EE1
Answer Respondent Percentage
5 283 44%
4 330 51%
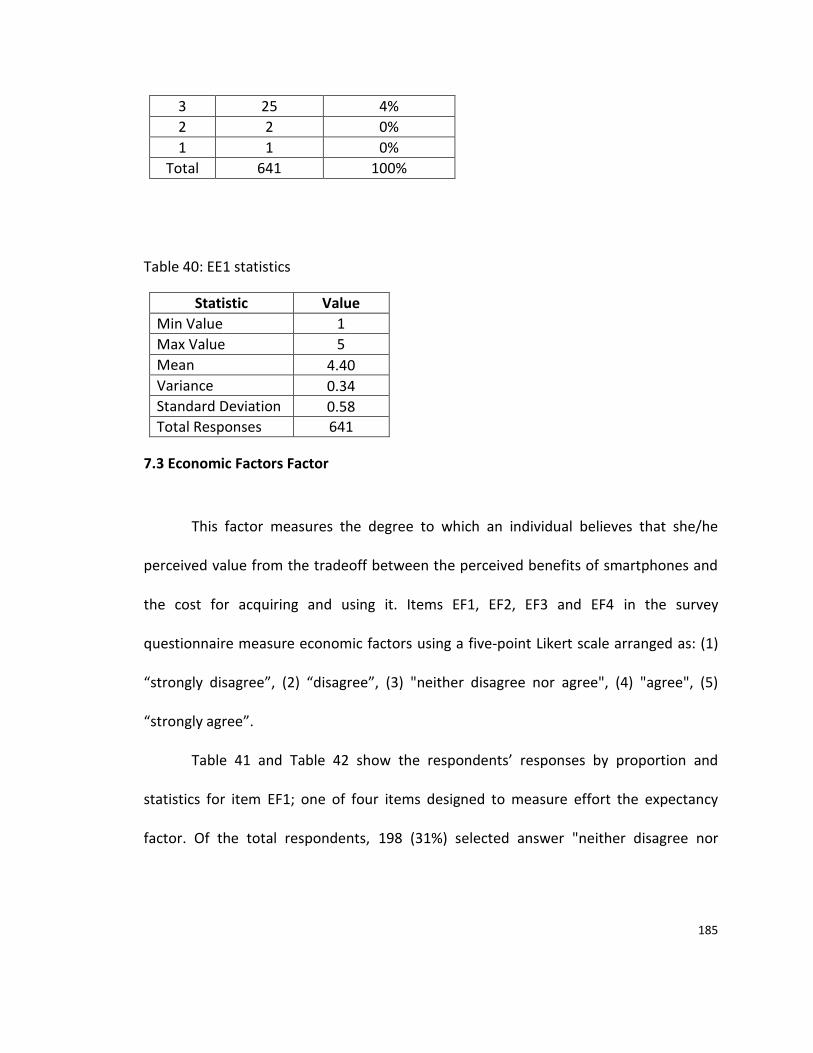
185
3 25 4%
2 2 0%
1 1 0%
Total 641 100%
Table 40: EE1 statistics
Statistic Value
Min Value 1
Max Value 5
Mean 4.40
Variance 0.34
Standard Deviation 0.58
Total Responses 641
7.3 Economic Factors Factor
This factor measures the degree to which an individual believes that she/he
perceived value from the tradeoff between the perceived benefits of smartphones and
the cost for acquiring and using it. Items EF1, EF2, EF3 and EF4 in the survey
questionnaire measure economic factors using a five-point Likert scale arranged as: (1)
“strongly disagree”, (2) “disagree”, (3) "neither disagree nor agree", (4) "agree", (5)
“strongly agree”.
Table 41 and Table 42 show the respondents’ responses by proportion and
statistics for item EF1; one of four items designed to measure effort the expectancy
factor. Of the total respondents, 198 (31%) selected answer "neither disagree nor
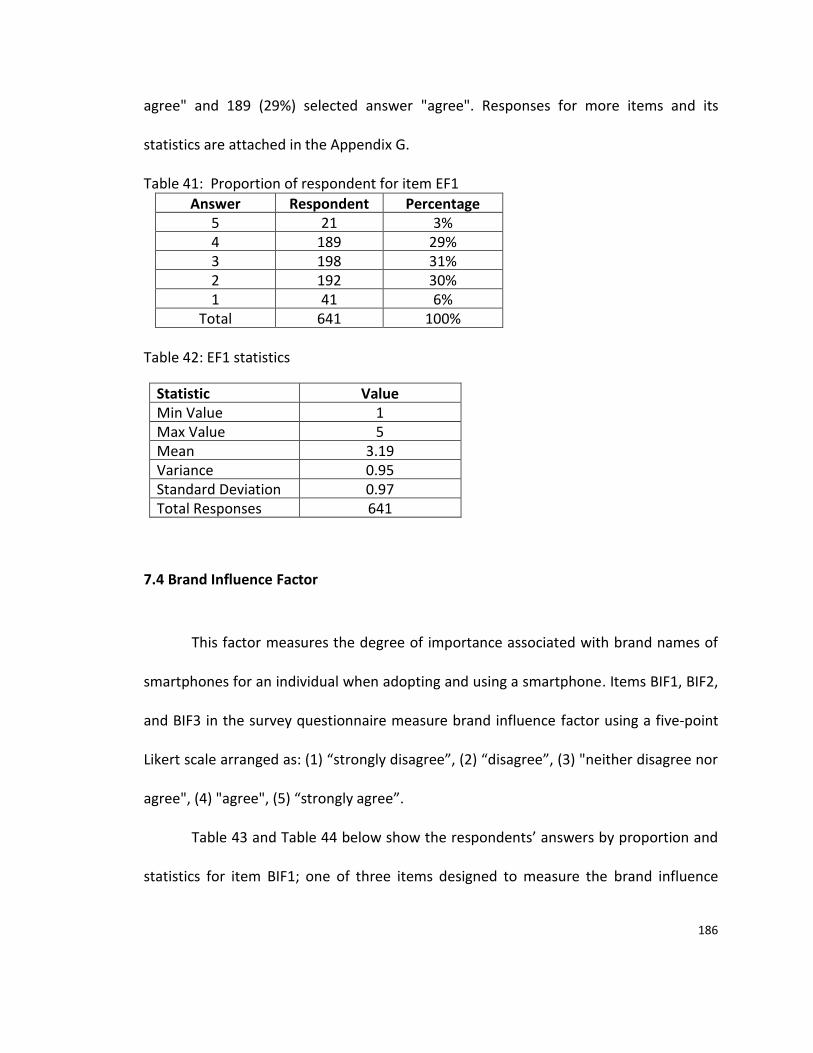
186
agree" and 189 (29%) selected answer "agree". Responses for more items and its
statistics are attached in the Appendix G.
Table 41: Proportion of respondent for item EF1
Answer Respondent Percentage 5 21 3% 4 189 29% 3 198 31% 2 192 30% 1 41 6%
Total 641 100% Table 42: EF1 statistics
Statistic Value Min Value 1 Max Value 5 Mean 3.19 Variance 0.95 Standard Deviation 0.97 Total Responses 641
7.4 Brand Influence Factor
This factor measures the degree of importance associated with brand names of
smartphones for an individual when adopting and using a smartphone. Items BIF1, BIF2,
and BIF3 in the survey questionnaire measure brand influence factor using a five-point
Likert scale arranged as: (1) “strongly disagree”, (2) “disagree”, (3) "neither disagree nor
agree", (4) "agree", (5) “strongly agree”.
Table 43 and Table 44 below show the respondents’ answers by proportion and
statistics for item BIF1; one of three items designed to measure the brand influence
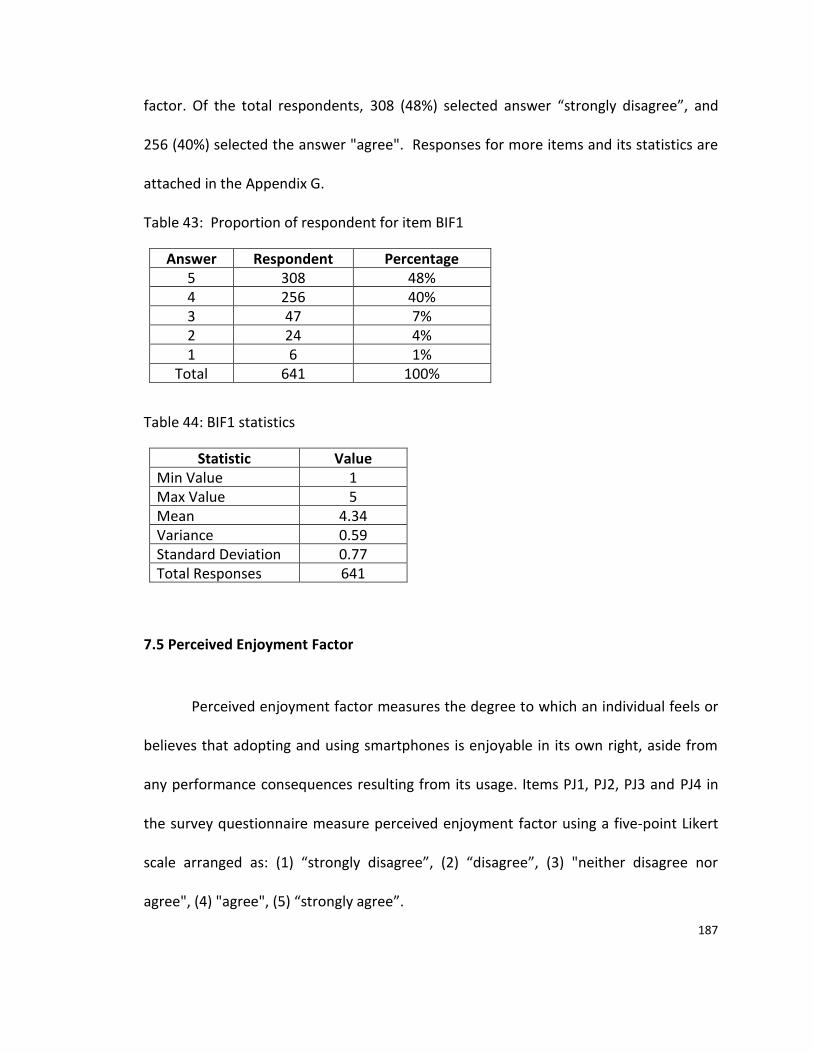
187
factor. Of the total respondents, 308 (48%) selected answer “strongly disagree”, and
256 (40%) selected the answer "agree". Responses for more items and its statistics are
attached in the Appendix G.
Table 43: Proportion of respondent for item BIF1
Answer Respondent Percentage 5 308 48% 4 256 40% 3 47 7% 2 24 4% 1 6 1%
Total 641 100%
Table 44: BIF1 statistics
Statistic Value Min Value 1 Max Value 5 Mean 4.34 Variance 0.59 Standard Deviation 0.77 Total Responses 641
7.5 Perceived Enjoyment Factor
Perceived enjoyment factor measures the degree to which an individual feels or
believes that adopting and using smartphones is enjoyable in its own right, aside from
any performance consequences resulting from its usage. Items PJ1, PJ2, PJ3 and PJ4 in
the survey questionnaire measure perceived enjoyment factor using a five-point Likert
scale arranged as: (1) “strongly disagree”, (2) “disagree”, (3) "neither disagree nor
agree", (4) "agree", (5) “strongly agree”.
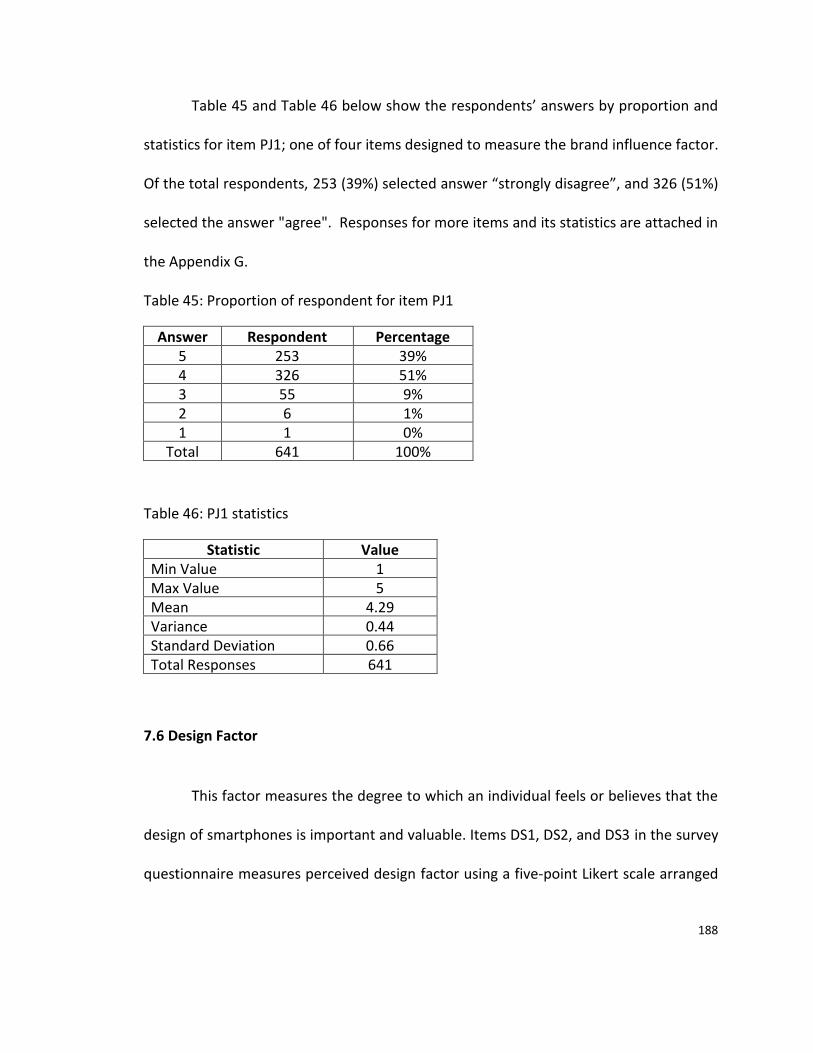
188
Table 45 and Table 46 below show the respondents’ answers by proportion and
statistics for item PJ1; one of four items designed to measure the brand influence factor.
Of the total respondents, 253 (39%) selected answer “strongly disagree”, and 326 (51%)
selected the answer "agree". Responses for more items and its statistics are attached in
the Appendix G.
Table 45: Proportion of respondent for item PJ1
Answer Respondent Percentage 5 253 39% 4 326 51% 3 55 9% 2 6 1% 1 1 0%
Total 641 100%
Table 46: PJ1 statistics
Statistic Value Min Value 1 Max Value 5 Mean 4.29 Variance 0.44 Standard Deviation 0.66 Total Responses 641
7.6 Design Factor
This factor measures the degree to which an individual feels or believes that the
design of smartphones is important and valuable. Items DS1, DS2, and DS3 in the survey
questionnaire measures perceived design factor using a five-point Likert scale arranged
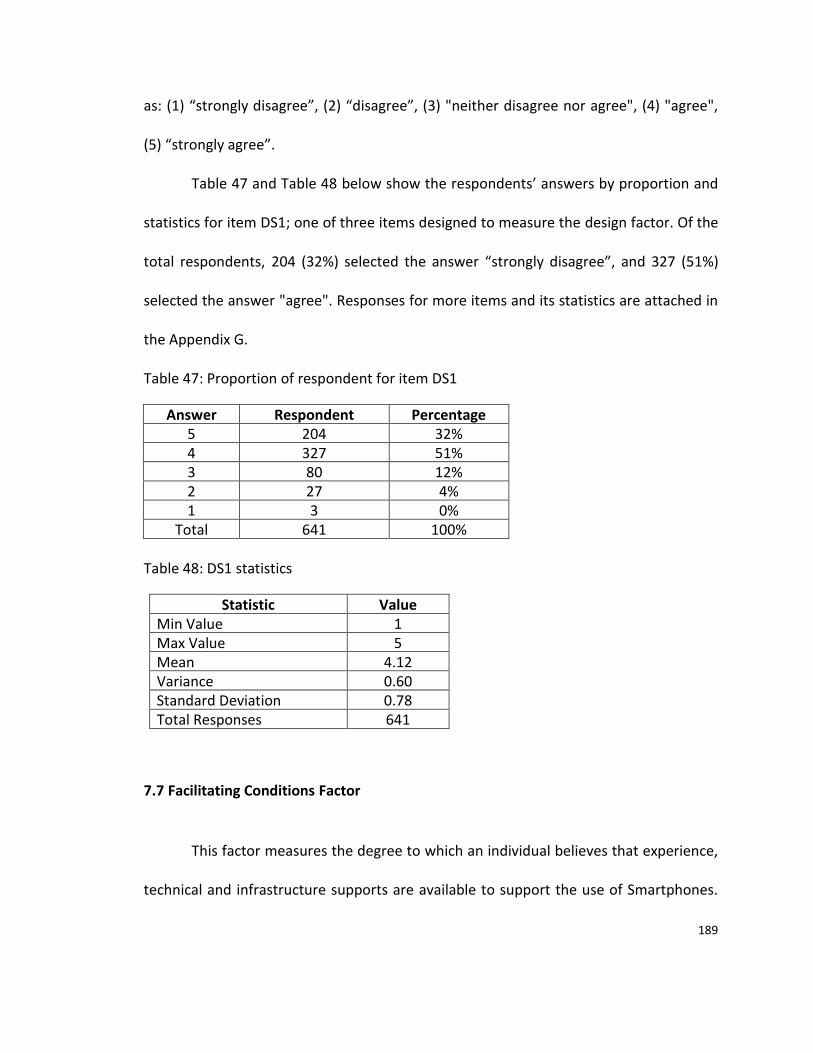
189
as: (1) “strongly disagree”, (2) “disagree”, (3) "neither disagree nor agree", (4) "agree",
(5) “strongly agree”.
Table 47 and Table 48 below show the respondents’ answers by proportion and
statistics for item DS1; one of three items designed to measure the design factor. Of the
total respondents, 204 (32%) selected the answer “strongly disagree”, and 327 (51%)
selected the answer "agree". Responses for more items and its statistics are attached in
the Appendix G.
Table 47: Proportion of respondent for item DS1
Answer Respondent Percentage 5 204 32% 4 327 51% 3 80 12% 2 27 4% 1 3 0%
Total 641 100% Table 48: DS1 statistics
Statistic Value Min Value 1 Max Value 5 Mean 4.12 Variance 0.60 Standard Deviation 0.78 Total Responses 641
7.7 Facilitating Conditions Factor
This factor measures the degree to which an individual believes that experience,
technical and infrastructure supports are available to support the use of Smartphones.
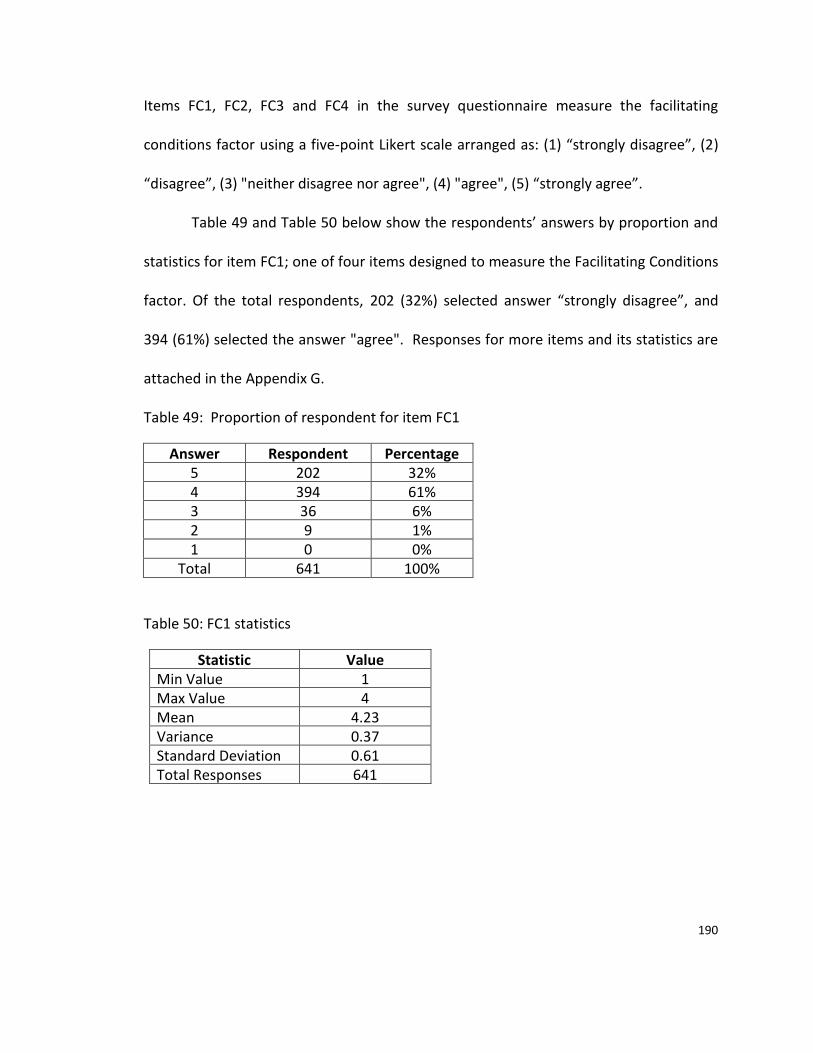
190
Items FC1, FC2, FC3 and FC4 in the survey questionnaire measure the facilitating
conditions factor using a five-point Likert scale arranged as: (1) “strongly disagree”, (2)
“disagree”, (3) "neither disagree nor agree", (4) "agree", (5) “strongly agree”.
Table 49 and Table 50 below show the respondents’ answers by proportion and
statistics for item FC1; one of four items designed to measure the Facilitating Conditions
factor. Of the total respondents, 202 (32%) selected answer “strongly disagree”, and
394 (61%) selected the answer "agree". Responses for more items and its statistics are
attached in the Appendix G.
Table 49: Proportion of respondent for item FC1
Answer Respondent Percentage 5 202 32% 4 394 61% 3 36 6% 2 9 1% 1 0 0%
Total 641 100%
Table 50: FC1 statistics
Statistic Value Min Value 1 Max Value 4 Mean 4.23 Variance 0.37 Standard Deviation 0.61 Total Responses 641
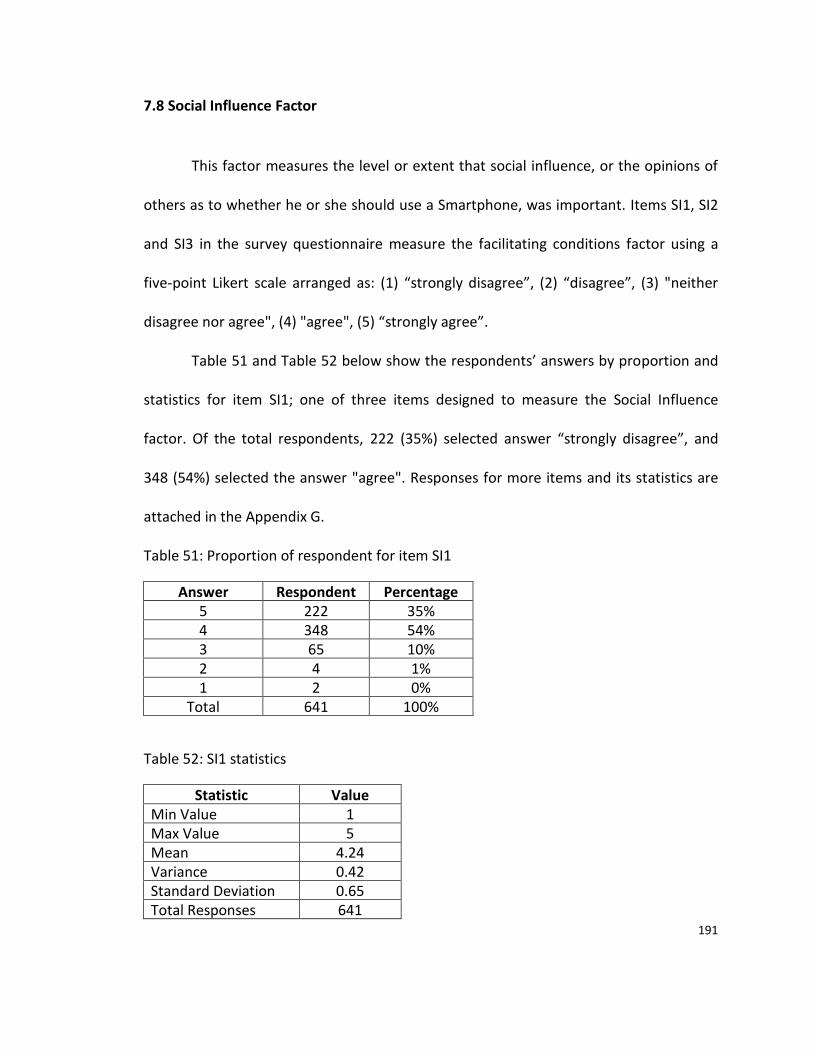
191
7.8 Social Influence Factor
This factor measures the level or extent that social influence, or the opinions of
others as to whether he or she should use a Smartphone, was important. Items SI1, SI2
and SI3 in the survey questionnaire measure the facilitating conditions factor using a
five-point Likert scale arranged as: (1) “strongly disagree”, (2) “disagree”, (3) "neither
disagree nor agree", (4) "agree", (5) “strongly agree”.
Table 51 and Table 52 below show the respondents’ answers by proportion and
statistics for item SI1; one of three items designed to measure the Social Influence
factor. Of the total respondents, 222 (35%) selected answer “strongly disagree”, and
348 (54%) selected the answer "agree". Responses for more items and its statistics are
attached in the Appendix G.
Table 51: Proportion of respondent for item SI1
Answer Respondent Percentage 5 222 35% 4 348 54% 3 65 10% 2 4 1% 1 2 0%
Total 641 100%
Table 52: SI1 statistics
Statistic Value Min Value 1 Max Value 5 Mean 4.24 Variance 0.42 Standard Deviation 0.65 Total Responses 641
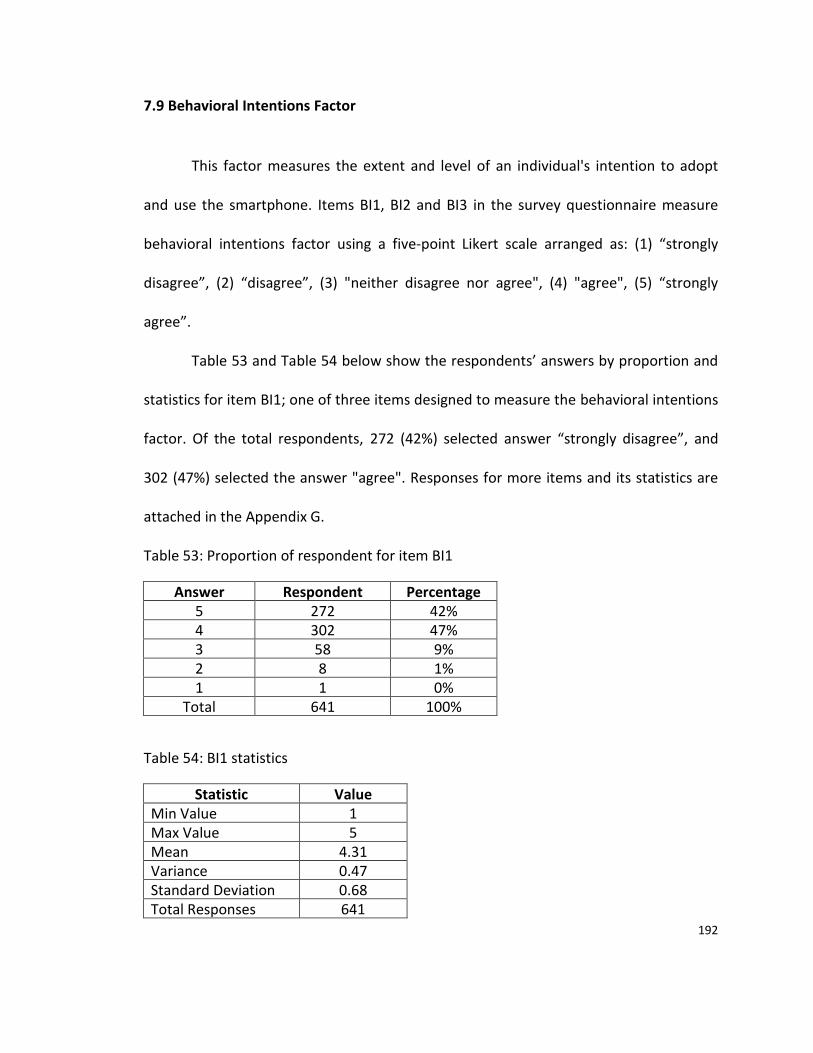
192
7.9 Behavioral Intentions Factor
This factor measures the extent and level of an individual's intention to adopt
and use the smartphone. Items BI1, BI2 and BI3 in the survey questionnaire measure
behavioral intentions factor using a five-point Likert scale arranged as: (1) “strongly
disagree”, (2) “disagree”, (3) "neither disagree nor agree", (4) "agree", (5) “strongly
agree”.
Table 53 and Table 54 below show the respondents’ answers by proportion and
statistics for item BI1; one of three items designed to measure the behavioral intentions
factor. Of the total respondents, 272 (42%) selected answer “strongly disagree”, and
302 (47%) selected the answer "agree". Responses for more items and its statistics are
attached in the Appendix G.
Table 53: Proportion of respondent for item BI1
Answer Respondent Percentage 5 272 42% 4 302 47% 3 58 9% 2 8 1% 1 1 0%
Total 641 100%
Table 54: BI1 statistics
Statistic Value Min Value 1 Max Value 5 Mean 4.31 Variance 0.47 Standard Deviation 0.68 Total Responses 641
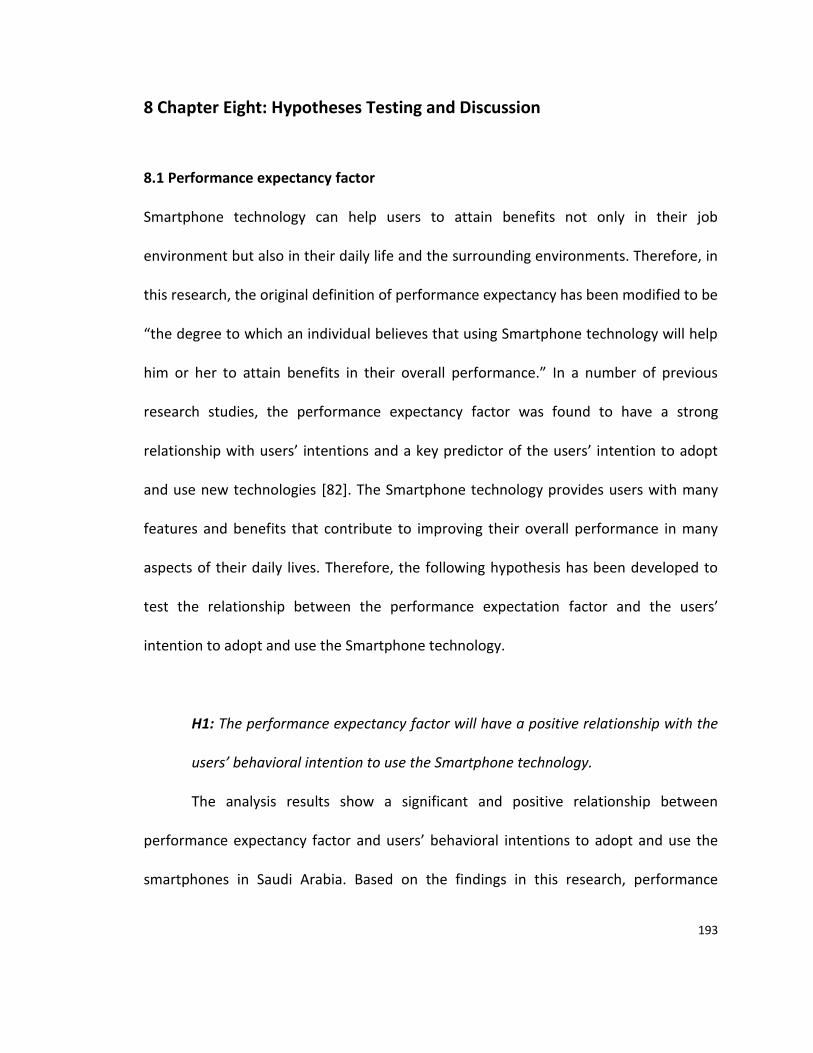
193
8 Chapter Eight: Hypotheses Testing and Discussion
8.1 Performance expectancy factor
Smartphone technology can help users to attain benefits not only in their job
environment but also in their daily life and the surrounding environments. Therefore, in
this research, the original definition of performance expectancy has been modified to be
“the degree to which an individual believes that using Smartphone technology will help
him or her to attain benefits in their overall performance.” In a number of previous
research studies, the performance expectancy factor was found to have a strong
relationship with users’ intentions and a key predictor of the users’ intention to adopt
and use new technologies [82]. The Smartphone technology provides users with many
features and benefits that contribute to improving their overall performance in many
aspects of their daily lives. Therefore, the following hypothesis has been developed to
test the relationship between the performance expectation factor and the users’
intention to adopt and use the Smartphone technology.
H1: The performance expectancy factor will have a positive relationship with the
users’ behavioral intention to use the Smartphone technology.
The analysis results show a significant and positive relationship between
performance expectancy factor and users’ behavioral intentions to adopt and use the
smartphones in Saudi Arabia. Based on the findings in this research, performance
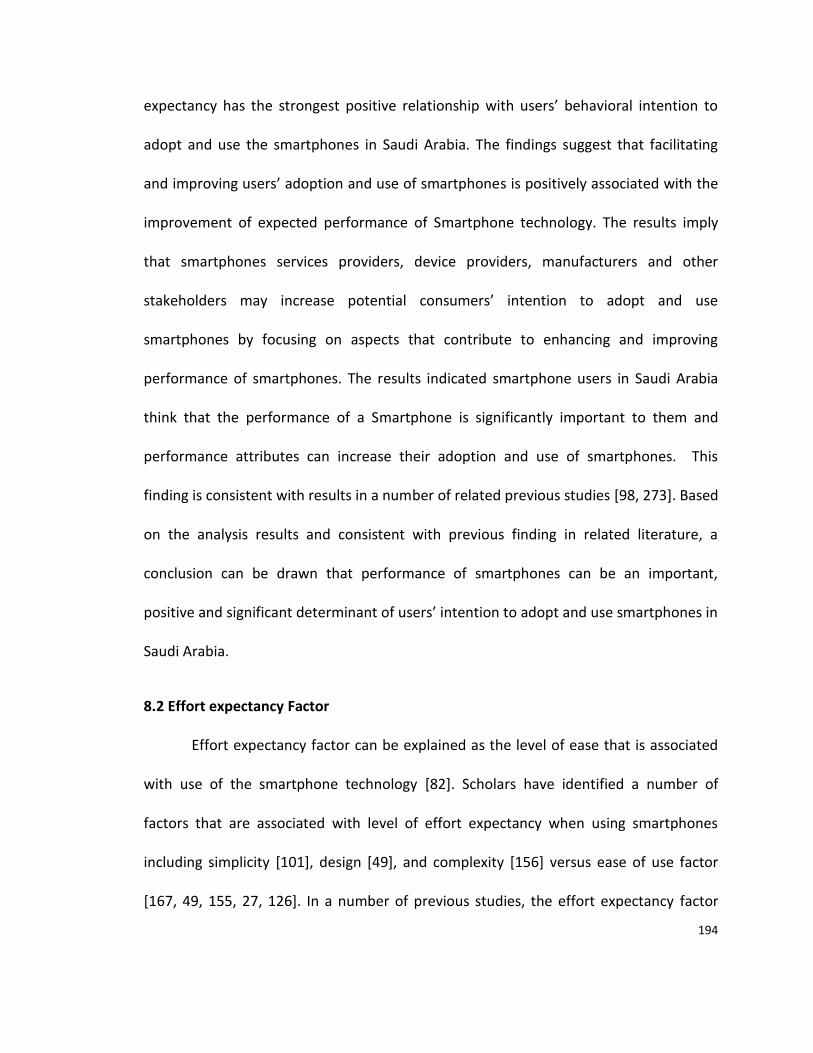
194
expectancy has the strongest positive relationship with users’ behavioral intention to
adopt and use the smartphones in Saudi Arabia. The findings suggest that facilitating
and improving users’ adoption and use of smartphones is positively associated with the
improvement of expected performance of Smartphone technology. The results imply
that smartphones services providers, device providers, manufacturers and other
stakeholders may increase potential consumers’ intention to adopt and use
smartphones by focusing on aspects that contribute to enhancing and improving
performance of smartphones. The results indicated smartphone users in Saudi Arabia
think that the performance of a Smartphone is significantly important to them and
performance attributes can increase their adoption and use of smartphones. This
finding is consistent with results in a number of related previous studies [98, 273]. Based
on the analysis results and consistent with previous finding in related literature, a
conclusion can be drawn that performance of smartphones can be an important,
positive and significant determinant of users’ intention to adopt and use smartphones in
Saudi Arabia.
8.2 Effort expectancy Factor
Effort expectancy factor can be explained as the level of ease that is associated
with use of the smartphone technology [82]. Scholars have identified a number of
factors that are associated with level of effort expectancy when using smartphones
including simplicity [101], design [49], and complexity [156] versus ease of use factor
[167, 49, 155, 27, 126]. In a number of previous studies, the effort expectancy factor
195
was found to have a significant positive relationship with users’ intention to adopt and
use Smartphone technology [164, 98]. Therefore, the following hypothesis has been
developed to test the relationship between the effort expectancy factor and users’
intention to adopt and use the Smartphone technology.
H2: The effort expectancy factor will have a positive relationship with the users’
behavioral intention to adopt and use the Smartphone technology.
The analysis results show a significant and positive relationship between effort
expectancy factor and users’ behavioral intentions to adopt and use the Smartphone
technology in Saudi Arabia. The findings suggest that enhancing and improving users’
intention to adopt and use the smartphones is positively associated with the
improvement of effort expectancy of Smartphone technology and that, smartphones
services providers, device providers and manufacturers as well as other stakeholders
may increase potential consumers’ intention to adopt and use smartphones by focusing
on aspects that contribute to effort expectancy factor such as improving simplicity and
ease of using smartphones. This result indicates that improving the level of effort
expectancy is positively associated with improving the users’ intention to adopt and use
the smartphone. This finding is consistent with results in a number of related previous
studies [98]. Based on the analysis results and consistent with previous findings in
related literature, a conclusion can be drawn that efforts associated with improving use
of smartphones can be important, positive and significant determinants of users’
intention to adopt and use smartphones in Saudi Arabia.
196
8.3 Economic factors Factor
The economic factors factor can be defined as the perceived value of the
tradeoff between the apparent benefits of the technologies and the cost of acquiring
and using it [190, 191]. Economic factors have been identified as a predictor of users’
behavioral intention to adopt and use new information technologies [191]. It has been
indicated that there is a relationship between economic factors and users’ intention to
adopt and use a technology. Many individuals balance the benefits of obtaining a
technology compared to the cost of acquiring that technology [191]. In previous
studies, the perceived cost saving factor was found to have a positive relationship with
users’ intention to use mobile wireless technology via Smartphone [91]. In previous
research that investigated the adoption of smartphones in a number of emerging
countries, scholars found that economic factor such as price found to be one of the
main factors that influence the adoption of smartphones [274]. Scholars found that the
cost of mobile internet has a significant and positive relationship with users’ behavioral
intention to adopt mobile technology [170]. A number of factors related to economic
factors, namely perceived cost [155], perceived cost saving [91] and company
willingness to fund [91] have been identified in previous research as important factors
that are associated with users’ adoption and use of the Smartphone. Therefore, the
following hypothesis is created to test the relationship between the economic factors
factor and users’ intention to adopt and use the Smartphone technology.
197
H3: The economic factors factor will have a positive relationship with the users’
behavioral intention to adopt and use the Smartphone technology.
The analysis conducted did not show a significant relationship between the
economic factor and the behavioral intention factor. In contrast to previous research,
this factor has no significant relationship with users’ intention to adopt and use
Smartphone technology in Saudi Arabia. These results imply, to some extent, the
general feeling by users of smartphones in Saudi Arabia that the price of smartphone
devices and services are reasonable compared to the economic value they offer.
Contrary to popular belief in mobile and smartphones literature, economic factors such
as cost and pricing seem to have no association with users’ intention to adopt and use
smartphones in Saudi Arabia. That may be attributed to the high competition among
smartphones device manufacturers and providers to provide better and cheaper
smartphones devices and services. Moreover, it may be attributed generally to the
strong and growing economy in Saudi Arabia at the time of conducting this research
which contributes to improving users’ ability to consider Smartphone devices and
services as reasonable and very affordable technology for them. Based on analysis and
results a conclusion can be drawn that economic factors related to smartphones are not
a significant determinant of users’ intention to adopt and use smartphones in Saudi
Arabia.
198
8.4 Brand Influence Factor
Brand influence on the adoption and use of a technology is a phenomenon that
has been considered [106, 107]. With regard to Smartphone technology, brand name
has been the focus of scholars in a number of studies, such as exploring the influence of
learning effects on the rate of adoption in the market to better explain the impact of
learning effects on the adoption rate of the iPhone [107]. Brand influence factor was
found to have a positive relationship with users’ adoption of Smartphone technology
[188]. A number of scholars investigated individual attitudes toward the adoption of a
specific Smartphone, namely Blueberry [106]. Brand names of smartphone technology
has been the subject of a number of studies, and many researchers have dedicated their
efforts to study different aspects of one brand, the iPhone [108-111, 7]. Therefore, the
following hypothesis has been developed to test the relationship between the brand
influence factor and users’ intention to adopt and use the Smartphone technology.
H4: The brand influence factor will have a positive relationship with the users’
behavioral intention to adopt and use the Smartphone technology.
The analysis shows a significant and positive relationship between brand
influence factor and the users’ behavioral intention factor. The results indicate that the
users’ intention to adopt and use Smartphone technology in Saudi Arabia is significantly
and positively associated with the users’ perception of smartphones’ brand. The findings
suggest that enhancing and improving users’ perception of a Smartphone's brand could
positively attribute to their intention to adopt and use smartphones. Moreover, the
199
results imply that smartphones’ service providers, device manufacture and other
stakeholders may increase potential consumers’ intention to adopt and use
smartphones by focusing on aspects that contribute to brand influence.
The Apple iPhone could be an example of how brand influence is positively
associated with users’ intention to adopt and use smartphones. Loyal iPhone users have
adopted the Apple iPhone because they have a positive perception of Apple; they are
more excited to see the next generation of the iPhone; and, they are willing to wait in
line and pay more money to get it because it's the Apple brand. Hard work to improve
the brand image of a Smartphone such Apple can positively attribute to users’ intention
to adopt and use smartphones, especially in Saudi Arabia. Based on the analysis results
and consistent with previous finding in related literature, a conclusion can be reached
that the brand of a Smartphone can be a positive and significant predictor of users’
intentions to adopt and use smartphones in Saudi Arabia.
8.5 Perceived Enjoyment Factor
Scholars in a number of previous studies have found perceived enjoyment to be
a significant predictor of users’ intention to adopt and use new information technology
[193, 194, 25] and their behavioral intention to adopt and use technology related to
smartphones [98, 166, 90]. Therefore, the following hypothesis is created to test the
relationship between the perceived enjoyment factor and users’ intention to adopt and
use the Smartphone technology.
200
H5: The perceived enjoyment factor will have a positive relationship with users’
behavioral intention to adopt and use the Smartphone technology.
The analysis results show a significant and positive relationship between
perceived enjoyment factor and users’ behavioral intention factor. The results indicate
that, users’ intention to adopt and use Smartphone technology in Saudi Arabia is
significantly and positively associated with the users’ perceived enjoyment of the
smartphones. The finding suggests that, enhancing and improving users’ perceived
enjoyment of a Smartphone could positively attribute to their intention to adopt and
use smartphones. Moreover, the results imply that smartphones services providers,
device manufactures and other stakeholders may increase potential consumers’
intention to adopt and use smartphones by focusing on improving aspects that
contribute to users’ enjoyment of Smartphones. The finding of this analysis is aligned
with the results in a number of previous studies [98]. Based on findings, and consistent
with previous findings in related literature, a conclusion can be reached that perceived
enjoyment of smartphones can be an important, positive and significant determinant of
users’ intention to adopt and use smartphones in Saudi Arabia.
8.6 Design Factor
Design is an important aspect that has been used by many manufacturers to
distinguish and differentiate their products to make them more appealing to consumers.
In previous research, scholars found design factor to have an important and positive
relationship with users’ behavioral intention to adopt Smartphone technology [49]
201
Therefore, the following hypothesis is created to test the relationship between the
design factor and users’ intention to adopt and use the Smartphone technology.
H6: The design factor will have a positive relationship with the users’ behavioral
intention to adopt and use the Smartphone technology.
The analysis results show a significant and positive relationship between design
factor and users’ behavioral intention factor. The findings indicate that users’ intention
to adopt and use Smartphone technology in Saudi Arabia is significantly and positively
associated with the design of the Smartphone and that enhancing and improving the
design of a Smartphone could positively attribute to users’ intention to adopt and use
Smartphones, especially in Saudi Arabia. Moreover, the results imply that Smartphone
device providers and manufacturers may increase potential consumers’ intention to
adopt and use smartphones by focusing on aspects that contribute to the design of the
smartphones. This finding, to some extent, is consistent with the results in a number of
previous studies, which indicated that design can positively and significantly contribute
to users’ adoption and use of smartphones. Based on findings and consistent with
previous results in related literature, a conclusion can be drawn that the design of a
Smartphone can be an important, positive and significant determinant of users’
intention to adopt and use smartphones in Saudi Arabia.
8.7 Social Influence Factor
As explained earlier the social influence factor can vary in some emerging
regions. Scholars indicated that the social influence factor has a relationship with users’
202
adoption and use of technology [82]. A number of factors, namely self-efficacy [27],
social norms [90], and social pressure [126] have been indicated in previous research as
important factors that are related to social influence on users’ adoption of and use of
the Smartphone and its related technology. Moreover, the social influence factor has
been found to have a significant and positive influence on users’ adoption of the
Smartphone [275, 42]. Subjective norms were found to have a significant and positive
relationship with users’ adoption and use of the Smartphone [43]. Scholars pointed out
the important role of cultural factors and its influence on the adoption use of new
information technologies [32-36]. Saudi society has different cultural contexts in that it
is characterized as a society that is more collectivist in nature and in which individuals
have closer personal ties with each other and influential effects among these contacts
[32]. A number of scholars empirically studied the adoption of technology related to the
Smartphone. They found that social influence is a key factor that directly influences the
use behavior factor [276]. Therefore, the following hypothesis is created to test the
relationship between the social influence factor and usage behavior.
H7: The Social Influence factor will have a positive relationship with the usage
behavior factor.
The analysis results show a significant and positive relationship between the
social influence factor and the use behavior factor. The results indicate that users’ use
behavior regarding Smartphone technology in Saudi Arabia is significantly and positively
associated with the social influence factor. The findings further suggest that the
203
surrounding social influence could positively attribute to users’ use behavior of
smartphones. Moreover, the results imply that smartphones service providers and
manufacturers may increase potential consumers’ use behavior in using smartphones
by paying more attention to the social influences in a region and focusing on aspects
that contribute to social influence in that region. This finding is aligned with the results
in a number of previous studies in which social influence showed a positive and
significant relationship with use of smartphones and its related technologies as
mentioned above. Based on that, and consistent with previous findings in related
literature, a conclusion can be drawn that social influence can be an important, positive
and significant determinant of users’ actual use of smartphones in Saudi Arabia.
8.8 Facilitating conditions factor
With regard to Smartphone technology, facilitating conditions can include
connectivity and internet service availability, services support, usage information,
system compatibility, individual financial resources, and other factors that facilitate
better use of this technology. A number of factors have been identified that are related
to facilitating conditions. Scholars, in previous research, indicated that the facilitating
conditions factor has a significant relationship with users’ adoption and use of
smartphones in e-health services [164]. Moreover, researchers found that the
facilitating conditions factor has a significant influence on adoption and use of
Smartphone technology among older adults [98]. Therefore, the following hypothesis is
204
created to test the relationship between the facilitating conditions factor and the use
behavior.
H8: The Facilitating conditions factor will have a positive relationship with the
use behavior.
The analysis conducted did not show a significant relationship between the
facilitating conditions factor and the use behavior factor. In contrast to related previous
research, the facilitating conditions factor has no significant relationship with actual use
of smartphones in Saudi Arabia. This result could imply, to some extent, a general
feeling among users of smartphones in Saudi Arabia that service support, usage
information, system compatibility, individual financial resources, and experience are
widely available and satisfied. This is contrary to multiple findings in research related to
mobile and smartphones, facilitating conditions related factors such as services support,
usage information, system compatibility, individual financial resources, and experience
seems not to induce significant association with users’ actual use of smartphones in
Saudi Arabia. That can be attributed to the wide availability of technical supports,
reliable infrastructure and users’ knowledge and experiences of the actual use of
Smartphone technology in Saudi Arabia. Moreover, that could be attributed to the hard
work by smartphones services providers and device manufacturers to provide
smartphones users with the needed technical supports, reliable infrastructure and
better knowledge and experiences driven by high competition telecommunications
companies in Saudi Arabia and the smartphones devise manufacturers worldwide.

205
8.9 Behavioral Intention Factor
A number of researchers examined the relationship between the behavioral
intention factor and the use behavior factor or actual use of technology. Their findings
indicated that the behavioral intention factor is a key and important predictor of use
behavior (actual use) of smartphones and its related technologies [199, 82, 159]. Use
behavior or actual use of technology has been found to be associated with users’
behavioral intention in many previous studies. Therefore, behavioral intention is
expected to have a positive relationship with the use behavior factor or actual use of
smartphones. Thus, the following hypothesis is created.
H9: The behavioral intentions factor will have a positive relationship with the Use
behavior factor.
The analysis results show a significant and positive relationship between
perceived behavioral intentions and the use behavior factor. The results indicate that
use behavior or actual usage of Smartphone technology in Saudi Arabia is significantly
and positively associated with the users’ behavioral intentions to adopt and use the
Smartphone. The findings suggest that enhancing and improving users’ use behavior or
actual usage of smartphones could positively attribute to improving and enhancing their
behavioral intention to adopt and use smartphones. Moreover, the results imply that
smartphones services providers, device manufactures and other stakeholders may
increase potential actual usage of smartphones by focusing on aspects that contribute
to users’ behavioral intentions to adopt and use Smartphone. Moreover, a number of
206
factors such as performance expectancy, effort expectancy, brand influence, perceived
enjoyment, and design have a positive indirect relationship with users’ actual use of
smartphones through users’ behavioral intention factor. This finding corresponds with
the results of a number of previous studies which indicated that users’ behavioral
intention is an important determinant of actual use. Based on analysis results and
consistent with previous findings in related literature, a conclusion can be drawn that
users’ behavioral intentions can be an important, positive and significant determinant of
users’ actual use of smartphones in Saudi Arabia.
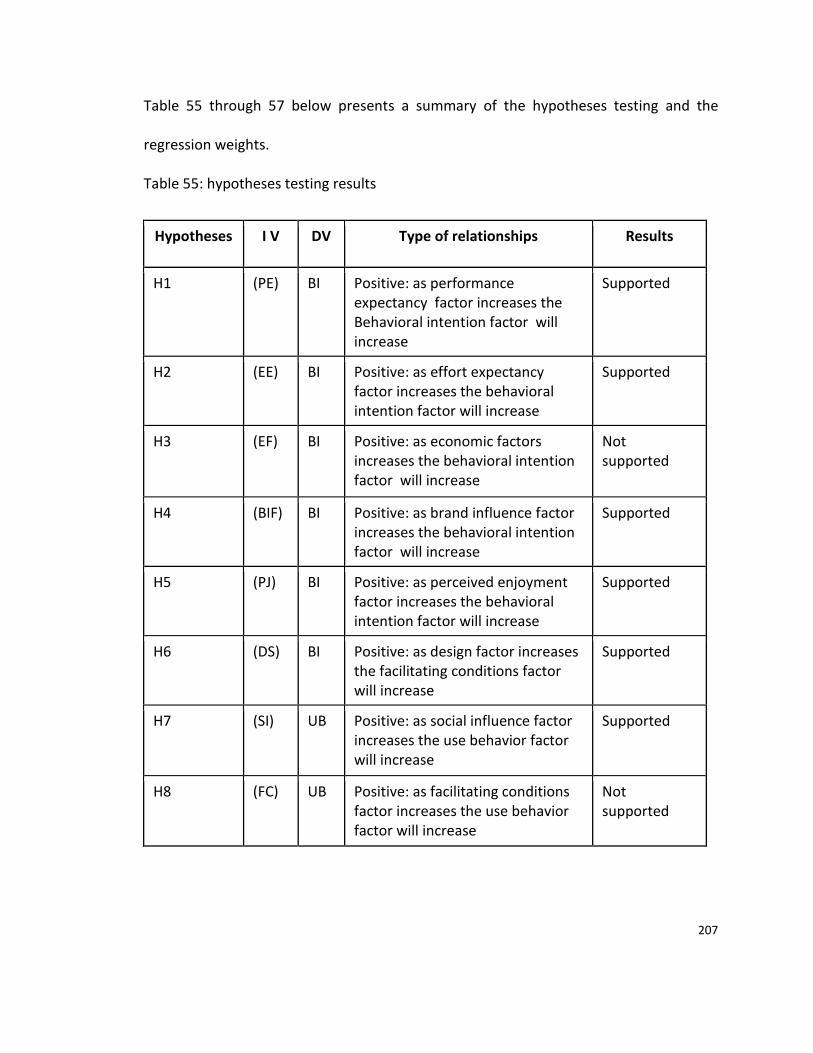
207
Table 55 through 57 below presents a summary of the hypotheses testing and the
regression weights.
Table 55: hypotheses testing results
Hypotheses I V DV Type of relationships Results
H1 (PE) BI Positive: as performance expectancy factor increases the Behavioral intention factor will increase
Supported
H2 (EE) BI Positive: as effort expectancy factor increases the behavioral intention factor will increase
Supported
H3 (EF) BI Positive: as economic factors increases the behavioral intention factor will increase
Not supported
H4 (BIF) BI Positive: as brand influence factor increases the behavioral intention factor will increase
Supported
H5 (PJ) BI Positive: as perceived enjoyment factor increases the behavioral intention factor will increase
Supported
H6 (DS) BI Positive: as design factor increases the facilitating conditions factor will increase
Supported
H7 (SI) UB Positive: as social influence factor increases the use behavior factor will increase
Supported
H8 (FC) UB Positive: as facilitating conditions factor increases the use behavior factor will increase
Not supported
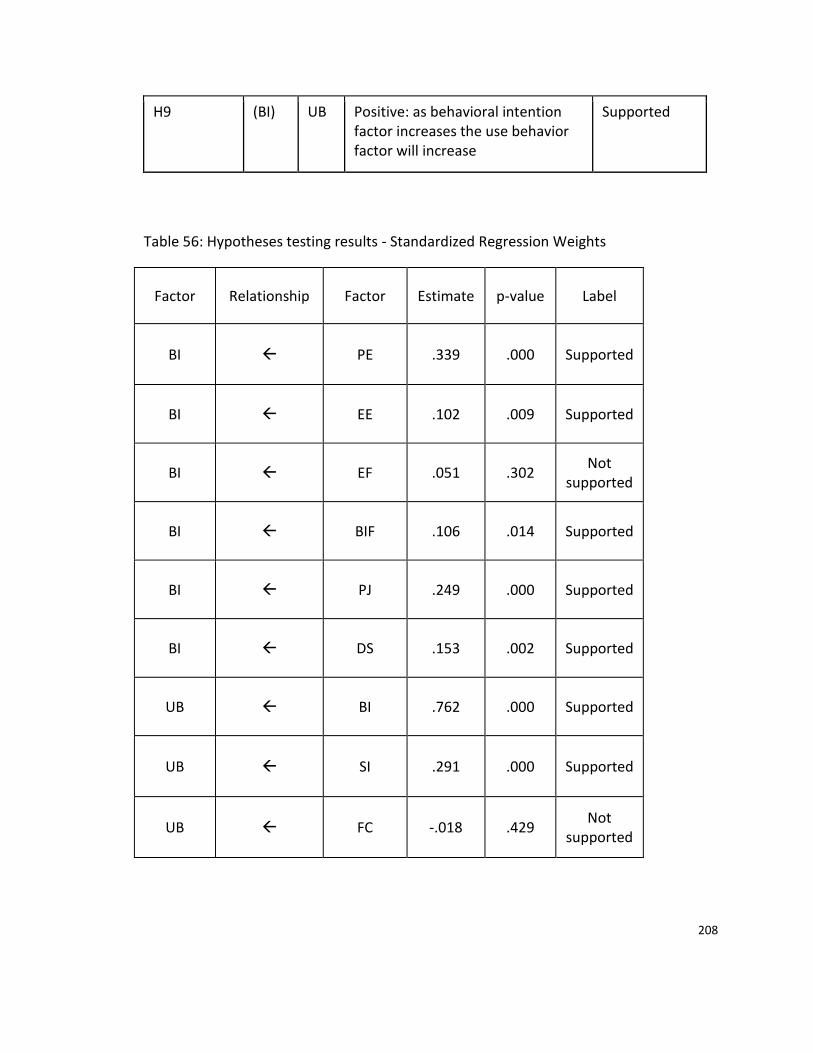
208
Table 56: Hypotheses testing results - Standardized Regression Weights
Factor Relationship Factor Estimate p-value Label
BI PE .339 .000 Supported
BI EE .102 .009 Supported
BI EF .051 .302 Not
supported
BI BIF .106 .014 Supported
BI PJ .249 .000 Supported
BI DS .153 .002 Supported
UB BI .762 .000 Supported
UB SI .291 .000 Supported
UB FC -.018 .429 Not
supported
H9 (BI) UB Positive: as behavioral intention factor increases the use behavior factor will increase
Supported
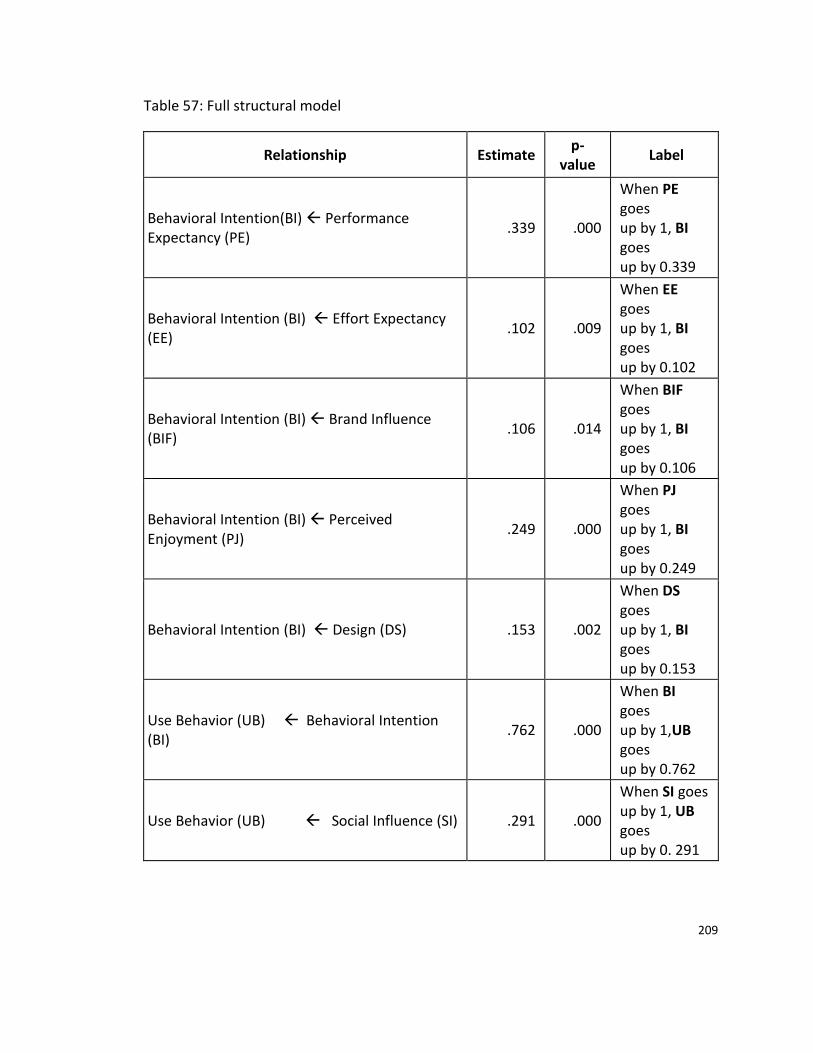
209
Table 57: Full structural model
Relationship Estimate p-
value Label
Behavioral Intention(BI) Performance Expectancy (PE)
.339 .000
When PE goes up by 1, BI goes up by 0.339
Behavioral Intention (BI) Effort Expectancy (EE)
.102 .009
When EE goes up by 1, BI goes up by 0.102
Behavioral Intention (BI) Brand Influence (BIF)
.106 .014
When BIF goes up by 1, BI goes up by 0.106
Behavioral Intention (BI) Perceived Enjoyment (PJ)
.249 .000
When PJ goes up by 1, BI goes up by 0.249
Behavioral Intention (BI) Design (DS) .153 .002
When DS goes up by 1, BI goes up by 0.153
Use Behavior (UB) Behavioral Intention (BI)
.762 .000
When BI goes up by 1,UB goes up by 0.762
Use Behavior (UB) Social Influence (SI) .291 .000
When SI goes up by 1, UB goes up by 0. 291
210
9 Chapter nine: Conclusion, Research Contribution, Limitation and Future
Research
9.1 Conclusion
This dissertation developed a research model based on literature review, existing
related theoretical models and the use of a number of qualitative methods to obtain
experts’ opinions. The developed research model has been utilized, using the data
collected to explore the key factors that are associated with users’ adoption and use of
smartphones in emerging regions, specifically in the case of Saudi Arabia. This
dissertation has been conducted starting with an extensive literature review to gain
better understanding of research conducted related to the adoption of Smartphone
technology and to understand the IT adoption models related to the adoption and use
of Smartphone technology.
An extensive literature review has been conducted to obtain more insight into
the existing research related to the adoption and use of smartphones and the
theoretical models that have been utilized in previous related research. Taxonomy of
factors related to the adoption and use of smartphones have been developed based on
the literature review. More than forty factors related to the adoption and use of
smartphones in previous research were reviewed and identified. A research model has
been developed for this research based on the UTAUT model. A number of qualitative
methods have been conducted to review, elevate, validate, and select the factors that
211
are most related and can be included in the research model to explore and study users’
adoption and use of smartphones.
Based on the literature review and the results of the qualitative methods
conducted, the research model has been developed, modified and finalized. Moreover,
hypotheses have been developed to explain and test the relationships among factors in
the research model. A survey instrument has been developed, translated into Arabic
language and a web-based survey questionnaire was designed. The web-based survey
was administered to users of smartphones in Saudi Arabia to collect data. Data was
screened, organized and statistically analyzed using SEM, SPSS and AMOS software.
Research hypotheses were tested based on the data collected. The results indicated that
performance expectancy, effort expectancy, brand influence, perceived enjoyment, and
design factors have a positive and significant relationship with users’ behavioral
intention to adopt and use smartphones in Saudi Arabia. Also, the results indicate that
the social influence factor has a significant and positive relationship with use behavior
or actual use of Smartphones in Saudi Arabia.
The results of this dissertation indicate both similarities and differences between
prior studies and this study:
• In consistent with previous research, the results imply that:
– Many smartphones users in Saudi Arabia are influenced mostly by the
expected performance of their smartphones, benefits and gains that they
may attain in their daily life from adopting and using smartphones.
212
– Many smartphones users in Saudi Arabia are influenced by their peers,
close friends and other figures in their society in their use behavior of
smartphones and they are more likely to follow the social norm in their
society.
– More smartphones users in Saudi Arabia are looking for more hedonic
features and entertainment options in their smartphones.
– More smartphones users in Saudi Arabia believe that the appearance,
color, the overall look and feel of smartphones are important to them
and they pay attention to the brand names of smartphones.
• In contrary with previous research, the results imply that:
– Many smartphones users in Saudi Arabia believe that the cost and pricing
of smartphones are reasonable and acceptable for them.
– Many smartphones users in Saudi Arabia may have more experiences and
knowledge with use of smartphones and its related technologies.
Implications of Findings and Recommendations:
The findings in this dissertation showed that smartphones users in Saudi Arabia rely
mainly on their perceptions of performance expected of the smartphones to make
decisions to adopt and use smartphones. Therefore, the implications for related
practitioners are to improve the expected performance and the expected benefits or
213
gains of adopting and use smartphones to encourage and increase more favorable
intentions among potential users to adopt and use smartphones. Moreover, the
results imply that more people will adopt and use smartphones in Saudi Arabia if
smartphones became more useful to them in their daily lives, enabling them to
accomplish tasks more quickly, and increasing their overall productivity.
Brand name influence was found to be a one of the factors that could encourage
and increase users’ intention to adopt and use smartphones; therefore, it is
recommended to enhance brand name and increase users’ loyalty to their brand
name.
Perceived enjoyments were found to be one of the key factors that could increase
users’ intention to adopt and use smartphones; therefore, it is recommended that
smartphones be made more enjoyable to users.
Design of the smartphones was found to be one of the factors that could increase
users’ intention to adopt and use smartphones; therefore, it is recommended that
the design of smartphones be enhanced to appeal to more users.
9.2 Research Contributions
This empirical research provides a number of useful contributions to the body of
knowledge on the information technology adoption, related research and to
practitioners in the IT domain including:
214
In this dissertation a research model have been developed and modified based
on existing IT adoption theoretical model, literature review, and the use of
qualitative methods.
“The Communication and Information Technology Commission (CITC) has
adopted a cooperative strategy between the related parties (government
agencies, media players, telecom operators, and educational bodies in the
country) to leverage the broadband based economy, mainly the e-commerce”
[277, 278]. The results of this dissertation can contribute to CITC and support
strategy. CITC may implement their strategy partially based on the following
implication: The finding showed that the social influence factor showed a
positive and significant relationship with the actual use of Smartphones in Saudi
Arabia. Therefore, providing incentives and encouragement to groups’ leaders,
celebrities, society leaders and other figures could facilitate, drive and encourage
the use of smartphones to obtain services and products by government
agencies.
This research has comprehensively studied the general users of Smartphone
technology to provide more insight into the key factors that are associated with
users’ intention to adopt and use the Smartphone in Saudi Arabia. The empirical
results of this dissertation provide beneficial information to both researchers
215
and practitioners in the IT domain. Furthermore, the outcome of this research
provides stakeholders with valuable insight and precise information that is based
on data obtained from general smartphones users in Saudi Arabia. Those insights
and information can greatly assist in improving the adoption and use of
Smartphone technology, enhancing users’ experiences, improving products,
services and their related markets, especially in Saudi Arabia.
This empirical research is expected to show the importance and benefits of
utilizing and modifying theoretical model to better understand users’ intention
to adopt and use the Smartphone. Furthermore, this research has empirically
demonstrated the use of the literature review, a number of qualitative methods,
and the modification of the IT theoretical model UTAUT to study, test and
analyze users’ adoption and use of new IT such as the Smartphone technology in
emerging regions such as Saudi Arabia.
A number of market researchers indicated that the capabilities of smartphones
provide marketers with a substantial possibility to reach and better serve their
consumers [279]. Also, they indicated that the more the price of the smartphone
and its services decrease the more users will most likely increase their online
usage [279]. This provides a huge opportunity to expand their marketing
strategy with mobile marketing strategy. The finding showed that the price of
smartphones and their service seems to be reasonable and acceptable to many

216
users in Saudi Arabia and this can be used by marketers to align and expand their
strategies accordingly.
Telecommunication companies in Saudi Arabia are facing a sharp decline in their
revenues for the year 2015 [280]. An expert in Communications and Information
Technology Dr. Ahmed Sindi, linked that decline in revenue to several causes,
including the lack of effective actions to reach their customers and understand
their needs and preferences in time [280]. The results of this dissertation provide
useful insights and information that can be used by telecommunication
companies in Saudi Arabia to better understand their customers and develop
their strategies accordingly.
A trend noticed is that many smartphones users are starting to shift to the use of
smartphones for computing more than using laptops [118]. Also, it was indicated
that there is a lack of more innovative soft keyboard options in smartphones
[118]. The results in this dissertation show that performance expectancy is a key
factor that has a positive and significant relationship with users’ intention to
adopt and use smartphones in Saudi Arabia. The results imply that more people
will adopt and use smartphones if the phone could help them to attain more
benefits in their daily life, enable them to accomplish tasks more quickly, and to
improve their performance in many of their daily activities. Based on those
results, practitioners could modify and align their strategy and policy to focus
217
more on developing and building smartphones that could satisfy users’
preferences and needs.
As mentioned in the introduction of this dissertation, [8, 6, 7] smartphones
manufacturers and providers change their strategies and policies in order to
obtain a better market share. For example; Apple had a policy that made its
iphone available exclusively through AT&T. The company decided to change its
strategies and sell their product to more companies to increase its market share.
The results of this dissertation provide a useful insight that can be used by
practitioners in building and developing a better strategies and policies based on
users’ points of view.
9.3 Limitation and Future Research
The research model that has been developed in this dissertation was developed
to explore and study key factors that may have relationships with users’
adoption and use of Smartphone technology in Saudi Arabia using a
comprehensive and holistic approach. This research did not look at other
mediating factors that may modify the relationships between the factors in the
research model. The researcher is considering future research that reviews,
evaluates and includes possible mediating factors and explores the influence of
these mediating factors.
This research has collected data from Smartphone users in Saudi Arabia at one
point in time. The economy of Saudi Arabia at that time was very strong and
218
people were eager to spend and explore newer and better technology. The
results of this study showed that economic factors did not show a significant
relationship with users’ behavioral intention to adopt and use Smartphones in
Saudi Arabia. The economic factors could change dramatically from any change
in the Saudi Arabian economy, which could change the significance of the results
found in this research.
This dissertation explored the key factors that may have relationships with users’
adoption and use of smartphones in a comprehensive and holistic way. Based on
the results of this research, future research can focus more on the specific
factors that have significant relationships. Each of these key factors has a
number of sub-factors which may have different contributes. Based on the
results of this research, further research can be conducted that can focus on the
sub-factors and investigate their relationships and influence.
This research has collected data from general smartphones users in Saudi Arabia
and did not focus on early adaptors of smartphones. Early adopters may have a
different view of smartphones that could be targeted and investigated in future
research.
The results can not be generalizable on all of the Saudi users of smartphones
since the data have been collected from one of the four main
219
telecommunications companies in Saudi Arabia. A future research may extend
the scope of the simple and collect data from all four companies.
220
References:
[1] M. Rohan. (2015, 6/2015). Worldwide Smartphones Market Worth US$258.9 Billion By 2015 Available: http://www.marketsandmarkets.com/PressReleases/worldwide-smartphones-market.
[2] A. M. Kaplan, "If you love something, let it go mobile: Mobile marketing and mobile social media 4x4," Business Horizons, vol. 55, pp. 129-139, 2012.
[3] S. Santhipriya, B. Sastry, and K. Akshitha, "Securing Smartphone Apps In Online Environment," International Journal of Mathematical Archive (IJMA) ISSN 2229-5046, vol. 2, 2011.
[4] G. Gueguen, "Coopetition and business ecosystems in the information technology sector: the example of Intelligent Mobile Terminals," International journal of entrepreneurship and small business, vol. 8, pp. 135-153, 2009.
[5] R. M. Müller, B. Kijl, and J. K. Martens, "A comparison of inter-organizational business models of mobile app stores: There is more than open vs. closed," Journal of theoretical and applied electronic commerce research, vol. 6, pp. 63-76, 2011.
[6] S. P. Hall and E. Anderson, "Operating systems for mobile computing," Journal of Computing Sciences in Colleges, vol. 25, pp. 64-71, 2009.
[7] J. West and M. Mace, "Browsing as the killer app: Explaining the rapid success of Apple's iPhone," Telecommunications Policy, vol. 34, pp. 270-286, 2010.
[8] M. Butler, "Android: Changing the mobile landscape," Pervasive Computing, IEEE, vol. 10, pp. 4-7, 2011.
[9] S. Alwahaishi and V. Snášel, "Factors Influencing The Consumer’ Adoption Of Mobile Internet," in The Third International Conference on Digital Information and Communication Technology and its Applications (DICTAP2013), 2013, pp. 31-39.
[10] E. G. Carayannis and S. C. Clark, "Do smartphones make for smarter business? The smartphone CEO study," Journal of the Knowledge Economy, vol. 2, pp. 201-233, 2011.
[11] A. J. Rohm, T. T. Gao, F. Sultan, and M. Pagani, "Brand in the hand: A cross-market investigation of consumer acceptance of mobile marketing," Business Horizons, vol. 55, pp. 485-493, 2012.
[12] H. Chun, H. Lee, and D. Kim, "The integrated model of smartphone adoption: Hedonic and utilitarian value perceptions of smartphones among Korean college students," Cyberpsychology, Behavior, and Social Networking, vol. 15, pp. 473-479, 2012.
[13] S. M. Goldman, "Transformers," Journal of Consumer Marketing, vol. 27, pp. 469-473, 2010.
[14] B. Saddik, D. Barakah, and B. Aldosari, "A study of PDA and Smartphone adoption rates at King Saud Medical City Hospitals," in Medical Information and
221
Communication Technology (ISMICT), 2012 6th International Symposium on, 2012, pp. 1-3.
[15] (3/30/2014). Global market share held by the leading smartphone operating systems in sales to end users from 1st quarter 2009 to 4th quarter 2013. Available: http://www.statista.com/statistics/266136/global-market-share-held-by-smartphone-operating-systems/
[16] M. Kenney and B. Pon, "Structuring the smartphone industry: is the mobile internet OS platform the key?," Journal of Industry, Competition and Trade, vol. 11, pp. 239-261, 2011.
[17] T. S. Portal. (2015, 8/15/2015). Worldwide market share forecast of smartphone operating systems from 2010 to 2015. Available: http://www.statista.com/statistics/216420/global-market-share-forecast-of-smartphone-operating-systems/
[18] V. Venkatesh, "Determinants of perceived ease of use: Integrating control, intrinsic motivation, and emotion into the technology acceptance model," Information systems research, vol. 11, pp. 342-365, 2000.
[19] A. Dillon and M. G. Morris, "User acceptance of information technology: theories and models," in Annual review of information science and technology. Vol.31, ed Medford, NJ, USA: Information Today, 1996, pp. 3-32.
[20] A. L. Gilbert and H. Han, "Understanding mobile data services adoption: demography, attitudes or needs?," Technological Forecasting and Social Change, vol. 72, pp. 327-337, 2005.
[21] H. Dai and P. C. Palvi, "Mobile commerce adoption in China and the United States: a cross-cultural study," ACM SIGMIS Database, vol. 40, pp. 43-61, 2009.
[22] F.-M. Tseng, Y.-L. Liu, and H.-H. Wu, "Market penetration among competitive innovation products: The case of the Smartphone Operating System," Journal of Engineering and Technology Management.
[23] S. A. Vannoy and P. Palvia, "The social influence model of technology adoption," Communications of the ACM, vol. 53, pp. 149-153, 2010.
[24] M. S. Chtourou and N. Souiden, "Rethinking the TAM model: time to consider fun," Journal of Consumer Marketing, vol. 27, pp. 336-344, 2010.
[25] Y. Song and J. Han, "Is Enjoyment Important? An Empirical Research on the Impact of Perceive Enjoyment on Adoption of New Technology," in International Conference on Information Management, Innovation Management and Industrial Engineering, 2009, pp. 511-514.
[26] B. Kijsanayotin, S. Pannarunothai, and S. M. Speedie, "Factors influencing health information technology adoption in Thailand's community health centers: Applying the UTAUT model," International Journal of Medical Informatics, vol. 78, pp. 404-416, 2009.
[27] Y. Park and J. V. Chen, "Acceptance and adoption of the innovative use of smartphone," Industrial Management & Data Systems, vol. 107, pp. 1349-1365, 2007.
222
[28] G. J. Putzer and Y. Park, "The effects of innovation factors on smartphone adoption among nurses in community hospitals," Perspectives in health information management/AHIMA, American Health Information Management Association, vol. 7, 2010.
[29] J. V. Chen, D. C. Yen, and K. Chen, "The acceptance and diffusion of the innovative smart phone use: A case study of a delivery service company in logistics," Information & Management, vol. 46, pp. 241-248, 2009.
[30] S. Y. Lee, "Examining the factors that influence early adopters’ smartphone adoption: The case of college students," Telematics and Informatics, vol. 31, pp. 308-318, 2014.
[31] L. G. Tornatzky and K. J. Klein, "Innovation characteristics and innovation adoption-implementation: A meta-analysis of findings," IEEE Transactions on Engineering Management, vol. EM-29, pp. 28-45, 1982.
[32] S. S. Al-Gahtani, G. S. Hubona, and J. Wang, "Information technology (IT) in Saudi Arabia: Culture and the acceptance and use of IT," Information & Management, vol. 44, pp. 681-691, 2007.
[33] P. A. Herbig and F. Palumbo, "The effect of culture on the adoption process: A comparison of Japanese and American behavior," Technological Forecasting and Social Change, vol. 46, pp. 71-101, 1994.
[34] D. Straub, M. Keil, and W. Brenner, "Testing the technology acceptance model across cultures: A three country study," Information & Management, vol. 33, pp. 1-11, 1997.
[35] D. W. Straub, "The Effect of Culture on IT Diffusion: E-Mail and FAX in Japan and the US," Information Systems Research, vol. 5, pp. 23-47, 1994.
[36] Y. M. Van Everdingen and E. Waarts, "The effect of national culture on the adoption of innovations," Marketing Letters, vol. 14, pp. 217-232, 2003.
[37] W. A. Al-Ghaith, L. Sanzogni, and K. Sandhu, "Factors influencing the adoption and usage of online services in Saudi Arabia," The Electronic Journal of Information Systems in Developing Countries, vol. 40, 2010.
[38] E. Alwagait, "Popularity Analysis for Saudi Telecom Companies Based on Twitter Data," 2013.
[39] J. Que and V. Hurtado. 10/30/2013). The rise of Saudi Arabian telecoms: Unrivalled promise and opportunity in a vibrant market. Available: http://www.deltapartnersgroup.com/our_insights/whitepapers/the-rise-of-saudi-telecoms-unrivalled-promise-and-opportunity-in-a-vibrant-market
[40] I. Arpaci, Y. C. Yardimci, and O. Turetken, "The impact of cultural differences on smartphone adoption by organizations," in Innovative Computing Technology (INTECH), 2013 Third International Conference on, 2013, pp. 421-423.
[41] G. Alnajjar, M. Mahmuddin, and T. Ramayah, "Adoption Factors of m-Commerce in Jordan: From Personal and Societal Norms Perspectives," International Journal of Computer Theory and Engineering, vol. 5, p. 155, 2013.
223
[42] D. Pan, N. Chen, and P.-L. P. Rau, "The Acceptance and Adoption of Smartphone Use among Chinese College Students," in Cross-Cultural Design. Methods, Practice, and Case Studies, ed: Springer, 2013, pp. 450-458.
[43] M. Ling and P. Yuan, "An empirical research: Consumer intention to use smartphone based on consumer innovativeness," in Consumer Electronics, Communications and Networks (CECNet), 2012 2nd International Conference on, 2012, pp. 2368-2371.
[44] I. K. Lai and D. C. Lai, "User acceptance of mobile commerce: an empirical study in Macau," International Journal of Systems Science, pp. 1-11, 2013.
[45] J. Park, S. Yang, and X. Lehto, "ADOPTION OF MOBILE TECHNOLOGIES FOR CHINESE CONSUMERS," Journal of Electronic Commerce Research, vol. 8, 2007.
[46] S. Pan and M. Jordan-Marsh, "Internet use intention and adoption among Chinese older adults: From the expanded technology acceptance model perspective," Computers in human behavior, vol. 26, pp. 1111-1119, 2010.
[47] J. Lu, C. Liu, C.-S. Yu, and J. E. Yao, "Exploring factors associated with wireless internet via mobile technology acceptance in Mainland China," Communications of the International Information Management Association, vol. 3, pp. 101-120, 2003.
[48] C. E. Hill, K. D. Loch, D. Straub, and K. El-Sheshai, "A qualitative assessment of Arab culture and information technology transfer," Journal of Global Information Management (JGIM), vol. 6, pp. 29-38, 1998.
[49] Y. M. Kang, C. Cho, and S. Lee, "Analysis of factors affecting the adoption of smartphones," in 1st International Technology Management Conference (ITMC), San Jose, CA, United states, 2011, pp. 919-925.
[50] R. F. Perozzo and C. E. Pereira, "Management of services in intelligent environments for mobile devices," in 4th International Conference on Intelligent Environments, Seattle, WA, United states, 2008.
[51] H. Verkasalo, "Analysis of smartphone user behavior," in Ninth International Conference on Mobile Business and Global Mobility Roundtable (ICMB-GMR), 2010, pp. 258-263.
[52] S. A. Al-Meshal and M. A. Almotairi, "Consumer Acceptance of Mobile Marketing: An Empirical Study on the Saudi Female," International Journal of Marketing Studies, vol. 5, 2013.
[53] A. Alsenaidy and A. Tauseef, "A Review of Current State M Government in Saudi Arabia," Global Engineers & Technologists Review, vol. 2, pp. 5-8, 2012.
[54] M. E. Seliaman and M. Al-Turki, "Mobile Learning Adoption in Saudi Arabia," in Proceedings of World Academy of Science, Engineering and Technology, 2012.
[55] O. M. Alakloby, "Dermatology Research in Saudi Arabia: Challenges and Hopes," Journal of the Saudi Society of Dermatology & Dermatologic Surgery, 2012.
[56] c. d. o. s. a. information. (2015, september 10). Estimate of population by sex and nationality. Available: http://www.cdsi.gov.sa/english/index.php?option=com_docman&Itemid=160
224
[57] K. A. Alkhathlan, "Contribution of oil in economic growth of Saudi Arabia," Applied Economics Letters, vol. 20, pp. 343-348, 2013.
[58] A. M. Khatib, "Oil and Infrastructure Expenditures in Saudi Arabia," Journal of Business Studies Quarterly, vol. 4, pp. 72-76, 2012.
[59] M. Qobo and M. Soko. (2010, Saudi Arabia as an Emerging Market: Commercial Opportunities and Challenges for South Africa. Available: http://dspace.cigilibrary.org/jspui/handle/123456789/30038
[60] I. A. Al-Darrab, W. A. Gulzar, and K. S. Ali, "Status of implementation of safety, quality and environmental management systems in Saudi Arabian industries," Total Quality Management & Business Excellence, vol. 24, pp. 336-354, 2013.
[61] N. Y. Mansouri, R. J. Crookes, and T. Korakianitis, "A projection of energy consumption and carbon dioxide emissions in the electricity sector for Saudi Arabia: The case for carbon capture and storage and solar photovoltaics," Energy Policy, vol. 63, pp. 681-695, 2013.
[62] M. T. Simsim, "Internet usage and user preferences in Saudi Arabia," Journal of King Saud University-Engineering Sciences, vol. 23, pp. 101-107, 2011.
[63] R. AlGhamdi, S. Drew, and S. Alkhalaf, "Government initiatives: The missing key for e-commerce growth in KSA," arXiv preprint arXiv:1211.2398, 2012.
[64] C. a. I. T. Commission. (2010, On the Internet Ecosystem in Saudi Arabia. Available: http://www.citc.gov.sa/English/Reportsandstudies/Reports/Documents/IT%20006%20E%20-%20IT%20Report%202010.pdf
[65] B. Kargin, N. Basoglu, and T. Daim, "Factors affecting the adoption of mobile services," International Journal of Services Sciences, vol. 2, pp. 29-52, 2009.
[66] K. Phan and T. Daim, "Exploring technology acceptance for mobile services," Journal of Industrial Engineering and Management, vol. 4, pp. 339-360, 2011.
[67] Alawi et. al. (2012, Saudi Telecom Sector. Available: http://www.aljaziracapital.com.sa/report_file/ess/SEC-32.pdf
[68] M. O. Al-Fakhri, R. A. Cropf, P. Kelly, and G. Higgs, "E-government in Saudi Arabia: Between promise and reality," International Journal of Electronic Government Research (IJEGR), vol. 4, pp. 59-85, 2008.
[69] I. Monitor. (2014, July 21). Opportunity knocks in Saudi Arabia. Available: http://monitor.icef.com/2012/01/opportunity-knocks-in-saudi-arabia/
[70] C. D. o. S. Information. (2014, November 3). Population (15 years and over) by age groups and educational status. Available: http://www.cdsi.gov.sa/english/index.php?option=com_docman&Itemid=161
[71] J. C. Stephens, M. E. Hernandez, M. Román, A. C. Graham, and R. W. Scholz, "Higher education as a change agent for sustainability in different cultures and contexts," International Journal of Sustainability in Higher Education, vol. 9, pp. 317-338, 2008.
[72] Z. Krieger, "Saudi Arabia puts its billions behind Western-style higher education," The Chronicle of Higher Education, vol. 54, p. A1, 2007.
225
[73] M. Alamri, "Higher Education in Saudi Arabia," Journal of Higher Education Theory & Practice, vol. 11, 2011.
[74] A. A. News. (2015, november 6). All Saudi students in U.S. included in King's scholarship program. Available: http://english.alarabiya.net/en/perspective/features/2015/09/06/All-Saudi-students-in-U-S-included-in-kingdom-s-scholarship-program.html
[75] F. Luqman. 12/21/2013). KAUST will become one of the best in the world. Available: http://www.arabnews.com/news/461379
[76] J. Adams, C. King, D. Pendlebury, D. Hook, J. Wilsdon, and A. Zewail, "Global Research Report, the Middle East," Exploring the Changing Landscape of Arabian, Persian and Turkish Research: Thomson Reuters, pp. 25-27, 2011.
[77] A. Dillon and M. G. Morris, "User acceptance of new information technology: theories and models," Annual Review of Information Science and Technology, vol. 14, pp. 3-32, 1996.
[78] G. C. Moore and I. Benbasat, "Development of an instrument to measure the perceptions of adopting an information technology innovation," Information systems research, vol. 2, pp. 192-222, 1991.
[79] E. M. Rogers, Diffusion of innovations, 5th Edition ed.: Free press, 2003. [80] M. Alavi and E. A. Joachimsthaler, "Revisiting DSS implementation research: A
meta-analysis of the literature and suggestions for researchers," Mis Quarterly, pp. 95-116, 1992.
[81] S. Taylor and P. A. Todd, "Understanding information technology usage: A test of competing models," Information systems research, vol. 6, pp. 144-176, 1995.
[82] V. Venkatesh, M. G. Morris, G. B. Davis, and F. D. Davis, "User acceptance of information technology: Toward a unified view," Management Information Systems (MIS), vol. 27, pp. 425-478, 2003.
[83] I. Ajzen, "The theory of planned behavior.," Organizational Behavior and Human Decision Processes, vol. 50, pp. 179-211, 1991.
[84] F. D. Davis, "Perceived usefulness, perceived ease of use, and user acceptance of information technology," MIS Q., vol. 13, pp. 319-340, 1989.
[85] S. Heshan and Z. Ping, "A methodological analysis of user technology acceptance," in Proceedings of the 37th Annual Hawaii International Conference on System Sciences, 5-8 Jan. 2004, Los Alamitos, CA, USA, 2004, p. 10 pp.
[86] Y. Lee, K. A. Kozar, and K. R. Larsen, "The technology acceptance model: past, present, and future," The Communications of the Association for Information Systems, vol. 12, pp. 752-780., 2003.
[87] F. D. Davis, R. P. Bagozzi, and P. R. Warshaw, "User acceptance of computer technology: a comparison of two theoretical models," Management Science, vol. 35, pp. 982-1003, 1989.
[88] H. Rui and L. Lu, "The diffusion and adoption research of mobile commerce-A Review," in Management and Service Science, 2009. MASS'09. International Conference on, 2009, pp. 1-5.
226
[89] Y. W. Sawng and H. S. Han, "Market analysis for the next‐generation mobile communications (DMB) service from the perspective of innovation adoption and diffusion," International Journal of Satellite Communications and Networking, vol. 25, pp. 323-348, 2007.
[90] H. Verkasalo, C. López-Nicolás, F. J. Molina-Castillo, and H. Bouwman, "Analysis of users and non-users of smartphone applications," Telematics and Informatics, vol. 27, pp. 242-255, 2010.
[91] K. Sang Hyun, "Moderating effects of job relevance and experience on mobile wireless technology acceptance: adoption of a smart phone by individuals," Information and Management, vol. 45, pp. 387-93, 2008.
[92] P. Legris, J. Ingham, and P. Collerette, "Why do people use information technology? A critical review of the technology acceptance model," Information and Management, vol. 40, pp. 191-204, 2003.
[93] Z. Liu, Q. Min, and S. Ji, "A comprehensive review of research in IT adoption," in Wireless Communications, Networking and Mobile Computing, 2008. WiCOM'08. 4th International Conference on, 2008, pp. 1-5.
[94] M. Conner and C. J. Armitage, "Extending the theory of planned behavior: A review and avenues for further research," Journal of applied social psychology, vol. 28, pp. 1429-1464, 1998.
[95] D. L. Goodhue and R. L. Thompson, "Task-technology fit and individual performance," MIS Q., vol. 19, pp. 213-236, 1995.
[96] M. Fishbein, and I Ajzen, Belief, Attitude, Intention and Behaviour: An Introduction to Theory and Research: Addison-Wesley, 1975.
[97] F. Aldhaban, "Exploring the adoption of Smartphone technology: Literature review," in Technology Management for Emerging Technologies (PICMET), 2012 Proceedings of PICMET'12:, 2012, pp. 2758-2770.
[98] J. Choudrie, S. Pheeraphuttharangkoon, E. Zamani, and G. Giaglis, "Investigating the adoption and use of smartphones in the UK: a silver-surfers perspective," 2014.
[99] S.-C. Ho, W.-Y. Sun, and Y.-M. Wang, "Investigation of factors influencing the adoption of mobile data services," in Proceedings of the 13th International Conference on Electronic Commerce, 2011, p. 11.
[100] A. Aarnio, A. Enkenberg, J. Heikkila, and S. Hirvola, "Adoption and use of mobile services. Empirical evidence from a Finnish survey," in System Sciences, 2002. HICSS. Proceedings of the 35th Annual Hawaii International Conference on, 2002, pp. 1454-1463.
[101] B. Kargin, N. Basoglu, and T. Daim, "Exploring mobile service adoption: A conjoint model," in Portland International Conference on Management of Engineering and Technology (PICMET), 2008, pp. 2623-2633.
[102] B. Swar, J. Kim, D. H. Lee, and J. Moon, "Impact of culture on mobile phone service adoption and diffusion: a cross-country analysis," in Computer Sciences
227
and Convergence Information Technology, 2009. ICCIT'09. Fourth International Conference on, 2009, pp. 1442-1444.
[103] M. Cherubini, R. de Oliveira, A. Hiltunen, and N. Oliver, "Barriers and bridges in the adoption of today's mobile phone contextual services," in Proceedings of the 13th International Conference on Human Computer Interaction with Mobile Devices and Services, 2011, pp. 167-176.
[104] J. Huang, Q. Xu, B. Tiwana, Z. M. Mao, M. Zhang, and P. Bahl, "Anatomizing application performance differences on smartphones," in Proceedings of the 8th international conference on Mobile systems, applications, and services, 2010, pp. 165-178.
[105] S. Kim and G. Garrison, "Investigating mobile wireless technology adoption: An extension of the technology acceptance model," Information Systems Frontiers, vol. 11, pp. 323-333, 2009.
[106] S. Kim and Y. Song, "Determinants Influencing Individuals’ Likelihood of Adopting and Actual use of Blueberry," Journal of Applied Sciences, vol. 9, pp. 3662-3671, 2009.
[107] C. Maloney. (2009). the Newton ball multi-National diffusion acceleration effect: an apple iPhone case study. . Available: http://chrismaloney.files.wordpress.com/2009/06/newton-ball-multi-national-diffusion-acceleration-effect-an-apple-iphone-case-study1.pdf
[108] E. J. Arruda-Filho, J. A. Cabusas, and N. Dholakia, "Social behavior and brand devotion among iPhone innovators," International journal of information management, vol. 30, pp. 475-480, 2010.
[109] A. Haywood and G. Boguslawski, "I Love My iPhone... But There Are Certain Things That ‘Niggle’Me," in Human-Computer Interaction. New Trends, ed: Springer, 2009, pp. 421-430.
[110] M. M. Rana and U. Rana, "Accessibility evaluation of iPhone’s user interface for visually impaired," The proceedings of internet and multimedia systems and applications, pp. 164-167, 2009.
[111] H. Tscherning and L. Mathiassen, The Role of Social Networks in Early Adoption of Mobile Devices: Springer, 2010.
[112] J. Yoo, Y. Yoon, and M. Choi, "Importance of positive reputation for Smartphone adoption," in Information and Communication Technology Convergence (ICTC), 2010 International Conference on, 2010, pp. 314-318.
[113] P. Nanda, J. Bos, K.-L. Kramer, C. Hay, and J. Ignacz, "Effect of smartphone aesthetic design on users' emotional reaction: An empirical study," The TQM Journal, vol. 20, pp. 348-355, 2008.
[114] H. Bouwman, M. de Reuver, and S. Stalman, "Mobile TV: The Search for a Holy Grail that Isn’t," in Proceddings of the 9th international interactive conference on Interactive television, 2011, pp. 185-194.
228
[115] H. Verkasalo, "Empirical observations on the emergence of mobile multimedia services and applications in the US and Europe," in Proceedings of the 5th international conference on Mobile and ubiquitous multimedia, 2006, p. 3.
[116] D. Schuurman, C. Courtois, and L. De Marez, "New media adoption and usage among Flemish youngsters," Telematics and Informatics, vol. 28, pp. 77-85, 2011.
[117] Y. Liu, H. Li, and C. Carlsson, "Factors driving the adoption of m-learning: An empirical study," Computers & Education, vol. 55, pp. 1211-1219, 2010.
[118] T. Page, "Usability of text input interfaces in smartphones," Journal of Design Research, vol. 11, pp. 39-56, 2013.
[119] D.-H. Shin, Y.-J. Shin, H. Choo, and K. Beom, "Smartphones as smart pedagogical tools: Implications for smartphones as u-learning devices," Computers in Human Behavior, vol. 27, pp. 2207-2214, 2011.
[120] M. N. Boulos, S. Wheeler, C. Tavares, and R. Jones, "How smartphones are changing the face of mobile and participatory healthcare: an overview, with example from eCAALYX," Biomedical engineering online, vol. 10, p. 24, 2011.
[121] L. Wolfenden, L. Brennan, and B. I. Britton, "Intelligent obesity interventions using Smartphones," Preventive medicine, vol. 51, pp. 519-520, 2010.
[122] A. M. Khan, Y.-K. Lee, S. Lee, and T.-S. Kim, "Human activity recognition via an accelerometer-enabled-smartphone using kernel discriminant analysis," in Future Information Technology (FutureTech), 2010 5th International Conference on, 2010, pp. 1-6.
[123] J. J. Oresko, Z. Jin, J. Cheng, S. Huang, Y. Sun, H. Duschl, and A. C. Cheng, "A wearable smartphone-based platform for real-time cardiovascular disease detection via electrocardiogram processing," Information Technology in Biomedicine, IEEE Transactions on, vol. 14, pp. 734-740, 2010.
[124] P. Yu, M. X. Wu, H. Yu, and G. Q. Xiao, "The challenges for the adoption of M-health," in Service Operations and Logistics, and Informatics, 2006. SOLI'06. IEEE International Conference on, 2006, pp. 181-186.
[125] I. Carreras and D. Tacconi, "U-hopper: User-centric heteogeneous opportunistic middleware," in Bio-Inspired Models of Network, Information and Computing Systems, 2007. Bionetics 2007. 2nd, 2007, pp. 302-305.
[126] D.-H. Shin, "User acceptance of mobile Internet: Implication for convergence technologies," Interacting with Computers, vol. 19, pp. 472-483, 2007.
[127] Y. Yoon, S. Patino, N. Jarpa, and H. Alanazi, "WiMAX: Forecasting by integrating scenario planning and Bass model methodologies," in Management of Engineering & Technology, 2009. PICMET 2009. Portland International Conference on, 2009, pp. 2375-2390.
[128] M. Edo, M. Garcia, C. Turro, and J. Lloret, "IP Telephony Development and Performance over IEEE 802.11 g WLAN," in Networking and Services, 2009. ICNS'09. Fifth International Conference on, 2009, pp. 186-191.
229
[129] C. Caini, P. Cornice, R. Firrincieli, M. Livini, and D. Lacamera, "DTN meets smartphones: Future prospects and tests," in Wireless Pervasive Computing (ISWPC), 2010 5th IEEE International Symposium on, 2010, pp. 355-360.
[130] T. Evens, D. Schuurman, L. De Marez, and G. Verleye, "Forecasting broadband Internet adoption on trains in Belgium," Telematics and Informatics, vol. 27, pp. 10-20, 2010.
[131] S. M. Habib, C. Jacob, and T. Olovsson, "A practical analysis of the robustness and stability of the network stack in smartphones," in Computer and Information Technology, 2008. ICCIT 2008. 11th International Conference on, 2008, pp. 393-398.
[132] M.-K. Kim, J.-H. Park, and J.-H. Paik, "Factors influencing adoption of Korean 3G mobile services: The role of relative advantages, facilitating condition and adoption barriers," in Advanced Communication Technology, 2009. ICACT 2009. 11th International Conference on, 2009, pp. 1392-1395.
[133] Q. Wang and R. Deters, "SOA's Last Mile-Connecting Smartphones to the Service Cloud," in Cloud Computing, 2009. CLOUD'09. IEEE International Conference on, 2009, pp. 80-87.
[134] Y. Agarwal, R. Chandra, A. Wolman, P. Bahl, K. Chin, and R. Gupta, "Wireless wakeups revisited: energy management for voip over wi-fi smartphones," in Proceedings of the 5th international conference on Mobile systems, applications and services, 2007, pp. 179-191.
[135] P. Briggs, R. Chundury, and J. Olsson, "Carrier ethernet for mobile backhaul," Communications Magazine, IEEE, vol. 48, pp. 94-100, 2010.
[136] J. Harno, "Impact of 3G and beyond technology development and pricing on mobile data service provisioning, usage and diffusion," Telematics and informatics, vol. 27, pp. 269-282, 2010.
[137] R. F. Perozzo and C. E. Pereira, "Management of services in intelligent environments for mobile devices," in Intelligent Environments, 2008 IET 4th International Conference on, 2008, pp. 1-6.
[138] B. Dixon and S. Mishra, "On rootkit and malware detection in smartphones," in Dependable Systems and Networks Workshops (DSN-W), 2010 International Conference on, 2010, pp. 162-163.
[139] B. Steinke, "Reconfigurable object based multimedia display communication system for Smartphones," in Information and Telecommunication Technologies, 2008. APSITT. 7th Asia-Pacific Symposium on, 2008, pp. 253-257.
[140] X. Ni, Z. Yang, X. Bai, A. C. Champion, and D. Xuan, "DiffUser: Differentiated user access control on smartphones," in Mobile Adhoc and Sensor Systems, 2009. MASS'09. IEEE 6th International Conference on, 2009, pp. 1012-1017.
[141] C. Tseng, M. Ali, and R. Vibhandik, "Common Visual Representation for websites and smartphones," in Granular Computing (GrC), 2010 IEEE International Conference on, 2010, pp. 477-482.
230
[142] D.-H. Kim, M.-H. Yun, S.-J. Kim, and C.-H. Lee, "Design and Implementation of Smartphone Edition based on Embedded Linux," in Advanced Communication Technology, 2008. ICACT 2008. 10th International Conference on, 2008, pp. 328-331.
[143] V. L. Thing, K.-Y. Ng, and E.-C. Chang, "Live memory forensics of mobile phones," digital investigation, vol. 7, pp. S74-S82, 2010.
[144] P. Gasti and Y. Chen, "Breaking and Fixing the Self Encryption Scheme for Data Security in Mobile Devices," in Parallel, Distributed and Network-Based Processing (PDP), 2010 18th Euromicro International Conference on, 2010, pp. 624-630.
[145] N. B. Mabrouk, N. Georgantas, and V. Issarny, "A semantic end-to-end QoS model for dynamic service oriented environments," in Proceedings of the 2009 ICSE Workshop on Principles of Engineering Service Oriented Systems, 2009, pp. 34-41.
[146] T. J. Gerpott, "Impacts of mobile Internet use intensity on the demand for SMS and voice services of mobile network operators," Attitudes and Behaviors of Mobile Network Operator Customers: Contributions toward empirically founded marketing strategies for mobile navigation and Internet services, p. 129, 2010.
[147] N.-Y. Jeong and Y. Yoo, "A study of adopting Warshaw's purchase intention model in mobile-RFID services and on moderating effect of personal innovativeness," in Management of Engineering and Technology, Portland International Center for, 2007, pp. 2932-2939.
[148] A. Denoo, "The ORANGE Telematic services for mass market," in Telecommunications, 2007. ITST'07. 7th International Conference on ITS, 2007, pp. 1-6.
[149] L. Bauer, L. F. Cranor, M. K. Reiter, and K. Vaniea, "Lessons learned from the deployment of a smartphone-based access-control system," in Proceedings of the 3rd Symposium on Usable Privacy and Security, 2007, pp. 64-75.
[150] S.-Y. Tsai, C.-Y. Wang, and R.-H. Hwang, "Ubiquitous Phone System," in Ubiquitous Intelligence and Computing, ed: Springer, 2008, pp. 201-215.
[151] P. Zhuang, D. Wang, and Y. Shang, "SMART: Simultaneous indoor localization and map construction using smartphones," in Neural Networks (IJCNN), The 2010 International Joint Conference on, 2010, pp. 1-8.
[152] M. Boari, A. Corradi, E. Lodolo, S. Monti, and S. Pasini, "Coordination for the internet of services: A user-centric approach," in Communication Systems Software and Middleware and Workshops, 2008. COMSWARE 2008. 3rd International Conference on, 2008, pp. 434-441.
[153] E. Miluzzo, C. T. Cornelius, A. Ramaswamy, T. Choudhury, Z. Liu, and A. T. Campbell, "Darwin phones: the evolution of sensing and inference on mobile phones," in Proceedings of the 8th international conference on Mobile systems, applications, and services, 2010, pp. 5-20.
231
[154] T. Zhou, Y. Lu, and B. Wang, "Integrating TTF and UTAUT to explain mobile banking user adoption," Computers in Human Behavior, vol. 26, pp. 760-767, 2010.
[155] N. Koenig-Lewis, A. Palmer, and A. Moll, "Predicting young consumers' take up of mobile banking services," International Journal of Bank Marketing, vol. 28, pp. 410-432, 2010.
[156] N. Mallat, "Exploring consumer adoption of mobile payments - A qualitative study," Journal of Strategic Information Systems, vol. 16, pp. 413-432, 2007.
[157] H. H. Bauer, S. J. Barnes, T. Reichardt, and M. M. Neumann, "Driving consumer acceptance of mobile marketing: A theoretical framework and empirical study," Journal of electronic commerce research, vol. 6, pp. 181-192, 2005.
[158] T. Zhou, "Exploring mobile user acceptance based on UTAUT and contextual offering," in Electronic Commerce and Security, 2008 International Symposium on, 2008, pp. 241-245.
[159] J.-H. Wu and S.-C. Wang, "What drives mobile commerce?: An empirical evaluation of the revised technology acceptance model," Information & management, vol. 42, pp. 719-729, 2005.
[160] R. Xia, M. Rost, and L. E. Holmquist, "Business models in the mobile ecosystem," in Mobile Business and 2010 Ninth Global Mobility Roundtable (ICMB-GMR), 2010 Ninth International Conference on, 2010, pp. 1-8.
[161] F. Lin and W. Ye, "Operating system battle in the ecosystem of smartphone industry," in Information Engineering and Electronic Commerce, 2009. IEEC'09. International Symposium on, 2009, pp. 617-621.
[162] R. Balocco, R. Mogre, and G. Toletti, "Mobile internet and SMEs: a focus on the adoption," Industrial Management & Data Systems, vol. 109, pp. 245-261, 2009.
[163] B. Beurer-Zuellig and M. Meckel, "Smartphones enabling mobile collaboration," in Hawaii International Conference on System Sciences, Proceedings of the 41st Annual, 2008, pp. 49-49.
[164] W. Boontarig, W. Chutimaskul, V. Chongsuphajaisiddhi, and B. Papasratorn, "Factors influencing the Thai elderly intention to use smartphone for e-Health services," in Humanities, Science and Engineering Research (SHUSER), 2012 IEEE Symposium on, 2012, pp. 479-483.
[165] U. Sekaran, Research methods for business: A skill building approach, 4th ed.: John Wiley & Sons, 2003.
[166] F. D. Davis, R. P. Bagozzi, and P. R. Warshaw, "Extrinsic and Intrinsic Motivation to Use Computers in the Workplace," Journal of Applied Social Psychology, vol. 22, pp. 1111-1132, 1992.
[167] S.-C. Ho, W.-Y. Sun, and Y.-M. Wang, "Investigation of Factors Influencing the Adoption of Mobile Data Services," in Proceedings of the 13th International Conference on Electronic Commerce, Liverpool, United Kingdom, 2011, pp. 1-8.
232
[168] D. H. Haejung Yun, and Choong Lee, , "Extending UTAUT to Predict the Use of Location-Based Services," International Conference on Information Systems (ICIS), 2011.
[169] G. J. Putzer and Y. Park, "The effects of innovation factors on smartphone adoption among nurses in community hospitals," Perspectives in health information management / AHIMA, American Health Information Management Association, vol. 7, p. 1b, 2010.
[170] H.-W. Kim, H. C. Chan, and S. Gupta, "Value-based adoption of mobile internet: an empirical investigation," Decision Support Systems, vol. 43, pp. 111-126, 2007.
[171] H. Sun and P. Zhang, "An exploration of affect factors and their role in user technology acceptance: Mediation and causality," Journal of the American society for information science and technology, vol. 59, pp. 1252-1263, 2008.
[172] J. F. Finch and S. G. West, "The investigation of personality structure: Statistical models," Journal of Research in Personality, vol. 31, pp. 439-485, 1997.
[173] A. E. Hurley, T. A. Scandura, C. A. Schriesheim, M. T. Brannick, A. Seers, R. J. Vandenberg, and L. J. Williams, "Exploratory and confirmatory factor analysis: Guidelines, issues, and alternatives," Journal of organizational behavior, vol. 18, pp. 667-683, 1997.
[174] B. Williams, T. Brown, and A. Onsman, "Exploratory factor analysis: A five-step guide for novices," Australasian Journal of Paramedicine, vol. 8, p. 1, 2012.
[175] J. Ritchie, J. Lewis, C. M. Nicholls, and R. Ormston, Qualitative research practice: A guide for social science students and researchers: Sage, 2013.
[176] C. O. Seneler, N. Basoglu, and T. U. Daim, "A taxonomy for technology adoption: A human computer interaction perspective," in Management of Engineering & Technology, 2008. PICMET 2008. Portland International Conference on, 2008, pp. 2208-2219.
[177] N. K. Gale, G. Heath, E. Cameron, S. Rashid, and S. Redwood, "Using the framework method for the analysis of qualitative data in multi-disciplinary health research," BMC medical research methodology, vol. 13, p. 117, 2013.
[178] A. McKenna, F. McMartin, Y. Terada, V. Sirivedhin, and A. Agogino, "A Framework for Interpreting Students' Perceptions of an Integrated Curriculum," in Proceedings, 2001 ASEE Annual Conference and Exposition, 2001.
[179] M. A. Meyer and J. M. Booker, Eliciting and analyzing expert judgment: a practical guide vol. 7: SIAM, 2001.
[180] P. B. Paulus and V. R. Brown, "Toward More Creative and Innovative Group Idea Generation: A Cognitive‐Social‐Motivational Perspective of Brainstorming," Social and Personality Psychology Compass, vol. 1, pp. 248-265, 2007.
[181] R. P. McGlynn, D. McGurk, V. S. Effland, N. L. Johll, and D. J. Harding, "Brainstorming and task performance in groups constrained by evidence," Organizational behavior and human decision processes, vol. 93, pp. 75-87, 2004.
[182] H.-C. Wang, D. Cosley, and S. R. Fussell, "Idea Expander: Supporting group brainstorming with conversationally triggered visual thinking stimuli," in
233
Proceedings of the 2010 ACM conference on Computer supported cooperative work, 2010, pp. 103-106.
[183] P. C. Shih, G. Venolia, and G. M. Olson, "Brainstorming under constraints: why software developers brainstorm in groups," in Proceedings of the 25th BCS Conference on Human-Computer Interaction, 2011, pp. 74-83.
[184] D. L. Morgan, Focus groups as qualitative research vol. 16: Sage, 1997. [185] L. Chase and J. Alvarez, "Internet research: The role of the focus group," Library
& Information Science Research, vol. 22, pp. 357-369, 2000. [186] D. W. Stewart and P. N. Shamdasani, Focus groups vol. 20: Sage, 2014. [187] K. Phan, "Innovation Measurement: A Decision Framework to Determine
Innovativeness of a Company," Dissertation, PORTLAND STATE UNIVERSITY, 2013.
[188] N. Mohd Suki, "Students' demand for smartphones: Structural relationships of product features, brand name, product price and social influence," Campus-Wide Information Systems, vol. 30, pp. 236-248, 2013.
[189] L. Oshlyansky, P. Cairns, and H. Thimbleby, "Validating the unified theory of acceptance and use of technology (UTAUT) tool cross-culturally," presented at the Proceedings of the 21st British HCI Group Annual Conference on People and Computers: HCI...but not as we know it - Volume 2, University of Lancaster, United Kingdom, 2007.
[190] W. B. Dodds, K. B. Monroe, and D. Grewal, "Effects of price, brand, and store information on buyers' product evaluations," Journal of Marketing Research (JMR), vol. 28, 1991.
[191] V. Venkatesh, J. Thong, and X. Xu, "Consumer acceptance and use of information technology: extending the unified theory of acceptance and use of technology," MIS quarterly, vol. 36, pp. 157-178, 2012.
[192] M. A. Osman, A. Z. Talib, Z. A. Sanusi, T. Shiang-Yen, and A. S. Alwi, "A Study of the Trend of Smartphone and its Usage Behavior in Malaysia," International Journal of New Computer Architectures and their Applications (IJNCAA), vol. 2, pp. 274-285, 2012.
[193] S.-J. Hong, K. Y. Tam, and J. Kim, "Mobile data service fuels the desire for uniqueness," Journal of Communications of the ACM, vol. 49, pp. 89-94, 2006.
[194] C. Je Ho and P. Myeong-Cheol, "Mobile internet acceptance in Korea," Internet Research: Electronic Networking Applications and Policy, vol. 15, pp. 125-40, 2005.
[195] R. W. Belk, "An exploratory assessment of situational effects in buyer behavior," Journal of Marketing Research, pp. 156-163, 1974.
[196] R. W. Belk, "Situational variables and consumer behavior," Journal of Consumer research, pp. 157-164, 1975.
[197] S. Ward and T. S. Robertson, "Consumer behavior research: Promise and prospects," Scott Ward and Thomas S. Robertson, Consumer Behavior: Theoretical Sources. Englewood Cliffs: Prentice-Hall, pp. 3-42, 1973.
234
[198] R. R. Harmon and G. Laird, "Linking marketing strategy to customer value: implications for technology marketers," in Innovation in Technology Management-The Key to Global Leadership. PICMET'97: Portland International Conference on Management and Technology, 1997, pp. 896-900.
[199] S. H. Kim, "Moderating effects of job relevance and experience on mobile wireless technology acceptance: Adoption of a smartphone by individuals," Information & Management, vol. 45, pp. 387-393, 2008.
[200] G. G. Gable, "Integrating case study and survey research methods: an example in information systems," European Journal of Information Systems, vol. 3, pp. 112-126, 1994.
[201] A. Pinsonneault and K. L. Kraemer, "Survey research methodology in management information systems: an assessment," Journal of management information systems, pp. 75-105, 1993.
[202] T. R. Anderson, Research Methods for Technology Management and other Fields. Portland, OR: print-on-demand system, 2012.
[203] D. R. Cooper, P. S. Schindler, and J. Sun, Business research methods, ninth ed. New York, NY: McGraw-Hill/Irwin, 2006.
[204] J. R. Fraenkel and N. E. Wallen, "How to design and evaluate research in education," third ed: McGraw-Hill (New York), 1996.
[205] D. Andrews, B. Nonnecke, and J. Preece, "Electronic survey methodology: A case study in reaching hard-to-involve Internet users," International Journal of Human-Computer Interaction, vol. 16, pp. 185-210, 2003.
[206] E. R. Babbie, Survey research methods, second ed.: Wadsworth Publishing Company Belmont, CA, 1990.
[207] A. Rindfleisch, A. J. Malter, S. Ganesan, and C. Moorman, "Cross-sectional versus longitudinal survey research: concepts, findings, and guidelines," Journal of Marketing Research, vol. 45, pp. 261-279, 2008.
[208] C. Carlsson, J. Carlsson, K. Hyvonen, J. Puhakainen, and P. Walden, "Adoption of Mobile Devices/Services - Searching for Answers with the UTAUT," in System Sciences, 2006. HICSS '06. Proceedings of the 39th Annual Hawaii International Conference on, 2006, pp. 132a-132a.
[209] J. W. Creswell, Research design: Qualitative, quantitative, and mixed methods approaches, second ed.: SAGE Publications, Incorporated, 2004.
[210] J. G. Geer, "What do open-ended questions measure?," Public Opinion Quarterly, vol. 52, pp. 365-367, 1988.
[211] R. Likert, "A technique for the measurement of attitudes," Archives of psychology, vol. 22, 1932.
[212] D. L. Clason and T. J. Dormody, "Analyzing data measured by individual Likert-type items," Journal of Agricultural Education, vol. 35, p. 4, 1994.
[213] F. J. Gravetter and L. B. Wallnau, Essentials of statistics for the behavioral sciences, sixth ed.: Wadsworth Publishing Company, 2008.
235
[214] J. F. Hair, W. Black, B. J. Babin, and R. E. Anderson, Multivariate data analysis, Seventh ed.: Pearson, 2010.
[215] P. Slottje, J. van der Sluijs, and A. B. Knol, "Expert Elicitation: Methodological suggestions for its use in environmental health impact assessments," National Institute for Public Health and the Environment, RIVM Letter report 2008.
[216] G. Rowe and G. Wright, "The Delphi technique as a forecasting tool: issues and analysis," International journal of forecasting, vol. 15, pp. 353-375, 1999.
[217] R. Cooke and L. Goossens, "Procedures guide for structural expert judgement in accident consequence modelling," Radiation Protection Dosimetry, vol. 90, pp. 303-309, 2000.
[218] G. Rowe, G. Wright, and F. Bolger, "Delphi: a reevaluation of research and theory," Technological Forecasting and Social Change, vol. 39, pp. 235-251, 1991.
[219] N. A. Behkami, "Examining Health Information Technology Implementations: Case of the Patient-centered Medical Home," PhD Dissertation in Engineering Management, , Portland State University, 2012.
[220] K. L. Manfreda and V. Vehovar, "Internet surveys," International handbook of survey methodology, pp. 264-284, 2008.
[221] L. J. Cronbach, "Coefficient alpha and the internal structure of tests," Psychometrika, vol. 16, pp. 297-334, 1951.
[222] J. R. A. Santos, "Cronbach’s alpha: A tool for assessing the reliability of scales," Journal of extension, vol. 37, pp. 1-5, 1999.
[223] J. Pallant, SPSS survival manual: A step by step guide to data analysis using SPSS, fourth ed.: Open University Press, 2010.
[224] R. H. Salman, "Exploring Capability Maturity Models and Relevant Practices as Solutions Addressing IT Service Offshoring Project Issues," Doctor of Philosophy, Portland State University, 2014.
[225] A. Bryman, Social research methods, Second Edition ed.: OUP Oxford, 2004. [226] K. K. Boyer, J. R. Olson, and E. C. Jackson, "Electronic surveys: advantages and
disadvantages over traditional print surveys," Decision Line, vol. 32, pp. 4-7, 2001.
[227] R. D. Fricker and M. Schonlau, "Advantages and disadvantages of Internet research surveys: Evidence from the literature," Field Methods, vol. 14, pp. 347-367, 2002.
[228] D. H. Granello and J. E. Wheaton, "Online data collection: Strategies for research," Journal of Counseling & Development, vol. 82, pp. 387-393, 2004.
[229] K. B. Wright, "Researching Internet based populations: Advantages and disadvantages of online survey research, online questionnaire authoring software packages, and web survey services," Journal of Computer Mediated Communication, vol. 10, 2005.
[230] D. A. Dillman, Mail and internet surveys: The tailored design method vol. 2: Wiley New York, 2000.
236
[231] M. D. Kaplowitz, T. D. Hadlock, and R. Levine, "A comparison of web and mail survey response rates," Public opinion quarterly, vol. 68, pp. 94-101, 2004.
[232] F. J. Fowler Jr, Survey research methods vol. 1: SAGE Publications, Incorporated, 2008.
[233] R. Sapsford, Survey research: SAGE Publications Limited, 2006. [234] K. Kelley, B. Clark, V. Brown, and J. Sitzia, "Good practice in the conduct and
reporting of survey research," International Journal for Quality in Health Care, vol. 15, pp. 261-266, 2003.
[235] c. a. i. t. commission, "Annual Report 2012," Saudi Arabia2012. [236] emarketer. (2015, september 9). United-Arab-Emirates-Leads-Middle-East-
Africa-Mobile-Phone-Penetration. Available: http://www.emarketer.com/Article/United-Arab-Emirates-Leads-Middle-East-Africa-Mobile-Phone-Penetration/1011971
[237] C. a. I. T. Commission, "Market Definition, Designation and Dominance Report " 2010.
[238] D. Barclay, C. Higgins, and R. Thompson, "The partial least squares (PLS) approach to causal modeling: personal computer adoption and use as an illustration," Technology studies, vol. 2, pp. 285-309, 1995.
[239] W. W. Chin, "The partial least squares approach for structural equation modeling," Modern Methods for business research, pp. 295-336, 1998.
[240] W. W. Chin and P. R. Newsted, "Structural equation modeling analysis with small samples using partial least squares," Statistical strategies for small sample research, vol. 1, pp. 307-341, 1999.
[241] S. S. Kahai and R. B. Cooper, "Exploring the core concepts of media richness theory: The impact of cue multiplicity and feedback immediacy on decision quality," Journal of Management Information Systems, vol. 20, pp. 263-300, 2003.
[242] B. G. Tabachnick and L. S. Fidell, Using multivariate statistics. Needham Heights, MA USA: A Pearson Education Company, 2001.
[243] A. Boomsma, "The robustness of LISREL against small sample sizes in factor analysis models," Systems under indirect observation: Causality, structure, prediction, vol. 1, pp. 148-173, 1982.
[244] H. W. Marsh and M. Bailey, "Confirmatory factor analyses of multitrait-multimethod data: A comparison of alternative models," Applied psychological measurement, vol. 15, pp. 47-70, 1991.
[245] L. Ding, W. F. Velicer, and L. L. Harlow, "Effects of estimation methods, number of indicators per factor, and improper solutions on structural equation modeling fit indices," Structural Equation Modeling: A Multidisciplinary Journal, vol. 2, pp. 119-143, 1995.
[246] H. W. Marsh, J. R. Balla, and R. P. McDonald, "Goodness-of-fit indexes in confirmatory factor analysis," Psychological bulletin, vol. 103, pp. 391-410, 1988.
237
[247] H. W. Marsh, K.-T. Hau, J. R. Balla, and D. Grayson, "Is more ever too much? The number of indicators per factor in confirmatory factor analysis," Multivariate Behavioral Research, vol. 33, pp. 181-220, 1998.
[248] S. A. Mulaik, L. R. James, J. Van Alstine, N. Bennett, S. Lind, and C. D. Stilwell, "Quantitative methods in psychology," Psychological Bulletin, vol. 105, pp. 430-445, 1989.
[249] L. Pui-Wa and S. B. Dunbar, "Effects of score discreteness and estimating alternative model parameters on power estimation methods in structural equation modeling," Structural Equation Modeling, vol. 11, pp. 20-44, 2004.
[250] D. Iacobucci, "Structural equations modeling: Fit indices, sample size, and advanced topics," Journal of Consumer Psychology, vol. 20, p. 90, 2010.
[251] J. C. Anderson and D. W. Gerbing, "The effect of sampling error on convergence, improper solutions, and goodness-of-fit indices for maximum likelihood confirmatory factor analysis," Psychometrika, vol. 49, pp. 155-173, 1984.
[252] N. A. Behkami, "Examining Health Information Technology Implementations: Case of the Patient-centered Medical Home," Portland State University, 2012.
[253] D. A. Dillman and D. K. Bowker, "The web questionnaire challenge to survey methodologists," Bemad Batinic, Ulf-Dietrich Reips, Michael Bosnjak & Andreas Werner: Online Social Sciences. Seattle: Hogrefe & Huber, pp. 53-71, 2001.
[254] C. Cobanoglu, B. Warde, and P. J. Moreo, "A comparison of mail, fax and web-based survey methods," International journal of market research, vol. 43, pp. 441-452, 2001.
[255] Y. Baruch and B. C. Holtom, "Survey response rate levels and trends in organizational research," Human Relations, vol. 61, pp. 1139-1160, 2008.
[256] P. L. Alreck and R. B. Settle, The survey research handbook: McGraw-Hill, 1994. [257] T. Daim, "Technology Evaluation and Acquision Strategies and their Implications
in the U.S. Electronics Manufacturing Industry.," Doctor of Philosophy, , Portland State University., 1998.
[258] T. Downes-Le Guin, R. Baker, J. Mechling, and E. Ruylea, "Myths and realities of respondent engagement in online surveys," International Journal of Market Research, vol. 54, pp. 1-21, 2012.
[259] C. B. Jarvis, S. B. MacKenzie, and P. M. Podsakoff, "A critical review of construct indicators and measurement model misspecification in marketing and consumer research," Journal of consumer research, vol. 30, pp. 199-218, 2003.
[260] R. A. Hassad, "Development and validation of a teaching practice scale (TISS) for instructors of introductory statistics at the college level," arXiv preprint arXiv:1007.3654, 2010.
[261] J. C. Anderson and D. W. Gerbing, "Structural equation modeling in practice: A review and recommended two-step approach," Psychological bulletin, vol. 103, pp. 411-423, 1988.
238
[262] B. M. Byrne, Structural Equation Modeling With Eqs: Basic Concepts, Applications, And Programming, 2nd ed. Routledge, New York.: Psychology Press, 2006.
[263] J. Cohen, Applied Multiple Regression/Correlation Analysis for the Behavioral Sciences. Mahwah, New Jersey: Lawrence Erlbaum Associates, 2003.
[264] L. K. Muthén and B. O. Muthén, "Statistical analysis with latent variables," Los Angeles: Muthén & Muthén, 2001.
[265] J. E. Hunter and F. L. Schmidt, Methods of meta-analysis: Correcting error and bias in research findings: SAGE Publications, Incorporated, 2004.
[266] S. L. Hershberger, "The growth of structural equation modeling: 1994-2001," Structural Equation Modeling, vol. 10, pp. 35-46, 2003.
[267] A. Diamantopoulos, "Viewpoint–export performance measurement: reflective versus formative indicators," International Marketing Review, vol. 16, pp. 444-457, 1999.
[268] K.-H. Yuan and Z. Zhang, "Structural Equation Modeling Diagnostics Using R Package semdiag and EQS," Structural Equation Modeling, vol. 19, pp. 683-702, 2012.
[269] H. M. Blalock, Causal inferences in nonexperimental research. Chapel Hill: University of North Carolina Press, 1964.
[270] O. D. Duncan, Introduction to structural equation models. New York, USA: Academic Press, 1975.
[271] B. M. Byrne, Structural equation modeling with AMOS: Basic concepts, applications, and programming: Psychology Press, 2010.
[272] D. Hooper, J. Coughlan, and M. Mullen, "Structural equation modelling: guidelines for determining model fit," Electronic Journal of Business Research Methods, vol. 6, pp. 53-60, 2008.
[273] S. Gao, Y. Yang, and J. Krogstie, "The Adoption of Smartphones Among Older Adults in China," in Information and Knowledge Management in Complex Systems, ed: Springer, 2015, pp. 112-122.
[274] S. Lee and S. Lee, "Early diffusion of smartphones in OECD and BRICS countries: An examination of the effects of platform competition and indirect network effects," Telematics and Informatics, vol. 31, pp. 345-355, 2014.
[275] M. S. Kocour, "An Investigation of the Key Factors that Affect the Adoption of Smartphones in Global Midmarket Professional Service Firms," 2014.
[276] W. Yu-Lung, T. Yu-Hui, and J. Pei-Chi Yang, "Using UTAUT to explore the behavior of 3G mobile communication users," in IEEE International Conference on Industrial Engineering and Engineering Management 2007, pp. 199-203.
[277] T. C. a. I. T. C. (CITC). (2014, december, 8). Establishment Report. Available: http://www.citc.gov.sa/English/AboutUs/AreasOfwork/Pages/default.aspx
[278] S. A. Al-Hudhaif and A. Alkubeyyer, "E-commerce adoption factors in Saudi Arabia," International Journal of Business and Management, vol. 6, p. p122, 2011.
239
[279] A. Persaud and I. Azhar, "Innovative mobile marketing via smartphones: are consumers ready?," Marketing Intelligence & Planning, vol. 30, pp. 418-443, 2012.
[280] A. Alfaifi. (2015, November 1). Ghost pressures prosecuted telecommunications companies. Available: http://www.alwatan.com.sa/Economy/News_Detail.aspx?ArticleID=240656&CategoryID=2

240
Appendix A: Brainstorming Session
invitation for targeted participants in brainstorming session
Dear Mrs. /Mr.
I am a PhD student in the Department of Engineering and Technology
Management (ETM) at Portland State University. The topic of my PhD research is
“Exploring the Adoption and Use of the Smartphone Technology in Emerging Regions:
Case of Saudi Arabia”. As a part of my research, I develop a preliminary research model
Unified Theory of Acceptance and Use of Technology (UTAUT) to study and identify the
key factors that are associated with users’ intention to adopt and use the Smartphone.
Through a literature review conducted for this research a number of factors have been
identified that are related to the adoption and use of Smartphone and its related
technologies. As a part of my research I need to conduct a brainstorming session to help
in introducing new factors and selecting the most important factors that can be included
in the research preliminary research model.
You have been identified as an experienced user of the Smartphone and your
expertise and knowledge will be very helpful in my research. The brainstorming session
is expected to take around one hour to be completed and will be conducted in the most
convenient time and place for the participants. People who agree to participate will
receive more details about the research including the research model, main factors and
the factors derived from literature review. I will really appreciate it if you accept my
invitation and participate in this brainstorming session.
Details provided to participants in brainstorming session
241
More details provided to participants
Dear Dr. X,
Thank you for accepting my invitation to participate in the brainstorming session
for my PhD research. The author developed a preliminary research model, shown in
figure 2 below, to study and identify the key factors that influence users’ adoption and
use of the Smartphone. The preliminary research model is developed based on Unified
Theory of Acceptance and Use of Technology (UTAUT) model which include five main
factors adopted from UTAUT model. UTAUT model claims that each of these five main
factors, namely performance expectancy, effort expectancy, social influence, facilitating
conditions and economic factors can have an influence on users’ intention to adopt and
use a new technology. Through a literature review conducted for this research more
than factors have been identified which may have relationships with users’ adoption
and use of Smartphone and its related technologies (see table1 below). Taxonomy of
factors related to the adoption and use of the Smartphone has been developed based
on the factors that have been identified in literature (see figure 1 below). The aim of
conducting a brainstorming session is to obtain creative ideas and thought of
experienced users of the Smartphone in evaluating the identified factors and adding any
missing factors that may have relationship with adoption and use of the Smartphone.
Below is the preliminary research model that is developed for this research (see figure
2), table of the external factors identified in literature, definitions of the main factors in
the preliminary research model, and definitions of the external factors identified in
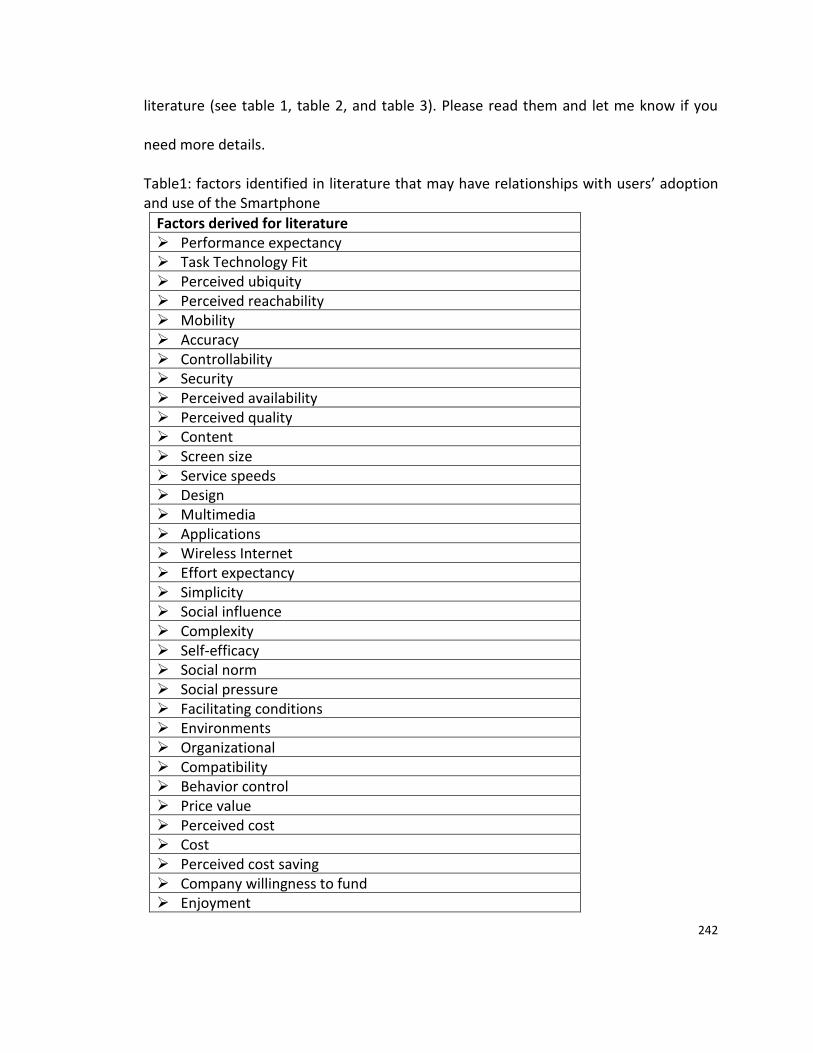
242
literature (see table 1, table 2, and table 3). Please read them and let me know if you
need more details.
Table1: factors identified in literature that may have relationships with users’ adoption and use of the Smartphone
Factors derived for literature Performance expectancy Task Technology Fit Perceived ubiquity Perceived reachability Mobility Accuracy Controllability Security Perceived availability Perceived quality Content Screen size Service speeds Design Multimedia Applications Wireless Internet Effort expectancy Simplicity Social influence Complexity Self-efficacy Social norm Social pressure Facilitating conditions Environments Organizational Compatibility Behavior control Price value Perceived cost Cost Perceived cost saving Company willingness to fund Enjoyment

243
Perceived enjoyment Computer playfulness Fun Entertainment utility After service
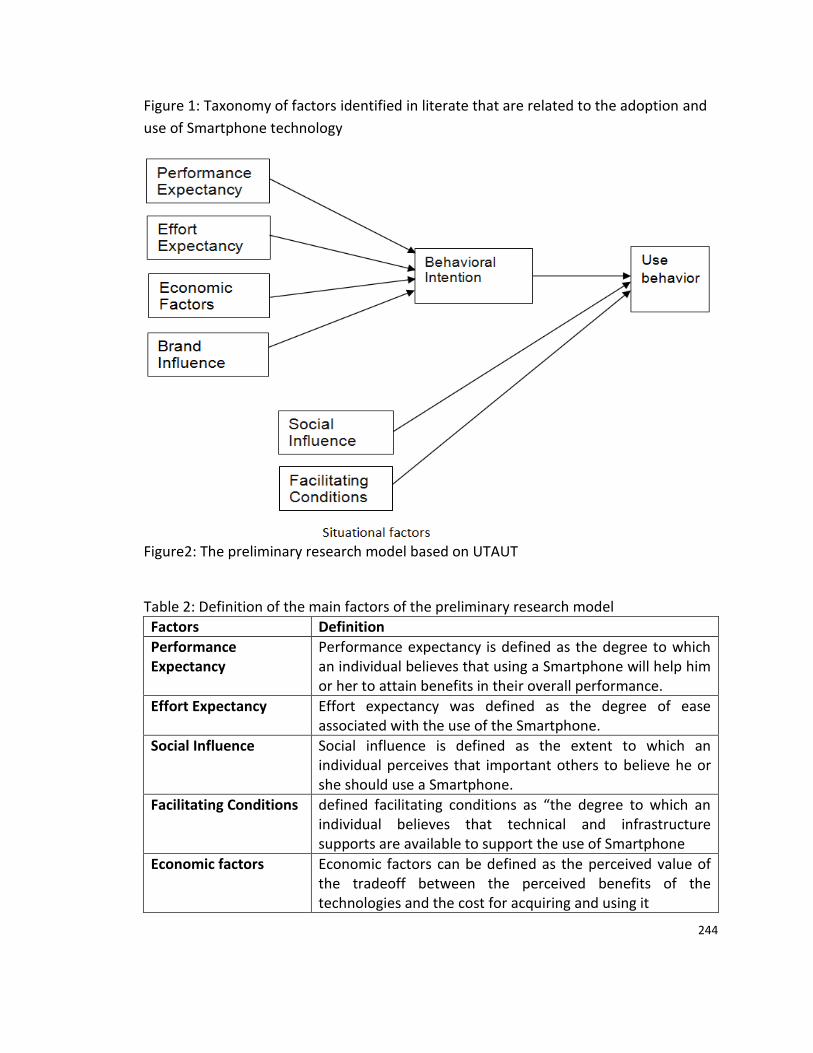
244
Figure 1: Taxonomy of factors identified in literate that are related to the adoption and
use of Smartphone technology
Figure2: The preliminary research model based on UTAUT
Table 2: Definition of the main factors of the preliminary research model
Factors Definition
Performance Expectancy
Performance expectancy is defined as the degree to which an individual believes that using a Smartphone will help him or her to attain benefits in their overall performance.
Effort Expectancy Effort expectancy was defined as the degree of ease associated with the use of the Smartphone.
Social Influence Social influence is defined as the extent to which an individual perceives that important others to believe he or she should use a Smartphone.
Facilitating Conditions defined facilitating conditions as “the degree to which an individual believes that technical and infrastructure supports are available to support the use of Smartphone
Economic factors Economic factors can be defined as the perceived value of the tradeoff between the perceived benefits of the technologies and the cost for acquiring and using it
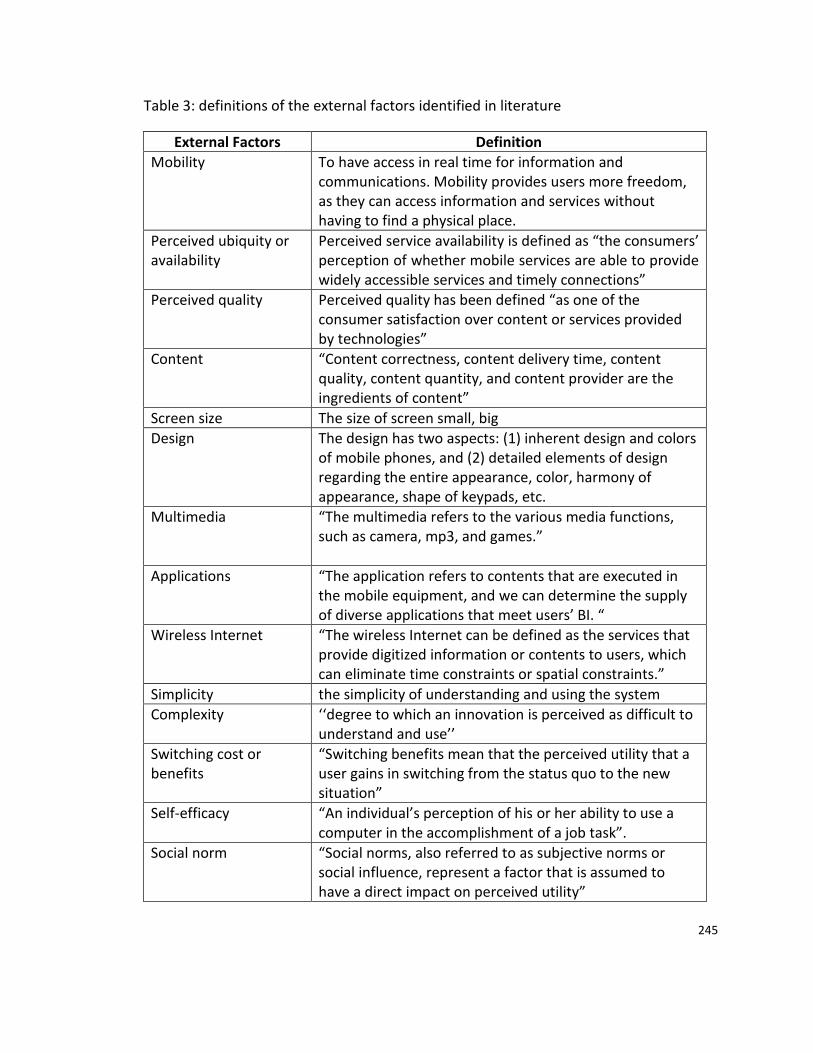
245
Table 3: definitions of the external factors identified in literature
External Factors Definition
Mobility To have access in real time for information and communications. Mobility provides users more freedom, as they can access information and services without having to find a physical place.
Perceived ubiquity or availability
Perceived service availability is defined as “the consumers’ perception of whether mobile services are able to provide widely accessible services and timely connections”
Perceived quality Perceived quality has been defined “as one of the consumer satisfaction over content or services provided by technologies”
Content “Content correctness, content delivery time, content quality, content quantity, and content provider are the ingredients of content”
Screen size The size of screen small, big
Design The design has two aspects: (1) inherent design and colors of mobile phones, and (2) detailed elements of design regarding the entire appearance, color, harmony of appearance, shape of keypads, etc.
Multimedia “The multimedia refers to the various media functions, such as camera, mp3, and games.”
Applications “The application refers to contents that are executed in the mobile equipment, and we can determine the supply of diverse applications that meet users’ BI. “
Wireless Internet “The wireless Internet can be defined as the services that provide digitized information or contents to users, which can eliminate time constraints or spatial constraints.”
Simplicity the simplicity of understanding and using the system
Complexity ‘‘degree to which an innovation is perceived as difficult to understand and use’’
Switching cost or benefits
“Switching benefits mean that the perceived utility that a user gains in switching from the status quo to the new situation”
Self-efficacy “An individual’s perception of his or her ability to use a computer in the accomplishment of a job task”.
Social norm “Social norms, also referred to as subjective norms or social influence, represent a factor that is assumed to have a direct impact on perceived utility”
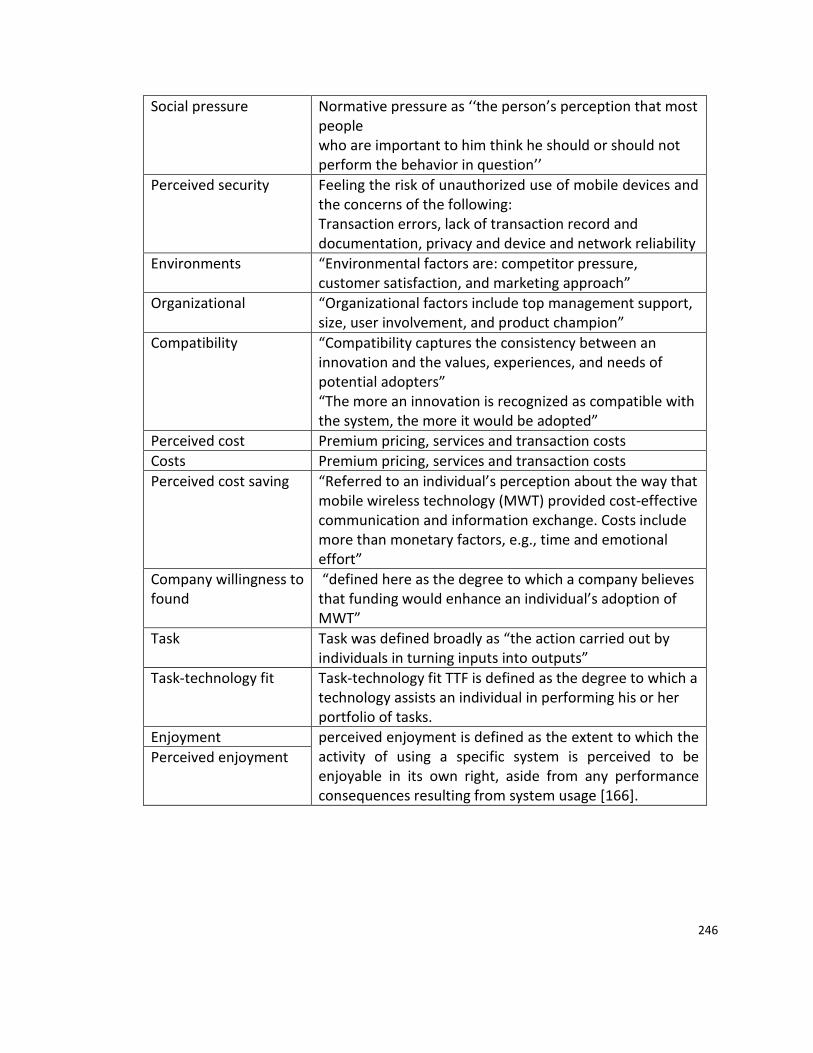
246
Social pressure Normative pressure as ‘‘the person’s perception that most people who are important to him think he should or should not perform the behavior in question’’
Perceived security Feeling the risk of unauthorized use of mobile devices and the concerns of the following: Transaction errors, lack of transaction record and documentation, privacy and device and network reliability
Environments “Environmental factors are: competitor pressure, customer satisfaction, and marketing approach”
Organizational “Organizational factors include top management support, size, user involvement, and product champion”
Compatibility “Compatibility captures the consistency between an innovation and the values, experiences, and needs of potential adopters” “The more an innovation is recognized as compatible with the system, the more it would be adopted”
Perceived cost Premium pricing, services and transaction costs
Costs Premium pricing, services and transaction costs
Perceived cost saving “Referred to an individual’s perception about the way that mobile wireless technology (MWT) provided cost-effective communication and information exchange. Costs include more than monetary factors, e.g., time and emotional effort”
Company willingness to found
“defined here as the degree to which a company believes that funding would enhance an individual’s adoption of MWT”
Task Task was defined broadly as “the action carried out by individuals in turning inputs into outputs”
Task-technology fit Task-technology fit TTF is defined as the degree to which a technology assists an individual in performing his or her portfolio of tasks.
Enjoyment perceived enjoyment is defined as the extent to which the activity of using a specific system is perceived to be enjoyable in its own right, aside from any performance consequences resulting from system usage [166].
Perceived enjoyment
247
Main question for the brainstorming session
Q1 Please take five to 10 minutes to think about new factors that can be introduced
which you believe are associated with users’ adoption and use of the Smartphone.
Please introduce only new factors that are not mentioned in list of factors provided to
you.
Q2. Please take five to 10 minutes to think and evaluate all factors; the newly
introduced in this brainstorming session and the factors that are in the list provided to
you, and narrow them down into only the most important factors.
Q3. Please take five to 10 minutes to re-evaluate all factors including the main factors
showing in the preliminary research model and explain how can the most important
factors selected can be logically linked into the main factors and the behavioral
intention in the preliminary research model.
248
Conference room reservation confirmation email
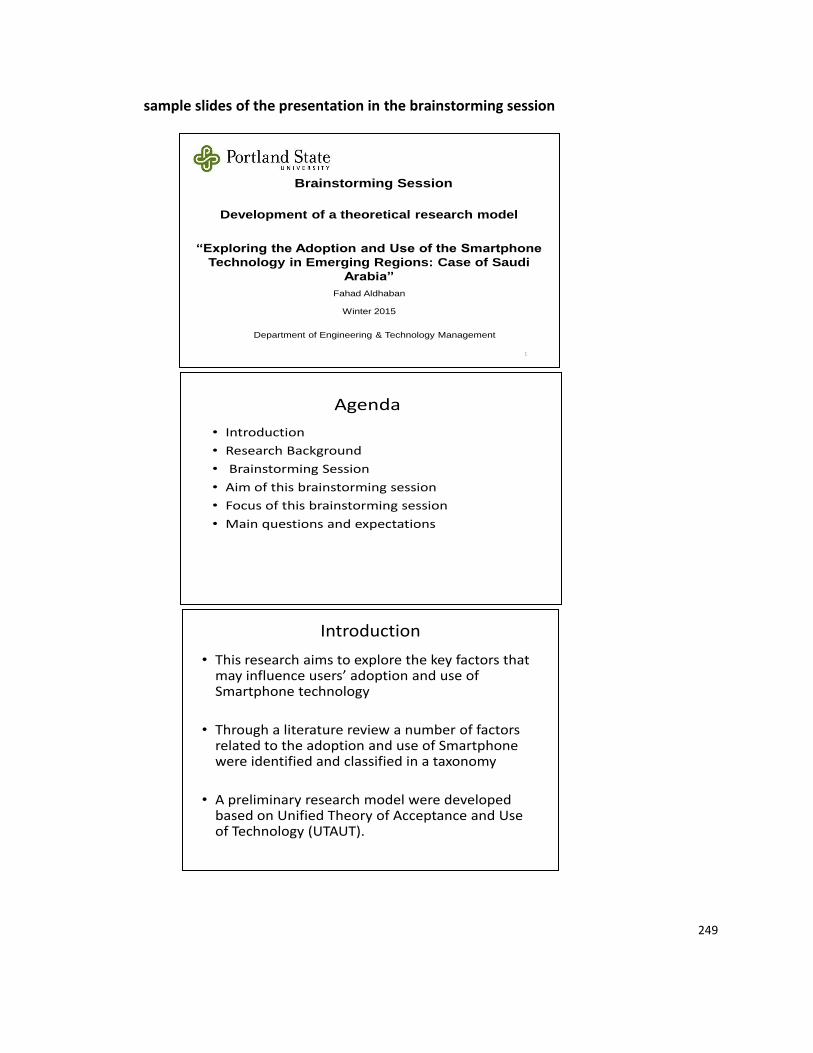
249
sample slides of the presentation in the brainstorming session
Brainstorming Session
Development of a theoretical research model
“Exploring the Adoption and Use of the Smartphone
Technology in Emerging Regions: Case of Saudi
Arabia”
Fahad Aldhaban
Winter 2015
Department of Engineering & Technology Management
1
Agenda
• Introduction
• Research Background
• Brainstorming Session
• Aim of this brainstorming session
• Focus of this brainstorming session
• Main questions and expectations
Introduction
• This research aims to explore the key factors that may influence users’ adoption and use of Smartphone technology
• Through a literature review a number of factors related to the adoption and use of Smartphone were identified and classified in a taxonomy
• A preliminary research model were developed based on Unified Theory of Acceptance and Use of Technology (UTAUT).
250
Appendix B: Focus Group Session
(An invitation email that was sent to targeted participates in the focus group session)
Dear Mrs. /Mr.
I am a PhD student in the Department of Engineering and Technology
Management (ETM) at Portland State University. The topic of my PhD research is
“Exploring the Adoption and Use of the Smartphone Technology in Emerging Regions:
Case of Saudi Arabia”. As a part of my research, I develop a preliminary research model
Unified Theory of Acceptance and Use of Technology (UTAUT) to study and identify the
key factors that are associated with users’ intention to adopt and use the Smartphone.
Through a literature review conducted for this research a number of factors have been
identified that are related to the adoption and use of Smartphone and its related
technologies. As a part of my research I need to conduct a Focus group session to help
in introducing new factors and selecting the most important factors that can be included
in the research preliminary research model.
You have been identified as an experienced user of the Smartphone and your
expertise and knowledge will be very helpful in my research. The focus group session is
expected to take around one hour to be completed and it will be conducted in the most
convenient time and place for the participants. People who agree to participate will
receive more details about the research including the research model, main factors and
the factors derived from literature review. I will really appreciate it if you accept my
invitation and participate in this focus group session.
251
Details provided to participants in the focus group session
Dear Dr. X,
Thank you for accepting my invitation to participate in the focus group session
for my PhD research. The author developed a preliminary research model, shown in
figure 2 below, to study and identify the key factors that influence users’ adoption and
use of the Smartphone. The preliminary research model is developed based on Unified
Theory of Acceptance and Use of Technology (UTAUT) model which include four main
factors adopted from UTAUT model. UTAUT model claims that each of these five main
factors, namely performance expectancy, effort expectancy, social influence, and
facilitating conditions, can have an influence on users’ intention to adopt and use a new
technology. Through a literature review conducted for this research forty factors have
been identified which may have relationships with users’ adoption and use of
Smartphone and its related technologies (see table1 below). Taxonomy of factors
related to the adoption and use of the Smartphone has been developed based on the
factors that have been identified in literature (see figure 1 below). The aim of
conducting this focus group session is to obtain participants’ opinions and perspective in
evaluating the identified and selecting factors and adding any missing factors that may
have relationship with adoption and use of the Smartphone. Below is the preliminary
research model that is developed for this research (see figure 2), table of factors
identified in literature, definitions of the main factors in the preliminary research model,
and definitions of the external factors identified in literature (see table 1, table 2, and
table 3). Please read them and let me know if you need more details.
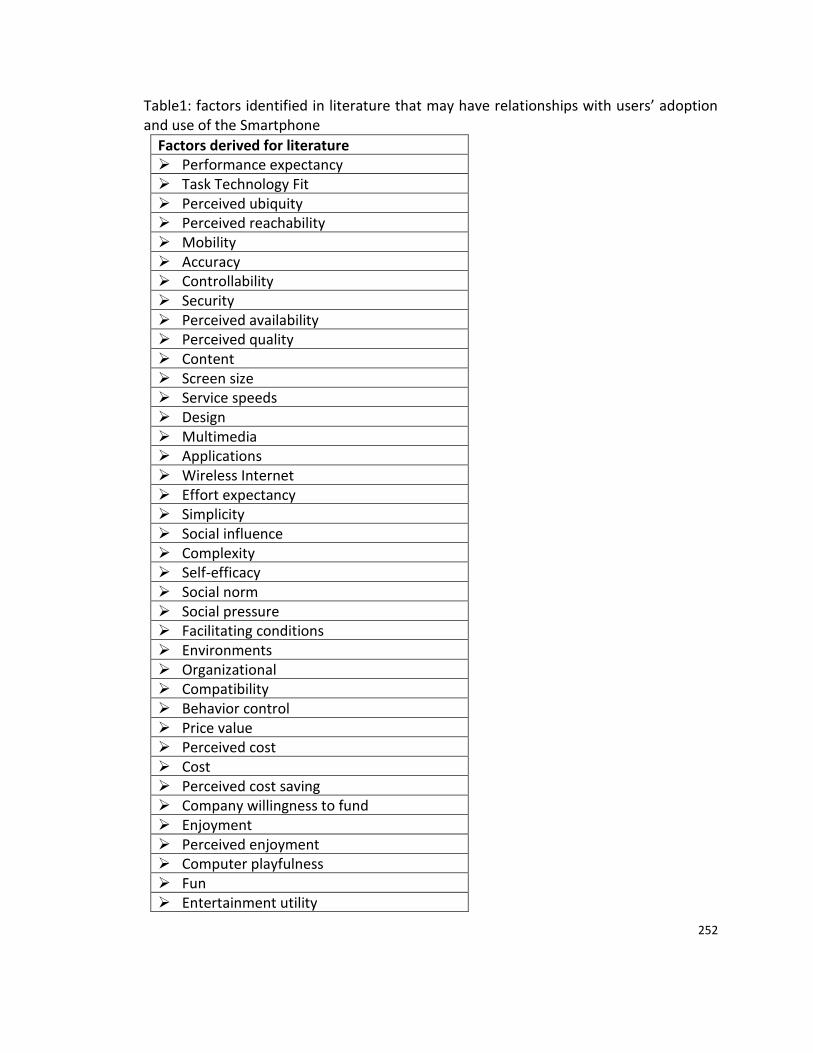
252
Table1: factors identified in literature that may have relationships with users’ adoption and use of the Smartphone
Factors derived for literature Performance expectancy Task Technology Fit Perceived ubiquity Perceived reachability Mobility Accuracy Controllability Security Perceived availability Perceived quality Content Screen size Service speeds Design Multimedia Applications Wireless Internet Effort expectancy Simplicity Social influence Complexity Self-efficacy Social norm Social pressure Facilitating conditions Environments Organizational Compatibility Behavior control Price value Perceived cost Cost Perceived cost saving Company willingness to fund Enjoyment Perceived enjoyment Computer playfulness Fun Entertainment utility
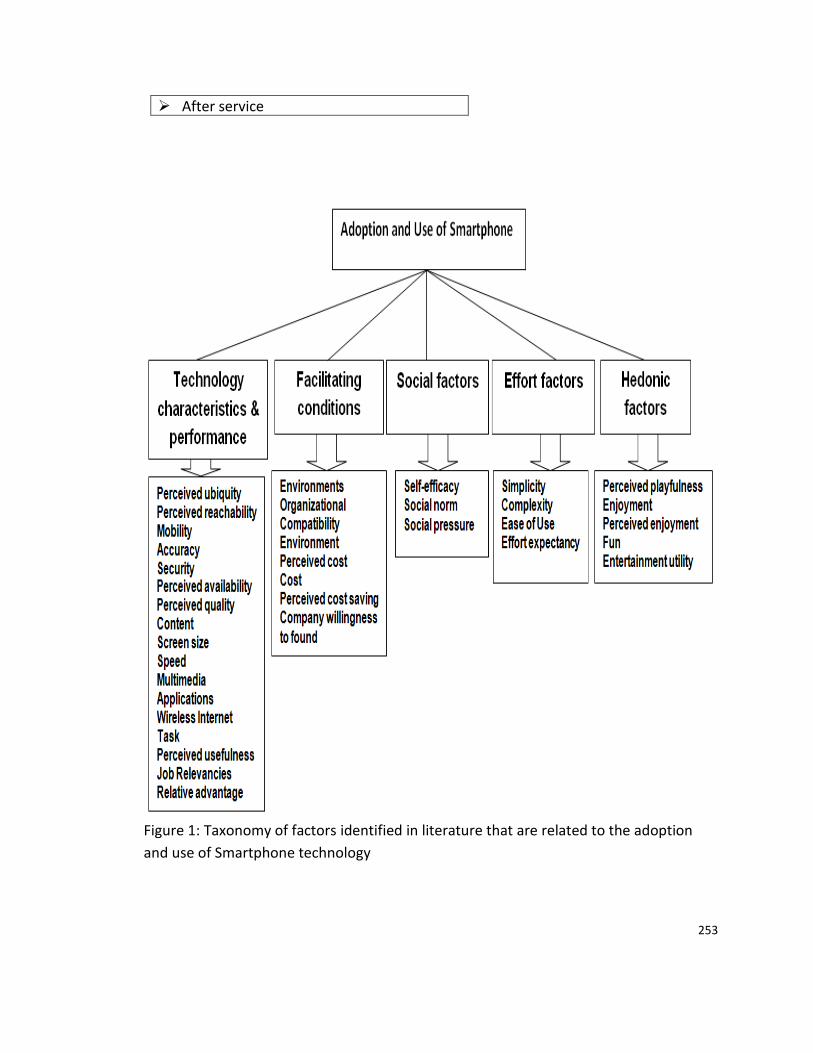
253
Figure 1: Taxonomy of factors identified in literature that are related to the adoption
and use of Smartphone technology
After service
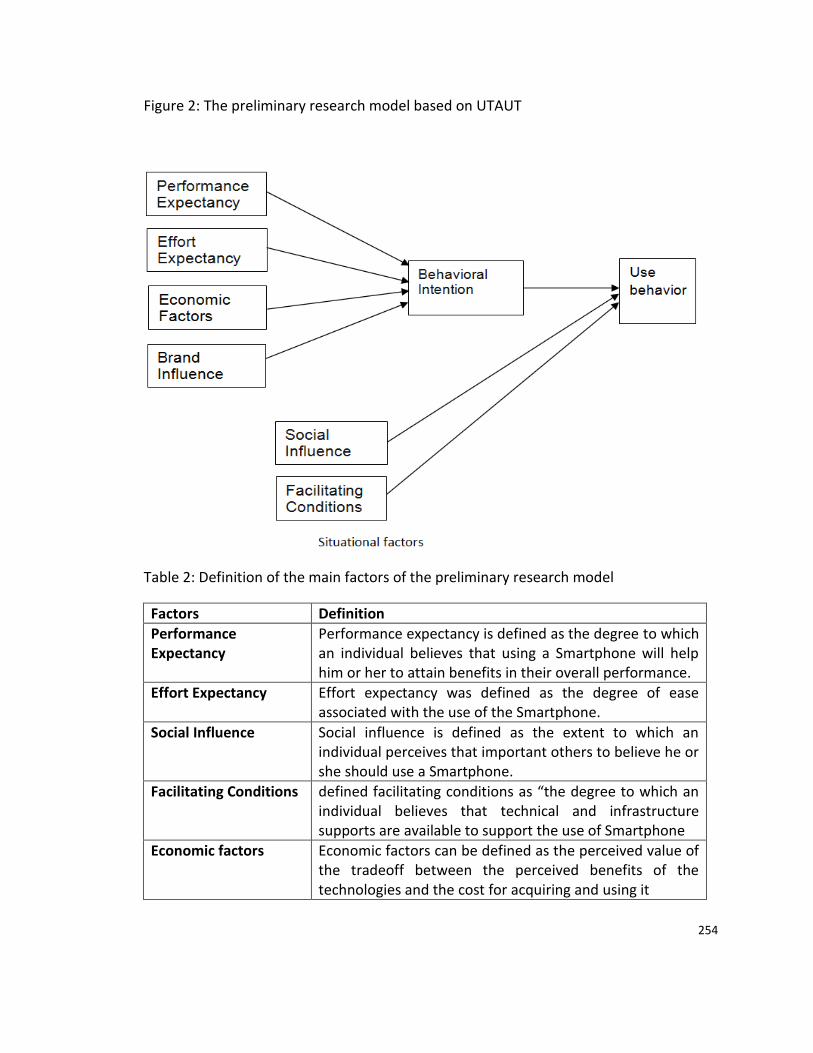
254
Figure 2: The preliminary research model based on UTAUT
Table 2: Definition of the main factors of the preliminary research model
Factors Definition
Performance Expectancy
Performance expectancy is defined as the degree to which an individual believes that using a Smartphone will help him or her to attain benefits in their overall performance.
Effort Expectancy Effort expectancy was defined as the degree of ease associated with the use of the Smartphone.
Social Influence Social influence is defined as the extent to which an individual perceives that important others to believe he or she should use a Smartphone.
Facilitating Conditions defined facilitating conditions as “the degree to which an individual believes that technical and infrastructure supports are available to support the use of Smartphone
Economic factors Economic factors can be defined as the perceived value of the tradeoff between the perceived benefits of the technologies and the cost for acquiring and using it
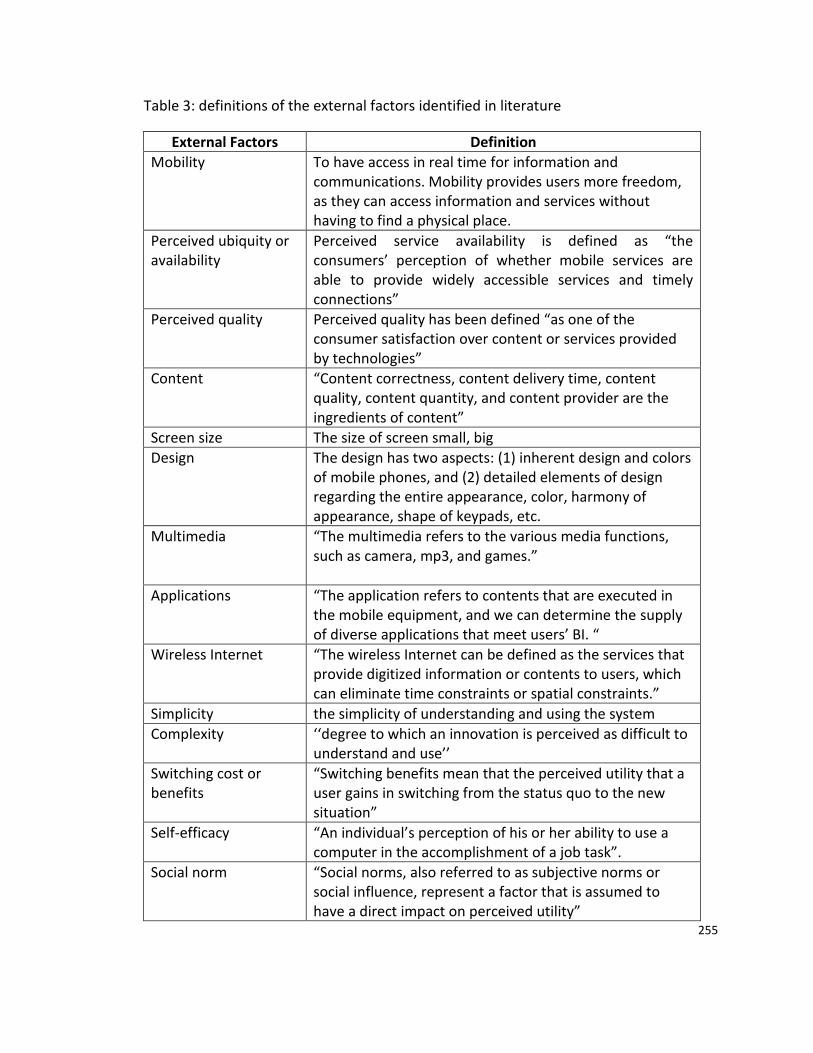
255
Table 3: definitions of the external factors identified in literature
External Factors Definition
Mobility To have access in real time for information and communications. Mobility provides users more freedom, as they can access information and services without having to find a physical place.
Perceived ubiquity or availability
Perceived service availability is defined as “the consumers’ perception of whether mobile services are able to provide widely accessible services and timely connections”
Perceived quality Perceived quality has been defined “as one of the consumer satisfaction over content or services provided by technologies”
Content “Content correctness, content delivery time, content quality, content quantity, and content provider are the ingredients of content”
Screen size The size of screen small, big
Design The design has two aspects: (1) inherent design and colors of mobile phones, and (2) detailed elements of design regarding the entire appearance, color, harmony of appearance, shape of keypads, etc.
Multimedia “The multimedia refers to the various media functions, such as camera, mp3, and games.”
Applications “The application refers to contents that are executed in the mobile equipment, and we can determine the supply of diverse applications that meet users’ BI. “
Wireless Internet “The wireless Internet can be defined as the services that provide digitized information or contents to users, which can eliminate time constraints or spatial constraints.”
Simplicity the simplicity of understanding and using the system
Complexity ‘‘degree to which an innovation is perceived as difficult to understand and use’’
Switching cost or benefits
“Switching benefits mean that the perceived utility that a user gains in switching from the status quo to the new situation”
Self-efficacy “An individual’s perception of his or her ability to use a computer in the accomplishment of a job task”.
Social norm “Social norms, also referred to as subjective norms or social influence, represent a factor that is assumed to have a direct impact on perceived utility”
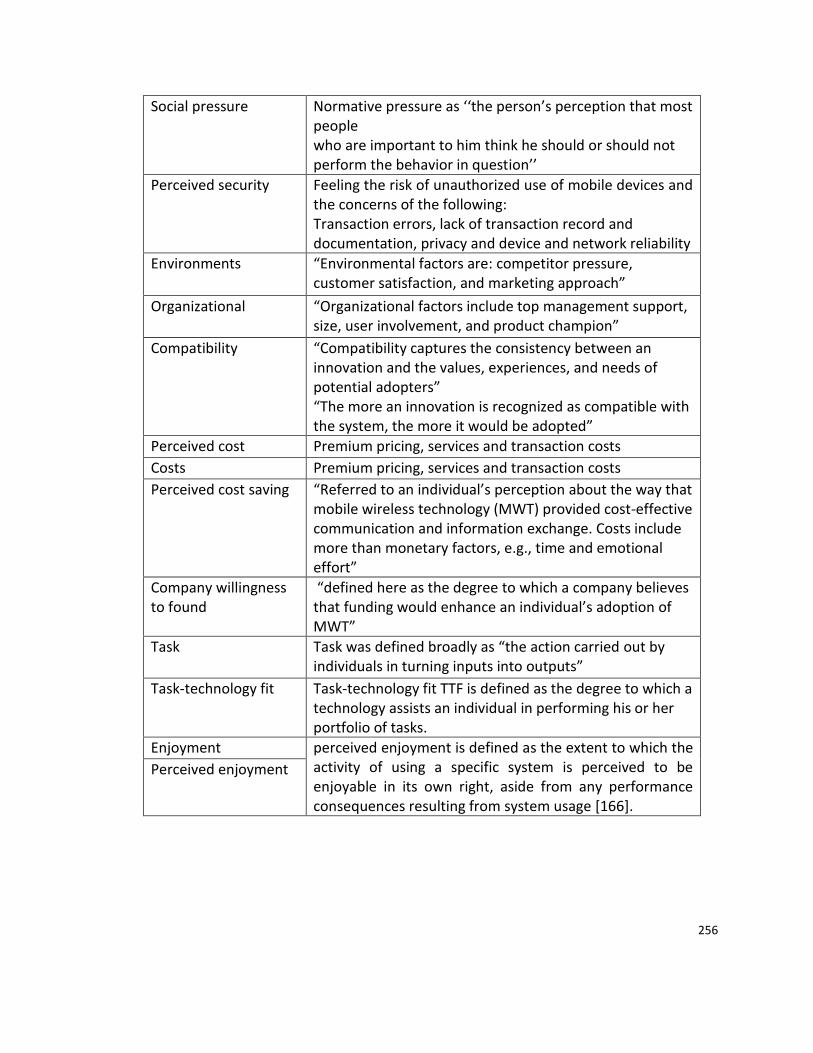
256
Social pressure Normative pressure as ‘‘the person’s perception that most people who are important to him think he should or should not perform the behavior in question’’
Perceived security Feeling the risk of unauthorized use of mobile devices and the concerns of the following: Transaction errors, lack of transaction record and documentation, privacy and device and network reliability
Environments “Environmental factors are: competitor pressure, customer satisfaction, and marketing approach”
Organizational “Organizational factors include top management support, size, user involvement, and product champion”
Compatibility “Compatibility captures the consistency between an innovation and the values, experiences, and needs of potential adopters” “The more an innovation is recognized as compatible with the system, the more it would be adopted”
Perceived cost Premium pricing, services and transaction costs
Costs Premium pricing, services and transaction costs
Perceived cost saving “Referred to an individual’s perception about the way that mobile wireless technology (MWT) provided cost-effective communication and information exchange. Costs include more than monetary factors, e.g., time and emotional effort”
Company willingness to found
“defined here as the degree to which a company believes that funding would enhance an individual’s adoption of MWT”
Task Task was defined broadly as “the action carried out by individuals in turning inputs into outputs”
Task-technology fit Task-technology fit TTF is defined as the degree to which a technology assists an individual in performing his or her portfolio of tasks.
Enjoyment perceived enjoyment is defined as the extent to which the activity of using a specific system is perceived to be enjoyable in its own right, aside from any performance consequences resulting from system usage [166].
Perceived enjoyment
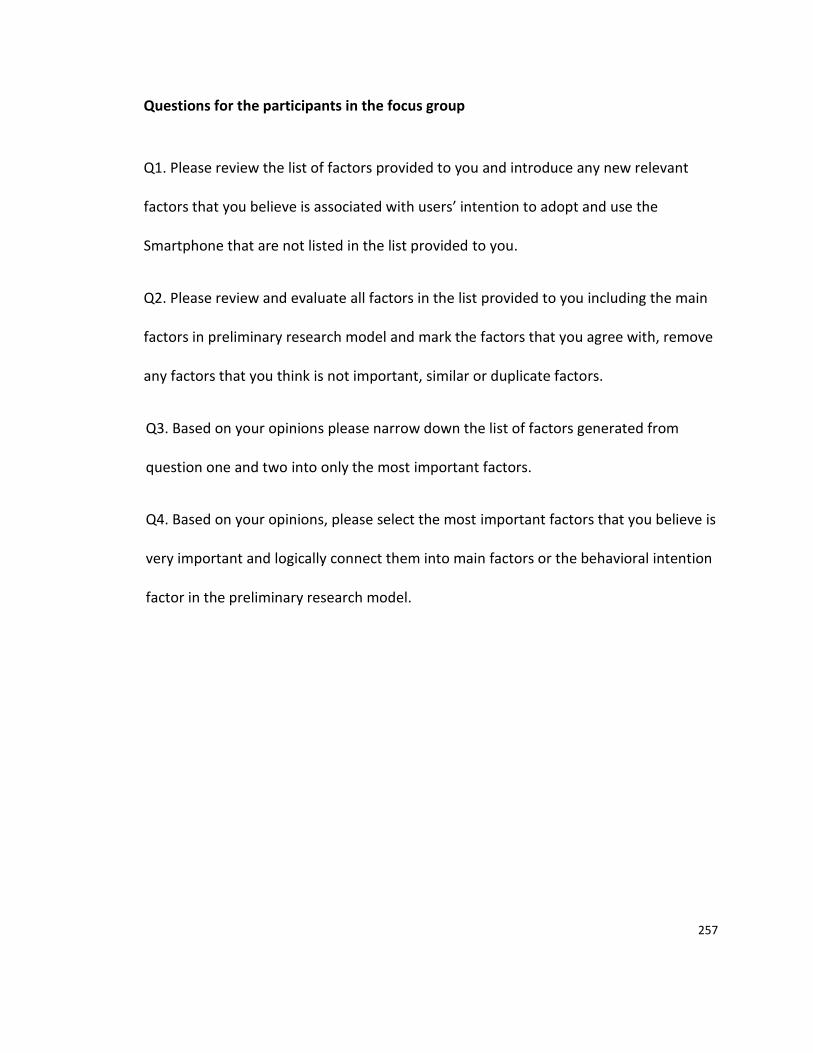
257
Questions for the participants in the focus group
Q1. Please review the list of factors provided to you and introduce any new relevant
factors that you believe is associated with users’ intention to adopt and use the
Smartphone that are not listed in the list provided to you.
Q2. Please review and evaluate all factors in the list provided to you including the main
factors in preliminary research model and mark the factors that you agree with, remove
any factors that you think is not important, similar or duplicate factors.
Q3. Based on your opinions please narrow down the list of factors generated from
question one and two into only the most important factors.
Q4. Based on your opinions, please select the most important factors that you believe is
very important and logically connect them into main factors or the behavioral intention
factor in the preliminary research model.
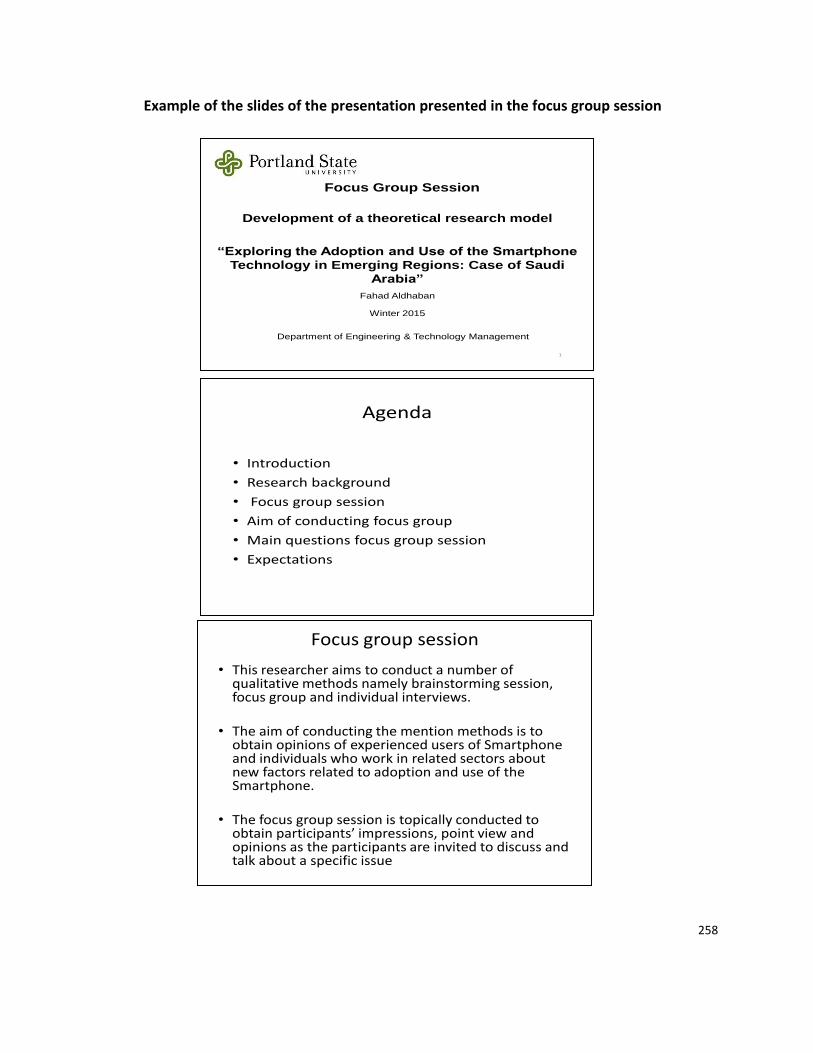
258
Example of the slides of the presentation presented in the focus group session
Focus Group Session
Development of a theoretical research model
“Exploring the Adoption and Use of the Smartphone
Technology in Emerging Regions: Case of Saudi
Arabia”
Fahad Aldhaban
Winter 2015
Department of Engineering & Technology Management
1
Agenda
• Introduction
• Research background
• Focus group session
• Aim of conducting focus group
• Main questions focus group session
• Expectations
Focus group session
• This researcher aims to conduct a number of qualitative methods namely brainstorming session, focus group and individual interviews.
• The aim of conducting the mention methods is to obtain opinions of experienced users of Smartphone and individuals who work in related sectors about new factors related to adoption and use of the Smartphone.
• The focus group session is topically conducted to obtain participants’ impressions, point view and opinions as the participants are invited to discuss and talk about a specific issue
259
Appendix C: Individual Interviews
(An invitation email that was sent or submitted to targeted participates in the
interviews)
Dear Mrs. /Mr.
I am a PhD student in the Department of Engineering and Technology
Management (ETM) at Portland State University. The topic of my PhD research is
“Exploring the Adoption and Use of the Smartphone Technology in Emerging Regions:
Case of Saudi Arabia”. As a part of my research, I develop a preliminary research model
Unified Theory of Acceptance and Use of Technology (UTAUT) to study and identify the
key factors that are associated with users’ intention to adopt and use the Smartphone.
Through a literature review conducted for this research a number of factors have been
identified that are related to the adoption and use of Smartphone and its related
technologies. As a part of my research I need to conduct individual interviews to help in
introducing new factors and selecting the most important factors that can be included in
the research preliminary research model.
You have been identified as an experienced user of the Smartphone and your
expertise and knowledge will be very helpful in my research. The individual interview is
expected to take 20 to 40 minutes to be completed and it will be conducted in the most
convenient time and place for each individual. Individual who agree to participate will
receive more details about the research including the research model, main factors and
the factors derived from the literature review. I will really appreciate it if you accept my
invitation and participate in this individual interview.
260
Details provided to participants who agreed to participate in the interviews
Dear Dr. X,
Thank you for accepting my invitation to participate in the individual interview
for my PhD research. The author developed a preliminary research model, shown in
figure 2 below, to study and identify the key factors that influence users’ adoption and
use of the Smartphone. The preliminary research model is developed based on Unified
Theory of Acceptance and Use of Technology (UTAUT) model which include four main
factors adopted from UTAUT model. UTAUT model claims that each of these five main
factors, namely performance expectancy, effort expectancy, social influence, and
facilitating conditions, can have an influence on users’ intention to adopt and use a new
technology. Through a literature review conducted for this research thirty five external
factors have been identified which may have relationships with users’ adoption and use
of Smartphone and its related technologies (see table1 below). Taxonomy of factors
related to the adoption and use of the Smartphone has been developed based on the
factors that have been identified in literature (see figure 1 below). The aim of
conducting this individual interview is to obtain participants’ opinions and perspective in
evaluating the identified and selecting factors and adding any missing factors that may
have relationship with adoption and use of the Smartphone. Below is the preliminary
research model that is developed for this research (see figure 2), table of the external
factors identified in literature, definitions of the main factors in the preliminary research
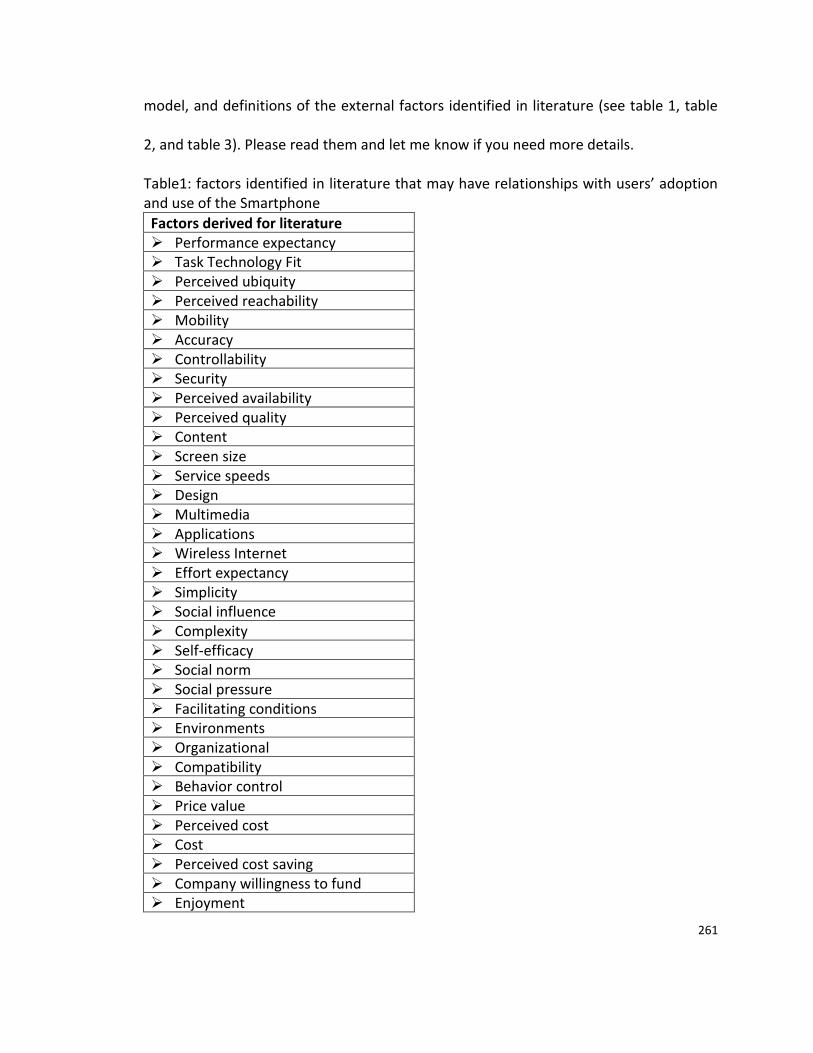
261
model, and definitions of the external factors identified in literature (see table 1, table
2, and table 3). Please read them and let me know if you need more details.
Table1: factors identified in literature that may have relationships with users’ adoption and use of the Smartphone
Factors derived for literature Performance expectancy Task Technology Fit Perceived ubiquity Perceived reachability Mobility Accuracy Controllability Security Perceived availability Perceived quality Content Screen size Service speeds Design Multimedia Applications Wireless Internet Effort expectancy Simplicity Social influence Complexity Self-efficacy Social norm Social pressure Facilitating conditions Environments Organizational Compatibility Behavior control Price value Perceived cost Cost Perceived cost saving Company willingness to fund Enjoyment
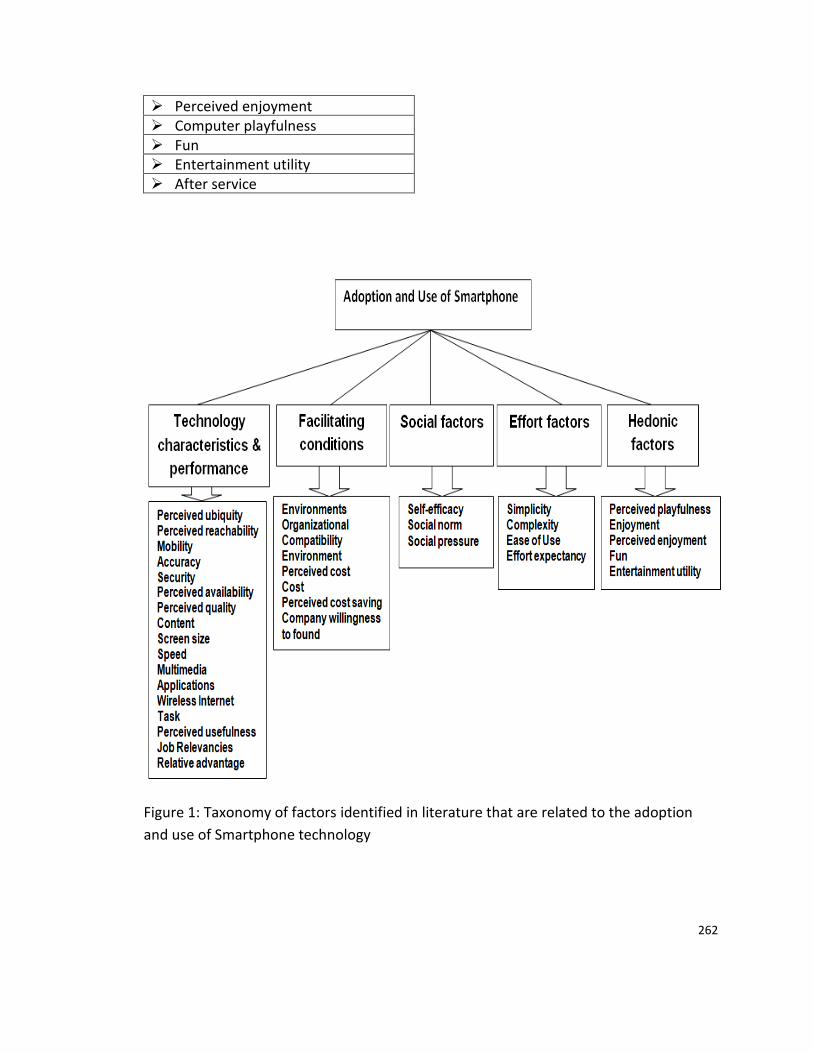
262
Figure 1: Taxonomy of factors identified in literature that are related to the adoption
and use of Smartphone technology
Perceived enjoyment Computer playfulness Fun Entertainment utility After service
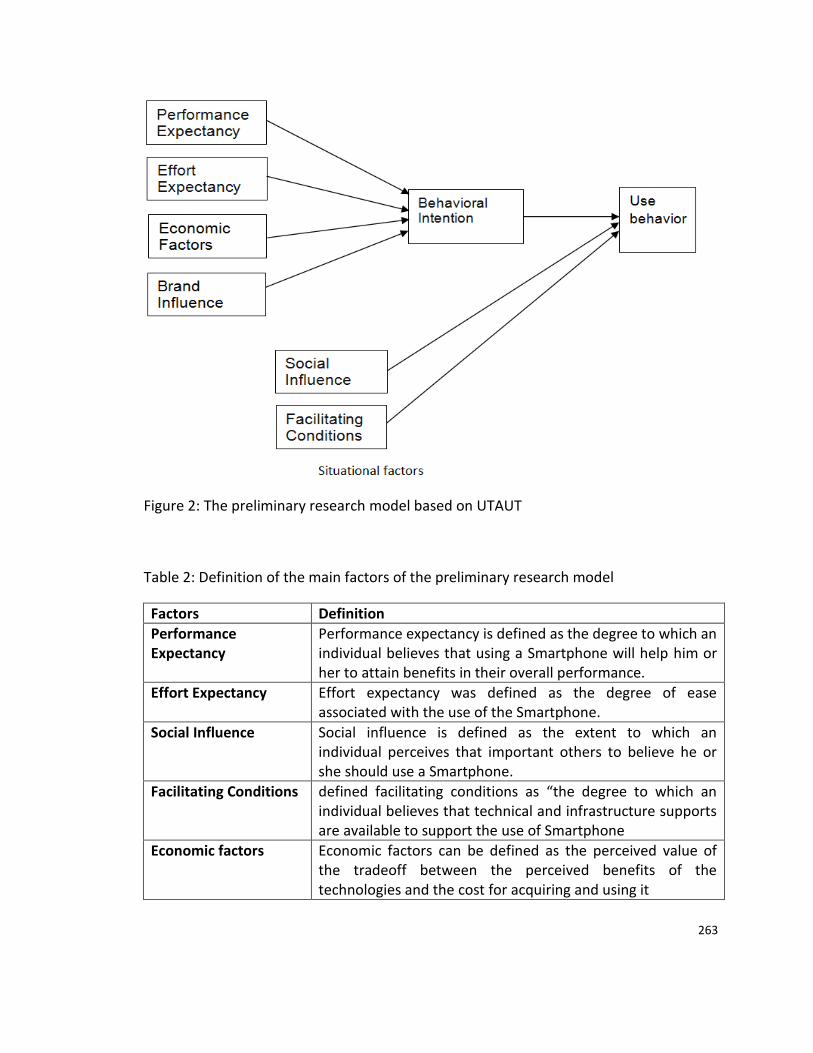
263
Figure 2: The preliminary research model based on UTAUT
Table 2: Definition of the main factors of the preliminary research model
Factors Definition
Performance Expectancy
Performance expectancy is defined as the degree to which an individual believes that using a Smartphone will help him or her to attain benefits in their overall performance.
Effort Expectancy Effort expectancy was defined as the degree of ease associated with the use of the Smartphone.
Social Influence Social influence is defined as the extent to which an individual perceives that important others to believe he or she should use a Smartphone.
Facilitating Conditions defined facilitating conditions as “the degree to which an individual believes that technical and infrastructure supports are available to support the use of Smartphone
Economic factors Economic factors can be defined as the perceived value of the tradeoff between the perceived benefits of the technologies and the cost for acquiring and using it
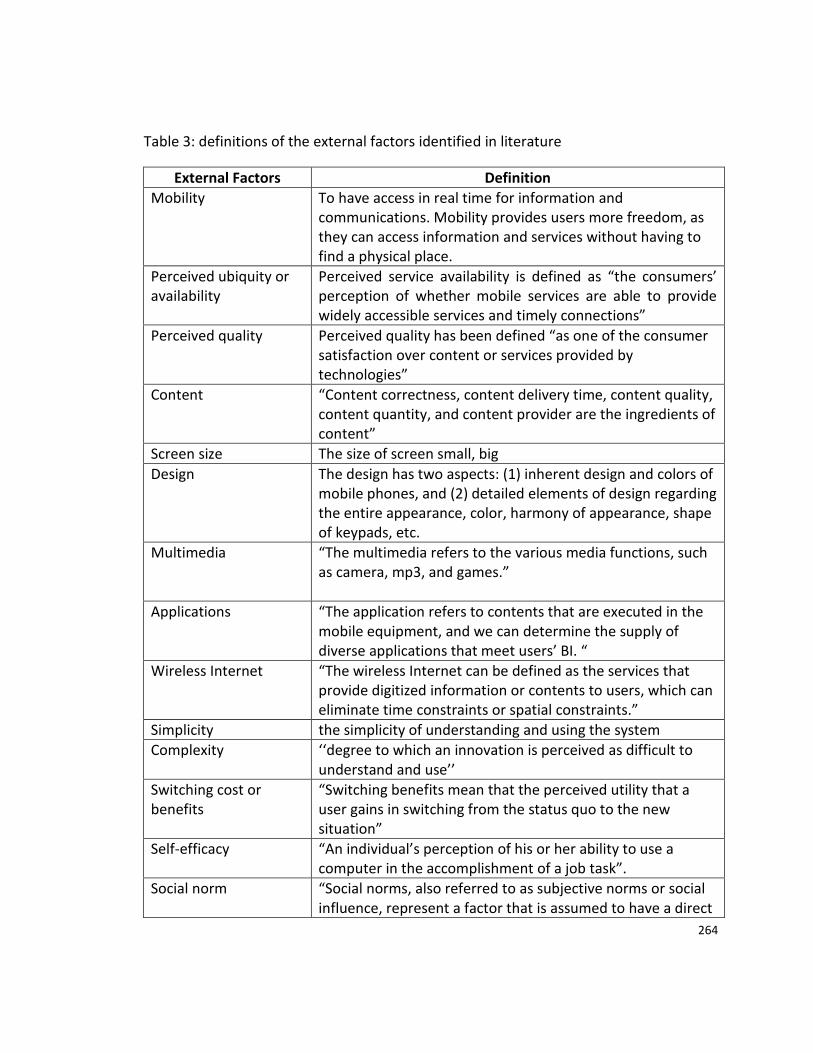
264
Table 3: definitions of the external factors identified in literature
External Factors Definition
Mobility To have access in real time for information and communications. Mobility provides users more freedom, as they can access information and services without having to find a physical place.
Perceived ubiquity or availability
Perceived service availability is defined as “the consumers’ perception of whether mobile services are able to provide widely accessible services and timely connections”
Perceived quality Perceived quality has been defined “as one of the consumer satisfaction over content or services provided by technologies”
Content “Content correctness, content delivery time, content quality, content quantity, and content provider are the ingredients of content”
Screen size The size of screen small, big
Design The design has two aspects: (1) inherent design and colors of mobile phones, and (2) detailed elements of design regarding the entire appearance, color, harmony of appearance, shape of keypads, etc.
Multimedia “The multimedia refers to the various media functions, such as camera, mp3, and games.”
Applications “The application refers to contents that are executed in the mobile equipment, and we can determine the supply of diverse applications that meet users’ BI. “
Wireless Internet “The wireless Internet can be defined as the services that provide digitized information or contents to users, which can eliminate time constraints or spatial constraints.”
Simplicity the simplicity of understanding and using the system
Complexity ‘‘degree to which an innovation is perceived as difficult to understand and use’’
Switching cost or benefits
“Switching benefits mean that the perceived utility that a user gains in switching from the status quo to the new situation”
Self-efficacy “An individual’s perception of his or her ability to use a computer in the accomplishment of a job task”.
Social norm “Social norms, also referred to as subjective norms or social influence, represent a factor that is assumed to have a direct
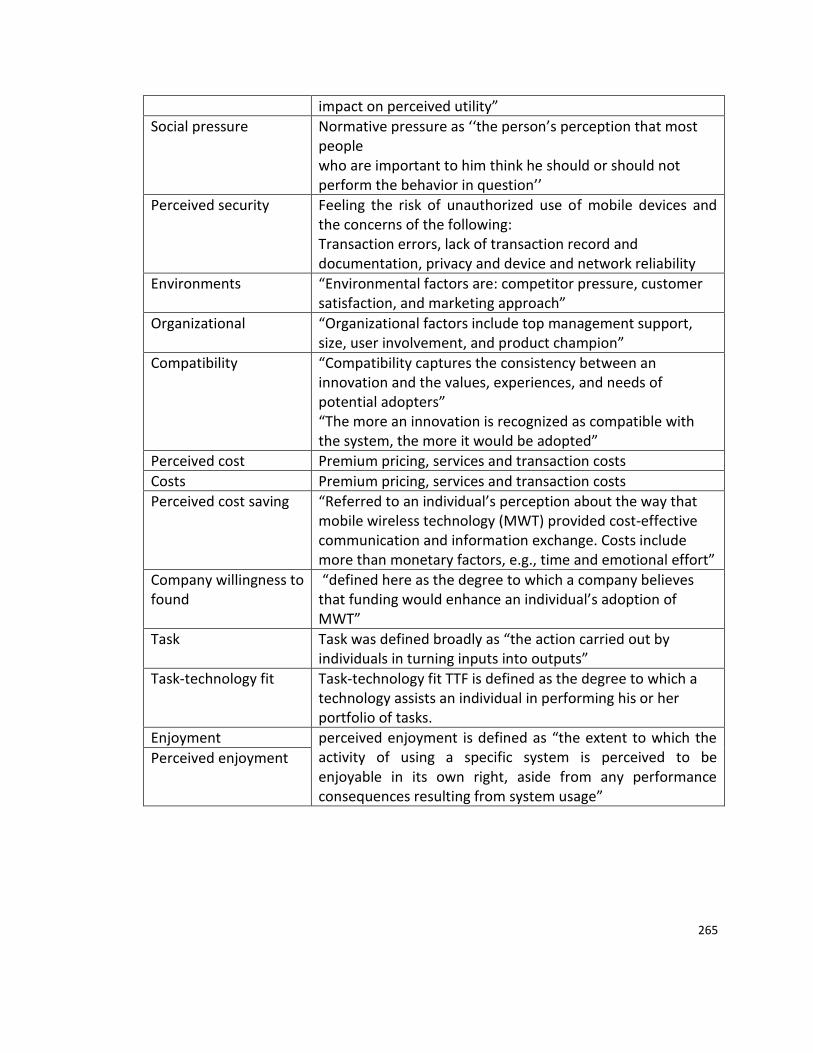
265
impact on perceived utility”
Social pressure Normative pressure as ‘‘the person’s perception that most people who are important to him think he should or should not perform the behavior in question’’
Perceived security Feeling the risk of unauthorized use of mobile devices and the concerns of the following: Transaction errors, lack of transaction record and documentation, privacy and device and network reliability
Environments “Environmental factors are: competitor pressure, customer satisfaction, and marketing approach”
Organizational “Organizational factors include top management support, size, user involvement, and product champion”
Compatibility “Compatibility captures the consistency between an innovation and the values, experiences, and needs of potential adopters” “The more an innovation is recognized as compatible with the system, the more it would be adopted”
Perceived cost Premium pricing, services and transaction costs
Costs Premium pricing, services and transaction costs
Perceived cost saving “Referred to an individual’s perception about the way that mobile wireless technology (MWT) provided cost-effective communication and information exchange. Costs include more than monetary factors, e.g., time and emotional effort”
Company willingness to found
“defined here as the degree to which a company believes that funding would enhance an individual’s adoption of MWT”
Task Task was defined broadly as “the action carried out by individuals in turning inputs into outputs”
Task-technology fit Task-technology fit TTF is defined as the degree to which a technology assists an individual in performing his or her portfolio of tasks.
Enjoyment perceived enjoyment is defined as “the extent to which the activity of using a specific system is perceived to be enjoyable in its own right, aside from any performance consequences resulting from system usage”
Perceived enjoyment
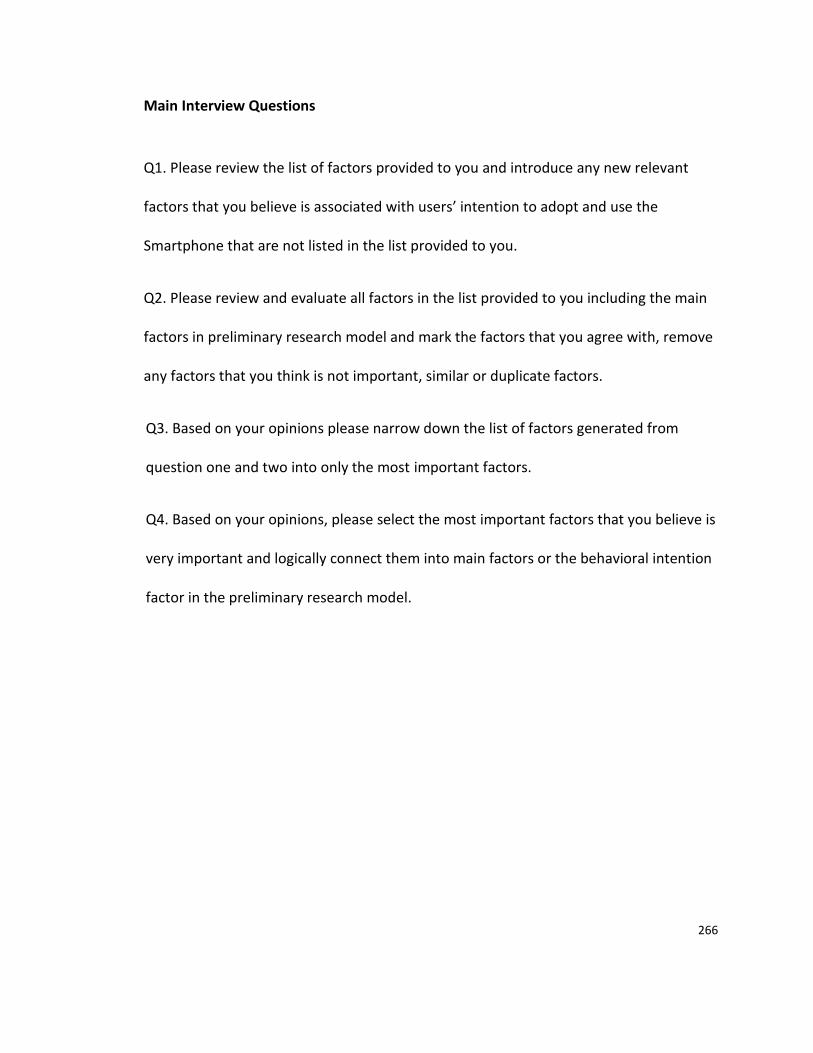
266
Main Interview Questions
Q1. Please review the list of factors provided to you and introduce any new relevant
factors that you believe is associated with users’ intention to adopt and use the
Smartphone that are not listed in the list provided to you.
Q2. Please review and evaluate all factors in the list provided to you including the main
factors in preliminary research model and mark the factors that you agree with, remove
any factors that you think is not important, similar or duplicate factors.
Q3. Based on your opinions please narrow down the list of factors generated from
question one and two into only the most important factors.
Q4. Based on your opinions, please select the most important factors that you believe is
very important and logically connect them into main factors or the behavioral intention
factor in the preliminary research model.
267
Appendix D: Consent Form
Consent form for participants in the Qualitative methods
The Portland State University
Consent to Participate in Research
“Exploring the Adoption and Use of the Smartphone Technology in Emerging Regions:
Case of Saudi Arabia”
You are being asked to participate in a research study that is being done by Tugrul
U. Daim, who is the principal investigator and the associate researcher Fahad Aldhaban,
from the department of Engineering and Technology Management at Portland State
University in Portland, Oregon. This research is studying the key factors that may
influence users’ adoption and use of the Smartphone technology. This research is being
conducted in partial fulfillment for the requirements for a doctoral degree in Technology
Management. You are being asked to participate in this research because are an
experienced user of the Smartphone or you have a work experience in industries related
to Smartphones technology. Your feedback will help the researcher to study and better
understand key factors that may influence users’ adoption and use of the Smartphone.
If you agree to participate, you will be given a list of adoption factors that were
derived from literature, which may have relationships with users’ adoption of the
Smartphone. You will be asked to participate in either an interview, brainstorming
session, or focus group session. You will be asked to review, evaluate, and select only the
factors that may be more important and can be added to the research model. Participation
in this research will take approximately 30 minutes of your time to complete. You will
participate in only one session.
Risks are minimal for participating in this research study. Data that contain
identifiers linked to the participants will be kept confidential at all times and will be
accessible to only the principal investigator and the co-principal investigator. All the data
obtained from participants will be kept confidential and will only be reported in the
aggregate format (reporting only combined results and never reporting individual results).
Before any presentation, sharing data outside of the research team or publication the
names and identifiers linked to the participants will be removed to insure anonymity.
Within three years after completing this research the investigator and the co-principal
Investigator will destroy or delete the collected information. Participants in the focus
group should know that, the investigator can only be responsible for the confidentiality of
the data collected by the researcher. Confidentiality may be breached by other
participants in the focus group. As a participant in the focus group, you are encouraged
not to speak of what is discussed during the group once the group has ended.
268
There is no direct benefit from participating in this research, but the research may
help to increase knowledge, which may help in improving service and production of
Smartphones. Your participation in this study is completely voluntary. You have the right
to choose not to participate or to withdraw your participation at any point in this study
without penalty or loss of benefits to which you are otherwise entitled.
If you have questions, concerns or complaints at any time about this research
study, you may contact the researcher Fahad Aldhaban, at 503-935-XXXX,
[email protected]. If you have questions regarding your rights as a research participant,
you may call the PSU Office for Research Integrity at (503) 725-2227 or 1(877) 480-
4400. The ORI is the office that supports the PSU Institutional Review Board (IRB). The
IRB is a group of people from PSU and the community who provide independent
oversight of safety and ethical issues related to research involving human participants.
For more information, you may also access the IRB website at
https://sites.google.com/a/pdx.edu/research/integrity.
You are making a decision whether to participate in this study. Your signature
below indicates that you have read the information provided. By signing this consent
form, you are not waiving any of your legal rights as a research participant. You have had
an opportunity to ask questions and all questions have been answered to your satisfaction.
By signing this consent form, you agree to participate in this study. A copy of this
consent form will be provided to you.
____________________________ ____________________________ ___________
Name of Adult Subject (print) Signature of Adult Subject Date
INVESTIGATOR SIGNATURE
This research study has been explained to the participant and all of his/her questions have
been answered. The participant understands the information described in this consent
form and freely consents to participate.
Fahad Aldhaban
___ _________________________________________ ___________________
(Name) (Signature) Date
269
Appendix E: An Example of the Validation Tool Developed to be Used by Experts.
Validation Tool
This research aims to explore the key factors that influence users to adopt and
use Smartphone technology: Case of Saudi Arabia. A research model and hypotheses
have been developed based on a literature review conducted on related previous
research and theoretical models. The research model is based on Unified Theory of
Acceptance and Use of Technology (UTAUT) model and it has been modified and
validated using a number of qualitative methods, namely a brainstorming session, a
focus group session, and individual face-to-face interviews. In order to test the
hypothesized relationship among factors/variables in the research model shown in
figure 1, a survey questionnaire has been developed to collect data. For each
factor/variable in this research model a number of items/questions have been
developed to measure the relationships among each factor/variable as shown in figure 1
and 2. In order to collect data from smartphone users, a research instrument has been
developed using a survey questionnaire. The questions in the survey have been adopted
from survey instruments that have been developed and validated in previous related
research. Also, the survey questions have been modified using read aloud method and
tested in a pilot test administrated to a group of PhD. students at the department of
ETM. This tool is developed to obtain your judgment on the degree of relevance of each
item or question to the factor/variable that it is intended to measure, as well as to
obtain your judgment on how easy is it for smartphone users to answer each
question/item. Please provide your judgments and comments in table 1 below.
For more information about the research factors/variables please see their definitions in
table 2 below. If you have any questions or need more information, please contact me
Please provide your judgments in the table below using the following two questions and
their possible answers:
Question 1 (Relevance): In your judgment, how closely dose each
item/question’s text represent the intention of that item/question?
- Answer range from 1 to 5: 1- Not Very Closely, 2- Somewhat Not Closely, 3-
Neutral, 4- Somewhat Closely, 5- Very Closely.
Question 2 (Ease of answering the question): In your judgment, how easy is it
for a smartphone user to answer the each question?
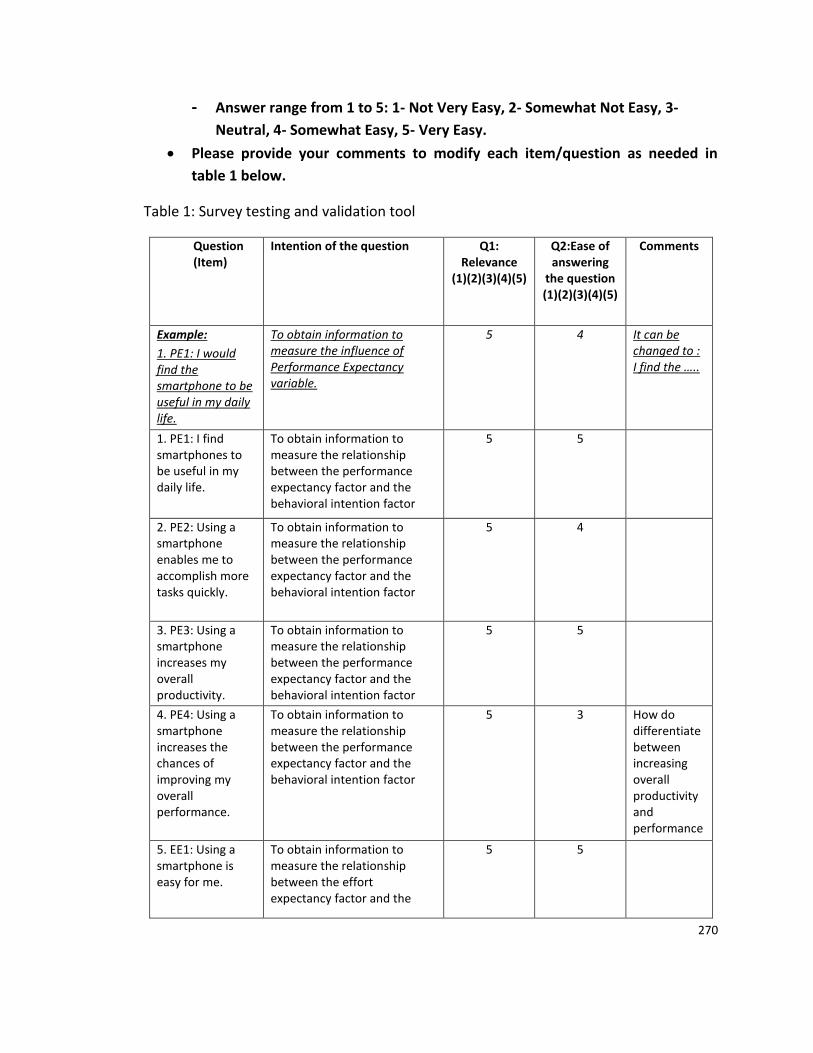
270
- Answer range from 1 to 5: 1- Not Very Easy, 2- Somewhat Not Easy, 3-
Neutral, 4- Somewhat Easy, 5- Very Easy.
Please provide your comments to modify each item/question as needed in
table 1 below.
Table 1: Survey testing and validation tool
Question (Item)
Intention of the question Q1: Relevance
(1)(2)(3)(4)(5)
Q2:Ease of answering
the question (1)(2)(3)(4)(5)
Comments
Example:
1. PE1: I would find the smartphone to be useful in my daily life.
To obtain information to measure the influence of Performance Expectancy variable.
5 4 It can be changed to : I find the …..
1. PE1: I find smartphones to be useful in my daily life.
To obtain information to measure the relationship between the performance expectancy factor and the behavioral intention factor
5 5
2. PE2: Using a smartphone enables me to accomplish more tasks quickly.
To obtain information to measure the relationship between the performance expectancy factor and the behavioral intention factor
5 4
3. PE3: Using a smartphone increases my overall productivity.
To obtain information to measure the relationship between the performance expectancy factor and the behavioral intention factor
5 5
4. PE4: Using a smartphone increases the chances of improving my overall performance.
To obtain information to measure the relationship between the performance expectancy factor and the behavioral intention factor
5 3 How do differentiate between increasing overall productivity and performance
5. EE1: Using a smartphone is easy for me.
To obtain information to measure the relationship between the effort expectancy factor and the
5 5
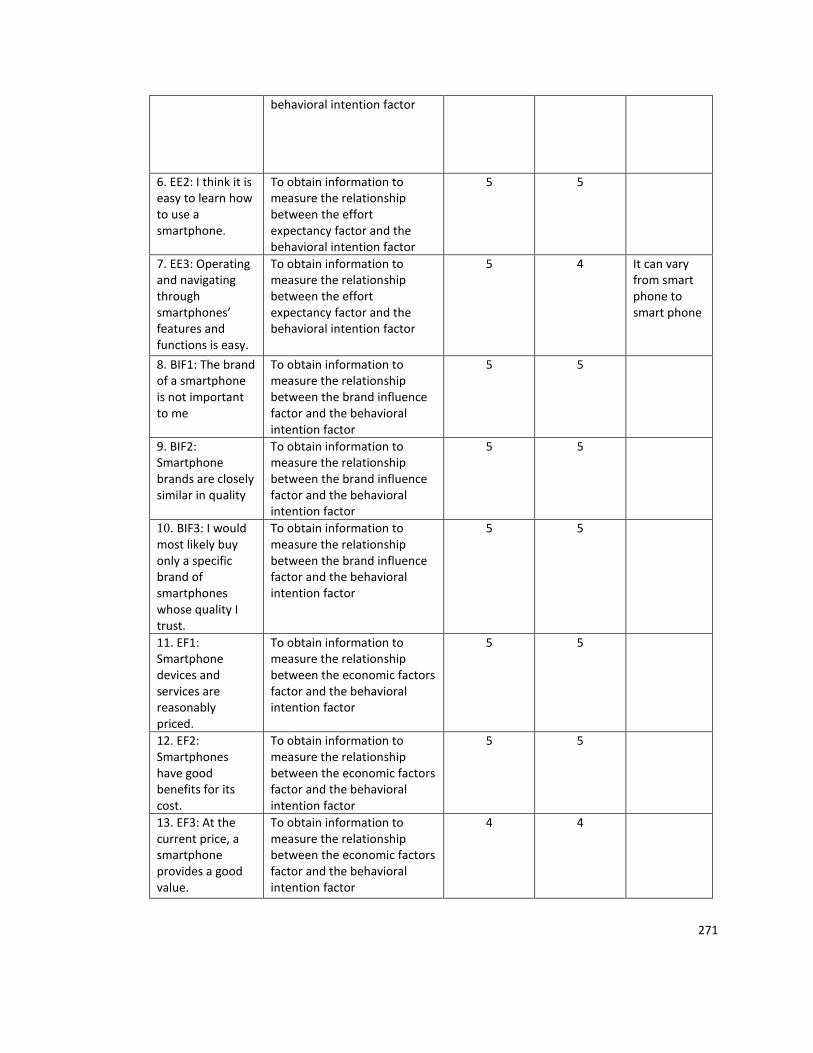
271
behavioral intention factor
6. EE2: I think it is easy to learn how to use a smartphone.
To obtain information to measure the relationship between the effort expectancy factor and the behavioral intention factor
5 5
7. EE3: Operating and navigating through smartphones’ features and functions is easy.
To obtain information to measure the relationship between the effort expectancy factor and the behavioral intention factor
5 4 It can vary from smart phone to smart phone
8. BIF1: The brand of a smartphone is not important to me
To obtain information to measure the relationship between the brand influence factor and the behavioral intention factor
5 5
9. BIF2: Smartphone brands are closely similar in quality
To obtain information to measure the relationship between the brand influence factor and the behavioral intention factor
5 5
10. BIF3: I would most likely buy only a specific brand of smartphones whose quality I trust.
To obtain information to measure the relationship between the brand influence factor and the behavioral intention factor
5 5
11. EF1: Smartphone devices and services are reasonably priced.
To obtain information to measure the relationship between the economic factors factor and the behavioral intention factor
5 5
12. EF2: Smartphones have good benefits for its cost.
To obtain information to measure the relationship between the economic factors factor and the behavioral intention factor
5 5
13. EF3: At the current price, a smartphone provides a good value.
To obtain information to measure the relationship between the economic factors factor and the behavioral intention factor
4 4
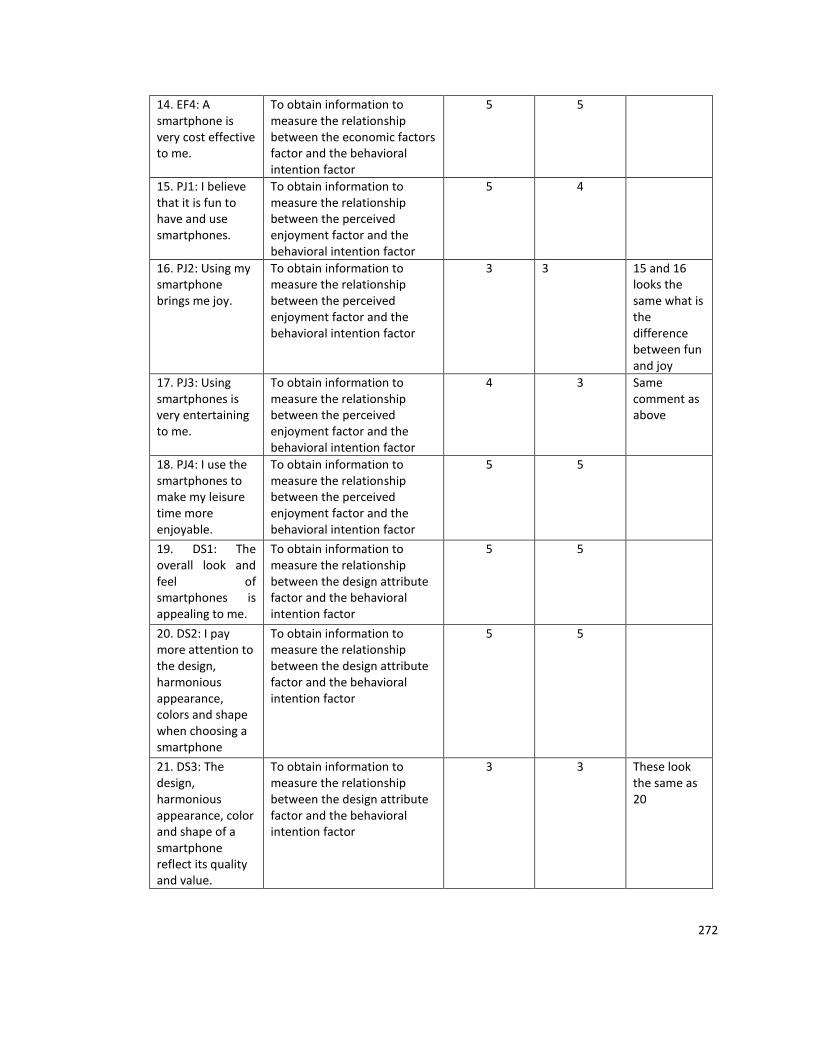
272
14. EF4: A smartphone is very cost effective to me.
To obtain information to measure the relationship between the economic factors factor and the behavioral intention factor
5 5
15. PJ1: I believe that it is fun to have and use smartphones.
To obtain information to measure the relationship between the perceived enjoyment factor and the behavioral intention factor
5 4
16. PJ2: Using my smartphone brings me joy.
To obtain information to measure the relationship between the perceived enjoyment factor and the behavioral intention factor
3 3 15 and 16 looks the same what is the difference between fun and joy
17. PJ3: Using smartphones is very entertaining to me.
To obtain information to measure the relationship between the perceived enjoyment factor and the behavioral intention factor
4 3 Same comment as above
18. PJ4: I use the smartphones to make my leisure time more enjoyable.
To obtain information to measure the relationship between the perceived enjoyment factor and the behavioral intention factor
5 5
19. DS1: The overall look and feel of smartphones is appealing to me.
To obtain information to measure the relationship between the design attribute factor and the behavioral intention factor
5 5
20. DS2: I pay more attention to the design, harmonious appearance, colors and shape when choosing a smartphone
To obtain information to measure the relationship between the design attribute factor and the behavioral intention factor
5 5
21. DS3: The design, harmonious appearance, color and shape of a smartphone reflect its quality and value.
To obtain information to measure the relationship between the design attribute factor and the behavioral intention factor
3 3 These look the same as 20
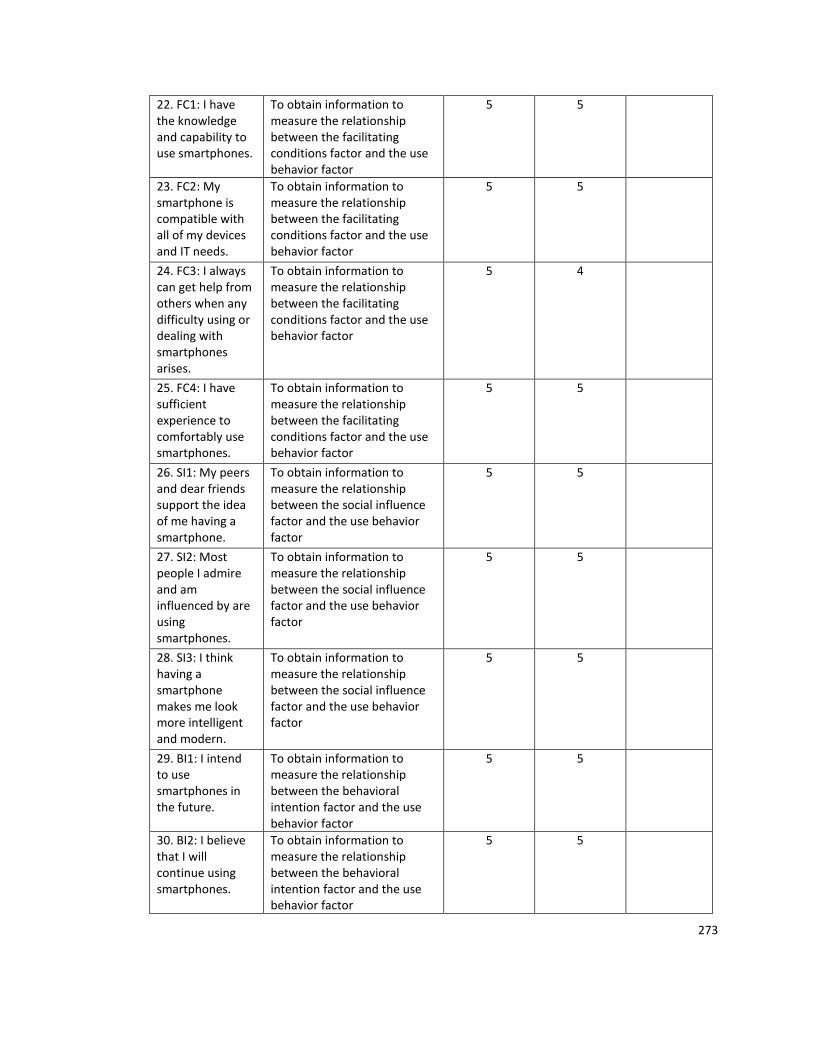
273
22. FC1: I have the knowledge and capability to use smartphones.
To obtain information to measure the relationship between the facilitating conditions factor and the use behavior factor
5 5
23. FC2: My smartphone is compatible with all of my devices and IT needs.
To obtain information to measure the relationship between the facilitating conditions factor and the use behavior factor
5 5
24. FC3: I always can get help from others when any difficulty using or dealing with smartphones arises.
To obtain information to measure the relationship between the facilitating conditions factor and the use behavior factor
5 4
25. FC4: I have sufficient experience to comfortably use smartphones.
To obtain information to measure the relationship between the facilitating conditions factor and the use behavior factor
5 5
26. SI1: My peers and dear friends support the idea of me having a smartphone.
To obtain information to measure the relationship between the social influence factor and the use behavior factor
5 5
27. SI2: Most people I admire and am influenced by are using smartphones.
To obtain information to measure the relationship between the social influence factor and the use behavior factor
5 5
28. SI3: I think having a smartphone makes me look more intelligent and modern.
To obtain information to measure the relationship between the social influence factor and the use behavior factor
5 5
29. BI1: I intend to use smartphones in the future.
To obtain information to measure the relationship between the behavioral intention factor and the use behavior factor
5 5
30. BI2: I believe that I will continue using smartphones.
To obtain information to measure the relationship between the behavioral intention factor and the use behavior factor
5 5
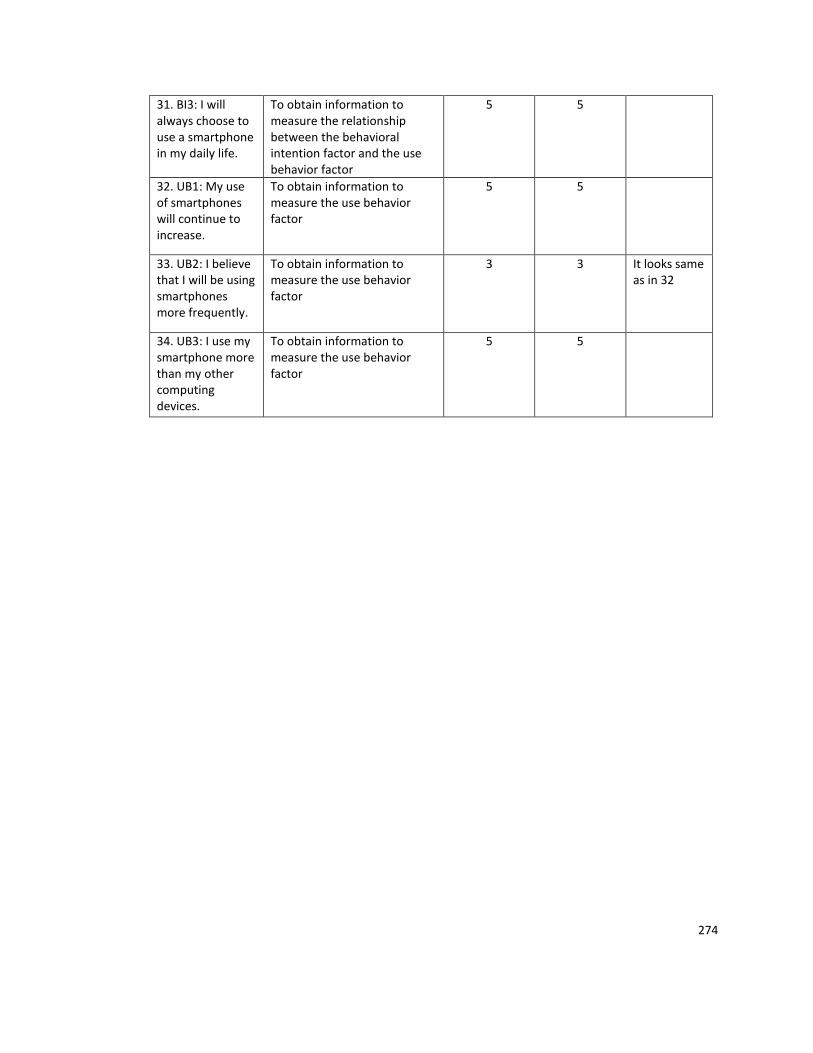
274
31. BI3: I will always choose to use a smartphone in my daily life.
To obtain information to measure the relationship between the behavioral intention factor and the use behavior factor
5 5
32. UB1: My use of smartphones will continue to increase.
To obtain information to measure the use behavior factor
5 5
33. UB2: I believe that I will be using smartphones more frequently.
To obtain information to measure the use behavior factor
3 3 It looks same as in 32
34. UB3: I use my smartphone more than my other computing devices.
To obtain information to measure the use behavior factor
5 5
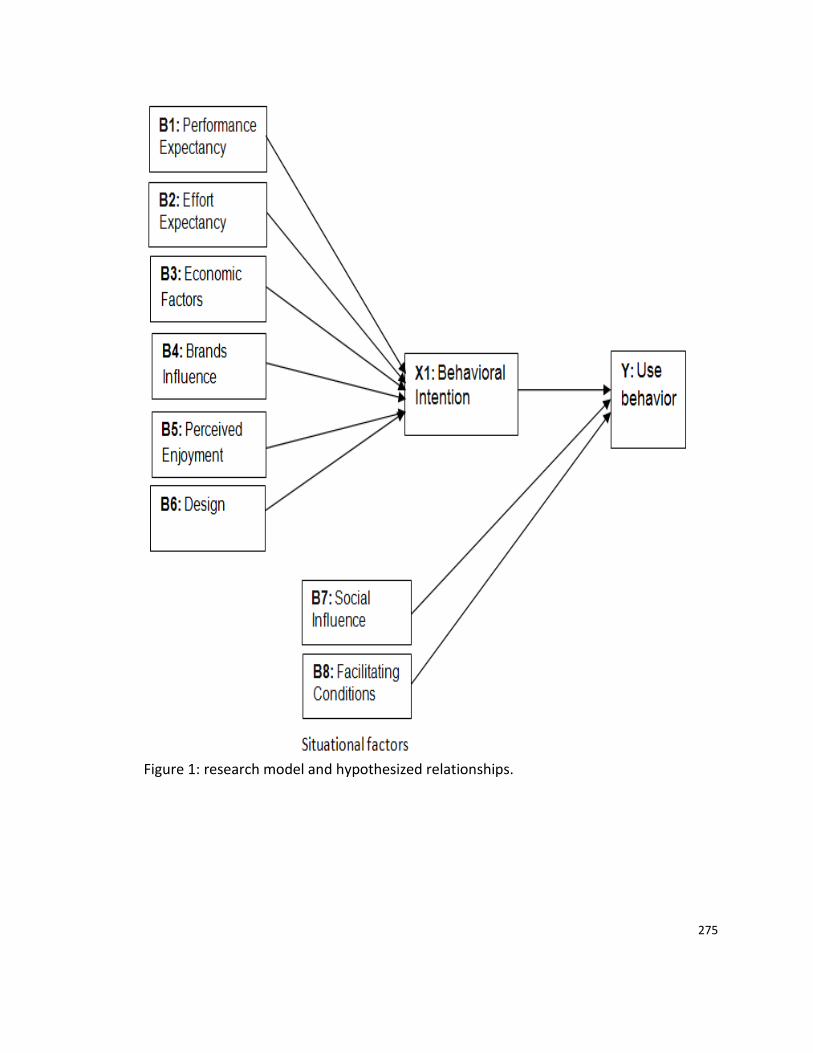
275
Figure 1: research model and hypothesized relationships.
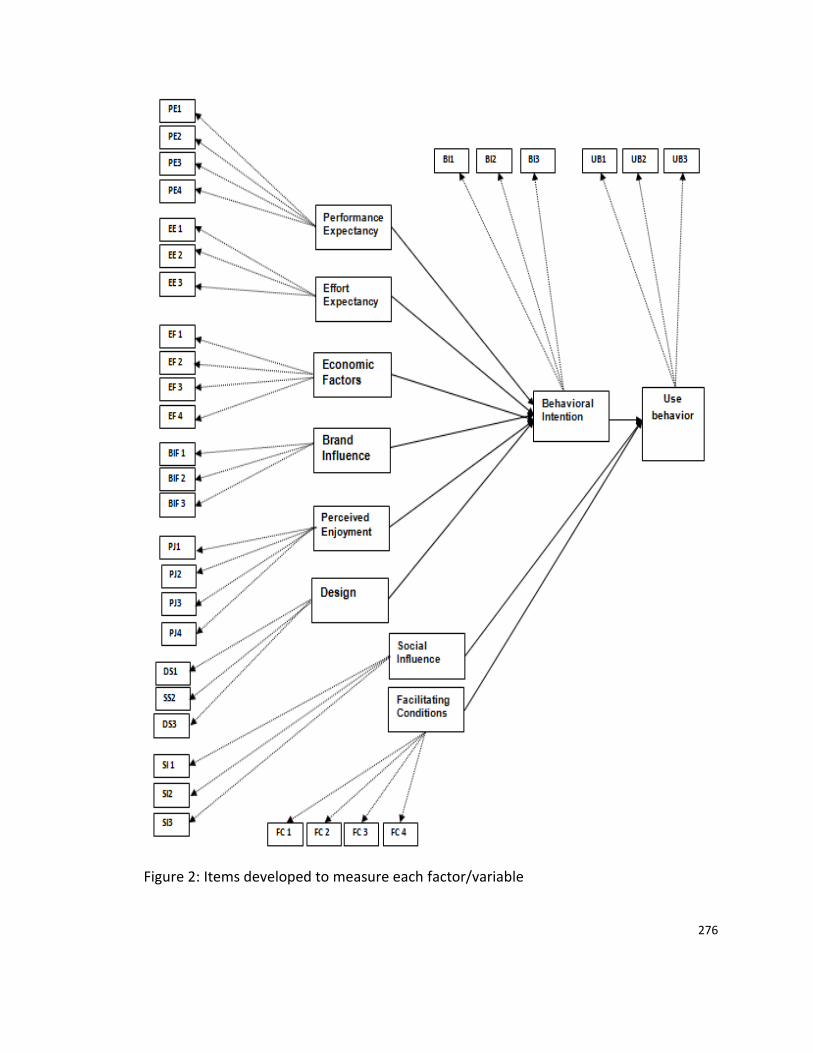
276
Figure 2: Items developed to measure each factor/variable
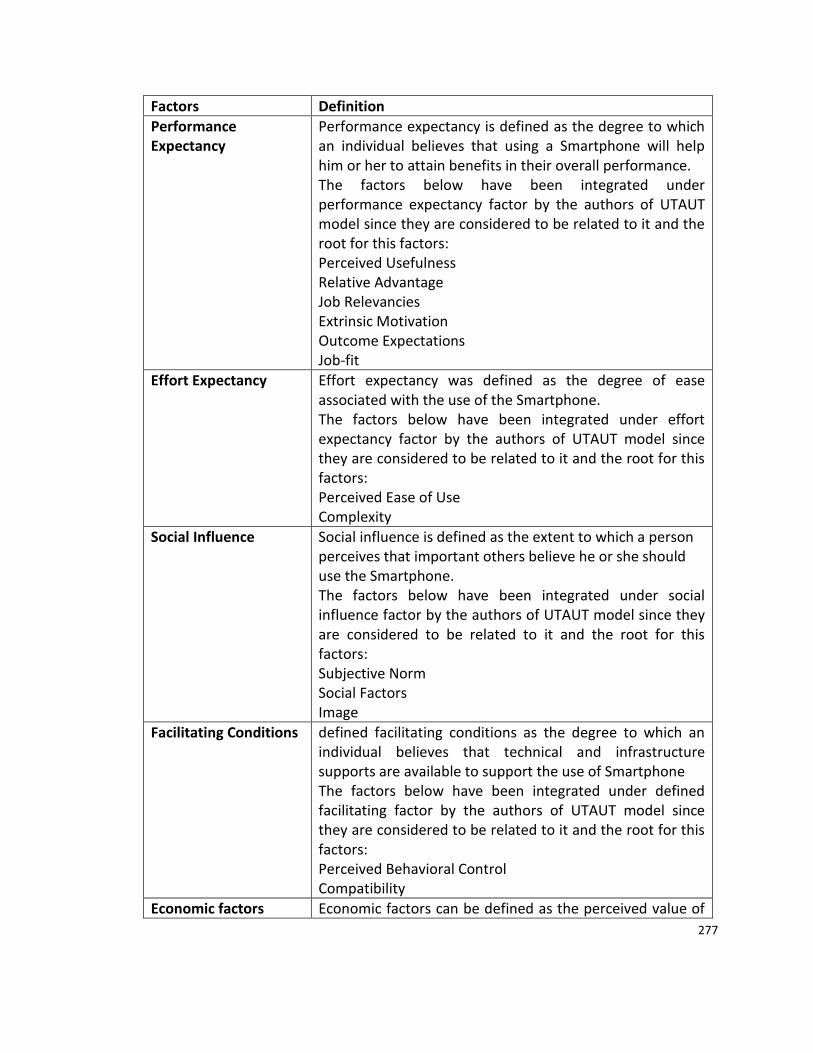
277
Factors Definition
Performance Expectancy
Performance expectancy is defined as the degree to which an individual believes that using a Smartphone will help him or her to attain benefits in their overall performance. The factors below have been integrated under performance expectancy factor by the authors of UTAUT model since they are considered to be related to it and the root for this factors: Perceived Usefulness Relative Advantage Job Relevancies Extrinsic Motivation Outcome Expectations Job-fit
Effort Expectancy Effort expectancy was defined as the degree of ease associated with the use of the Smartphone. The factors below have been integrated under effort expectancy factor by the authors of UTAUT model since they are considered to be related to it and the root for this factors: Perceived Ease of Use Complexity
Social Influence Social influence is defined as the extent to which a person perceives that important others believe he or she should use the Smartphone. The factors below have been integrated under social influence factor by the authors of UTAUT model since they are considered to be related to it and the root for this factors: Subjective Norm Social Factors Image
Facilitating Conditions defined facilitating conditions as the degree to which an individual believes that technical and infrastructure supports are available to support the use of Smartphone The factors below have been integrated under defined facilitating factor by the authors of UTAUT model since they are considered to be related to it and the root for this factors: Perceived Behavioral Control Compatibility
Economic factors Economic factors can be defined as the perceived value of
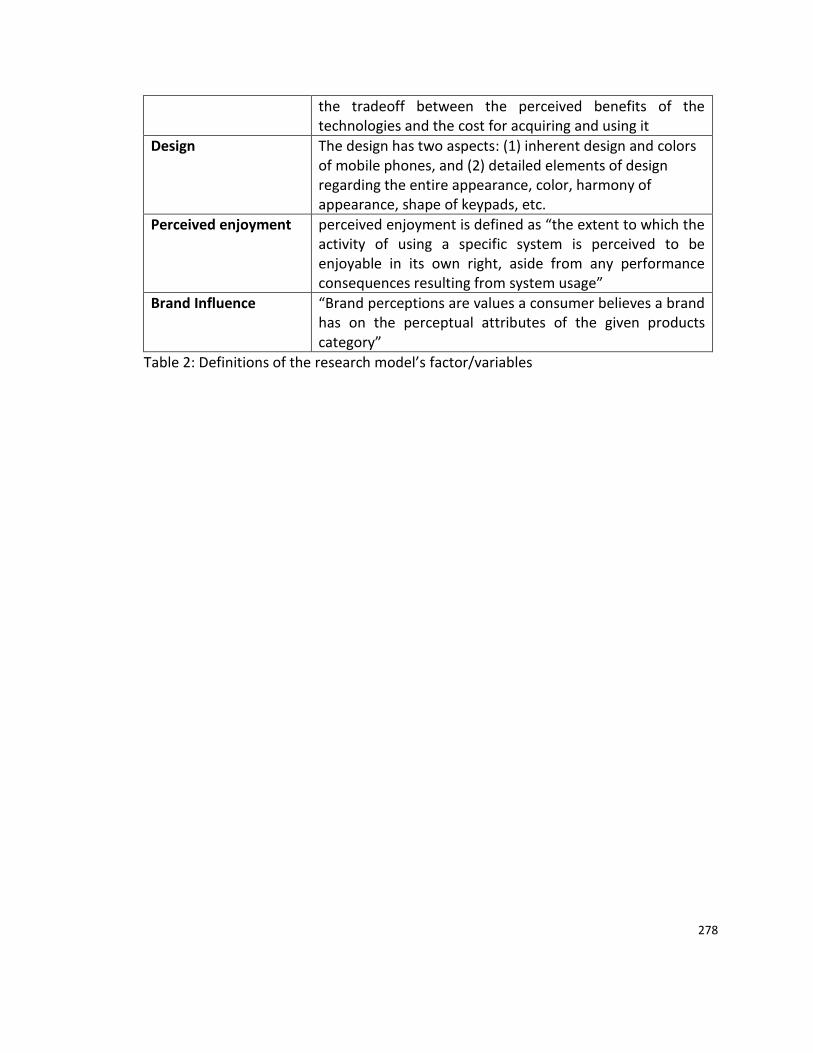
278
the tradeoff between the perceived benefits of the technologies and the cost for acquiring and using it
Design The design has two aspects: (1) inherent design and colors of mobile phones, and (2) detailed elements of design regarding the entire appearance, color, harmony of appearance, shape of keypads, etc.
Perceived enjoyment perceived enjoyment is defined as “the extent to which the activity of using a specific system is perceived to be enjoyable in its own right, aside from any performance consequences resulting from system usage”
Brand Influence “Brand perceptions are values a consumer believes a brand has on the perceptual attributes of the given products category”
Table 2: Definitions of the research model’s factor/variables
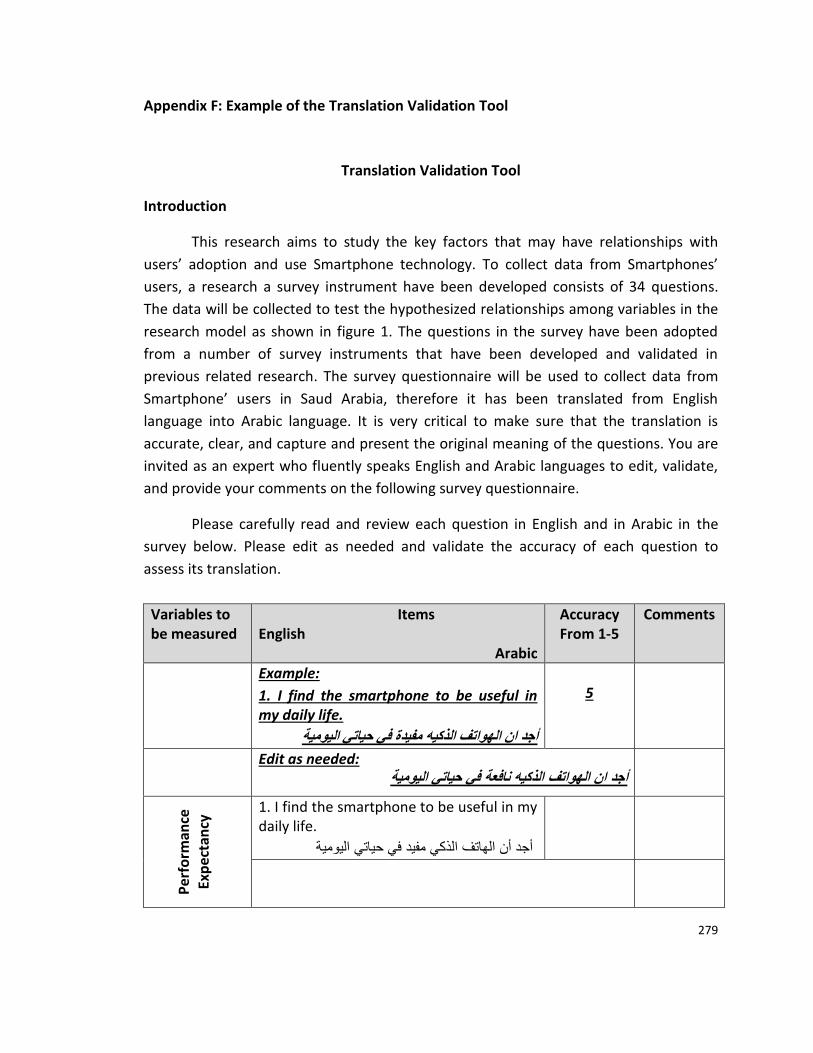
279
Appendix F: Example of the Translation Validation Tool
Translation Validation Tool
Introduction
This research aims to study the key factors that may have relationships with
users’ adoption and use Smartphone technology. To collect data from Smartphones’
users, a research a survey instrument have been developed consists of 34 questions.
The data will be collected to test the hypothesized relationships among variables in the
research model as shown in figure 1. The questions in the survey have been adopted
from a number of survey instruments that have been developed and validated in
previous related research. The survey questionnaire will be used to collect data from
Smartphone’ users in Saud Arabia, therefore it has been translated from English
language into Arabic language. It is very critical to make sure that the translation is
accurate, clear, and capture and present the original meaning of the questions. You are
invited as an expert who fluently speaks English and Arabic languages to edit, validate,
and provide your comments on the following survey questionnaire.
Please carefully read and review each question in English and in Arabic in the
survey below. Please edit as needed and validate the accuracy of each question to
assess its translation.
Variables to be measured
Items English
Arabic
Accuracy From 1-5
Comments
Example:
1. I find the smartphone to be useful in my daily life.
أجد ان الهواتف الذكيه مفيدة في حياتي اليومية
5
Edit as needed: أجد ان الهواتف الذكيه نافعة في حياتي اليومية
Per
form
ance
Ex
pec
tan
cy 1. I find the smartphone to be useful in my
daily life.
أجد أن الهاتف الذكي مفيد في حياتي اليومية
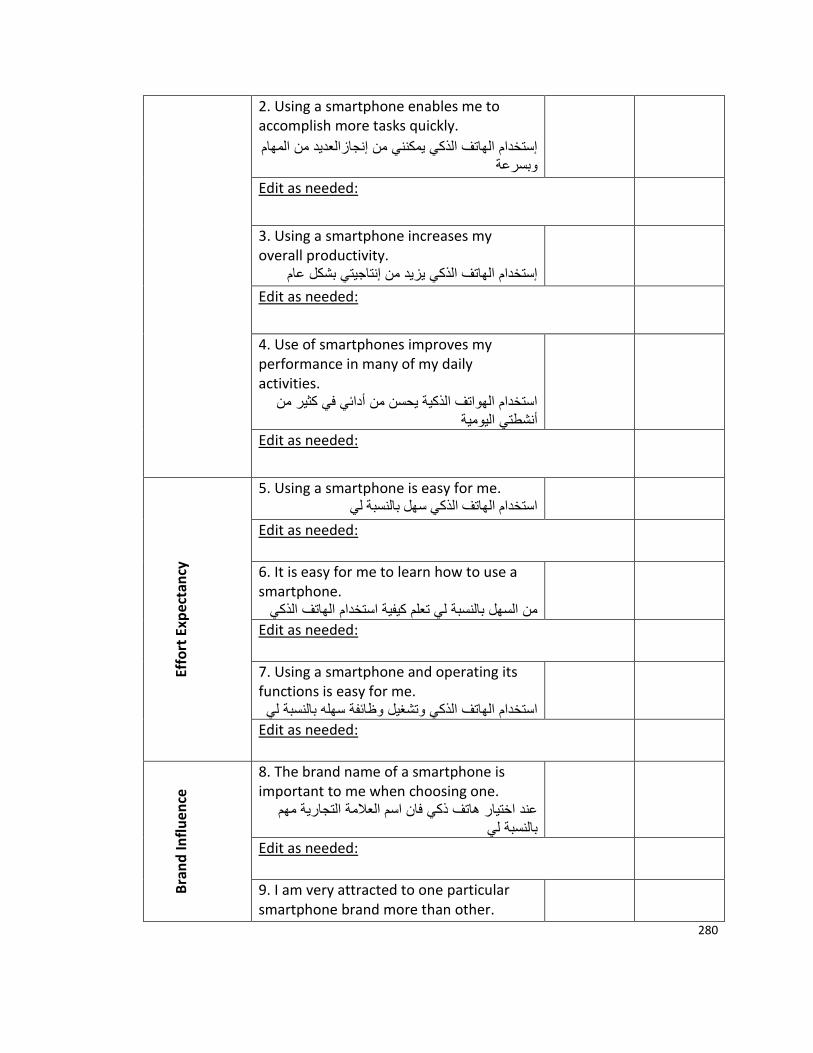
280
2. Using a smartphone enables me to accomplish more tasks quickly.
لمهام إستخدام الهاتف الذكي يمكنني من إنجازالعديد من ا وبسرعة
Edit as needed:
3. Using a smartphone increases my overall productivity.
كل عامإستخدام الهاتف الذكي يزيد من إنتاجيتي بش
Edit as needed:
4. Use of smartphones improves my performance in many of my daily activities.
من استخدام الهواتف الذكية يحسن من أدائي في كثير أنشطتي اليومية
Edit as needed:
Ef
fort
Exp
ecta
ncy
5. Using a smartphone is easy for me. سهل بالنسبة لياستخدام الهاتف الذكي
Edit as needed:
6. It is easy for me to learn how to use a smartphone.
ف الذكيمن السهل بالنسبة لي تعلم كيفية استخدام الهات
Edit as needed:
7. Using a smartphone and operating its functions is easy for me.
نسبة ليي وتشغيل وظائفة سهله بالاستخدام الهاتف الذك
Edit as needed:
B
ran
d In
flu
ence
8. The brand name of a smartphone is important to me when choosing one.
عند اختيار هاتف ذكي فان اسم العلامة التجارية مهم بالنسبة لي
Edit as needed:
9. I am very attracted to one particular smartphone brand more than other.
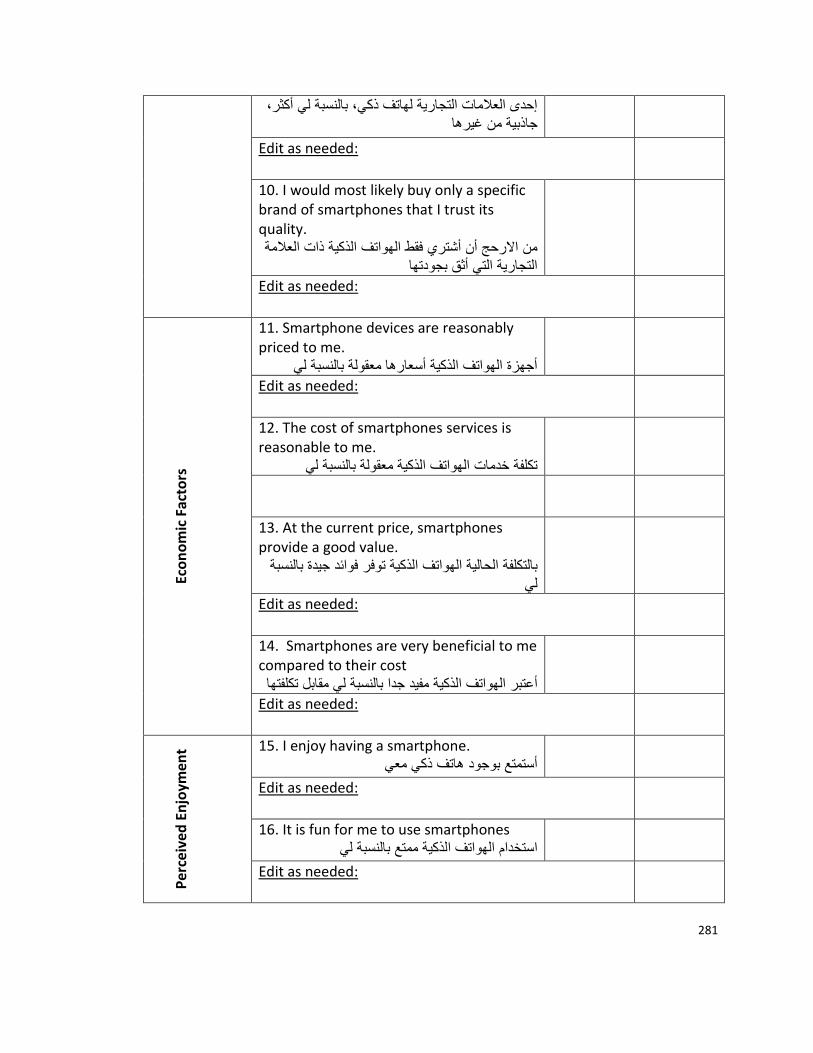
281
كثر، إحدى العلامات التجارية لهاتف ذكي، بالنسبة لي أ جاذبية من غيرها
Edit as needed:
10. I would most likely buy only a specific brand of smartphones that I trust its quality.
مة ف الذكية ذات العلامن الارحج أن أشتري فقط الهوات التجارية التي أثق بجودتها
Edit as needed:
Ec
on
om
ic F
acto
rs
11. Smartphone devices are reasonably priced to me.
أجهزة الهواتف الذكية أسعارها معقولة بالنسبة لي
Edit as needed:
12. The cost of smartphones services is reasonable to me.
تكلفة خدمات الهواتف الذكية معقولة بالنسبة لي
13. At the current price, smartphones provide a good value.
يدة بالنسبة وفر فوائد جالهواتف الذكية تبالتكلفة الحالية لي
Edit as needed:
14. Smartphones are very beneficial to me compared to their cost
هال تكلفتمفيد جدا بالنسبة لي مقابالهواتف الذكية أعتبر
Edit as needed:
P
erce
ived
En
joym
ent
15. I enjoy having a smartphone. أستمتع بوجود هاتف ذكي معي
Edit as needed:
16. It is fun for me to use smartphones لذكية ممتع بالنسبة لياستخدام الهواتف ا
Edit as needed:
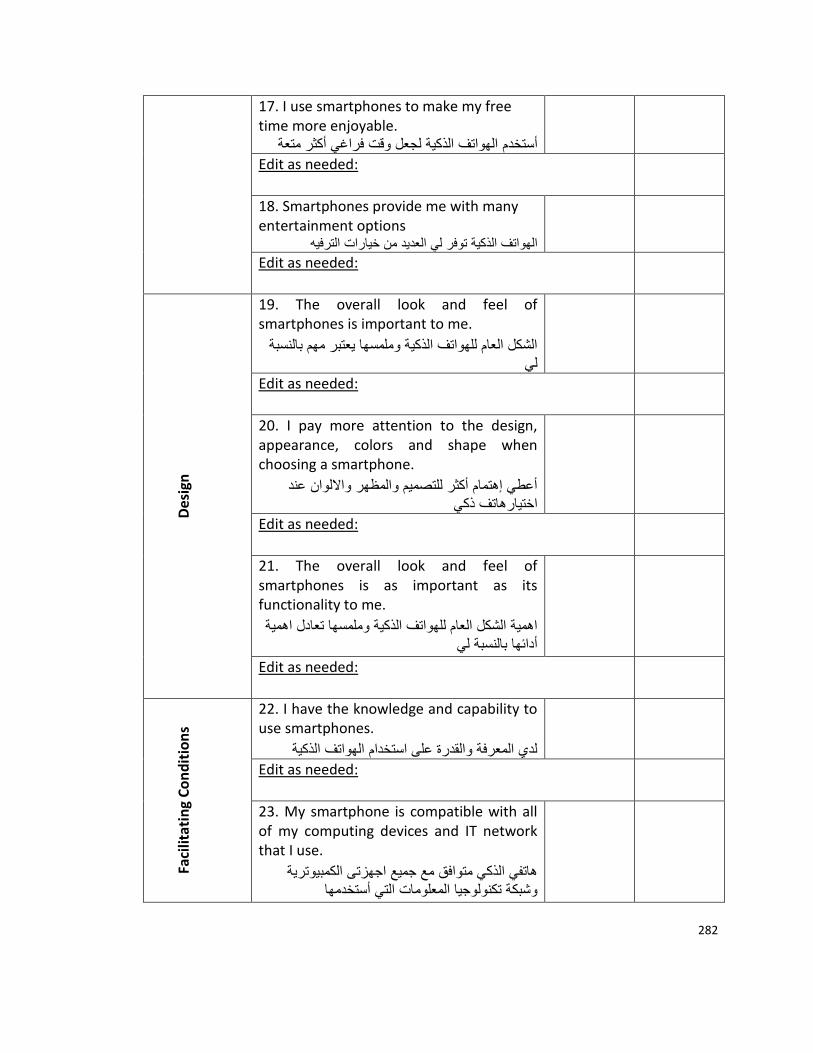
282
17. I use smartphones to make my free time more enjoyable.
عةالهواتف الذكية لجعل وقت فراغي أكثر مت أستخدم
Edit as needed:
18. Smartphones provide me with many entertainment options
العديد من خيارات الترفيهالهواتف الذكية توفر لي
Edit as needed:
Des
ign
19. The overall look and feel of smartphones is important to me.
النسبة الشكل العام للهواتف الذكية وملمسها يعتبر مهم ب لي
Edit as needed:
20. I pay more attention to the design, appearance, colors and shape when choosing a smartphone.
عند أعطي إهتمام أكثر للتصميم والمظهر والالوان اختيارهاتف ذكي
Edit as needed:
21. The overall look and feel of smartphones is as important as its functionality to me.
مية تعادل اهاهمية الشكل العام للهواتف الذكية وملمسها أدائها بالنسبة لي
Edit as needed:
Faci
litat
ing
Co
nd
itio
ns
22. I have the knowledge and capability to use smartphones.
لدي المعرفة والقدرة على استخدام الهواتف الذكية
Edit as needed:
23. My smartphone is compatible with all of my computing devices and IT network that I use.
ية هاتفي الذكي متوافق مع جميع اجهزتى الكمبيوتر وشبكة تكنولوجيا المعلومات التي أستخدمها
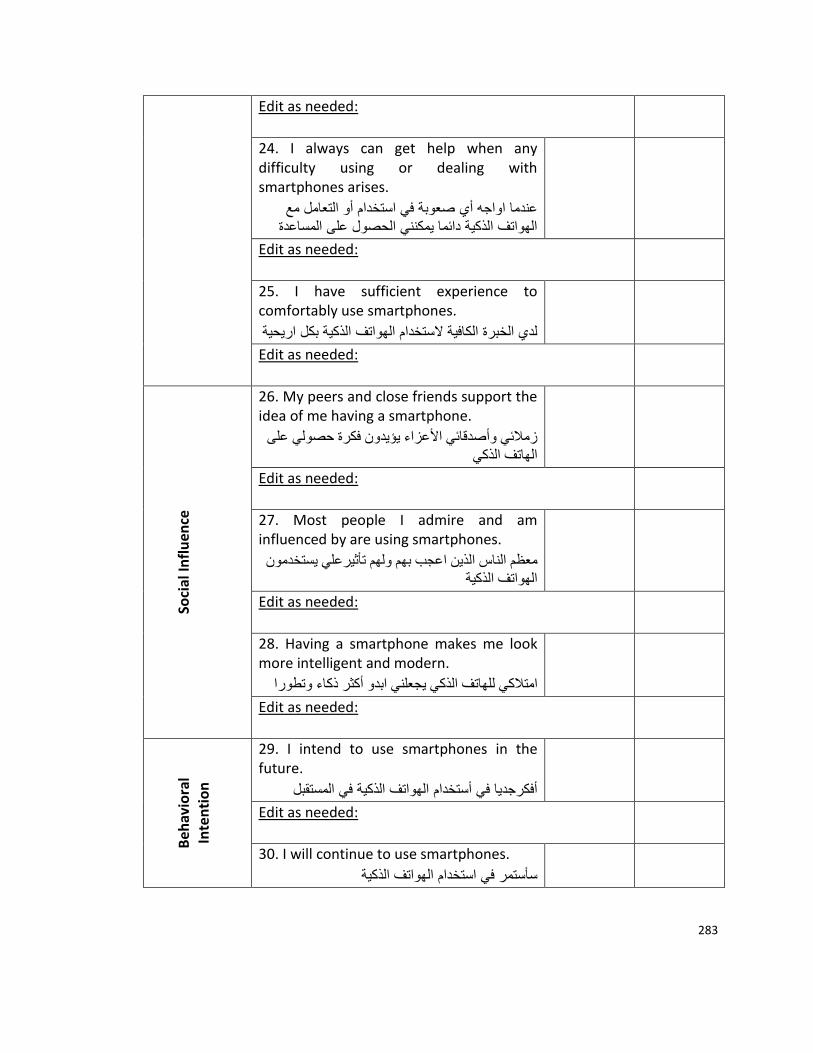
283
Edit as needed:
24. I always can get help when any difficulty using or dealing with smartphones arises.
صعوبة في استخدام أو التعامل مع عندما اواجه أيدةالهواتف الذكية دائما يمكنني الحصول على المساع
Edit as needed:
25. I have sufficient experience to comfortably use smartphones.
ل اريحيةلدي الخبرة الكافية لاستخدام الهواتف الذكية بك
Edit as needed:
Soci
al In
flu
ence
26. My peers and close friends support the idea of me having a smartphone.
لى زملائي وأصدقائي الأعزاء يؤيدون فكرة حصولي ع
الهاتف الذكي
Edit as needed:
27. Most people I admire and am influenced by are using smartphones.
دمون يستخ عليم ولهم تأثيرمعظم الناس الذين اعجب به
الهواتف الذكية
Edit as needed:
28. Having a smartphone makes me look more intelligent and modern.
طوراتلهاتف الذكي يجعلني ابدو أكثر ذكاء ول يامتلاك
Edit as needed:
Beh
avio
ral
Inte
nti
on
29. I intend to use smartphones in the future.
قبلالهواتف الذكية في المستأفكرجديا في أستخدام
Edit as needed:
30. I will continue to use smartphones.
سأستمر في استخدام الهواتف الذكية
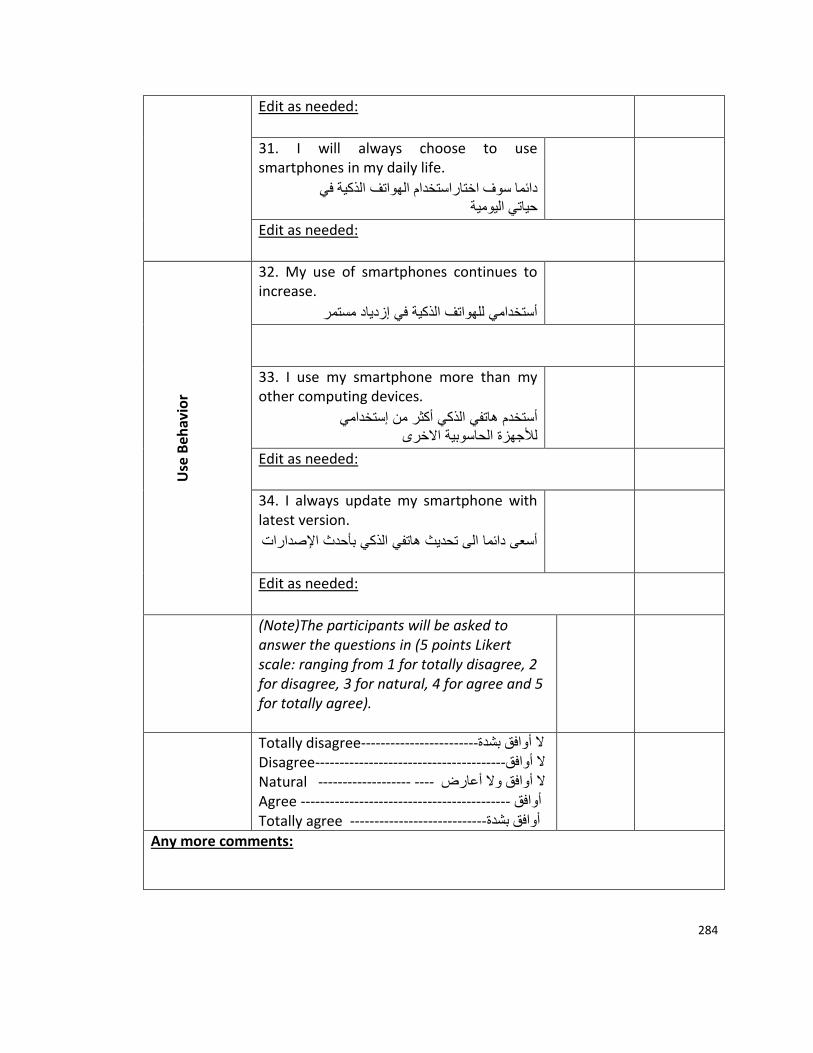
284
Edit as needed:
31. I will always choose to use smartphones in my daily life.
ي ف الهواتف الذكيةتاراستخدام دائما سوف اخ
حياتي اليومية
Edit as needed:
Use
Beh
avio
r
32. My use of smartphones continues to increase.
مرأستخدامي للهواتف الذكية في إزدياد مست
33. I use my smartphone more than my other computing devices.
أكثر من إستخدامي أستخدم هاتفي الذكي للأجهزة الحاسوبية الاخرى
Edit as needed:
34. I always update my smartphone with latest version.
ارات أسعى دائما الى تحديث هاتفي الذكي بأحدث الإصد
Edit as needed:
(Note)The participants will be asked to answer the questions in (5 points Likert scale: ranging from 1 for totally disagree, 2 for disagree, 3 for natural, 4 for agree and 5 for totally agree).
Totally disagree------------------------لا أوافق بشدة Disagree---------------------------------------لا أوافق Natural ------------------- ---- لا أوافق ولا أعارض Agree ------------------------------------------- أوافق Totally agree ----------------------------أوافق بشدة
Any more comments:
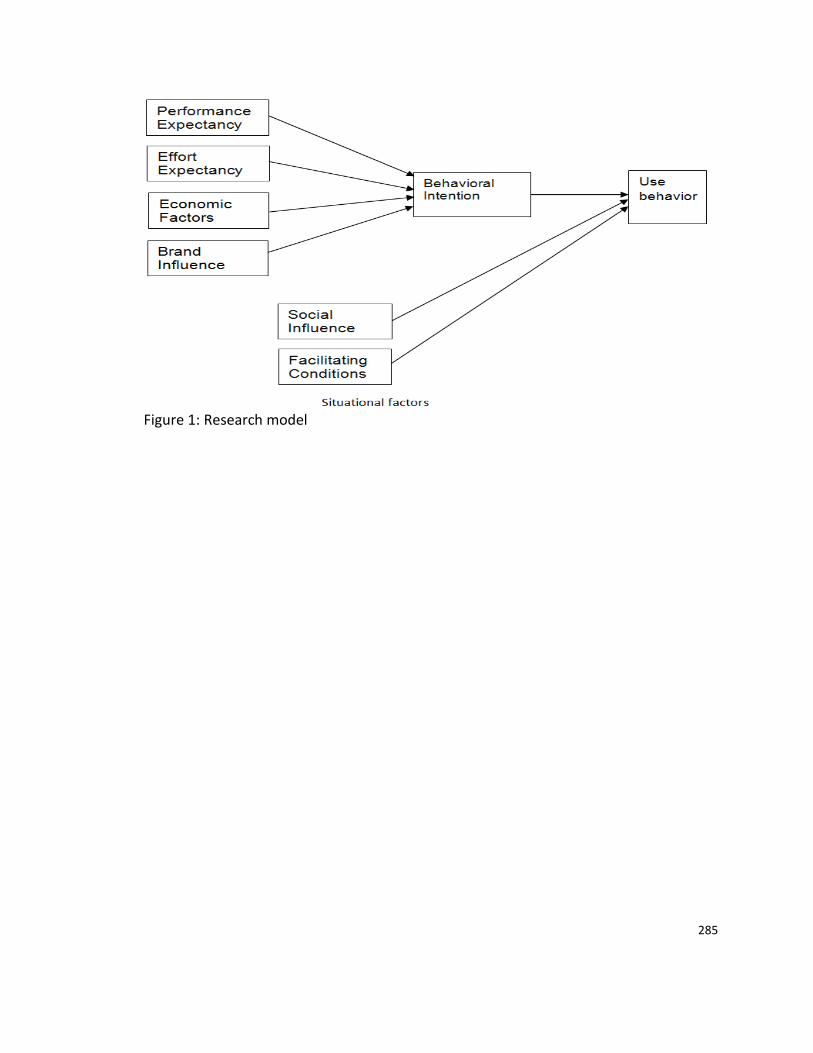
285
Figure 1: Research model

286
Appendix G: Email Invitation Sent to Invite Participants to Participate in the Survey
اتف الذكيةسريع عن الهو اكاديمى يحتاج مساعدتك بالتكرم بالمشاركة في استبيان دكتوراه طالب
بسم الله الرحمن الرحيم
الاعزاء مستخدمو الهاتف الذكيوالاخوات الاخوة
السلام عليكم ورحمة الله تعالى وبركاته
لولايات انا طالب دكتوراه في قسم الهندسة وإدارة التكنولوجيا في جامعة بورتلاند الحكومية في ا
ذكية في المتحدة الامريكية, وكجزء من بحث الدكتوراه احتاج لجمع بيانات من مستخدمي الهواتف ال
ي الاجابة كة فالمملكة العربية السعودية. لذا أرجو منكم كمستخدمين للهاتف الذكي التكرم بالمشار
المستخدمين على الاستبيان المرفق والذي يهدف إلى دراسة العوامل الرئيسية التي تؤثر على سلوك
في قبول واستخدام الهاتف الذكي خصوصا في المملكة العربية السعودية.
مىتقبلوا جزيل شكري وعميق تقديري على تكرمكم بالمشاركة في هذا الاستبيان الاكادي
نكم الإجابة على عدد من الأسئلة حول وجهة نظركم بخصوص الهاتف الذكي سوف يطلب م
بة واستخدامه. هناك خمسة اختيارات مختلفة للإجابة على كل سؤال ارجو اختيار الاجابة المناس
حسب رأيك.
ى هذا وسوف تستغرق الاجابة عل المشاركة في هذه الدراسة البحثية هي تماما اختيارية تطوعية
سؤال بخصوص 34سيبدأ الاستبيان بأربعة أسئلة عامة ثم يتبع ذلك دقائق حيث 10حوالي الاستبيان
الهاتف الذكي.
د من هذه سيكون هناك بعض الاسئلة المتشابهة والتي توحي بانها تكرار لسؤال آخر حيث أن القص
يعا.الاسئلة المتشابهة هو محاولة قياس متغير واحد لذا ارجو التكرم بالإجابة عليها جم
يرجى استخدام الرابط أدناه للوصل الى الاستبيان
https://portlandstate.qualtrics.com//SE/?SID=SV_3aTVb4zsWuIFHa5
لكترونياذا كان لديك أسئلة الرجاء الاتصال بي على بريدي الا
اشكر لك مشاركتكم في هذا الاستبيان
اخوكم فهد الضبعان
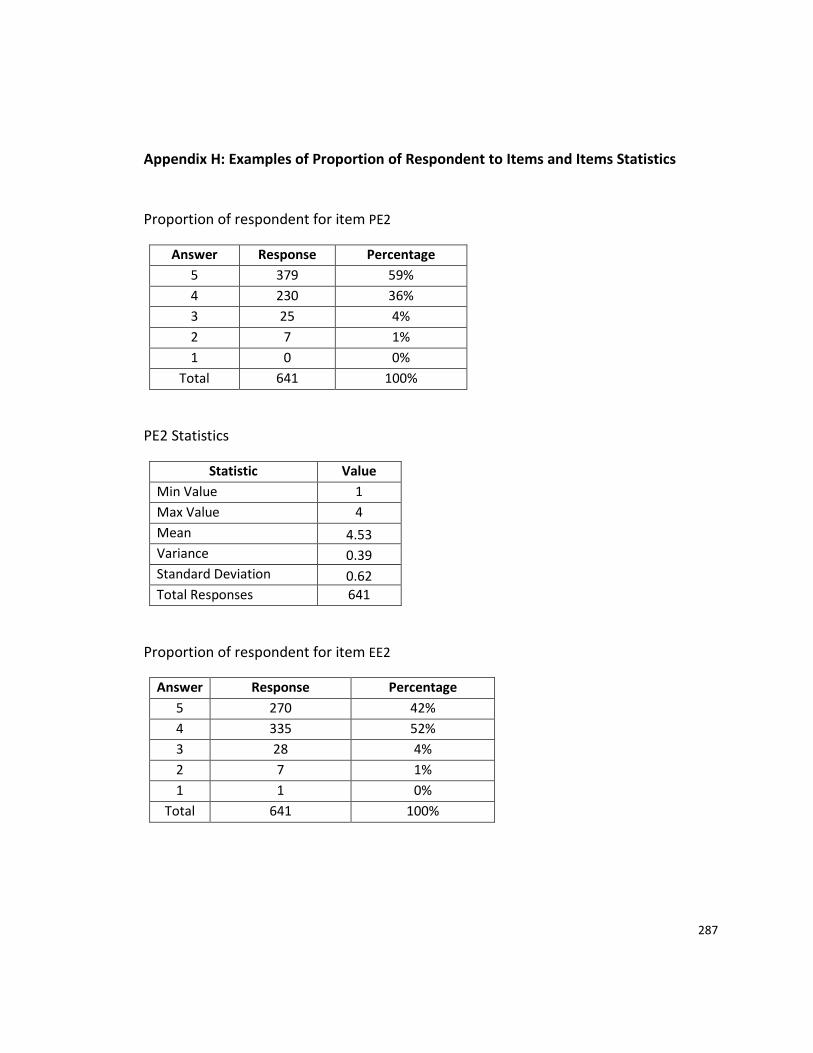
287
Appendix H: Examples of Proportion of Respondent to Items and Items Statistics
Proportion of respondent for item PE2
Answer Response Percentage
5 379 59%
4 230 36%
3 25 4%
2 7 1%
1 0 0%
Total 641 100%
PE2 Statistics
Statistic Value
Min Value 1
Max Value 4
Mean 4.53
Variance 0.39
Standard Deviation 0.62
Total Responses 641
Proportion of respondent for item EE2
Answer Response Percentage
5 270 42%
4 335 52%
3 28 4%
2 7 1%
1 1 0%
Total 641 100%
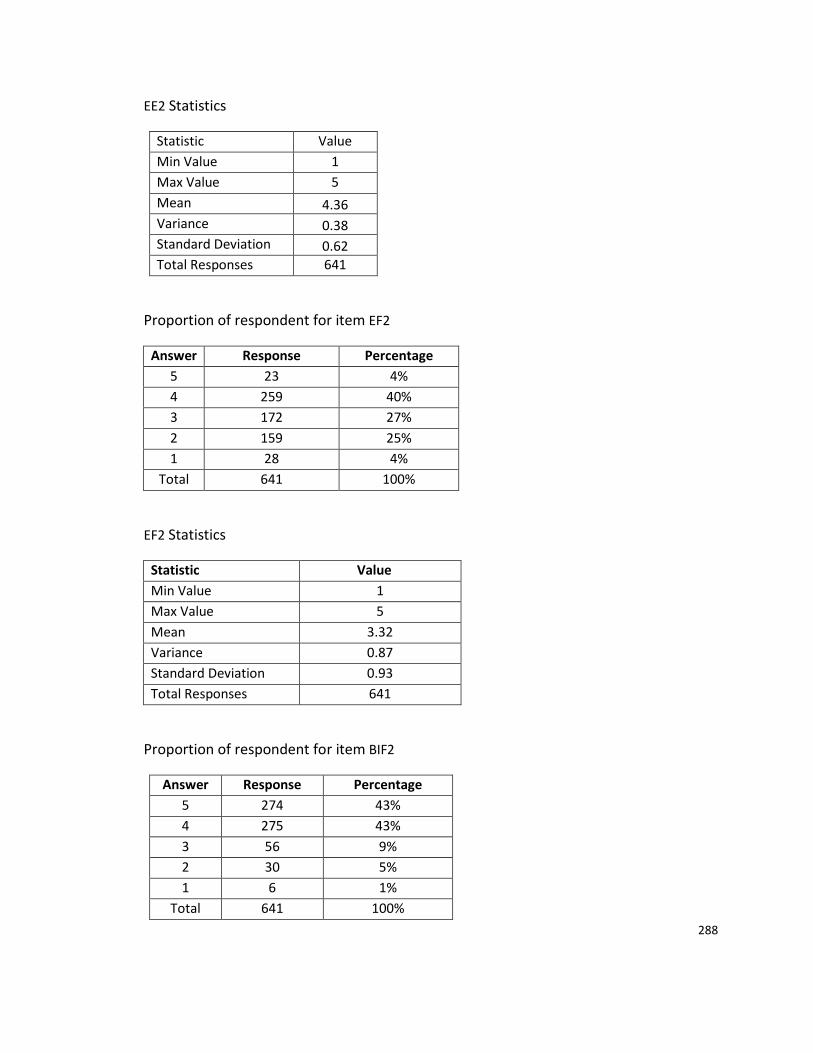
288
EE2 Statistics
Statistic Value
Min Value 1
Max Value 5
Mean 4.36
Variance 0.38
Standard Deviation 0.62
Total Responses 641
Proportion of respondent for item EF2
Answer Response Percentage
5 23 4%
4 259 40%
3 172 27%
2 159 25%
1 28 4%
Total 641 100%
EF2 Statistics
Statistic Value
Min Value 1
Max Value 5
Mean 3.32
Variance 0.87
Standard Deviation 0.93
Total Responses 641
Proportion of respondent for item BIF2
Answer Response Percentage
5 274 43%
4 275 43%
3 56 9%
2 30 5%
1 6 1%
Total 641 100%
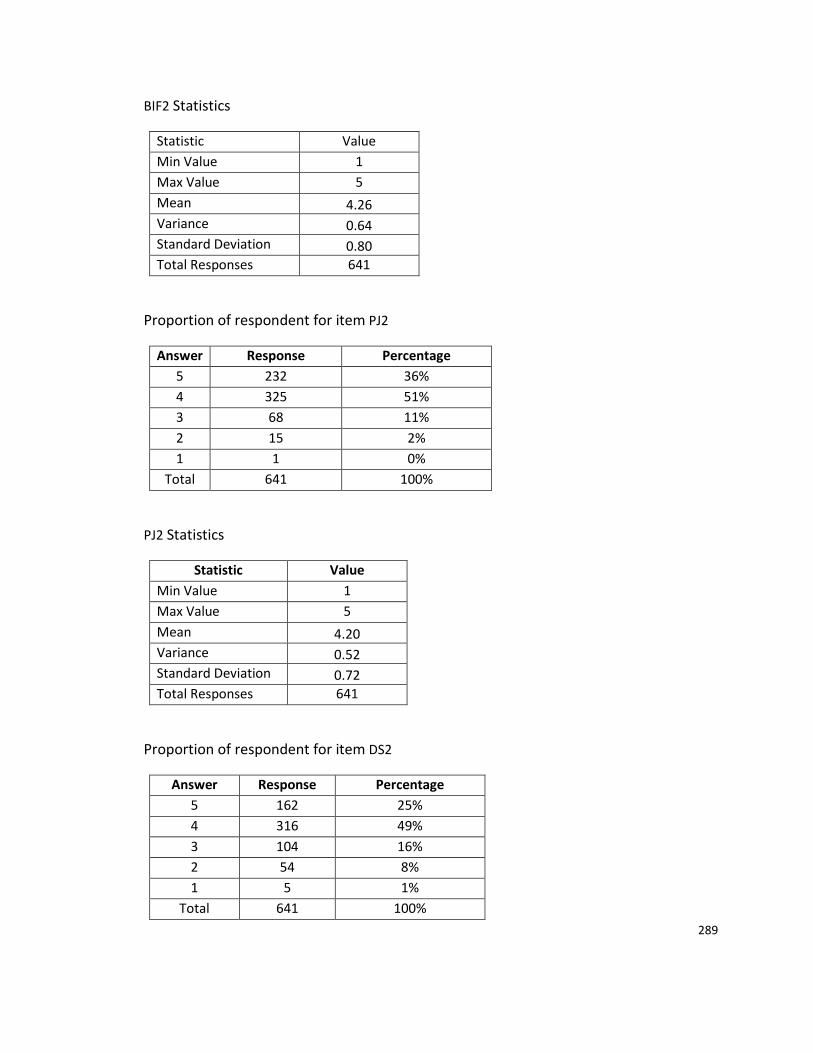
289
BIF2 Statistics
Statistic Value
Min Value 1
Max Value 5
Mean 4.26
Variance 0.64
Standard Deviation 0.80
Total Responses 641
Proportion of respondent for item PJ2
Answer Response Percentage
5 232 36%
4 325 51%
3 68 11%
2 15 2%
1 1 0%
Total 641 100%
PJ2 Statistics
Statistic Value
Min Value 1
Max Value 5
Mean 4.20
Variance 0.52
Standard Deviation 0.72
Total Responses 641
Proportion of respondent for item DS2
Answer Response Percentage
5 162 25%
4 316 49%
3 104 16%
2 54 8%
1 5 1%
Total 641 100%

290
DS2 Statistics
Statistic Value
Min Value 1
Max Value 5
Mean 3.93
Variance 0.76
Standard Deviation 0.87
Total Responses 641
Proportion of respondent for item FC2
Answer Response Percentage
5 125 20%
4 350 55%
3 103 16%
2 59 9%
1 4 1%
Total 641 100%
FC2 Statistics
Statistic Value
Min Value 1
Max Value 5
Mean 3.86
Variance 0.71
Standard Deviation 0.84
Total Responses 641
Proportion of respondent for item SI2
Answer Response Percentage
5 189 29%
4 304 47%
3 106 17%
2 33 5%
1 9 1%
Total 641 100%
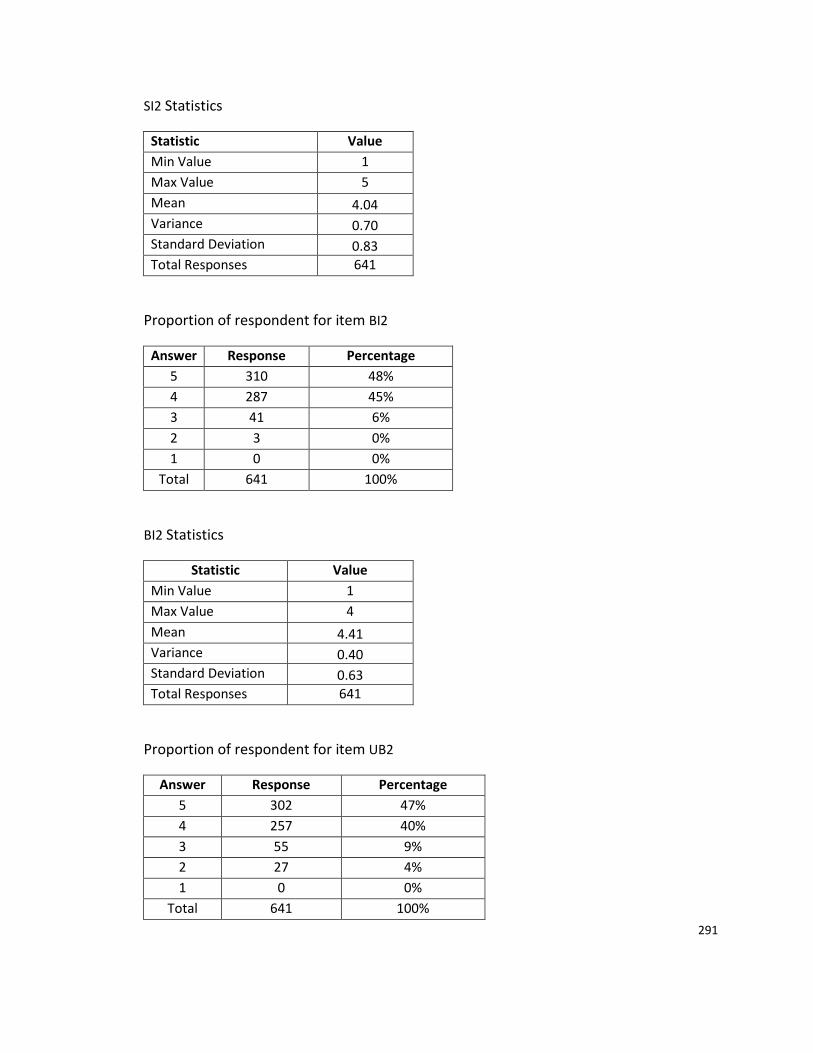
291
SI2 Statistics
Statistic Value
Min Value 1
Max Value 5
Mean 4.04
Variance 0.70
Standard Deviation 0.83
Total Responses 641
Proportion of respondent for item BI2
Answer Response Percentage
5 310 48%
4 287 45%
3 41 6%
2 3 0%
1 0 0%
Total 641 100%
BI2 Statistics
Statistic Value
Min Value 1
Max Value 4
Mean 4.41
Variance 0.40
Standard Deviation 0.63
Total Responses 641
Proportion of respondent for item UB2
Answer Response Percentage
5 302 47%
4 257 40%
3 55 9%
2 27 4%
1 0 0%
Total 641 100%
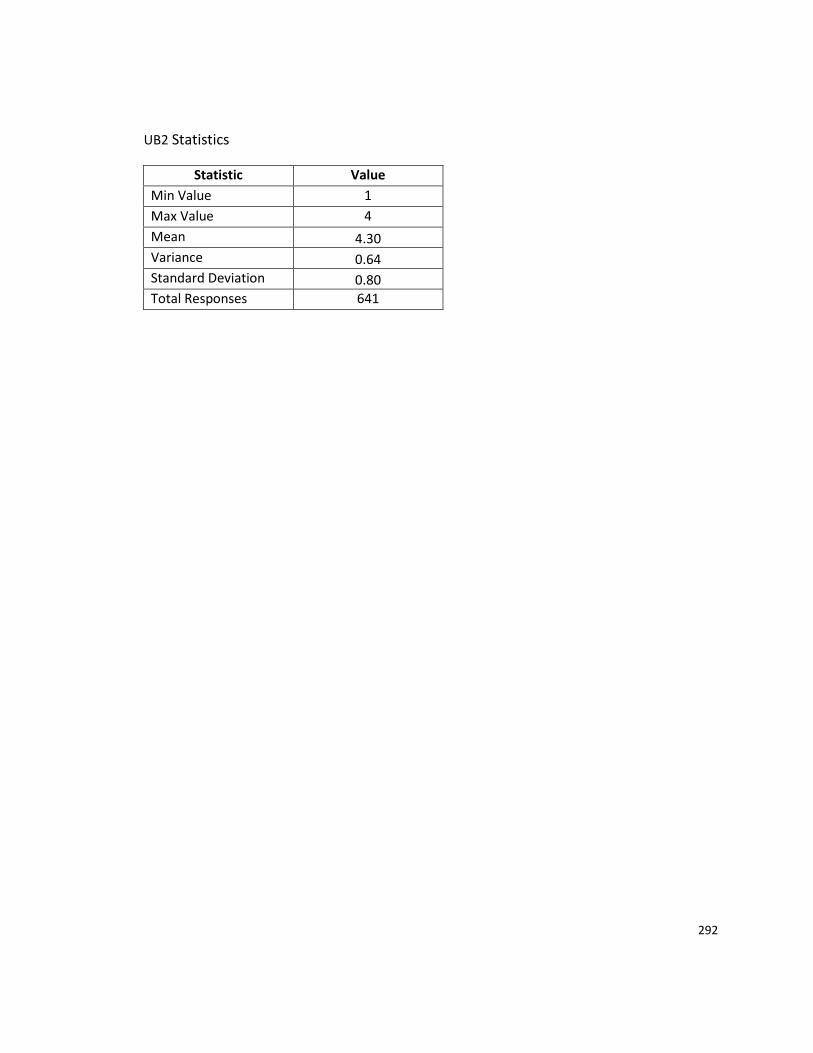
292
UB2 Statistics
Statistic Value
Min Value 1
Max Value 4
Mean 4.30
Variance 0.64
Standard Deviation 0.80
Total Responses 641
293
Appendix I: Screen Captures of The Web-based Survey
294
295
296
297
298
299
300
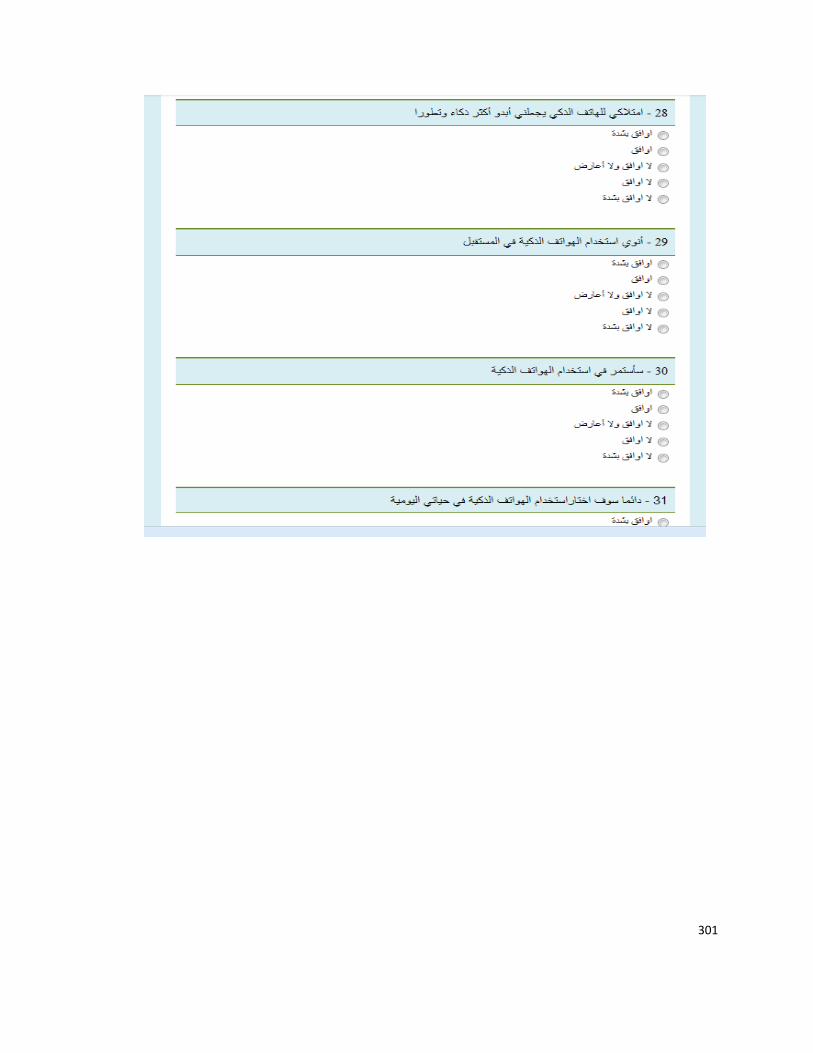
301
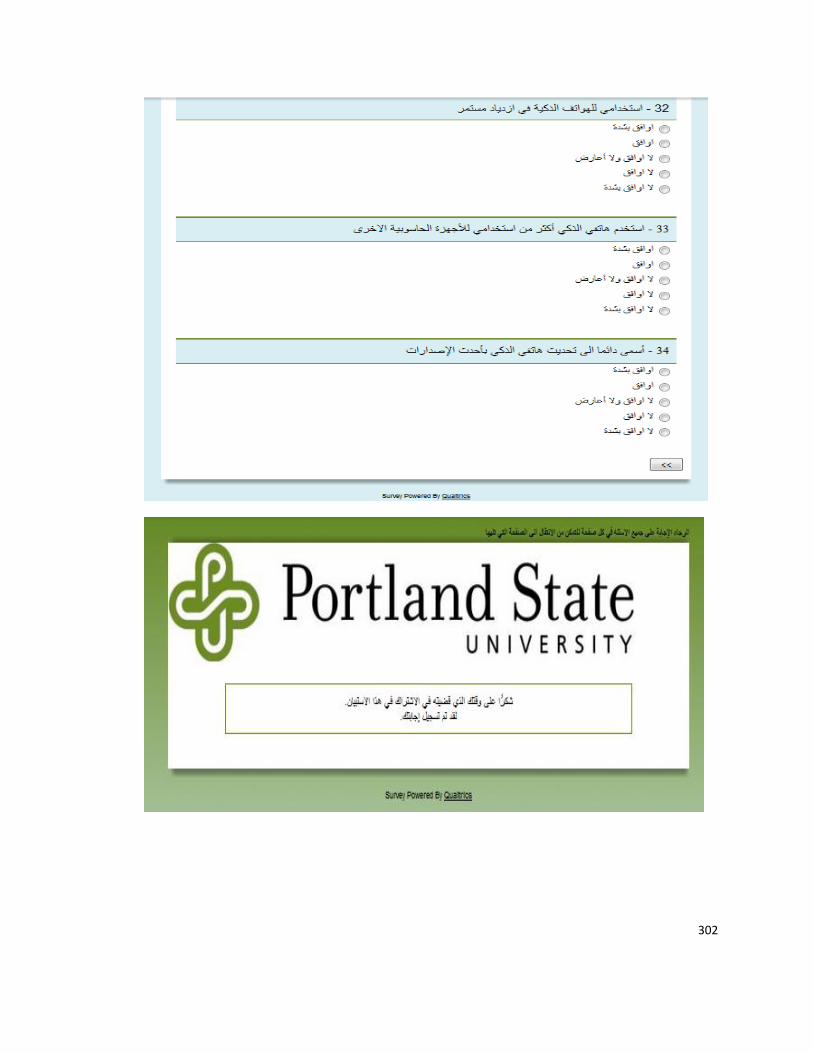
302
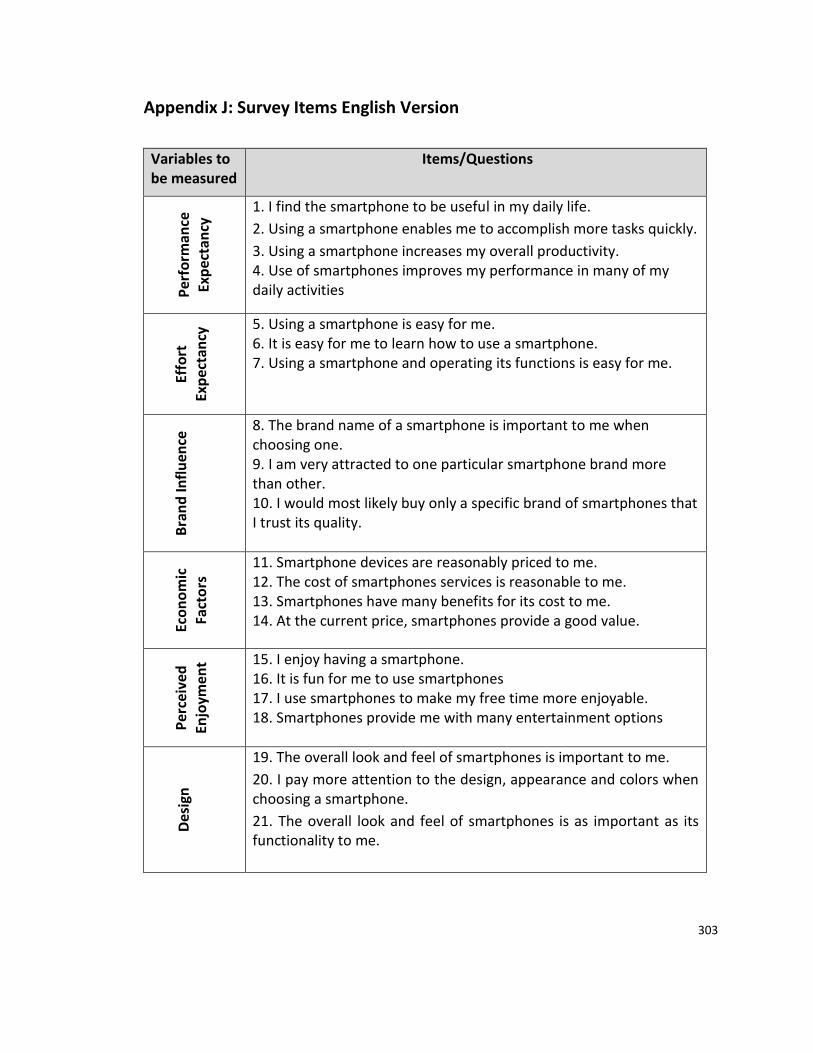
303
Appendix J: Survey Items English Version
Variables to be measured
Items/Questions
Per
form
ance
Ex
pec
tan
cy 1. I find the smartphone to be useful in my daily life.
2. Using a smartphone enables me to accomplish more tasks quickly.
3. Using a smartphone increases my overall productivity. 4. Use of smartphones improves my performance in many of my daily activities
Ef
fort
Ex
pec
tan
cy 5. Using a smartphone is easy for me.
6. It is easy for me to learn how to use a smartphone. 7. Using a smartphone and operating its functions is easy for me.
B
ran
d In
flu
ence
8. The brand name of a smartphone is important to me when choosing one. 9. I am very attracted to one particular smartphone brand more than other. 10. I would most likely buy only a specific brand of smartphones that I trust its quality.
Ec
on
om
ic
Fact
ors
11. Smartphone devices are reasonably priced to me. 12. The cost of smartphones services is reasonable to me. 13. Smartphones have many benefits for its cost to me. 14. At the current price, smartphones provide a good value.
P
erce
ive
d
Enjo
ymen
t 15. I enjoy having a smartphone.
16. It is fun for me to use smartphones 17. I use smartphones to make my free time more enjoyable. 18. Smartphones provide me with many entertainment options
Des
ign
19. The overall look and feel of smartphones is important to me.
20. I pay more attention to the design, appearance and colors when choosing a smartphone.
21. The overall look and feel of smartphones is as important as its functionality to me.
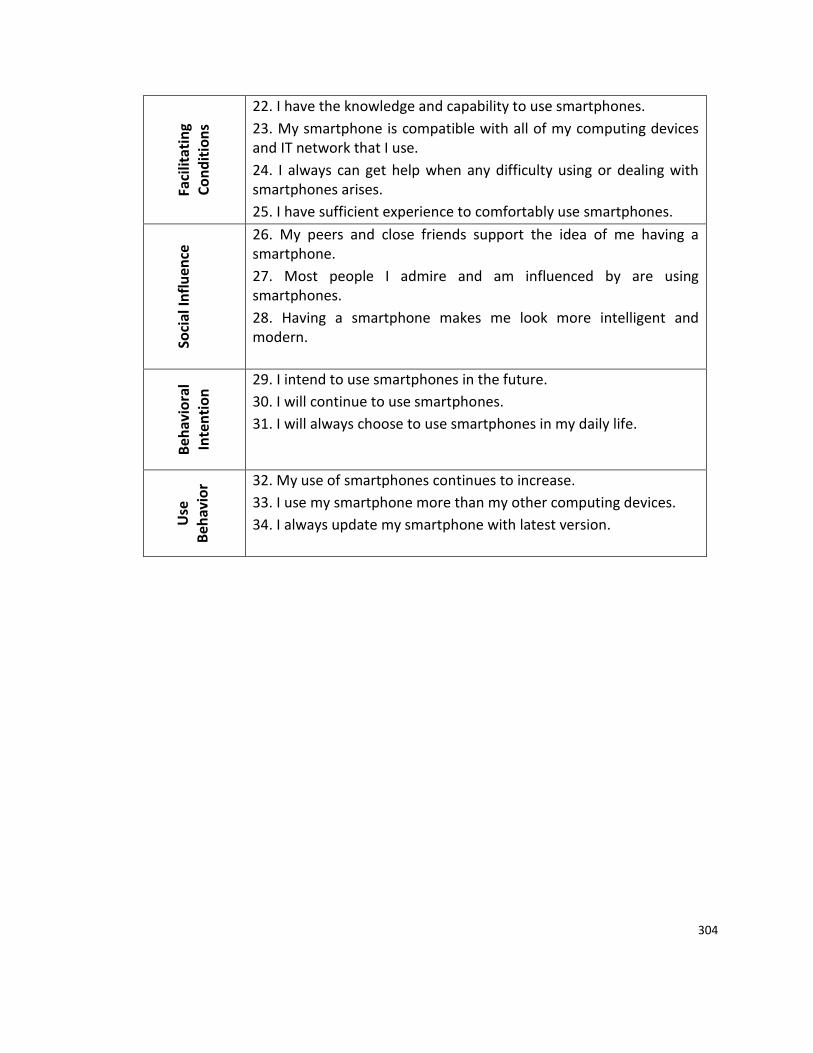
304
Faci
litat
ing
Co
nd
itio
ns
22. I have the knowledge and capability to use smartphones.
23. My smartphone is compatible with all of my computing devices and IT network that I use.
24. I always can get help when any difficulty using or dealing with smartphones arises.
25. I have sufficient experience to comfortably use smartphones.
Soci
al In
flu
ence
26. My peers and close friends support the idea of me having a smartphone.
27. Most people I admire and am influenced by are using smartphones.
28. Having a smartphone makes me look more intelligent and modern.
Beh
avio
ral
Inte
nti
on
29. I intend to use smartphones in the future.
30. I will continue to use smartphones.
31. I will always choose to use smartphones in my daily life.
Use
B
ehav
ior 32. My use of smartphones continues to increase.
33. I use my smartphone more than my other computing devices.
34. I always update my smartphone with latest version.
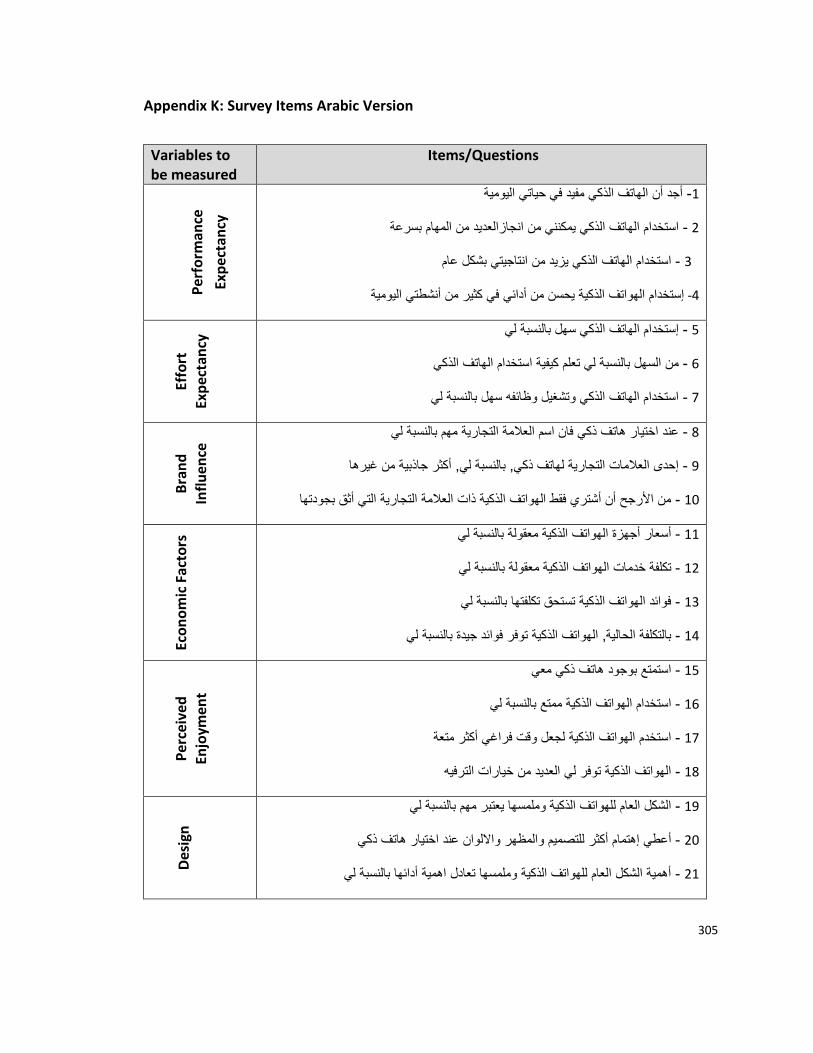
305
Appendix K: Survey Items Arabic Version
Variables to be measured
Items/Questions
Per
form
ance
Exp
ecta
ncy
أجد أن الهاتف الذكي مفيد في حياتي اليومية -1
استخدام الهاتف الذكي يمكنني من انجازالعديد من المهام بسرعة - 2
انتاجيتي بشكل عاماستخدام الهاتف الذكي يزيد من - 3
4- إستخدام الهواتف الذكية يحسن من أدائي في كثير من أنشطتي اليومية
Ef
fort
Ex
pec
tan
cyإستخدام الهاتف الذكي سهل بالنسبة لي - 5
من السهل بالنسبة لي تعلم كيفية استخدام الهاتف الذكي - 6
استخدام الهاتف الذكي وتشغيل وظائفه سهل بالنسبة لي - 7
B
ran
d
Infl
uen
ceعند اختيار هاتف ذكي فان اسم العلامة التجارية مهم بالنسبة لي - 8
إحدى العلامات التجارية لهاتف ذكي, بالنسبة لي, أكثر جاذبية من غيرها - 9
هامن الأرجح أن أشتري فقط الهواتف الذكية ذات العلامة التجارية التي أثق بجودت - 10
Ec
on
om
ic F
acto
rsأسعار أجهزة الهواتف الذكية معقولة بالنسبة لي - 11
تكلفة خدمات الهواتف الذكية معقولة بالنسبة لي - 12
فوائد الهواتف الذكية تستحق تكلفتها بالنسبة لي - 13
بالتكلفة الحالية, الهواتف الذكية توفر فوائد جيدة بالنسبة لي - 14
P
erce
ived
En
joym
ent
هاتف ذكي معي استمتع بوجود - 15
استخدام الهواتف الذكية ممتع بالنسبة لي - 16
استخدم الهواتف الذكية لجعل وقت فراغي أكثر متعة - 17
الهواتف الذكية توفر لي العديد من خيارات الترفيه - 18
Des
ign
الشكل العام للهواتف الذكية وملمسها يعتبر مهم بالنسبة لي - 19
للتصميم والمظهر والالوان عند اختيار هاتف ذكي أعطي إهتمام أكثر - 20
أهمية الشكل العام للهواتف الذكية وملمسها تعادل اهمية أدائها بالنسبة لي - 21
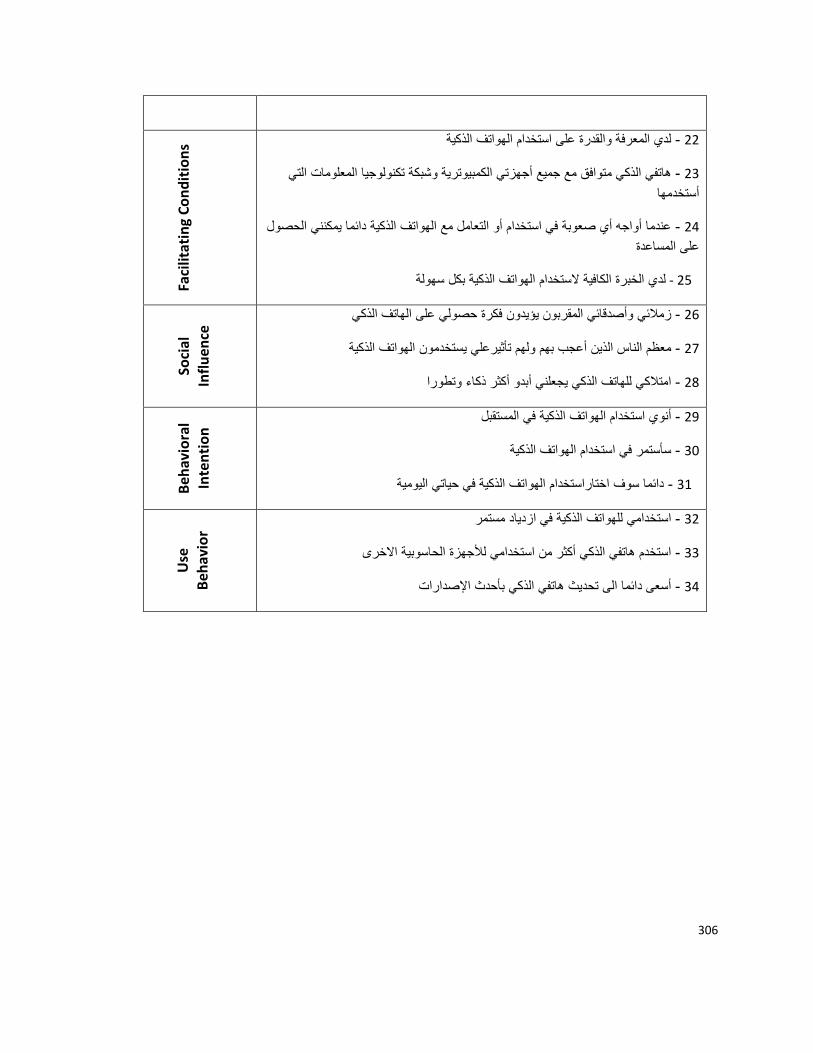
306
Faci
litat
ing
Co
nd
itio
ns 22 - لدي المعرفة والقدرة على استخدام الهواتف الذكية
مات التي بكة تكنولوجيا المعلوهاتفي الذكي متوافق مع جميع أجهزتي الكمبيوترية وش - 23
أستخدمها
حصول عندما أواجه أي صعوبة في استخدام أو التعامل مع الهواتف الذكية دائما يمكنني ال - 24
على المساعدة
25 - لدي الخبرة الكافية لاستخدام الهواتف الذكية بكل سهولة
Soci
al
Infl
uen
ceة حصولي على الهاتف الذكيزملائي وأصدقائي المقربون يؤيدون فكر - 26
معظم الناس الذين أعجب بهم ولهم تأثيرعلي يستخدمون الهواتف الذكية - 27
امتلاكي للهاتف الذكي يجعلني أبدو أكثر ذكاء وتطورا - 28
Beh
avio
ral
Inte
nti
on
أنوي استخدام الهواتف الذكية في المستقبل - 29
سأستمر في استخدام الهواتف الذكية - 30
دائما سوف اختاراستخدام الهواتف الذكية في حياتي اليومية - 31
Use
B
ehav
ior
استخدامي للهواتف الذكية في ازدياد مستمر - 32
استخدم هاتفي الذكي أكثر من استخدامي للأجهزة الحاسوبية الاخرى - 33
أسعى دائما الى تحديث هاتفي الذكي بأحدث الإصدارات - 34