Embed Size (px)
Citation preview
734
Journal of Sport Management, 2008, 22, 734-761© 2008 Human Kinetics, Inc.
Exploring Brand Positioning in a Sponsorship Context: A Correspondence Analysis of the Dew Action Sports Tour
Mauricio FerreiraTexas A&M University
Todd K. Hall
Georgia Southern University
Gregg BennettTexas A&M University
In this study, we used correspondence analysis (Greenacre, 1984; Hoffman & Franke, 1986) to examine connections between the title sponsor, brand competitors, and con-sumer targets exposed to a sponsorship. Demographic characteristics and self-reported use of 20 soft drink brands were collected from 1,138 attendees of four of the five inaugural events of the Dew Action Sports Tour. The analyses consisted of decompos-ing the cross-tabulated data into latent dimensions and graphically portraying brands and consumer targets in joint preference maps. Results revealed that consumers dif-ferentiated the 20 soft drink brands based on two latent dimensions: energy/diet and convenience. Furthermore, based on proximity of the target market to the title sponsor in the maps, it appears that Mountain Dew has been relatively effective in positioning the brand for key target markets in only one of the four cities examined. Theoretical and managerial implications of the findings are discussed.
Over the past 20 years, corporate sponsorship has been one of the fastest growing forms of promotional activity worldwide (IEG, 2004). One of the reasons for this growth is the opportunity sponsorships provide to cut through the clutter of traditional media by offering access to well-defined target markets (Gardner & Shuman, 1987). In fact, corporations seek to associate with properties containing an attractive consumer base for their products. This product-consumer fit is impor-tant to corporations as it facilitates the activation of the sponsorship, allows the user imagery of the property to potentially “transfer” to the sponsor products (Gwinner, 1997), and provides an opportunity to increase product usage among those consumers who are of interest to sponsors.
Ferreira and Bennett are with the Dept. of Health and Kinesiology, Texas A&M University, College Station, TX 77845. Hall is with the Dept of Hospitality, Tourism, Family & Consumer Science, Georgia Southern University, Statesboro, GA 30460.
Brand Positioning in a Sponsorship Context 735
Despite the importance of the fit between sponsoring brands and consumers of the event (Pracejus & Olsen, 2004), very few sponsorship studies have focused on how brands are positioned in regard to intended audience and their competi-tors. Consistent with the notion of brand differentiation, it is paramount that brand managers involved in sponsorships evaluate whether their marketing efforts are reaching the intended audience.
The purpose of this study, therefore, was to examine the association between consumer targets and brand consumption for the title sponsor of the Dew Action Sports Tour. Although this examination can be accomplished in many different ways, we particularly used correspondence analysis as a positioning analysis tool to investigate connections between the event sponsor, competitors, and consumers exposed to the sponsorship. An underlying premise of this inquiry is that sponsor-ship as a positioning strategy can enhance brand preference among specific, tar-geted consumer groups. Given that exposure to sponsorship takes place, the degree to which targeted groups are associated with the consumption of sponsoring brands indicates how well the sponsorship efforts enhanced brand use among the targeted group.
This paper makes a specific contribution to the sport management literature by providing a better understanding of the role sponsorship can play in position-ing a sponsoring brand to key target markets. This contribution is particularly accomplished by demonstrating how correspondence analysis can be used and interpreted to examine the positioning of the Mountain Dew brand through action sports sponsorships.
Background
Brand Positioning
Brand positioning refers to “a relatively stable set of consumer perceptions (or meanings) of a brand in relation to competitive alternatives” (Kates & Goh, 2003, p. 59). A few well-known examples of brand positioning include the common consumer perceptions of Visa as a widely-accepted credit card, the perceptions of Apple computers as user-friendly, and the perceptions of the Dallas Cowboys as America’s team. These are examples of brands that have a distinct position in the consumers’ minds. Conceptually, brand positioning influences consumer choice by “shap[ing] and maintain[ing] a specific brand’s image in the consumer’s mind” (Green & Muller, 2002, p. 180).
The term positioning was first introduced by Al Ries and Jack Trout mainly as a communications tool to breakthrough the clutter of a crowded marketplace (Ries & Trout, 1986). However, positioning influences and is influenced by all marketing variables, not just communications (Aaker & Shansby, 1982; Bagozzi, Rosa, Celly, & Coronel, 1998; Kardes, 1998). Although the way brands are pre-sented to consumers is important, positioning usually follows a set of integrated strategies to create brand differentiation in the consumers’ mind (Bagozzi et al., 1998; Kardes, 1998). For example, in an effort to fix a new image as a “safety leader brand without a luxury-car price” into consumers’ minds, Honda made changes to their marketing actions that were consistent with the intended image. This entailed not only communicating the intended image, but also providing safety features in every car and not altering price (Halliday, 2004).
736 Ferreira, Hall, and Bennett
The crucial element to positioning is differentiation. There are many ways in which a brand can be perceived to be different, including among others the attri-butes/benefits it provides, its price, whether it is a pioneer brand, when it is con-sumed, and who consumes the brand (Aaker & Shansby, 1982). One particular strategy that is relevant to the current study is positioning by the product user (Aaker & Shansby, 1982). This positioning strategy attempts to associate the product with users or user groups. Many product categories such as soft drinks, beers, cosmetics, and personal hygiene products employ such strategy. For exam-ple, a recent marketing campaign employed by Pepsi highlighted the brand’s Diet Pepsi line extension in an attempt to appeal to a specific consumer segment over the age of 35 years old (Lippert, 2003). More recently Miller High Life endeav-ored to reinforce or reclaim its position with the blue-collar workforce by creating commercials wherein their own blue-collar workers took Miller High Life product away from trendy restaurants and night clubs, rather than delivering it (Mullman, 2006). Regardless of the positioning strategy employed, an important objective of brand positioning efforts is to increase the consumption of a particular product or brand among a specific segment of consumers.
Brand Positioning and Sponsorship
One avenue for creating product differentiation through positioning strategy is to employ sponsorship. Sponsorship is “an investment, in cash or in kind, in an activ-ity, in return for the exploitable commercial potential associated with that activ-ity” (Meenaghan 1991, p. 36). Marketers have increasingly used sponsorship as a promotional and positioning tool to reach targeted markets due to its unique abil-ity to cut through the clutter of traditional media (Cliffe & Motion, 2005; Gardner & Shuman, 1987; Nicholls, Roslow, & Dublish, 1999). Among the many pro-posed benefits and/or objectives of corporate sponsorship is the ability to create an emotional attachment with the target audience, which can be difficult to accom-plish via traditional media. In essence, sponsorship allows the corporation to approach the target audience through a medium in which they are already inter-ested. In return, companies who invest in sponsorships may experience high levels of preference among those who attend a sponsored event.
While sponsorship has many varying objectives including creating aware-ness, building goodwill, and enhancing corporate image and brand equity (Gard-ner & Shuman, 1987; Meenaghan, 1991; Pracejus, 2004), it is often used as a communication tool to differentiate and position a brand apart from its competi-tors. For instance, in July of 2007, PepsiCo sponsored “Live Earth,” a 24-hr series of concerts held around the globe to support the fight against global warming (Hein, 2007a). Not only did the sponsoring of such a cause enable PepsiCo to reach specific targets, but it also allowed PepsiCo to borrow from the image of being “green” or an environmentally conscious organization, in an attempt to dif-ferentiate from their primary competitor, Coca-Cola.
Exploring Event and Sponsor Fit
When deciding on what sponsorships best fit the corporation’s goals, firms often employ many criteria to decide what to sponsor (IEG, 1999). However, brand

Brand Positioning in a Sponsorship Context 737
image and audience compatibility are often required to assess the viability of a sponsorship engagement (Howard & Crompton, 2004). Keller (1993) defined brand image as “perceptions about a brand as reflected by the brand associations held in memory” (p. 3). According to Keller (1993), brand images are formed by three types of brand associations held in memory: attributes, benefits, and brand attitudes. In the case of a soft drink, for example, we might form brand attitudes toward a brand like Mountain Dew based on its product-related attributes (sugar content, caffeine, taste, color) or nonproduct related attributes such as price, pack-aging, as well as the perceptions we may have of those who consume Mountain Dew (e.g., trendy, cool, hip-hop) and usage occasions (e.g., evenings, at events, etc.). Brand positioning through sponsorships is intended to function in a way that the brand image of sponsors is leveraged or facilitated by the event image. The success of the leverage may depend on the degree of congruence between the brand and event images (Keller, 1993). Studies of sponsorship, branding, and endorsements have supported this notion of brand image fit, where high levels of congruence may enhance consumer attitudes toward firms (Keller & Aaker, 1992; Speed & Thomson, 2000).
In addition to brand and event image fit, firms also seek brand and audience fit. That is, firms are often interested in sponsorship opportunities that show a match between attendees or participants of an event and the consumers of the brand (Cornwell, Weeks, & Roy, 2005; Howard & Crompton, 2004). Sociodemo-graphic variables such as age and gender often play an important role in audience fit because of the reliance by both the companies and sport properties on these variables to target and sell their products (Fennell & Allenby, 2004; Fennell, Allenby, Yang, & Edwards, 2003). Brand and audience fit in a sponsorship rela-tionship is particularly important because the promotional strategy is aimed at specific consumer segments and can be a part of a positioning strategy, especially positioning by the product user, as discussed above. Sponsorships offer compa-nies the opportunity to build goodwill (Meenaghan, 1991, 2001) among those who are current (confirmed) or potential brand consumers. Action sports sponsor-ships, for example, give companies access to teenagers and young adults.
In our view, sponsorship decision making can be complex and often requires market research information to minimize the risks of making erroneous marketing decisions. The assessment of the relationship between target markets and brand use is one legitimate way to evaluate current efforts, especially if target markets are considered as an important element of sponsorship decision making. There-fore, a brand positioning analysis can be helpful to inform post-sponsorship evalu-ative decisions such as renewals, new strategies, and brand portfolio management.
As companies engage in sponsorships, important questions to ask are those that can help managers better understand brand consumption and its relationships with intended target markets and competition. For example, questions such as whether the intended targeted markets have been persuaded through the sponsor-ship and how well sponsors are positioned or differentiated relative to competition can provide valuable information for future decisions regarding sponsorships.
Mountain Dew Sponsorships and Target Markets. The Mountain Dew brand is currently the title sponsor of the Dew Action Sports Tour (DAST), which began its
738 Ferreira, Hall, and Bennett
inaugural event series in 2005 with five events in Louisville, Denver, Portland, San Jose, and Orlando. Each tour stop was sponsored by a major firm attempting to connect with the youth market, including Panasonic, Toyota, Vans, Right Guard, and Sony’s PlayStation brand. The event series, which is owned and broadcast by the National Broadcast Company (NBC), provided action sports athletes with an annual tour championship much like the PGA Tour and Nextel NASCAR series (Bennett & Lachowetz, 2004).1 Action sports athletes compete in various sports (BMX—Dirt, Vert, and Park, Skateboarding—Vert and Park, and Freestyle Moto-cross) at each event, accumulating points resulting with a champion in each sport at the end of each season.
Before this event series, there were a handful of events for action sports ath-letes, the most notable being ESPN’s X Games. The X Games are the marquee action sports event, having been in existence for over a decade. The X Games have been a staple for ESPN in regard to broadcasting hours, and they have helped fuel the growth of action sports participation among the youth segment (Bennett & Lachowetz, 2004). The Dew Action Sports Tour is NBC’s response to the contin-ued growth of action sports and market share enjoyed by ESPN.
As the fastest growing soft drink in terms of sales in the 1990s (Gladden & McDonald, 2006), the Mountain Dew brand has used action sports to position its core product (as well as the product extensions Diet Mountain Dew and MD Amp) as a youthful, high energy, high action brand (Holt, 2003). In using action sports as a tool to accomplish its positioning strategy, Mountain Dew is targeting the youth market, males ages 10–24 (Wade Martin personal interview as cited by Gladden & McDonald, 2006), which consists of more than 58 million consumers (McCarthy, 2001).
As Mountain Dew uses action sports sponsorship as a tool to communicate with the youth male market, this study assesses the potential associations between Mountain Dew, consumption, and target markets. In addition, this study also examines how well Mountain Dew is positioned or differentiated relative to com-petition. Therefore, the following questions are explored in this investigation:
R1: Are Dew Action Sports Tour attendees overall (and for each city of the tour) more likely to consume Mountain Dew versus other brands?
R2: Does a relationship between brand consumption and different target mar-kets exist (overall and for each city of the tour)?
R3: How is Mountain Dew positioned relative to competing brands in key target markets (males 24 years of age and younger) overall and for each city of the tour?
Method
Respondents
Respondents (n = 1138) were attendees at four of the five events of the Dew Action Sports Tour, as data were not collected at one tour stop (Denver). Data were collected onsite between noon and 8:00 p.m. over the three days when the events were held in June, August, September, and October of 2005. Mall intercept
Brand Positioning in a Sponsorship Context 739
methodology was employed by trained collectors at all four locations. In each city, there were two to four collectors near an information booth located in a cen-tral, high-traffic area in close proximity to the only entrance to the various events, and five to nine collectors within the individual arenas while waiting for an event to commence. All collectors were instructed to work in pairs to solicit every respondent (not only those they thought were more likely to fill out a survey) pass-ing through their strategic points. The survey took less than ten minutes to com-plete and respondents were offered the incentive of a prize drawing for their par-ticipation. The prizes varied by city and ranged from a bicycle to a mini motorcycle.
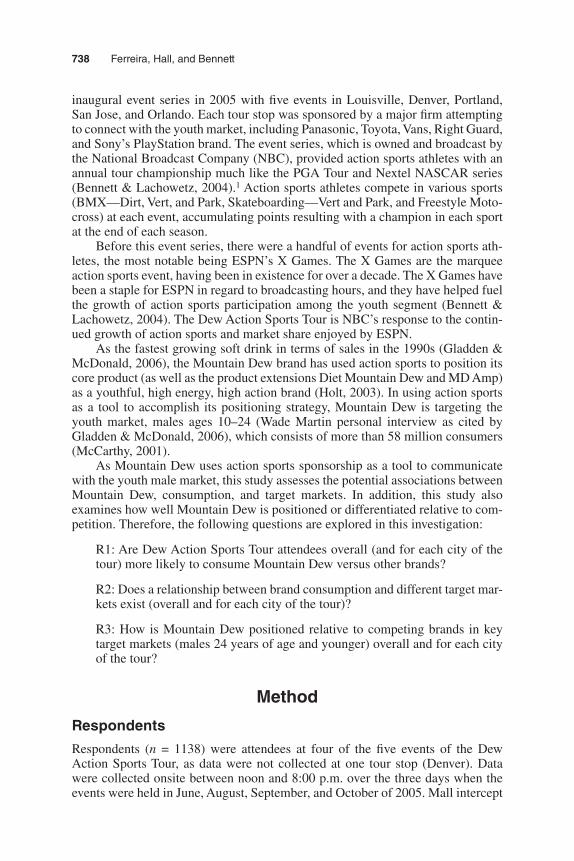
Table 1 details the demographic profile of the entire sample and displays the demographic differences between each city. The overall sample consisted of a predominance of Caucasian (75%) males (68%). Members of Generation Y (ages 12–24) comprised 50% of the sample. To identify demographic differences across cities, a Chi-square analysis was conducted between each demographic character-istic and cities. The Chi-square adjusted residuals were then used to determine values that show significant relationship beyond what would be expected by chance alone. As shown in Table 1, the Chi-square values indicate that the cities differed significantly on all demographic characteristics. According to the adjusted residuals, the most remarkable differences include the following: San Jose was comprised of more Hispanics (37%), more males (77%), more teenagers 17 years of age and under (46%), and more respondents still in middle/high school (44%) than expected. Orlando was also more diverse than expected, with Hispanics com-prising 15% of the sample. Moreover, Orlando had more females (37%) and older respondents in the 37+ years of age group (36%) than expected. Portland was comprised of more teenagers under 17 years of age (44%) and more Caucasians (82%) than expected. Finally, Louisville was comprised of more females (35%), more individuals in the older 37+ years of age group (30%), more Caucasians (91%), and more individuals with very high income, $85,000 or higher (18%) than expected.
Measures
To address the research questions of this study, a questionnaire was constructed and administered to the sample as described above. The questionnaire contained items related to involvement with action sports, consumption of soft drinks, and demographic segmentation, including gender and age.
Target Market Composite Characteristics. In the demographic section of the questionnaire, respondents were asked to provide their gender and age at the time of the event. The gender measure was a dichotomous variable, which was chosen by respondents (1 = female; 0 = male), while the age measure required an open-ended response. The respondents were then categorized into four groups of rela-tively1 equal size according to quartiles (bands of 25 percentile frequencies) across the entire database: ages 17 and under, ages 18–24, ages 25–36, and ages 37 and older.
Because our interest here was mainly to determine the relationship between brand consumption and target groups, and not the relationship between demo-graphic variables, a composite variable representing target groups was created

740
Tab
le 1
D
emo
gra
ph
ic C
har
acte
rist
ics
P
ort
lan
d
San
Jo
se
Orl
and
o
Lo
uis
ville
O
vera
ll
(n
=203
)
(n=2
17)
(n
=166
)
(n=5
52)
(n
=113
8)
Ch
i-S
qu
are
d
f
p
Gen
der
Mal
e69
%
77%
63
%
65%
68
%
Fem
ale
31%
23
%
37%
35
%
32%
25
0
3
<.0
01
A
ge
<
Und
er 1
7 yr
s ol
d44
%
46%
10
%
25%
30
%
18-2
416
%
18%
30
%
19%
20
%
25-3
111
%
10%
12
%
14%
13
%
32 +
yea
rs29
%
26%
48
%
42%
37
%
1,87
0
9
<.0
01
E
thni
city
Afr
ican
Am
eric
an3%
4%
3%
4%
3%
A
sian
or A
sian
Am
eric
an4%
8%
1%
1%
3%
H
ispa
nic
5%
37%
15
%
2%
10%
N
ativ
e A
mer
ican
2%
5%
1%
1%
2%
Whi
te, n
ot H
ispa
nic
82%
44
%
77%
91
%
75%
O
ther
5%
3%
3%
1%
2%
5,23
6
15
<.0
01
E
duca
tion
Enr
olle
d in
mid
dle/
high
sch
ool
43%
44
%
14%
24
%
30%
H
S gr
ad16
%
19%
19
%
20%
19
%
Tra
de/te
ch d
iplo
ma
2%
4%
6%
5%
4%
(con
tinu
ed)

741
Tab
le 1
(co
nti
nu
ed)
P
ort
lan
d
San
Jo
se
Orl
and
o
Lo
uis
ville
O
vera
ll
(n
=203
)
(n=2
17)
(n
=166
)
(n=5
52)
(n
=113
8)
Ch
i-S
qu
are
d
f
p
Som
e co
llege
14%
16
%
23%
24
%
21%
2-
year
deg
ree
6%
5%
6%
7%
6%
Col
lege
gra
d9%
7%
24
%
14%
13
%
Gra
duat
e de
gree
8%
3%
5%
5%
5%
Prof
essi
onal
deg
ree
2%
1%
3%
2%
2%
1,64
8
21
<.0
01
In
com
e
<
$15,
000
17%
35
%
19%
14
%
19%
$1
5,00
0 -
$24,
999
16%
9%
8%
13
%
12%
$2
5,00
0 -
$39,
999
19%
12
%
21%
19
%
18%
$4
0,00
0 -
$59,
999
23%
13
%
25%
23
%
22%
$6
0,00
0 -
$84,
999
13%
13
%
17%
14
%
14%
$8
5,00
0 +
11%
19
%
10%
18
%
16%
1,
061
15
<
.001

742 Ferreira, Hall, and Bennett
using the individual variables age and gender. The composite variable was cre-ated, in which each value of the new variable represented an age by gender com-bination. Because age and gender have four and two levels respectively, the new variable had eight values. This new composite variable with eight targets suffices for separate analysis within each city. To allow a comparison of these eight target groups across the four targeted cities, a composite variable with 32 groups (eight target groups x four cities) were also created. These composite variables not only allow the focus of the analysis to be on the relationship between brands and tar-gets (as opposed to individual demographic characteristics), but also it allows a simple correspondence analysis to be used.
Self-Reported Brand Use. Survey respondents were asked to identify which, if any soft drink brands, from a list of 20, they had consumed in the previous two-week period. The soft drinks listed represent a variety of popular cola, noncola, diet, sport, and energy brands.
Using Correspondence Analysis to Explore Audience and Sponsor Fit
Chi-square and correspondence analyses were conducted to examine the relation-ship between brand consumption and target groups who participated in the survey. Correspondence analysis (Greenacre, 1984; Hoffman & Franke, 1986) is an exploratory data reduction method designed to portray cross-tabulated categorical data in a joint space map. The relationship between categorical variables is uncov-ered by factoring and decomposing categorical data into latent dimensions, simi-lar to principal components analyses. The results of the analysis are graphically portrayed in a low-dimensional map where similar objects (described by rows and columns as points) are plotted close together and different objects (rows and col-umns) are plotted relatively far apart. This graphical portrayal of both rows and columns in the same map is particularly useful in revealing the nature of relation-ship (or correspondence) between the objects (Bendixen, 1996). For tables of three or more variables, either multiple variables can be combined into a single composite variable (the approach used in this paper) or a generalized multivariate extension of correspondence analysis, Multiple Correspondence Analysis (MCA), can be employed (Kaciak & Louviere, 1990).
Correspondence analysis is often applied as a compositional or attribute-based approach, where respondents are asked to make direct associations between products and attributes using questions of “pick-any” type (Arimond & Elfessi, 2001; Hair, Anderson, Tatham, & Black, 1998). Many marketing and tourism-related studies have particularly employed correspondence analysis to understand the relationship between products, brands, or destinations, and their correspond-ing features or attributes (Arimond & Elfessi, 2001; Calantone, Benedetto, Hakam, & Bojanic, 1989; Hoffman & Franke, 1986; Kaciak & Louviere, 1990). However, correspondence analysis can also be used as a decompositional or attribute-free approach when product attributes are inferred from an analysis of cases-by-brands matrices of nonnegative data such as brand usage data (Elrod, 1991; Elrod & Winer, 1992). Decompositional approaches consist of measuring perceptions indirectly in such a way that they are inferred from the choices, brand uses, prefer-
Brand Positioning in a Sponsorship Context 743
ence rankings, or similarity judgments individuals make regarding brands. The most common decompositional approaches are associated with multidimensional scaling (MDS) techniques, which are often applied to judgment data (similarity or preferences) at the individual or group level (Hair et al., 1998). Martin (1994), for example, used similarity comparisons between sports to create a perceptual map of the consumer’s sport schema using MDS techniques. In addition, Milne, McDonald, Sutton, and Kashyap (1996) examined participation patterns using transformed frequency data as input for a MDS analysis. Correspondence analysis was particularly used in this paper as a decompositional approach by using self-reported brand usage data as the sampling unit for contingency tables between brands and targets.
As a data reduction technique, correspondence analysis offers at least three advantages over other methods. First, unlike any other data reduction method, correspondence analysis is particularly useful in identifying how categorical vari-ables are related by yielding a simultaneous graphical portrayal of two-way or multiway contingency tables. Second, the method is very flexible regarding data requirements, where input data can be simply dichotomous (e.g., yes/no) data, which are easier to obtain and useful when many variables (e.g., brands) are used in a study. Finally, when used as a decompositional approach to examining self-reported or actual brand usage data, the results derived from correspondence anal-ysis reveal a map that best reflects consumer preference. However, one disadvan-tage of this approach is that the interpretation of the dimensions may not be simple, relying on researchers’ previous knowledge and judgment. Further technical dis-cussion regarding correspondence analysis can be found in articles by Carroll, Green, and Schaffer (1987), Greenacre (1984, 1989), and Hoffman and Franke (1986).
In this study, simple correspondence analysis was first performed on contin-gency tables, which were formed by tabulating the frequency of self-reported brand use of twenty soft drink brands by eight consumer targets for each city sepa-rately (a total of four maps). Each cell of the contingency table contained the number of affirmative responses to the brand consumption question regarding 20 brands (e.g., dichotomous variables that indicate whether individuals consumed a brand in the last two weeks). To depict an overall relationship between brands and targets while accounting for variation across cities, a fifth preference map was developed by including a composite variable that incorporates location, yielding 32 levels (gender × age × cities). All correspondence analyses were performed using PROC CORRESP in SAS 9.1. For the sake of saving space, we have only reported the map of Louisville in detail and briefly discuss the overall map2, which contains the data from all four cities. They will be discussed in the next section.
Results
Chi-square Analysis—Relationship between Brand and Consumption
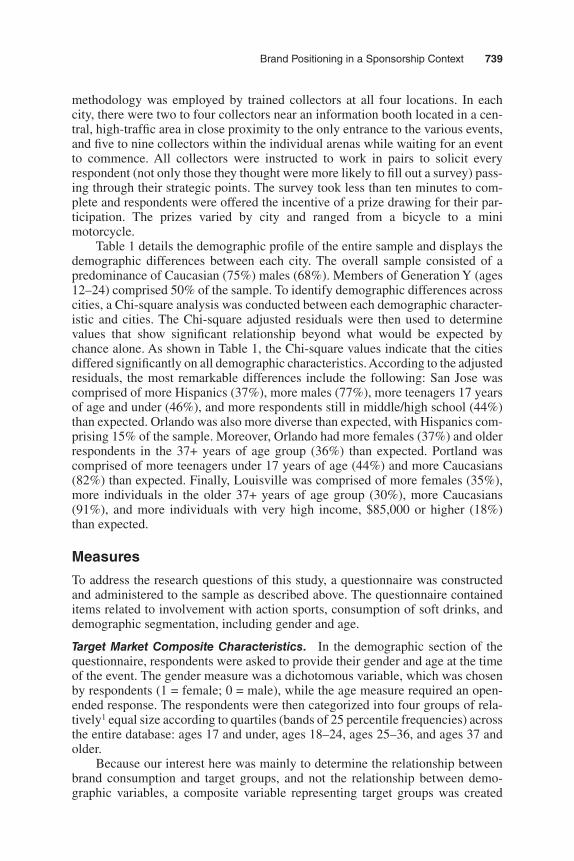
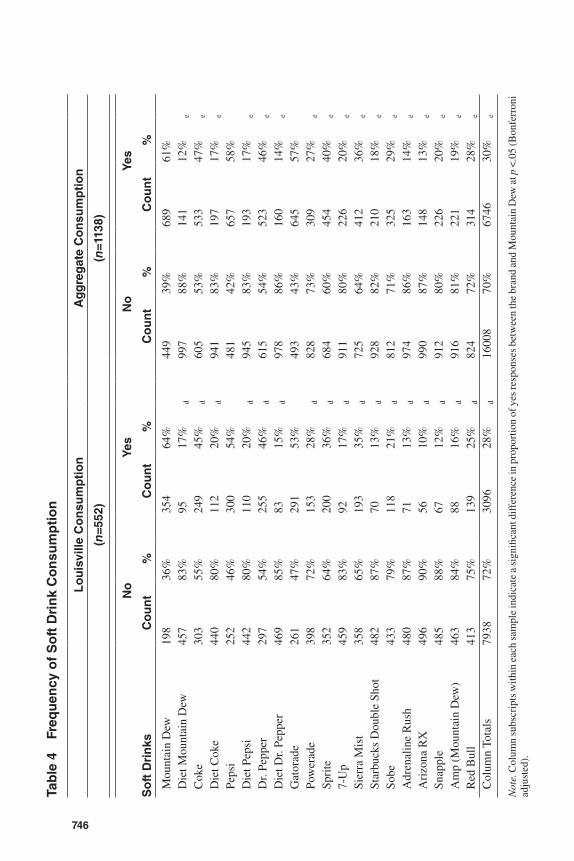
Tables 2, 3, and 4 contain the frequency of individual responses to the brand con-sumption question for each brand and for each of the four host cities. Chi-square
744
Tab
le 2
Fr
equ
ency
of
So
ft D
rin
k C
on
sum
pti
on
P
ort
lan
d C
on
sum
pti
on
San
Jo
se C
on
sum
pti
on
(n
=203
)
(n
=217
)
N
o
Yes
No
Ye
s
Soft
Dri
nks
Cou
nt%
C
ount
%
C
ount
%
Cou
nt%
M
ount
ain
Dew
7637
%
127
63%
100
46%
11
754
%
Die
t Mou
ntai
n D
ew19
094
%
136%
a
195
90%
22
10%
b
Cok
e10
049
%
103
51%
118
54%
99
46%
Die
t Cok
e17
787
%
2613
%a
18
384
%
3416
%b
Peps
i73
36%
13
064
%
83
38%
13
462
%
Die
t Pep
si17
184
%
3216
%a
18
585
%
3215
%b
Dr.
Pepp
er10
150
%
102
50%
109
50%
10
850
%
Die
t Dr.
Pepp
er17
988
%
2412
%a
18
485
%
3315
%b
Gat
orad
e80
39%
12
361
%
85
39%
13
261
%
Pow
erad
e15
074
%
5326
%a
15
571
%
6229
%b
Spri
te11
456
%
8944
%a
12
156
%
9644
%
7-U
p14
370
%
6030
%a
16
676
%
5124
%b
Sier
ra M
ist
122
60%
81
40%
a
128
59%
89
41%
Star
buck
s D
oubl
e Sh
ot15
677
%
4723
%a
15
571
%
6229
%b
Sobe
113
56%
90
44%
132
61%
85
39%
Adr
enal
ine
Rus
h16
682
%
3718
%a
17
681
%
4119
%b
Ari
zona
RX
176
87%
27
13%
a
171
79%
46
21%
b
Snap
ple
130
64%
73
36%
a
153
71%
64
29%
b
Am
p (M
ount
ain
Dew
)14
571
%
5829
%a
16
777
%
5023
%b
Red
Bul
l14
169
%
6231
%a
14
366
%
7434
%b
Col
umn
Tota
ls27
0367
%
1357
33%
a
2909
67%
14
3133
%b

Brand Positioning in a Sponsorship Context 745
analyses indicate a significant relationship between brands and consumption cat-egories (yes and no) in Portland, 2 (19, N = 203) = 561.820, p < .001, in San Jose, 2 (19, N = 217) = 467.468, p < .001, in Orlando, 2 (19, N = 116) = 492.573, p < .001, in Louisville, 2 (19, N = 552) = 1399.234, p < .001, and across all cities, 2 (19, N = 1138) = 2717.76, p < .001. Adjusted Chi-square residual values for each city and across all cities revealed a higher than expected self-reported consump-tion for Mountain Dew (residual values ranging from 6.733 to 19.353, all p < .001), Coke (residual values ranging from 4.067 to 9.148, all p < .001), Pepsi (residual values ranging from 9.063 to 14.105, all p < .001), Dr. Pepper (residual values ranging from 2.706 to 9.731, all p < .001), Gatorade (residual values rang-ing from 8.419 to 13.230, all p < .001), Sprite (residual values ranging from 3.229 to 4.704, all p < .001), and Sierra Mist (residual values ranging from 1.072 to 3.735, all p < .05, except in Orlando). Nevertheless, Chi-square residuals indi-cated a significant lower than expected consumption of all diet soft drinks (resid-ual values ranging from –8.373 to –4.168, all p < .001) and certain energy drinks,
Table 3 Frequency of Soft Drink Consumption
Orlando Consumption
(n=166)
No Yes
Soft Drinks Count % Count % Mountain Dew 75 45% 91 55%
Diet Mountain Dew 155 93% 11 7% c
Coke 84 51% 82 49%
Diet Coke 141 85% 25 15% c
Pepsi 73 44% 93 56%
Diet Pepsi 147 89% 19 11% c
Dr. Pepper 108 65% 58 35%
Diet Dr. Pepper 146 88% 20 12% c
Gatorade 67 40% 99 60%
Powerade 125 75% 41 25% c
Sprite 97 58% 69 42%
7-Up 143 86% 23 14% c
Sierra Mist 117 70% 49 30% c
Starbucks Double Shot 135 81% 31 19% c
Sobe 134 81% 32 19% c
Adrenaline Rush 152 92% 14 8% c
Arizona RX 147 89% 19 11% c
Snapple 144 87% 22 13% c
Amp (Mountain Dew) 141 85% 25 15% c
Red Bull 127 77% 39 23% c
Column Totals 2458 74% 862 26% c
746
Tab
le 4
Fr
equ
ency
of
So
ft D
rin
k C
on
sum
pti
on
L
ou
isvi
lle C
on
sum
pti
on
Ag
gre
gat
e C
on
sum
pti
on
(n
=552
)
(n
=113
8)
N
o
Yes
N
o
Yes
So
ft D
rin
ksC
ou
nt
%
Co
un
t%
Co
un
t%
C
ou
nt
%
Mou
ntai
n D
ew19
836
%
354
64%
449
39%
68
961
%
Die
t Mou
ntai
n D
ew45
783
%
9517
%d
99
788
%
141
12%
e
Cok
e30
355
%
249
45%
d
605
53%
53
347
%e
Die
t Cok
e44
080
%
112
20%
d
941
83%
19
717
%e
Peps
i25
246
%
300
54%
481
42%
65
758
%
Die
t Pep
si44
280
%
110
20%
d
945
83%
19
317
%e
Dr.
Pepp
er29
754
%
255
46%
d
615
54%
52
346
%e
Die
t Dr.
Pepp
er46
985
%
8315
%d
97
886
%
160
14%
e
Gat
orad
e26
147
%
291
53%
493
43%
64
557
%
Pow
erad
e39
872
%
153
28%
d
828
73%
30
927
%e
Spri
te35
264
%
200
36%
d
684
60%
45
440
%e
7-U
p45
983
%
9217
%d
91
180
%
226
20%
e
Sier
ra M
ist
358
65%
19
335
%d
72
564
%
412
36%
e
Star
buck
s D
oubl
e Sh
ot48
287
%
7013
%d
92
882
%
210
18%
e
Sobe
433
79%
11
821
%d
81
271
%
325
29%
e
Adr
enal
ine
Rus
h48
087
%
7113
%d
97
486
%
163
14%
e
Ari
zona
RX
496
90%
56
10%
d
990
87%
14
813
%e
Snap
ple
485
88%
67
12%
d
912
80%
22
620
%e
Am
p (M
ount
ain
Dew
)46
384
%
8816
%d
91
681
%
221
19%
e
Red
Bul
l41
375
%
139
25%
d
824
72%
31
428
%e
Col
umn
Tota
ls79
3872
%
3096
28%
d
1600
870
%
6746
30%
e
Not
e. C
olum
n su
bscr
ipts
with
in e
ach
sam
ple
indi
cate
a s
igni
fican
t dif
fere
nce
in p
ropo
rtio
n of
yes
resp
onse
s be
twee
n th
e br
and
and
Mou
ntai
n D
ew a
t p <
.05
(Bon
ferr
oni
adju
sted
).
Brand Positioning in a Sponsorship Context 747
including Amp, Arizona Rx, Starbucks Double-Shot, and Adrenaline Rush (resid-ual values ranging from –8.133 to –1.504, all p < .001, except for Amp in Portland).
As displayed in Tables 2, 3, and 4, Mountain Dew had the highest proportion of self-reported consumption (“yes” responses) in Louisville (61%), the second highest in Portland (63%), and the third highest in both San Jose (54%) and Orlando (55%). Across all cities, Mountain Dew (61%) had the highest proportion of self-reported consumption, followed by Pepsi (58%), and Gatorade (57%). To determine whether there were significant differences between the proportions of self-reported consumption for Mountain Dew and the proportions for other brands, two-tailed Z-tests for dependent proportions (Wild & Seber, 1993) were per-formed overall and for each of the four cities. Across all cities, Bonferroni adjusted results indicated a significantly higher proportion of self-reported consumption of Mountain Dew than any other brand at alpha .05 (Z tests ranging from 4.44 and 14.35, all p < .05), except when compared with the proportions of Pepsi (Z = 0.87, p = .38) and Gatorade (Z = 1.20, p = .23). Similar results were found in the Lou-isville data. Although Mountain Dew was the second or third most consumed brand in the other cities, its proportions were not statistically different than other leading brands such as Coke, Pepsi, and Gatorade. Therefore, in regard to our first question, Mountain Dew was most likely to be consumed than other leading brands, with an exception for Pepsi and Gatorade, across the entire sample and for the Louisville sample in particular.
Results of Correspondence Analyses by City
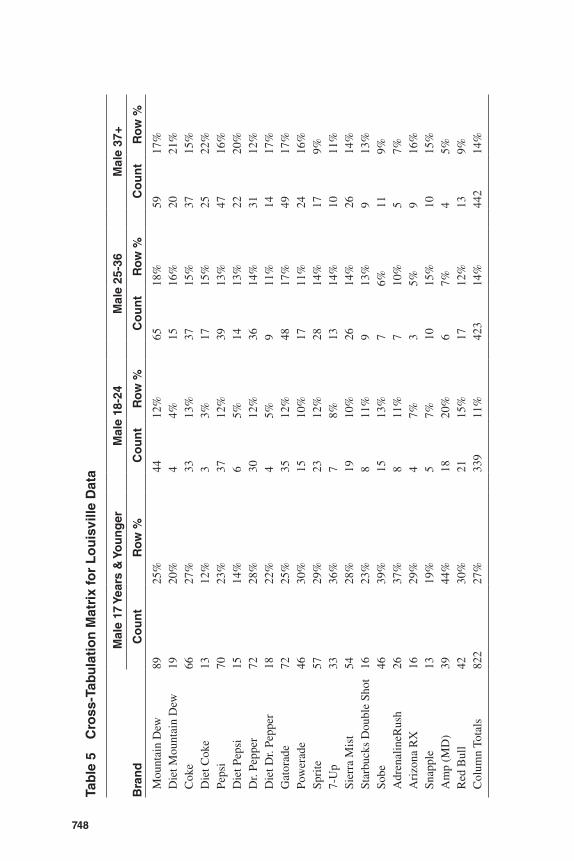
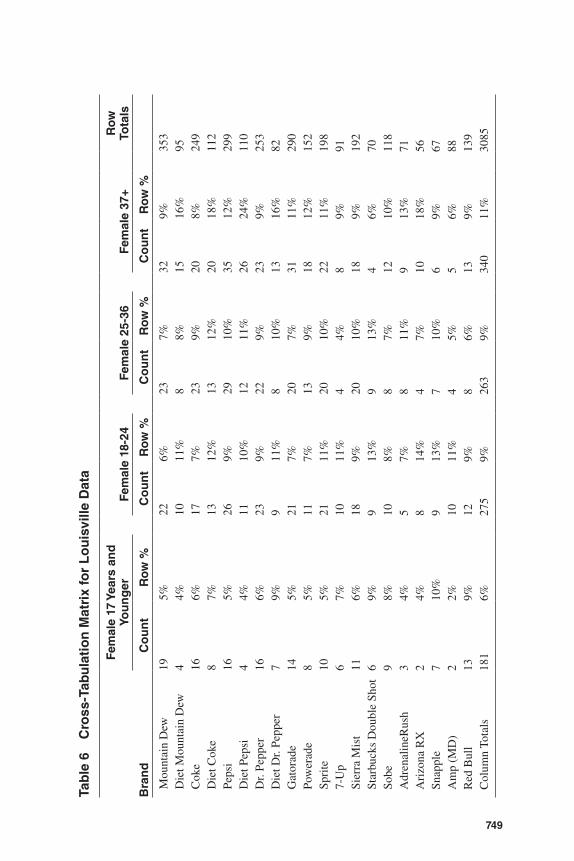
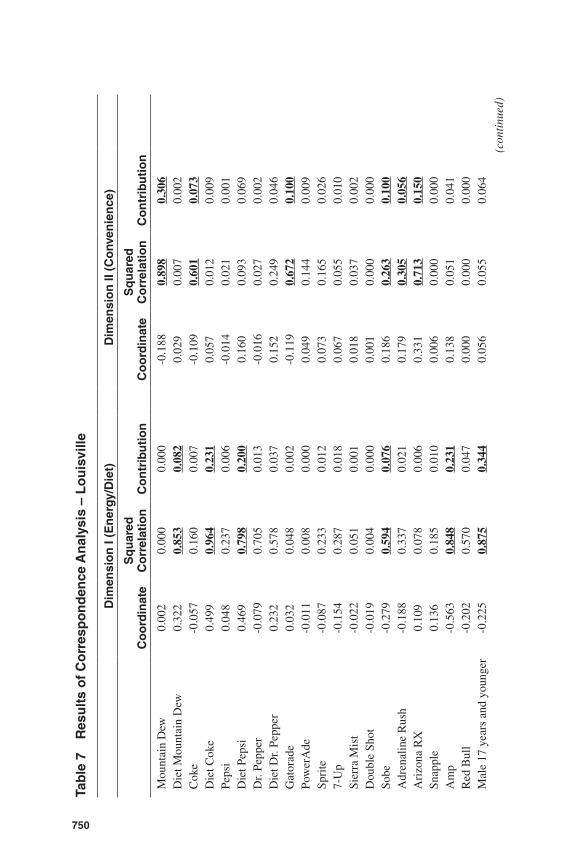
The cross-tabulation matrix used in the analysis, which relates the brands (rows) to target group categories (columns) for the Louisville sample, is displayed in Tables 5 and 6. The frequencies reported are the affirmative responses of the respective soft drink brand consumption. Table 7 shows the results of the decom-position of the matrix into dimensions that underlie the relationship between brands and target groups. There were a total of seven dimensions that recovered perfectly the data matrix. The eigenvalues for the first two dimensions accounted for cumulative proportions of inertia equal to 75.55%. Because the third dimen-sion only added to an additional 9.92% of the variance coupled with the desire to keep a low-dimensionality solution to facilitate interpretation, two dimensions were deemed appropriate for the data. As recommended by Bendixen (1996), a significant relationship between brands and targets was established by examining the Chi-square statistic and an approximation of a correlation coefficient, which is given by the square root of the trace. As suggested by Bendixen (1996), correla-tion coefficients higher than .20 were considered significant. The overall Chi-square showed that the relationship between brands and target groups was signifi-cant (2 = 213.824, df = 133, p < .001), with a correlation coefficient of .26. This result provides a partial answer to our second question indicating that a relation-ship between brand consumption and target markets exist at least for the Louis-ville sample.
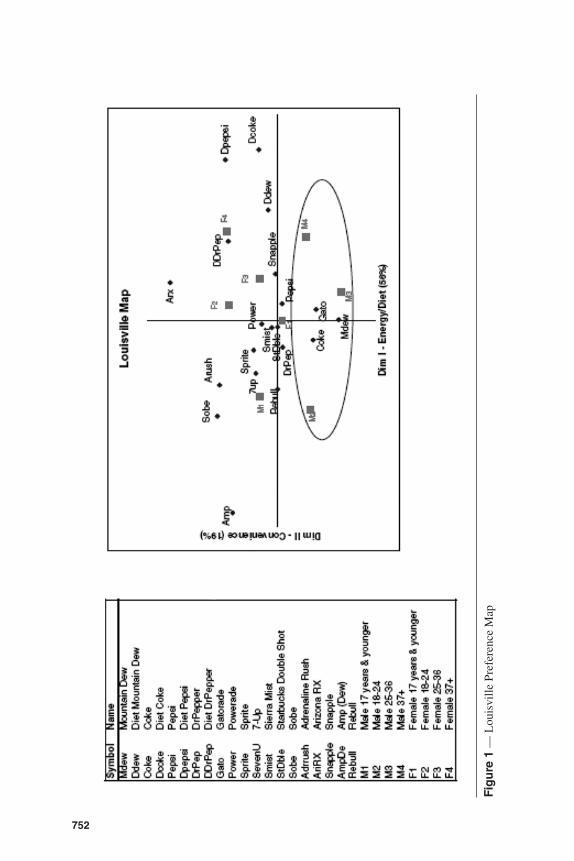
Figure 1 shows the joint display of brands and target groups in a map for Louisville. Focusing on the brands first, the figure shows four clustering of brands. Diet brands including, Diet Coke, Diet Pepsi, Diet Mountain Dew, and Diet Dr.
748
Tab
le 5
C
ross
-Tab
ula
tio
n M
atri
x fo
r L
ou
isvi
lle D
ata
Mal
e 17
Yea
rs &
Yo
un
ger
M
ale
18-2
4
Mal
e 25
-36
M
ale
37+
Bra
nd
C
ou
nt
Ro
w %
C
ou
nt
Ro
w %
C
ou
nt
Ro
w %
C
ou
nt
Ro
w %
Mou
ntai
n D
ew89
25%
44
12%
65
18%
59
17%
Die
t Mou
ntai
n D
ew19
20%
4
4%
1516
%
2021
%C
oke
6627
%
3313
%
3715
%
3715
%D
iet C
oke
1312
%
33%
17
15%
25
22%
Peps
i70
23%
37
12%
39
13%
47
16%
Die
t Pep
si15
14%
6
5%
1413
%
2220
%D
r. Pe
pper
7228
%
3012
%
3614
%
3112
%D
iet D
r. Pe
pper
1822
%
45%
9
11%
14
17%
Gat
orad
e72
25%
35
12%
48
17%
49
17%
Pow
erad
e46
30%
15
10%
17
11%
24
16%
Spri
te57
29%
23
12%
28
14%
17
9%7-
Up
3336
%
78%
13
14%
10
11%
Sier
ra M
ist
5428
%
1910
%
2614
%
2614
%St
arbu
cks
Dou
ble
Shot
1623
%
811
%
913
%
913
%So
be46
39%
15
13%
7
6%
119%
Adr
enal
ineR
ush
2637
%
811
%
710
%
57%
Ari
zona
RX
1629
%
47%
3
5%
916
%Sn
appl
e13
19%
5
7%
1015
%
1015
%A
mp
(MD
)39
44%
18
20%
6
7%
45%
Red
Bul
l42
30%
21
15%
17
12%
13
9%C
olum
n To
tals
822
27%
33
911
%
423
14%
44
214
%
749
Tab
le 6
C
ross
-Tab
ula
tio
n M
atri
x fo
r L
ou
isvi
lle D
ata
Fem
ale
17 Y
ears
an
d
You
ng
er
Fem
ale
18-2
4
Fem
ale
25-3
6
Fem
ale
37+
Ro
w
Tota
ls
Bra
nd
C
ou
nt
Ro
w %
C
ou
nt
Ro
w %
C
ou
nt
Ro
w %
Co
un
tR
ow
%
Mou
ntai
n D
ew19
5%
226%
23
7%32
9%35
3D
iet M
ount
ain
Dew
44%
10
11%
8
8%15
16%
95C
oke
166%
17
7%
239%
208%
249
Die
t Cok
e8
7%
1312
%
1312
%20
18%
112
Peps
i16
5%
269%
29
10%
3512
%29
9D
iet P
epsi
44%
11
10%
12
11%
2624
%11
0D
r. Pe
pper
166%
23
9%
229%
239%
253
Die
t Dr.
Pepp
er7
9%
911
%
810
%13
16%
82G
ator
ade
145%
21
7%
207%
3111
%29
0Po
wer
ade
85%
11
7%
139%
1812
%15
2Sp
rite
105%
21
11%
20
10%
2211
%19
87-
Up
67%
10
11%
4
4%8
9%91
Sier
ra M
ist
116%
18
9%
2010
%18
9%19
2St
arbu
cks
Dou
ble
Shot
69%
9
13%
9
13%
46%
70So
be9
8%
108%
8
7%12
10%
118
Adr
enal
ineR
ush
34%
5
7%
811
%9
13%
71A
rizo
na R
X2
4%
814
%
47%
1018
%56
Snap
ple
710
%
913
%
710
%6
9%67
Am
p (M
D)
22%
10
11%
4
5%5
6%88
Red
Bul
l13
9%
129%
8
6%13
9%13
9C
olum
n To
tals
181
6%
275
9%
263
9%34
011
%30
85
750
Tab
le 7
R
esu
lts
of
Co
rres
po
nd
ence
An
alys
is –
Lo
uis
ville
D
imen
sio
n I
(En
ergy
/Die
t)
Dim
ensi
on
II (
Co
nven
ien
ce)
C
oo
rdin
ate
Sq
uar
ed
Co
rrel
atio
nC
on
trib
uti
on
C
oo
rdin
ate
Sq
uar
ed
Co
rrel
atio
nC
on
trib
uti
on
Mou
ntai
n D
ew0.
002
0.00
00.
000
-0
.188
0.898
0.306
Die
t Mou
ntai
n D
ew0.
322
0.853
0.082
0.
029
0.00
70.
002
Cok
e-0
.057
0.16
00.
007
-0
.109
0.601
0.073
Die
t Cok
e0.
499
0.964
0.231
0.
057
0.01
20.
009
Peps
i0.
048
0.23
70.
006
-0
.014
0.02
10.
001
Die
t Pep
si0.
469
0.798
0.200
0.
160
0.09
30.
069
Dr.
Pepp
er-0
.079
0.70
50.
013
-0
.016
0.02
70.
002
Die
t Dr.
Pepp
er0.
232
0.57
80.
037
0.
152
0.24
90.
046
Gat
orad
e0.
032
0.04
80.
002
-0
.119
0.672
0.100
Pow
erA
de-0
.011
0.00
80.
000
0.
049
0.14
40.
009
Spri
te-0
.087
0.23
30.
012
0.
073
0.16
50.
026
7-U
p-0
.154
0.28
70.
018
0.
067
0.05
50.
010
Sier
ra M
ist
-0.0
220.
051
0.00
1
0.01
80.
037
0.00
2D
oubl
e Sh
ot-0
.019
0.00
40.
000
0.
001
0.00
00.
000
Sobe
-0.2
790.594
0.076
0.
186
0.263
0.100
Adr
enal
ine
Rus
h-0
.188
0.33
70.
021
0.
179
0.305
0.056
Ari
zona
RX
0.10
90.
078
0.00
6
0.33
10.713
0.150
Snap
ple
0.13
60.
185
0.01
0
0.00
60.
000
0.00
0A
mp
-0.5
630.848
0.231
0.
138
0.05
10.
041
Red
Bul
l-0
.202
0.57
00.
047
0.
000
0.00
00.
000
Mal
e 17
yea
rs a
nd y
oung
er-0
.225
0.875
0.344
0.
056
0.05
50.
064
(con
tinu
ed)

751
Tab
le 7
(co
nti
nu
ed)
D
imen
sio
n I
(En
ergy
/Die
t)
Dim
ensi
on
II (
Co
nven
ien
ce)
C
oo
rdin
ate
Sq
uar
ed
Co
rrel
atio
nC
on
trib
uti
on
C
oo
rdin
ate
Sq
uar
ed
Co
rrel
atio
nC
on
trib
uti
on
Mal
e 18
-24
-0.2
610.717
0.192
-0
.100
0.10
60.083
Mal
e 25
-36
0.08
10.
127
0.02
3
-0.1
940.731
0.388
Mal
e 37
+0.
243
0.778
0.217
-0
.086
0.09
80.081
Fem
ale
17 y
ears
and
yo
unge
r-0
.001
0.00
00.
000
-0
.014
0.00
20.
001
Fem
ale
18-2
40.
044
0.03
80.
004
0.
153
0.464
0.157
Fem
ale
25-3
60.
120
0.26
30.
031
0.
056
0.05
70.
020
Fem
ale
37+
0.25
90.617
0.189
0.
158
0.229
0.207
Tota
lPr
inci
pal I
nert
ia
(Eig
enva
lues
)0.
039
0.01
30.
052
Perc
enta
ge(T
race
)56
.41%
19
.14%
75.5
5%
752
Fig
ure
1 —
Lou
isvi
lle P
refe
renc
e M
ap
Brand Positioning in a Sponsorship Context 753
Pepper, formed one group in the upper right quadrant of the map. On the left quadrants of the map, energy brands such as AMP and Red Bull formed another group. Mountain Dew, Coke, and Gatorade formed a third group in the lower quadrants. Finally, Arizona Rx, Sobe, and Adrenaline Rush formed another group in the upper quadrants of the map. The contributions to the inertia and correlations between brands and dimensions (cosine square) shown in Table 7 were used to interpret the map. The main contributions and highest correlations highlighted in Table 7 confirm that the diet brands and Dew Amp and Red Bull were the main contributors to dimension I, and that Mountain Dew, Coke, Gatorade, Arizona Rx, and Adrenaline Rush were the main contributors to dimension II. Based on these results, we tentatively interpret the first dimension as “diet/energy” and the second as “convenience.” The labeling of the second dimension is derived from the fact that on one side of the dimension, there is a cluster of highly available and con-sumed brands, Mountain Dew, Coke, and Gatorade, and the other with niche brands such as Arizona Rx and Adrenaline Rush that are not as readily available in vending machines in schools or stores.
Also shown in Table 7, the main target groups that contributed to dimension I were male teenagers (12–17 years old) and young males (18–24 years old) stretched along the left most side of dimension I (along with the energy drinks), and older 37+ years of age males and females on the right most side of dimension I (along with diet drinks). The most important contributors to the second dimen-sion were females across different age groups positioned on the top of the map and males between 25 and 36 years of age on the bottom of the map (along with Mountain Dew, Coke, and Gatorade). Males between 18 and 24 years of age and 37 years of age and older also contributed to dimension II, but the contributions were relatively much smaller compared with males between 25 and 36 years of age. When interpreting the map displayed in Figure 1, it is important to consider the joint contributions that each individual variable makes to explain the map. For example, females 37 years of age and older contribute positively to both dimen-sions, therefore this target’s position is located at the right (along diet drinks) and upper quadrant of the map (along with niche drinks).
The title sponsor, Mountain Dew, contributes primarily to dimension II and is shown to be competing in the same preference space as Coke and Gatorade. Its consumption (along with the consumption of Coke and Gatorade) was reported to be more strongly associated with males between 25 and 36 years of age who attended the Louisville event. Therefore, as a response to our third question, these results indicate that Mountain Dew was “better” positioned toward the adult male market (25–36 years old), along with Coke and Gatorade, than other brands for the Louisville sample. On the other hand, energy drinks seem to be better posi-tioned toward the teenager market (17 years of age & younger) and young adults (18–24 years old), while the diet drinks tend to be better positioned to females and older adults. Given this scenario, it is not surprising to see Mountain Dew brand extensions, AMP and Diet Mountain Dew, filling the gaps to reach the teenager, younger adults, and female target markets in Louisville.
The analysis of the data gathered in the other three cities of Portland, Orlando, and San Jose showed mixed results regarding the relationship between brands and target groups. While the correlation coefficients showing dependency between brands and targets were above .28 for each city, the Chi-square statistics were not

754 Ferreira, Hall, and Bennett
significant (2 values ranging from 110.72 to 116.88, df ranging from 112 to 133, p > .83). For comparative purposes, Pearson correlations between the four city maps for dimensions I and II derived from a correspondence analysis were com-puted. Results showed consistency across maps in how brands were positioned along dimension I: energy on one extreme and diet drinks on the other extreme (Mountain Dew generally centrally located). Pearson correlation coefficients were higher than .58 for brand locations on dimension I between maps. However, results were inconsistent in regard to dimension II as evidenced by low correla-tions between the maps.
Results of Correspondence Analysis Across Cities
To derive an overall picture of the relationships between brands and targets accounting for the variation across cities, a preference map was developed using a composite variable that represented any gender, age, and city combination (32 levels). This map required a new level of analysis beyond the one conducted for each city separately. The most striking benefit of this overall map is the identifica-tion of the locations in which the brand-target relationships are stronger. Because the map is much more complex than the ones within each city, it is up to the ana-lyst to decide whether the contrasts by location overcome the added complexity and difficulty of interpretation.
The overall map is displayed in Figure 2. To avoid clutter, only the targets with most contributions to the map were plotted along with the brands. The Chi-square showed that the relationship between brands and target groups was signifi-cant (2 = 738.195, df = 589, p < .001). The eigenvalues for the first two dimen-sions accounted for cumulative proportions of inertia equal to 53.94%.
With a close resemblance to the map for Louisville, the overall map shows four clusters of brands. The first cluster of diet brands included, Diet Coke, Diet Pepsi, and Diet Dr. Pepper, in the upper right quadrant of the map (although not in the upper quadrant, Diet Mountain Dew is also on the far right side of the map). On the left side along dimension I, energy brands such as AMP, Sobe, and to a lesser extent Adrenaline Rush and Red Bull formed another group. Mountain Dew and Coke3 formed a third group in the lower right quadrant. Finally, on the upper left quadrant, Snapple, Starbucks Double Short, Sobe and Arizona RX formed the fourth group. The contributions to the inertia and correlations between brands and dimensions (cosine square) confirm that the diet brands and Dew Amp were the main contributors to dimension I, and Mountain Dew, Coke, and Snapple were the main contributors to dimension II.
It is important to understand that the analysis across cities may present differ-ent results from the analysis by city because a different contingency table is used (with new row and column totals). This implies that if a relationship between a particular target and a brand may be higher (lower) than expected for one particu-lar city, the relationship would not necessarily be higher (lower) than expected when other cities are considered. While the relationship between brands and tar-gets were not significant for three cities when examined separately, many relation-ships between brands and targets were higher than expected when considering the entire data set. For example, females across different age groups in San Jose and Portland were major contributors to dimension II and were positioned on the top

755
Fig
ure
2 —
Ove
rall
Pref
eren
ce M
ap
756 Ferreira, Hall, and Bennett
quadrants of the map along with niche drinks such as Snapple, Sobe, and Star-bucks Double Shot. Males 24 years of age and younger in San Jose and Portland were major contributors of dimension I and were positioned on the far left of the map along with Amp, Adrenaline Rush, and Red Bull. Males 36 years of age and younger in Louisville and older males 37+ years of age in Orlando were major contributors of dimension II and positioned at the lower quadrants of the map along with Mountain Dew and Coke. Finally, older males and females 25+ years of age in Louisville were major contributors of dimension I and positioned on the right quadrants of the map along with the diet drinks. When all cities are consid-ered, Mountain Dew as the title sponsor was shown to be more positioned to male targets especially in Louisville as evidenced by the attendees’ reported behavior. Mountain Dew Amp was better positioned for young audiences especially in Port-land and Diet Mountain Dew to older adults of both genders in Louisville.
Discussion
Sponsorship of sporting, entertainment, and art events has been used to accom-plish many marketing objectives. Prominent marketing objectives that have received considerable research attention include brand awareness, brand image and image transfer, and ROI (Gardner & Shuman, 1987; Gwinner, 1997; Meen-aghan, 1991; Pruitt, Cornwell, & Clark, 2004). One of the main advantages that sponsorship offers over more traditional marketing tools is the ability to focus on specific target markets (Gardner & Shuman, 1987), which are often comprised of prospects who are emotionally invested in the sponsored event. After selecting attractive target markets, corporations then select marketing communications tools that will presumably best reach and potentially persuade the desired mar-kets. Thus, it is important to gain an understanding of the role sponsorship can play in positioning a brand.
This research has used correspondence analysis to discern Mountain Dew’s positioning relative to competing brands in key target markets (young and male audiences) of the Dew Action Sports Tour. As stated in the results section of this study, correspondence analysis was shown to be effective in explaining self-reported brand use based on latent benefits of soft drinks. The resulting preference map based on the entire data showed that Mountain Dew has successfully posi-tioned itself to male segments only in Louisville, one of the four cities examined. There are at least a few explanations for the findings. First, the results suggest that heterogeneous tastes and perceptions among target markets may exist in vastly different geographical locations of the events. The data in Tables 2, 3, and 4 sup-port at least differences in demographic profiles by city. Therefore, the fact that Mountain Dew tends to be more strongly associated with young and adult males in Louisville does not necessarily mean that Mountain Dew tends to be more strongly associated with the same targets in different locations of the country. Second, it is also plausible to think that the effectiveness of Mountain Dew spon-sorship activations may depend on regional differences. For example, signage, symbols, and announcements may be more or less appealing depending on regional differences (e.g., some cities may be more conservative than others,
Brand Positioning in a Sponsorship Context 757
hence the appropriateness of language, jargon, and accents may differ across regions). Furthermore, as the events were held in different facilities, preexisting signage in the venues may have created differing levels of clutter when activating the brand at different locations (although the activations were similar across events). Finally, since Chi-square analysis can be sensitive to sample size, these results could also be attributed to differences in sample sizes between these cities.
One theoretical implication of the findings is that sponsorship effectiveness can be dependent on the context. That is, the degree to which an intended relation-ship is achieved may directly depend on the context within which the relationships operate. In the context of sponsorship, the geographical location, vicinity, attend-ees, culture, etc., may all influence positioning. Keller (1993) suggests that brand image is formed and influenced by any contact a person has with a brand. Further-more, whether a brand should position itself the same way in different regions is also an important consideration. In this regard, the decision of standardization across regions is a consideration similar (but perhaps to a lesser extent) to the internationalization of the brand in different countries (Bagozzi et al., 1998).
The results from correspondence analysis were consistent with multiattribute theory (Ajzen & Fishbein, 1980; Edwards & Barron, 1994; Keeney & Raiffa, 1976), which portrayed overall preference for soft drink brands as a function of desired benefits derived from consumption, including energy, diet, and conve-nience. Therefore, self-reported consumption was explained by the attributes that products possessed and the benefits individuals derive from the attributes. In addi-tion, the possibility of graphically portraying brands and target markets in the same preference map provided a way to assess audience and brand fit. Therefore, correspondence analysis along with the resulting preference map was useful as a form of sponsorship evaluation. With the analysis based on self-reported brand use, results actually became more relevant and realistic since it was based on indi-viduals’ self-reported behavior as opposed to individuals’ self-reported intentions. Such mapping not only shows the consumer characteristics associated with con-sumption of the sponsoring brand, but also includes the portrayal of competitor positioning, which can be useful in planning future sponsorship and positioning strategies.
Managerial Implications
The results of this study offer managerial implications in three key areas: sponsor-ship renewals, new strategies, and brand management. Regarding sponsorship renewals, as is witnessed by the sheer frequency of self-reported consumption, the Mountain Dew brand has been relatively successful in accomplishing its position-ing strategy in the venues of the Dew Action Sports Tour sponsorship activities where data were collected. The analysis across cities shows that Mountain Dew is most successfully positioned toward male consumers in Louisville. Based on these results, managers must evaluate whether their sponsorship objectives have been met, whether renewals should take place, and what new objectives should be set. According to Hein (2007b), although the Dew Action Sports Tour will most likely continue, Mountain Dew may change its “extreme” positioning strategy in

758 Ferreira, Hall, and Bennett
the near future to something new or not-so-extreme because of confusion in the marketplace. Such consideration shows that Mountain Dew’s managers are not completely satisfied with its current positioning strategy.
In addition to sponsorship renewals, managers may be concerned with brand management and strategic issues for a couple of reasons. Firstly, it is reported that in using action sports to reach target markets, Mountain Dew is aiming to attract young consumers. The results show that the youngest age group of respondents (17 years and younger) is more closely associated with energy drinks than with the popular soft drinks. Mountain Dew managers may want to reconsider the methods used to reach this target if it is indeed the objective. The fact that Moun-tain Dew AMP is more strongly associated with the teen segment indicates that Mountain Dew may prefer to position for older age groups to avoid cannibaliza-tion. Secondly, it is requisite that the positions of competing soft drinks be consid-ered. As seen on the aggregate data preference map, Mountain Dew shares similar preference space to Coca-Cola, Powerade, and Gatorade. Acknowledging which brands Mountain Dew is mostly competing with for this target market can aid brand managers in formulating future sponsorship activities. Finally, managers may also consider regional differences when planning activation if costs associ-ated with customization are not prohibitive.
Limitations and Future ResearchThere are at least four limitations to this study that are important to highlight. First, this study was susceptible to the problems associated with any field study. In field studies, the ability to control for factors that could explain the differences found between cities is limited. Hence, differences in taste, activation effective-ness, facilities, geographic and economic conditions can all be associated and provide partial explanations for the findings. However, the analysis was useful to generate possible hypotheses for the lack of consistency across cities that can be further explored in future research endeavors. Second, the study was also limited to a series of events within one sport category, action sports, and its relationship with the soft drink category. Third, observations were obtained by asking respon-dents to report their brand usage by picking any soft drinks they have consumed for the past two weeks. Although self-reported data are useful and easy to collect, they may be subjected to inaccuracies. Given the effortless task associated with “picking” brands, we perceive that the advantages of this type of data overcome its disadvantages. The alternative would be to obtain real purchase information (secondary data). However, secondary data are not error-free and can be very expensive, especially if additional primary research is needed to link action sports attendance behavior to purchase data. Assuming the cost is not an issue and sec-ondary data are available, secondary data can be used to complement field studies. Winer (1999) highlights the importance of combining data sources and offers three examples of how scanner data can be used to externally validate the studies conducted in laboratory settings. Finally, the analysis ignored the dynamic nature of positioning. Future studies should attempt to capture changes of positioning over time and correlate these changes to managerial and marketing variables. This may also lead for example to the employment of preexperimental designs such as
Brand Positioning in a Sponsorship Context 759
pretest-posttest or quasi-experiments such as the time-series design (Campbell & Stanley, 1963) to assess the impact of the sponsorship. Therefore, comparing the positioning from the inaugural tours to the following years can show how posi-tioning can evolve over time, and if expenditures and activations between this year and the following year are tracked, a more sophisticated model can be built to better isolate the effects of sponsorship.
Nevertheless, this study provided an exploration of the relationship between an event sponsor, its competitors, and the effectiveness of acquiring consumers from the desired target market through exposure to the sponsorship. Self-reported brand use showed that the event sponsor was among the top three brands con-sumed in each of the four cities where data were collected and the most consumed brand overall. Correspondence analysis indicated that consumers differentiated 20 soft drink brands based on energy, diet, and convenience attributes. Based on proximity of the target market to the sponsoring brand, it appears that Mountain Dew has been relatively effective in using sponsorship to position the brand with the intended target market in at least one of the cities examined.
Notes
1. In 2008, MTV Networks Music Group has also partnered with NBC to expand the tour, and a winter tour has been added as an additional property. The tour has also rebranded as AST (Action Sports Tour) Dew Tour.
2. The groups were not entirely equal in size because instead of using the age of 16 as the cutoff for the first quartile, we used 17 to particularly separate teenagers under age from young adults. The cutoff ages for equal groups were 16, 24, and 36. Despite this cutoff, the analysis was not substantially altered using either 16 or 17 years of age as the cutoff age.
3. Those interested can contact the authors to obtain preference maps of other individual cities.
4. Although Powerade and Gatorade are also in the lower quadrants, their contribution to dimensions I and II are small.
ReferencesAaker, D.A., & Shansby, J.G. (1982). Positioning your product. Business Horizons, 25(3),
36–62.Arimond, G., & Elfessi, A. (2001). A clustering method for categorical data in tourism
market segementation research. Journal of Travel Research, 39(4), 391–397.Ajzen, I., & Fishbein, M. (1980). Understanding attitudes and predicting social behavior.
Englewood Cliffs, NJ: Prentice-Hall Inc.Bagozzi, R.P., Rosa, J.A., Celly, K.S., & Coronel, F. (1998). Marketing management.
Upper Saddle River, NJ: Prentice Hall.Bendixen, M. (1996). A practical guide to the use of correspondence analysis in marketing
research. Marketing Bulletin Online, 14, Technical Note 2, 16-38.Bennett, G., & Lachowetz, T. (2004). Marketing to Lifestyles: Action sports and Genera-
tion Y. Sport Marketing Quarterly, 13, 239–243.Calantone, R.J., Benedetto, C.A., Hakam, A., & Bojanic, D.C. (1989). Multiple multina-
tional tourism positioning using correspondence analysis. Journal of Travel Research, 28(2), 25–32.

760 Ferreira, Hall, and Bennett
Campbell, D.T., & Stanley, J.C. (1963). Experimental and quasi-experimental designs for research. Hopewell, NJ: Houghton Mifflin Company.
Carroll, J.D., Green, P.E., & Schaffer, C.M. (1987). Comparing interpoint distances in cor-respondence analysis: A clarification. JMR, Journal of Marketing Research, 24(4), 445–450.
Cliffe, S.J., & Motion, J. (2005). Building contemporary brands: A sponsorship-based strategy. Journal of Business Research, 58(8), 1068–1077.
Cornwell, T.B., Weeks, C.S., & Roy, D.P. (2005). Sponsorship-linked marketing: Opening the black box. Journal of Advertising, 34(2), 21–42.
Edwards, W., & Barron, F.H. (1994). SMARTS and SMARTER: Improved simple methods for multiattribute utility measurement. Organizational Behavior and Decision Pro-cesses, 60(3), 306–325.
Elrod, T. (1991). Internal analysis of market structure: Recent developments and future prospects. Marketing Letters, 2(3), 253–266.
Elrod, T., & Winer, R. (1992, August). An Empirical comparison of mapping methods based on panel data. Unpublished Manuscript, Faculty of Business, University of Alberta, Edmonton.
Fennell, G., & Allenby, G.M. (2004). An integrated approach: Market definition, market segmentation, and brand positioning create a powerful combination. Marketing Research, 16(4), 28–34.
Fennell, G., Allenby, G., Yang, S., & Edwards, Y. (2003). The effectiveness of demographic and psychographic variables for explaining brand and product category use. Quantita-tive Marketing and Economics, 1, 223–244.
Gardner, M.P., & Shuman, P.J. (1987). Sponsorship: An important component of the pro-motions mix. Journal of Advertising, 16(1), 11–17.
Gladden, J., & McDonald, M. (2006). Alternative global avenues: Action sports and events. In J. Amis & T.B. Cornwell (Eds.), Global Sport Sponsorship (pp. 191–206). Oxford, NY: Berg.
Green, C., & Muller, T. (2002). Positioning a youth sport camp: A brand-mapping exercise. Sport Management Review, 5, 179–200.
Greenacre, M.J. (1984). Theory and Application of Correspondence Analysis. London: Academic Press.
Greenacre, M.J. (1989). The Geometric interpretation of correspondence approach. Jour-nal of the American Statistical Association, 82, 437–447.
Gwinner, K. (1997). A model of image creation and image transfer in event sponsorship. International Marketing Review, 14(3), 145–158.
Hair, J.F., Anderson, R.E., Tatham, R.L., & Black, W.C. (1998). Multivariate data analysis. Upper Saddle River, NJ: Prentice Hall.
Halliday, J. (2004). Honda does a Volvo, plays on safety. Advertising Age, 75(36), 3–4.Hein, K. (2007a). PepsiCo puts the pop in pop culture. Brandweek, 48(17), 4.Hein, K. (2007b). Not so extreme: Dew retooling image. Brandweek, 47(39), 6.Hoffman, D.L., & Franke, G.R. (1986). Correspondence Analysis: Graphical representa-
tion of categorical data in marketing research. JMR, Journal of Marketing Research, 23(3), 213–227.
Holt, D. (2003). What becomes an icon most? Harvard Business Review, 81(3), 43–49.Howard, D.R., & Crompton, J.L. (2004). Financing Sport. Morgantown, WV: Fitness
Information Technology, Inc.IEG (International Event Group). (1999). IEG’s Complete Guide to Sponsorship: Every-
thing You Need to Know about Sports, Arts, Event, Entertainment, and Cause Market-ing. Chicago, IL: IEG, Inc.
IEG (International Event Group). (2004). IEG Sponsorship Report. Chicago: IEG, Inc.Kaciak, E., & Louviere, J. (1990). Multiple correspondence analysis of multiple choice
experiment data. JMR, Journal of Marketing Research, 27, 455–465.
Brand Positioning in a Sponsorship Context 761
Kardes, F. (1998). Consumer Behavior & Managerial Decision Making. Reading, MA: Addison-Wesley Educational Publishers, Inc.
Kates, S.M., & Goh, C. (2003). Brand morphing. Journal of Advertising, 32(1), 59–68.Keller, K.L. (1993). Conceptualizing, measuring, and managing customer-based brand
equity. Journal of Marketing, 57, 1–22.Keller, K.L., & Aaker, D.A. (1992). The effects of sequential introduction of brand exten-
sions. JMR, Journal of Marketing Research, 29(1), 35–50.Keeney, R.L., & Raiffa, H. (1976). Decisions with multiple objectives: preferences and
value tradeoffs. New York: Wiley.Lippert, B. (2003). Child’s play. Adweek, 44(17), 36.Martin, J.H. (1994). Using a perceptual map of the consumer’s sport schema to help make
sponsorship decisions. Sport Marketing Quarterly, 3(3), 27–33.McCarthy, M. (2001, August 14). ESPN’s promotion of X Games goes to extremes.
USA Today. Retrieved December 11, 2007, from http://www.usatoday.com/money/advertising/2001-08-14-xgames.htm
Meenaghan, T. (1991). The role of sponsorship in the marketing communications mix. International Journal of Advertising, 10, 35–47.
Meenaghan, T. (2001). Understanding sponsorship effects. Psychology and Marketing, 18(2), 95–122.
Milne, G.R., McDonald, M.A., Sutton, W.A., & Kashyap, R. (1996). A niche-based evalua-tion of sport participation patterns. Journal of Sport Management, 10(4), 417–434.
Mullman, J. (2006). Miller puts the gruff back into High Life. Advertising Age, 77(42), 3–4.
Nicholls, J.A.F., Roslow, S., & Dublish, S. (1999). Brand recall and brand preference at sponsored golf and tennis tournaments. European Journal of Marketing, 33(3), 365–387.
Pracejus, J.W. (2004). Seven psychological mechanisms through which sponsorship can influence consumers. In L.R. Kahle & C. Riley (Eds.), Sports marketing and the psy-chology of marketing communication (pp. 175–189). NJ: Lawrence Erlbaum Associ-ates, Inc.
Pracejus, J.W., & Olsen, G.D. (2004). The role of brand/cause fit in the effectiveness of cause-related marketing campaigns. Journal of Business Research, 57(6), 635–640.
Pruitt, S.W., Cornwell, T.B., & Clark, J.M. (2004). The NASCAR phenomenon: Auto racing sponsorships and shareholder wealth. Journal of Advertising Research, 44(3), 281–296.
Ries, A., & Trout, J. (1986). Positioning: The battle for your mind. NY: McGraw-Hill.Speed, R., & Thompson, P. (2000). Determinants of sports sponsorship response. Journal
of the Academy of Marketing Science, 28, 226–238.Wild, C.J., & Seber, G.A. (1993). Comparing two proportions from the same survey. The
American Statistician, 47(3), 178–181.Winer, R.S. (1999). Experimentation in the 21st century: The importance of external valid-
ity. Journal of the Academy of Marketing Science, 27(3), 349–358.