Embed Size (px)
Citation preview
Portland State University Portland State University
PDXScholar PDXScholar
Master of Environmental Management Project Reports Environmental Science and Management
5-2010
Exploring Mitigation Options to Reduce Vehicle-Exploring Mitigation Options to Reduce Vehicle-
caused Mortality for the Oregon Silverspot Butterfly, caused Mortality for the Oregon Silverspot Butterfly,
Speyeria zerene hippolyta, along Highway 101 at the Speyeria zerene hippolyta, along Highway 101 at the
Siuslaw National Forest Siuslaw National Forest
Sara B. Zielin Portland State University
Follow this and additional works at: https://pdxscholar.library.pdx.edu/mem_gradprojects
Part of the Entomology Commons, and the Environmental Sciences Commons
Let us know how access to this document benefits you.
Recommended Citation Recommended Citation Zielin, Sara B., "Exploring Mitigation Options to Reduce Vehicle-caused Mortality for the Oregon Silverspot Butterfly, Speyeria zerene hippolyta, along Highway 101 at the Siuslaw National Forest" (2010). Master of Environmental Management Project Reports. 15. https://pdxscholar.library.pdx.edu/mem_gradprojects/15 https://doi.org/10.15760/mem.23
This Project is brought to you for free and open access. It has been accepted for inclusion in Master of Environmental Management Project Reports by an authorized administrator of PDXScholar. Please contact us if we can make this document more accessible: [email protected].
ii
Exploring mitigation options to reduce vehicle-caused
mortality for the Oregon Silverspot Butterfly, Speyeria zerene hippolyta, along Highway 101 at the
Siuslaw National Forest
Prepared by: Sara B. Zielin, Master of
Environmental Management Student,
Portland State University
May 2010
iii
Acknowledgements
I would like to thank my committee, Catherine E. de Rivera, Sandra L. Jacobson, and
Winston P. Smith for supporting me throughout the development and fruition of this project. I
would also like to thank Paul Hammond, Anne Walker, and Mike Patterson for offering their
generous support and expertise especially during my summer field research. I would like to
thank USDA Forest Service employees from the Siuslaw National Forest including Paul G.
Thomas, Randy Miller, and Melissa Shelley for providing support while working out of the
Waldport office. I would like to thank my lab members for being extremely helpful during
several brainstorming sessions related to this project. One of the most appreciated thanks goes to
Chris Parker and „groupo uno‟ for holding my hand through several of the statistical analyses.
Last, I would like to thank the funders of this project: Portland State University (PSU) and the
U.S.D.A. Forest Service. PSU provided my summer stipend via the faculty enhancement grant
awarded to Catherine E. de Rivera and the USDA Forest Service, Siuslaw National Forest and
Pacific Northwest Research Station, provided housing as well as field support.

iv
Table of Contents
LIST OF FIGURES ................................................................................................................ VI
LIST OF TABLES ................................................................................................................ VII
LIST OF APPENDICES ........................................................................................................ VIII
1.0 INTRODUCTION ................................................................................................................. 1
2.0 BACKGROUND................................................................................................................... 5
LIFE HISTORY AND HABITAT REQUIREMENTS ....................................................................... 5
HABITAT AND POPULATION MANAGEMENT HISTORY ............................................................ 6
HIGHWAY 101 AND TRAFFIC ................................................................................................ 8
MITIGATION TYPES .............................................................................................................. 8
QUESTIONS ADDRESSED IN THIS STUDY ............................................................................... 11
3.0 METHODS ......................................................................................................................... 14
SITE LOCATION .................................................................................................................. 14
STUDY DESIGN .................................................................................................................. 15
SAMPLING SURVEYS .......................................................................................................... 16
ROAD-MEADOW COMPARISONS: INSTANTANEOUS SCAN SURVEY ..................................... 17
DETECTION PROBABILITY IN MEADOW ............................................................................ 18
INTER-OBSERVER RELIABILITY ........................................................................................ 19
ALL OCCURRENCE SAMPLING FOR OSBS IN ROAD PLOTS ................................................ 19
OPPORTUNISTIC SAMPLING ............................................................................................. 21
VEGETATION SURVEYS ................................................................................................... 21
STATISTICAL ANALYSES .................................................................................................... 22
INSTANTANEOUS SCAN ................................................................................................... 24
FLASHING SPEED REDUCTION SIGN ................................................................................. 25
EARTHEN BERM (REMOVAL OR ADDITION) – ROAD-CUT ANALYSIS ................................. 27
VEGETATION MANIPULATION – ROAD-SIDE VEGETATION ANALYSIS ................................ 27
MEADOW FLOWERING PLANTS ..................................................................................... 27
ROAD FLOWERING PLANTS .......................................................................................... 27
4.0 RESULTS ........................................................................................................................... 28
ROAD MORTALITY ............................................................................................................ 28
ENVIRONMENTAL PARAMETERS OF OSB FLIGHT ................................................................ 29
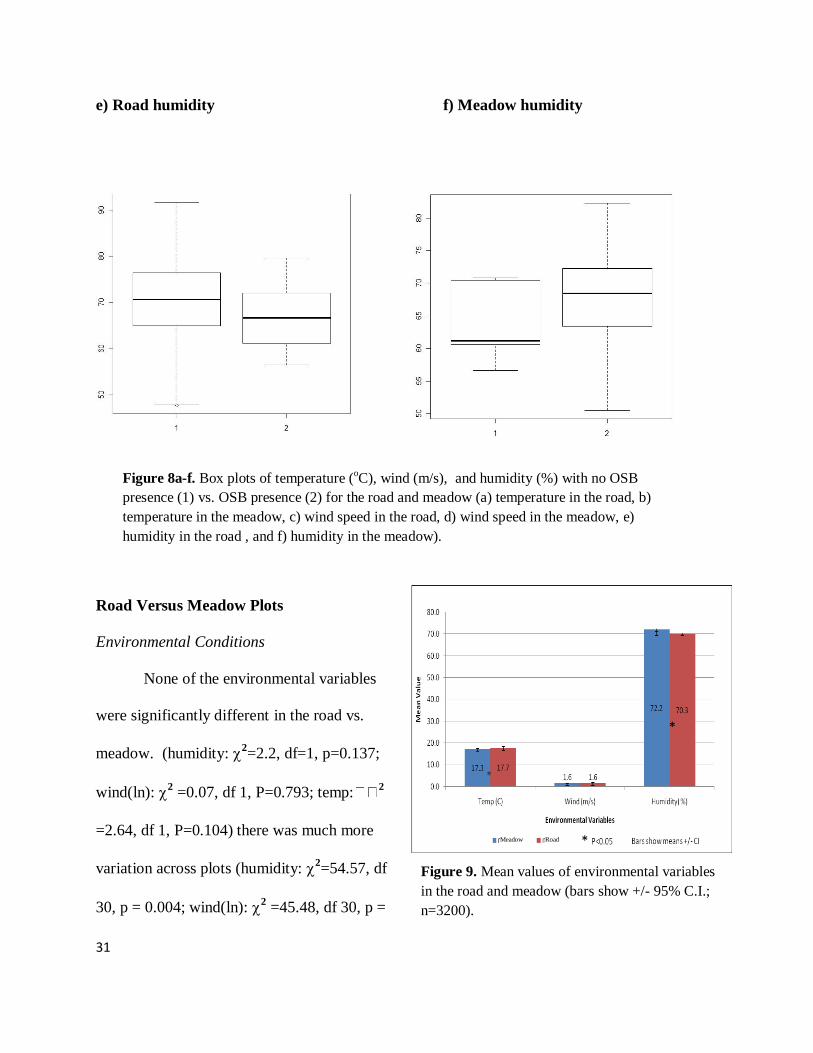
ROAD VERSUS MEADOW PLOTS ........................................................................................ 31
ENVIRONMENTAL CONDITIONS ....................................................................................... 31
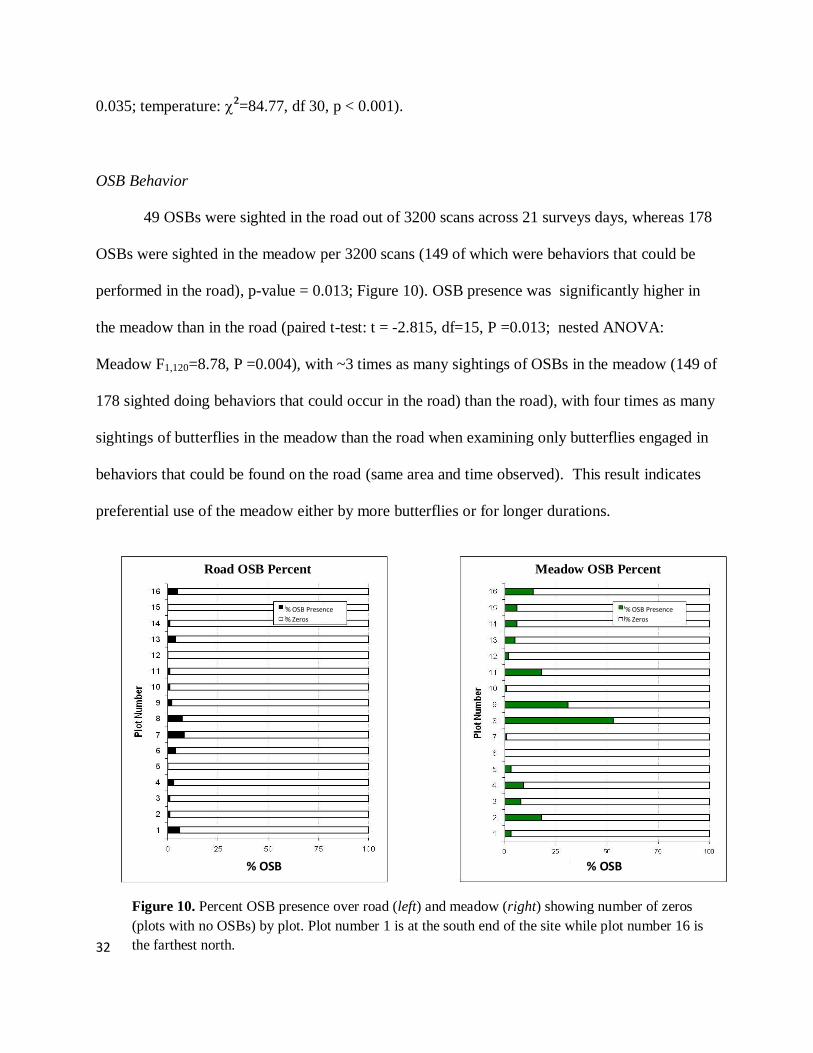
OSB BEHAVIOR ............................................................................................................. 32
ASSESSMENT OF OSB MOVEMENT IN PLOTS 7 AND 8 ...................................................... 34
v
DIFFERENCES BETWEEN ROAD SECTIONS ........................................................................... 36
OVERALL RESULTS FOR ALL OCCURRENCE SURVEYS ..................................................... 36
BARRIER INSTALLATION AND EARTHEN BERMS ................................................................... 37
AREAS OF ROAD CROSSED MOST – INFORMING BARRIER INSTALLATION ......................... 37
AREAS OF ROAD CROSSED MOST – INFORMING EARTHEN BERMS .................................... 38
DIFFERENCES IN ENVIRONMENTAL CONDITIONS AMONG ROAD SECTIONS – INFORMING
EARTHEN BERMS ............................................................................................................ 38
DIFFERENCES IN FLOWER AVAILABILITY ........................................................................... 39
FLOWER IN THE MEADOW .............................................................................................. 39
FLOWERS ALONG THE ROAD .......................................................................................... 39
OSB PRESENCE/ABSENCE VERSUS ENVIRONMENTAL CONDITIONS ..................................... 40
5.0 DISCUSSION OF PRIORITIZED MITIGATION TYPES AND MANAGEMENT
SUGGESTIONS ...................................................................................................................... 43
VEGETATION MANIPULATION – HIGH PRIORITY .................................................................. 43
MANAGEMENT SUGGESTIONS .......................................................................................... 45
BARRIER INSTALLATION – HIGH TO MODERATE PRIORITY ................................................... 46
MANAGEMENT SUGGESTIONS .......................................................................................... 49
FLASHING SPEED REDUCTION SIGNAL – MODERATE PRIORITY ............................................ 50
ROAD-KILL ANALYSIS ..................................................................................................... 54
MANAGEMENT SUGGESTIONS .......................................................................................... 56
EARTHEN BERMS – LOW AND HIGH PRIORITY ..................................................................... 57
MANAGEMENT SUGGESTIONS .......................................................................................... 60
POTENTIAL RISKS OF MITIGATIONS SUGGESTIONS .............................................................. 60
7.0 CONCLUSION ................................................................................................................... 61
FUTURE RESEARCH ............................................................................................................ 62
8.0 LITERATURE CITED ........................................................................................................ 63
9.0 APPENDICES ............................................................................................................... 68-85
vi
List of Figures
Figure 1. OSB distribution within Oregon State and Rock Creek – Big Creek locator map
Figure 2. Photo of road-cut area at Rock Creek – Big Creek site
Figure 3. Schematic of study site
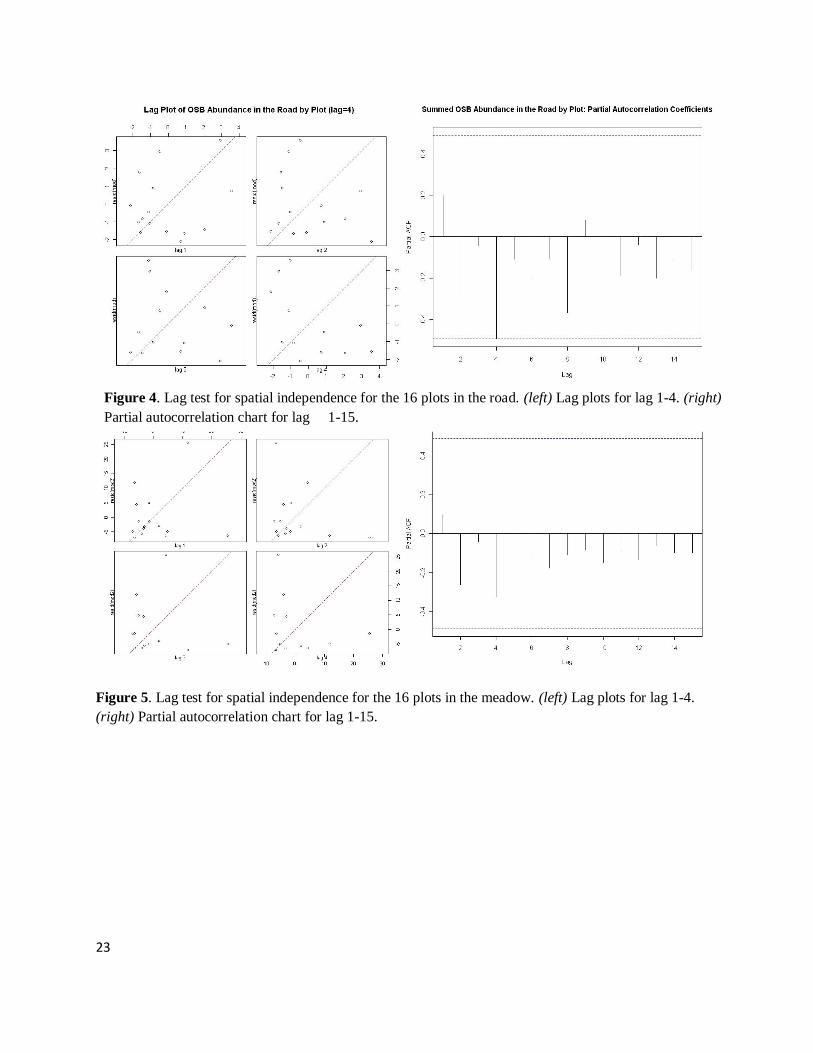
Figure 4. Lag test for spatial independence for the 16 plots in the road
Figure 5. Lag test for spatial independence for the 16 plots in the meadow
Figure 6. Correlation matrix of OSB presence and environmental variables
Figure 7. Vehicle and OSB interactions
Figure 8. Box plots of environmental variables when no OSB vs. OSB presence
Figure 9. Mean values of environmental variables in the road and meadow
Figure 10. Percent OSB presence over road and meadow showing number of zeros by plot
Figure 11. Total number of OSBs by behavior type in the road vs. meadow
Figure 12. Ingress and egress of OSBs by road plots
Figure 13. Photo of flowering vegetation adjacent to road plot 7 south of meadow area 4
Figure 14. Aerial photo of OSB annual census transects and meadow areas
Figure 15. Mean OSB presence in road plots across days observed for all
Figure 16. Mean temperature and wind speed for all occurrence surveys
Figure 17. Number of OSBs by road plot for all accounts of detection
Figure 18. Scatterplots of meadow flowering plants vs. meadow OSBs and vs. road OSBs
Figure 19. Linear regression of OSB presence and flowering plants in the road
Figure 20. Logistic regression of OSB presence and temperature in road and meadow
Figure 21. Logistic regression of OSB presence and humidity in road and meadow
Figure 22. Photo of speed reduction traffic sign for the endangered Hine‟s emerald dragonfly

vii
List of Tables
Table 1. Motivation, management, study questions, methods, and sampling effort
Table 2. OSB behavior types and descriptions
Table 3. Confusion table kappa and PCC values for each logistic regression
Table 4. Total OSB road ingress and egress for all road plots combined
Table 5. Relative humidity (%) range, median, and mean for OSB presence vs. absence
Table 6. Prioritization of barrier placement
viii
List of Appendices
Appendix 1. Rock Creek – Big Creek Site Maps
Appendix 2. OSB Life Cycle Diagram
Appendix 3. Oregon OSB Index Count 1990 to 2009
Appendix 4. Meadow Slope Diagram
Appendix 5. Instantaneous Scan and All Occurrence Datasheets
Appendix 6. Circular OSB Movement in Plots 7 and 8
Appendix 7. Weather Data for Yachats, OR 2009
Appendix 8. Density Comparison of OSBs by Transects at Rock Creek - Big Creek
Appendix 9. OSB Census Data Stacked by Transect and Date
1
1.0 Introduction
Roads and the vehicles traveling on them and allow human society to stay connected for
social, work, and trade needs (Forman and Sperling 2003). Approximately 3.9 million miles of
road exist within the U.S. and an estimated 200 million vehicles traveling 2.7 trillion miles per
year use those roads (National Atlas 2008). One percent of total land within the U.S. is covered
by public road corridors but a greater area is estimated to be directly affected ecologically (15-
20% of U.S. land) (Forman and Alexander 1998). One impact roads have on the natural
environment is direct mortality of individual animals that attempt to cross roads. Cars collide
with large animals over 1 million times each year in the U.S. and with smaller animals much
more often (Conover et al. 1995). Other indirect pressures roads inflict on wildlife and their
habitats include: alteration of landscape spatial pattern, direct loss of habitat, degradation of
habitat quality, habitat fragmentation and barrier effects, increased human exploitation,
population fragmentation and isolation, disruption of social structures, and reduced access to
vital habitats (Jackson 2000).
Roads can affect behavioral patterns of animals (e.g., movements). Wildlife cross roads
to access resources (Singer and Doherty 1985; Ries and Debinski 2001), avoid predators (May
and Norton 1996 as cited in Shine et al. 2004), and locate mates (Shine et al. 2004). Roadside
verges serve as habitat for a wide range of species, including butterflies (Ries and Debinski
2001; May and Norton 1996; Munguira and Thomas 1992; Free et al. 1975), and at times even
support higher densities than adjoining landscapes (Adams and Geis 1983). Roads and their
verges may offer microhabitats, such as shelter from the wind, that may attract or keep
individuals in the road corridor longer than expected. For example, roads may be warmer, warm
2
up earlier in the day, or remain warm for extended periods of time; poikiltherms are attracted to
these locations for basking (Ashley and Robinson 1996; Shine et al. 2004).
Road mortality could particularly impact butterfly populations and would likely impose a
greater impact if the population is already small and diminishing. Because a population is
already at risk of extirpation based on stochasticity, roads can present an additional stressor on an
already stressed system. Impacts can be expected when: fecundity is low (which is not typical
for invertebrates), breeding occurs after interactions with the road, and especially when mortality
from other sources is near or greater than the birth rate. Fragmentation of a population can also
pose a problem because it divides populations into smaller ones, which are expected to have
lower genetic diversity than those in uninterrupted habitats. Genetic diversity decline is caused
by restricted gene flow, genetic drift, and increased inbreeding and is known to decrease the
long-term persistence of populations in the wild (Frankham et al. 2002; Saccheri et al. 1998).
Also, positive relationships between species diversity and allelic diversity support the importance
of preserving biodiversity (Cleary et al. 2006).
Most wildlife-related road ecology research has been performed on mega-fauna; few
efforts have been devoted to invertebrate species. Although road effects on invertebrates can be
numerous, research on this topic is relatively rare. To increase the probability of safe passage,
vehicle speed would likely have to be reduced further for slow moving organisms, especially
ones unable to process vehicles trajectories, than faster moving ones. Also, invertebrates often
possess a low processing ability that may interfere with sufficient vehicle avoidance (INS 2010).
It is difficult to justify listing them as federally threatened or endangered because data are often
missing.
3
Research efforts on the effect of roads on butterflies have been even fewer, although
some pioneering studies offer important insight into this topic. For example, Rao and Girish
(2007) assessed insect road kills and discovered that butterflies and dragonflies were the major
taxa killed by vehicles. They found highest casualties occurred when traffic load on back roads
was highest, on Sundays. Ries and Debinski (2001) concluded that higher levels of crossing by
and mortality of butterflies occurred along roadsides with native prairie or weeds relative to
grassy roadsides. Not all research, however, suggests roads pose a problem to butterflies.
Munguira and Thomas (1992) found high butterfly diversity and abundance along roadsides;
butterfly abundance was not affected by the amount of midday traffic, and even wide, busy roads
did not present a significant barrier to species from open populations. Their bi-weekly surveys,
though, suggest that a minimum of 7% of butterflies in open populations were killed from
vehicles.
The Oregon Silverspot Butterfly (OSB), Speyeria zerene hippolyta, is federally listed as
“threatened.” It historically inhabited coastal regions of Washington, Oregon, and California
(USFWS 2001). OSB populations only remain at five sites, four of which are in Oregon; one
remaining population is in California, and none exist in Washington state as they have been
extirpated (BFCI 2009; USFWS 2001). The site selected for this study was Rock Creek-Big
Creek, adjacent to the Siuslaw National Forest (Figure 1) (Appendix 1). At this site OSB habitat
is bisected by Highway 101; butterflies are observed to use both sides of the highway throughout
their life cycle (P. Hammond, personal communication, June 12, 2009). It is suspected that
vehicles on Highway 101, through collisions and their turbulence, present a substantial threat to
OSBs at this site. This suspicion, however, has not yet been quantified and is only minimally
evaluated in this paper.
4
Effective mitigation techniques have rarely been developed and tested for small or flying
organisms (but see, e.g., Smith 2009, Bard et al. 2002). Mitigation for one species may not work
effectively for others (e.g., Jackson and Griffin 2000). Moreover, due to expense and scale, it is
prohibitive to test multiple mitigation options sequentially. Therefore, we explored whether
gathering targeted ecological data would help prioritize mitigation options for a threatened
species, the Oregon silverspot butterfly (Speyeria zerene hippolyta, hereafter, OSB). We studied
OSB ecology in order to evaluate the likely success of mitigation options before funding was
pursued for implementing or directly testing any of them.
In this research, we considered four potential management options that seemed most
likely to be effective based on available information, including barrier installation; earthen berm
removal and other actions to reduce the attractiveness of the road relative to the surrounding
habitat; environmentally triggered, flashing speed-reduction-sign installation; and vegetation
manipulation. Again, because these management scenarios are not yet in play, we could not
directly test them. Rather, we gathered data on the behavioral ecology of OSBs and the
environmental conditions of the road compared to surrounding habitat to determine which
mitigation measures would have the greatest potential for effectiveness. To inform mitigation
options we examined six questions about environmental conditions across habitats or
microhabitats and how these correlated with OSB presence.
5
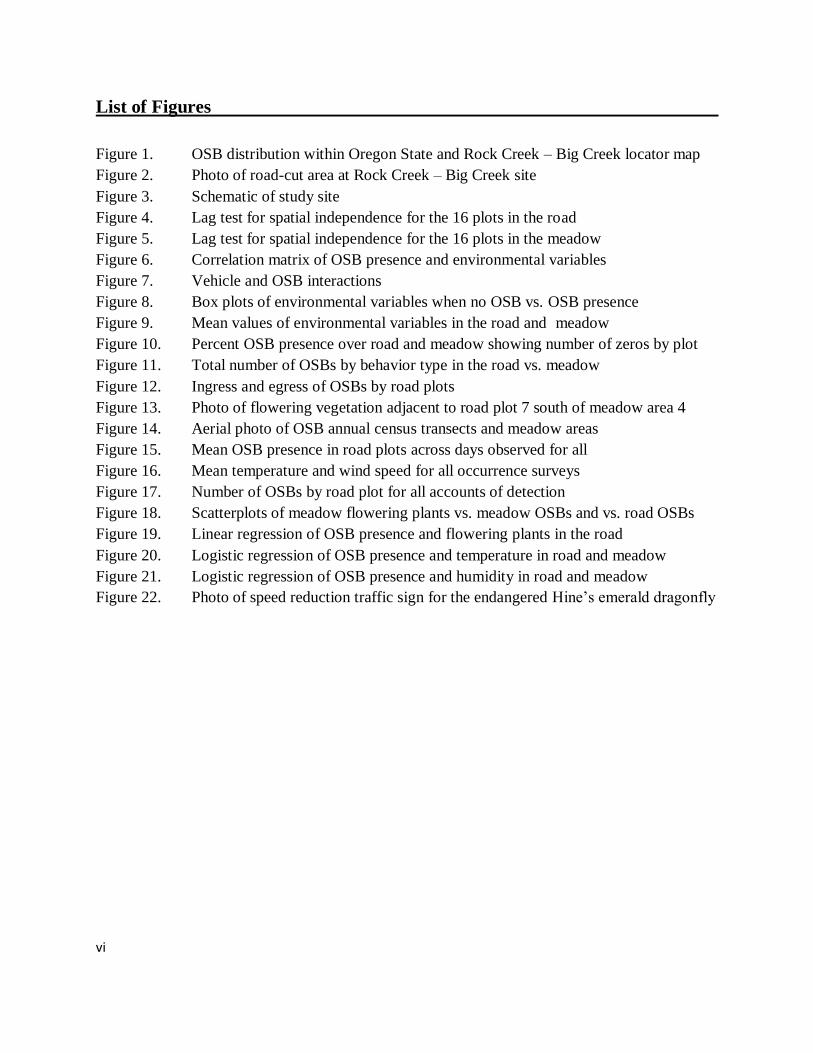
Figure 1: OSB Distribution within Oregon State and Rock Creek – Big Creek Locator Map;
this study was conducted at the southernmost site in Oregon, Rock Creek-Big Creek.
Distribution map (USFW 2001) adapted by Sara Zielin.
2.0 Background
Life History and Habitat Requirements
The OSB transforms through six larval instars and a pupal phase prior to eclosing as an
adult (USFWS 2001) (Appendix 2). Adults appear throughout late summer beginning in July
and continue to emerge through late September to mate. The first adult OSBs that appear are
males and emerge several weeks prior to females (USFWS 2001). Eggs are laid on or near
Viola adunca plants, and hatch shortly thereafter. The larvae soon enter a winter diapause
(dormant state) during which they spend the winter. In the spring, the larvae rouse and begin
6
feeding on violet leaves until the late spring or summer when they pupate. Their pupation time is
short (~2 weeks) and adults soon emerge to continue the cycle (McCorkle and Hammond 1988).
The OSB requires one of three types of grasslands to complete its life cycle: coastal salt
spray meadows, stabilized dunes, or montane meadows. These grasslands must have both the
larval host plant and nectaring plants. Also, OSBs typically use forest fringe areas to roost in the
evenings. The primary source of food for OSB larvae is the Viola adunca (western blue violet)
(USFWS 2001). Food (nectaring) plants for adults include multiple native and non-native
species: Canada goldenrod (Solidago canadensis), dune goldenrod (S. spathulata), California
aster (Aster chilensis), pearly everlasting (Anaphalis margaritacea), dune thistle (Cirsium edule),
yarrow (Achillea millefolium), tansy ragwort (Senecio jacobaea), false dandelion (Hypochaeris
radicata), thistles in the genus Cirsium, chaparral broom (Baccharis pilularis), smooth
hawksbeard (Crepis capillaris), and woolly sunflower (Eriophyllum lanatum) (USFWS 2001).
Habitat and Population Management History
One of the main factors attributed to the decline of OSBs is the invasion of non-native
plant species (mostly grasses) such as: heath grass (Danthonia decumbens [Sieglingia
decumbens]), bent grass (Agrostis alba), velvet grass (Holcus lanatus), orchard grass (Dactylis
glomerata), tall fescue (Festuca arundinacea), reed canary grass (Phalaris arundinacea),
European beach grass (Ammophila arenaria), and Scotch broom (Cytisus scoparius) (USFWS
2001). Exotic grasses at the study site tend to produce tall and dense stands that can eliminate
native plants including the larval food plant of OSBs (Hammond 1994a).
Since 1985, the Rock Creek – Big Creek site has been managed for Viola adunca with
the primary management technique of 3 annual mowing events, typically beginning late May and
7
ending early July (Hammond 2008). Mowing temporarily provides control of non-native grass
height, thatch accumulation, and control of salal and other woody species. OSB oviposition
becomes limited to ideal egg laying locations with the encroachment of non-native grasses as
they tend to “shade-out” Viola adunca plants making them inaccessible to gravid females for egg
laying. Abundance of Viola adunca and levels of OSB oviposition have been inversely
correlated with vegetation height and depth (Singleton 1989, McIver et al. 1991, Pickering et al.
1992). Although mowing has potentially reduced the impacts of invasive plants on the OSB, it is
not considered a long-term solution for non-native species management (USFWS 2001), and
mowing simultaneously reduces the number of nectaring plants for adults as it is a non-selective
management tool.
OSB populations have been augmented with captive-reared species since 1999. The
Nature Conservancy (TNC), the Oregon Zoo of Portland and the Woodland Park Zoo have
managed a butterfly rearing program with the goals of maintaining genetic variability in the
population and increase the likelihood of natural recovery (Oregon Zoo Conservation 2009).
U.S. Fish and Wildlife Service (USFWS) (and other organizations) has initiated plantings of
Viola adunca and nectar plants at the study site (A. Walker, personal communication, August 16,
2009). It appears that the more recent increase in population size at Rock Creek-Big Creek has
been associated with the release of captive-reared OSBs (Patterson 2008), although this notion
has not been quantified as there have been no efforts (such as marking) to decipher the difference
from captive-reared and “wild” butterflies. The OSB counts for 2009 at Rock Creek – Big
Creek, Bray Point, Cascade Head, and Mt Hebo are 437, 124, 1420, and 1411 respectively
(Appendix 3).
8
Highway 101 and Traffic
Highway 101 begins in California, passes through Oregon and ends in Washington State.
Construction of the Oregon section of Highway 101 took 15 years and was completed in 1936
(OCZMA 2008). Highway 101 at Rock Creek-Big Creek generally runs in a north-south
direction, has few small unofficial pull-off areas, and is bordered by rivers to the north and south
(Figure 1; Appendix 1). In 2008, the average annual daily traffic (AADT) for Highway 101 at
this site was 2,100 vehicles (N. Testa, personal communication, February 5, 2010). With an
increase in human population and travelers to the Oregon coast during the summer months it can
be assumed that the AADT has increased and that the current AADT is an underestimate during
August and September. It was estimated that by 2006 approximately 43% of OSBs that attempt
to cross Highway 101 (at a 1500 foot section of road including the Big Creek bridge) would be
hit by passing vehicles and most likely killed at Rock Creek – Big Creek (Powers 1988 as cited
by Testa 1995).
Mitigation Types
Currently, the USDA Forest Service is pursuing four mitigation techniques to reduce
potential vehicle-caused impacts sustained by OSBs at Rock Creek-Big Creek.
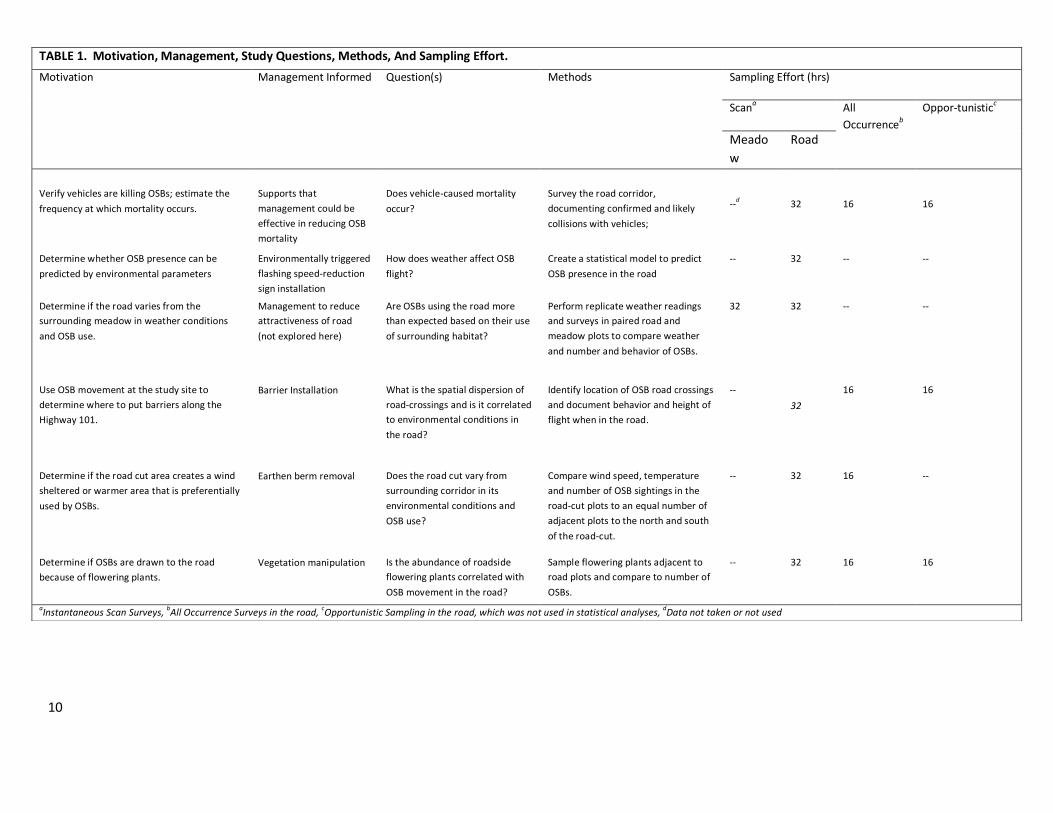
The mitigation types being considered are (Table 1):
1) Barrier installation (fences, netting, guardrails and/or concrete)
Function: To reduce the number of OSBs flying into the road, to encourage
butterflies to stay in the meadows longer, and in the case that OSBs do find their way
into the road corridor, use barriers to force them to fly higher than they naturally
would and effectively over vehicles driving on Highway 101
9
2) Earthen berms (addition or removal)
Function: To reduce potential sheltering from the wind in the road corridor where
OSBs may congregate and essentially reduce the likelihood of a butterfly-vehicle
collision
3) Flashing speed reduction sign installation
Function: To reduce the likelihood of an OSB-vehicle collision by
slowing traffic and to reduce the societal effects of traffic calming by
limiting speed reduction to the key times for OSB flight to values of
environmental variables associated with OSB presence in the road
4) Vegetation manipulation
Function: to draw butterflies away from the road corridor or reduce
incentive to cross the road or otherwise enter the road corridor
10
TABLE 1. Motivation, Management, Study Questions, Methods, And Sampling Effort.
Motivation
Management Informed Question(s) Methods Sampling Effort (hrs)
Scana All
Occurrenceb
Oppor-tunisticc
Meado
w
Road
Verify vehicles are killing OSBs; estimate the
frequency at which mortality occurs.
Supports that
management could be
effective in reducing OSB
mortality
Does vehicle-caused mortality
occur?
Survey the road corridor,
documenting confirmed and likely
collisions with vehicles;
--d
32
16
16
Determine whether OSB presence can be
predicted by environmental parameters
Environmentally triggered
flashing speed-reduction
sign installation
How does weather affect OSB
flight?
Create a statistical model to predict
OSB presence in the road
-- 32 -- --
Determine if the road varies from the
surrounding meadow in weather conditions
and OSB use.
Management to reduce
attractiveness of road
(not explored here)
Are OSBs using the road more
than expected based on their use
of surrounding habitat?
Perform replicate weather readings
and surveys in paired road and
meadow plots to compare weather
and number and behavior of OSBs.
32 32 -- --
Use OSB movement at the study site to
determine where to put barriers along the
Highway 101.
Barrier Installation What is the spatial dispersion of
road-crossings and is it correlated
to environmental conditions in
the road?
Identify location of OSB road crossings
and document behavior and height of
flight when in the road.
--
32
16 16
Determine if the road cut area creates a wind
sheltered or warmer area that is preferentially
used by OSBs.
Earthen berm removal Does the road cut vary from
surrounding corridor in its
environmental conditions and
OSB use?
Compare wind speed, temperature
and number of OSB sightings in the
road-cut plots to an equal number of
adjacent plots to the north and south
of the road-cut.
-- 32 16 --
Determine if OSBs are drawn to the road
because of flowering plants.
Vegetation manipulation Is the abundance of roadside
flowering plants correlated with
OSB movement in the road?
Sample flowering plants adjacent to
road plots and compare to number of
OSBs.
-- 32 16 16
aInstantaneous Scan Surveys,
bAll Occurrence Surveys in the road,
cOpportunistic Sampling in the road, which was not used in statistical analyses,
dData not taken or not used
11
Questions Addressed in this Study
Several questions were asked in this study to determine if a particular mitigation option
may be suitable to reduce mortality to the OSB (Table 1). Below are the four main questions
asked along with synopses on how we plan to address each and the rationale behind our methods.
How does weather affect OSB flight?
Knowing when OSBs are active is a key first step to understanding the practicality of this
mitigation option. The purpose of this question is to determine 1) whether OSB presence
(especially in the road) can be predicted by a suite of environmental parameters and 2) if
environmental variables are significantly different between the road and meadow is it possible
that OSBs are drawn to the road when more ideal conditions exist there. Temperature, wind
speed, humidity, and OSB presence were all recorded during both the meadow and road surveys.
By identifying which variables best correlate with OSB presence mitigation options can be better
modified to increase efficiency and effectiveness, and essentially reduce mortality. For example,
OSB presence is hypothesized to be positively correlated with temperature in both the road and
meadow as butterflies need relatively warm air (15.5oC or 60
oF) to fly (McCorkle and Hammond
1988) and using these data to create a model for prediction would allow for an environmental-
variable triggered speed reduction sign to activate only when the probability of OSB presence
was highest. It‟s also hypothesized that OSB presence will have a negative relationship with
wind speed and humidity, as both factors are known to inhibit butterfly activity and may support
a finer tuned model (N. Testa, personal communication, March 25, 2009; USFWS 2001). There
are other elements that must be understood to determine whether vehicle speed reduction will be
capable of reducing butterfly vehicle-caused mortality. If OSBs do in fact show some
predictable pattern of presence related to any of the documented parameters these parameters
12
would then be used to dictate when speed reduction is prompted and in a fashion that lessens the
amount of time vehicles were pointlessly reducing speed on days when conditions were not
suitable for OSB flight.
What is the dispersion of OSB road-crossings and what is their behavior when doing so?
The goal of this question was to discover where OSBs are crossing in the road
corridor so to better 1) understand their movement at the study site and, 2) determine
where to put barriers along Highway 101. No known research has observed OSB
movement at this site and it‟s believed that OSBs potentially cross the road at least 2
times a day, roosting in the forest fringe areas at night on the east-side of Highway 101,
crossing the road to the west-side to access plants for oviposition and foraging, and
returning to the east-side in the evening (P. Hammond, personal communication; June 12,
2009). To thoroughly answer the first part of this question, individuals would need to be
marked, observed, and followed throughout the day, which was deemed impractical
(discussed below). Rather, location of OSB road crossing was documented at the sub-
plot level as well as behavior and height of flight when in the road. These results will
allow inference of where barrier placement is feasible by determining where high
crossing areas for OSBs exist. It‟s hypothesized that OSBs tend to cross the road in
particular areas and that their dispersal from the meadows into the road is concentrated (P.
Hammond, personal communication, 2009). If OSBs mainly display a flying behavior
and are found to fly at low heights (relative to the road surface) when in the road, plots
with these behaviors will be ideal areas for barrier placement. Barriers will serve to 1)
keep OSBs in the meadows longer and 2) fly higher, over barriers, when in the road,
13
presumably avoiding vehicle collisions. Again, more research will need to be performed
to further understand how OSBs interact with different types of barriers.
Does the road-cut vary from surrounding the corridor in its environmental conditions
and OSB use?
Research on this question addressed the concern that the warmer surface of the
road and roadside creates a basking area, especially in the road-cut area. If this were the
case, a change in the topography, especially of the road cut, such as by changing earthen
berms, would be an appropriate management strategy which may also offer shelter from
cross winds‟. Research to address this question included two approaches. First, we
compared wind speed, temperature, and number of OSB sightings in the road-cut area to
the adjacent areas along the road to determine if relevant environmental conditions differ
along different parts of the road. Second, we compared butterfly numbers and behavioral
time budgets (for basking, flying, and interacting) between the road and identically sized
strips of habitat in the adjacent meadow to determine whether butterflies favored the road
or meadow for any behaviors. Duration of stay in the road relative to meadow would be a
more direct measure but could not be assessed; the OSBs could not be marked (USFWS
policy) and they interacted and flew in and out of the meadow plots, making impossible
the reliable, extended focal observations needed for time budgets for each behavior.
Is the abundance of roadside flowering plants correlated with OSB movement in the road or in
the meadow?
The purpose of this question was to determine if 1) flowering plants can explain OSB
presence either in the meadow or in the road, and 2) if OSBs may be drawn to the road because
of flowering plants. We hypothesize that an increased number of flowering plants in the
14
meadows will translate to greater OSB presence in the meadow plots and\or adjacent road plots.
For flowering plants immediately adjacent to the road we similarly hypothesize that an
increasing number of flowering plants in the verge will correlate with increasing number of
OSBs detected in road sub-plots as this species feeds on the nectar of several flowering plants at
this site (USFW 2001). If this prediction is found to be accurate the removal of flowering plants
adjacent to the road and plantings in the meadow could reduce the risk of vehicle collisions, as
OSBs would less likely be attracted to the road and more so to the meadow. Managing
vegetation along the roadside can be particularly important post-meadow mowing when there are
fewer flowering plants in the meadows.
3.0 Methods
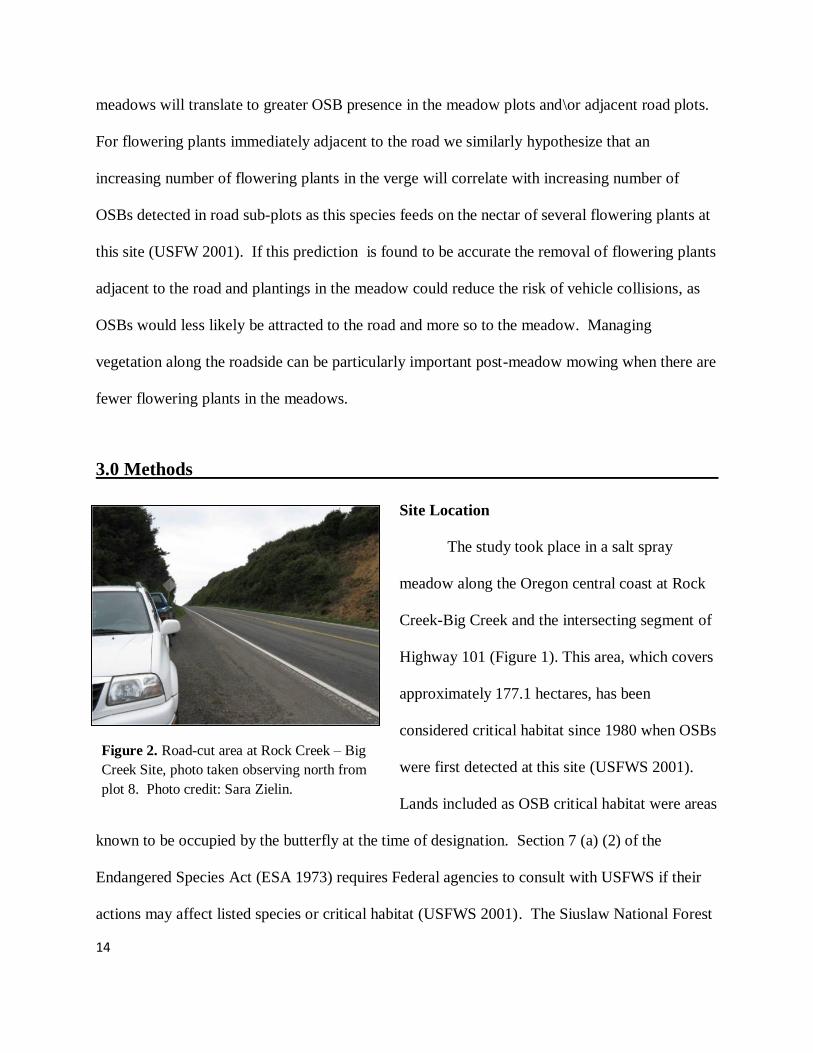
Site Location
The study took place in a salt spray
meadow along the Oregon central coast at Rock
Creek-Big Creek and the intersecting segment of
Highway 101 (Figure 1). This area, which covers
approximately 177.1 hectares, has been
considered critical habitat since 1980 when OSBs
were first detected at this site (USFWS 2001).
Lands included as OSB critical habitat were areas
known to be occupied by the butterfly at the time of designation. Section 7 (a) (2) of the
Endangered Species Act (ESA 1973) requires Federal agencies to consult with USFWS if their
actions may affect listed species or critical habitat (USFWS 2001). The Siuslaw National Forest
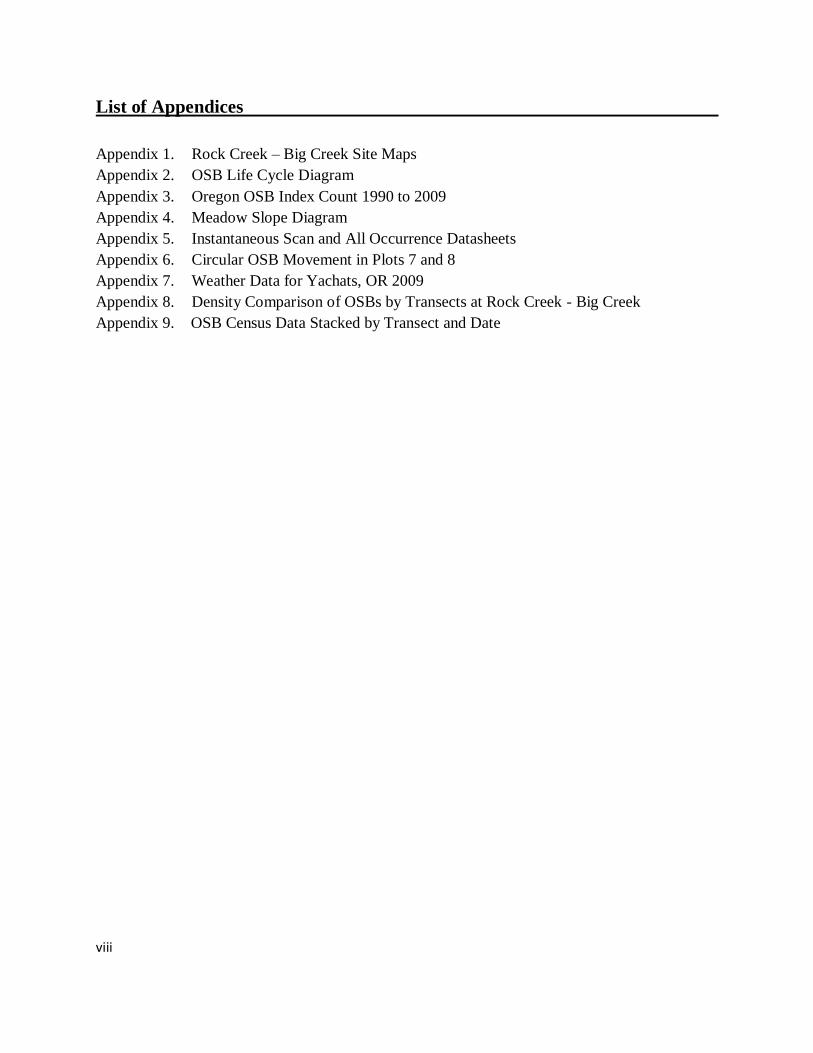
Figure 2. Road-cut area at Rock Creek – Big
Creek Site, photo taken observing north from
plot 8. Photo credit: Sara Zielin.
15
manages approximately 20 hectares of potential butterfly habitat (USFWS 2001). The site is
located roughly between the mouths of Rock Creek and Big Creek (USFWS 2001). Meadow is
on both sides of Highway 101 starting approximately 200 m south of Big Creek continuing north
to the south side of Rock Creek. In general, the east-side of the study area starts at a
significantly higher elevation (340 feet) and with a steeper grade than the west-side (Appendix 1;
Figure 1). As the meadow approaches the road on the east-side of Highway 101 the grade
becomes less steep and even more so on the west-side (ocean-side) of the road (Appendix 4). In
some sections of Highway 101 the road surface is significantly lower than the abutting meadow
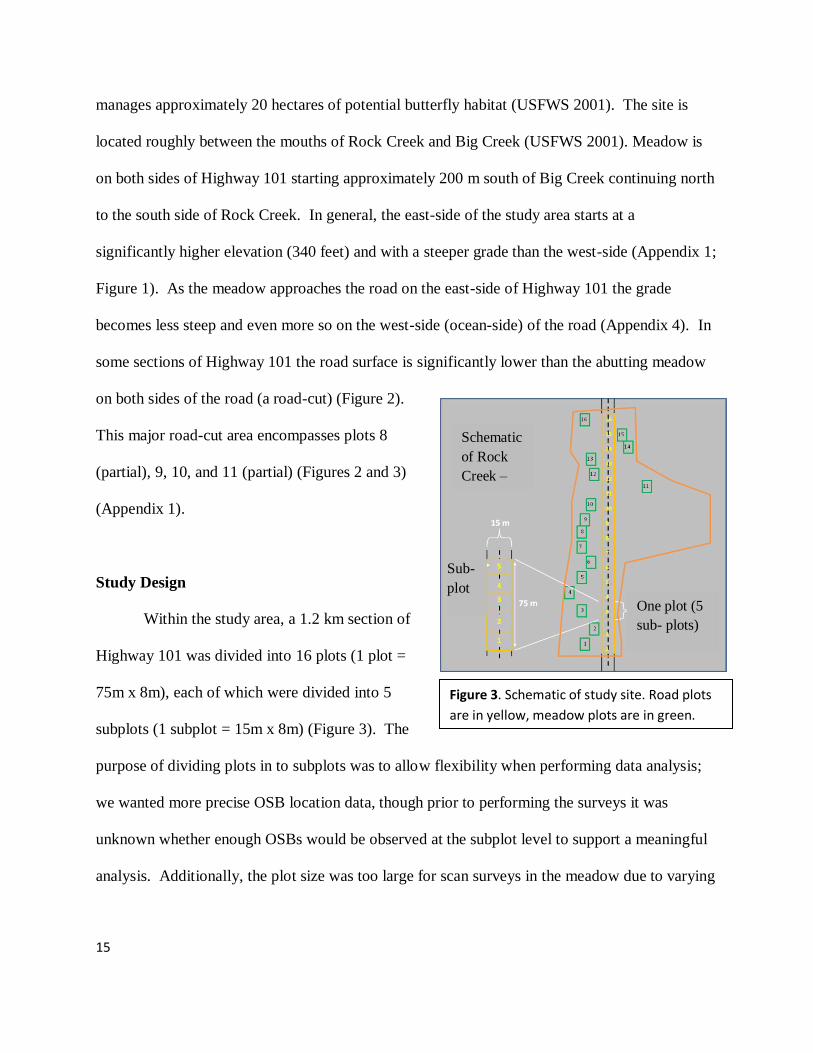
on both sides of the road (a road-cut) (Figure 2).
This major road-cut area encompasses plots 8
(partial), 9, 10, and 11 (partial) (Figures 2 and 3)
(Appendix 1).
Study Design
Within the study area, a 1.2 km section of
Highway 101 was divided into 16 plots (1 plot =
75m x 8m), each of which were divided into 5
subplots (1 subplot = 15m x 8m) (Figure 3). The
purpose of dividing plots in to subplots was to allow flexibility when performing data analysis;
we wanted more precise OSB location data, though prior to performing the surveys it was
unknown whether enough OSBs would be observed at the subplot level to support a meaningful
analysis. Additionally, the plot size was too large for scan surveys in the meadow due to varying
8m One plot (5
sub- plots)
Sub-
plot
Schematic
of Rock
Creek –
Big Creek
Project
Area
Figure 3. Schematic of study site. Road plots
are in yellow, meadow plots are in green.
16
topography and lack of line of sight. By breaking plots into subplots it became possible to detect
all OSBs in a survey from a single location.
Corners of the subplot boundaries were marked in meadows using orange pin flags (1m
long, 10 x 12.5 cm flags). In the road, plot corners were marked with pin flags and subplot
corners were designated using marking paint. Each road plot was paired with a meadow plot of
the same dimension. The meadow plot was kept at the same latitude as the road plot, subdivided
like the road plots (5 subplots per plot), and placed at a random distance from the centerline of
Highway 101 and the outer edge of the surrounding meadow habitat.
Sampling Surveys
Surveys were conducted between 17 August and 19 September 2009 on road plots or on
plots in the surrounding habitat. Surveys were not conducted on days when it was raining to
minimize over-inflation of zeros and low values attributable to weather that was unsuitable for
flight (McCorkle and Hammond 1988). Two types of surveys were performed (Appendix 5).
Instantaneous Scan Sampling, determined spatio-temporal OSB presence patterns and provided
comparison of meadow plots vs. road plots. The plot size was chosen to minimize extremely low
numbers of butterflies encountered. All road and meadow plots were sampled with
instantaneous scans four times throughout the study. Preliminary observations identified that
focal individual sampling of these unmarked butterflies, given that they could not be marked, did
not yield enough consecutive observations of individuals to be used for analysis. The All
Occurrence Survey‟s primary purpose was documenting any OSB activities when sightings
occurred in the road. We also opportunistically recorded all sightings of OSBs in the road.
17
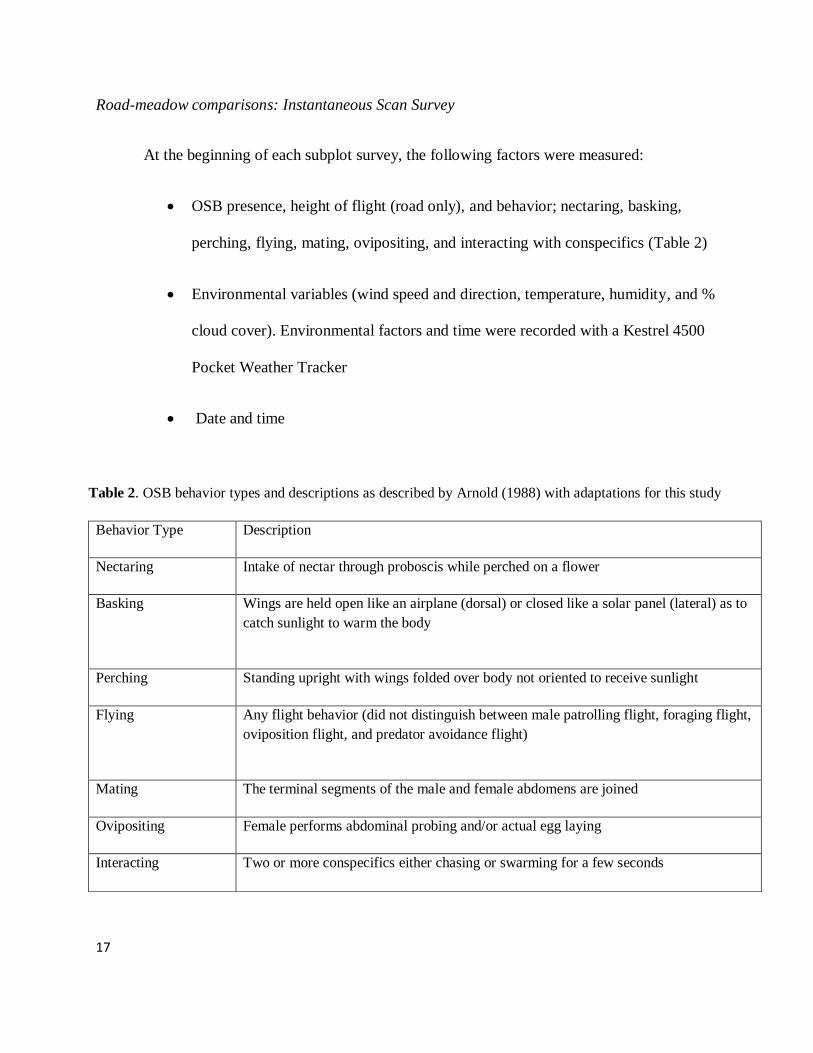
Road-meadow comparisons: Instantaneous Scan Survey
At the beginning of each subplot survey, the following factors were measured:
OSB presence, height of flight (road only), and behavior; nectaring, basking,
perching, flying, mating, ovipositing, and interacting with conspecifics (Table 2)
Environmental variables (wind speed and direction, temperature, humidity, and %
cloud cover). Environmental factors and time were recorded with a Kestrel 4500
Pocket Weather Tracker
Date and time
Behavior Type Description
Nectaring Intake of nectar through proboscis while perched on a flower
Basking Wings are held open like an airplane (dorsal) or closed like a solar panel (lateral) as to
catch sunlight to warm the body
Perching Standing upright with wings folded over body not oriented to receive sunlight
Flying Any flight behavior (did not distinguish between male patrolling flight, foraging flight,
oviposition flight, and predator avoidance flight)
Mating The terminal segments of the male and female abdomens are joined
Ovipositing Female performs abdominal probing and/or actual egg laying
Interacting Two or more conspecifics either chasing or swarming for a few seconds
Table 2. OSB behavior types and descriptions as described by Arnold (1988) with adaptations for this study
18
We counted the number of butterflies in each subplot engaged in each behavior at the
instant of the scan. Therefore, nectaring included only butterflies on flowers, while those flying
between flowers to nectar were classified as flying. Scans started at the south end of each
meadow or road plot, systematically surveying each component subplot (Figure 3) (Appendix 1).
Once the whole plot was scanned, this procedure was repeated again for a total of ten times for
the plot being surveyed. Once either the road or meadow plot was completed, a survey of the
paired plot was undertaken using the same protocol. Three or four pairs of plots were surveyed
each day (weather permitting) with plots randomly selected using a random number generator in
Microsoft Excel. Four replicates were conducted for each of the 16 pairs of plots, totaling 3200
data points for meadow and 3200 for the road (16 plots x 5 subplots x 10 scans x 4 replicates).
Detection Probability in meadow
While the ease of visibility in the road left little doubt as to the efficacy of OSB detection
during road subplot scan surveys, the potential for difficulties in OSB detection in the more
visually heterogeneous meadow habitat warranted additional scrutiny. Detection probability
surveys in meadow subplots were performed in order to quantify the effectiveness of individual
observers detecting butterflies during instantaneous scan surveys. These surveys were done after
the instantaneous scan surveys in the meadow and at unscheduled intervals when time permitted.
These surveys entailed scanning a series of five subplots (identical methods to those of the
instantaneous scan surveys). However, once the last subplot was scanned the observer would
then begin to zigzag back through each subplot all the way to the initial subplot, theoretically
flushing any butterflies missed during the scan, and counting all butterflies encountered during
the zigzag walk. Observers had a high detection probability: Observer 1 was 97.6% (83 subplots
19
surveyed, 2 previously unrecorded butterflies detected during the zigzag walk); and Observer 2
was 97.2% (109 subplots, 3 additional butterflies observed during a zigzag walk). These
detection probabilities were considered sufficiently high to assume that the detection rate was
representative of the actual OSB presence.
Inter-observer Reliability
Inter-observer reliability was calculated between the two observers performing surveys as
consistency is important for recording accurate data. The detection probability data were used to
assess reliability as these surveys were performed simultaneously during scans and zigzags. The
percent agreement between the observers was 91% (31/34) and 97% (33/34) for scans and
zigzags respectively.
All Occurrence sampling for OSBs in road plots
The all occurrence survey was exclusive to the road. Each road plot was observed four
times throughout the season, totaling 64 15-minute observations of roads for crossings in
addition to the 64 scan sampling periods by standing at the south end of a designated road plot
and observing any OSB activity while looking north for 15 minutes. For every sighting of an
OSB in the road the following variables were documented:
OSB presence and behavior; nectaring, perching, basking, flying, mating, ovipositing,
and interacting with conspecifics (Table 2)
Environmental variables (wind speed and direction, temperature, humidity, and % cloud
cover)
Date and time
20
Location (subplot where OSB was initially detected)
Direction of flight (using the road as a north-south reference)
Duration (recorded by counting seconds OSB was in the road)
Distance flew (estimated using the known plot dimensions and the road edge and pin-
flags as a reference for the plot boundaries)
Rate of flight (calculated using duration of flight and distance flew in the road)
Height of flight (estimated by placing a 3.5 m telescoping staff marked in half meter
increments in the middle of the plot along the road edge)
If a collision occurred
„Duration‟ in the road was documented by counting the seconds an OSB was in the road
beginning when it was first detected over top of the pavement until it could no longer be seen or
until it left the pavement. „Distance flew‟ in the road was estimated by documenting OSB
ingress and egress into and out of the road and by using the known plot dimensions as well as the
road edge and pin-flags as references. „Rate of flight‟ was calculated post-observation by
dividing the distance estimate by the duration estimate. Last, „height of flight‟ was estimated by
placing a 3.5 m long telescoping staff marked in half meter increments at the road edge (at the
approximate center of the plot) as a reference height.
A digital voice recorder was used to document sightings of OSBs to minimize error from
drawing eyes away from the target species. A Kestrel 4500 Pocket Weather Tracker was used to
measure environmental variables and time of day.
21
Opportunistic sampling
Opportunistic sampling was performed haphazardly with no set study design. Once at the
study site, if OSBs were observed in the road outside of the actual survey period and the
surveyor was prepared to record all the variables, the sighting was documented. The purpose of
this sampling was to gather as much data as possible on the occurrence of this rare species over
the road. Although these data were not used statistically, they were used to show total number of
crossings observed per plot and they may assist with the development of future study designs and
hypothesis formation.
Vegetation Surveys
The number of flowering plants was quantified for all meadow subplots and a sub-
sampling of road subplots. In the meadow, 3 samples were taken per 15m x 8m subplot. Sample
locations were selected by dividing each subplot into 480 square meter sections, assigning each
section a number 1 through 480, and using random number generator in Microsoft Excel to select
three numbers for each subplot to be surveyed. A square meter PVC reference frame with 10
nylon strings per side, creating 100 subdivisions, was used to quantify flowering plants. Every
flowering plant detected at a string intersection was counted.
The number of flowering plants was also quantified for a sub-sampling of road subplots.
A stratified random sampling design was used and was based on the number of OSB crossings at
subplots. 3 levels of OSB crossing were established: low, medium and high. Low crossing
included subplots with zero observed OSB crossings; medium crossing were those with 1-2
observed crossings, and high crossing subplots were those with 3-7 observed crossings. Five
subplots were sampled from each level of crossing type and were selected using the random
22
number generator in Microsoft Excel. Three samples were taken within the 15m x 1m area
immediately adjacent and parallel to the road subplot where the pavement ended and the
vegetation began. The road subplot area was divided into 60 square meter sections, assigned a
number 1 through 60 for each section, and 3 sample locations were selected using random
number generator in Microsoft Excel. Selection for sample location within the subplots was
identical to the meadow subplots but with a reduced area (15m x 1m) because vegetation is not
growing in the actual road subplot area but was directly next to the road in the roadside verge.
Statistical Analyses
For all data, we used the Shapiro-Wilk test to check normality and a VIF test and an F-
test for equal variance to determine if the data met the assumptions of parametric analyses, once
transformed. A lag test examined the possibility of spatial autocorrelation of the plots. Data
approximated the normal distribution when data were pooled across subplots, replicates, and
individual scans (n=16; Road: W=0.9144, P=0.1373; Meadow: W=0.9878, P=0.9973). A partial
ACF test on the residuals of the linear model, plotting the relationship between OSB abundance
and plot number, indicated there was not strong spatial dependence for the road or meadow plots
(Figures 4 and 5).
23
Figure 5. Lag test for spatial independence for the 16 plots in the meadow. (left) Lag plots for lag 1-4.
(right) Partial autocorrelation chart for lag 1-15.
Figure 4. Lag test for spatial independence for the 16 plots in the road. (left) Lag plots for lag 1-4. (right)
Partial autocorrelation chart for lag 1-15.
24
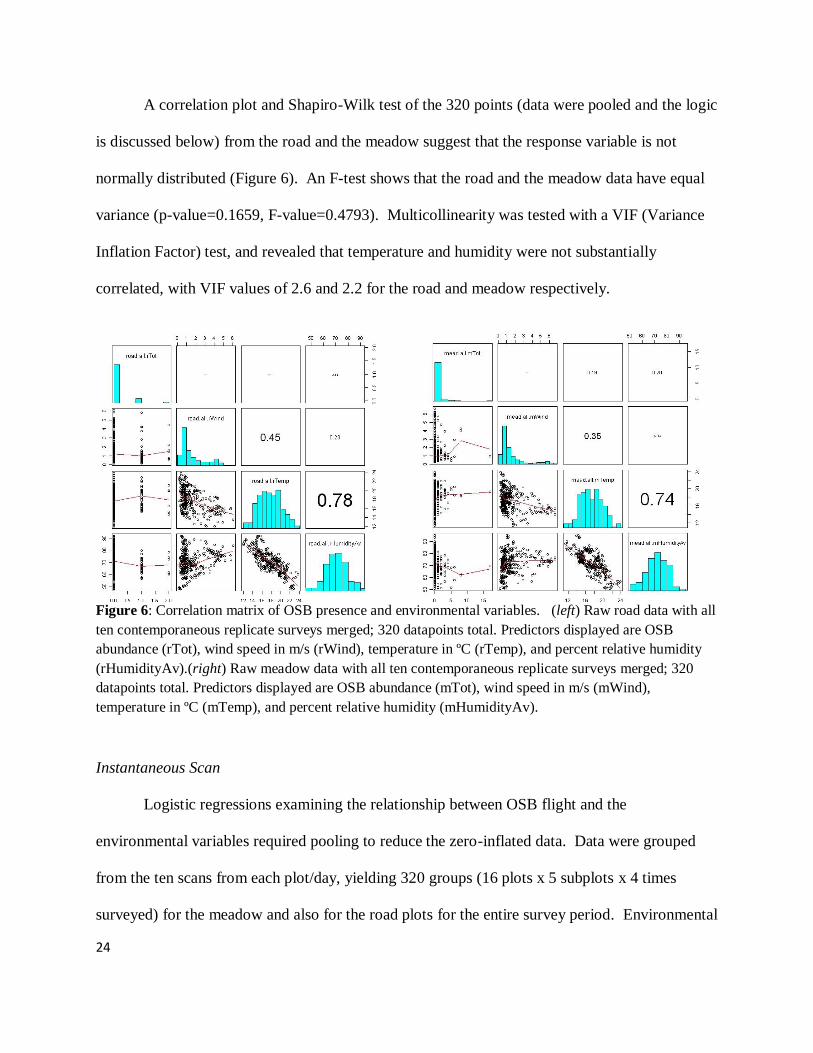
A correlation plot and Shapiro-Wilk test of the 320 points (data were pooled and the logic
is discussed below) from the road and the meadow suggest that the response variable is not
normally distributed (Figure 6). An F-test shows that the road and the meadow data have equal
variance (p-value=0.1659, F-value=0.4793). Multicollinearity was tested with a VIF (Variance
Inflation Factor) test, and revealed that temperature and humidity were not substantially
correlated, with VIF values of 2.6 and 2.2 for the road and meadow respectively.
Instantaneous Scan
Logistic regressions examining the relationship between OSB flight and the
environmental variables required pooling to reduce the zero-inflated data. Data were grouped
from the ten scans from each plot/day, yielding 320 groups (16 plots x 5 subplots x 4 times
surveyed) for the meadow and also for the road plots for the entire survey period. Environmental
Figure 6: Correlation matrix of OSB presence and environmental variables. (left) Raw road data with all
ten contemporaneous replicate surveys merged; 320 datapoints total. Predictors displayed are OSB
abundance (rTot), wind speed in m/s (rWind), temperature in ºC (rTemp), and percent relative humidity
(rHumidityAv).(right) Raw meadow data with all ten contemporaneous replicate surveys merged; 320
datapoints total. Predictors displayed are OSB abundance (mTot), wind speed in m/s (mWind),
temperature in ºC (mTemp), and percent relative humidity (mHumidityAv).
25
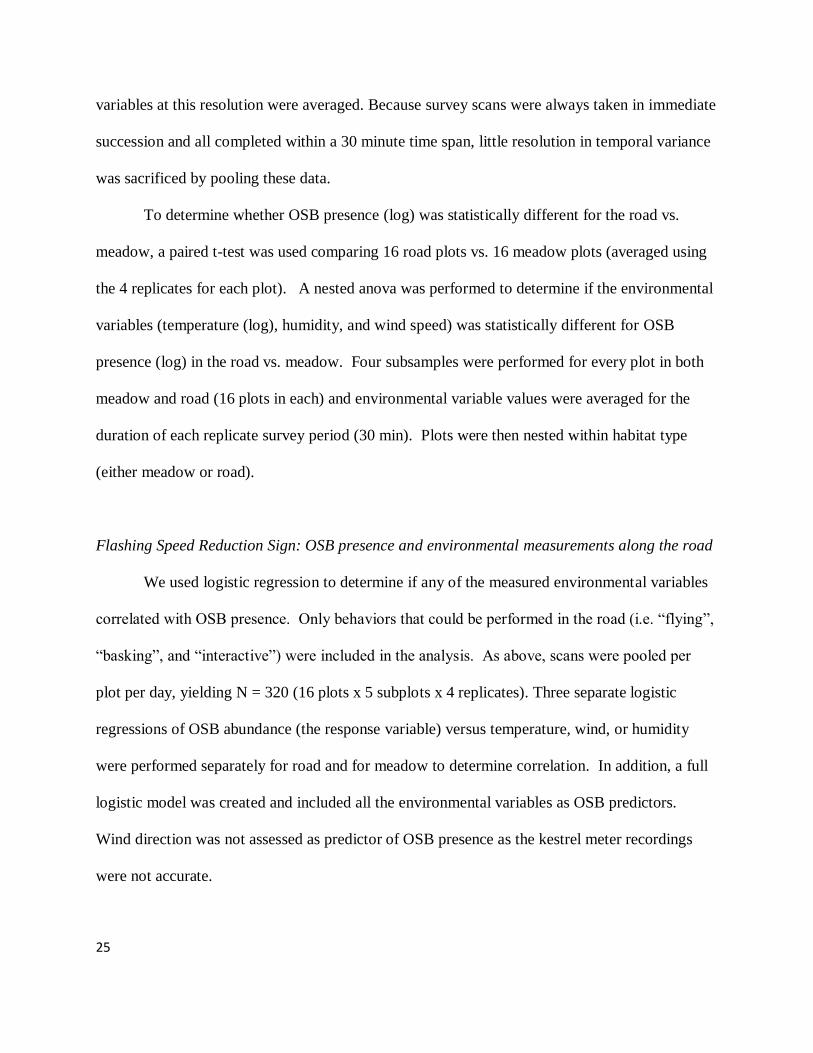
variables at this resolution were averaged. Because survey scans were always taken in immediate
succession and all completed within a 30 minute time span, little resolution in temporal variance
was sacrificed by pooling these data.
To determine whether OSB presence (log) was statistically different for the road vs.
meadow, a paired t-test was used comparing 16 road plots vs. 16 meadow plots (averaged using
the 4 replicates for each plot). A nested anova was performed to determine if the environmental
variables (temperature (log), humidity, and wind speed) was statistically different for OSB
presence (log) in the road vs. meadow. Four subsamples were performed for every plot in both
meadow and road (16 plots in each) and environmental variable values were averaged for the
duration of each replicate survey period (30 min). Plots were then nested within habitat type
(either meadow or road).
Flashing Speed Reduction Sign: OSB presence and environmental measurements along the road
We used logistic regression to determine if any of the measured environmental variables
correlated with OSB presence. Only behaviors that could be performed in the road (i.e. “flying”,
“basking”, and “interactive”) were included in the analysis. As above, scans were pooled per
plot per day, yielding N = 320 (16 plots x 5 subplots x 4 replicates). Three separate logistic
regressions of OSB abundance (the response variable) versus temperature, wind, or humidity
were performed separately for road and for meadow to determine correlation. In addition, a full
logistic model was created and included all the environmental variables as OSB predictors.
Wind direction was not assessed as predictor of OSB presence as the kestrel meter recordings
were not accurate.
26
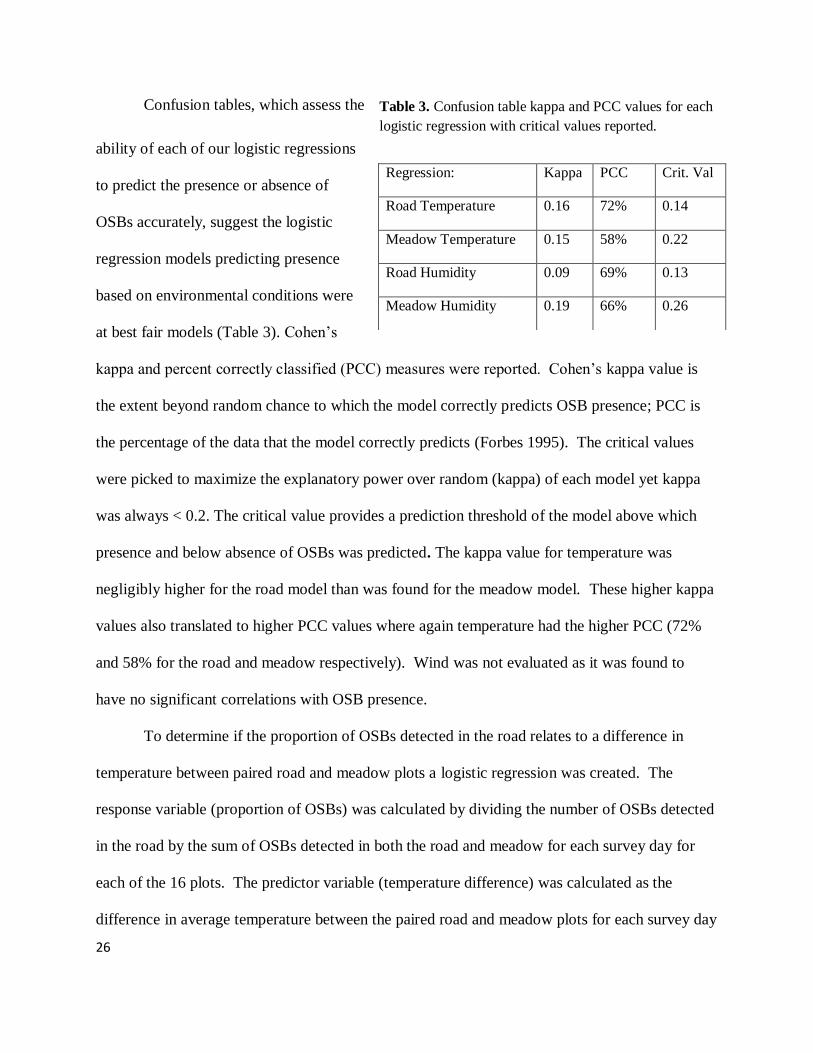
Confusion tables, which assess the
ability of each of our logistic regressions
to predict the presence or absence of
OSBs accurately, suggest the logistic
regression models predicting presence
based on environmental conditions were
at best fair models (Table 3). Cohen‟s
kappa and percent correctly classified (PCC) measures were reported. Cohen‟s kappa value is
the extent beyond random chance to which the model correctly predicts OSB presence; PCC is
the percentage of the data that the model correctly predicts (Forbes 1995). The critical values
were picked to maximize the explanatory power over random (kappa) of each model yet kappa
was always < 0.2. The critical value provides a prediction threshold of the model above which
presence and below absence of OSBs was predicted. The kappa value for temperature was
negligibly higher for the road model than was found for the meadow model. These higher kappa
values also translated to higher PCC values where again temperature had the higher PCC (72%
and 58% for the road and meadow respectively). Wind was not evaluated as it was found to
have no significant correlations with OSB presence.
To determine if the proportion of OSBs detected in the road relates to a difference in
temperature between paired road and meadow plots a logistic regression was created. The
response variable (proportion of OSBs) was calculated by dividing the number of OSBs detected
in the road by the sum of OSBs detected in both the road and meadow for each survey day for
each of the 16 plots. The predictor variable (temperature difference) was calculated as the
difference in average temperature between the paired road and meadow plots for each survey day
Regression: Kappa PCC Crit. Val
Road Temperature 0.16 72% 0.14
Meadow Temperature 0.15 58% 0.22
Road Humidity 0.09 69% 0.13
Meadow Humidity 0.19 66% 0.26
Table 3. Confusion table kappa and PCC values for each
logistic regression with critical values reported.
27
for all 16 plots. Records where no OSBs were detected in both of the paired plots on the same
survey day were omitted to reduce zero-inflation.
Earthen Berm (removal or addition) – Road-Cut Analyses
To determine if a sheltering effect was occurring in the major road-cut area along
Highway 101, student‟s t-tests were performed. These tests compared subplots within the road-
cut area (subplots 37-51) to an equal number of subplots to the immediate north (subplots 52-66)
and south (subplots 23-36) of the road-cut. These tests examined whether the number of OSBs
mean wind speed, and mean temperature in the road-cut area differed from the surrounding road
sections. Data from both the instantaneous scans and all occurrence surveys were pooled to
analyze the change in OSB presence. Data from the instantaneous scan sampling were used to
analyze the difference in wind speeds and temperature as this dataset is much larger (3200
records compared to 64) and better represents the variance of these environmental variables.
Vegetation Manipulation – Road-side Vegetation Analysis
Meadow flowering plants
Scatterplots were created to assess the relationship between meadow flowering plants and
OSB presence in the meadow and in the road.
Road flowering plants
A linear regression determined if the number of OSBs crossing the road (log transformed)
at the subplot level was a function of the number of flowering plants adjacent to the road.
28
4.0 Results
Road Mortality
There was one confirmed account of an OSB-vehicle collision: it occurred on August 19th
at 11:02 am in plot 7 (subplot 34) (Figure 7). The road-killed OSB, which was sexed as a female,
entered the road from the west and crossed both lanes of Highway 101 to the east-side of the
road, flew north, then when it attempted to cross back to the west it collided with a southbound
SUV type vehicle. Another dead OSB was
found on the walkway at the north end of
the Big Creek Bridge by the Siuslaw
National Forest wildlife biologist and may
have been killed by a passing vehicle
(Randy Miller, personal communication,
September 2009). Also, other animal-
vehicle collisions were witnessed
throughout the field study and included: a
barn swallow (Hirundo rustica), an
unidentified dragonfly, and bumble bees
(Bombus sp.). Last a dead bat (Myotis sp.),
vole (Microtus sp.), and unidentified
passerine, moth and other butterfly species
were found along Highway 101 throughout
the study period.
Figure 7. Vehicle and OSB interactions (no
collision, apparent collision, confirmed collision) by
plot for all accounts of detection either during
surveys (scan or all occurrence) or opportunistic
sightings. Across plots, 49 observations were from
Instantaneous scan sampling, 24 were from all-
occurrence surveys, and 22 were from opportunistic
sampling.
29
There were additional potential butterfly-vehicle collisions, though no others led to a
confirmed mortality. There were 9 instances where OSBs likely collided with a vehicle (apparent
mortality); these collisions could not be confirmed although the butterfly was not seen after the
car had passed and in each case the vehicle was moving away from the observer where the
vehicle grill could not be examined (Figure 7). In all of the apparent mortalities of OSBs the
road and roadside verge were inspected immediately after the vehicle had passed to see if the
butterfly had landed on the road surface or adjacent vegetated area along the road and none were
found. When witnessing bumble bee-vehicle collisions the carcasses or severely disoriented
individuals were scavenged by ants almost immediately. On several occasions ants attempted to
drag bumble bees off the road although they were still alive but unable to fly.
Environmental Parameters of OSB Flight
No OSBs were detected in the road below 13.9°C (57°F; Figures 8a-f). Also, no OSBs
were detected below 56.5 % relative humidity or above 79.6 % in the road. Lastly, no OSBs
were observed at wind speeds above 7.5 m/s (16.8 mph).
30
a) Road temperature b) Meadow temperature
c) Road wind speed d) Meadow wind speed
31
e) Road humidity f) Meadow humidity
Road Versus Meadow Plots
Environmental Conditions
None of the environmental variables
were significantly different in the road vs.
meadow. (humidity: 2=2.2, df=1, p=0.137;
wind(ln): 2 =0.07, df 1, P=0.793; temp:
2
=2.64, df 1, P=0.104) there was much more
variation across plots (humidity: 2=54.57, df
30, p = 0.004; wind(ln): 2 =45.48, df 30, p =
Figure 8a-f. Box plots of temperature (oC), wind (m/s), and humidity (%) with no OSB
presence (1) vs. OSB presence (2) for the road and meadow (a) temperature in the road, b)
temperature in the meadow, c) wind speed in the road, d) wind speed in the meadow, e)
humidity in the road , and f) humidity in the meadow).
*
Figure 9. Mean values of environmental variables
in the road and meadow (bars show +/- 95% C.I.;
n=3200).
*
Meadow Road *
32
0.035; temperature: 2=84.77, df 30, p < 0.001).
OSB Behavior
49 OSBs were sighted in the road out of 3200 scans across 21 surveys days, whereas 178
OSBs were sighted in the meadow per 3200 scans (149 of which were behaviors that could be
performed in the road), p-value = 0.013; Figure 10). OSB presence was significantly higher in
the meadow than in the road (paired t-test: t = -2.815, df=15, P =0.013; nested ANOVA:
Meadow F1,120=8.78, P =0.004), with ~3 times as many sightings of OSBs in the meadow (149 of
178 sighted doing behaviors that could occur in the road) than the road), with four times as many
sightings of butterflies in the meadow than the road when examining only butterflies engaged in
behaviors that could be found on the road (same area and time observed). This result indicates
preferential use of the meadow either by more butterflies or for longer durations.
Figure 10. Percent OSB presence over road (left) and meadow (right) showing number of zeros
(plots with no OSBs) by plot. Plot number 1 is at the south end of the site while plot number 16 is
the farthest north.
% OSB % OSB
% OSB Presence
% Zeros
%
% OSB Presence
% Zeros
%
Road OSB Percent Meadow OSB Percent
33
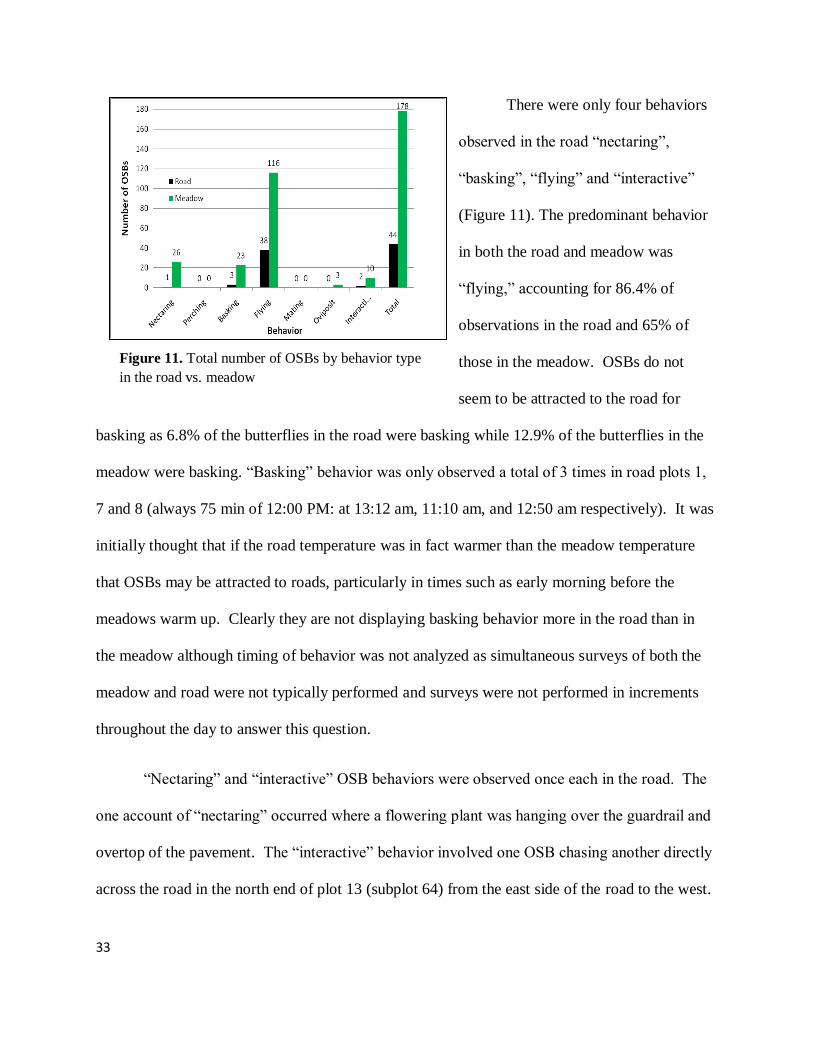
There were only four behaviors
observed in the road “nectaring”,
“basking”, “flying” and “interactive”
(Figure 11). The predominant behavior
in both the road and meadow was
“flying,” accounting for 86.4% of
observations in the road and 65% of
those in the meadow. OSBs do not
seem to be attracted to the road for
basking as 6.8% of the butterflies in the road were basking while 12.9% of the butterflies in the
meadow were basking. “Basking” behavior was only observed a total of 3 times in road plots 1,
7 and 8 (always 75 min of 12:00 PM: at 13:12 am, 11:10 am, and 12:50 am respectively). It was
initially thought that if the road temperature was in fact warmer than the meadow temperature
that OSBs may be attracted to roads, particularly in times such as early morning before the
meadows warm up. Clearly they are not displaying basking behavior more in the road than in
the meadow although timing of behavior was not analyzed as simultaneous surveys of both the
meadow and road were not typically performed and surveys were not performed in increments
throughout the day to answer this question.
“Nectaring” and “interactive” OSB behaviors were observed once each in the road. The
one account of “nectaring” occurred where a flowering plant was hanging over the guardrail and
overtop of the pavement. The “interactive” behavior involved one OSB chasing another directly
across the road in the north end of plot 13 (subplot 64) from the east side of the road to the west.
Figure 11. Total number of OSBs by behavior type
in the road vs. meadow
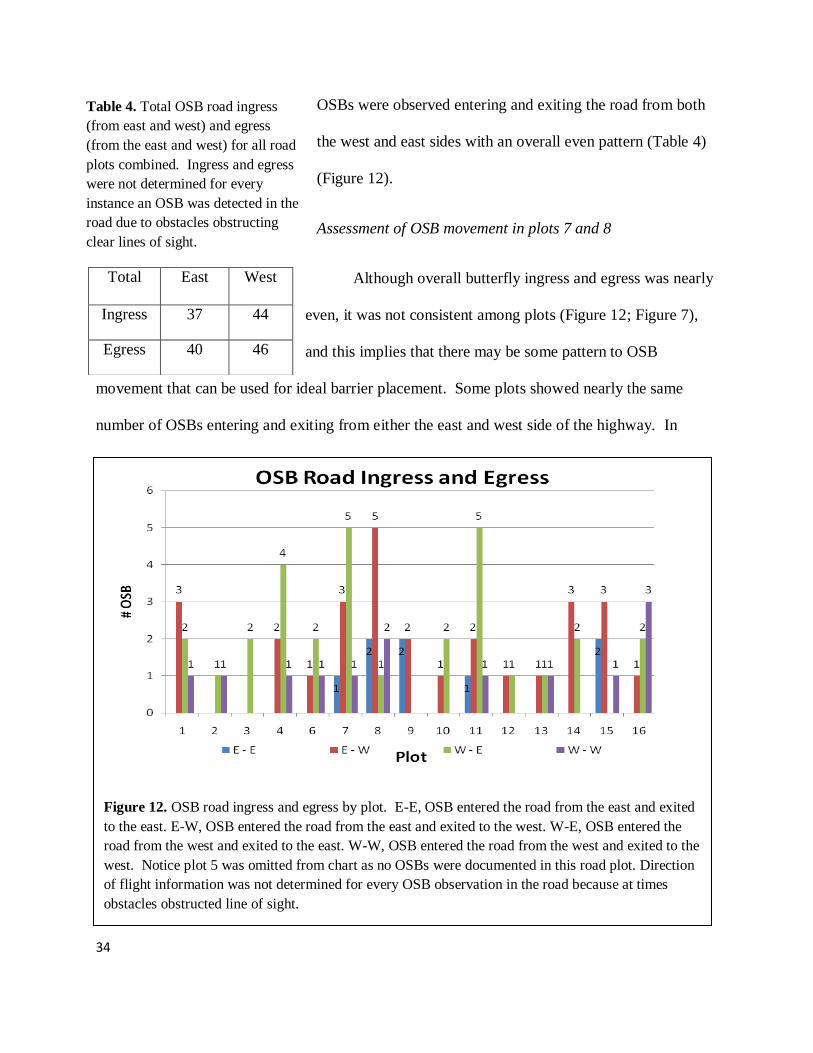
34
Table 4. Total OSB road ingress
(from east and west) and egress
(from the east and west) for all road
plots combined. Ingress and egress
were not determined for every
instance an OSB was detected in the
road due to obstacles obstructing
clear lines of sight.
OSBs were observed entering and exiting the road from both
the west and east sides with an overall even pattern (Table 4)
(Figure 12).
Assessment of OSB movement in plots 7 and 8
Although overall butterfly ingress and egress was nearly
even, it was not consistent among plots (Figure 12; Figure 7),
and this implies that there may be some pattern to OSB
movement that can be used for ideal barrier placement. Some plots showed nearly the same
number of OSBs entering and exiting from either the east and west side of the highway. In
Total East West
Ingress 37 44
Egress 40 46
Figure 12. OSB road ingress and egress by plot. E-E, OSB entered the road from the east and exited
to the east. E-W, OSB entered the road from the east and exited to the west. W-E, OSB entered the
road from the west and exited to the east. W-W, OSB entered the road from the west and exited to the
west. Notice plot 5 was omitted from chart as no OSBs were documented in this road plot. Direction
of flight information was not determined for every OSB observation in the road because at times
obstacles obstructed line of sight.
35
contrast, for example, two adjacent plots, 7 and 8, showed a circular pattern of movement
wherein OSBs entered the road at plot 7 from the west and exited the road to the east, whereas
they were primarily heading west when crossing the road in plot 8 (entering from east and
exiting west) (Appendix 6).
In some locations along Highway
101 the road surface is significantly lower
than the adjacent meadows creating a
walled corridor (road-cut) made of earth
and vegetation reaching well over 5 m in
height relative to the road surface (Figure
2). Plot 7 and the southern section of plot 8
were immediately south of the longest
walled corridor at this site and north of the
Big Creek Bridge. These same plots are
also a location in which the road surface of
Highway 101 slopes. The road begins to
drop in elevation at the southerly end of the
walled corridor (plot 8) and continues to
slope downward toward the south at a
moderate grade to the north-side of the Big
Creek Bridge where the road levels again
(plots 5 and 6) (Appendix 1).
Big Creek
Meadow 4 Road Plot 7
Slope with
flowering
vegetation
Figure 13. Photo of flowering vegetation adjacent to
road plot 7 and south of meadow area 4. Photo credit:
Sara Zielin.
Meadow Area 4
Big Creek Bridge
Figure 14. Aerial photo of OSB annual census
transects and meadow areas at Rock Creek – Big
Creek. Photo credit: Google (modified by Mike
Patterson and again by Sara Zielin).
36
The area west of the road plot 7 has many flowering plants (including Rubus sp.), but is
not considered meadow and is more of a sloping transitional zone from meadow area 4 to Big
Creek (Figure 13). This area, especially on windy days, seems to serve as shelter from the wind
and OSBs were observed accumulating just south of the meadow area 4. Presumably, OSBs
were taking shelter at this location when winds were very high in the more exposed meadow area
(Figure 14). Indeed, OSBs may have been pushed there by northwest winds (Appendix 7).
Meadow area 4 was also the location where the highest densities of OSBs (over 130
individuals/ha) were calculated during the 2009 OSB census surveys (Appendix 8 and 9)
(Patterson 2009).
Differences between Road Sections
Overall results from All-Occurrence surveys
24 OSBs were detected from the all-occurrence surveys (64 survey periods). These were
observed in all road plots except plot 5 (Figure 15), which was beyond the Big Creek Bridge.
The mean temperature and wind speed were slightly higher than those reported for the road scan
surveys (Figure 16).
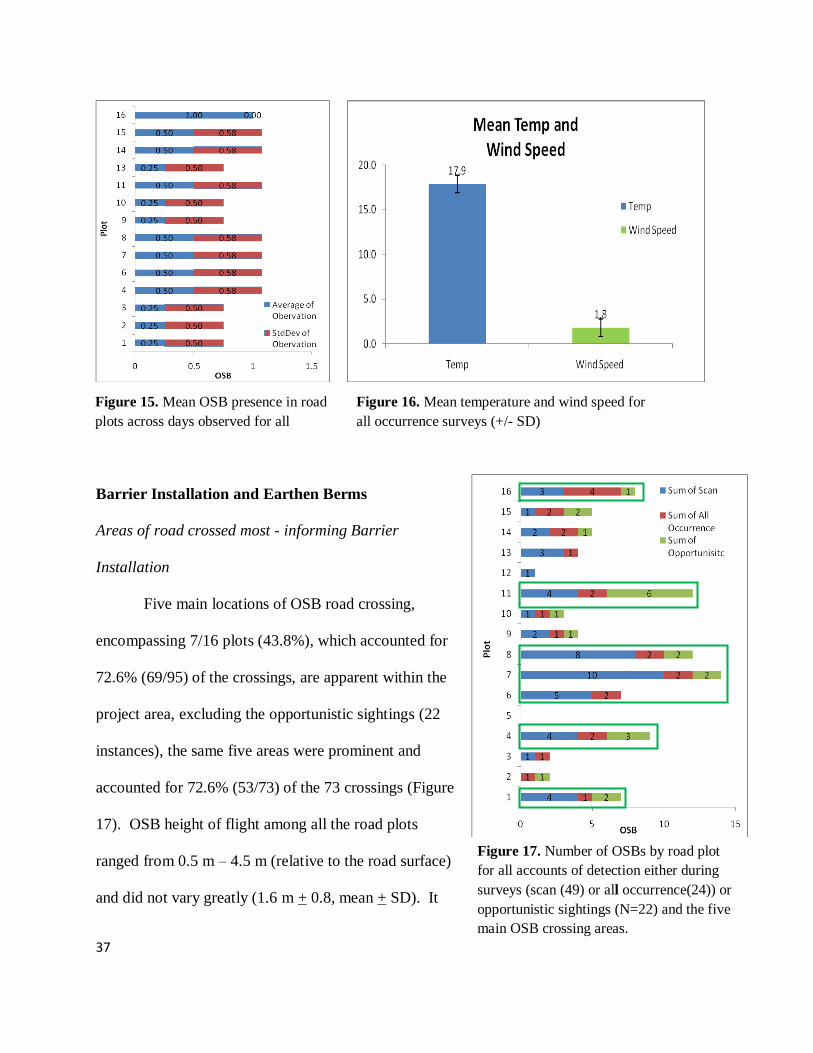
37
Barrier Installation and Earthen Berms
Areas of road crossed most - informing Barrier
Installation
Five main locations of OSB road crossing,
encompassing 7/16 plots (43.8%), which accounted for
72.6% (69/95) of the crossings, are apparent within the
project area, excluding the opportunistic sightings (22
instances), the same five areas were prominent and
accounted for 72.6% (53/73) of the 73 crossings (Figure
17). OSB height of flight among all the road plots
ranged from 0.5 m – 4.5 m (relative to the road surface)
and did not vary greatly (1.6 m + 0.8, mean + SD). It
Main
Crossings
Figure 17. Number of OSBs by road plot
for all accounts of detection either during
surveys (scan (49) or all occurrence(24)) or
opportunistic sightings (N=22) and the five
main OSB crossing areas.
Figure 15. Mean OSB presence in road
plots across days observed for all
occurrence survey data (+/- SD)
Figure 16. Mean temperature and wind speed for
all occurrence surveys (+/- SD)
38
should be mentioned that it was difficult to estimate flight height above the staff height (3.5 m)
which was used as a reference. OSBs tended to fly directly across the road without lingering,
and 55 (55/95, 57.9%) flew directly across the road. Most other OSBs continued to fly the
length of the road but either eventually returned back to the side where they initially entered the
road or exited across the road. Egress was not documented for every OSB sighted in the road as
visual obstructions sometimes impeded line of sight.
Areas of road crossed most - informing Earthen Berms
No difference was detected between OSB presence in the road-cut subplots vs. subplots
to the immediate north and south (log of number of OSBs in road-cut = 0.64+0.16 vs. log of
number outside of road-cut = 0.59+0.12; t-test: t = -0.27, n = 45, p = 0.7884).
Differences in environmental conditions among road sections – informing Earthen Berms
The road-cut subplots had significantly lower wind speeds and warmer temperatures than
the subplots immediately adjacent to the north and south (log of wind speed in road-cut =
0.900.04 versus log of wind outside of road-cut = 1.060.03; t-test: t = 3.59, n = 45, p =0.0006;
mean temperature in road-cut = 18.60.24oC versus outside of road-cut = 17.10.17
oC; t-test: t=-
4.76, n=45, p<0.0001).
39
Differences in Flower Availability
Flowers in meadow
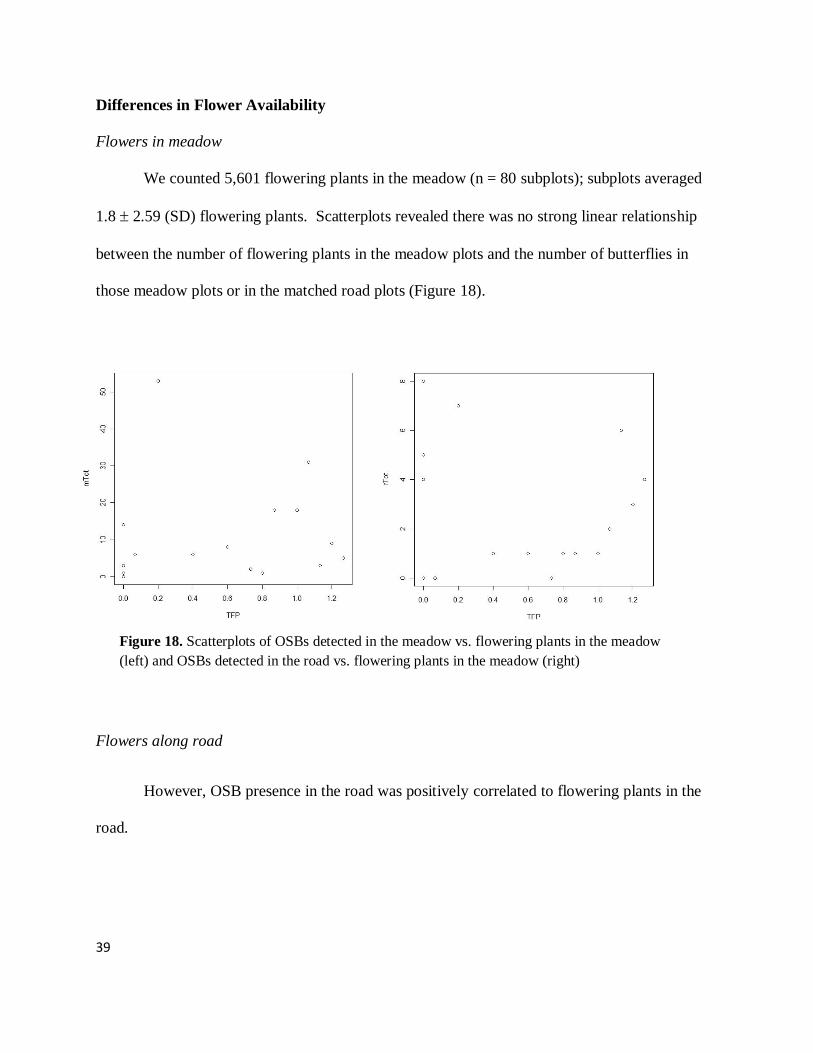
We counted 5,601 flowering plants in the meadow (n = 80 subplots); subplots averaged
1.8 2.59 (SD) flowering plants. Scatterplots revealed there was no strong linear relationship
between the number of flowering plants in the meadow plots and the number of butterflies in
those meadow plots or in the matched road plots (Figure 18).
Flowers along road
However, OSB presence in the road was positively correlated to flowering plants in the
road.
Figure 18. Scatterplots of OSBs detected in the meadow vs. flowering plants in the meadow
(left) and OSBs detected in the road vs. flowering plants in the meadow (right)
40
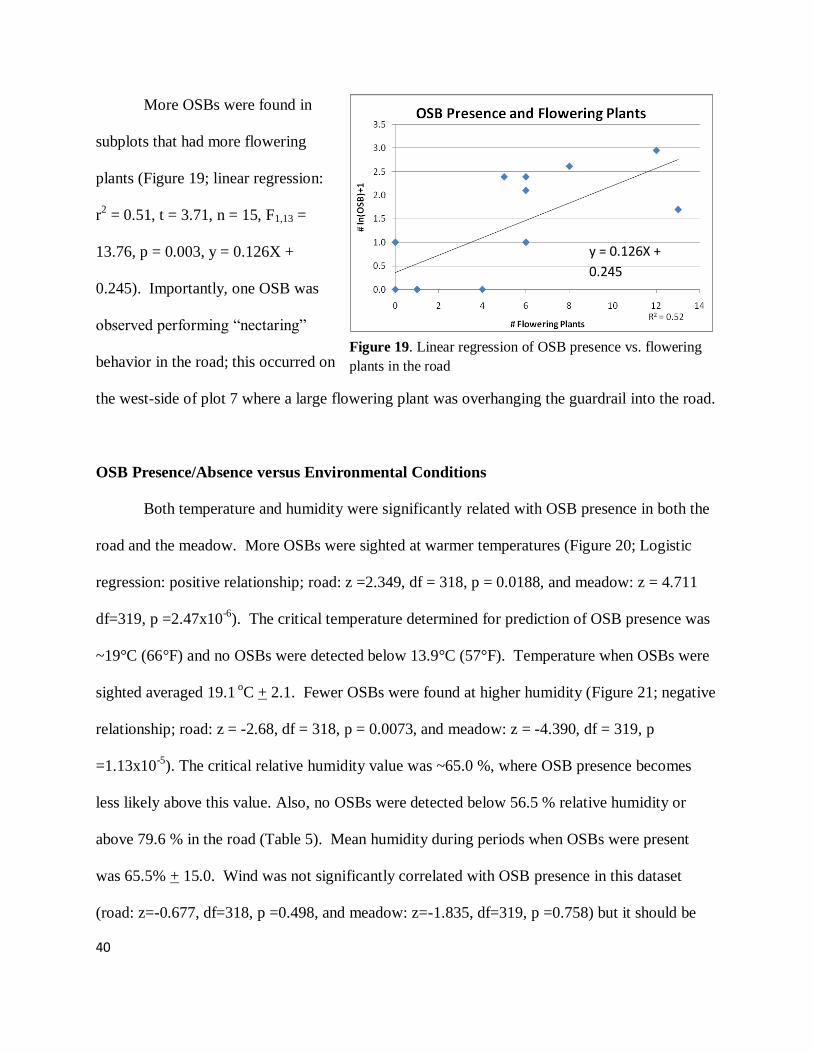
More OSBs were found in
subplots that had more flowering
plants (Figure 19; linear regression:
r2 = 0.51, t = 3.71, n = 15, F1,13 =
13.76, p = 0.003, y = 0.126X +
0.245). Importantly, one OSB was
observed performing “nectaring”
behavior in the road; this occurred on
the west-side of plot 7 where a large flowering plant was overhanging the guardrail into the road.
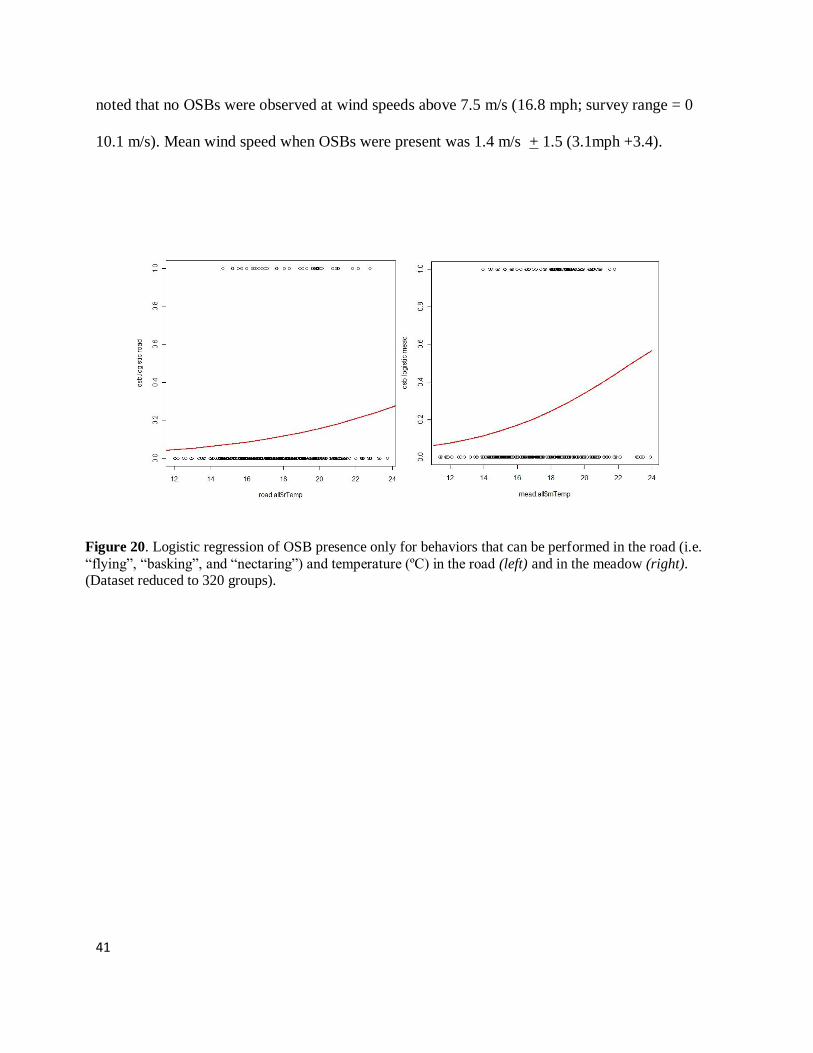
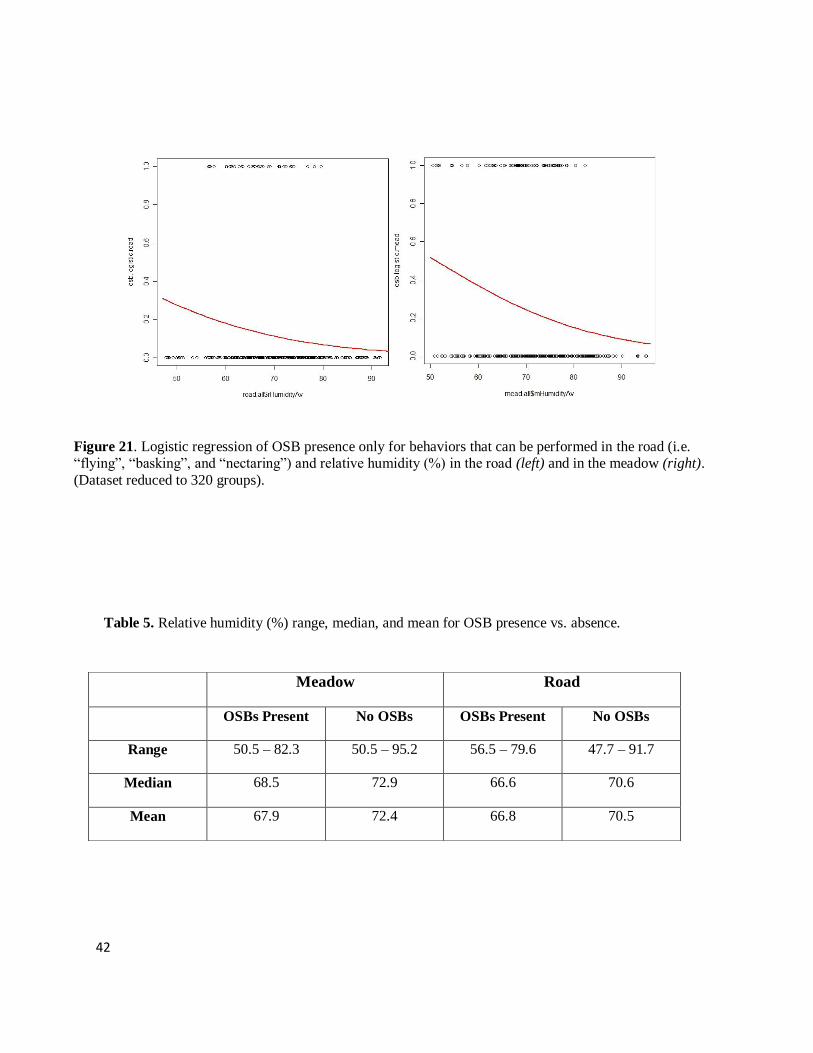
OSB Presence/Absence versus Environmental Conditions
Both temperature and humidity were significantly related with OSB presence in both the
road and the meadow. More OSBs were sighted at warmer temperatures (Figure 20; Logistic
regression: positive relationship; road: z =2.349, df = 318, p = 0.0188, and meadow: z = 4.711
df=319, p =2.47x10⁻⁶
). The critical temperature determined for prediction of OSB presence was
~19°C (66°F) and no OSBs were detected below 13.9°C (57°F). Temperature when OSBs were
sighted averaged 19.1 oC + 2.1. Fewer OSBs were found at higher humidity (Figure 21; negative
relationship; road: z = -2.68, df = 318, p = 0.0073, and meadow: z = -4.390, df = 319, p
=1.13x10⁻⁵
). The critical relative humidity value was ~65.0 %, where OSB presence becomes
less likely above this value. Also, no OSBs were detected below 56.5 % relative humidity or
above 79.6 % in the road (Table 5). Mean humidity during periods when OSBs were present
was 65.5% + 15.0. Wind was not significantly correlated with OSB presence in this dataset
(road: z=-0.677, df=318, p =0.498, and meadow: z=-1.835, df=319, p =0.758) but it should be
y = 0.126X +
0.245
R2 = 0.52
Figure 19. Linear regression of OSB presence vs. flowering
plants in the road
41
noted that no OSBs were observed at wind speeds above 7.5 m/s (16.8 mph; survey range = 0
10.1 m/s). Mean wind speed when OSBs were present was 1.4 m/s + 1.5 (3.1mph +3.4).
Figure 20. Logistic regression of OSB presence only for behaviors that can be performed in the road (i.e.
“flying”, “basking”, and “nectaring”) and temperature (ºC) in the road (left) and in the meadow (right). (Dataset reduced to 320 groups).
42
Meadow Road
OSBs Present No OSBs OSBs Present No OSBs
Range 50.5 – 82.3 50.5 – 95.2 56.5 – 79.6 47.7 – 91.7
Median 68.5 72.9 66.6 70.6
Mean 67.9 72.4 66.8 70.5
Table 5. Relative humidity (%) range, median, and mean for OSB presence vs. absence.
Figure 21. Logistic regression of OSB presence only for behaviors that can be performed in the road (i.e. “flying”, “basking”, and “nectaring”) and relative humidity (%) in the road (left) and in the meadow (right).
(Dataset reduced to 320 groups).
43
5.0 Discussion of Prioritized Mitigation Types and Management Suggestions
One fifth of OSBs observed in road and meadow-plot surveys ventured outside their
preferred habitat of the meadow and onto Highway 101, presumably to access habitat on the
other side. This high proportion of road crossings suggests the OSBs at Rock Creek – Big Creek
are highly vulnerable to vehicle-butterfly collisions. Risk of road mortality is likely the most
severe during August when traffic, temperature, and OSB abundance all peak. During this study,
which was mostly conducted during this peak risk time, one instance of vehicle-caused mortality
was confirmed (of 95 butterflies seen in the roadway). In addition, nine instances (10 %) were
recorded for which vehicle-related mortality was likely but death could not be verified (apparent
mortality) even though the road and adjacent vegetation was searched immediately after a
butterfly-vehicle interaction. It‟s possible that the nine apparent mortalities of OSBs stuck to the
grills of passing vehicles upon collision.
Several management options are being considered to reduce the risk of butterfly mortality
due to vehicle-butterfly collisions. This study on butterfly use of the road was conducted to help
identify where and when butterflies use the road in order to inform choices from the different
management options being considered. Here, we use the study results as a first attempt to
identify which management options may be suitable to pursue for future application or for
research. Below, the mitigation options are listed in order of priority (from highest to lowest)
based on study results and other literature.
Vegetation Manipulation – High Priority
Vegetation manipulation has been established as high priority as it offers a benefit at an
assumed relatively low, though on-going, cost. Several recommendations for manipulating
44
vegetation are supported by our data and additional observations. First, the verge could be
cleared of flowering plants, especially during the season of OSB flight. There were significantly
more OSBs found in plots with more flowering plants along the road (Figure 19), and an OSB
also was found nectaring in the road. Butterflies likely would reduce their time on the road and
perhaps also their number of crossings if the roadside had fewer available nectaring opportunities.
Although it is assumed that even with vegetations removed from each side of the road some will
randomly fly into the road corridor or cross to access alluring plants in opposite meadows. Not
only did we find more butterflies in roadside areas with more plants, other studies have
documented change in butterfly movement rates and resident time per microhabitat based on
their preference or motivation for that habitat type. For example, Kuefler and Haddad (2006)
found that the movements of four species of bottomland butterflies were influenced by boundary
type, stream proximity, and host plant abundance. In addition, Schultz (1998) reports that
butterflies may increase movement rates to escape through hostile or non-preferred habitat.
Second, the verge could be mowed in coordination with meadow mowings. The Forest
Service manages OSB habitat at the study site by implementing a mowing regime in the meadow.
Periodic mowings at key times throughout the year are performed to subdue mostly non-native
grasses (and salal) that outcompete the larval food plant (Viola adunca) of the butterfly. Oregon
Department of Transportation (ODOT) also manages vegetation along roadsides throughout the
state including Highway 101 but not necessarily in coordination with the Forest Service
mowings. Two opportunistic observations, which should be followed up with quantified data,
are relevant. It seemed the meadows had lower flowering plant diversity than the roadside. After
the summer mowing, the main flowering plant noticed in the meadows was Hypochaeris
radicata. Coordinated mowing would decrease this disparity. Anecdotal observations also
45
indicated that, after a meadow mowing, there was a higher frequency of dense patches of
flowering plants along the roadside than the meadow. If these patterns are real, butterflies may
be attracted to the road more often and for a longer time than expected when there are fewer or
lower diversity of flowering plants in their preferred habitat.
Third, the Rock Creek – Big Creek site is considered critical habitat, any modification of
such habitat would require consultation with USFWS and concurrence with the process prior to
modification. Although the intent of all the mitigation options is to reduce mortality and
essentially support the recovery of the OSB, evaluating any potential changes made to the critical
habitat is mandated under the National Environmental Policy Act (NEPA). As a result
mitigation options may need to be modified to comply with USFWS and NEPA.
Last, although a significant positive relationship was apparent between OSB presence and
flowering plants (Figure 19) follow up testing in the verge should be performed to a) determine if
these same hotspots for crossing are found once the mowing regime has changed, and b)
manipulate distribution of roadside flowers by moving potted plants to different plots and
determining if this affects where OSBs enter and cross the road.
Management Suggestions for Vegetation Manipulation
1) Remove all potential nectar plants along the road corridor at the study site;
2) Coordinate mowing efforts between the USDA Forest Service (meadow management)
and ODOT (roadside management);
3) Increase nectar plants in meadows by manipulating meadow mowing regime (dates
and/or locations) or by planting additional nectaring plants away from the road;
46
4) Create preferred habitat in meadows on both sides of Highway 101 that include forest
fringe and nectar and larval food plants so butterflies do not have to cross the road to
access a resource not available on one side.
5) Perform a follow-up test on OSB presence vs. flowering plants in the roadside verge to
corroborate our results acquired from only one sampling season and to determine if these
results change once the mowing regime is in place.
Due to these recommendations, ODOT mowed the verge the following summer; subsequently no
butterflies were found nectaring near the road or loitering on the road and all crossings were
straight across the road and were attributed to resource use (V. Bennett, personal communication,
2010).
Barrier Installation – High to Moderate Priority
Barriers are prioritized as high to moderate priority as this mitigation type is likely to be
successful, but at a greater cost than vegetation manipulation. Barriers have the ability to
manipulate movement of wildlife. One example of a successful barrier implementation is with
the royal tern (Sterna maxima) in Sebastian Inlet State Park, Melbourne Beach, Florida. There
the barrier is a visual one, with 122 3-m-long metal poles spaced 3.7 m apart with no fencing or
netting linking them together and installed along both sides of a 13.1 m high two-lane bridge
over an inlet (Bard et al. 2002). Bard et al. (2002) evaluated the effectiveness of this barrier in
reducing the incidence of collisions between royal terns and vehicles along the bridge. The poles
served as a „visual barrier‟ to the terns; i.e., perceived as an impermeable or undesirable route for
them to cross. The birds responded by flying higher; over the bridge and poles, effectively

47
avoiding vehicles on the bridge. Bard et al. (2002) found that significantly fewer terns (64%
decrease) were killed post-barrier installation.
Although birds and butterflies are very different species, parallels may be drawn between
the two in relation to how they interact with roads and barriers. Severns (2008) studied Fender‟s
blue butterflies (Icaricia icarioides fenderi) along a narrow two-lane, paved road 10 km west of
Eugene, Oregon, that bisects the butterfly habitat. He observed the response of Fender‟s blue
butterflies to roads and physical barriers (particularly hedgerows) to determine if either of those
retarded butterfly movement between the south and north habitat patches. The results indicate
that the road does not act as a barrier for movement of the Fender‟s blue butterfly and this
remains consistent with other published research (Munguira and Thomas 1992; Ries and
Debinski 2001). However, the hedgerows did appear to serve as a barrier to butterflies as 1.2 %
(less than 2% of males and 10% of females) flew over the hedgerows. Nearly 97% of butterflies
observed crossed the road from the south to north, approached and tracked the length of
hedgerow for approximately 5 m before they crossed back over the road to the south field. An
additional 1.9% of butterflies observed followed the same general path but returned immediately
to the south once they approached the hedgerow. No collisions were observed during the
surveys and the probable cause for this is the very low number of vehicles observed using the
road (3 vehicles) and the low speed (40 km/hr) of vehicles traveling on the road. It appears,
therefore, that barriers, man-made or natural, can be used to manipulate movement of wildlife.
Fences, netting, guardrails, and/or concrete (temporary or permanent) structures in key
locations could manipulate movement of butterflies, ideally keeping OSBs in meadows longer or
forcing them to fly higher over the road and vehicle turbulence than they otherwise would, while
allowing access to all habitats. Four lines of evidence suggest this management would be
48
effective here. First, butterflies were not seeking out the road to use as a habitat, except for
nectaring on the verge: they basked less in the road and spent much less time in the road than the
surrounding habitat. Second, height of flight above the road ranged from 0.5m – 4.5m and
typically depended on the height of vegetation or land on either side of the road. Third, OSBs
tended to follow the most direct route across the road, and typically did not loiter. Fourth, five
road segments (across seven plots) accounted for the majority (72%) of OSB crossings (Figure
17 and Table 3), suggesting that strategic placement of relatively narrow barriers could be
effective. These plots had higher densities of flowering plants alongside, were adjacent to areas
where captive-reared OSBs were released (and counts were historically high), and may be travel
routes due to the topography and resource distribution. Thus, these areas have promise as
potential locations for barrier placement, with higher priority of placement going to areas that
have a negative slope on one side of the road and a positive slope immediately across the road to
complete a continuous and natural path over the road (S. Jacobson, personal communication,
January 10, 2010). It may be necessary to extend the length of barriers beyond prioritized plot
locations to prevent circumvention of the barriers, such as with fences for ungulates (Clevenger
at al. 2001). In fact, OSBs were observed following edges and on several occasions butterflies
followed the length of the salal hedge that lines some sections of the Highway 101 and when
OSBs approached a break in the hedge they flew into the road.
OSB census report data can be used as a guide for timing of temporary barrier placement
to coincide with the peak of OSB flight (Patterson 2009). Further research is needed to evaluate
barrier types and placement. Table 6 identifies the degree of habitat match and crossing rate
along with an associated ranking for priority of barrier installation. The actual barrier should be
positioned on the negative slope side of the road to elevate OSB crossing height.
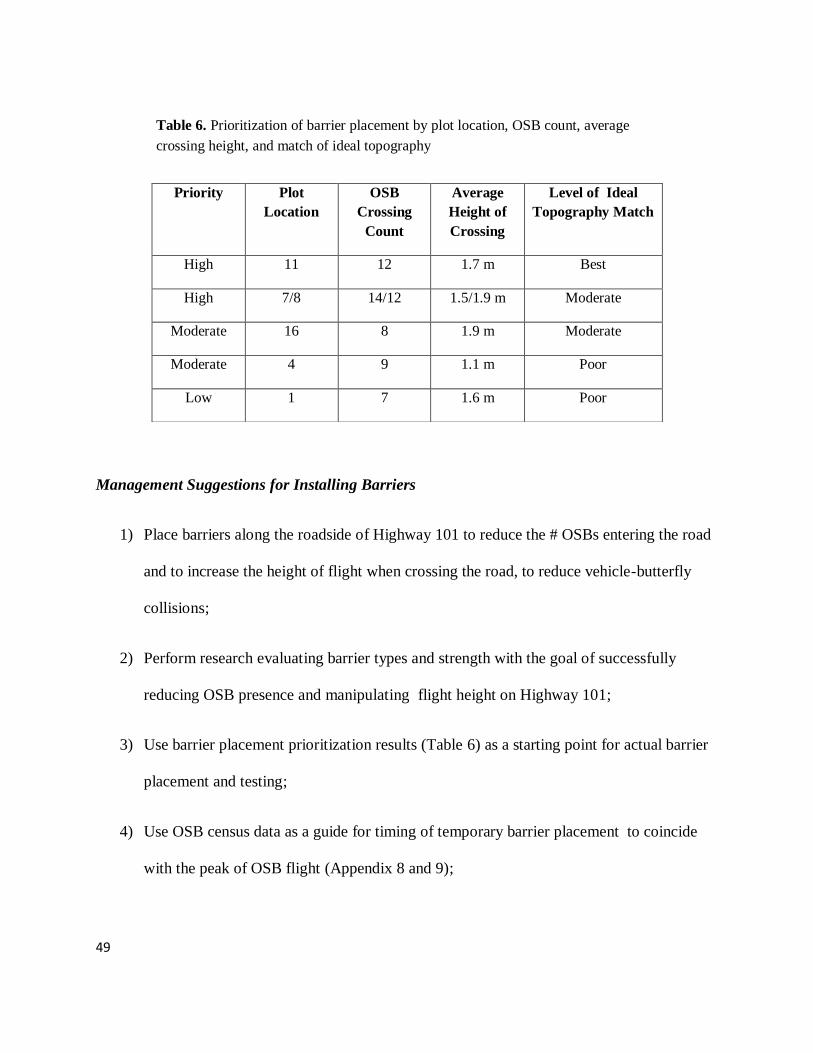
49
Management Suggestions for Installing Barriers
1) Place barriers along the roadside of Highway 101 to reduce the # OSBs entering the road
and to increase the height of flight when crossing the road, to reduce vehicle-butterfly
collisions;
2) Perform research evaluating barrier types and strength with the goal of successfully
reducing OSB presence and manipulating flight height on Highway 101;
3) Use barrier placement prioritization results (Table 6) as a starting point for actual barrier
placement and testing;
4) Use OSB census data as a guide for timing of temporary barrier placement to coincide
with the peak of OSB flight (Appendix 8 and 9);
Priority Plot
Location
OSB
Crossing
Count
Average
Height of
Crossing
Level of Ideal
Topography Match
High 11 12 1.7 m Best
High 7/8 14/12 1.5/1.9 m Moderate
Moderate 16 8 1.9 m Moderate
Moderate 4 9 1.1 m Poor
Low 1 7 1.6 m Poor
Table 6. Prioritization of barrier placement by plot location, OSB count, average
crossing height, and match of ideal topography
50
Flashing Speed Reduction Signal – Moderate Priority to Low Priority
An environmentally triggered flashing speed reduction sign as a mitigation option was
considered moderate priority because uncertain effectiveness, inconvenience to travelers, and
high cost may hinder feasibility. Animal detection systems
along with speed reduction are being investigated in several
areas to reduce large animal-vehicle collisions (Huijser et al.
2008), but these systems are still considered experimental, and
none have been used for animals invisible to drivers, or for
animals whose danger to the driver does not motivate speed
reduction. A speed limit of 15 mph was implemented for the
Hine‟s emerald dragonfly (Somatochlora hineana), a
federally-listed endangered species that experienced impacts
from vehicle and railway traffic (Soluk and Moss 2003).
Driver response to speed limit reduction is key to success, but
it is unknown if drivers will respond to an unusual, and invisible, reason for speed
reduction. Linking speed reduction to timing and environmental conditions typical of OSB flight
would reduce impacts to traffic and likely increase compliance.
Mortality studies of the dragonfly were performed by Soluk et al. (2003) in 1997 and
2002 and death rates ranged from 0-16.4 fatalities/km/day. Data were collected from multiple
roads with varying posted speed limits and found a significant decrease in mortality with
declining speed limits but the cause of this correlation remains untested.
Although the effect (or exact relationship) of vehicle speed reduction on vehicle-caused
mortality of the Hine‟s emerald dragonfly has not been studied, managers were asked to suggest
Figure 22. Photo of speed
reduction traffic sign for the
endangered Hine‟s emerald
dragonfly (Somatochlora
hineana). Photo credit: Dan
Soluk
51
an ideal speed limit for vehicles traveling on a road adjacent to dragonfly habitat (to essentially
avoid any dragonfly “take” caused by vehicle collisions) (D. Soluk, personal communication,
April 10, 2009). Managers of the dragonfly recommended a speed limit of 15 mph based on
their expertise related to the species and overall sense of how the dragonfly interacts with
vehicles from observations (Figure 22). Although no follow up research observing the
relationship between vehicle speed and mortality has been performed with the Hine‟s emerald
dragonfly, future research of this sort related to butterflies and other invertebrates should be
performed to better understand if there is in fact a predictable relationship between vehicle speed
and collisions with flying organisms and how it varies with flight speed.
One of the goals of this research was to determine the thresholds for flight and OSB
presence in the road relative to key environmental variables. These data provide a scientific basis
for recommendations regarding environmental conditions that would activate a speed reduction
sign when conditions were favorable for butterfly flight, if this mitigation option were pursued.
We examined the possibility of using temperature, wind speed, and humidity as predictors of
OSB presence.
OSB presence in the road increased with increasing temperature and decreased with
increasing humidity and wind speeds. No OSBs were found in the road at temperatures under
13.9o C, and this provides a conservative threshold option. An alternate possible threshold is to
use a cut-off of two standard deviations from the mean, which in our study was 19.1 o C + 4.2.
This cut-off would encompass all but 2.2% of the observations below the cut-off and thus would
greatly reduce risk of butterfly-vehicle collision but still greatly limit the hours when the speed
limit was reduced. A third option would be to use the temperature threshold predicted for flight
by the road logistic regression model (19.0°C). The logistic regression approach is a strong one
52
based on the best available empirical data, but our models had weak predictive power so in this
case may not provide the best option for a cut.
The positive relationship between OSB presence and temperature over the road or
meadow is consistent with other studies that indicate that butterflies are more likely to fly when
temperatures exceed 16 ºC (60oF) (McCorkle and Hammond 1988). In general, most Speyeria
require high body temperature to engage in normal activities and they typically suspend flight
unless there is full sun or if the ambient air temperature is higher than 21 ºC (70 o
F) when it is
cloudy (McCorkle and Hammond 1988). OSBs use solar heating to raise their body temperature
when ambient air temperature is ≤16oC (60
oF) to fly effectively and perform behaviors such as
foraging, mate seeking, predator evasion, and oviposition (Douglas 1978; Watt 1968). They
behaviorally thermoregulate by using a dorsal basking position where their wings are open in a
horizontal plane and their dark basal suffusions are exposed to the sun (McCorkle and Hammond
1988). Heat is absorbed by the basal suffusions, then transferred to the thorax, and is retained by
a thick coat of long hairs which serves as insulation for thoracic heat (Douglas 1978; McCorkle
1980).
Humidity may impact OSB flight as more water vapor in the air may cause higher rates
of evaporative cooling and keep butterflies below the threshold body temperature to fly. Fog and
rain, common at the Oregon coast, can also negatively affect butterfly flight (McCorkle and
Hammond 1988; USFW 2001; Haughton et al. 2003). In our study, 65% relative humidity was
determined to be the critical humidity value from the logistic regression, below which OSBs
were more likely to be active (no OSBs were detected below 56.6 %). The mean humidity value
during periods when OSBs were present in the road was 65.5 % + 15.0 (SD).
53
In this study OSBs were not observed either in the road or meadow at wind speeds above
7.5 m/s (17 mph). Two standard deviations from the mean, 1.4 m/s + 3.0, again provides another
possible cutoff. Similarly, other observations have found that wind speeds of 6.3 m/s (14 mph)
inhibit butterfly flight (N. Testa, personal communication, March 25, 2009; USFW 2001). Box
plots in Figure 8 depict environmental variables when OSB was not present as compared to when
OSB was present. Values for the road showed that temperature was higher when OSBs were
present, wind speeds were the same regardless of presence, and humidity was lower when OSBs
were present.
Temperature and wind speed are recommended variables to use to trigger a flashing
speed reduction sign. Humidity is strongly correlated with temperature and statistical models
(logistic regression) on humidity were not as robust as those with temperature. Temperature and
humidity were stronger predictors of OSB presence than wind speed in logistic regression
models on our dataset, although even those models did not have high explanatory power. All the
modeling efforts suffered from the fact that survey times were selected to maximize butterfly
occurrence and therefore did not have many sample points near or beyond the environmental
thresholds. For example, the average wind speed in our study (2.5 m/s or 5.6 mph) was much
lower than the wind speeds that inhibit flight.
Speed reduction to reduce OSB mortality is an intriguing mitigation option that warrants further
study as little is known about the effectiveness of speed reduction to reduce mortality (Huijser et
al. 2008) or the effectiveness of engaging driver response to a benign target. Further research
may be needed to support this option, however. A study examining the relationship between
vehicle speed and butterfly mortality would help identify the maximum speed limit that could
substantially decrease mortality. The ideal reduced speed to alleviate OSB vehicle-kills is
54
unknown especially considering the fragility of butterflies in turbulent air caused by passing
vehicles. Assuming a given speed reduction, reducing traffic speed when temperatures are above
19.0°C and wind speeds are below 7.5 m/s would minimize the amount of time speed reduction
is implemented.
Road-kill Analysis
The one documented vehicle-caused death of an OSB likely underestimates mortality as
this was documented from only 48 hours of survey time across 21 days of observations on the
road. There were approximately 59 days during the summer of 2009 when OSBs could have
been present based on the first detection on July 22 and last detection on September 18 (data
from this study and from OSB census data, Patterson 2009) although this estimate doesn‟t
exclude days when weather was unsuitable for butterfly flight (i.e. raining or other unfavorable
weather). OSBs were detected as early as 9:30 a.m. and as late as 16:30 p.m. although they may
have been active at times other than this timeframe but surveys were not typically performed
outside of this range. Also, three or four paired plots were surveyed per day and it‟s possible that
OSB presence may be exceedingly underestimated for plots that were surveyed at times further
from the warmest part of the day. Last, there were 9 occasions of apparent mortalities where no
carcasses were found after vehicles passed and it‟s speculated that these butterflies collided with
and stuck to the grills of passing vehicles. All apparent mortalities occurred when vehicles were
driving away from the observer and OSBs crossed the road on the distal side of the vehicle
furthest away from the observer (so the potential collision was not visible to the observer).
Again the road and roadside verge were investigated for OSB carcasses immediately after
vehicle-butterfly interactions and none were found.
55
The estimated range for OSB vehicle-caused mortality for any given year may fluctuate
considerably depending on various factors and OSBs may experience the greatest impact when
high vehicle traffic volume (McKenna and McKenna 2001) and a high number of eclosing OSBs
coincide. Peak flight for OSBs during the 2009 season was August 13th with 112 individuals
detected (Appendix 9) (Patterson 2009). Peak summer traffic counts are unknown for this site
but the AADT along this stretch of Highway 101 is 2100 vehicles. AADT at the Rock Creek-
Big Creek site is most likely an under estimate of actual vehicles traveling on the road when
OSBs are present. It is probable that the OSB flight season does indeed overlap with peak
summer travel (July through September) as most families take their summer vacations during
this time and because the Oregon coast is a desired vacationers destination. In fact, visitation
numbers to the Cape Perpetua Visitor Center (a nearby destination approximately 7 miles north
of the study site) indicates that July, August and September are the months with the highest
visitation, with the peak visitation month in August (36,827 visitors) (D. Dunn, personal
communication, 2009).
Based on the 2008 AADT up to 124,000 vehicles could be impacted by reduction in
speed at the study site although this would only occur if the traffic change was implemented 24
hours a day for the entire flight season (~59 days). The number of impacted vehicles could be
even higher as AADT is not corrected for the assumed increase in summer traffic volume. With
an environmental variable triggered traffic signal there would likely be times and perhaps even
full days, even within peak OSB flight, where the traffic signal may not be because of
unfavorable environmental conditions for flight. The ability to trigger a speed reduction sign
only when necessary is a great selling point for this mitigation option for several reasons: 1) it
slows traffic when OSBs are most likely present and reduces the potential for vehicle collision, 2)
56
it only slows traffic when the probability of OSB presence is at its highest which in turn reduces
the amount of unnecessary traffic build up, and 3) may keep local drivers stimulated and less
likely to disregard the traffic signal change. The low speed likely required to reduce butterfly-
vehicle collisions substantially on this coastal highway, however, keeps this option a low priority.
Management Suggestions for Flashing Speed Reduction Signal
1) Perform research to understand the relationship between vehicle speed and butterfly
mortality to determine what vehicle speed is necessary to reduce or eliminate mortality
due to vehicle collisions;
2) Reduce traffic speed when the temperature reaches 19°C, relative humidity is below 65%,
and when wind speeds are below the maximum wind speed where OSBs were observed
(7.5 m/s or 17 mph);
3) Perform a more comprehensive study to determine a predictor of OSB presence by using
other butterflies at the study site as a surrogate for OSBs, and test other predictor
variables not included in this study (such as solar radiation).
57
Earthen Berms – Varied Priority
Removing Berms – Not a Priority
The removal and addition of earthen berms as a mitigation option was established as a
low priority because no “sheltering” effect of OSBs was detected in the road-cut, despite its
lower wind speed and higher temperature, and OSB habitat is protected under the ESA as
“critical habitat” (ESA 1973).
Significantly more sightings of OSBs occurred in the meadow than in the road. They use
meadow habitat on both sides of the road for foraging, mating, and oviposition during the
summer (McCorkle and Hammond 1988; Arnold 1988). Most oviposition, however, occurs west
of the highway and much of the foraging occurs to the east (P. Hammond, personal
communication, June 12, 2009). Behaviors that could occur on the road, such as flying,
interacting, nectaring, or basking, also were much more frequent in the meadow. These data
suggest OSBs are not drawn to the road for basking or shelter.
Initially it was thought that the road-cut areas were serving as shelter for OSBs when
high winds persist and that butterflies were essentially loitering in the road. If this were the case,
removing the berms on the ocean-side would theoretically eliminate the dead air that was
allowing butterflies to linger effortlessly in the road since the primary wind direction is from the
northwest (Appendix 7, Weather Underground 2009).
Although there was no difference in the mean wind speed and temperature between the
meadow and road, there was a significant difference in the road-cut subplots and those to the
immediate north and south. The road-cut subplots had a lower mean wind speed and higher
mean temperature than the surrounding subplots; however this did not translate into more OSBs
in the road-cut area. One reason for this may be that the difference may not have been great
58
enough for the butterflies detect. In addition, air funneled through the road-cut as if it were a
tunnel independent of prevailing wind direction, albeit at lower wind speeds than the adjacent
plots. This was true even when the wind direction was perpendicular to the road-cut. For
example, on September 15th the average wind direction was 270
o (Weather Underground 2009)
and on that same day plot 10 (which has an azimuth of roughly 0o; Appendix 1) was surveyed
within the road-cut and the range of wind directions recorded was from 351o to 43
o. This
continual movement of wind through the road-cut indicates that, although the mean wind speeds
are different from the road-cut subplots to the adjoining subplots, this area does not necessarily
represent a shelter from wind.
Adding Hedges – High Priority
OSBs were observed loitering immediately south of meadow area 4 (next to road plot 7)
particularly on windy days (Figures 13 and 14). Although the flowering vegetation may have
drawn them there, anecdotal observations suggested that OSBs seemed to congregate in this
location on particularly windy days. This would indicate that OSBs may seek shelter from the
wind and that creating sheltered areas within or along the meadow may be a suitable solution to
keep OSBs in the meadow.
Although berms were not assessed as a barrier to butterflies here, other studies found that
hedgerows can act as a barrier to butterfly movement (Severns 2008). This did not seem to be
the case with OSBs at the study site. OSBs were observed flying over the road-cut or walled
corridor (typically from the west-side meadow), over Highway 101, to the habitat on the other
side of the road. They were also observed flying within the main road-cut corridor, generally
moving in a south-to-north direction starting from plots 7 or 8, and sometimes they would fly up
59
and out of the walled-corridor into the adjacent meadow. One possible explanation why OSBs
did not respond to hedgerows or berms the same way as the Fender‟s blue butterfly (Icaricia
icarioides fenderi) does may be due to the topography at the study site and the gradual transition
from meadow to hedge area.
Severns‟ (2008) findings that hedgerows are a barrier to butterflies may have been a
function of the abrupt transition in height from ground to hedgerow. If there was no other
vegetation acting to guide butterflies up towards the top of the hedges and the angle where the
hedgerows meet the ground is close to 90o butterflies may be more likely to perceive this as a
barrier. In contrast, at the Rock Creek-Big Creek site the road-cut/salal hedge from the meadow-
side is more transitional and less abrupt. If this observation is accurate, then it would be
expected that the road-cut may be more of a barrier for OSBs when they are attempting to exit
the road than when they are entering it.
Last, the removal of berms seems unnecessary because OSBs do not appear to be
loitering in the road-cut area. However, the addition of a berm or hedge in the meadows may be
practical when implementing as shelter. In this case, it still may not be necessary to remove
existing berms but rather plant hedges as the potential for an accidental “take” of OSBs during
construction or removal of a berm still exists. OSBs may be in some form of the larval or pupae
phase nearly year round at the Rock Creek – Big Creek site. This mitigation option may in fact
negate the purpose of its own efforts if not implemented with caution as there would be impacts
to larvae. Hedges would be less destructive to the critical habitat at the study site because
plantings would theoretically take up less space and disturb less earth where larvae reside. Since
the dominant winds at the study site are from the northwest (Appendix 7) placement of hedges
60
on the western boundary of the west-side meadow may be the most suitable location to create
safe wind sheltered areas.
Management Suggestions for Earthen Berms
1) Do not use the addition or removal of earthen berms to manipulate wind in the road
unless future research suggests OSBs start congregating in the road cut area;
2) Future research related to the road-cut area should include recording weather data using
fixed instruments in both the road and meadow. At a minimum weather meters should be
placed in the road (within the road-cut area and outside the road-cut area) and in the
meadow (adjacent to the suggested placement locations in the road).
3) Use hedgerows to create sheltered locations within the west-side meadows particularly in
meadow area 4 where the highest density of OSBs were detected;
Potential Risks Of Mitigation Suggestions
An in depth analysis on the potential negative impacts from mitigation measures is
difficult when there are multiple unknowns. This fact makes monitoring necessary and adaptive
management extremely valuable. Evaluation from the USFWS Endangered Species Biologist
actively working to restore OSB populations indicated no major risks of mortality or negative
effects are expected to be sustained by OSBs from the outlined management suggestions and the
management may have a positive effect on OSBs in the long term, assuming monitoring is
employed to assess project implementation and outcomes (A. Walker, unpublished data).
61
7.0 Conclusion
The Oregon Silverspot Butterfly is a threatened species that resides in four locations
along the Oregon coast, including Rock Creek – Big Creek. Highway 101 bisects the OSB
habitat at this site and poses the threat of vehicle collision when OSBs attempt to cross the road.
One vehicle-butterfly collision was documented during this study in the month of August and
resulted in the death of a female OSB. Four mitigation options are being considered to reduce
vehicle-caused mortality to OSBs at this location. Although determining which mitigation
measures should be pursued to minimize the impact of roads on the surrounding animal
community is not always straight forward. We evaluated potential management techniques to
determine which should be pursued further by gathering information on the behavioral ecology
of our target organism. We found using ecological observations with mitigation options in mind
an effective technique for prioritizing management options and identifying what related future
research is most needed. Approximately ¼ of the amount OSBs observed in the meadow plots
were observed in the road plots indicating that the road was not preferred habitat as was
suspected.
Vegetation manipulation was designated as the highest priority among the mitigation
options, as it appears to be an effective and relatively inexpensive option that will reduce OSB
presence in the road and presumably reduce vehicle-caused mortality. Barrier installation was
chosen as the second priority, as it also appears to be an effective mitigation option but with an
expected higher cost. The flashing speed reduction sign was set as a moderate priority because it
may be expensive and intolerable to motorists, and the actual effectiveness is difficult to quantify
without understanding how butterflies respond to reduced vehicle speeds. The removal of
earthen berms in the road cut area was given a low priority as it appears unnecessary to
62
manipulate wind flow in the road-cut area as no “sheltering” effect was detected. However, the
addition of hedges in the meadow was made a high priority, as these areas may serve as shelter
within the meadow area.
Future Research
Future research with the OSB related to road ecology includes performing a mortality
study to determine if reducing vehicle speed decreases vehicle-caused mortality to butterflies or
other flying insects in road corridors during the spring of 2010. Also, creating a traffic flow
model at the Rock Creek – Big Creek site should be performed to better understand probability
of mortality at different traffic volumes and to better understand the relationship between speed
and traffic volume. In creating the previously listed task data must be obtained on distributed
traffic volume by time of day and time of year so to overlap with when OSBs are active. Next,
research is planned to test the effectiveness of different barrier types and their interchangeable
extensions (along Highway 101 at Rock Creek-Big Creek) to: 1) keep butterflies out of the road
and 2) force them to fly higher when in the road corridor. Last, marking or tagging of adult
captive-reared OSBs released at sites should be preformed since this is not currently being done
and it would allow observers the ability to differentiate between the augmented and wild
populations of OSBs. Since OSBs are not marked there is no way to determine if the recent
increase in population index can be attributed to the captive-rearing program. Bee tags or
another technique devised by Severns using a felt tipped pen can be used to identify groups and
individuals (Paul Severns, personal communication, 2009).
63
8.0 Literature Cited
Adams, L.W., and A.D. Geis. (1983). Effects of roads on small mammals. Journal of Applied
Ecology, Vol. 20, 403-415
Arnold, R.A. (1988). Ecological and Behavioral Studies on the Threatened Oregon Silverspot
Butterfly at its Rock Creek, Cascade Head, Mt. Hebo, and Clatsop Plains Populations in
Oregon, U.S. Department of Interior, Fish and Wildlife Service, Olympia, Washington.
Ashley, E. P., and J. T. Robinson. (1996). Road Mortality of Amphibians, Reptiles and Other
Wildlife on the Long Point Causeway, Lake Erie, Ontario. Canadian Field Naturalist,
Vol.110, 403-412.
Bard, A.M., Smith, H.T., Egensteiner, E.D., Mulholland, R., Harver, T.V., Heath, G.W., Miller,
W.J.B., & Weske, J.S. (2002) A simple structural method to reduce road-kills of royal
terms at bridge sites, Wildlife Society Bulletin, 30, 603-605.
Bauer, D.L., (1955). Notes on the Papilio machaon complex in Arizona, The Lepidopterists’
News, 9, 7-10.
BFCI, The Butterfly Conservation Initiative. (2009). Oregon Silverspot Butterfly Speyeria
zerene hippolyta. Retrieved March 10, 2009, from:
http://www.butterflyrecovery.org/species_profiles/oregon_silverspot/
Cleary, D.F.R., Fauvelot, C., Genner, M.J., Menken, S.B.J., & Mooers, A.O. (2006). Parallel
responses of species and genetic diversity to El Nino Southern Oscillation-induced
environmental destruction. Ecology Letters 9, 304–310.
Clevenger, A.P., Chruszcz, B., & Gunson, K.E. (2001). Highway Mitigation Fencing Reduces
Wildlife-Vehicle Collisions. Wildlife Society Bulletin, 29, 646-653.
Conover, M. R, Pitt, W.C., Kessler, K. K., DuBow, T.J., & W.A. Sanborn. (1995). Review of
human injuries, illnesses and economic losses caused by wildlife in the U.S., Wildlife
Society Bulletin, 23, 407-414.
Douglas, M.M. (1978). The behavior and biophysical strategies of thermoregulation in temperate
butterflies. PhD. Dissertation, University of Kansas, Lawrence. 231 pp Diss. Abs. Int., 39
(7) 3133B-3133B. Order No. 78-24790
ESA, Endangered Species Act of 1973. Public Law 93-205, 87 Stat. 884, 16 U.S.C. 1531-1544.
Forbes, A.D. (1995) Classification-algorithm evaluation: five performance measures based on
confusion matrices. Journal of Clinical Monitoring, 11, 189–206.
Forman, R.T.T., & Sperling, D. (2003). Road Ecology: Science and Solutions. Washington, DC:
Island Press.
64
Forman, R. T.T., and Alexander, L. E. (1998). Roads and their major ecological effects. Annual
Review of Ecology and Systematics, 29, 207-231.
Frankham, R., Ballou, J. D., & Briscoe, D. A. (2002). Introduction to conservation genetics.
Cambridge University Press, Cambridge. 617 pp.
Free, J.B., D., Gennard, J.H. (1975). Stevenson and I.H. Williams. Beneficial insects present on
a motorway verge. Biological Conservation, Vol.8, 61-72.
Gunther, K., M. Biel, & H. Robinson. (1998). Factors influencing the frequency of road killed
wildlife in Yellowstone National Park. In: Evink, G.L., P. Garrett, D. Zeigler & J. Berry
(eds.). Proceedings of the international conference on wildlife ecology and transportation:
32-42. Fort Myers, Florida. FL-ER-69-98. Florida Department of Transportation,
Tallahassee, Florida.
Hammond, P. C. (1994a). 1994 report of silverspot butterfly use of native meadow habitat on the
Siuslaw National Forest. 16 pp.
Haughton, A. J., et al. (2003). Invertebrate responses to the management of genetically modified
herbicide-tolerant and conventional spring crops. II. Within-field epigeal and aerial
arthropods. Phil. Trans. R. Soc. Lond. B, 358, 1863–1877.
Huijser, M.P., & Kociolek, A.V. (2008). Wildlife-Vehicle Collision and Crossing Mitigation
Measures: A Literature Review for Blaine County, Idaho. Report to the Board of Blaine
County Commissioners. Blaine County, Hailey, Idaho, 83333.
Huijser, M.P., P., McGowen, J., Fuller, A., Hardy, A., Kociolek, A.P., Clevenger, D., Smith, and
R. Ament. (2008). Wildlife-Vehicle Collision Reduction Study: Report to
Congress.Publication FHWA-HRT-08-034. FHWA, U.S. Department of Transportation.
INS, Invertebrate Nervous System. (2010). Nervous System - Evolution Of Invertebrate Nervous
Systems. Retrieved May 5, 2010, from: http://science.jrank.org/pages/4595/Nervous-
System-Evolution-invertebrate-nervous-systems.html#ixzz0ndghql1f
Jackson, S.D. (2000). Overview of Transportation Impacts on Wildlife Movement and
Populations. Pp. 7-20 In Messmer, T.A., and West, (eds) Wildlife and Highways:
Seeking Solutions to an Ecological and Socio-economic Dilemma. The Wildlife Society.
Jackson, S.D. and C.R. Griffin. (2000). A Strategy for Mitigating Highway Impacts on Wildlife.
In Messmer, T.A. and B. West, (eds) Wildlife and Highways: Seeking Solutions to an
Ecological and Socio-economic Dilemma. The Wildlife Society, 143-159.
Kuefler, D., & Haddad, N.M. (2006). Local versus landscape determinants of butterfly
movement behaviors. Ecography, 29, 549-560.
65
National Atlas. (2008). Transportation of the United States. Retrieved May 14, 2009, from:
http://nationalatlas.gov/transportation.html
May, S. A., and T. W. Norton. (1996). Influence of fragmentation and disturbance on the
potential impact of feral predators on native fauna in Australian forest ecosystems.
Wildlife Research, 23, 87-400.
McCorkle, D.V. (1980). Ecological investigation report: Oregon silverspot butterfly (Speyeria
zerene hippolyta). USDA Forest Service, Siuslaw National Forest, Corvallis, Oregon. 117
pp.
McCorkle, D.V., and P.C. Hammond. (1988). Biology of Speyeria zerene hippolyta
(Nymphalidae) in a marine modified environment. Journal of the Lepidopterist's Society,
42, 184-195.
McIver, J., Muttillinja, S., Pickering, D. & VanBuskirk, R. (1991). Population dynamics and
habitat selection of the Oregon silverspot butterfly (Speyeria zerene hippolyta): a
comparative study at four primary sites in Oregon. Report to the U.S. Department of
Agriculture, Forest Service, Siuslaw National Forest, Corvallis, Oregon. 61 pp.
McKenna, D.D., & McKenna, K.M. (2001). Mortality of Lepidoptera along roadways in central
Illinois. Journal of the Lepidopterists‟ Society, 55, 63-68.
Munguira, M.L. & Thomas, J.A. (1992). Use of road verges by butterfly and burnet populations,
and the effect of roads on adult dispersal and mortality. Journal of Applied Ecology, 29,
316-329.
OCZMA, Oregon Coastal Zone Management Association. (2008). A History of U.S. Highway
101 – Onno Husing, Director, OCZMA. Retrieved October 3, 2009, from:
http://www.oczma.org/pdfs/U.S.Highway%20101%20Final_1.pdf
Oregon Zoo Conservation. (2009). Oregon Silverspot Butterfly. Retrieved May 14, 2009, from:
http://www.oregonzoo.org/Conservation/silverspot.htm
Patterson, M. 2009. Annual Report to U.S. Fish and Wildlife Service On cooperative agreement
#13420-8-J806, Oregon Silverspot Fritillary Population Monitoring 2009 Flight Season.
Pickering, D., Salzer, D., & Macdonald, C.A. (1992). Population dynamics and habitat
characteristics of the Oregon silverspot butterfly (Speyeria zerene hippolyta). Report to
the Siuslaw National Forest. The Nature Conservancy, Portland, Oregon. 100 pp.
Powers, R. (1988). Revised Biological Assessment on the effect of Big Creek Bridge
Replacement, U.S.101, Oregon Coast Highway, Lane County, Oregon, on the Oregon
Silverspot Butterfly (Speyeria zerene hippolyta). Oregon Department of Transportation.
66
Rao, R.S.P., & Girish, M.K.S. (2007). Road kills: Assessing insect casualties using flagship
taxon. Current Science, 92, 830-837.
Ries, L., & Debinski, D.M. (2001). Conservation Value of Roadside Prairie Restoration to
Butterfly Communities. Conservation Biology, 15, 401-411.
Saccheri, I., Kuusaari, M., Kankare, M., Vikman, P., Fortelius, W., & Hanski, I. (1998).
Inbreeding and extinction in a butterfly metapopulation. Nature 392, 491–494.
Schultz, C.B. (1998). Dispersal Behavior and Its Implications for Reserve Design in a rare
Oregon Butterfly. Conservation Biology, 12, 284-292.
Severns, P. (2008). Road crossing behavior of an endangered grassland butterfly, Icarici
icarioides fenderi macy (Lycaenidae), between a subdivided population. Journal of the
Lepidopterists’ Society, 62, 55-56.
Shine, R., M. Lemaster, M. Wall, T. Langkilde, and R. Mason. (2004). Why Did the Snake Cross
the Road? Effects of Roads on Movement and Location of Mates by Garter
Snakes(Thamnophis sirtalis parietalis). Ecology and Society, 9. [online] URL:
http://www.ecologyandsociety.org/vol9/iss1/art9/
Singleton, T.A. (1989). Population dynamics and habitat selection of the Oregon silverspot
butterfly (Speyeria zerene hippolyta) at Cascade Head Preserve. Report to the Siuslaw
National Forest. The Nature Conservancy, Portland, Oregon. 9 pp.
Smith, D.M. (2007). Butterflies and Vehicles Don‟t Mix. Nevada and Taiwan Take Steps to
Keep Them Apart, March 29, 2007, http://wildlife-conservation.suite101.com/article.
cfm/butterflies_and_vehicles_dont_mix. May 1, 2009.
Soluk, D.A., & Moss, K. (2003). Roadway and Exuvial Surveys of the Hine‟s Emerald
Dragonfly (Somatochlora hineana) in Door County, Wisconsin. Part II: Roadway
Fatalities. Submitted to: U.S. Fish and Wildlife Service.
Testa, N. (1995). Biological Assessment on the effects of the Big Creek Bridge Rehabilitation,
Lincoln County, Oregon, on the Oregon Silverspot Butterfly (Speyeria zerene hippolyta).
Oregon Department of Transportation.
USFW, U.S. Fish and Wildlife Service. (2001). Oregon silverspot butterfly (Speyeria zerene
hippolyta) revised recovery plan. U.S. Fish and Wildlife Service, Portland, Oregon.
Walker, A. (designer of diagram). (2010). Oregon Silverspot Butterfly Lifecyle, Retrieved March
15, 2020, from: [email protected]
Watt, W.B. (1968). Adaptive significance of pigment polymorphisms in Colias butterflies. I.
Variation of melanin pigment in relation to thermoregulation. Evolution, 22, 437-458.

67
Weather Underground. (2010). Weather data for Yachats, Oregon. Retrieved April 17, 2010,
from:http://www.wunderground.com/weatherstation/WXDailyHistory.asp?ID=MAS53
&day=17&year=2009&month=8&graphspan=year
68
10.0 Appendices
Appendix 1 – Rock Creek – Big Creek Site Maps
Overview Map
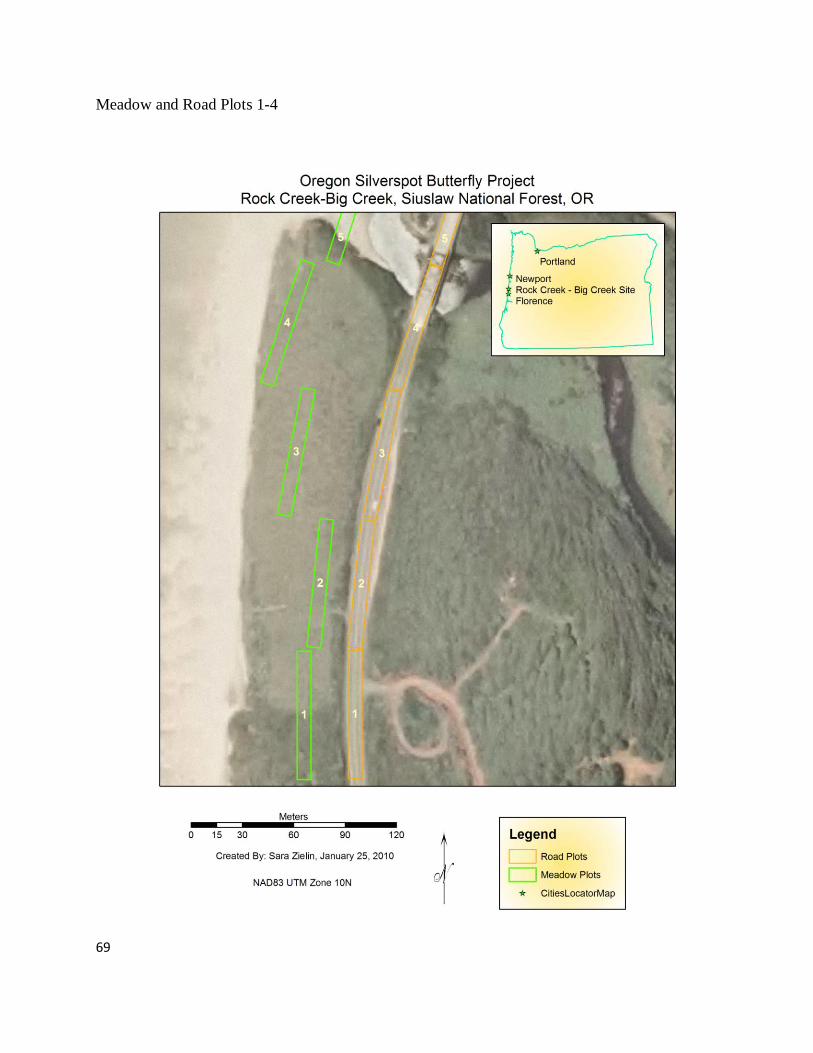
69
Meadow and Road Plots 1-4
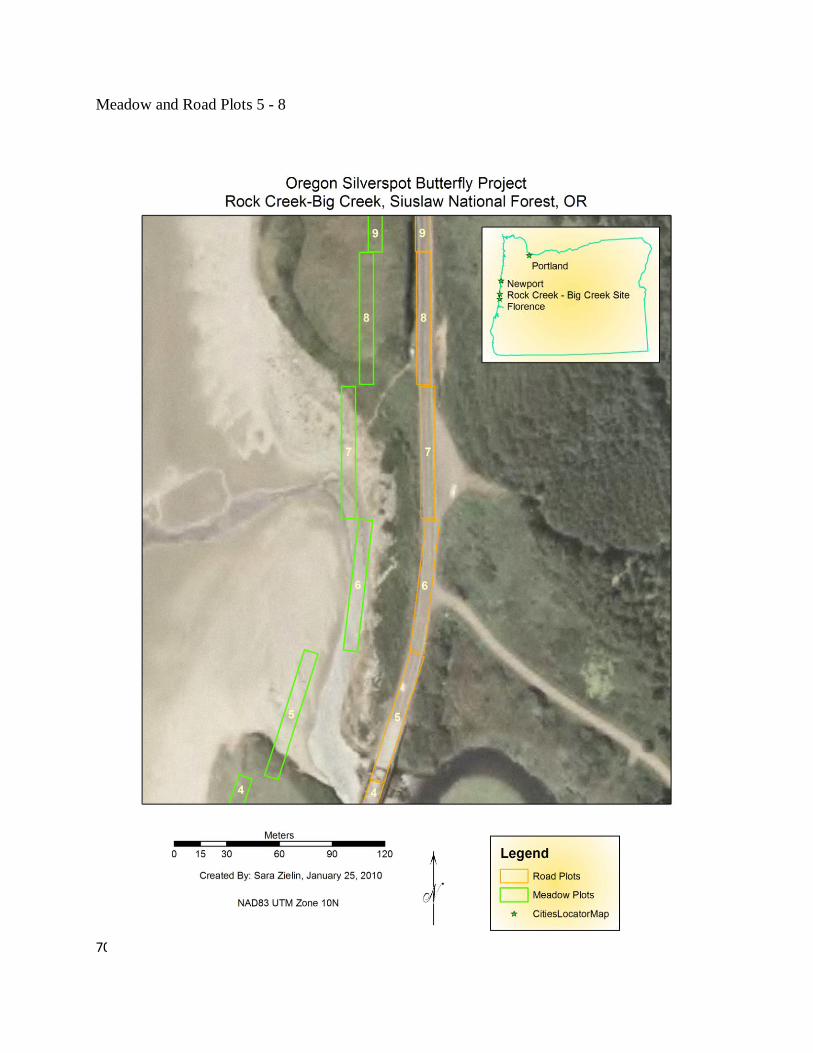
70
Meadow and Road Plots 5 - 8
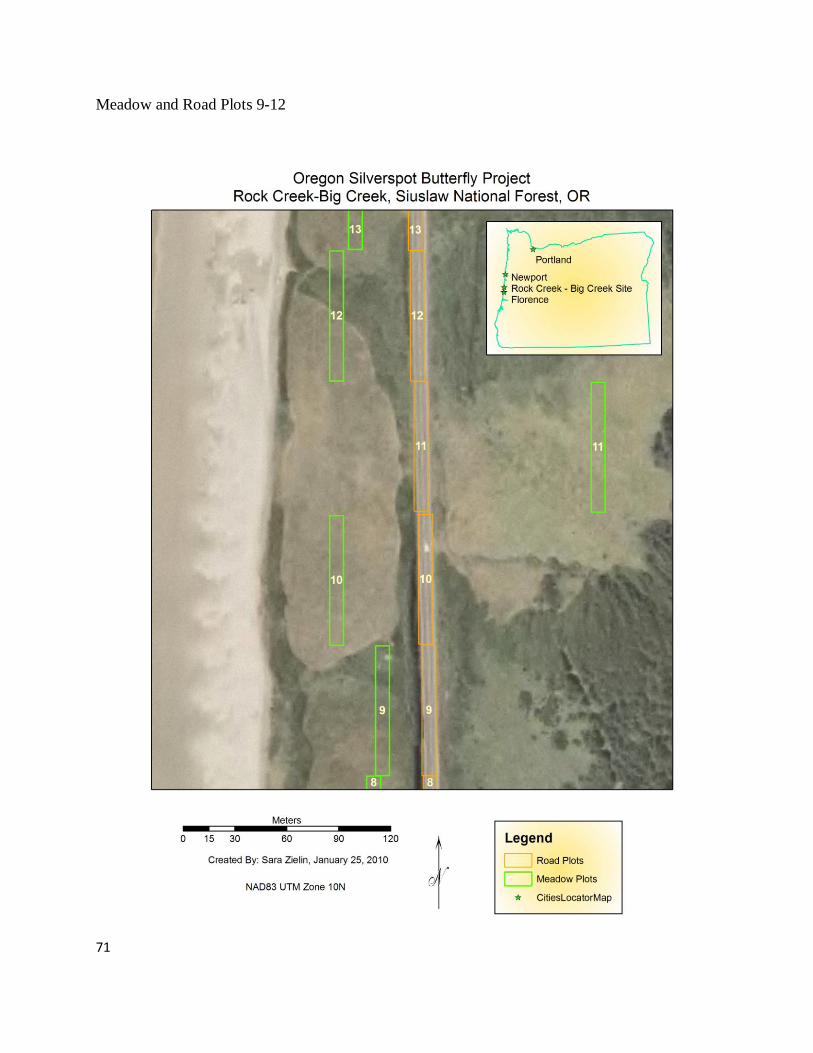
71
Meadow and Road Plots 9-12
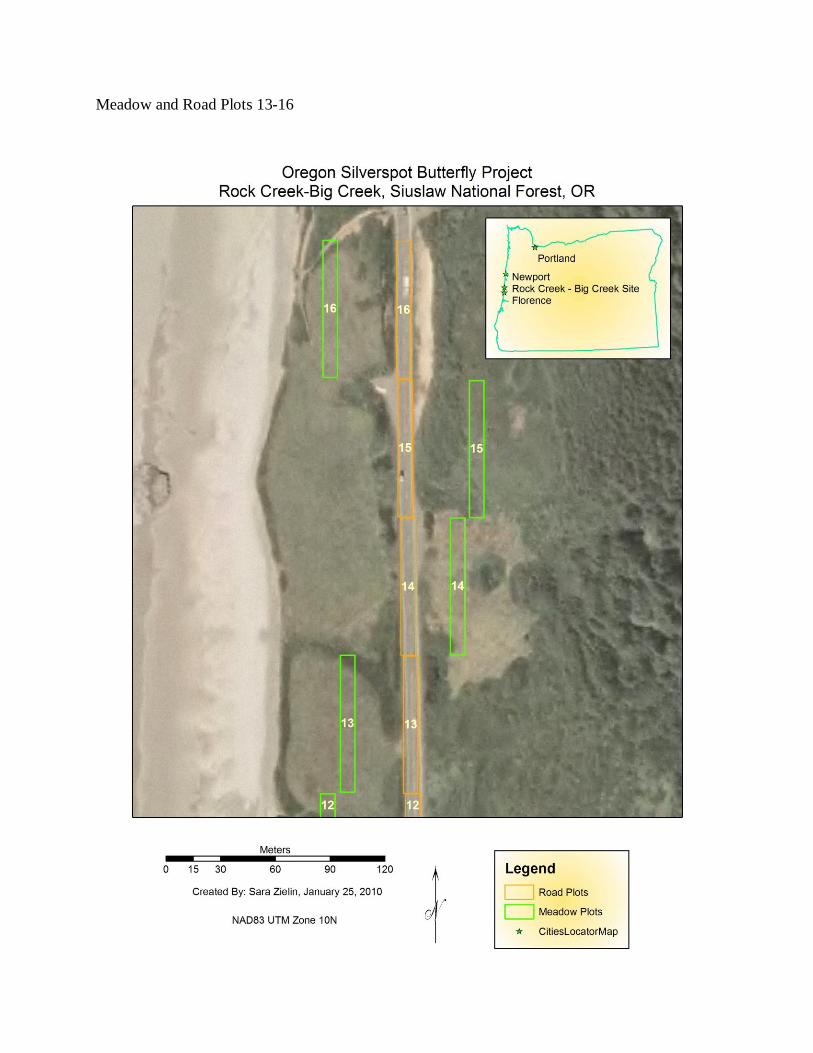
72
Meadow and Road Plots 13-16
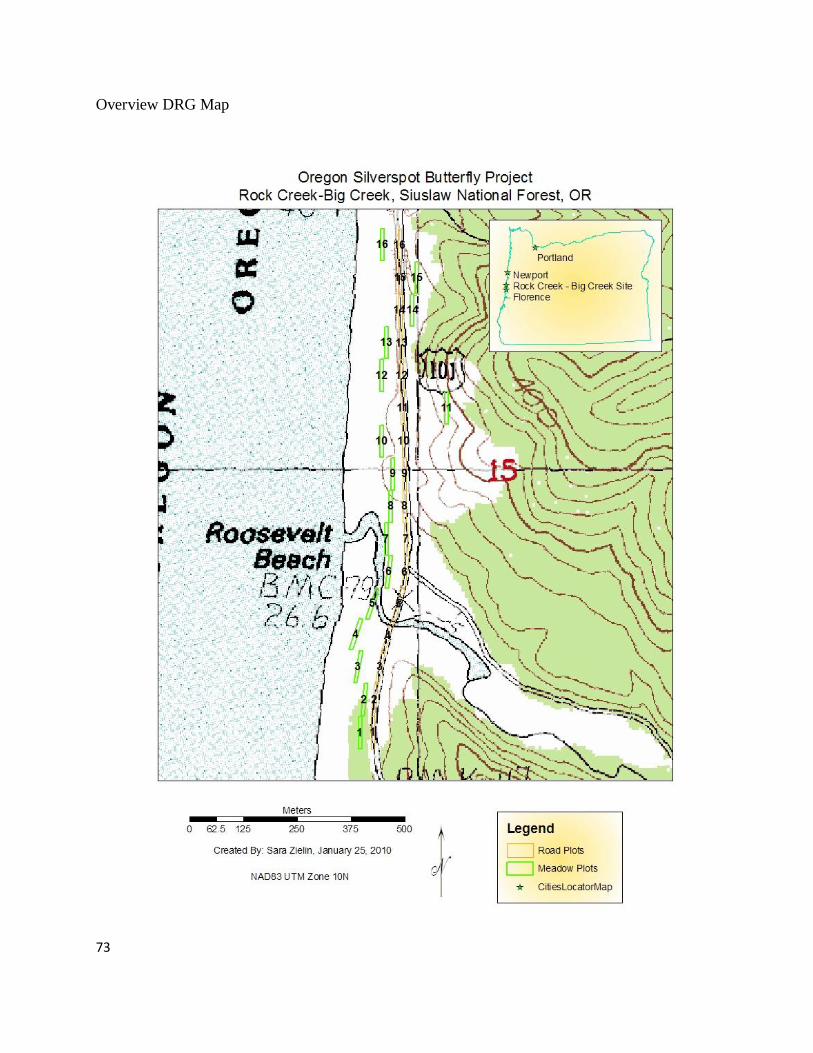
73
Overview DRG Map
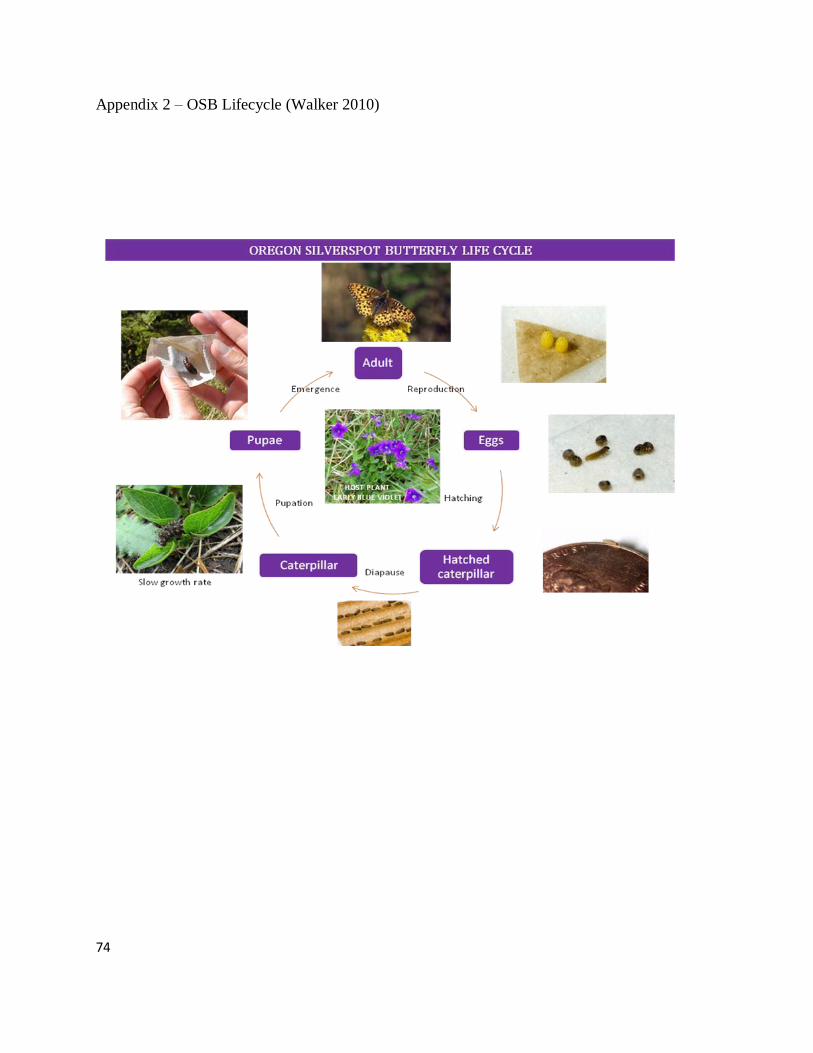
74
Appendix 2 – OSB Lifecycle (Walker 2010)
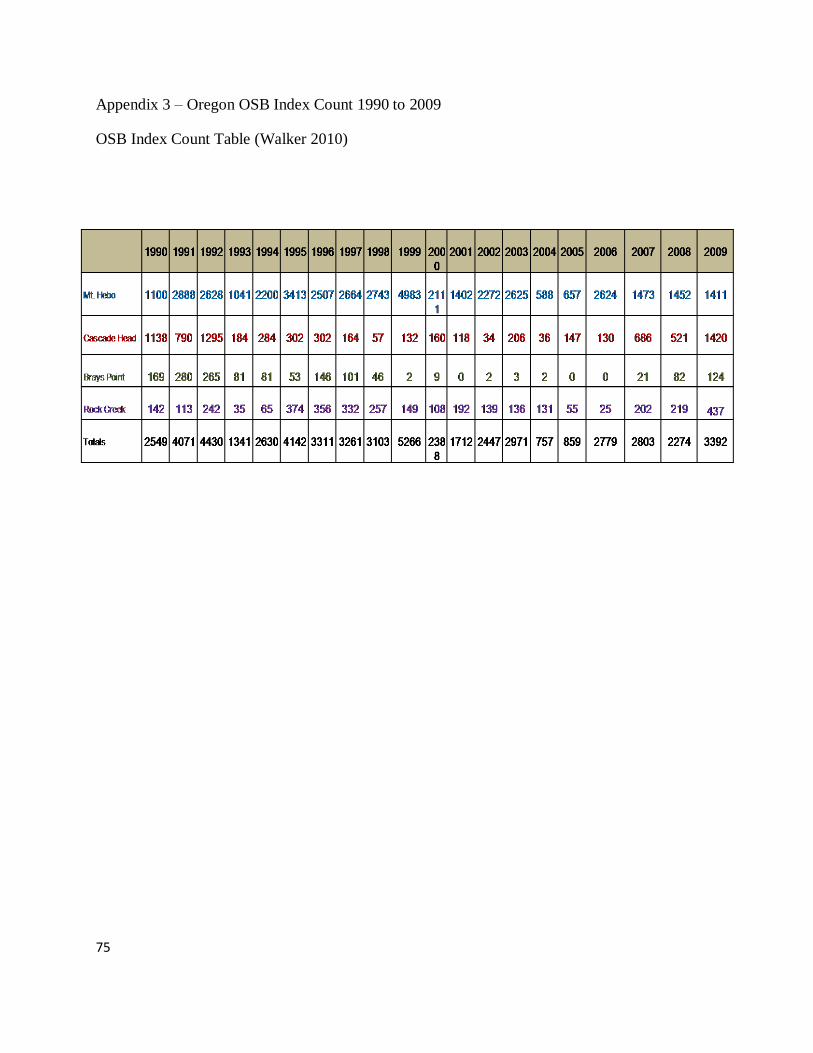
75
Appendix 3 – Oregon OSB Index Count 1990 to 2009
OSB Index Count Table (Walker 2010)
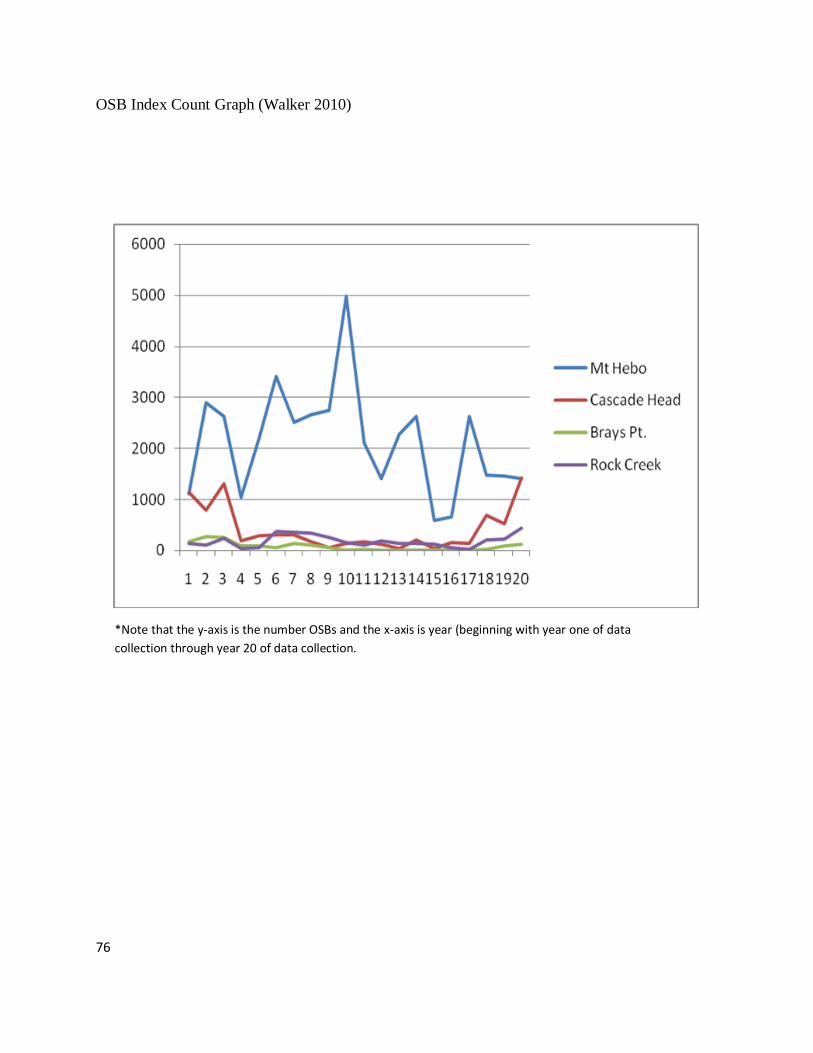
76
OSB Index Count Graph (Walker 2010)
*Note that the y-axis is the number OSBs and the x-axis is year (beginning with year one of data
collection through year 20 of data collection.
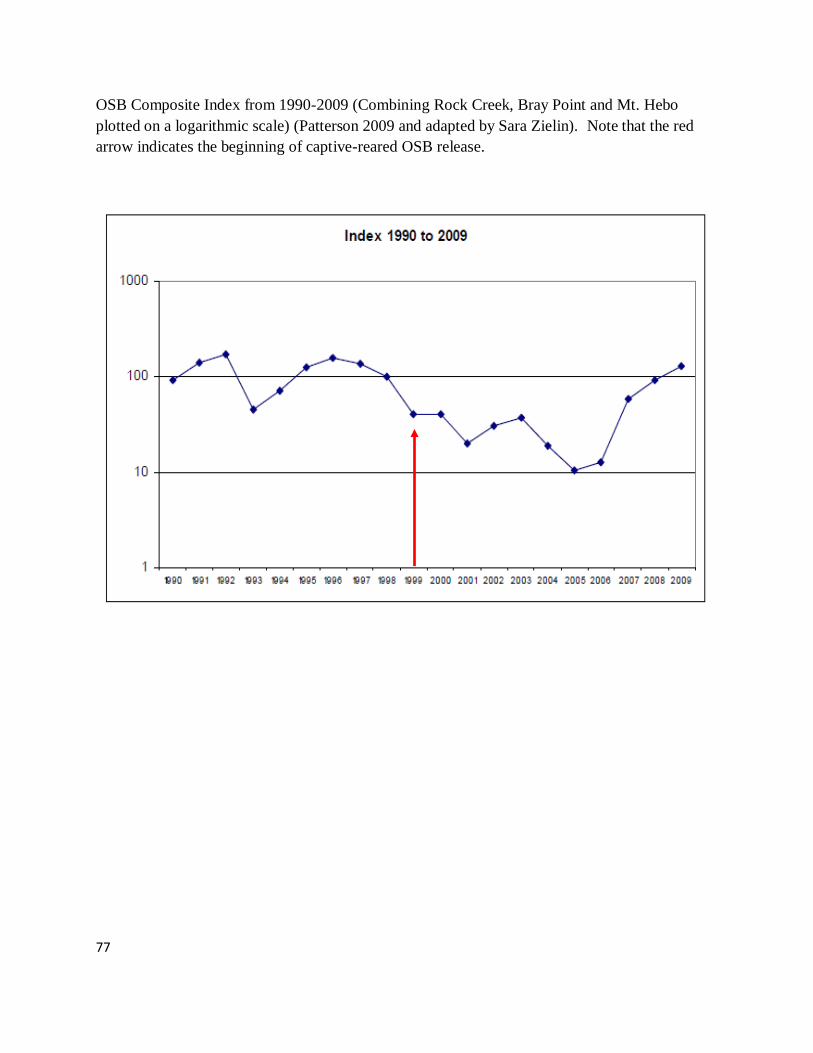
77
OSB Composite Index from 1990-2009 (Combining Rock Creek, Bray Point and Mt. Hebo
plotted on a logarithmic scale) (Patterson 2009 and adapted by Sara Zielin). Note that the red
arrow indicates the beginning of captive-reared OSB release.
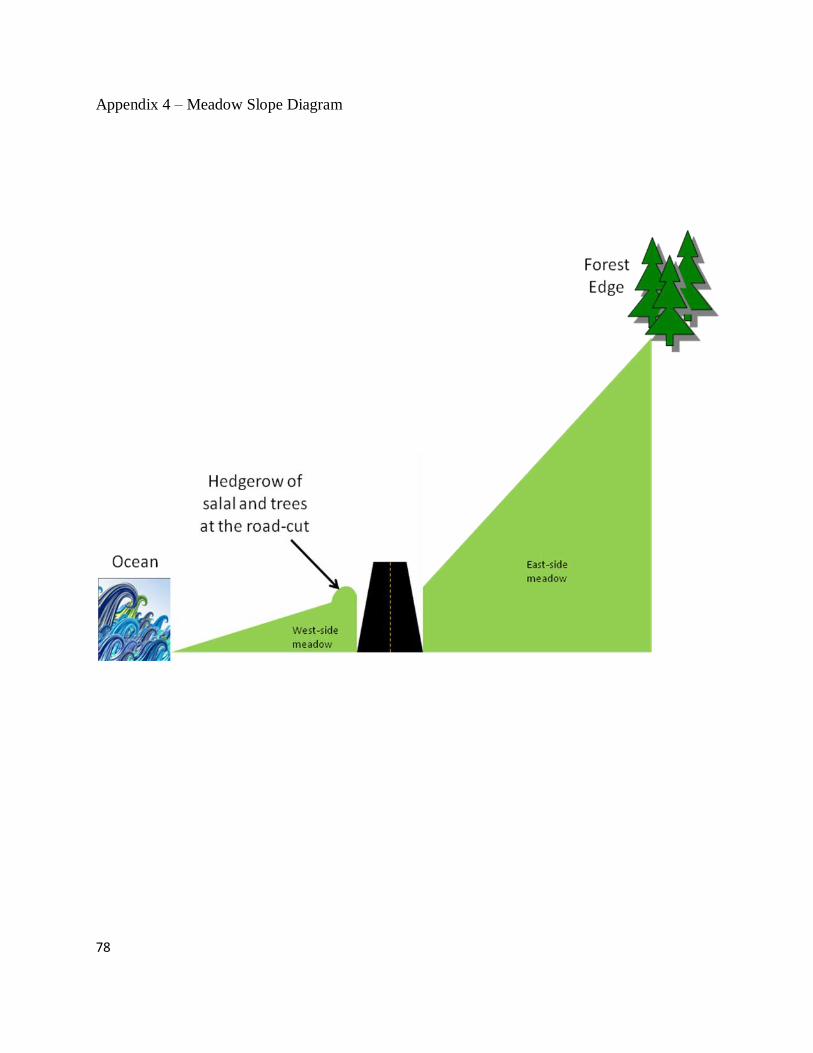
78
Appendix 4 – Meadow Slope Diagram
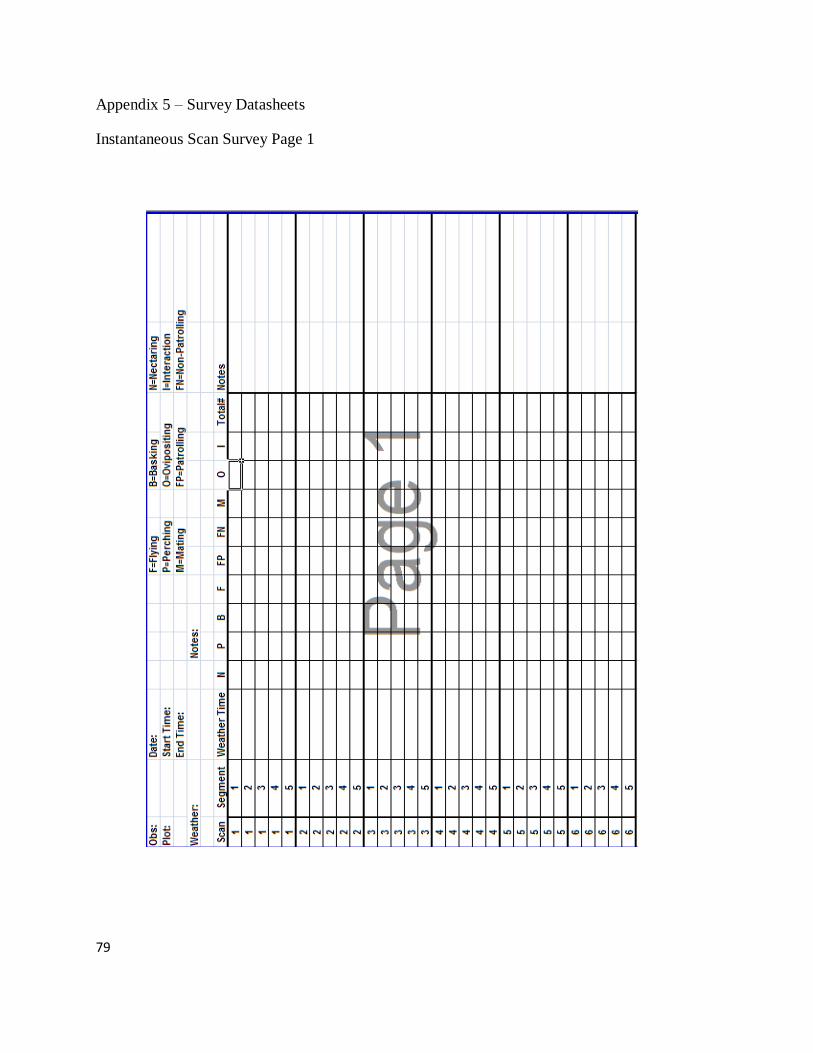
79
Appendix 5 – Survey Datasheets
Instantaneous Scan Survey Page 1

80
Instantaneous Scan Survey Page 2
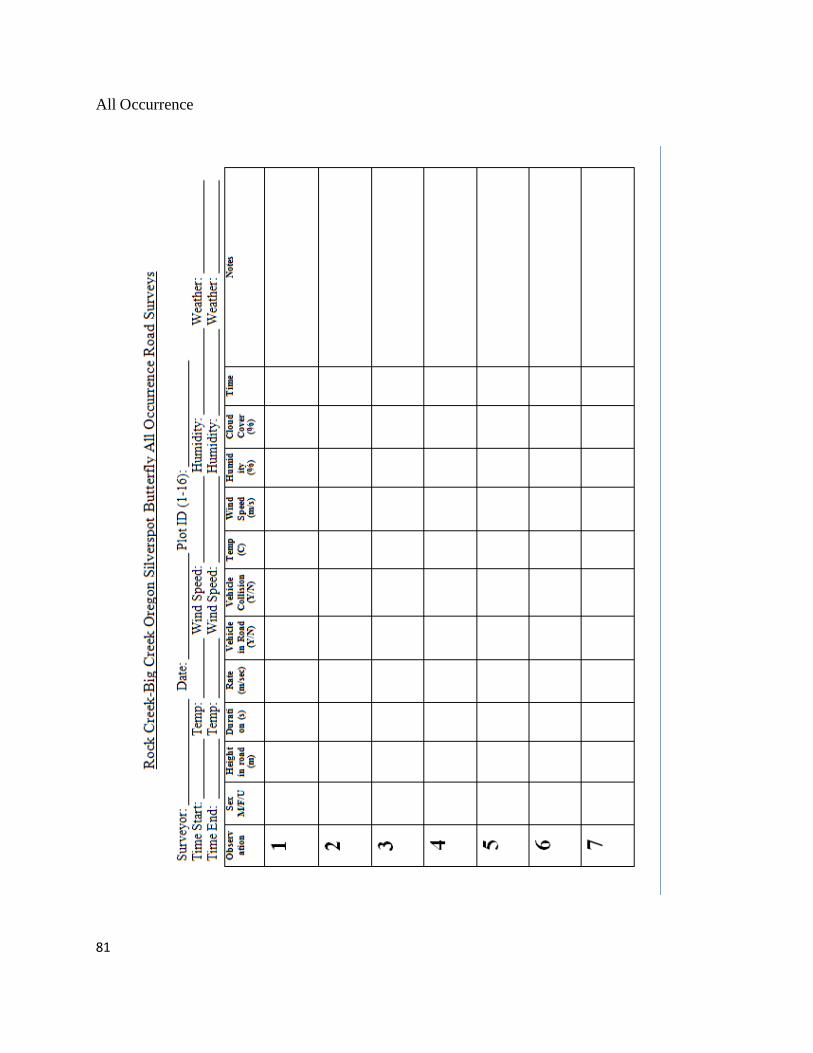
81
All Occurrence
82
Appendix 6 – Circular OSB Movement in Plots 7 and 8
83
Appendix 7 – Weather Data for Yachats, OR 2009 (Weather Underground 2009)
84
Appendix 8 – Density Comparison of OSBs by Transects at Rock Creek - Big Creek (Patterson
2009)
85
Appendix 9 – OSB Census Data Stacked by Transect and Date (Patterson 2009)
Figure 1: Rock Creek and Big Creek census data stacked by transect for the entire 2009 flight
season. Note that transects RC05 and RC08 are in areas where captive-bred OSBs have been
released.