Embed Size (px)
Citation preview
University of South CarolinaScholar Commons
Theses and Dissertations
12-15-2014
Exploring the Association Between Depression andObesity Among Alzheimer's PatientsStephanie ClugstoneUniversity of South Carolina - Columbia
Follow this and additional works at: https://scholarcommons.sc.edu/etd
Part of the Epidemiology Commons
This Open Access Thesis is brought to you by Scholar Commons. It has been accepted for inclusion in Theses and Dissertations by an authorizedadministrator of Scholar Commons. For more information, please contact [email protected].
Recommended CitationClugstone, S.(2014). Exploring the Association Between Depression and Obesity Among Alzheimer's Patients. (Master's thesis). Retrievedfrom https://scholarcommons.sc.edu/etd/3000
EXPLORING THE ASSOCIATION BETWEEN DEPRESSION AND OBESITY AMONG
ALZHEIMER’S PATIENTS
by
Stephanie Clugstone
Bachelor of Science
Auburn University, 2012
Submitted in Partial Fulfillment of the Requirements
For the Degree of Master of Science in Public Health in
Epidemiology
The Norman J. Arnold School of Public Health
University of South Carolina
2014
Accepted by:
Daheia Barr-Anderson, Director of Thesis
Alexander McLain, Reader
Maggi Miller, Reader
Lacy Ford, Vice Provost and Dean of Graduate Studies

ii
© Copyright by Stephanie Clugstone, 2014
All Rights Reserved.
iii
DEDICATION
This document is dedicated to the family and friends that have helped me through
this journey. Specifically, I’d like to thank my mother, for always offering her guidance
and support throughout my graduate career. Another big thank you goes out to my
roommates, who were there for the good times and bad. Thank you all, I truly appreciate
it.

iv
ACKNOWLEDGEMENTS
I would like to thank my committee members, for all of their hard work, and
willingness to answer my incessant questions. A huge thank you goes to my advisor, Dr.
Barr-Anderson, without whom none of this would have been possible. Thank you to Dr.
Miller, who made time for me even while taking care of a new baby. Last, but not least,
thank you Dr. McLain, whose door was always open for questions.
v
ABSTRACT
Alzheimer’s disease (AD) is a neurological disorder that affects elderly
individuals, and is becoming an increasing concern among the aging population of the
world. Due to the projected increase in incidence of AD, modifiable risk factors such as
depression and obesity should be evaluated, as prevention is the only current option. This
study aimed to determine the prevalence of obesity and depression among AD patients,
and to evaluate the association between depression and obesity. Patients were chosen
from a subset of the South Carolina Alzheimer’s disease registry, which included
information about weight status and depression, as well as several other comorbidities
and other potential confounding variables. All persons in the registry have been
diagnosed with AD by a physician. A total of 641 AD patients were included in the study,
with 17.6% (n = 113) classified as obese, and 53.7% (n = 338) self-reporting depressive
symptoms. Using several types of regression – linear, logistic, and ordinal logistic – no
significant association was found between depression and obesity after controlling for
confounding factors (OR of 0.831 [0.545, 1.267], 0.770 [0.489, 1.212] for logistic and
ordinal regression, respectively). Linear regression was deemed to be a poor fit for the
data, thus could not be used. These null findings could be due to missing potential
confounders or relatively small sample sizes. Further study is needed.
vi
TABLE OF CONTENTS
DEDICATION ....................................................................................................................... iii
ACKNOWLEDGEMENTS ........................................................................................................ iv
ABSTRACT ............................................................................................................................v
LIST OF TABLES ................................................................................................................. vii
CHAPTER 1: INTRODUCTION ..................................................................................................1
CHAPTER 2: LITERATURE REVIEW ........................................................................................4
CHAPTER 3: METHODS ........................................................................................................19
CHAPTER 4: RESULTS ..........................................................................................................25
CHAPTER 5: DISCUSSION .....................................................................................................30
CHAPTER 6: CONCLUSIONS .................................................................................................35
REFERENCES .......................................................................................................................37
APPENDIX A – QUESTIONS USED FOR DEPRESSION VARIABLES ...........................................44
APPENDIX B – QUESTIONS USED FOR APPETITE DISTURBANCE VARIABLES .........................46
vii
LIST OF TABLES
TABLE 4.1 DEMOGRAPHIC INFORMATION OF ADULTS WITH ALZHEIMER'S DISEASE ............25
TABLE 4.2 MODEL DESCRIPTIONS AND β VALUES FOR LOGISTIC REGRESSION .....................27
TABLE 4.3 MODEL DESCRIPTIONS AND β VALUES FOR ORDINAL LOGISTIC REGRESSION ......27
TABLE 4.4 COMPARISON OF WEIGHT STATUSES FOR ORDINAL LOGISTIC REGRESSION .........28
TABLE A.1 SURVEY QUESTIONS USED FOR DEPRESSION VARIABLES ...................................44
TABLE B.1 SURVEY QUESTIONS TO CREATE APPETITE DISTURBANCE VARIABLES ...............46
1
CHAPTER 1
INTRODUCTION
Alzheimer’s disease (AD) is a neurological disorder that affects 1 out of every 9
older Americans aged 65 or older (Alzheimer’s Association, 2014). It is characterized by
amyloid-beta plaques, which are a buildup of the protein amyloid-beta (Aβ) on the
exterior of neurons, and tau protein tangles on the interior. Symptoms range from
dementia, memory loss, changes in mood, confusion, and difficulty completing everyday
tasks, to being completely bedridden and dependent on outside help (Alzheimer’s
Association, 2014; Reitz C, 2014). AD can be diagnosed by a physician after obtaining a
family history, and completing a battery of cognitive tests. Magnetic resonance imaging
(MRI) may be used to exclude other potential causes of dementia and cognitive
impairment, such as stroke. Biomarkers are being researched to more accurately diagnose
AD (Shaffer L, 2013; Galluzzi S, 2013; Douaud G, 2013; Roe C, 2013).
As the number one form of dementia in the United States (Hebert L,
2013), AD garners much scientific attention, especially since there is no known cure.
Since there is no cure for AD, finding potentially modifiable behaviors and factors
becomes very important. Certain non-modifiable factors have been identified as risk-
increasing factors. These factors include age (Brookmeyer R, 1997), race (Alzheimer’s
Association, 2014; Manley J, 2008), family history (Mayeux R, 1991; Rosen A, 2007),
and genetic makeup (Breitner J, 1999; Blacker D, 1997; Corbo R, 2007). Among the
2
modifiable risk factors associated with AD, traumatic brain injury (TBI) (Randolph C,
2013; Guskiewicz K, 2005), hypertension (Glynn R, 1999; Girouard H, 2006), diabetes
(Huang C, 2014; Wand K, 2012), and body mass index (BMI) (Whitmer M,
2005Rosengren A, 2005; Tolppanen A, 2014) stand out as promising areas of focus for
prevention. Obesity is perhaps the most easily targeted modifiable risk factor, and can
affect several outcomes simultaneously.
Having a BMI greater than 30 kg/m2 (being obese) is associated with having a
higher risk of developing AD. Obesity is also associated with increased risk of diabetes
(Whitmer M, 2005; Rosengren A, 2005; Tolppanen A, 2014), and hypertension (Glynn
R, 1999; Girouard H, 2006). Therefore, if obesity can be controlled and minimized, so
too will several other chronic diseases. This is best done by first understanding what
affects obesity. Physical activity level has been found to influence obesity, with the
higher the levels of activity, the lower the risk for obesity (Grilo C, 1994).
Socioeconomic status (SES) has also been found to influence obesity (Yaffe K, 2013;
Evans D, 1997; McDowell I, 2007), with higher SES levels being associated with a lower
risk of obesity.
Depression is yet another risk factor for obesity (Brumpton, 2013; Marmorstein, 2014).
The DSM-5 (American Psychiatric Association, 2013) defines depression as depressed
mood or loss of interest, as well as several other criteria in a 2 week span.
Being diagnosed with depression has been found to increase the risk of
developing AD later in life. The odds of developing AD among those with depression is
1.65 times the odds among those without depression. (Diniz, 2013). While many studies
have determined the association between obesity and depression in the general

3
population, there is a lack of research studying this association among those with AD.
This study aims to fill in this gap, by assessing the association between obesity and
depression, among those who have previously been diagnosed with AD. Both obesity and
depression are modifiable risk factors, making them ideal candidates for future
interventions if they are indeed associated.
4
CHAPTER 2
LITERATURE REVIEW
Alzheimer’s disease
Dementia is defined by the Diagnostic and Statistical Manual of Mental Disorders
(American Psychiatric Association, 2013) as significant irreversible cognitive decline,
which requires assistance from another to perform daily activities. Cognitive decline due
to dementia cannot be due to delirium, or another neurological disorder. These criteria
were originally created in 1984, by the National Institute of Aging, and updated in 2011
(Jack CR, 2011). There are many forms of dementia, many with overlapping symptoms.
Criteria were created and updated to enable better diagnosis of major neurological
disorders, such as Huntington’s disease, dementia due to Lewy bodies, Parkinson’s
disease, and Alzheimer’s disease (AD) (Jack CR 2011; McKhann GM, 2011).
Alzheimer’s disease is characterized by amyloid-beta plaques, which are a
buildup of the protein amyloid-beta (Aβ) on the exterior of neurons. Another hallmark of
AD is tangles of hyperphosphorylated tau protein accumulated in the interior of neurons
(Alzheimer’s Association, 2014; Reitz C, 2014). Symptoms of AD include dementia,
memory loss, changes in mood, confusion, and difficulty completing everyday tasks,
among others. In the late stages of AD, the patient becomes bedridden and dependent on
outside help for even the most basic of tasks. Patients with AD often die from causes
other than AD, including cardiovascular and cerebrovascular diseases (Todd S, 2013).
5
AD is the number one form of dementia in the United States, with an estimated
4.7 million cases in 2010 (Hebert L, 2013). This is also a global issue, with an estimated
24 million cases world-wide (Ferri C, 2005). The prevalence is predicted to increase
dramatically over the next 25 to 30 years, (Hebert L, 2013; Ferri C, 2005;
Demirovic J, 2003) with an estimated 13.8 million cases in the US, and 81.1 million
cases globally.
When diagnosing AD, a physician may utilize magnetic resonance imaging (MRI)
to exclude other diseases that may also have dementia-like symptoms, such as stroke
(Alzheimer’s Association, 2014). Further cognitive testing is performed, along with
physical and neurological performance evaluations. A physician will also obtain a
medical and family history from the patient, or the patient’s medical proxy, if the case is
unable to give information themselves. This is to determine if the patient has one or more
of the several suspected risk factors for AD. There has been an increased interest on the
use of biomarkers and MRI in detecting AD in the early and pre-clinical stages (Shaffer
L, 2013; Galluzzi S, 2013; Douaud G, 2013; Roe C, 2013). Recent studies indicate the
use of biomarkers increases the accuracy with which physicians can diagnose AD. One
such study found misclassification of AD dropped from 41% to 28% when using fluorine
18 fluorodeoxyglucose (Shaffer L, 2013). Another study found when using the AD
biomarkers Aβ 42 and fluorine 18 fluorodeoxyglucose, there was 100% accuracy in
diagnosing AD, and 0 patients without the biomarkers developed AD (Galluzzi S, 2013).
Other studies found the use of MRI or cerebrospinal fluid biomarkers can allow
6
physicians to detect cognitive impairment two (Douaud G, 2013) to seven (Roe C, 2013)
years before onset of clinical symptoms.
There is no known cure for AD which will stop or reverse the damage done to the
neurons by tau tangles and Aβ plaques. There are several drugs in use currently that help
alleviate the symptoms of early- and mid-stage AD (Shah R, 2008; Hansen R, 2008),
with cholinesterase inhibitors being the most predominant. These inhibitors are thought to
target and decrease the amounts of the precursor of the Aβ protein, but the mechanism
isn’t well known (Shah R, 2008). Approaches other than drug mediated therapy are also
used in treating the symptoms of AD. Psychosocial interventions – also called
nonpharmacological interventions – such as increased social engagement show promise
in reducing the severity of AD symptoms (Brodaty H, 2012; Wang, 2002). As with the
pharmacological treatments, these interventions only help relieve symptoms. It is of
utmost importance to determine risk factors, so AD can potentially be prevented.
Suspected risk factors
Apolipoprotein E Apolipoprotein E (APOE) is a very low density lipid protein
that carries cholesterol and cholesterol precursors through the blood stream and to the
liver. There are three alleles for the APOE gene: epsilon 2, 3, and 4. The epsilon 3 allele
is the most common allele, and thus far isn’t believed to play a role in increasing or
decreasing the risk of developing late-onset AD (Alzheimer’s Disease Education and
Referral Center, 2011). In 1994, Corder et al conducted a case-control study that revealed
there was a protective association between the less common epsilon 2 and developing
late-onset AD (Corder E, 1994). Epsilon 4, on the other hand, has been found to be
strongly associated with AD (Breitner J, 1999; Blacker D, 1997; Corbo R, 2007). One
7
study, the Cache County Study (Breitner J, 1999), found that the maximum age-specific
prevalence of AD among those without the epsilon 4 allele was 95. After 95, the
prevalence declined. Those with one epsilon 4 allele, the maximum prevalence was at age
87, and in those homozygous for the epsilon 4 allele, the maximum was age 73. Blacker
et al (1997) found that heterozygous individuals did not have a statistically lower age of
onset as those who have no epsilon 4 alleles. However, compared to those who were
homozygous for epsilon 4, the mean age of onset decreased from 72 to 66. This makes
APOE-epsilon 4 a tool that may be utilized to predict age of onset among those at risk of
AD.
Traumatic Brain Injury Head injuries and their repercussions affect many
individuals in a wide variety of lifestyles and occupations. Studies have shown that
traumatic brain injury (TBI) is a major concern among those in the military (Weiner M,
2013; Plassman B, 2000), and those in professional contact sports such as boxing and
American football (Randolph C, 2013; Guskiewicz K, 2005). TBI is defined as “injury
resulting from external force to the head, which results in an alteration or loss of
consciousness.” (Weiner M, 2013) Kiraly and Kiraly (2007) estimate the incidence of
TBI to be 180/100,000, one of the highest incidences of neurological disorders.
In the past 15 years, TBI – as well as mild TBI – has garnered some attention as a
potential risk factor for AD. In 2005, a study found an association between recurrent
concussions and mild cognitive impairment among retired football players (Guskiewicz
K, 2005). They did not find an association with recurrent concussions and AD, but they
saw earlier onset of AD among former players compared to the general population.
Plassman et al (2000) used a historical cohort study to estimate the risk of AD among
8
World War II veterans. There was an increased risk of AD from both moderate and
severe head injury, with hazard ratios of 2.32 and 4.51, respectively. Fakhran et al (2013)
evaluated the changes in the white matter of the brain after mild TBI, and found the
abnormalities were distributed similar to those in the early stages of AD. The exact
mechanism of this association is not currently known.
Age Increasing age is the biggest known risk factor for AD (Alzheimer’s
Association, 2014). As age increases, the risk for developing AD also increases. The
majority of people living with AD fall into the 90 years old and above group. In 1997, the
proportion of 90+ year olds living with AD was 28.5%, compared to 4.3% of 75 year
olds, 8.5% of 80 year olds, and 16% of 85 year olds (Brookmeyer R, 1997). Being elderly
doesn’t guarantee developing AD, as AD isn’t a part of the natural progression of aging.
Family History Having a family history of AD, has been found to be a very
significant risk factor for AD. Rosen et al (2007) conducted a case-control study that
determined those with AD had an elevated risk of having a family history of AD when
compared to those without AD. An earlier study conducted in Manhattan (Mayeux R,
1991) explored the relationship between the risk of dementia and a family history of AD
from first degree relatives (parents or siblings). It was noted that there was an increase in
the odds of having a first degree relative with dementia in those with AD, as well as those
with other types of neurological disorders; thus, an elevated risk for developing a
neurological disorder among those with a family history of dementia may not be
exclusive to AD.
More recently, studies have shown there is a greater risk among those with a
maternal history of AD, compared to no history or only a paternal history (Liu Z, 2013;
9
Mosconi L, 2007). One such study used cerebrospinal fluid biomarkers Aβ1-40 and Aβ1-
42 to screen cognitively normal individuals (Liu Z, 2013). They found those with a
maternal family history of AD had lower Aβ1-42 levels than those with a paternal history
or no history. This is indicative of potential impaired cognitive function later in life. The
authors caution, however, that these results are preliminary, and more research is
necessary. Mosconi et al (2007) also found that a maternal family history may increase
the risk of developing AD later in life. In this study, positron emission tomography
imaging was used to determine the cerebral metabolic rate of glucose (CMRglc) in the
brain. Patients with AD tend to have lower rates in specific areas of the brain. They found
there was no statistically significant difference between the rates of those with no family
history of AD and those with a paternal history of AD. They did find, however, a
significant reduction in CMRglc in those with a maternal family history compared to
those without a family history.
Gender It was commonly believed that women had a greater risk of developing
AD than men. Several studies have since refuted this belief. Kukull et al (2002) found
that age stratified incidence rates were similar for men and women, and their 95%
confidence intervals overlapped. Hebert et al (2001) also calculated age-specific
incidence rates for men and women that were not statistically different. Prevalence also
was not significantly different between men and women, even after adjustment for age. It
is now known that the appearance of higher risk is due to the fact that women, on
average, live longer than men (Hebert L, 2001). The older a person is, the higher the risk
of developing AD, regardless of gender.
10
Race The majority of elderly Americans living with AD are Caucasian
(Alzheimer’s Association, 2014). This does not mean, however, that white, non-
Hispanics are more likely to develop AD. Using self-identified race and a longitudinal
study design, Manly et al (2008) found Hispanics and African Americans had higher risks
of developing cognitive impairments than whites but African Americans were less likely
to report cognitive impairment than whites (Potter et al 2009). Potter et al. also discussed
the possibility that other confounding factors are more prevalent in African Americans
and Hispanics than whites, such as diabetes and hypertension, which may skew the
results of studies (2009).
Diabetes The American Diabetes Association defines diabetes as “a group of
metabolic diseases characterized by hyperglycemia resulting from defects in insulin
secretion, insulin action, or both” (American Diabetes Association, 2010). Diabetes,
especially type 2, has been targeted as a risk factor for AD. Several studies have shown
an association between diabetes and AD, yet the mechanism is still unknown. In 2012, a
population based cohort study found incidence densities of AD for both men and women
with diabetes were higher than those without diabetes, and had a significantly elevated
hazard ratio (Huang C, 2014). Another population based cohort study with a longer
follow up time (11 years compared to 8) (Wand K, 2012), had similar results: elevated
hazard ratios for those with diabetes.
Even with a consensus about the status of diabetes, there are several theories
about why diabetes affects the risk of AD, and how. One such theory is diabetes causes
increased oxidative stress, which leads to an accumulation of glycation end products
(Huang C, 2014). This may lead to abnormalities in the brain, specifically in the
11
hippocampus. This theory would allow physicians to prescribe pharmaceuticals to
combat the negative effects of both diabetes and AD.
Another working theory is that insulin resistance created by diabetes causes brain
insulin resistance (Hokama M, 2013; de la Monte, 2014; Craft S, 2004). Increased insulin
resistance in the brain may alter the metabolism of the Aβ protein, the protein responsible
for the formation of plaques on the outside of neuron cells. The blood-brain barrier is
weakened, and allows insulin to cross into the brain. This may be why diabetics who take
insulin have a higher risk of AD than those who do not, as one of the most frequently
cited studies discovered (Ott A, 1999). Again, neither of these theories has been proven,
but research continues in this area.
Hypertension The Joint National Committee on Prevention, Detection,
Evaluation, and Treatment of High Blood Pressure defines hypertension as a blood
pressure (BP) reading of higher than 140/90 mmHg (National Institutes of Health, 2010).
Pre-hypertension is defined as having a 120-139 mmHg systolic BP or 80-89 mmHg
diastolic BP. Those with hypertension are at an increased risk of developing several
chronic diseases, AD among the list. Longitudinal data showed the relationship between
elevated blood pressure and cognitive decline was U shaped for both systolic (Glynn R,
1999) and diastolic BP (Girouard H, 2006).
Hypertension is a known risk factor for stroke, which damages brain function.
This is believed to be due to the brain’s need for a continuous, steady supply of blood,
which is tightly regulated (Girouard H, 2006). With increased blood pressure, a steady
blood supply is interrupted, causing neuron damage and altered gene expression. This, in
turn, increases the accumulation of Aβ and tau proteins in the brain.
12
Body Weight Body weight is commonly measured as body mass index (BMI),
which accounts for an individual’s height. Underweight is defined as having a BMI of
less than 18.5 kg/m2, normal as a BMI between 18.5 and 24.9 kg/m2, overweight as a
BMI between 25 and 29.9 kg/m2, and obese as a BMI of 30 or greater. There has been
some debate about whether body weight, specifically mid-life BMI, is a risk factor for
AD.
Several studies have been conducted to determine if there is an association
between BMI and development of AD, with conflicting results. Several studies have
noted there is a J or U shaped association between BMI and AD47-49 (Whitmer M, 2005;
Rosengren A, 2005; Tolppanen A, 2014), indicating there is increased risk of AD among
those with lower BMI (underweight) and with higher BMI (overweight and obese). On
the other hand, other studies have shown there is a protective association between higher
BMI and AD (Atti A, 2008; Dahl A, 2008; Luchsinger J, 2013). There is a consensus,
however, that a lower BMI, as well as a decrease in BMI in midlife, is associated with a
higher risk of AD.
The reason for the differing results of these various studies is not currently
known. There may be discrepancies between the different study populations used, or
there may be an undefined confounding factor that is causing differing results. There are
many factors that affect both risk of obesity/overweight and AD. Several of them will be
considered here.
Obesity
As previously mentioned, obesity is defined as having a BMI of greater than 30
kg/m2. Further, obesity can be classified into 3 categories: grades 1, 2, and 3. The
13
corresponding BMI ranges are 30 to <35, 35 to <40, and 40 and above, respectively. In
2011, the overall prevalence of obesity was estimated at 34.9% for adults (Ogden, 2014).
The prevalence grade 2 or 3 obesity for men (11.9%) was slightly different than the
prevalence for women (17.1%). The prevalence for overweight and obesity among adults
is 68.5%. The prevalence is even higher among elderly populations. One population
based study found 26.5% of participants were obese, while 39.9% were classified as
overweight (Ricci, 2014). Ogden et al found the national prevalence of obesity for those
age 60 years and older was slightly higher than that of all adults: 35.4% (2014).
The high prevalence of obesity and overweight is bound to take a toll on the
population, both in terms of morbidities and monetary costs. The effect of obesity on
overall health is akin to an increase in age by 30 years (Strum R, 2002). This is similar to
the effects of smoking, or heavy drinking. Obesity increases the risk of developing
cardiovascular disease, hypertension, and diabetes more-so than drinking or smoking.
These chronic diseases are fairly common, and persist for a long period of time, which
increases the cost burden. It has been estimated that obesity is responsible for a 36%
increase in health care costs, and a 77% increase in medications costs (Strum R, 2002).
There are several factors known to increase the risk of developing obesity. For an
adult, these factors include but are not limited to smoking, amount of physical activity,
and nutrition (Lakhan S, 2013). Depression, hypertension, and diabetes are also risk
factors for AD.
AD risk factors related to obesity
As mentioned previously, hypertension is a risk factor for AD, but it is also
known to be associated with obesity as well. Obesity has been shown to be associated
14
with hypertension (Lee S, 2005; Mokdad A, 2003), but the association is likely
confounded by several other factors. These include nutrition, age, race, and other chronic
diseases. In general, a higher BMI is associated with a higher risk of hypertension.
Much like hypertension, diabetes is also related to both AD and obesity. Diabetes
has garnered much attention from the scientific world due to its high prevalence (about
285 million adults worldwide [Shaw J, 2010]), and the predictions that it will continue to
increase in the next 20-30 years. Studies have noted that an elevated BMI increases the
risk of developing diabetes (Mokdad A, 2003). This is also likely to be confounded by
several other factors, many of which are also shared by hypertension. These include
physical activity, obesity, age, and nutritional factors.
Factors affecting AD and obesity
Physical activity There is a vast amount of literature on the association between
physical activity and obesity. An increased amount of physical activity is associated with
a lower risk of obesity (Grilo C, 1994). This inverse relationship has been studied
extensively over the past 10 to 15 years. A similar protective association has been seen
between physical activity and AD. Cohort data have shown that higher levels of physical
activity are associated with lower risk of AD, as well as cognitive impairment (Laurin D,
2001).
It is unknown whether this association is due to an effect physical activity has on
the body, and specifically on the brain, or if it has to do with the lower risk of obesity. As
previously discussed, obesity is believed to be a risk factor for AD. With a higher amount
of physical activity, there would be a lower risk of obesity, and by proxy, a lower risk of
developing AD.
15
Socioeconomic Status The American Psychological Association defines
socioeconomic status (SES) as “the social standing or class of an individual or group,
(2014)” which can be measured in several ways. Commonly, annual household income,
education level, or occupation is used as an indicator for SES. A combination of several
factors may also be used, in a type of metric to more accurately determine SES. In
general, lower household income, education level, and property value is indicative of a
lower SES.
SES has been found to be associated with a number of chronic diseases, obesity
and AD among them. When using level of education as an indicator for SES, the lowest
level showed a strong association with AD when compared to the highest SES level.
Several studies showed the estimated risk nearly doubling (Yaffe K, 2013; Evans D,
1997; McDowell I, 2007) with the lowest level of education. There is some concern that
using education levels as a surrogate for SES may bias the estimate. Most studies use
cognitive exams such as the Modified Mini-Mental State exam to screen for subjects with
cognitive decline. Unfortunately, these exams tend to be correlated with education level,
which means exams shouldn’t be used when exploring the association between cognitive
decline and education level. This can be remedied by using a different indicator of SES.
Another way researchers can estimate SES is by using occupational hierarchy.
Unskilled laborers are considered lower SES than those in management positions. When
using occupation, there was still an association between SES and AD, albeit to a lesser
extent (Evans D, 1997; McDowell I, 2007). Using annual household income generally
gave the same results as education level (Yaffe K, 2013; Evans D, 1997; McDowell I,
2007), and is probably one of the most accurate measures of SES available.
16
SES is similarly associated with obesity. When using education level or income,
there is a strong association between the lowest SES levels and AD when compared to
the highest SES levels (Conklin A, 2013; Drewowski A, 2014). When using self-reported
financial hardships – another surrogate for SES – the association between the lowest
category and AD was still significant, but not as strong (Conklin A, 2013). While these
associations generally hold true in most populations, it is not true for all (Mowafi M,
2014). Most likely, there are other factors confounding this association, such as food
availability.
Depression The DSM-5 (American Psychiatric Association, 2013) defines
depression as depressed mood or loss of interest, as well as 4 or more other criteria in a 2
week span. The other potential criteria that may indicate depression are: weight loss or
gain, insomnia, fatigue, retardation, feelings of worthlessness, inability to concentrate,
and thoughts of suicide. This is normally diagnosed using one of several depression
scales available. With therapy and proper pharmaceutical use, depression can be treated
and managed successfully.
Prospective cohort data have shown an association between obesity and
depression (Brumpton B, 2013; Marmorstein N, 2014). There is some discrepancy as to
whether the prevalence of depression is different by gender. However, the consensus is,
regardless of gender, adults with depression have a higher risk of being obese than those
without depression. The HUNT Study (Brumpton B, 2013) found having anxiety or
depression was associated with an increase in weight, and an increased cumulative
incidence in obesity.
17
Depression has also been investigated for its association with AD. Longitudinal
data analyzed with proportional hazard regression found a slight association between
depression and AD incidence (Luppa M, 2013). Another longitudinal study looked for an
association between AD and present depression, past depression, and both present and
past depression (Olazaran J, 2013). A weak association was found between AD and
present depression, and a stronger association between AD and past and present
depression. The inclusion of past depression distinguishes between a true association and
potential reverse causation. Depression is also a symptom of AD, which makes finding an
association between depression and AD more difficult.
According to Lyketsos et al. 27% of AD patients suffer from mild depression, and
21% suffer from major depression (1997). A meta-analysis performed by Diniz et al.
showed a significant increase in the risk of developing AD among those with depression
(2013). Analyzing 23 community-based prospective cohort studies, Diniz et al. found
late-life depression, specifically, was associated with increased risk of all-cause
dementia, as well as AD and vascular dementia. According to their analysis, there was a
significant odds ratio of 1.65 (95% CI 1.42 – 1.92) for the association between late-life
depression and AD.
The exact mechanism of this association isn’t known, but a common hypothesis is
that depression causes degradation of neurons. This eventually accumulates, and leaves
the brain more susceptible to dementia (Olazaran J, 2013). Another hypothesis is there
are specific gene polymorphisms that cause depressive symptoms, and increases the risk
of developing AD. One study focused on the Sirtuin 2 gene, the function of which is as of
yet unknown (Porcelli S, 2013). Specifically, Porcelli et al. focused on the rs10410544
18
polymorphism, which has been implicated in several different mental illnesses, including
depression. Upon further analysis, Porcelli et al. discovered no association between the
rs10410544 polymorphism and AD. However, there are still many others that need to be
investigated for potential links.
It has already been established that AD and obesity are associated, as well as AD
and depression. While there have been several studies assessing the association between
obesity and depression, there is a lack of information on this association among those
who have been diagnosed with Alzheimer’s disease. This study aims to fill this void, to
determine if there is in fact an association between obesity and depression among those
with AD. The results of this study could identify which areas of prevention should be
focused on to alleviate symptoms of AD, as well as possible prevention of AD itself.

19
CHAPTER 3
METHODS
Research question This study aimed to determine whether there was an association
between depression and obesity (having a BMI greater than 30kg/m2) among a population
of adults who have been diagnosed with AD.
Hypotheses
1. The prevalence of depression in this population is around 50%, approximately the
percentage of mild and major depression in AD patients found by Lyketsos et al
(1997).
2. The prevalence of obesity in this population (mean age= 83+8.18 years) is higher
than the national prevalence of obesity for older adults: 35.4%.
3. There is a positive association between depression and obesity; those AD patients
who are depressed are more likely to be obese, compared to those who are not
depressed.
Study population The South Carolina Alzheimer’s Disease Registry is a statewide
population-based registry for those who are diagnosed with AD, as well as other related
disorders. These include vascular dementia, Parkinson’s disease, dementia with Lewy
20
Bodies, and dementia due to stroke, among others. Data on diagnosed cases were
obtained from several sources, including inpatient hospitalizations, Medicaid, mental
health records, vital records, and long-term care facilities in the state of South Carolina.
A participant’s type of dementia was classified using the International
Classification of Diseases, 9th
Revision, Clinical Modification (ICD-9-CM) codes
provided from the physician’s diagnosis. In this registry, AD was classified by the ICD-
9-CM codes 290.0-290.3, 290.8-290.9, and 331.0. Along with diagnosis, information
about sociodemographic variables and other medical diagnoses were obtained at the time
of entry into the registry. A total of 82,772 participants are included in the registry. Of
those, 50,961 participants have been diagnosed with AD. The current study used a
smaller subsample of the registry, the Eli Lilly subsample, which included more detailed
information related to depression scores and general health scores. The surveys were
answered by caregivers, not the patients themselves. In this way, information was
collected about appetite disturbances, depressive symptoms, and several comorbidities.
These comorbidities include, but are not limited to: hypertension, myocardial infarction,
congestive heart failure, Peripheral Vascular Disease, Cerebral Vascular Disease,
dementia, chronic obstructive pulmonary disease (COPD), diabetes, moderate/severe
renal disease, any tumor, and acquired immune deficiency syndrome (AIDS). In total,
641 persons with AD were analyzed for this study, the majority of whom had complete
data. While this greatly reduces the number of participants, the subset contains much
more detailed and pertinent information about depression, the main independent variable
for this study.
21
Variables
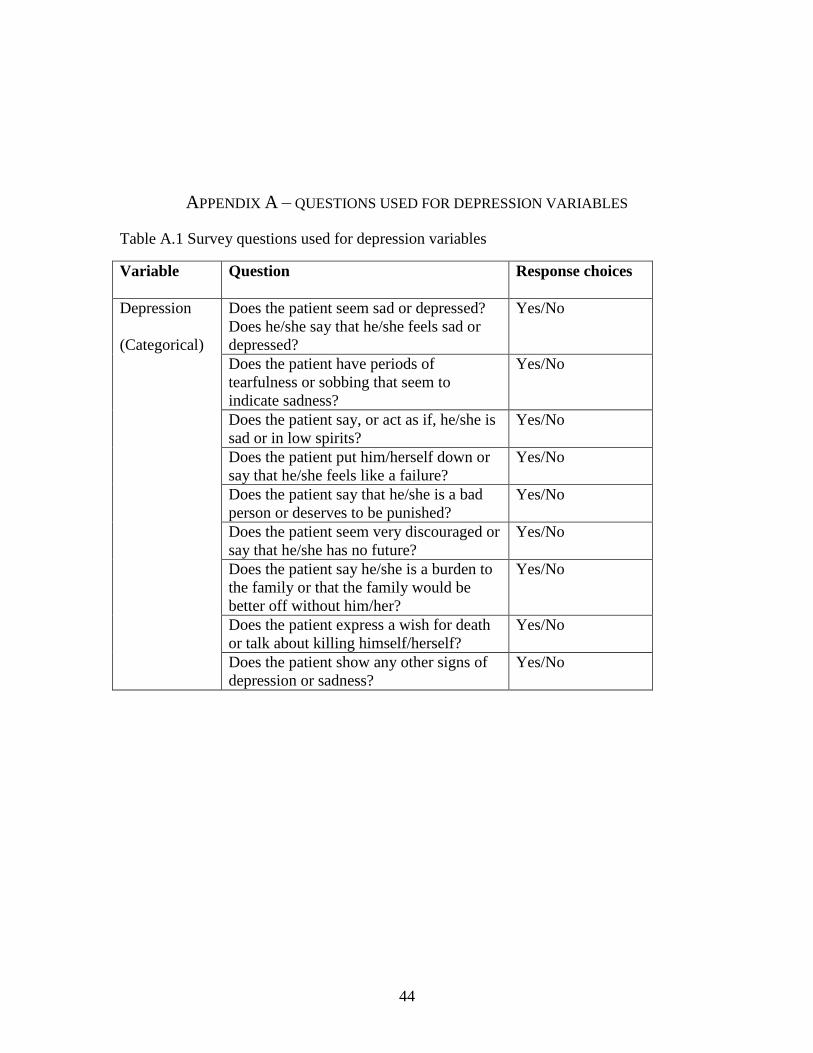
Depression Depression was defined two ways: as a dichotomous variable and a
continuous score. For the dichotomous variable, caregivers were asked if the patient
seemed sad or depressed, or if the patient states they are sad/depressed. Response options
were yes and no. There were also several other questions related to depression and
sadness, which can be seen in Appendix A.1. To prevent redundancy, only the umbrella,
yes/no variable was analyzed. The continuous depression variable was calculated by
multiplying the responses to depression frequency and depression severity. Thus the
higher the depression score, the more severe the case of depression. The questions used to
ascertain the depression score can be seen in Appendix A.1. The dichotomous variable
was used in logistic regression models, while the continuous variable was used in the
linear regression models. The continuous and dichotomous variables were not used in the
same models together, to prevent redundancy.
Weight status Using the height and weight measurements collected by nurses during the
data collection for the AD registry, a continuous BMI variable was calculated (weight in
kilograms/ height in meters squared).
Obesity status Obesity is based on patients’ BMI. A BMI of less than 18.5 kg/m2 is
classified as underweight; BMI between 18.5 and 24.9 kg/m2 is classified as normal
weight, BMI between 25 and 29.9 kg/m2 is classified as overweight, and BMI of 30
kg/m2 or greater is classified as obese. For logistic regression models, a dichotomous
(yes/no) obesity status variable was created using BMI cut-off point of 25 kg/m2.
22
Appetite disturbances Appetite disturbance was defined two ways: as a dichotomous
variable and a continuous score. For the dichotomous variable, caregivers were asked if
the patient has had any change in appetite, weight, or eating habits, or if there had been
any changes in the type of food the patients preferred. Response options were yes and no.
There were also several other questions related to appetite disturbances, which can be
seen in Appendix A.2. To prevent redundancy, only the umbrella, yes/no variable was
analyzed. The continuous appetite disturbance variable was calculated by multiplying the
responses to appetite disturbance frequency and severity. Thus the higher the appetite
disturbance score, the more severe disturbance. The questions used to ascertain the
appetite disturbance score can be seen in Appendix A.2.
Age The numerical variable age was calculated from the date of birth, on the day of the
interview.
Gender The gender variable is categorical; patients were categorized as male, female, or
unknown.
Comorbidities A modified Charlson Comorbidity Index (CCI) was used to assess overall
health of the AD patient. The CCI variable was a continuous variable, with the higher the
score, the more comorbidities an individual has, thus the poorer the patient’s overall
health. The comorbidities included in this CCI were: myocardial infarction, congestive
heart failure, peripheral vascular disease, cerebral vascular disease, dementia, COPD,
diabetes, moderate/severe renal disease, presence of any tumor, and AIDS. Based on
previous literature, only these specific comorbidities were chosen to be included in the
CCI for this study.

23
The above mentioned covariates were investigated for confounding and effect
modification. These were chosen for investigation based on previously published
literature.
Statistical Analysis All statistical analysis was done using SAS 9.3 (Cary, NC). The
association between depression and weight status was determined using several different
methods. This was done to determine several possible relationships. Linear regression
was used to determine if there was a linear relationship between the continuous BMI
variable and continuous depression score variable. Logistic regression was used to
determine an association between the dichotomous weight status variable (obesity yes/no)
and depression, and multinomial regression was used to determine the association
between a categorical weight status variable (underweight, normal, overweight, and
obese) and depression. For each type of regression, several independent variables were
evaluated for inclusion in the model. Age, CCI, race, sex, specific comorbidities
(diabetes, hypertension, and heart disease), appetite disturbances (dichotomous or
continuous), and home ownership were the covariates investigated in each model.
Using univariate logistical regression, a crude association between depression
and obesity was assessed, using a dichotomous outcome, and a dichotomous exposure.
Covariates were added to the regression model one at a time, and assessed for statistical
significance. This method was applied to all regression models used in this study.
Statistical significance was set at α=.05. Once a significant covariate is added to the
model, all previous insignificant covariates were added back into the model to check for
significance in the new model. These covariates included gender, race, age, and other
medical conditions. Individual medical conditions were considered (including diabetes,
24
hypertension, and cancer), determined by a yes/no response to several questions about
comorbidities, as well as the CCI calculated from the previously listed comorbidities.
Once the full multivariate logistical regression model was established, the association
between depression and obesity was assessed.
To determine if there is a linear relationship between depression and weight
status, a simple linear regression model was run using continuous BMI variable and
continuous depression score in SAS. Then, using the method described above, a final
model was created. To determine if the data follow a linear trend, the adjusted R square
values were recorded. To check for non-linear trends, the continuous BMI variable was
transformed in several ways: squared, cubed, and standardized. The adjusted R square
values were recorded for these regression models as well.
Finally, a multinomial regression analysis was performed, to reinforce the
findings from the previous logistic analysis. Using the same variables as the previous
analysis, a full model was assembled. The outcome variable used was BMI classified into
4 groups: underweight, normal weight, overweight, and obese according to the ranges
indicated previously. Ordinal logistic regression was used to obtain an odds ratio and
confidence interval.
A -2 log likelihood ratio test was performed to determine if the full model
was necessary to obtain the most accurate estimate, or if the crude model was sufficient.
25
CHAPTER 4
RESULTS
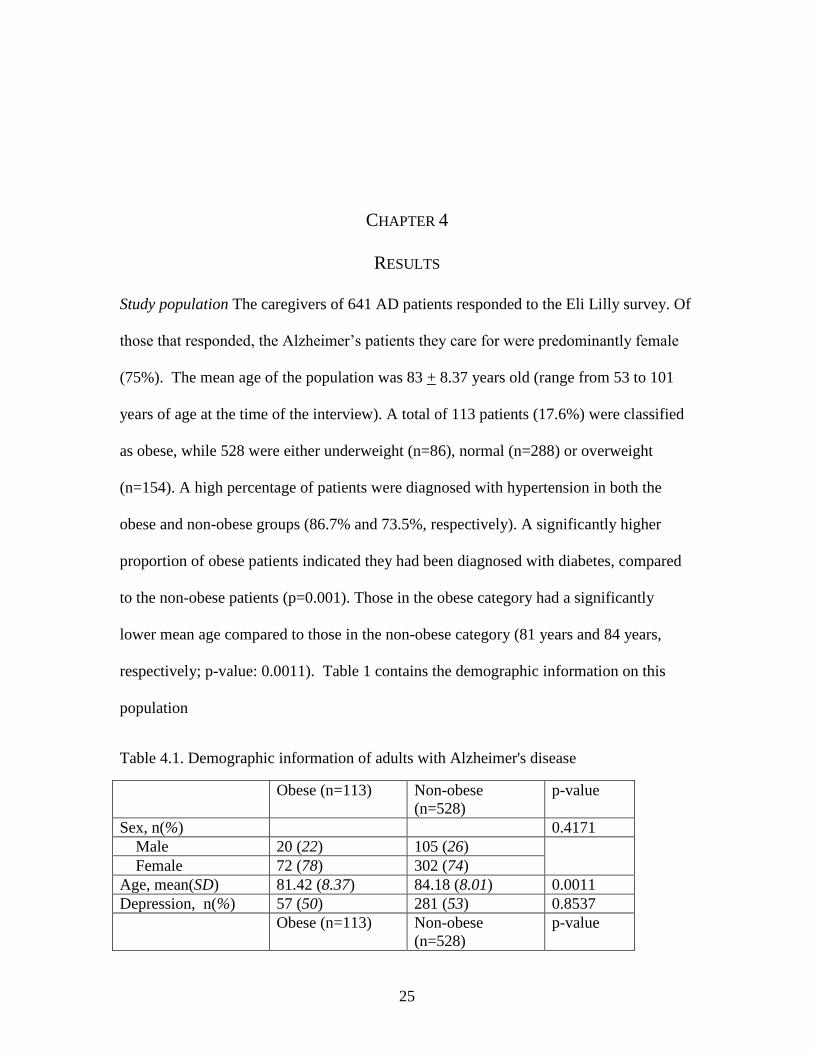
Study population The caregivers of 641 AD patients responded to the Eli Lilly survey. Of
those that responded, the Alzheimer’s patients they care for were predominantly female
(75%). The mean age of the population was 83 + 8.37 years old (range from 53 to 101
years of age at the time of the interview). A total of 113 patients (17.6%) were classified
as obese, while 528 were either underweight (n=86), normal (n=288) or overweight
(n=154). A high percentage of patients were diagnosed with hypertension in both the
obese and non-obese groups (86.7% and 73.5%, respectively). A significantly higher
proportion of obese patients indicated they had been diagnosed with diabetes, compared
to the non-obese patients (p=0.001). Those in the obese category had a significantly
lower mean age compared to those in the non-obese category (81 years and 84 years,
respectively; p-value: 0.0011). Table 1 contains the demographic information on this
population
Table 4.1. Demographic information of adults with Alzheimer's disease
Obese (n=113) Non-obese
(n=528)
p-value
Sex, n(%) 0.4171
Male 20 (22) 105 (26)
Female 72 (78) 302 (74)
Age, mean(SD) 81.42 (8.37) 84.18 (8.01) 0.0011
Depression, n(%) 57 (50) 281 (53) 0.8537
Obese (n=113) Non-obese
(n=528)
p-value
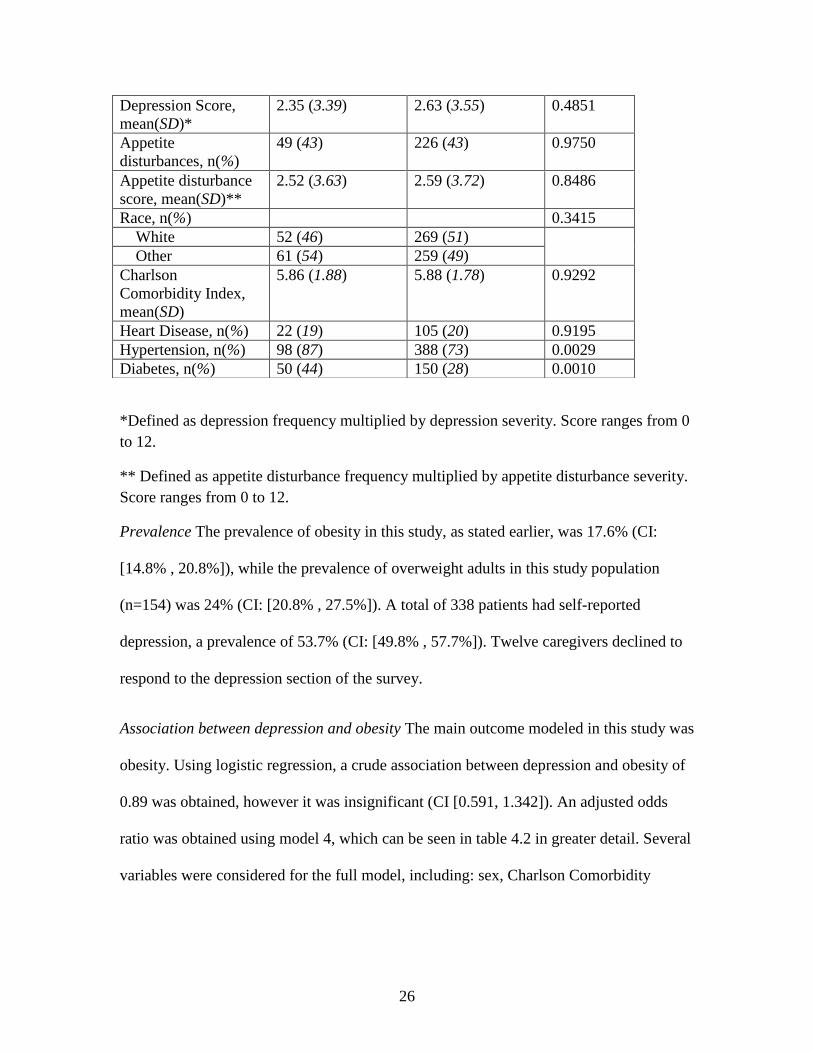
26
Depression Score,
mean(SD)*
2.35 (3.39) 2.63 (3.55) 0.4851
Appetite
disturbances, n(%)
49 (43) 226 (43) 0.9750
*Defined as depression frequency multiplied by depression severity. Score ranges from 0
to 12.
** Defined as appetite disturbance frequency multiplied by appetite disturbance severity.
Score ranges from 0 to 12.
Prevalence The prevalence of obesity in this study, as stated earlier, was 17.6% (CI:
[14.8% , 20.8%]), while the prevalence of overweight adults in this study population
(n=154) was 24% (CI: [20.8% , 27.5%]). A total of 338 patients had self-reported
depression, a prevalence of 53.7% (CI: [49.8% , 57.7%]). Twelve caregivers declined to
respond to the depression section of the survey.
Association between depression and obesity The main outcome modeled in this study was
obesity. Using logistic regression, a crude association between depression and obesity of
0.89 was obtained, however it was insignificant (CI [0.591, 1.342]). An adjusted odds
ratio was obtained using model 4, which can be seen in table 4.2 in greater detail. Several
variables were considered for the full model, including: sex, Charlson Comorbidity
Appetite disturbance
score, mean(SD)**
2.52 (3.63) 2.59 (3.72) 0.8486
Race, n(%) 0.3415
White 52 (46) 269 (51)
Other 61 (54) 259 (49)
Charlson
Comorbidity Index,
mean(SD)
5.86 (1.88) 5.88 (1.78) 0.9292
Heart Disease, n(%) 22 (19) 105 (20) 0.9195
Hypertension, n(%) 98 (87) 388 (73) 0.0029
Diabetes, n(%) 50 (44) 150 (28) 0.0010
27
Index, race, and appetite disturbances. All of these, however, were insignificant in a
model with depression only (α = 0.05).
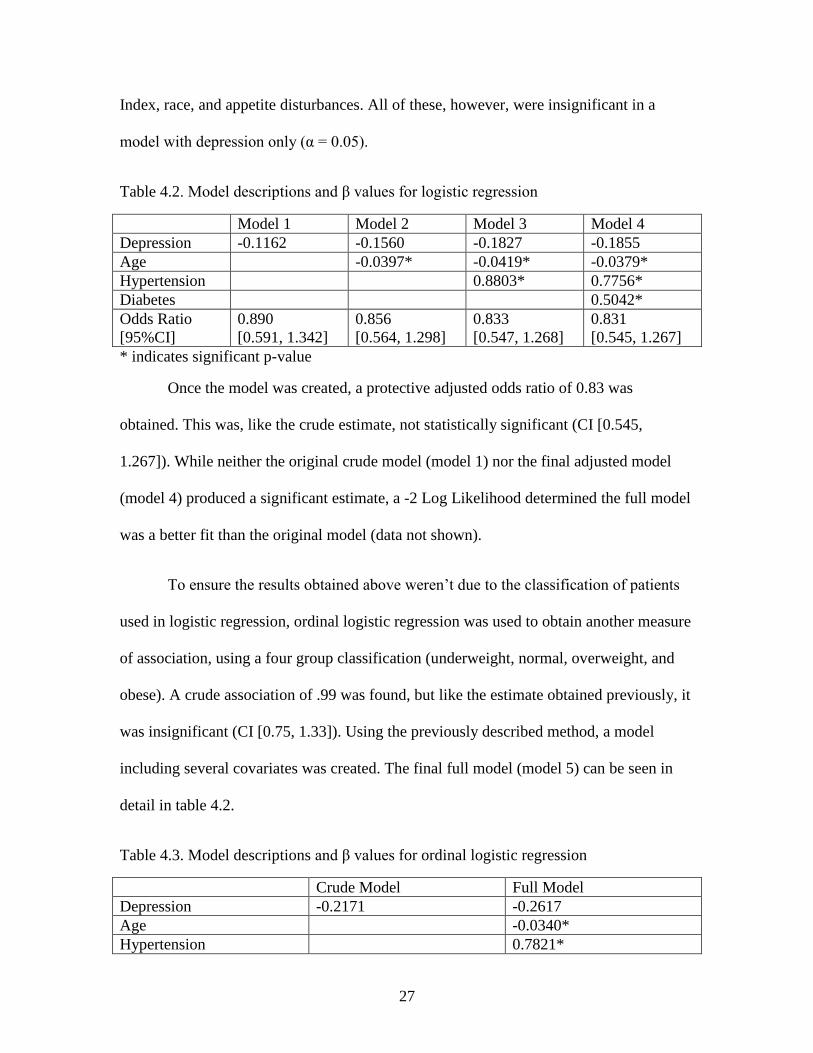
Table 4.2. Model descriptions and β values for logistic regression
Model 1 Model 2 Model 3 Model 4
Depression -0.1162 -0.1560 -0.1827 -0.1855
Age -0.0397* -0.0419* -0.0379*
Hypertension 0.8803* 0.7756*
Diabetes 0.5042*
Odds Ratio
[95%CI]
0.890
[0.591, 1.342]
0.856
[0.564, 1.298]
0.833
[0.547, 1.268]
0.831
[0.545, 1.267]
* indicates significant p-value
Once the model was created, a protective adjusted odds ratio of 0.83 was
obtained. This was, like the crude estimate, not statistically significant (CI [0.545,
1.267]). While neither the original crude model (model 1) nor the final adjusted model
(model 4) produced a significant estimate, a -2 Log Likelihood determined the full model
was a better fit than the original model (data not shown).
To ensure the results obtained above weren’t due to the classification of patients
used in logistic regression, ordinal logistic regression was used to obtain another measure
of association, using a four group classification (underweight, normal, overweight, and
obese). A crude association of .99 was found, but like the estimate obtained previously, it
was insignificant (CI [0.75, 1.33]). Using the previously described method, a model
including several covariates was created. The final full model (model 5) can be seen in
detail in table 4.2.
Table 4.3. Model descriptions and β values for ordinal logistic regression
Crude Model Full Model
Depression -0.2171 -0.2617
Age -0.0340*
Hypertension 0.7821*

28
Crude Model Full Model
Diabetes 0.5125*
Appetite Score 0.00272*
Odds Ratio
[95% CI]
0.805
[0.518, 1.250]
0.770
[0.489, 1.212]
* Indicates significant p-value
Table 4.4. Comparison of weight statuses using ordinal logistic regression
Odds ratio [95% Confidence Interval]
Underweight <0.001[0.392, 1.100]
Overweight 0.913 [0.609, 1.368]
Obese 0.770 [0.489, 1.212]
Like the previous logistic regression results, all odds ratios were insignificant.
Also like the estimates from logistic regression, the crude and adjusted odds ratios were
below 1. The adjusted odds ratio obtained from the full model showed reduced odds of
having depression among those who are classified as obese, compared to those who are
classified as normal weight, when other variables are held constant. When comparing the
overweight population to the normal weight group, the odds increased to nearly 1 (0.913
[0.609, 1.368]), as seen in Table 4.4. As seen in the other regression analyses, none of the
odds ratios obtained were significant.
Linear regression was used to analyze a potential linear trend between the
continuous BMI variable and depression. It was determined there was not a linear trend,
as the adjusted r2 for both the crude association and the adjusted model was very small
(0.002 and 0.0584, respectively) when the generalized linear model (GLM) procedure in
SAS was used. The continuous BMI variable was transformed in several ways, to assess
for a non-linear trend. The first transformation assessed was BMI2, the adjusted r
2
dropped to 0.0165 for the adjusted model. For BMI3, the adjusted r
2 for the adjusted

29
model dropped even further to 0.0082, much lower than the non-transformed variable.
Finally, the BMI variable was standardized, which increased the adjusted r2 to 0.0224,
which was still lower than the un-transformed variable.
30
CHAPTER 5
DISCUSSION
The prevalence of obesity among the population of AD patients was 17.6%, which is less
than the national prevalence of older adults of 35.4%, as determined by Ogden et al
(2014). A test of proportions showed the prevalence obtained in this study was
significantly different than the prevalence obtained by Ogden et al. (Z test statistic: -8.58;
p-value: <0.0001). The same was determined for overweight; the prevalence of
overweight adults was 24.0%, lower than the national prevalence of 33.6% (Ogden et al,
2014). These findings, which are contrary to our hypothesis, may be due in part to the
small number of participants. The fact that the average age of the population was in the
mid-80s may also contribute to the lower percentage of overweight and obese
individuals. A recent study conducted on modifiable risk factors of AD reported the
prevalence of obesity among AD patients to be 28% (Chen, 2014). This was also lower
than the national prevalence, but was higher than the prevalence of this study. The older
population Chen et al. studied had a mean age of 70 years, still much lower than this
study.
One potential explanation for the lower than expected obesity and overweight
prevalence is due to the age and nature of the population in this study. The population
had a high mean age, and all participants were diagnosed with AD. This indicates that
most of the participants were in the later stages of AD, which is characterized by loss of

31
appetite and trouble swallowing (Alzheimer’s Association, 2014). This leads to weight
loss and frailty. This frailty could be the reason such a low prevalence of obesity was
seen. On the other hand, the overall prevalence of depression among this study
population was 53.7%, higher than the 48% Lyketsos et al found in 1997. This aligns
with the hypothesis that the prevalence of depression in this study would be around 50%,
similar to the previously mentioned study. A test of proportions showed the prevalence
obtained in this study was not significantly different than the prevalence obtained by
Lyketsos (Z test statistic: 2.89; p-value: .9981). Although the Lyketsos study is nearly 20
years old, the trend remains that there is a high proportion of AD patients that experience
depression (Lyketsos, 1997).
While not statistically significant, there was a protective association between
depression and obesity found in this study. This is the exact opposite of what was
hypothesized, and what had been previously published. Brumpton et al. found both men
and women who had depressive symptoms had an increased risk of being obese (relative
risks of 1.37 and 1.18, respectively) (2013). However, Brumpton et al. did not look at
those specifically with AD, thus a direct comparison cannot be made. Likewise, Brook et
al. found women with psychological issues such as depression were more likely to report
less physical activity, which was directly associated to higher BMI (2013). While many
of these studies dealt primarily with adolescents, Pan et al. found depression to be
associated with obesity (odds ratio of 1.38) among middle aged and elderly women
without AD (2012). The difference in findings from previously published literature may
be due to there being very little difference between the proportions of AD patients with
depression among the obese/non-obese groups (See Table 4.1). The obesity groups were
32
broken down further, to determine if this was causing the insignificant protective
association. Regardless of how the patients were grouped (2, 3, or 4 categories), there
remained no significant differences in the proportions of depressed individuals. The odds
ratio increased to 1.23 when multinomial regression was used, but remained insignificant.
While the results of this study were not as expected, there is a potential
explanation for the protective association found. As previously mentioned, this study
population had a relatively old mean age, indicating the patients more than likely were
farther along in the progression of AD. Late stage AD is characterized by both depression
(the main exposure of interest) and increased frailty. This could cause the association to
be skewed toward a protective association.
A linear model to evaluate the association between continuous BMI and
depression was determined to be ineffective. There is not a strict linear relationship
between continuous BMI and continuous depression score. Based on the adjusted r-
squares calculated, a linear model fits the data very poorly, thus linear regression was
rejected as reasonable method for estimating the association between depression and
obesity. This held true even after a set of different transformations were applied to the
BMI variable. All transformations resulted in a poorer fit for the adjusted models than the
untransformed BMI variable.
This study has several strengths. This study focused on a very specific population,
one that is of the utmost importance, as the prevalence of AD is expected to dramatically
increase in the next few decades. While several studies have focused on the relationship
33
between depression and obesity, it has not really been studied among AD patients. Thus,
this study attempts to fill in that gap.
The use of multiple types of analyses to determine the true odds of depression is
also considered a strength. While a linear analysis was ruled ineffective, both the logistic
and multinomial regression analyses concluded there was no significant relationship
between depression and obesity. Using multiple types of regression reinforced the results
obtained, indicating the estimates calculated are more than likely correct. This means
there most likely is not a true significant relationship between depression and obesity
among AD patients in this population.
This study also has a few limitations. The overall number of patients classified as
obese was relatively low, as was the total number of participants, compared to the
number of AD patients in the registry. Hence, the power of this study may be lowered.
Perhaps the biggest limitation to this study was the method of collecting certain
information. While information such as age, height, weight, and comorbidities were
collected by nurses directly from the AD patients, information on depression and appetite
disturbances was obtained from caregivers of the patients. This leads to potential
misinformation, and also has the potential to introduce recall bias.
Another limitation to this study was a lack of certain confounders being
ascertained in the dataset. Other than home ownership (which was found to be
insignificant in all analyses), there were no socioeconomic variables available to include
in the analysis. SES has been found to be a significant variable when analyzing
associations between both AD and depression (Yaffe K, 2013; Evans D, 1997; McDowell
34
I, 2007), and there was no way to control for it in this study. There were also no measures
of APOE taken in this study – another variable that should be controlled for during
analyses. Since APOE may be associated with an increased risk of depression, it may be
a potential confounder (Breitner J, 1999; Blacker D, 1997; Corbo R, 2007). Not having
these two key pieces of information is seen as a limitation, as it may be masking the true
association between depression and obesity among this group of AD patients. With the
addition of these two variables, the protective association found using logistic regression
may have been closer to the null value of 1.
35
CHAPTER 6
CONCLUSIONS
This study determined there was no significant association between depression and
obesity among adults diagnosed with AD. This was opposite of what was expected, and
what had been reported in previous studies. This may be due to the previously mentioned
limitations, or some other as of yet unknown circumstances.
Due to the drastic increase in expected number of AD patients in the future (Reitz,
2014), it is imperative that modifiable factors that affect the risk of developing AD are
well understood. As there is currently no cure for AD, prevention is the only option for
decreasing the incidence. This study did not find evidence of an association between
depression and obesity; however, based on the limitations mentioned previously, the
steps described below need to be taken to completely rule out an association.
A potential future study should include SES information, as well as information
about APOE in the AD patients. A study with a larger population of adults with AD, and
clinically diagnosed depression instead of caregivers’ opinions would be ideal in either
refuting or confirming the results of this study. Potentially, the study could be repeated,
using patients from the full AD registry, and obtaining the missing information directly
from the AD patients themselves, or the caretakers who would be able to provide the
desired information.

36
There is still a knowledge gap in the literature surrounding the associations
between several risk factors among AD patients. This study attempted to fill that gap for
obesity and depression, however, based on the findings, the results should be cautiously
interpreted. As mentioned previously, further study is needed in this area, as well as other
potential modifiable risk factors.
37
REFERENCES
Alzheimer’s Disease Education and Referral Center. Alzheimer's Disease Genetics Fact
Sheet. National Institute on Aging, 2011;
http://www.nia.nih.gov/alzheimers/publication/alzheimers-disease-genetics-fact-
sheet
Alzheimer’s Association. Alzheimer’s Disease Facts and Figures. Alzheimer’s Dementia,
2014; 10(2).
American Diabetes Association. Diagnosis and classification of diabetes mellitus.
Diabetes Care, 2010; 33(Suppl 1): S62–S69.
American Psychiatric Association. Diagnostic and Statistical Manual of Mental Disorders
(fifth ed.). Arlington, VA,: American Psychiatric Publishing, 2013.
American Psychological Association. Socioeconomic Status. American Psychological
Association, 2014. http://www.apa.org/topics/socioeconomic-status/.
Atti A, Palmer K, et al. Late-life body mass index and dementia incidence: Nine-year
follow-up data from the Kungsholmen Project. JAGS, 2008; 56: 111-6.
Blacker D, Haines J, et al. ApoE-4 and age at onset of Alzheimer's disease: The NIMH
Genetics Initiative. Neurology, 1997; 48: 139-47.
Breitner J, Wyse B, et al. APOE-E4 count predicts age when prevalence of AD increases,
then declines: The Cache County Study. Neurology, 1999; 53: 321-36.
Brodaty H, Arasaratnam C. Meta-Analysis of Nonpharmacological Interventions for
Neuropsychiatric Symptoms of Dementia. American Journal of Psychiatry, 2012;
169(9): 946-53.
Brook J, Lee J, et al. Determinants of obesity: results from a longitudinal study of
adolescents and adults living in an urban area. Psychol Rep, 2013; 113(3): 717–
33.
38
Brookmeyer R, Gray B, et al. Projections of Alzheimer’s disease in the United States and
the public health impact of delaying disease onset. American Journal of Public
Health, 1997; 88(9): 1337-4
Brumpton B, Langhammer A, et al. The associations of anxiety and depression symptoms
with weight change and incident obesity: The HUNT Study. International Journal
of Obesity, 2013; 37: 1268-74.
Chen S, Siddarth P, et al. Modifiable risk factors for Alzheimer’s disease and subjective
memory impairment across age groups. PLOS One, 2014; 9(6).
Craft S, Watson G. Insulin and neurodegenerative disease: shared and specific
mechanisms. Lancet Neurology, 2004; 3: 169–78.
Conklin A, Forouhl N, et al. Socioeconomic status, financial hardship and measured
obesity in older adults: a cross sectional study of the EPIC-Norfolk cohort.
BioMed Central Public Health, 2013; 13: 1039.
Corbo R, Gambina G, et al. Combined effect of Apolipoprotein E genotype and past
fertility on age at onset of Alzheimer’s disease in women. Dement Geriatr Cogn
Disord, 2007; 24: 82-5.
Corder E, Saunders A, et al. Protective effect of Apolipoprotein E type 2 allele for late
onset Alzheimer Disease. Nature Genetics, 1994; 7: 180-4.
Dahl A, Lopponen M, et al. Overweight and obesity in old age are not associated with
greater dementia risk. JAGS, 2008; 56: 2261-6.
Demirovic J, Prineas R, et al. Prevalence of Dementia in Three Ethnic Groups: The South
Florida Program on Aging and Health. Ann Epidemiol, 2003; 13: 472–8.
Diniz B, Butters m, et al. Late-life depression and risk of vascular dementia and
Alzheimer’s disease: systematic review and meta-analysis of community-based
cohort studies. British J of Psych, 2013; 202: 329-35.
Douaud G, Menke R et al. Brain microstructure reveals early abnormalities more than
two years prior to clinical progression from mild cognitive impairment to
Alzheimer’s disease. Journal of Neuroscience, 2013; 33(5): 2147-55.
Drewnowski A, Moudon A, et al. Food environment and socioeconomic status influence
obesity rates in Seattle and Paris. International Journal of Obesity, 2014; 38: 306-
14.
39
Evans D, Hebert L, et al. Education and other measures of socioeconomic status and risk
of incident Alzheimer disease in a defined population of older persons. Archives
of Neurology, 1997; 54: 1399-1405.
Fakhran S, Yaeger K, et al. Symptomatic white matter changes in mild traumatic brain
injury resemble pathologic features of early Alzheimer’s dementia. Radiology,
2013; 269: 249-57.
Ferri C, Prince M, et al. Global prevalence of dementia: a Delphi consensus study.
Lancet, 2005; 366: 2112-7.
Flegal K, Carroll M, et al. Prevalence and trends in obesity among US adults, 1999-2008.
JAMA, 2010; 303(3): 235-41.
Galluzzi S, Geroldi C, et al. Supporting evidence for using biomarkers in the diagnosis of
MCI due to AD. Journal of Neurology, 2013; 260: 640-50.
Girouard H, Iadecola C, Neurovascular coupling in the normal brain and in hypertension,
stroke, and Alzheimer disease. J Appl Physiol, 2006; 100: 328–335.
Glynn R, Beckett L, et al. Current and remote blood pressure and cognitive decline.
JAMA, 1999; 281(5): 438-45.
Grilo C, et al. Physical activity and obesity. Biomedicine Pharmacotherapy, 1994; 48(3):
127-36.
Guskiewicz K, Marshall S, et al. Association between recurrent concussion and late-life
cognative impairment in retired professional football players. Neurosurgery,
2005; 57(4): 719-26.
Hansen R, Gartlehner G et al. Efficacy and safety of donepezil, galantamine, and
rivastigmine for the treatment of Alzheimer’s disease: A systematic review and
meta-analysis. Clinical Interventions in Aging, 2008; 3(2): 211-25.
Hebert L, Scherr P, et al. Is the risk of developing Alzheimer’s disease greater for women
than for men? American Journal of Epidemiology, 2001; 153(2): 132-6.
Hebert L, Weuve J, et al. Alzheimer disease in the United States (2010-2050) estimated
using the 2010 census. Neurology, 2013; 80: 1778-83.
Hokama M, Oka S, et al. Altered expression of diabetes-related genes in Alzheimer’s
disease brains: the Hisayama study. Cerebral Cortex, 2013.
Huang C, Chung C, et al. Diabetes mellitus and the Risk of Alzheimer’s disease: A
nationwide population-based study. PLOS ONE, 2014; 9 (1).
40
Jack CR, Albert MS et al. Introduction to the recommendations from the National
Institute on Aging – Alzheimer’s Association workgroups on diagnostic
guidelines for Alzheimer’s disease. Alzheimer’s & Dementia, 2011; 7(3): 257-62.
Kiraly, M and Kiraly S. Traumatic brain injury and delayed sequelae: a review –
traumatic brain injury and mild traumatic brain injury (concussion) are precursors
to later-onset brain disorders, including early-onset dementia.
TheScientificWorldJOURNAL, 2007; 7: 1768-76.
Knopman D, Boland L, et al. Cardiovascular risk factors and cognitive decline in middle-
aged adults. Neurology, 2001; 56: 42-8.
Kukull W, Higdon R, et al. Dementia and Alzheimer disease incidence: A prospective
cohort study. Arch Neurology, 2002; 59: 1737-46.
Lakhan S, and Kirchgessner A. The emerging role of dietary fructose in obesity and
cognitive decline. Nutritional Journal, 2013; 12.
Laurin D, Verreault R, et al. Physical activity and risk of cognitive impairment and
dementia in elderly patients. JAMA, 2001; 58: 498-504.
Lee S, Kim Y, et al. A Retrospective cohort study on Obesity and Hypertension risk
among Korean Adults. J Korean Med Sci, 2005; 20: 188-95.
Liu Z, Chen H, et al. A cross-sectional study on cerebrospinal fluid biomarker levels in
cognitively normal elderly subjects with or without a family history of
Alzheimer’s disease. CNS Neuroscience Therapeutics, 2013; 19: 38-42.
Luchsinger J, Biggs M, et al. Adiposity and cognitive decline in the Cardiovascular
Health Study. Neuroepidemiology, 2013; 40: 274-81.
Luppa M, Luck T, et al. Depression and incident dementia. An 8-year population-based
prospective study. PLOS ONE, 2013; 8(3).
Lyketsos C, Steele C, et al. Major and minor depression in Alzheimer’s disease:
Prevalence and impact. J of Neuropsychiatry, 1997; 9(4).
Manly J, Tang M, et al. Frequency and Course of Mild Cognitive Impairment in a
Multiethnic Community. Ann Neurol, 2008; 63: 494–506.
Marmorstein N, Iacono W, et al. Obesity and depression in adolescence and beyond:
reciprocal risks. International Journal of Obesity, 2014; 1-6.
Mayeux R, Sano M, et al. Risk of dementia in first-degree relatives of patients with
Alzheimer’s disease and related disorders. Arch Neurology, 1991; 48: 269-73.
41
McDowell I, Xi G, et al. Mapping the connections between education and dementia.
Journal of Clinical and Experimental Neuropsychology, 2007; 29(2): 127-41.
McKhann GM, Knopman DS, et al. The diagnosis of dementia due to Alzheimer’s
disease: Recommendations from the National Institute on Aging– Alzheimer’s
Association workgroups on diagnostic guidelines for Alzheimer’s disease.
Alzheimer’s & Dementia, 2011; 7(3): 263-69.
de la Monte, S. Relationships between diabetes and cognitive impairment. Endocrinol
Matab Clin N Am, 2014; 43: 245-67.
Mokdad A, Ford E, et al. Prevalence of obesity, diabetes, and obesity-related health risk
factors, 2001. JAMA, 2003; 289(1): 76-9.
Mosconi L, Brys M, et al. Maternal family history of Alzheimer’s disease predisposes to
reduce brain glucose metabolism. PNAS, 2007; 108(48): 19067-72.
Mowafi M, Khadr Z, et al. Socioeconomic status and obesity in Cairo, Eqypt: A heavy
burden for all. Journal of Epidemiology and Global Health, 2014; 4: 13-21.
National Institutes of Health. The seventh report from the Joint National Committee on
Prevention, Detection, Evaluation, and Treatment of High Blood Pressure. NIH,
2010.
Ogden C, Carroll M, et al. Prevalence of childhood and adult obesity in the United States,
2011-2012. JAMA, 2014; 311(8): 806-14.
Olazaran J, Trincado R, et al. Cumulative effect of depression on dementia risk.
International Journal of Alzheimer’s Disease, 2013.
Ott A, Stolk R et al. Diabetes mellitus and risk of dementia: the Rotterdam Study.
Neurology, 1999; 53: 1937-42.
Pan A, Sun Q, et al. Bidirectional association between depression and obesity in middle-
aged and older women. Int J Obes, 2012; 36(4): 595–602.
Plassman B, Havlik R, et al. Documented head injury in early adulthood and risk of
Alzheimer’s disease and other dementias. Neurology, 2000; 55: 1158-66.
Porcelli S, Salfi R, et al. Association between Sirtuin 2 gene rs10410544 polymorphism
and depression in Alzheimer’s disease in two independent European samples. J
Neural Transm, 2013; 120: 1709-15.
42
Potter G, Plassman B, et al. Cognitive performance and informant reports in the diagnosis
of cognitive impairment and dementia in African Americans and whites.
Alzheimer’s Dementia, 2009; 5: 445-53.
Randolph C, Karantzoulis S, et al. Prevalence and characterization of mild cognitive
impairment inretired National Football League players. J International
Neuropsychological Society, 2013; 19:873-80.
Reitz C, Mayeux R, Alzheimer disease: Epidemiology, Diagnostic Criteria, Risk Factors
and Biomarkers. Biochemical Pharmacology, 2014;
http://dx.doi.org/10.1016/j.bcp.2013.12.024
Ricci N, Pessoa G, et al. Frailty and cardiovascular risk in community-dwelling elderly:
A population-based study. Clin Interv Aging, 2014; 9: 1677-85.
Roe C, Fagan A, et al. Amyloid imaging and CSF biomarkers in predicting cognitive
impairment up to 7.5 years later. American Academy of Neurology, 2013; 80:
1784-91.
Rosen A, Steenland N, et al. Evidence of shared risk for Alzheimer’s disease and
Parkinson’s disease using family history. Neruogenetics, 2007; 8: 263-70.
Rosengren A, Skoog I, et al. Body mass index, other cardiovascular risk factors, and
hospitalization for dementia. JAMA, 2005; 165: 321-6.
Shaffer L, Petrella J, et al. Predicting cognative decline in subjects at risk for Alzheimer
disease by using combined cerebrospinal fluid, MR imaging, and PET
biomarkers. Radiology, 2013; 266(2): 583-91.
Shah R, Lee H et al. Current approaches in the treatment of Alzheimer’s disease.
Biomedicine Pharmacotherpy, 2008; 62: 199-207.
Shaw J, Sicree R, et al. Global estimates of the prevalence of diabetes for 2010 and 2030.
Diabetes Research and Clinical Practice, 2010; 87: 4-14.
Sturm R. The effects of obesity, smoking, and drinking on medical problems and costs.
Health Affairs, 2002; 21(2): 245-53.
Todd S, Barr S, et al. Cause of death in Alzheimer’s disease: a cohort study. Q J Med
2013; 106:747–53.
Tolppanen A, Ngandu T, et al. Midlife and late-life body mass index and late-life
dementia: results from a prospective population-based cohort. J of Alzheimer’s
Disease, 2014; 38: 201-9.
43
Wand K, Woung L, et al. Risk of Alzheimer’s disease in relation to diabetes: a
population-based cohort study. Neuroepidemiology, 2012; 38: 237-44.
Wang H, Karp A, et al. Late-life engagement in social and leisure activities is associated
with a decreased risk of dementia: A longitudinal study from the Kungsholmen
Project. Am J Epid, 2002; 155(12): 1081-87.
Weiner M, Friedl K, et al. Military risk factors for Alzheimer’s disease. Alzheimer’s
Dementia, 2013; 9:445-51.
Whitmer R, Gunderson E, et al. Obesity in middle age and future risk of dementia: a 27
year longitudinal population based study. British Medical Journal, 2005; 330:
1360-2.
Yaffe K, Falvey C, et al. Effect of socioeconomic disparities on incidence of dementia
among biracial older adults: prospective study. BMJ, 2013; 347.
44
APPENDIX A – QUESTIONS USED FOR DEPRESSION VARIABLES
Table A.1 Survey questions used for depression variables
Variable Question Response choices
Depression
(Categorical)
Does the patient seem sad or depressed?
Does he/she say that he/she feels sad or
depressed?
Yes/No
Does the patient have periods of
tearfulness or sobbing that seem to
indicate sadness?
Yes/No
Does the patient say, or act as if, he/she is
sad or in low spirits?
Yes/No
Does the patient put him/herself down or
say that he/she feels like a failure?
Yes/No
Does the patient say that he/she is a bad
person or deserves to be punished?
Yes/No
Does the patient seem very discouraged or
say that he/she has no future?
Yes/No
Does the patient say he/she is a burden to
the family or that the family would be
better off without him/her?
Yes/No
Does the patient express a wish for death
or talk about killing himself/herself?
Yes/No
Does the patient show any other signs of
depression or sadness?
Yes/No
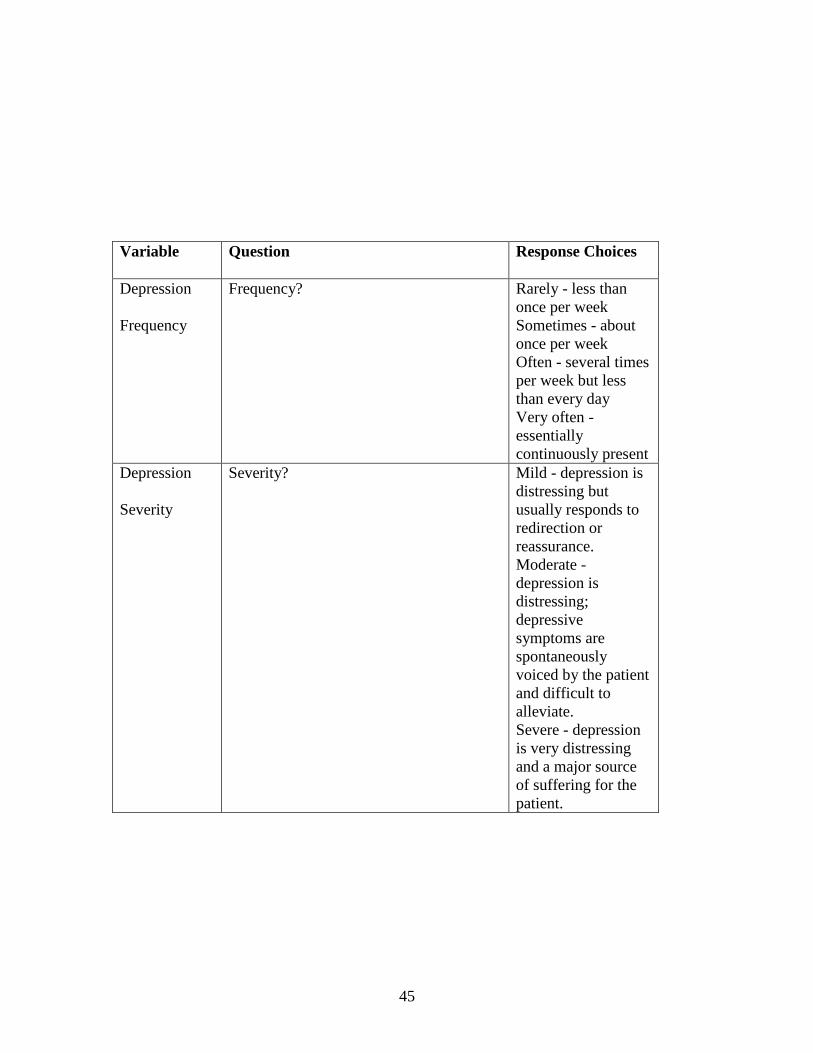
45
Variable Question Response Choices
Depression
Frequency
Frequency? Rarely - less than
once per week
Sometimes - about
once per week
Often - several times
per week but less
than every day
Very often -
essentially
continuously present
Depression
Severity
Severity? Mild - depression is
distressing but
usually responds to
redirection or
reassurance.
Moderate -
depression is
distressing;
depressive
symptoms are
spontaneously
voiced by the patient
and difficult to
alleviate.
Severe - depression
is very distressing
and a major source
of suffering for the
patient.
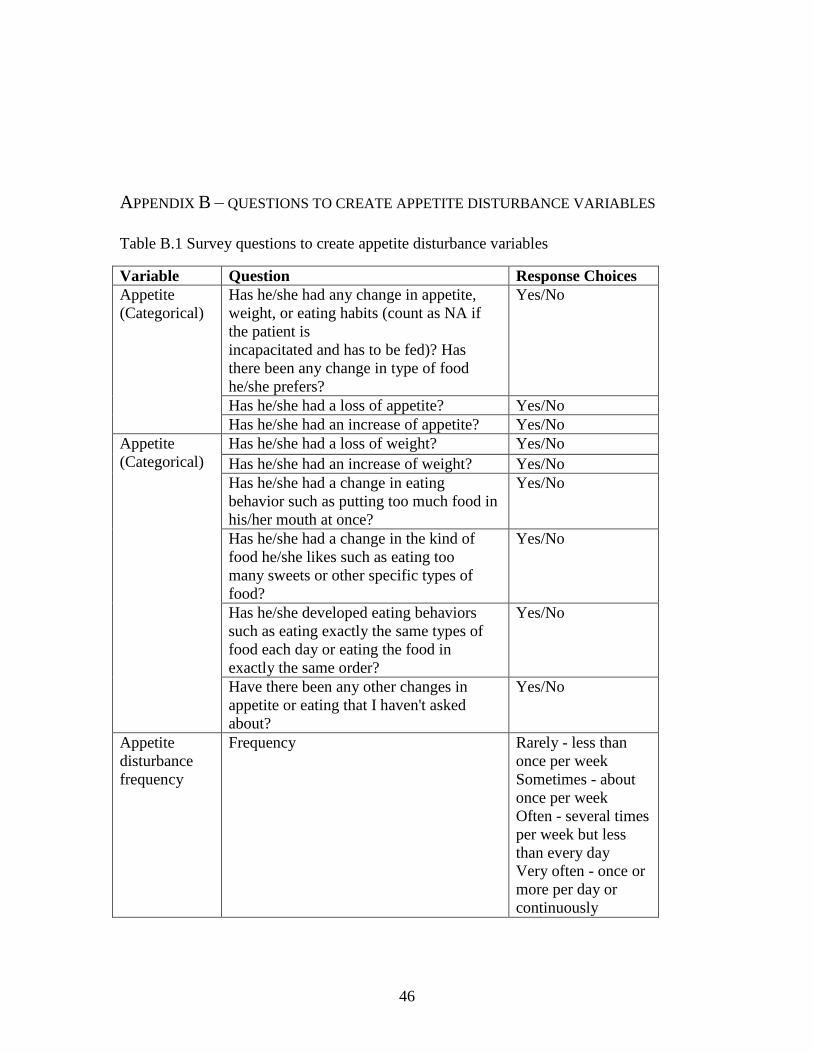
46
APPENDIX B – QUESTIONS TO CREATE APPETITE DISTURBANCE VARIABLES
Table B.1 Survey questions to create appetite disturbance variables
Variable Question Response Choices
Appetite
(Categorical)
Has he/she had any change in appetite,
weight, or eating habits (count as NA if
the patient is
incapacitated and has to be fed)? Has
there been any change in type of food
he/she prefers?
Yes/No
Has he/she had a loss of appetite? Yes/No
Has he/she had an increase of appetite? Yes/No
Appetite
(Categorical)
Has he/she had a loss of weight? Yes/No
Has he/she had an increase of weight? Yes/No
Has he/she had a change in eating
behavior such as putting too much food in
his/her mouth at once?
Yes/No
Has he/she had a change in the kind of
food he/she likes such as eating too
many sweets or other specific types of
food?
Yes/No
Has he/she developed eating behaviors
such as eating exactly the same types of
food each day or eating the food in
exactly the same order?
Yes/No
Have there been any other changes in
appetite or eating that I haven't asked
about?
Yes/No
Appetite
disturbance
frequency
Frequency Rarely - less than
once per week
Sometimes - about
once per week
Often - several times
per week but less
than every day
Very often - once or
more per day or
continuously

47
Variable Question Response Choices
Appetite
disturbance
severity
Severity Mild - changes in
appetite or eating are
present but have not
led to changes in
weight and are not
disturbing
Moderate - changes
in appetite or eating
are present and
cause minor
fluctuations in
weight
Severe - obvious
changes in appetite
or eating are present
and cause
fluctuations in
weight, are
embarrassing, or
otherwise disturb the
patient