Embed Size (px)
Citation preview

International Journal for Research in Vocational Education and Training (IJRVET)Vol.6, Issue 1, April 2019, 68-96DOI: 10.13152/IJRVET.6.1.4
ISSN: 2197-8646http://www.ijrvet.net
Exploring visual languages across vocational professions
Alessia Eletta Coppi*1, Alberto Cattaneo1, Jean-Luc Gurtner2
1Swiss Federal Institute for Vocational Education and Training, 6900 Lugano, Switzerland 2University of Fribourg, Department of Educational Sciences, 1700 Fribourg, Switzerland
Received: 13.07.2018; Accepted: 07.11.2018; Published: 30.04.2019
Abstract
Context: Discovering visual languages across professions is a complex task since it entails discovering a communication system composed of information in image or textual form called representations and also including various kinds of annotations such as notes. Such a task has been previously scarcely considered within research, and basically only inves-tigating in white collar professions (e.g., doctors). This leaves us wondering about all the possible shapes of these vocational visual languages and the potential of using these images to foster learning. For this reason, the current research aims to investigate commonalities and differences of visual languages across vocational professions with the goal of using the outcomes to design educational activities for vocational education and training (VET).
Approach: 55 semi-structured interviews have been conducted within eleven professions from the areas of Craftsmanship, Industry, Health and Services such a plumber and fashion designers. The interviews were audio-recorded and analyzed with NVivo through a coding scheme which served as the main reference for the analysis.
Findings Results showed that, in terms of visual representations, professionals use different types of drawings such as technical drawings (e.g., woodworkers), evaluation forms (e.g., dental assistants) and illustrations (e.g., gardeners). For sketches, participants indicate the practice of creating sketches depicting objects to produce (e.g. goldsmiths). For photos, they portrayed things to remember or pay attention to (e.g., chemical technologists). Participants
*Corresponding author: [email protected]

69Coppi, Cattaneo, Gurtner
across professions use annotations such as notes to specify details of their job. On the other side, they also report profession-specific annotations such as mathematical symbols like the surface roughness (e.g., polymechanics) and diagrammatic elements like different type of lines to indicate the status of the bones and muscles (e.g., massage therapists) or where to cut textiles (e.g., fashion designers). In terms of communalities, participants within techni-cal professions indicated a shared use of both representations and annotations. Conversely, other professions had very specific visual languages hardly shareable across professions.
Conclusion: These results helped in discovering the visual languages of different professions and this knowledge will be used to implement educational activities based on specific skills needed in different professions such as observation skills with the use of VET-specific edu-cational technologies.
Keywords: Visual languages, visual representations, annotations, vocational professions, vo-cational education and training, VET
1 IntroductionFor many decades the exploration of language has been a topic of research in many discipli-nes, such as philosophy and communication (e.g. Chomsky, 1962), psychology and education (e.g. Vygotsky, Whorf, & Wittgenstein, 1990) professions and organization (e.g., Loewen-stein, 2014) or semiotics and anthropology (e.g., Goodwin, 2004). These areas of knowledge focused on the concept of language, the impact of language in cognitive development or the use of textual and spoken language in different workplaces. Differently, this research will fo-cus more on the topic of language from a visual point of view; visual language is a communi-cation system that uses visual elements (Cherry, 1957) such as visual representations (Chang, 1986) or graphical signs like dots, lines, and arrows and their spatial relationships (Calvani, 2011). Aiming to research the visual language of multiple professions can be seen as a cum-bersome task and one way to narrow the goal of this study is to focus on visual representa-tions and annotations. These two concepts comprise most of the visual language of different professions and have also been the object of many years of research in the area of learning and psychology (e.g., Gibson, 1950; Anderson, 1978; Smith, 1998; Ainsworth, 1999; Arcavi, 2003). This is due to their potential for fostering students’ and workers’ learning and produc-tivity by decreasing cognitive overload and enhancing general understanding. Although the research on representations and annotations is extensive, the principal investigations' focus is mainly on: 1) producing taxonomies, identifying the cognitive and psychological bene-fits and main uses and 2) white-collar professions rather than vocational professions. What about blue-collar vocational professions? What types of visual representations, annotations and colors do they use? Are there features or elements of visual language used across profes-

70 Exploring visual languages
sions; is there any evidence of a shared visual language within and between these professions? Answering these questions could be beneficial for education and especially for vocational education: especially in dual systems, understanding better the use of visualizations within the professional domains could help on one side to bridge the gap between the work-based and the school-based track, and on the other side to design learning activities based on visual representations and fully exploiting the potential of annotations.
2 Theoretical background
2.1 Visual Representations
Visual representations are an established concept in the literature insofar as they have been studied in many humanistic sciences, although it is sometimes difficult to find a comprehen-sive definition of this term. Perini (2005) defined them as external objects that function as symbols, such as written text or numerical formulas. Other definitions that originated in the area of technology-mediated learning refer to visual representation as ‘visual display’, and specify that visual representations are representations of information that can have the form of text and static or dynamic images (Schraw, McCrudden, & Robinson, 2013).
In general, there is no widely accepted definition of visual representation; some of the pro-minent conceptualizations have focused on distinguishing different types of representations, such as internal and external representations (see, Gilbert, 2010), descriptive and depictive representations (Schnotz and Bannert, 2003) dynamic and static representations (Höffler, Schmeck, & Opfermann, 2013) and multiple representations (Ainsworth, 2006).
Alongside these studies, others have focused on representations such as drawings and sketches. In design and engineering the emphasis has been on producing taxonomies to unify the language and increasing understanding within the profession. For instance, Pei, Campbell and Evans (2011) created an extensive taxonomy that included different types of visual representations such as sketches, drawings, models and prototypes, with many diffe-rent subsets (Fig. 1).
Fig. 1: Taxonomy of Visual Design Representation (from Pei et al., 2011, p. 7)
71Coppi, Cattaneo, Gurtner
On the other hand, others distinguished between types of representation in design and engi-neering using the categories of: 1) concept design, 2) development design sketch, 3) embo-died design and 4) detailed design (Kim, Jung, & Self, 2013).
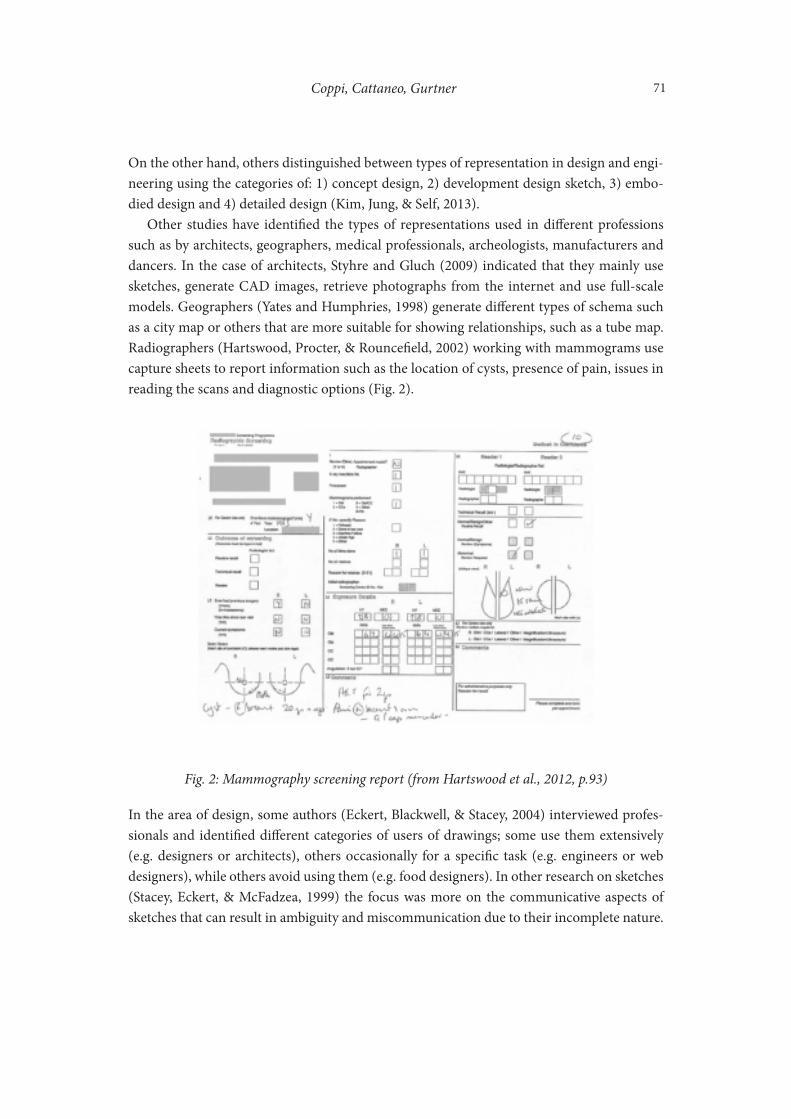
Other studies have identified the types of representations used in different professions such as by architects, geographers, medical professionals, archeologists, manufacturers and dancers. In the case of architects, Styhre and Gluch (2009) indicated that they mainly use sketches, generate CAD images, retrieve photographs from the internet and use full-scale models. Geographers (Yates and Humphries, 1998) generate different types of schema such as a city map or others that are more suitable for showing relationships, such as a tube map. Radiographers (Hartswood, Procter, & Rouncefield, 2002) working with mammograms use capture sheets to report information such as the location of cysts, presence of pain, issues in reading the scans and diagnostic options (Fig. 2).
Fig. 2: Mammography screening report (from Hartswood et al., 2012, p.93)
In the area of design, some authors (Eckert, Blackwell, & Stacey, 2004) interviewed profes-sionals and identified different categories of users of drawings; some use them extensively (e.g. designers or architects), others occasionally for a specific task (e.g. engineers or web designers), while others avoid using them (e.g. food designers). In other research on sketches (Stacey, Eckert, & McFadzea, 1999) the focus was more on the communicative aspects of sketches that can result in ambiguity and miscommunication due to their incomplete nature.
72 Exploring visual languages
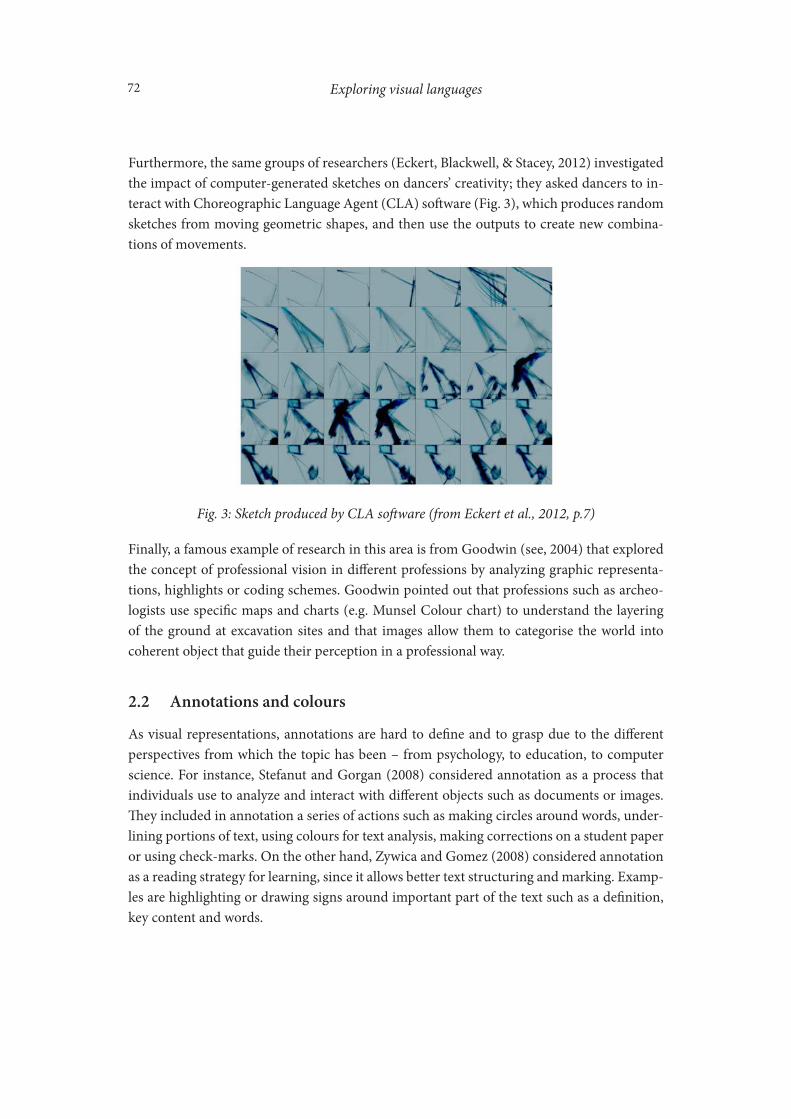
Furthermore, the same groups of researchers (Eckert, Blackwell, & Stacey, 2012) investigated the impact of computer-generated sketches on dancers’ creativity; they asked dancers to in-teract with Choreographic Language Agent (CLA) software (Fig. 3), which produces random sketches from moving geometric shapes, and then use the outputs to create new combina-tions of movements.
Fig. 3: Sketch produced by CLA software (from Eckert et al., 2012, p.7)
Finally, a famous example of research in this area is from Goodwin (see, 2004) that explored the concept of professional vision in different professions by analyzing graphic representa-tions, highlights or coding schemes. Goodwin pointed out that professions such as archeo-logists use specific maps and charts (e.g. Munsel Colour chart) to understand the layering of the ground at excavation sites and that images allow them to categorise the world into coherent object that guide their perception in a professional way.
2.2 Annotations and colours
As visual representations, annotations are hard to define and to grasp due to the different perspectives from which the topic has been – from psychology, to education, to computer science. For instance, Stefanut and Gorgan (2008) considered annotation as a process that individuals use to analyze and interact with different objects such as documents or images. They included in annotation a series of actions such as making circles around words, under-lining portions of text, using colours for text analysis, making corrections on a student paper or using check-marks. On the other hand, Zywica and Gomez (2008) considered annotation as a reading strategy for learning, since it allows better text structuring and marking. Examp-les are highlighting or drawing signs around important part of the text such as a definition, key content and words.

73Coppi, Cattaneo, Gurtner
In spite of the contrasting definitions and the lack of general classifications of annotations, research has addressed annotation both in the area of learning and in the professions. For instance, Heiser and Tversky (2006) identified what they called diagrammatic elements that generally help to enhance understanding of a representation, such as lines, blobs, boxes, cros-ses, arrows and circles. Elements such as arrows and lines are useful to emphasise the struc-tural organization and functioning of a machine or the working of a body (Azkue, 2013). Another example in engineering showed (see, Eckert et al., 2012) that designers produced drawings using CAD software’s and that they create a wide variety of signs and textual anno-tations that were used to duplicate, juxtapose and overlay images. In the medical field (see, Hartswood et al., 2002) radiographers working with mammograms use different notes to report abnormalities, such as abbreviations like ‘BT’ for breast tissue or ‘?’ to signal uncer-tainty. Other examples include ‘Dense BT’ for dense patches of material, ‘X NRC’ for no real changes in that area and ‘Benign’ for benign patches. Generally, these notes are annotated on the screening report, as illustrated in the image below (Fig. 4):
Fig. 4: Section of a mammography screening report (from Hartswood et al., 2012, p.93)
In this study we conceptualise visual representation as a visual object or an image that indi-viduals can create and manipulate such as a mind map, photograph or a sketch. Similarly, we conceive of annotations as the products of a process that includes a series of actions in which a visual representation is manipulated by adding one or more layers of information, which take the form(s) of text, lines, highlights and symbols.

74 Exploring visual languages
3 Research methodology
To answer our research questions an exploratory study was conducted in the Italian-speaking part of Switzerland (Tessin Canton). Data were collected during 55 semi-structured inter-views performed with five professionals from each of eleven professional areas, broadly grou-ped as: craftsmanship (woodworkers, plumbers, goldsmiths, fashion designers, winemakers, gardeners), industry (chemical technologists, polymechanics technicians, multimedia tech-nicians) and health & services (massage therapists, dental assistants). The interviews lasted for an average of 35 minutes (ranging from 13-90 minutes long) overall. During the sessions, participants were encouraged to show examples of representations and annotations typically used during their everyday work practice; such examples were collected for further reference. All of the interviews were audio-recorded, transcribed and analyzed using NVivo software. A coding scheme was created specifically for this research, based on Pei et al., (see, 2011), Heiser and Tversky (see, 2006), Schraw et al., (see, 2010). The coding scheme was also di-rectly induced from the interviews, to accommodate the fact that many professions included in our study go beyond the area of engineering and design. According to our research aims, the coding scheme distinguishes the following layers of coding: type of visual representation, type of annotation, use of colours and presence of shared language.
Visual Representations includes four codes:
– Drawings are formal arrangements of lines that determine a particular form. Dra-wings can picture different subjects; they are more structured than sketches;
– Sketches are preliminary design representations of something without details as the basis of a more finished product
– Photographs are images of an object, person or scene recorded by a camera on photo-sensitive material (Hanks, 1979);
– Other includes any other type of image such as colours scales or chromatographic images.
Annotations are considered to be the result of a series of actions in which a visual represen-tation is manipulated by adding written text, lines, highlights, arrows, drawings, numbers, and so forth (see, Stefanut and Gorgan, 2008; Zywica and Gomez, 2008). The categories of annotations that were observed are the following:

75Coppi, Cattaneo, Gurtner
– Notes are organised records of textual information present in a participant’s docu-mentation (see, Schraw et al., 2013). This category includes letters and combination of letters (A; AA), numbers (1, 2, 3) and combination of numbers and letters such as measurements (600mm);
– Diagrammatic elements are devices such as lines, blobs, boxes, crosses, arrows and circles (see, Heiser and Tversky, 2006). In this research this category also included plus (+) and minus (-) signs and alphanumeric characters such as asterisks (*), hash-tags (#) or at signs (@);
– Symbols (e.g. diameter, hazard symbol, pain) are conventional signs used in writing relating to a particular field to represent operations, quantities, elements, relations or qualities (Merriam-Webster's collegiate dictionary, 1979). They fulfill the criteria of standardization due to being professionally defined in standardised manuals and norms (e.g. International Standards Organization, ISO).
Colour is a layer of categorization that is applied to both representations and annotations. This layer was inserted in the coding scheme since colours is a dimension closely linked to images and annotation (e.g. Marshall, 1998).
Presence of Shared Language is another layer of categorization that can be applied to both representations and annotations. It was coded whenever participants mentioned that a spe-cific representation or annotation was shared within their profession or together with pro-fessionals from other professions with which they normally cooperate (e.g. medical doctors and nurses, electricians and plumbers, etc.).A subset equal to 20% of the corpus was inde-pendently coded by two researchers. The interrater reliability analyses for the four layers of codes showed substantial agreement that ranged from Kappa=0.75 to Kappa=0.94 (Landis and Koch, 1977).
4 Results In this section, we will focus on presenting the results of the content analyses of the inter-views. Alongside the description of the results, we have provided the illustrative quotation and some of the visual examples provided by the participants.

76 Exploring visual languages
4.1 What are the types of visual representations used across professions?
Table 1 displays how frequently different visual representations were mentioned by the in-terviewees, grouped by profession. Drawings were the most often mentioned representations across all professions. Sketches were reported less often than drawings but were mentioned by all the professions. Photos were mentioned by all winemakers, gardeners, goldsmiths and dental assistants.
Table 1: Frequency of references to different visual representations, by profession
(The numbers refer to the number of times a specific representation was mentioned, the numbers in parentheses standing for the number of persons that mentioned them within each profession)
After looking broadly at the frequencies table, it is important to explore the specific visual representations used by the sample.
In terms of Drawings, professionals such as polymechanics technicians and woodworkers reported using mainly technical drawings [1 – see numbered quotes below for examples of the type of use being mentioned] and illustrations [2]. Beside these types, plumbers reported using schematic diagrams [3], which were also the main types of drawing used by multi-media technicians. The difference is that in the first case the representations are picturing hydraulic systems, in the second electronic equipment:
[1] “We produce drawings using CAD and its internal library of tools. Our drawings are called ‘raiders’ and they show all the tools, position, info on the possible connections. With this drawing our workers are able to go to the site of the event with all the info needed.” [MultimediaTechnici-an_P23]
[2] We use technical illustrations of the machines so we know how certain machines work and how they can be cleaned.” [PolymechanicsTechnician_P12]

77Coppi, Cattaneo, Gurtner
[3] “They’re drawings representing the house. We can see the thermal power station, boilers, pipes, the sanitary systems, counter, and the distribution of the water.” [Plumber_P40]”
Fashion designers reported using two types of technical drawings; patterns [4] are templates for tracing the pieces of garments before cutting the fabric and technical sketches [5] are drawings of the garment with defined measurements and information:
[4] “Beside all the other types of images we use patterns. A fashion designer knows patterns. She knows that what is on the table is a jacket and not a dress.” [FashionDesigner_P08]
[5] “Technical sketches contain all the information about the garment from start to finish. I know that this garment is from a specific product line, that this jacket has a specific lining and pattern, that I’ll need to start stitching from the bottom.” [FashionDesigner_P41]
Gardeners’ planimetry is a type of technical drawing that shows the outline of the desired garden. It can have multiple formats and these drawings are generally produced by landscape architects [6]. Planimetries are also used by winemakers, who produce them to abide by the canton’s regulations or when they need to create a new vineyard [7]. Winemakers also use machine technical illustrations and scientific illustrations depicting plants and disease [8].
[6] “Drawings are made by the architects and then we create the actual garden. We don’t make the drawings! These drawings are from the top and show all the different flowerbeds, description of the plants, possible building, walls, pathways and everything else that could be in a garden.” [Gardener_P47]
[7] “We make technical drawings depicting the new vineyard since they are required by the can-ton.” [Winemaker_P34]
[8] “I use illustrations during the harvest to show the workers what kind of grapes they have to pick. I also use the plant disease ones to understand what grapes I have to remove.” [Winema-ker_P42]
Dental assistants and massage therapists reported using evaluation forms representing the body, called dentition charts and body charts. Dentition charts [9] are currently digital ima-ges presented in software (e.g. ZaWin32 or OneBox) depicting a prototypical set of teeth that can be modified by the assistant to match that of the patient. Similarly, body charts [10] depict the whole body or specific body parts. They both also reported using scientific illust-rations of the body or the mouth [11]:
[9] “The software has many settings. You can add all the different types of cavities and fillings, the pathology, the type of prostheses, implants or retainers that the patient has. You can also draw or write a note about a broken tooth or if the crown is made of gold or ceramic.” [DentalAssis-tant_P26]

78 Exploring visual languages
[10] “We use images representing the mouth with descriptions of different sections of the tooth. They are useful to explain to patients what type of treatment they are going to experience.” [Den-talAssistant_P26]
[11] “Anatomy books are useful to explain things to patients.” [MassageTherapist_P10]
Finally, the main source of information for chemical technicians was not graphical but rather text-based, and the only types of drawings used were technical drawings representing ma-chines [12]:
[12] “Drawings can help with the machines. It’s rare but if machines do not work we need them to fix the problem!” [ChemicalTechnician_P01]
Sketches are often created to put some ideas on paper and to show or explain something to the client. Therefore, sketches are simple visualizations of the possible product (e.g. jewelry). In the case of industrial and craftsmanship professionals, such as polymechanics technicians, woodworkers, multimedia technicians and plumbers, sketches can take the form of idea, stu-dy, informative or prescriptive sketches (see, Pei et al., 2011) and are used as a starting point to build the required piece [13], multimedia installation [14] or sanitary installation:
[13] “We always use them when building parts. If someone asks for a simple part such as a hook we sketch it and we don’t waste time with the technical drawings. We start working directly from the sketch.” [PolymechanicsTechnician_P12]
[14] “Sketches created in the first meeting with the client are the ‘phase zero’ of the project. They might look like unintelligible doodles but they are just the initial phase and they include also the ‘emotional side’ or the ‘fil rouge’ of the event.” [MultimediaTechnician_P23]
Goldsmiths favored sketches over drawings; they produce idea and study sketches in which they try different versions of the jewelry to be shown to the client before starting to work on the precious material [15]. In case of complex jewelry they produce a sketch with counts and measurements [16]:
[15] “I make simple sketches with a pencil in black and white. In other cases, it’s the client that brings me some drawings and I just try to redraw it a little better. Typically clients are happy with the result.” [Goldsmith_P24]
[16] “Well, if I have to make very complex jewelry or if I have to do something difficult.” [Golds-mith_P13]
Gardeners produced simple planimetry sketches (prescriptive sketches), but if the project was extensive, they required technical drawings from architects [17]. If the project was ex-

79Coppi, Cattaneo, Gurtner
tensive or well-financed, they might ask architects or artists to produce renderings of the final results. Renderings were also used by woodworkers and multimedia technicians [18]:
[17] “The idea is always to start with a small sketch in pencil that can be understood by everyone. Then it depends, if you’re a private client we just talk and we find a solution together by showing them some simple sketches on the spot. While if it’s a big building with 30 apartments, there is typically a company and architect involved and they’ll give us proper drawings.” [Gardener_P53]
[18] “Renderings are useful to interpret the client’s desire since they show the emotional aspect of what we’re going to build and help in showing the technical drawings in a realistic form.” [Multi-mediaTechnician_P23]
Dental assistants and massage therapists reported using information sketches to explain so-mething to the patient [19]. Winemakers produced sketches only when designing a new vi-neyard [20]:
[19] “I rarely use them, but in some cases I’ll use them to show what a hernia or a nerve compres-sion looks like.” [MassageTherapist_P10]
[20] “We use sketches that look like planimetry to understand how big the vineyard will be, how many plants I’ll need, how many poles and all the rest of the materials.” [Woodworker_P57]
Fashion designers reported using another type of sketch called measurement tables [21] that include a sketch of the final dress and its measurements:
[21] “It’s a standard table in which all the main measurement such as chest, waist and hips are reported. We also add simple and quick sketches so the client can have an idea of the dress.” [Fa-shionDesigner_P08]
In terms of Photographs, the only two types identified were photos taken with a camera or a phone and x-rays. In general, massage therapists reported taking snapshots of the patient’s body to show the status of the healing process [22]. Dental Assistants used them to clarify information given by the dentist and also used panoramic and single x-rays [23]:
[22] “Some chronic patients are unable to see their progress. In the case of an edema, I put photos next to their body to show their progress.” [MassageTherapist_P03]
[23] “We do panoramic x-rays but we can also look at the status of the teeth with 12 or 14 single x-rays that are more accurate. X-rays help us see if bones are retracting and there’s risk of perio-dontal disease.” [DentalAssistant_P16]
80 Exploring visual languages
Also, professionals such as fashion designers, goldsmiths and gardeners reported that they take or find photos to use them as inspiration or reference sources for a dress, a piece of je-welry [24] or a garden [25]:
[24] “Typically when clients come to my shop I show them photos from website or I can find other examples online.” [Goldsmith_P32]
[25] “I use photos of plants and reference images of previous work done on retaining walls and other plantings.” [Gardener_P05]
Chemical technologists reported that they simplify a procedure by displaying photos of the machines they must use [26]:
[26] “I write instructions for analyses and I use photographs to show the machines to be used in a specific procedure; in this way, they all understand.” [Chemical Technologist_P49]
In the case of plumbers, photos were used to remember to pay attention to certain things when installing or while building something such as a hidden pipe/tube [27]:
[27] “We take pictures of the bathroom and the furniture. If I have to install a tube that is behind the furniture I need to install it correctly or the furniture won’t open properly.” [Plumber_P54]
Winemakers reported using photos to learn new techniques and to identify the presence of diseases in the vines [28]:
[28] “I use images when I need to check the health of the vine.” [Winmeaker_P39]
The last category, Other, is the least represented in the sample; it includes mentions of other types of representations such as graphs for multimedia technicians, pH scales for winema-kers, chromatographic images for the chemical technologists [29]:
[29] “I use chromatographic images that show the results to achieve with the solution.” [Chemical Technologist_P05]
4.2 What are the types of annotations used across professions?
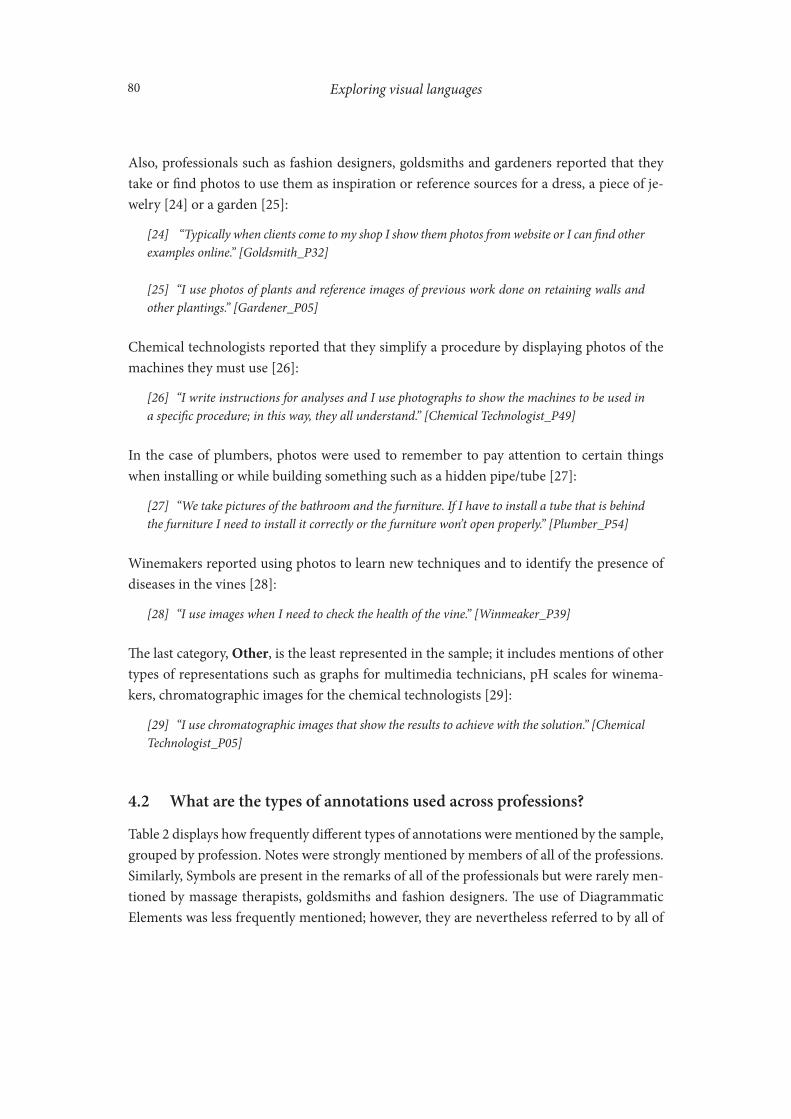
Table 2 displays how frequently different types of annotations were mentioned by the sample, grouped by profession. Notes were strongly mentioned by members of all of the professions. Similarly, Symbols are present in the remarks of all of the professionals but were rarely men-tioned by massage therapists, goldsmiths and fashion designers. The use of Diagrammatic Elements was less frequently mentioned; however, they are nevertheless referred to by all of
81Coppi, Cattaneo, Gurtner
the massage therapists and fashion designers interviewed and by all but one of the woodwor-kers. That revealed an interesting language of profession-specific diagrammatic elements.
Table 2: Frequency of references to different annotations, by profession
More specifically, in terms of Notes, professionals such as polymechanics technicians, plum-bers, woodworkers, multimedia technicians, and fashion designers all produced notes that included information such as general type of processing (e.g. surface roughness) [30], sche-duling of the work, presence of errors, information about the materials and measurements [31]. Gardeners and winemakers created notes with information about the status of their plants and possible diseases [32]:
[30] “We write description of the processing such ‘flat, laminated, 600X400mm and 105mm long with a surface roughness of 12.5’. Also the numbers 1 and 2 next to the measurements indicate edits to the original drawing.” [PolymechanicsTechnician_P46]
[31] “We received sketches from the headquarters with fabric samples. They include all sort of notes and measurements and also a description of the prototype indicating type of stitching, type of button, the length of the fabric used and much other info.” [Fashion Designer_P33]
[32] “We walk in the vineyard, observe and write down that some grapes are almost ready or that some vines are most resistant or mature faster than others. We take notes and then we reproduce that vine.” [Winemaker_P57]
Similarly, goldsmiths indicated the type of material to use, colours of the stone, type of effect such as glazing and rhodiation, measurements of both the client’s body and the materials (e.g. stones) [33]. They also included different type of abbreviations [34]:
[33] “I write down the measurements of the fingers or other measurements of the client’s body, the width needed and the type of processing for the metal.” [Goldsmith_P32]
[34] “For the material I can write AU (aurum) for gold and if the jewel is made of white gold I’ll write WG.” [Goldsmith¬_P30]

82 Exploring visual languages
Dental assistants produced notes that include standardised descriptions [31] of the status of the mouth or the procedure to perform [35]:
[35] “The doctor can write that the cavity is mesio-occlusal with the abbreviation ‘MO’ or ‘DO’ for distal-occlusal. For the dentition numeration we use 1, 2, 3 and 4 for the quadrants so if we remove the 8th tooth from the first quadrant I’ll write ‘1.8 removed’.” [DentalAssistant_P16]
Chemical technologists produced internal warnings and instructions about the functioning of the machines or the procedure itself, but these are generally discouraged [36]:
[36] “We have personal notes in which we write tips like waiting a certain time for a machine to be ready, but this info is not in the procedure. These notes create doubts so they are only in our notebooks.” [Chemical Technologist_P05]
In the case of Diagrammatic Elements, fashion designers used them to signal where to sew parts together [37]. Depending on the design studio, dotted/straight lines might indicate different type of bindellos (tapes) or show where to shrink/tighten, wrinkle, and cut/sew the fabric [38]. Also, gardeners used cross signs to show where already existing elements such as plants or the irrigation system are placed [39]:
[37] “I use a cross and another signal that means I have to sew the pieces together.” [FashionDesi-gner_P08]
[38] “Printed dotted lines indicate where to sew, while straight lines indicate where to cut.” [Fa-shionDesigner_P33]
[39] “I use an cross to indicate where the irrigation system is.” [Gardener_P47]
Massage therapists reported extensive use of diagrammatic elements such as circles, zigzags, hashtags, numbers, dots and plus and minus signs to indicate areas of pain, trigger points and other pain-related symptoms. Sometimes they re-draw a part of the body to make it more similar to that of the patient. Other signs included asterisks for scars and arrows for hyperex-tensions or rotation of the neck or hip [40;41]:
[40] “I use numbers to indicate where the problem is and I use circles to indicate the pain areas. I also use plus and minus signs to indicate the level of pain.” [MassageTherapist_P09]
[41] “I use a cross to indicate crossing knees. I redraw the shape of the spine on the body chart to make it similar to the patient’s actual spine if they have lordosis or it it’s too straight. I also use a hashtag for a scar.” [MassageTherapist_P03]

83Coppi, Cattaneo, Gurtner
Dental assistants seem to be different from all the other professionals, because most of the pa-per dentition charts have been replaced by software with digital dentition charts. This means that they use software to mark (by selecting from a menu) the status of the teeth [42]:
[42] “You can do anything with the programs; add implants, prostheses, retainers or other info, like if we need to change the filling.” [DentalAssistant_P26]
Polymechanics technicians use lines to signal errors in the drawings [43]:
[43] “I can only annotate where there is an error. I have to open the file in the program and change it with a red line, sign it and sent it to the engineer.” [Polymechanics_P18]
The professionals in our sample used various types of Symbols. Woodworkers, for instance, reported using technical symbols such as the radius or diameter, but also other symbols spe-cific to their profession such as the presence of invisible elements (e.g. glass) or others that differentiate between types of woods or types of openings in a window [44]:
[44] “Triangles are conventional signs that indicate the location of the top, bottom, right and left sections of pieces of furniture to assemble. Lines indicate the opening direction of the window.” [Woodworker_P14]
Chemical technologists reported using biohazard and ‘risk and safety’ symbols. Hazard sym-bols were also used by winemakers and dental assistants; the latter also used symbols descri-bing the status of the teeth (e.g. square with dots). Plumbers also used standardised symbols (International Organization for Standardization [ISO], 2016) to indicate the water direction and different mechanical components [45]:
[45] “We use specific signs. A triangle with a circle is a pump, a butterfly-looking sign is a valve and the arrow with a circle is a manometer.” [Plumbers_P37]
Goldsmiths performing gem certification reported using standardised symbols (from Ge-mological Institute of America) to mark issues of the stone. Multimedia technicians pointed out that they use CAD-CAM programs that already contain symbols for all the components of an electrical diagram such as the socket, aerials and use measurement units (e.g. decibel). They use standardised symbols identifying aerials, channels and transformers but also codes like the American Standard Code for Information Interchange (ASCII) the National Tele-vision System Committee (NTSC). Polymechanics technicians use standardised symbols in their technical drawings in conformity of ISO and DEN norms that can be found in “Extrait de normes pour écoles techniques” (Verein Schweizerischer Maschinenindustrieller, 1991). Other symbols are those for surface roughness that indicate the type of processing of the

84 Exploring visual languages
metal. Examples of some of the symbols reported to be used by the participants are shown in Table 3:
Table 3: Examples of the main symbols mentioned by specific professions

85Coppi, Cattaneo, Gurtner
4.3 What are the colours used across professions?
In Table 4, it can be observed that almost all the professions had multiple verbalizations re-garding the use of colours in their representations or their annotations.
Table 4: Frequency of references to different colours, by profession
Nevertheless, the category Colours was not used extensively, and most participants indicated that their drawings or sketches are often in black and white [46;47] even if there are some exceptions. For instance, plumbers colours pipes in red (hot water/high pressure), blue/green (cold water) or brown according to what they contain (e.g. drained water) while drains for the refrigeration system are sometimes marked in purple [48]. Multimedia technicians also have standard colours (International Electrotechnical Commission [IEC], 2017) such as red, yellow, green, brown and black to differentiate cables [49]:
[46] “Sketches are in black and white, but I can use some color for a specific client for the color of the stones.” [Goldsmith_P13]
[47] “Drawings are mostly monochromatic. Colored lines and colored codes can be useful in com-plex drawings.” [ChemicalTechnologist_P01]
[48] “In general, hot water is in red while the return water is in blue. Blue is for high pressure water, green is for cold water and red or pink is for hot water.” [Plumber_P40]
[49] “Cables’ colours can be black, brown and red. In the case of microelectronics, colours are now printed numbers.” [MultimediaTechnician_P44]
Massage therapists reported using colours to indicate problematic areas in body evaluation forms [50] while dental assistants used them to differentiate pathologies, and to flag impor-tant info to communicate, symbols and notes about surgeries [51]:
[50] “I write notes in red to indicate surgeries.” [DentalAssistant_P16]
[51] “I use red and blue to highlight the problem. I can use red for areas of pain, while areas of tension are in blue. Red is also for trigger points.” [MassageTherapist_P09]
86 Exploring visual languages
4.4 Illustrative examples
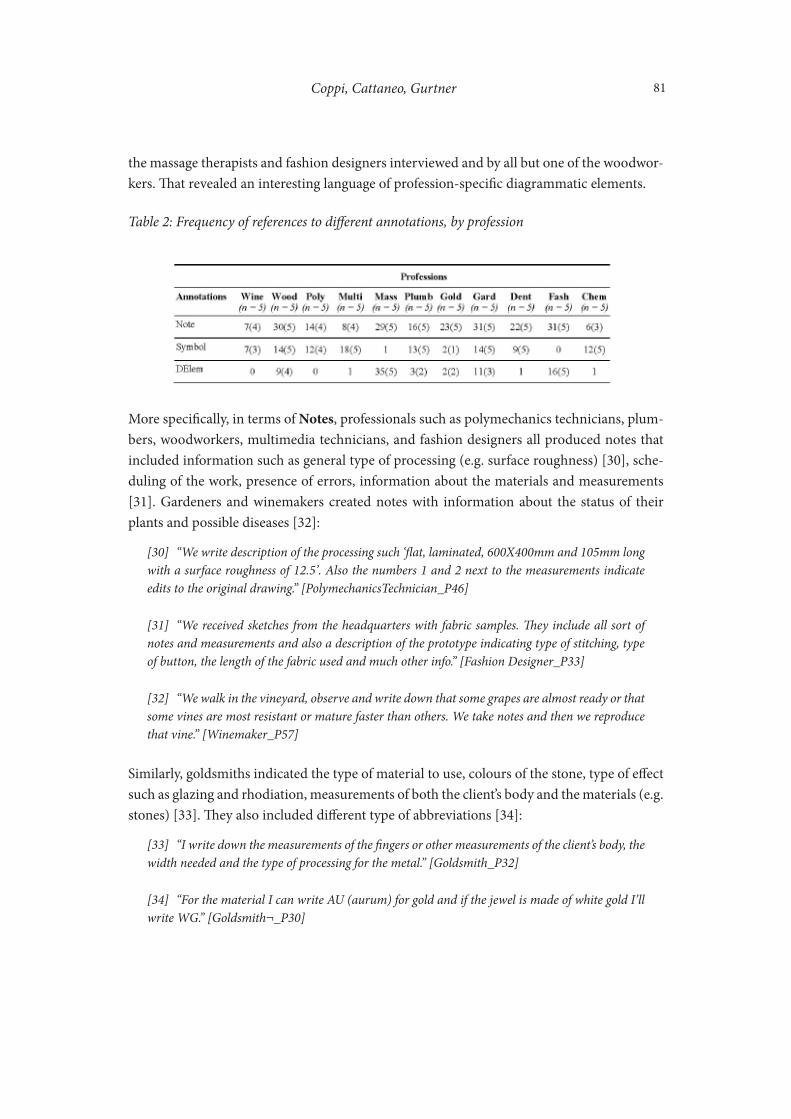
In this section are displayed some of the images collected during the interviews. From these examples it is possible to observe the different layers of observation used in the research and how they are all integrated in the images. For instance, massage therapists mainly use evalu-ation forms on which they put annotations such as notes, arrows and lines and colours like red (Fig. 5).
Fig. 5: Evaluation charts
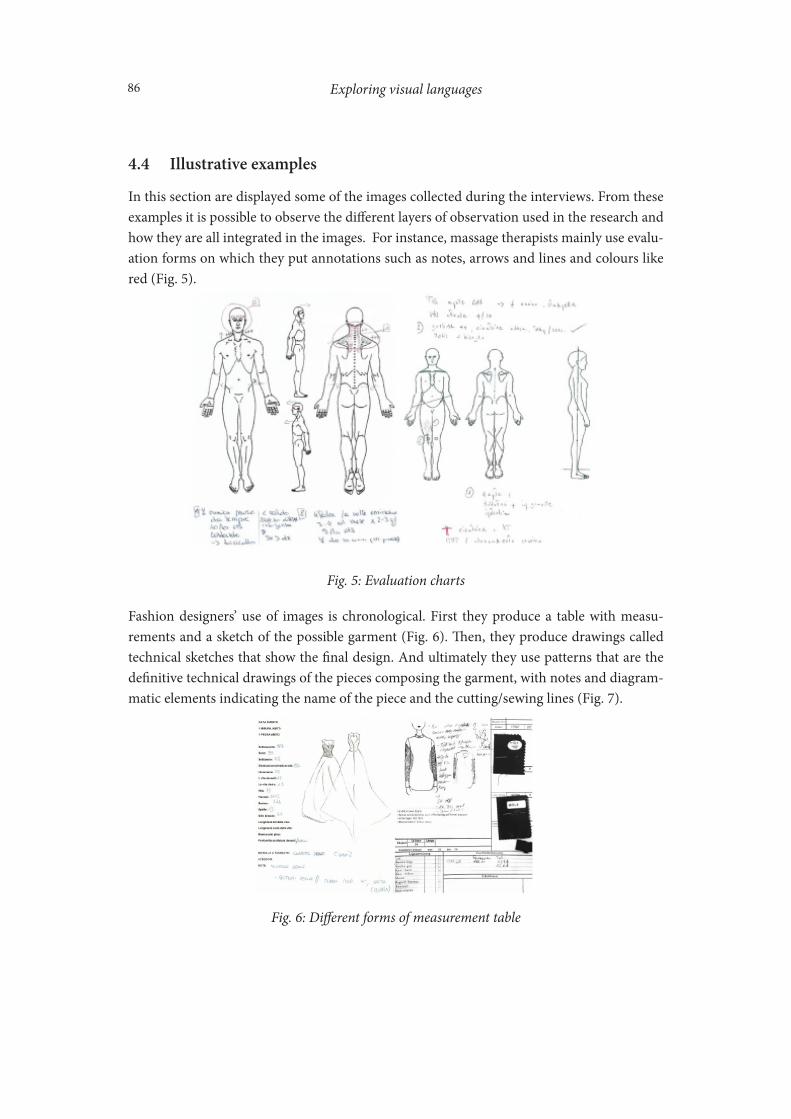
Fashion designers’ use of images is chronological. First they produce a table with measu-rements and a sketch of the possible garment (Fig. 6). Then, they produce drawings called technical sketches that show the final design. And ultimately they use patterns that are the definitive technical drawings of the pieces composing the garment, with notes and diagram-matic elements indicating the name of the piece and the cutting/sewing lines (Fig. 7).
Fig. 6: Different forms of measurement table

87Coppi, Cattaneo, Gurtner
Fig. 7: Technical sketch (left) and Pattern (right)
Goldsmiths use sketches to try out different concepts for the final look of the jewelry; in the case of a complex piece of jewelry they produce sketches with measurements, calculations and symbols (Fig. 8).
Fig. 8: Sketches of a ring and a bracelet
88 Exploring visual languages
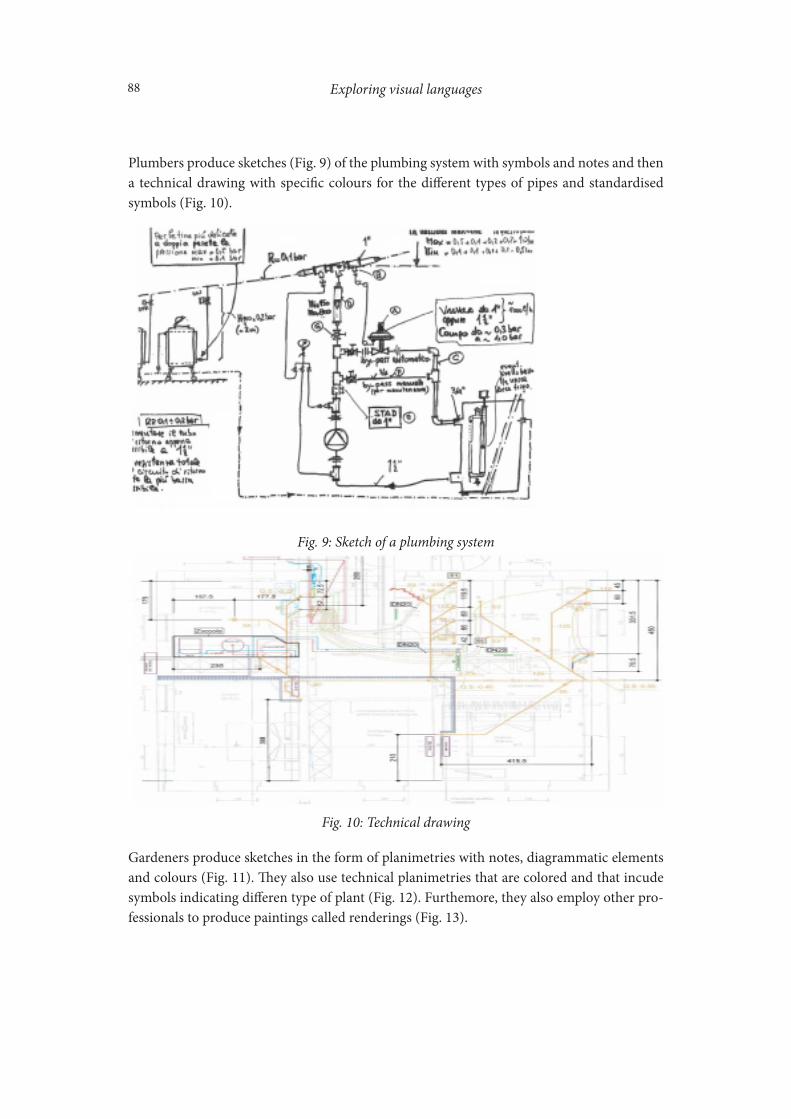
Plumbers produce sketches (Fig. 9) of the plumbing system with symbols and notes and then a technical drawing with specific colours for the different types of pipes and standardised symbols (Fig. 10).
Fig. 9: Sketch of a plumbing system
Fig. 10: Technical drawing
Gardeners produce sketches in the form of planimetries with notes, diagrammatic elements and colours (Fig. 11). They also use technical planimetries that are colored and that incude symbols indicating differen type of plant (Fig. 12). Furthemore, they also employ other pro-fessionals to produce paintings called renderings (Fig. 13).

89Coppi, Cattaneo, Gurtner
Fig. 11: Planimetry sketch
Fig. 12: Planimetry drawing

90 Exploring visual languages
Fig. 13: Rendering
Woodworkers use different types of technical drawings with different perspectives that inclu-de notes, diagrammatic elements and symbols (Fig. 14).
Fig. 14: Technical woodworking drawing
91Coppi, Cattaneo, Gurtner
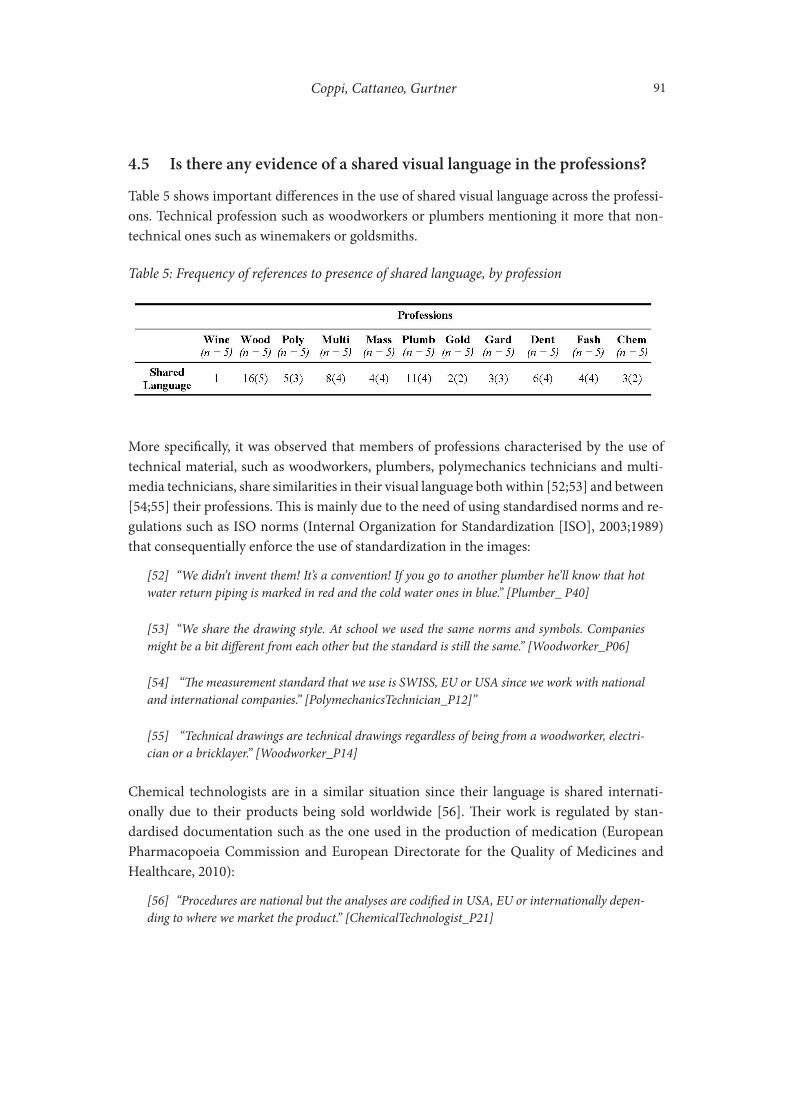
4.5 Is there any evidence of a shared visual language in the professions?
Table 5 shows important differences in the use of shared visual language across the professi-ons. Technical profession such as woodworkers or plumbers mentioning it more that non-technical ones such as winemakers or goldsmiths.
Table 5: Frequency of references to presence of shared language, by profession
More specifically, it was observed that members of professions characterised by the use of technical material, such as woodworkers, plumbers, polymechanics technicians and multi-media technicians, share similarities in their visual language both within [52;53] and between [54;55] their professions. This is mainly due to the need of using standardised norms and re-gulations such as ISO norms (Internal Organization for Standardization [ISO], 2003;1989) that consequentially enforce the use of standardization in the images:
[52] “We didn’t invent them! It’s a convention! If you go to another plumber he’ll know that hot water return piping is marked in red and the cold water ones in blue.” [Plumber_ P40]
[53] “We share the drawing style. At school we used the same norms and symbols. Companies might be a bit different from each other but the standard is still the same.” [Woodworker_P06]
[54] “The measurement standard that we use is SWISS, EU or USA since we work with national and international companies.” [PolymechanicsTechnician_P12]”
[55] “Technical drawings are technical drawings regardless of being from a woodworker, electri-cian or a bricklayer.” [Woodworker_P14]
Chemical technologists are in a similar situation since their language is shared internati-onally due to their products being sold worldwide [56]. Their work is regulated by stan-dardised documentation such as the one used in the production of medication (European Pharmacopoeia Commission and European Directorate for the Quality of Medicines and Healthcare, 2010):
[56] “Procedures are national but the analyses are codified in USA, EU or internationally depen-ding to where we market the product.” [ChemicalTechnologist_P21]

92 Exploring visual languages
Clinical-related professions such as massage therapy and dental assisting both have similar visual languages since they use evaluation forms for the teeth or the body on which they mark health issues, add symbols and write notes about the treatment and status of the patient [57]:
[57] “Evaluation charts are used even by doctors, physiotherapists and massage therapists and osteopaths. If I have to communicate with them I’ll use body charts.” [MassageTherapist_P04]
Another profession with shared language is that of gardeners, since they borrow symbols from landscape architects [58] and, depending on the type of work, share responsibility in the creation of the representation [59]:
[58] “These symbols are official between the architects. They have symbols for everything!” [Gar-dener_P53]
[59] “We do some measurements on the spot and we give them to the architect who will make the technical drawing and the we carry it out in the garden.” [Gardener_P55]
Specifically this result indicates that all of the professions produce notes that are similar in content, which focus mainly on the scope, materials, and schedule of the work. The main types of Diagrammatic Elements used are cross signs, lines and arrows. In terms of Symbols, the ones shared between the professions are technical ones such as radius or diameter, while within the professions other symbols are shared, such as the one for surface roughness used by the polymechanics technicians or the ones indicating different types of wood used by the woodworkers. For the feature of Color, there is shared language between the technical pro-fessions, since they all produce black and white drawings, but also within professions, such as the use of color coding of the electrical cables for the technicians or color differentiation in the hydraulic systems for plumbers.
5 Conclusion and discussionThe aims of this research were to explore the visual language of vocational professions by identifying the types of visual representations and annotations used and also to find evidence of a shared visual language. Unlike previous research that focused mainly on specific types or branches of professions (e.g. Pei et al., 2011), this study deliberately included a large variety of vocational professions. With respect to our first question, it is possible to conclude that the professionals in the sample make use of different types of visualizations in their professions, such as many different types of Drawings (e.g. technical drawings, evaluation forms or sche-matic diagrams), Sketches (e.g. technical sketches or prescriptive sketches), Photos and other forms of visual representation (e.g. chromatographic images). In terms of annotations, the most frequently used type is Notes, which are present across all professions, and have a simi-

93Coppi, Cattaneo, Gurtner
lar purpose and content. Other types are Diagrammatic Elements such as arrows and lines, which are mainly used by fashion designers, dental assistants and massage therapists. There are also Symbols that are used extensively in the form of standardised technical symbols (e.g. radius) and profession-specific symbols (e.g. surface roughness).
In terms of the second question it is possible to conclude that shared language is present both within and between the professions, but the level of sharing might be different from profession to profession or according to a type of specific representation or annotation. For instance, for standardizations reasons, technical and clinical professions possess a specific language that is shared both within and between their communities. A technical drawing of a building can be read by plumbers, multimedia technologists and woodworkers. In other professions, such as fashion design, they have their own specific language that is mostly not shared outside the profession.
The results of this research could be relevant for VET by helping educators to design cour-ses and activities more in line with real working practices. Specifically, the results pointed out the strong presence of visual representations in a variety of different professions, but also indicated that annotations are fundamental, such as in the case of the massage therapists and fashion designers. VET is an essential part of the education system in Switzerland, but there are still some gaps to fill and some progress to be made in order to create cohesive and better integrated experiences for students who move across different learning environments such as schools, companies and branch-courses. For instance, the pedagogical model ‘Erfahrraum’ (Schwendimann, Cattaneo, Dehler, & Zufferey, 2015) can be used for designing activities aimed at the integration of knowledge and professional skills. Examples in this direction are the work of Cattaneo, Motta and Gurtner (2015) with chefs or studies such as the one from Caruso (2017) that identified how fundamental observational skills are for fashion designers and the potential of developing a training program to promote this ability. Along this line, further research will continue to explore representations and annotations in vocational edu-cation, the possibility of developing e-tools to build students’ visual abilities with the help of representations and annotations and, at the same time, the development of an educational scenario to provide better integration between school and workplace.
94 Exploring visual languages
References
Carocci.
Höffler, T., Schmeck, A., & Opfermann, M. (2013). Static and dynamic visual representations: Indi-vidual differences in processing. In G. Schraw, M. T. McCrudden, D. Robinson, G. Schraw, M. T.
Ainsworth, S. (1999). The functions of multiple representations. Computers & Education, 33(2), 131- 152.Ainsworth, S. (2006). DeFT: A conceptual framework for considering learning with multiple represen- tations. Learning and Instruction, 16(3), 183-198.Anderson, J. R. (1978). Arguments concerning representations for mental imagery. Psychological Re- view, 85(4), 249-277.Arcavi, A. (2003). The role of visual representations in the learning of mathematics. Educational stu- dies in mathematics, 52(3), 215-241.Azkue, J. J. (2013). A digital tool for three-dimensional visualization and annotation in anatomy and embryology learning. European Journal of Anatomy, 17(3), 146-154.Calvani, A. (2011). Principi di comunicazione visiva e multimediale. Fare didattica con le immagini:
Caruso, V. (2017). Fashion designers and observation skills: How learning technology supports ap- prentices in decoding non-textual Information. (Ph.D. Cumulative), University of Fribourg, Fri- bourg, Switzerland.Cattaneo, A., Motta, E., & Gurtner, J. L. (2015). Evaluating a Mobile and Online System for Appren- tices' Learning Documentation in Vocational Education: Usability, Effectiveness and Satisfaction. International Journal of Mobile and Blended Learning (IJMBL), 7(3), 40-58.Chang, S.-K. (1986). Introduction: Visual Languages and Iconic Languages. In S.K. Chang, T. Ichika- wa, & P. A. Ligomenides (Eds.), Visual Languages (pp. 1-7). Boston, MA: Springer US.Cherry, C. (1957). On Human Communication: A Review, a Survey, a Criticism. Technology Press of Massachusetts Institute of Technology.
Logic, Methodology, and Philosophy of Science. Stanford University Press.Chomsky, N. (1962). Explanatory models in linguistics. In E. Nagel, P. Suppes, & A. Tarski (Eds.), Vol.
Eckert, C., Blackwell, A., Stacey, M., & Earl, C. (2004). Sketching across design domains. Paper pre- sented at the 3rd International Conference on Visual and Spatial Reasoning in Design, Cambridge. Eckert, C., Blackwell, A., Stacey, M., Earl, C., & Church, L. (2012). Sketching across design domains:
Roles and formalities. Artificial Intelligence for Engineering Design, Analysis and Manufacturing, 26(3), 245-266.
European Pharmacopoeia Commission and European Directorate for the Quality of Medicines and Healthcare. (2010). European pharmacopoeia. Brussels: Council of Europe, 2010.Gibson, J. (1950). The Perception Of The Visual World. Boston: Houghton Mi�in.Gilbert, J. (2010). The role of visual representations in the learning and teaching of science: An intro- duction. Asia-Pacific Forum on Science Learning & Teaching, 11(1), 1-19.Goodwin, C. (2004). Professional vision. American Anthropologist, 96(3), 606-633.Hanks, P. (1979). Collins Dictionary of the English Language: Collins.Hartswood, M., Procter, R., Rouncefield, M., & Slack, R. (2002). Performance management in breast screening: A case study of professional vision. Cognition, Technology & Work, 4(2), 91-100.Heiser, J., & Tversky, B. (2006). Arrows in comprehending and producing mechanical diagrams. Co-
gnitive Science, 30(3), 581-592.
95Coppi, Cattaneo, Gurtner
McCrudden, & D. Robinson (Eds.), Learning through visual displays. (pp. 133-163). Charlotte, NC, US: IAP Information Age Publishing.
Internal Organization for Standardization (1989). General tolerances - Part 1: Tolerances for linear and angular dimensions without individual tolerance indications (Standard No.2768-1).Internal Organization for Standardization. (2003). Technical drawings: General principles of presen- tation (Standard No.128-1).Internal Organization for Standardization. (2016). Dentistry: designation system for teeth and areas of the oral cavity (Standard No. 3950).International Electrotechnical Commission. (2017). Basic and safety principles for man-machine in- terface, marking and identification - Identification of equipment terminals, conductor terminati- ons and conductors (Standard No. 60445).Italian National Standards Institute. (2008). Sanitary tapware - Single taps and combination taps for water supply systems of type 1 and type 2 - General technical specification (UNI EN 806-1).Kim, S., Jung, S. H., & Self, J. (2013). Investigating design representation: implications for an un- derstanding of design practice. Paper presented at the IASDR13 Consilience and Innovation in Design, Tokyo.Landis, R., & Koch, G. (1977). The measurement of observer agreement for categorical data. Biome- trics, 33(1), 159-174.Loewenstein, J. (2014). Take my word for it: How professional vocabularies foster organizing. Journal of Professions and Organization, 1(1), 65-83.Marshall, C. (1998). Toward an ecology of hypertext annotation. Paper presented at the ACM Hyper- text, Pittsburgh.Merriam-Webster, I. (1998). Merriam-Webster's Collegiate Dictionary: Merriam-Webster.Pei, E., Campbell, I., & Evans, M. (2011). A taxonomic classification of visual design representations used by industrial designers and engineering designers. The Design Journal, 14(1), 64-91.Perini, L. (2005). Visual Representations and Confirmation. Philosophy of Science, 72(5), 913-926.Schnotz, W., & Bannert, M. (2003). Construction and interference in learning from multiple represen- tation. Learning & Instruction, 13(2), 141.Schraw, G., McCrudden, M. T., & Robinson, D. (2013). Learning through visual displays. Charlotte, NC, US: IAP Information Age Publishing.Schwendimann, B. A., Cattaneo, A. A. P., Dehler Zufferey, J., Gurtner, J.-L., Bétrancourt, M., & Dillen- bourg, P. (2015). The ‘Erfahrraum’: a pedagogical model for designing educational technologies in dual vocational systems. Journal of Vocational Education & Training, 67(3), 367-396.
presented at the International Conference on Engineering Design, Munich.
Smith, E. R. (1998). Mental representation and memory. In D. T. Gilbert, S. T. Fiske, & G. Lindzey (Eds.), The handbook of social psychology (pp. 391-445). New York, NY, US: McGraw-Hill.Stacey, M., Eckert, C., & McFadzea, J. (1999). Sketch interpretation in design communication. Paper
Stefanut, T., & Gorgan, D. (2008). Graphical annotation based interactive techniques in eTrace eLear- ning environments. Paper presented at the 4th International Scientific Conference eLSE, Bucha- rest.Styhre, A., & Gluch, P. (2009). Visual representations and knowledge-intensive work: The case of ar- chitect work. The journal of information and knowledge management systems, 39(2), 108-124.Verein Schweizerischer Maschinenindustrieller. (1991). Extrait de normes pour écoles techniques (Extract of norms for technical school). Bureau de normes VSM.

96 Exploring visual languages
Vygotsky, L. S., Whorf, B. L., Wittgenstein, L., & Fromm, E. (1990). Language and consciousness. In J.
Biographical notesAlessia Eletta Coppi is PhD student at Swiss Federal Institute for Vocational Education and Training (SFIVET). Her main research interests focus on vocational education and training, new technologies and games, usability and cognitive enhancement.
Alberto Cattaneo is professor at the Swiss Federal Institute for Vocational Education and Training (SFIVET) where he leads the Research Field “Innovation in VET”. His main re-search fields concern the integration of ICT – and especially video-based technology – in vo-cational teaching and learning, reflective learning in VET, instructional design, multimedia learning, teachers’ training.
Jean-Luc Gurtner is Professor of Psychology-Education at the University of Fribourg, Swit-zerland. He co-directs the Leading House "Technologies for VET" of the State Secretariat for Training, Research and Innovation (SERI). His research explores the potential of information and communication technologies for training and learning and also students’ motivation and reflection.
Pickering, M. Skinner, J. Pickering, & M. Skinner (Eds.), From sentience to symbols: Readings on consciousness. (pp. 240-266). Toronto, ON, Canada: University of Toronto Press.
Yates, P., & Humphries, M. (1998). The generation of schematic diagrams from geographic representa- tions of networks. Paper presented at the Spatial Information Research Centre’s 10th Colloquium. Zywica, J., & Gomez, K. (2008). Annotating to Support Learning in the Content Areas: Teaching and
Learning Science. Journal of Adolescent & Adult Literacy, 52(2), 155-164.