Embed Size (px)
Citation preview

Export Potential for Export Agriculture
Crops (EAC); Challenges and the Way
Forward
A.P.P Disna
Director
Department of Export Agriculture

Agriculture Sub Sectors in Sri Lanka
Food Sector PaddyVegetables, OFC and other annual cropsFruits and horticulture crops
Export Crop SectorTea RubberCoconut Other plantation ( sugar cane)Export Agriculture CropsOther perennial Crops (Palmira, Kithul cashew etc.) Floriculture and ornamentals (Fruits/Vegetables)Mixed/ Inter/Homestead Cropping Systems (Includes food/export/tree crops)

Agriculture Contribution to Sri Lankan Economy -2016
Agriculture Contribution to GDP (Gross Domestic Production by Industrial Origin at constant (2010) prices – as a % to GDP)
2015 – 4.8%
2016 – 7.1%
Contribution to employment Employed Persons (‘000) – 7,948
Agriculture – 27.1%
Industry – 26.4%
Services – 46.5%

Export Earnings from Different Agro-Food SectorsValue (US$ mn.)
Share ( % total Export Earnings)
Tea 1289.00 12.30Rubber 32.70 0.3Coconut products 366.00 3.5Spices 317.10 3.1Vegetables 26.50 0.3Unmanufactured Tobacco 31.21 0.3Minor Agriculture Products 114.10 1.1
Sea Food 169.1 1.6
Total Ag. Export Earnings 2386.1 22.6
Total Export Earnings (Agriculture + Industry +Services)
10309.7

Export Agriculture CropsSpices – Cinnamon, Pepper, Clove, Nutmeg, CardamomBeverages – Coffee, Cocoa, Vanilla Stimulants – Betel, Areca nutEssential Oil bearing Crops – Citronella, Lemon Grass
Cultivated as mono crops, inter crops or as mixed crops and each of above crop cultivations have unique features of their own
Contribution of EAC to Sri Lankan Economy – 2016 To GDP – 0.4-0.5% To Total Export Earnings of Sri Lanka- 3.4% To Total Agriculture Export Earnings of Sri Lanka – 15% EAC Export Volume (mt.) – 44,684 EAC Export Earnings (Rs.mn.) – 51,731Estimated Land Extent (ha.)– 110,000Estimated Production (Mt.)– 145,000 Estimated no. of Stakeholders - 600,000

World /Sri Lanka Trade Situation of EAC - 2016Crop World Sri Lanka
Export Volume Mt.)
Export Earnings (US $ mn.)
Export Volume (Mt.)
Export Earnings (US $mn.)
Pepper 373,665 2,887 7895.54 73Cinnamon (+cassia)
154,044 484 14,699.09 159
Cloves 59,496 397 1378.9 14Cardamom 55,409 389 779.39 6Nutmeg 24,818 173 1509.19 14Coffee (all) 8.710mn 30,790 13.70Cocoa (beans) 3.8mn 10,192 1345.5 (all) 5Vanilla 5621 763 2.06

0.00
5000.00
10000.00
15000.00
20000.00
25000.00
2000 2001 2002 2003 2004 2005 2006 2007 2008 2009 2010 2011 2012 2013 2014 2015 2016 2017July
MT/
Rs (M
n)
Exports of Cinnamon 2000-2017 up to July Export volume (MT)
Export Value Rs(Mn)

0.00
5000.00
10000.00
15000.00
20000.00
25000.00
2000 2001 2002 2003 2004 2005 2006 2007 2008 2009 2010 2011 2012 2013 2014 2015 2016 2017July
MT/
Rs (M
n)Exports of Pepper 2000-2017 up to July
Export volume (MT)
Export Value Rs(Mn)

0.00
1000.00
2000.00
3000.00
4000.00
5000.00
6000.00
7000.00
8000.00
2000 2001 2002 2003 2004 2005 2006 2007 2008 2009 2010 2011 2012 2013 2014 2015 2016 2017July
MT/
Rs (M
n)Exports of Clove 2000-2017 up to July
Export volume (MT)
Export Value Rs(Mn)

0.00
100.00
200.00
300.00
400.00
500.00
600.00
700.00
800.00
900.00
2000 2001 2002 2003 2004 2005 2006 2007 2008 2009 2010 2011 2012 2013 2014 2015 2016 2017July
MT/
Rs (M
n)
Exports of Cardamom 2000-2017 up to July
Export volume (MT)

0.00
500.00
1000.00
1500.00
2000.00
2500.00
2000 2001 2002 2003 2004 2005 2006 2007 2008 2009 2010 2011 2012 2013 2014 2015 2016 2017July
MT/
Rs (M
n)
Exports of Nutmeg 2000-2017 up to July
Export volume (MT)
Export Value Rs(Mn)

0.00
1000.00
2000.00
3000.00
4000.00
5000.00
6000.00
2000 2001 2002 2003 2004 2005 2006 2007 2008 2009 2010 2011 2012 2013 2014 2015 2016 2017July
MT/
Rs (M
n)Exports of Cocoa 2000-2017 up to July
Export volume (MT)
Export Value Rs(Mn)

-
20.00
40.00
60.00
80.00
100.00
120.00
140.00
160.00
180.00
2000 2001 2002 2003 2004 2005 2006 2007 2008 2009 2010 2011 2012 2013 2014 2015 2016 2017July
MT/
Rs (M
n)Exports of Citronella Oil 2000-2017 up to July
Export volume (MT)
Export Value Rs(Mn)

0.00
1000.00
2000.00
3000.00
4000.00
5000.00
6000.00
2000 2001 2002 2003 2004 2005 2006 2007 2008 2009 2010 2011 2012 2013 2014 2015 2016 2017July
MT/
Rs (M
n)Exports of Betel 2009-2017 up to July
Export volume(MT)Export ValueRs(Mn)

0.00
200.00
400.00
600.00
800.00
1000.00
1200.00
1400.00
1600.00
1800.00
2000.00
Rs./
Kg.
Year
Prices of Cinnamon Quills 2000-2017 up to August
Farm Gate Price

0.00
200.00
400.00
600.00
800.00
1000.00
1200.00
1400.00
1600.00
1800.00
Rs./
Kg.
Year
Prices of Pepper 2000-2017 up to August
Farm Gate Price
International Price

0.00
200.00
400.00
600.00
800.00
1000.00
1200.00
1400.00
1600.00
1800.00
2000.00Rs
./Kg
.
Year
Prices of Clove 2000-2017 up to August
Farm Gate Price
International Price

0.00
500.00
1000.00
1500.00
2000.00
2500.00
3000.00
3500.00
Rs./
Kg.
Year
Prices of Cardamom 2000-2017 up to August
Farm Gate Price
International Price

0.00
500.00
1000.00
1500.00
2000.00
2500.00
3000.00
3500.00
Rs./
Kg.
Year
Prices of Nutmeg 2000-2017 up to August
Farm Gate Price

-
2,000.00
4,000.00
6,000.00
8,000.00
10,000.00
12,000.00
Rs./
Kg.
Year
Prices of Citronella Oil 2000-2017 up to August
Farm Gate Price
International Price

SL Spice Exports to SAARC Region (Mt.)
Item India Pakistan
Bangladesh
Maldives
Nepal Total
2016 Pepper 4801 39 41 32 7895
Clove 493 7 20 9 1378
Nutmeg 154 196 89 0.18 1509
Cinnamon 493 184 0.73 14692
Cardamom 663 - 0,79 779
2015 Pepper 9068 1556 56 11.04 26.5 16667
Clove 1869 174 50 7 4782
Nutmeg 192 267 127 0.12 1575
Cinnamon 444 266 0.65 13548
Cardamom 100 0.68 119

SL Spice Exports to Non- SAARC Region (Mt.)
Country Pepper Clove Nutmeg Cinnamon
Cardamom
2015 USA 367.00 167 34.00 2170
France 17.00 3.94 2.35 40.55 0.66
Germany 643.17 105.72 128.10 221.54 1.25
Mexico 266.00 5946
UAE 46.39 0.10 209.28 58.74 10.11
Egypt 41.00 25.15 37.17
Japan 18.49 11.96 14.77 33.57 0.18
Australia and NZ
15.43 25.56 3.22 125.52 0.46
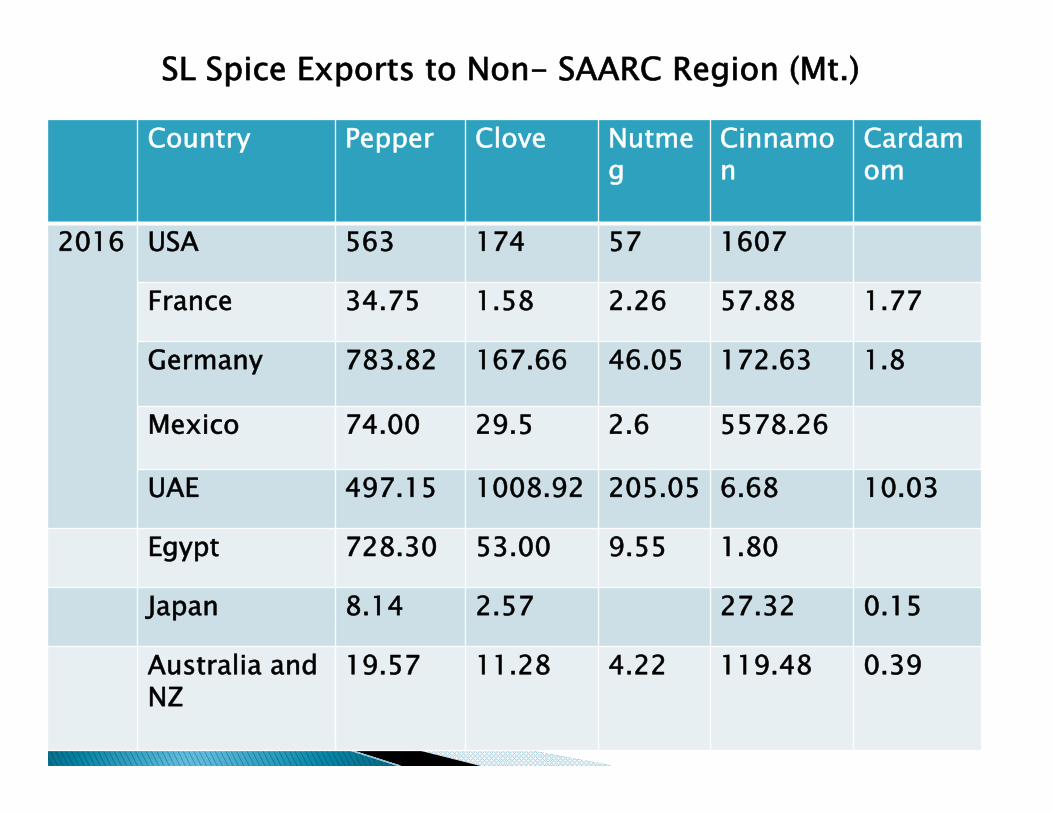
SL Spice Exports to Non- SAARC Region (Mt.)
Country Pepper Clove Nutmeg
Cinnamon
Cardamom
2016 USA 563 174 57 1607
France 34.75 1.58 2.26 57.88 1.77
Germany 783.82 167.66 46.05 172.63 1.8
Mexico 74.00 29.5 2.6 5578.26
UAE 497.15 1008.92 205.05 6.68 10.03
Egypt 728.30 53.00 9.55 1.80
Japan 8.14 2.57 27.32 0.15
Australia and NZ
19.57 11.28 4.22 119.48 0.39

Current Value Addition Status of EAC – 2016
Commodity VA form Export (mt.) Export Earnings(Rs.mn.)
Cinnamon Crushed 11.43 20.16
Ground 245.05 283.5
Cut qills/Retail packs below 01kg
1959.82 3424.74
Pepper Crushed 1278.68 328.44
Ground 142.81 288.87
Other 1446.25 2054.49
Clove Crushed or ground 56.76 92.01
Nutmeg Crushed or Other 192.00 198.99
Mace Crushed or ground 5.04 17.27
Cardamom Crushed or ground 12.02 13.18

Current Value Addition Status of EAC (Essential Oils)– 2013
Commodity VA form Export (mt.) Export Earnings(Rs.mn.)
Cinnamon Cinnamon Leaf Oil 226.36 905.9
Cinnamon Bark Oil 27.31 890.13Pepper Pepper oil 42.73 429.55Oleoresin 559.59 3257.22
Nutmeg Oil 122.35 595.37Cardamom oil 0.69 25.95Mace Oil 0.13 0.92Clove Oil 6.2 52.7Ginger Oil 2.82 44.83Vanilla Oil 0.03 0.07Citronella Oil 8.26 114.28
Lemon Grass Oil 0.30 1.1

Trade Agreements and their Relevance for EAC Sector
Free Trade Agreement with India
100% duty free for spice imports (2500mt. Cap for mature pepper) and arecanut from Sri Lanka with Country of Origin Sri Lanka or with 35% value addition for imported products
Free Trade Agreement with Pakistan
100% duty free imports for Cinnamon, Clove, Nutmeg and MaceConcessionary rate for Betel (changed)
SAPTA - 8% duty rate for spice imports to India
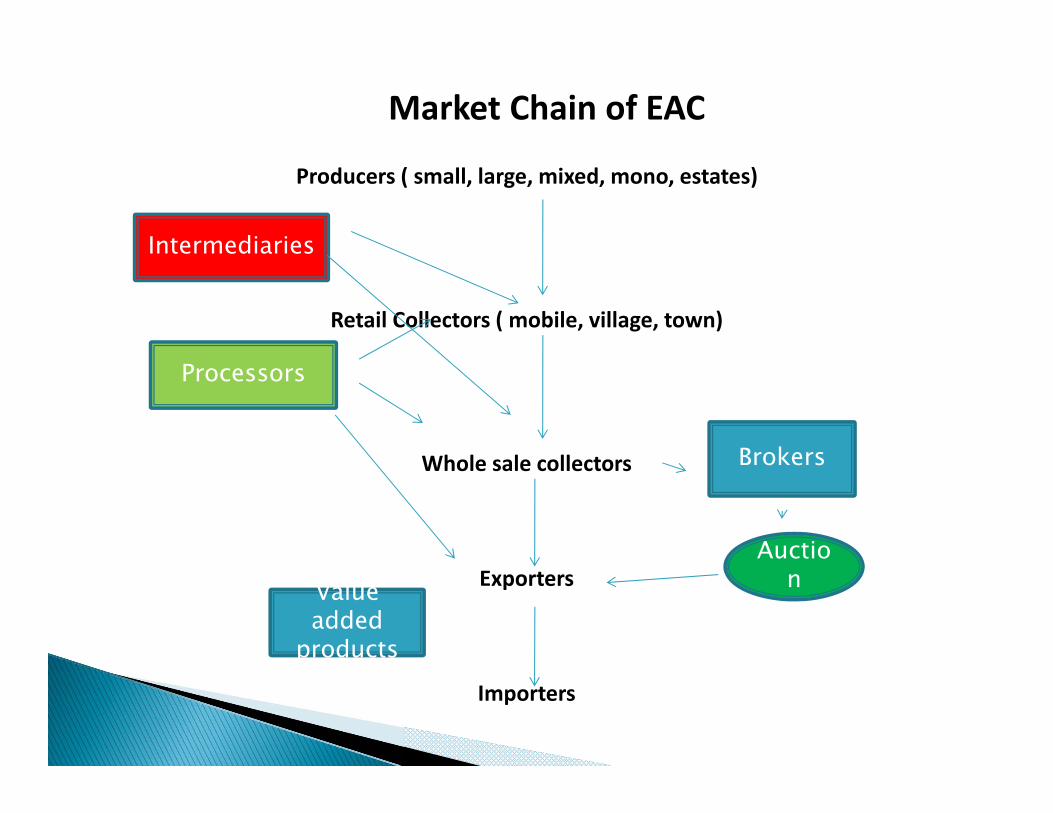
Value added
products
Producers ( small, large, mixed, mono, estates)
Retail Collectors ( mobile, village, town)
Whole sale collectors
Exporters
Importers
Intermediaries
Processors
Brokers
Auction
Market Chain of EAC

Strengths in the Sri Lankan EAC Sector•Reputation in intrinsic Quality•Can cultivate variety of spices
Weaknesses•Extrinsic Quality Problems in Exports•High COP•Small Scale unorganized Farmers Base
Opportunities•World Trade for Spices is growing at 5%, Asian Market is growing at 5%•World Trend for spicy foods •Increased market for essential oils, oleoresins•World trend for flavor enhancers, and fragrances•Increased concern over medicinal properties of Spices, food supplements•Spa and health care products
Threats•Emerging Producers (eg. Myanmar, Low cost/high volume, Vietnam/high productivity)•Dumping cheap low quality imports (reduce local price, destroy reputation)•Increasing SPS measures and quality, traceability, certification needs in high premium markets
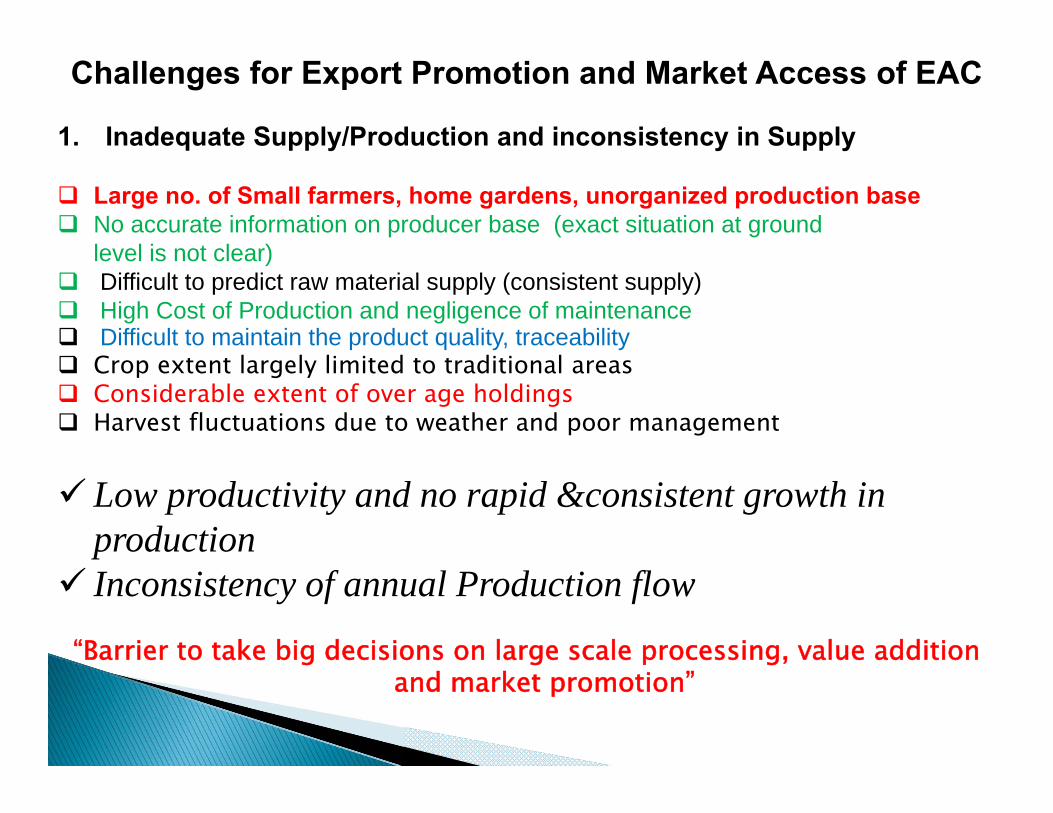
Challenges for Export Promotion and Market Access of EAC
1. Inadequate Supply/Production and inconsistency in Supply
Large no. of Small farmers, home gardens, unorganized production base No accurate information on producer base (exact situation at ground
level is not clear) Difficult to predict raw material supply (consistent supply) High Cost of Production and negligence of maintenance Difficult to maintain the product quality, traceability Crop extent largely limited to traditional areas Considerable extent of over age holdings Harvest fluctuations due to weather and poor management
Low productivity and no rapid &consistent growth in production
Inconsistency of annual Production flow
“Barrier to take big decisions on large scale processing, value addition and market promotion”

Current Development Programs of the Government Assistance for new cultivations of EAC
Promote EAC based Home gardens
productivity improvement of EAC cultivations
Estate Development programs with EAC
Promote inter cropping of EAC under coconut
Awareness, training programs
Farmer registration
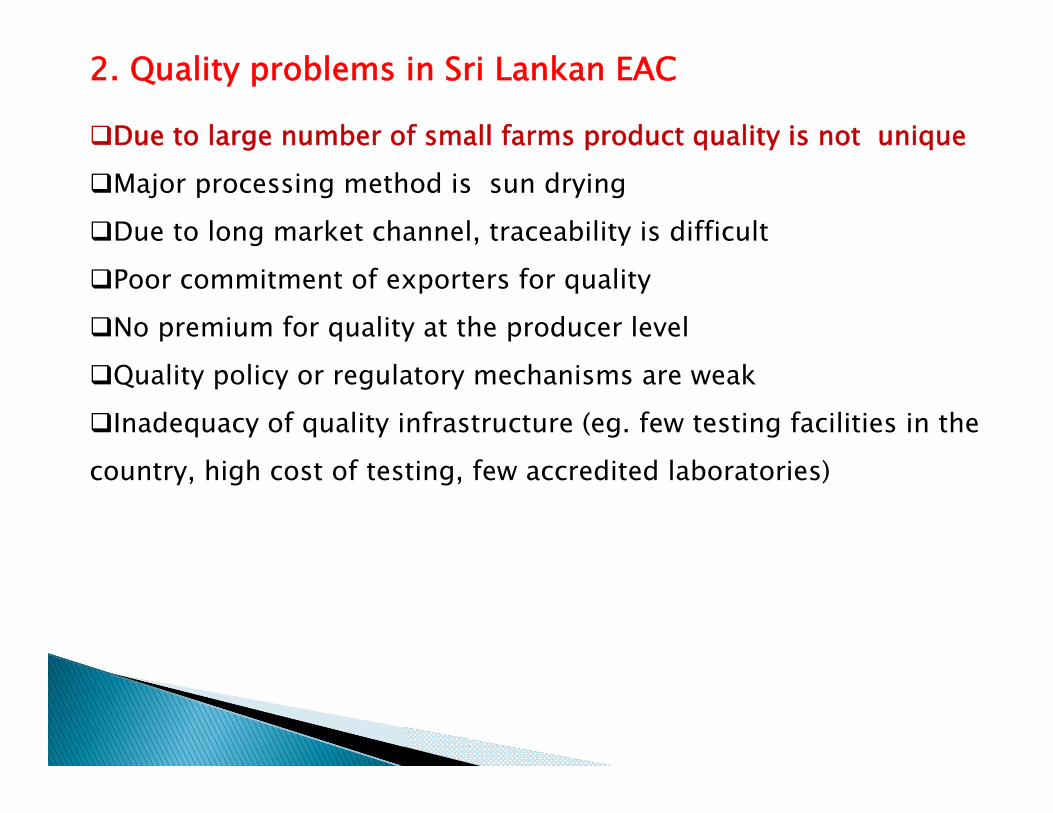
2. Quality problems in Sri Lankan EAC
Due to large number of small farms product quality is not unique
Major processing method is sun drying
Due to long market channel, traceability is difficult
Poor commitment of exporters for quality
No premium for quality at the producer level
Quality policy or regulatory mechanisms are weak
Inadequacy of quality infrastructure (eg. few testing facilities in the
country, high cost of testing, few accredited laboratories)

Current Development Programs Provide training, awareness
Provide machineries, equipments
Financial grants, loans
Technical expertise
Proposed actionsNational Export Strategy Propose a quality policy
Investment for GMP, other certification programs, machineries
NES proposes quality infrastructure facilities to be upgradedLow cost testing facilities available throughout the country
03. Primitive nature of market channel of EAC Many collectors, traders compete at ground level
Act individually, independently and with personal relations
Established family businesses
Not subjected to any regulation, registration (other than business
registration)
Not transparent
Aggregate purchases at each point and transfer bulk from hand to hand
Forward and backward linkages are informal, business oriented and not
seems to consider industry interests
Very poor concern over quality, grades
Inconsistency and uncertainty of quantity and quality of supply
Barrier for quality promotion, large scale investment on processing,value addition, Difficult for new exporters to establish in
the trade, reduce competitiveness of Sri Lankan EAC

Current Development Programs Establish Farmer-exporter connections
Awareness of market channel segments
World bank/EU projects to strengthen value chain by
providing support and awareness, capacity building
Needed actions Gradual change of the system with minimum effect,
Competitive alternatives ( Factory, collecting centre ???)
Strengthen central processing with defined market
Regulatory Framework

04. Low market share to high profit zonesCurrently more than 70% of EAC exports are reaching developing countries with relatively low profits
Why ????
Low quality of produce No market mechanism to “ pay for quality” Lack of traceability Largely for raw material for other countries Low Value addition
Current activities Provide technologies, machineriesProcessing facilitiesraining and awarenessQuality testing Programs
Needed actions Regulations for quality, product certification facilitiesestablish a norm for paying premium for qualityPromote Sri Lankan brands & other market promotionMarket links, Expand exporter base

5. Inadequate market promotion in overseas Low investment and less efforts from both from public and private
sector Low effort to promote intrinsic values for SL spices and no return for such values poor knowledge on niche markets For cinnamon, current demand and high price over cassia is for inherited values but it reduced competitiveness
Needed actions Identify effective methodologies (where, what, how)
Branding locally and internationally Market research or research reports research to establish intrinsic/medicinal values Cinnamon promote intrinsic value in high end markets-

06. Inadequate Value addition in EAC sector
Low tech products in small quantities
(crushed, ground, packed, tinned etc.)
Largely done by exporters themselves
Only a few large factories export high-tech products
Many invented products from DEA and ITI but only a few small VA
producers, mainly cater to local market
Inadequate knowledge on VA market potentials/prices
Inadequate information base on VA producers in the country
Low R & D on value addition, product developemt
DEA activities Provide research inputs, training, awarenessMachineries (for grinding, peeling. Drying) Provide information
Other Institutions supports ay the Limited scale
Needed actions
Establish Information base on current VA industries and take
measures to upgrade effective industries
Identify new investors for large scale/high tech investment
and support them
Changing policies if required, under well regulated
environment
( ex. Re-export policy, Policy of having one factory per district )
FDI for value addition
Investment for R & D for technology gaps
Commercialize innovations
Arrangements for raw material supply flows to VA factories

7. Inadequate Market Intelligence Poor Market intelligence for –
new market links/niche markets/Prices
Technology, packaging, mechanization,
VA products. Potential markets
SPS /quality/food safety/testing requirements
Local Testing facilities
Export procedures/logistics
Raw material supplies
NES plans to establish “ One Stop Shop” for market information and to
expand other facilities for market intelligence (eg. through EDB/Web
Potels)
•Need Market Research Program or invest on market research reports
(public investment program)

08. Inadequate Public Private Partnerships
In many cases we take decisions independently ( have to recognize and respect each other, share common interests, avoid duplications) Have a common goal- ex. Indian spice sector.
Export Agriculture
Crops Sector
Ministry/ies DEA
EDB
SAPPTASpice Counc
il
DOC
Customs
BOI
SLSI/ITI
Private laboratori
es
Producers, collectors, traders,
VA producers
Chambers

09. Other issues
FTAs …………???Debatable on current benefits of current FTA
More FTA are planned with China and Singapore
There should be
export ethics/disciplines to be established
To reap benefits of FTA
Thank You

Challenges