Embed Size (px)
Citation preview
1
Export Statistics Scotland
2014 Release Date: 27 January 2016
Key findings
The total nominal value of Scotland’s International Exports (excluding Oil and Gas) decreased in the last year, falling by £920 million (3.2%) from £28.4 billion in 2013 to £27.5 billion in 2014. Between 2010 and 2014 international exports increased by £4.0 billion (17.3%), increasing from £23.4 billion in 2010 to £27.5 billion in 2014. In the latest year exports have continued to increase in businesses classed in the service sector (up 0.6%) and the ‘other’1 sector (up 16.2%). Manufacturing business exports, which account for more than half of all exports, declined in the last year by 8.7%. In 2014, the largest exporting industry is manufacture of food products and beverages (£4.8 billion, 17.3% of all exports)2. The second largest industry is Legal, accounting, management, architecture, engineering, technical testing and analysis activities (£2.3 billion, 8.5% of all exports), followed by the manufacture of refined petroleum and chemical products (£2.1 billion, 7.8% of all exports), Mining and Quarrying (£1.9 billion, 6.9% of all exports) and Wholesale and retail trade (£1.8 billion, 6.5% of all exports).
Together the top 5 industry sectors account for around 47 per cent of total international exports from Scotland. In 2014 (42%) of international exports were destined for countries within the European Union (estimated at £11.6 billion). Within the EU, the Netherlands was the largest market, followed next by France and then Germany.
1 Agriculture, Forestry and Fishing, Mining and Quarrying, Utilities and Construction.
2 It should be noted some other food and drink commodities are also included in wholesale and
fisheries Industrial Sectors.
2
The USA is Scotland’s top international export destination country (as in the last 13 years) with an estimated £4.0 billion exports in 2014, an increase of £54 million (1%) since 2013. Netherlands is Scotland’s second top export destination country with an estimated £1.9 billion exports in 2014, a decrease of £526 million (22%). France is Scotland’s third top export destination country with an estimated £1.9 billion exports in 2014, a decrease of £162 million (8%). The Netherlands and Belgium are consistently reported in Scotland’s top trading partners, however as these countries contain key ports many of these goods are for onward supply to other countries. Exports to Europe and key European port countries in the last year are affected by the fall in exports from the refined petroleum sector.
The top five international export markets (USA, Netherlands, France, Germany, and Norway) accounted for £10.8 billion of international exports (39 per cent of all international exports) from Scotland. Exports to the rest of UK (from Scotland) in 2014 (excluding oil and gas) are provisionally estimated at £48.5 billion, an increase of £1.5 billion (3.2%) over the year. Service sector exports are of greater importance to the rest of UK than internationally. £27.0 billion (56%) of rest of UK exports are attributable to service sector companies compared with 38% (£10.5 billion) of international exports. Total international and rest of UK exports in 2014 (excluding oil and gas) are provisionally estimated at £76.0 billion an increase of £570 million (0.8%) from £75.4 billion in 2013. Rest of UK exports account for 64% of all exports from Scotland (international and rUK combined). About this publication This bulletin presents estimates of the nominal value of international and rest of UK exports for all sectors of the Scottish economy from 2002 to 2014. This publication was formerly named the Global Connections Survey. The new name reflects the range of official information incorporated to produce these export estimates. This is the thirteenth year of publication. Figures are presented in nominal terms throughout the main publication and so are not adjusted for inflation. A time series of total exports adjusted for inflation is included for the first time as an experimental statistical series in Annex A. The estimates in this publication are based on the completed survey returns from 1,664 businesses in Scotland to the 2014 Global Connections Survey. Further estimates for businesses based in Scotland for export value and turnover are sourced from UK wide official sources and administrative sources. Information from 2002 is provided in the accompanying excel tables. The industry definitions relates to the Standard Industrial Classification of the reporting company.
3
Contents
Export Statistics Scotland ...................................................................................... 1
1. International Exports ....................................................................................... 4
2. Scotland’s International Export Destinations ............................................. 11
3. Exports to the rest of the UK ........................................................................ 15
4. Total Exports from Scotland: Rest of UK and International exports ....... 18
5. Exports by Size of Company ........................................................................ 19
6. Comparability of Scottish International Exports Sources ......................... 22
7. Comments ...................................................................................................... 27
8. Background notes ......................................................................................... 28
Annex A: Volume Index of Export Statistics (Experimental Statistics) ........... 38

4
1. International Exports
Overview of International Exports
The nominal value of international exports decreased in each year between 2002 and 2005, falling by £1.9 billion (9.2%) from £20.2 billion to £18.3 billion in 2005. From 2005 to 2013 the nominal value of international exports increased in each year. It is estimated that the nominal value of international exports has decreased in the last year, falling by £920 million (3.2%) from £28.4 billion in 2013 to £27.5 billion in 2014. In the latest year exports have continued to increase in businesses classed in the service sector and the ‘other’ sector. However, manufacturing businesses, which account for more than half of all international exports, declined in the last year by 8.7%. The total value of Scotland’s international exports increased by £4.0 billion (17.3%) between 2010 and 2014 increasing from £23.4 billion in 2010 to £27.5 billion in 2014. Chart 1: Total International exports 2002-2014
Exports (£ billion)
Source: Export Statistics Scotland 2014 Note: Other International Exports includes: SIC 2007 1-3 Agriculture, forestry and fishing, 5-9 Mining and Quarrying, 35-39 Utilities, 41-43 Construction
20.219.2
18.818.3
19.220.3
22.2 22.3
23.4
26.5 26.9
28.427.5
14.6
13.5
12.411.6 11.7
12.313.2
12.613.2
14.9 15.015.6
14.3
4.8 4.95.5 5.6
6.5 6.87.8 8.2 8.2
9.2 9.610.5 10.5
0.8 0.9 0.9 1.0 1.0 1.2 1.2 1.52.0 2.4 2.3 2.3 2.7
0
5
10
15
20
25
30
2002 2003 2004 2005 2006 2007 2008 2009 2010 2011 2012 2013 2014
Year
Total International Exports
Manufacturing International Exports
Services International Exports
Other International Exports

5
International Exports by Industry
In 2014, the largest exporting industry was manufacture of food and beverages (£4.8 billion, 17.3% of all exports). Exports for SIC 2007 Distilling Rectifying and blending of spirits account for £3.95 billion (83% of all manufacture of food and beverage exports in 2014). The second largest industry is Legal, accounting, management, engineering, architecture, technical testing and analysis activities (£2.3 billion, 8.5% of all exports), followed by the manufacture of refined petroleum and chemical products (£2.1 billion, 7.8% of all exports), Mining and Quarrying (£1.9 billion, 6.9% of all exports) and Wholesale and retail trade (£1.8 billion, 6.5% of all exports). The top 5 industry sectors account for around half (47%) of all international exports.
Chart 2: Scotland’s top 5 International Exporting Industries Exports (£ billion)
Source: Export Statistics Scotland 2014 Note: Professional Services – Legal, accounting, management, architecture, engineering, technical testing and analysis activities, Other International Exports includes: SIC 2007 1-3 Agriculture, forestry and fishing, 5-9 Mining and Quarrying, 35-39 Utilities, 41-43 Construction
Key:
Manufacturing Services Other
1.8
1.9
2.1
2.3
4.8
0.0 1.0 2.0 3.0 4.0 5.0
Wholesale
Mining
Petroleum & Chemicals
Professional Services
Food & drink

6
International Exports for Manufacturing and Service Industries
Overall in 2014 manufacturing industry companies account for 51.9% of all international exports. Exports from the service sector have had increasing importance in recent years, accounting for 38% of all exports in 2014 compared with 24% in 2002. In the last year exports from the manufacturing sector industries decreased by £1.4 billion (8.7%) to an estimated £14.3 billion. For services sector businesses exports increased by £60 million (0.6%) to £10.5 billion. Within the manufacturing sector, exports of manufactured food and drink are estimated to have decreased by £250 million (5%) from £5.0 billion in 2013 to £4.8 billion in 2014. Exports from the whisky industry alone are estimated at £4.0 billion, having decreased by £310 million (7%) over the year. The manufacture of refined petroleum and chemical products sector is estimated at £2.1 billion having decreased by £730 million (25%) since 2013. This decrease in nominal value of exports in this sector in part reflects a decrease in relevant commodity price. The largest annual increase in the nominal value of exports in the manufacturing sector was in Machinery and equipment which increased £435 million (33%) from £1.3 billion in 2013 to £1.7 billion in 2014.

7
Chart 3: International Exports (£ billion) by Industry
Key:
Manufacturing Services Other
Source: Export Statistics Scotland 2014 Note: Professional Services – Legal, accounting, management, architecture, engineering, technical testing and analysis activities, Other International Exports includes: SIC 2007 1-3 Agriculture, forestry and fishing, 5-9 Mining and Quarrying, 35-39 Utilities, 41-43 Construction
Within the service sector, legal, accounting, management, architecture, engineering, technical testing and analysis activities is worth £2.3 billion and is the largest international exporting service. This is followed by wholesale and retail trade; repair of motor vehicles and motorcycles (estimated at £1.8 billion) and Administrative and support service activities (£1.3 billion). The largest annual increase in the nominal value of exports from the services sector was in Accommodation and food service activities which increased £115 million (40%) from £290 million in 2013 to £405 million in 2014.
Food & drink4.8
Petroleum & Chemicals
2.1
Machinery1.7
Computer1.1
Trans equip1.1
Other Manufacturing
3.4
Professional Services2.3
Wholesale1.8
Business1.3
Finance1.2
Trans & storage0.9
Other service3.0
Mining1.9
Other0.8

8
Trends in International Exports by Industry: Nominal Value of exports and % of all exports
Manufacture of food and beverages Chart 4 Manufacture of food and beverages
This sector has been the top exporting industrial sector in Scotland since 2005, accounting for 17.3% of international exports in 2014. The nominal value of international exports increased from 2004 to 2013 but decreased by £250 million (5%) in the last year. In 2014 exports from Distilling, rectifying and blending of spirits account for 83% of manufacture of food and drink exports. Between 2002 and 2006 the pace of growth was slower than between 2007 and 2011.
Professional Services - Legal, accounting, management, architecture, engineering, technical testing analysis
Chart 5 Professional Services
The second largest exporting sector in Scotland and the largest business group in the services sector is Professional Services. This sector accounts for 8.5% of all exports. The nominal value of exports from this sector decreased between 2002 and 2004, and then increased in each year until 2013. However, exports have declined in the last year between 2013 and 2014.
0
1
2
3
4
5
6
2002 2003 2004 2005 2006 2007 2008 2009 2010 2011 2012 2013 2014
Expo
rts
(£ b
illio
ns)
0
1
2
3
4
5
6
2002 2003 2004 2005 2006 2007 2008 2009 2010 2011 2012 2013 2014
Expo
rts
(£ b
illio
ns)

9
Computer, Electronic and Optical products Chart 6 Computer, Electronic and Optical products
Since 2002 the largest absolute change within a particular industry sector has been in Computer, electronic and optical products. In 2002 exports in this sector were estimated at £5.6 billion when this sector accounted for 28% of all exports. In 2014 exports from this sector totaled £1.1 billion (4% of all Scotland international exports).
0
1
2
3
4
5
6
2002 2003 2004 2005 2006 2007 2008 2009 2010 2011 2012 2013 2014
Exp
ort
s (£
bill
ion
s)

10
Table 1: Total International Exports by industry (£ million) 2011-2014
Notes: 1. Wholesale figures include the wholesale of agricultural products, fish and crustaceans molluscs 2. ‘Other services; included the following activities: health and other community activities, social and personal service activities 3. Industry grouping are based on the Industrial Classification of the reporting company 4. All % change calculations are based on unrounded data
£ million
SIC 2007
Division
2011 2012 2013 2014 2013-2014
change
2013-2014
% change Rank
Total International Exports 26,485 26,870 28,415 27,495 -920 -3.2
1, 2, 3 Agriculture, Forestry and Fishing 285 255 260 345 80 31.6 22
5,6, 7,8,9 Mining and Quarrying 1,725 1,575 1,645 1,900 250 15.3 4
Manufacturing
Manufacture of...
10, 11, 12 Food products, beverages and tobacco products 4,905 5,025 5,015 4,765 -250 -5.0 1
11.01 Of Which Distilling, rectifying and blending of spirits 4,225 4,275 4,260 3,950 -310 -7.3
13, 14, 15 Textiles, wearing apparel, leather and related products 350 375 365 360 -5 -0.7 20
16, 17, 18 Wood and paper products; printing and reproduction of
recorded media
395 405 420 355 -65 -15.0 21
19, 20 Coke, refined petroleum and chemical products 3,390 2,905 2,875 2,140 -730 -25.5 3
21 Basic pharmaceutical products and pharmaceutical
preparations
325 315 295 285 -10 -3.9 24
22, 23 Rubber and plastic products, and other non-metallic mineral
products
735 790 825 815 -5 -0.7 12
24, 25 Basic metals and fabricated metal products, except machinery
and equipment
460 515 550 540 -10 -1.7 16
26 Computer, electronic and optical products 1,385 1,400 1,600 1,120 -480 -30.1 9
27 Electrical equipment 380 350 440 380 -55 -13.0 19
28 Machinery and equipment NEC 1,035 1,235 1,300 1,735 435 33.3 6
29, 30 Transport equipment 930 1,025 1,250 1,105 -145 -11.4 10
31, 32 Other manufacturing: including furniture 195 205 185 180 0 -0.5 27
33 Repair and installation of machinery and equipment 425 485 520 485 -35 -6.8 17
Total Manufacturing 14,915 15,035 15,630 14,270 -1,360 -8.7
35, 36, 37,
38, 39
Utilities 285 360 335 340 5 2.1 23
41, 42, 43 Construction 90 75 90 130 40 41.2 29
Services
45, 46, 47 Wholesale1,
retail trade; repair of motor vehicles and 1,545 1,720 1,800 1,790 -10 -0.6 5
49,50,51,52,
53
Transportation and storage 845 720 940 940 -5 -0.3 11
55, 56 Accommodation and food service activities 280 325 290 405 115 39.6 18
58, 59, 60 Publishing, audiovisual and broadcasting activities 80 80 50 65 10 24.2 31
61 Telecommunications 190 175 205 245 40 19.6 25
62, 63 IT and other information services 480 500 550 625 75 13.4 14
64, 65, 66 Financial and insurance activities 1,645 1,390 1,245 1,165 -80 -6.5 8
68 Real estate activities 35 30 50 65 15 34.5 30
69,70, 71 Legal, accounting, management, architecture, engineering,
technical testing and analysis activities
1,940 2,275 2,570 2,340 -230 -9.0 2
72 Scientific research and development 375 405 510 565 55 11.2 15
73, 74, 75 Other professional, scientific and technical activities 220 220 210 215 5 2.3 26
77,78,79,80,
81,82
Administrative and support service activities 900 1,015 1,225 1,265 40 3.1 7
85 Education 520 555 625 685 60 9.7 13
86,87,88,90,
91,92,93,94,Other Services
2 120 165 180 150 -30 -17.1 28
Total Services 9,180 9,575 10,455 10,515 60 0.6

11
2. Scotland’s International Export Destinations
Exports by country should be treated with some caution. Less information is provided by companies on country of export compared with total export value.
International Exports by broad industry Group and Region of
destination
42 per cent of exports were destined for countries within the European Union (estimated at £11.6 billion). Over the year exports to the EU 28 declined by £985 million (7.8%) from £12.5 billion in 2013 to £11.6 billion in 2014.
Table 2: Scottish International exports by sector and trade area (£ million) 2014
Notes:
1. Total Exports does not equal the sum of EU28 and non-EU. This is because EU28 and non-EU estimates exclude exports from
some industries – SIC 2007 36, 37, 39, 50, 51, 64 and 65, whereas the ‘Total exports’ column includes these sectors in the figures.
2. Includes manufacturing, mining & quarrying and utilities.
3. Excludes the value of oil & gas extracted from the UK Continental Shelf, see notes.
EU28
% of all
EU Non-EU
% of all
non-EU
Total
exports % Unallocated
Total Exports111,560 15,170 27,495 765
Agriculture, Forestry & Fishing 155 1 185 1 345 1
Production2, 3 & Construction 7,520 65 9,105 60 16,635 61 10
of which manufacturing 6,695 58 7,575 50 14,270 52 0
Services 3,885 34 5,875 39 10,515 38 755
12
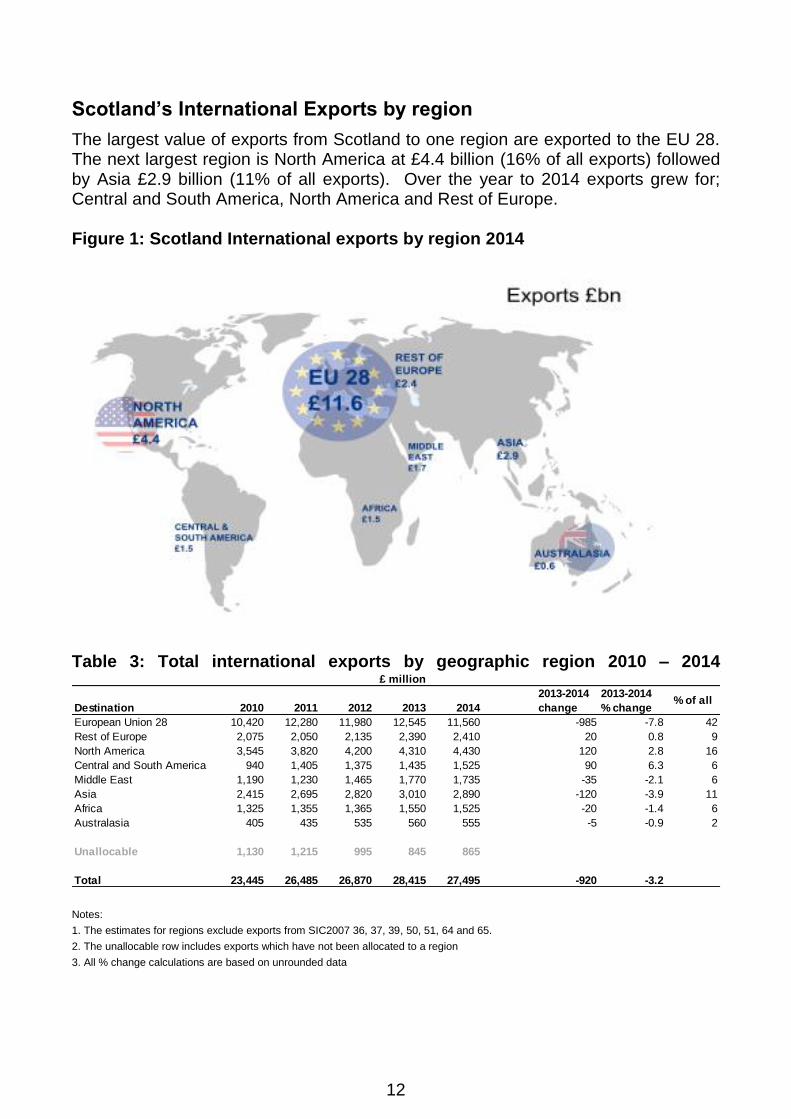
Scotland’s International Exports by region
The largest value of exports from Scotland to one region are exported to the EU 28. The next largest region is North America at £4.4 billion (16% of all exports) followed by Asia £2.9 billion (11% of all exports). Over the year to 2014 exports grew for; Central and South America, North America and Rest of Europe. Figure 1: Scotland International exports by region 2014
Table 3: Total international exports by geographic region 2010 – 2014
Notes:
1. The estimates for regions exclude exports from SIC2007 36, 37, 39, 50, 51, 64 and 65.
2. The unallocable row includes exports which have not been allocated to a region
3. All % change calculations are based on unrounded data
£ million
Destination 2010 2011 2012 2013 2014
2013-2014
change
2013-2014
% change % of all
European Union 28 10,420 12,280 11,980 12,545 11,560 -985 -7.8 42
Rest of Europe 2,075 2,050 2,135 2,390 2,410 20 0.8 9
North America 3,545 3,820 4,200 4,310 4,430 120 2.8 16
Central and South America 940 1,405 1,375 1,435 1,525 90 6.3 6
Middle East 1,190 1,230 1,465 1,770 1,735 -35 -2.1 6
Asia 2,415 2,695 2,820 3,010 2,890 -120 -3.9 11
Africa 1,325 1,355 1,365 1,550 1,525 -20 -1.4 6
Australasia 405 435 535 560 555 -5 -0.9 2
Unallocable 1,130 1,215 995 845 865
Total 23,445 26,485 26,870 28,415 27,495 -920 -3.2

13
Top country export destinations The USA continued to be Scotland’s top export destination country with an estimated £4.0 billion of exports from Scotland (14.5% of total exports). This is followed by Netherlands £1.9 billion (6.8% of the total), France with £1.9 billion (6.8 % of the total) and Germany with £1.8 billion (6.7% of the total). The top 10 export destinations accounted for 54 per cent of total international exports. Figure 2: Top 5 export destinations 2014
.
Note: The estimates for countries exclude exports from SIC 2007 36, 37,39,50,51,64 and 65.
Table 4: Top 20 export destinations (£ million), 2014
.Note:
The estimates for countries exclude exports from SIC 2007 36, 37,39,50,51,64 and 65.
The Netherlands and Belgium are consistently reported in Scotland’s top trading partners, however as these
countries contain key ports many of these goods are for onward supply to other countries.
Rank Destination Total
Exports
% of all Rank Destination Total
Exports
% of all
1 USA 3,985 14.5 11 Belgium 605 2.2
2 Netherlands 1,880 6.8 12 Italy 565 2.1
3 France 1,860 6.8 13 China 530 1.9
4 Germany 1,845 6.7 14 Singapore 455 1.7
5 Norway 1,200 4.4 15 Australia 445 1.6
6 Eire 1,125 4.1 16 Canada 445 1.6
7 Brazil 875 3.2 17 Other Africa (6) 420 1.5
8 Spain 815 3.0 18 Sweden 405 1.5
9 Denmark 720 2.6 19 Switzerland 395 1.4
10 UAE (5) 670 2.4 20 Japan 370 1.3

14
Total exports to countries within the top 3 regions
Chart 7: EU (Exports £ million)
Chart 8: North America (Exports £ million)
Chart 9: Asia (Exports £ million)
815
1,125
1,845
1,860
1,880
0 500 1,000 1,500 2,000 2,500 3,000 3,500 4,000
Spain
Eire
Germany
France
Netherlands
445
3,985
0 500 1,000 1,500 2,000 2,500 3,000 3,500 4,000
Canada
USA
455
530
0 500 1,000 1,500 2,000 2,500 3,000 3,500 4,000
Singapore
China

15
3. Exports to the rest of the UK Rest of UK export estimates should be treated with caution. It is more difficult to ascertain the final destination of sales within the UK as companies have no statutory requirement to collate financial information below UK leveI. Furthermore, particular sectors face challenges in determining what constitutes an ‘export’. In an Intra-UK situation, this is particularly the case in the service sector where output is harder to quantify and the residence of the final consumer may be less clear. Exports by sector Chart 10: International and rest of UK exports, % in Manufacturing and Services 2002 and 2014
Source: Exports Statistics Scotland
Exports to the rest of the UK have continued to increase in the last year, increasing £1.5 billion (3.2%) from £47.0 billion in 2013 to £48.5 billion in 2014. This is due to increases in the manufacturing sector (£20 million) and the service sector (£1.8 billion).
Manufacturing
Manufacturing
ManufacturingManufacturing
Services
Services
Services
Services
OtherOther
OtherOther
0%
10%
20%
30%
40%
50%
60%
70%
80%
90%
100%
2002 2014 2002 2014
International Exports Rest of UK Exports
16
Services account for a greater proportion of all exports to rest of the UK compared with international exports. In 2014 services accounted for 56% of all rest of UK exports compared with 38% of international exports. The 5 largest industry groups for rUK exports were:
Financial and insurance activities (£7.4 billion),
Wholesale, retail trade; repair of motor vehicles and motorcycles (£6.6 billion),
Utilities (£4.8 billion),
Manufacture of food products, beverages and tobacco (£4.0 billion), and
Legal, accounting, management, architecture, engineering, technical testing and analysis activities (£3.5 billion).
In the last year the largest increases, in the nominal value of exports, were in the following industry sectors:
Wholesale, retail trade; repair of motor vehicles and motorcycles (up £820 million),
Administrative and support service activities (up £440 million), and
Legal, accounting, management, architecture, engineering, technical testing and analysis activities (up £435 million).

17
Table 5: Rest of UK Exports by Industry (£million), 2011 – 2014
Notes:
1. Wholesale figures include the wholesale of agricultural products, fish and crustaceans & molluscs.
2. 'Other Services' includes the following activities: Health and other community activities, social and personal service activities.
3. Industry grouping are based on the Industrial Classification of the reporting company.
4. All % change calculations are based on unrounded data
£ million
SIC 2007 Division 2011 2012 2013 2014
2013-2014
change
2013-2014
% change Rank
Total rest of UK Exports 44,285 45,475 47,035 48,525 1,490 3.2
1, 2, 3 Agriculture, Forestry and Fishing 730 805 705 785 75 10.9 15
5,6, 7,8,9 Mining and Quarrying 2,765 2,745 2,790 3,205 415 14.8 6
Manufacturing
Manufacture of...
10, 11, 12 Food products, beverages and tobacco products 3,555 3,760 4,065 4,010 -55 -1.4 4
11.01 Of Which Distilling, rectifying and blending of spirits 615 525 585 530 -55 -9.8 0
13, 14, 15 Textiles, wearing apparel, leather and related products 245 265 260 265 5 1.5 25
16, 17, 18 Wood and paper products; printing and reproduction of 890 865 860 855 -5 -0.5 14
19, 20 Coke, refined petroleum and chemical products 1,870 1,610 1,595 1,190 -405 -25.3 9
21 Basic pharmaceutical products and pharmaceutical 265 160 150 155 5 4.7 29
22, 23 Rubber and plastic products, and other non-metallic mineral 465 450 470 485 15 3.1 20
24, 25 Basic metals and fabricated metal products, except machinery 755 800 745 705 -40 -5.1 16
26 Computer, electronic and optical products 640 685 580 680 100 17.2 17
27 Electrical equipment 175 120 90 180 90 99.4 31
28 Machinery and equipment NEC 390 420 530 680 155 29.2 21
29, 30 Transport equipment 1,360 1,490 1,170 1,310 145 12.3 11
31, 32 Other manufacturing: including furniture 110 125 160 160 0 1.4 30
33 Repair and installation of machinery and equipment 465 530 490 500 10 2.0 18
Total manufacturing 11,180 11,285 11,155 11,180 25 0.2
35, 36, 37, 38, 39 Utilities 4,820 4,930 5,630 4,755 -875 -15.5 3
41, 42, 43 Construction 1,445 1,525 1,630 1,635 10 0.6 10
Services
45, 46, 47 Wholesale1,
retail trade; repair of motor vehicles and
motorcycles
5,830 5,670 5,785 6,605 820 14.2 2
49,50,51,52,53 Transportation and storage 2,085 2,350 2,185 2,055 -130 -5.9 7
55, 56 Accommodation and food service activities 970 985 790 755 -35 -4.2 13
58, 59, 60 Publishing, audiovisual and broadcasting activities 235 305 380 340 -40 -9.9 23
61 Telecommunications 95 165 100 190 90 93.3 28
62, 63 IT and other information services 735 995 1,285 1,475 185 14.5 12
64, 65, 66 Financial and insurance activities 8,285 7,115 7,125 7,435 305 4.3 1
68 Real estate activities 365 380 575 325 -250 -43.7 22
69,70, 71 Legal, accounting, management, architecture, engineering, 2,315 2,805 3,085 3,520 435 14.2 5
72 Scientific research and development 220 230 230 195 -35 -15.3 26
73, 74, 75 Other professional, scientific and technical activities 260 295 240 245 5 2.1 24
77,78,79,80,81,82 Administrative and support service activities 1,455 2,235 2,805 3,245 440 15.6 8
85Education 445 485 420 460 40 9.4 19
86, 87, 88, 90, 91, 92,
93, 94, 95, 96, 97, 98,
99
Other Services2 55 170 120 130 5 4.4 27
Total Services 23,345 24,185 25,125 26,970 1,845 7.3
18
4. Total Exports from Scotland: Rest of UK and
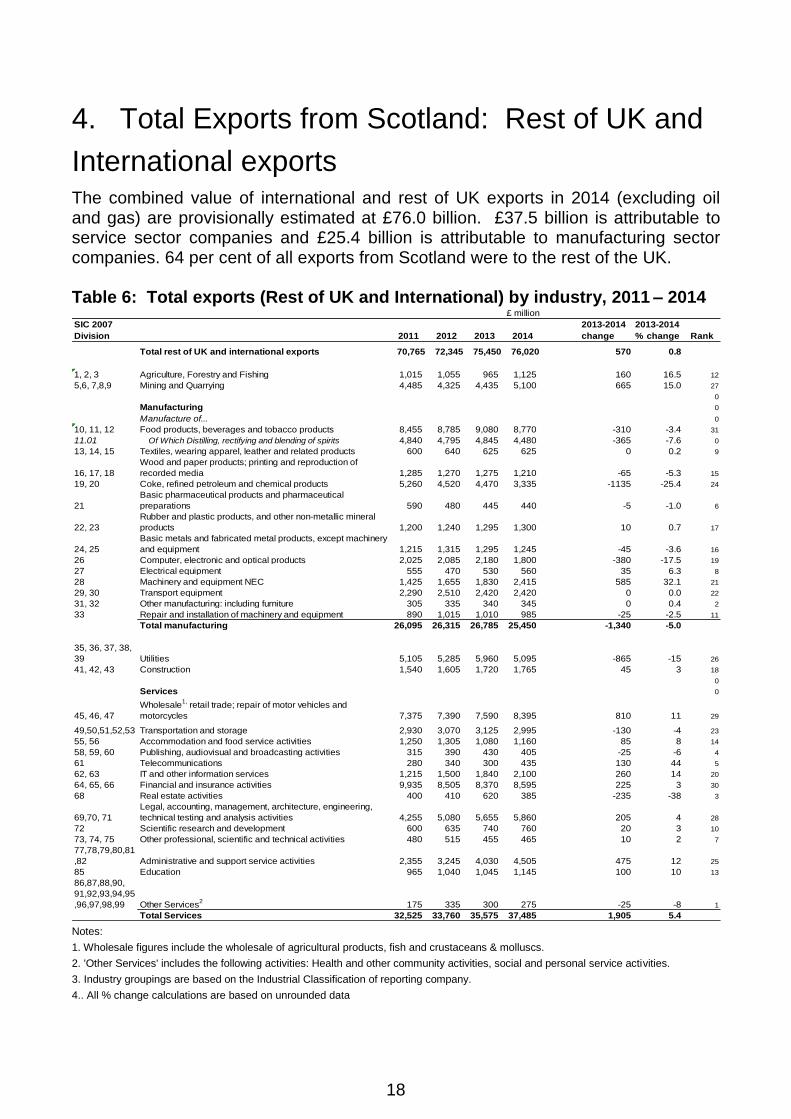
International exports The combined value of international and rest of UK exports in 2014 (excluding oil and gas) are provisionally estimated at £76.0 billion. £37.5 billion is attributable to service sector companies and £25.4 billion is attributable to manufacturing sector companies. 64 per cent of all exports from Scotland were to the rest of the UK. Table 6: Total exports (Rest of UK and International) by industry, 2011 – 2014
Notes:
1. Wholesale figures include the wholesale of agricultural products, fish and crustaceans & molluscs.
2. 'Other Services' includes the following activities: Health and other community activities, social and personal service activities.
3. Industry groupings are based on the Industrial Classification of reporting company.
4.. All % change calculations are based on unrounded data
£ million
SIC 2007
Division 2011 2012 2013 2014
2013-2014
change
2013-2014
% change Rank
Total rest of UK and international exports 70,765 72,345 75,450 76,020 570 0.8
1, 2, 3 Agriculture, Forestry and Fishing 1,015 1,055 965 1,125 160 16.5 12
5,6, 7,8,9 Mining and Quarrying 4,485 4,325 4,435 5,100 665 15.0 27
0
Manufacturing 0
Manufacture of... 0
10, 11, 12 Food products, beverages and tobacco products 8,455 8,785 9,080 8,770 -310 -3.4 31
11.01 Of Which Distilling, rectifying and blending of spirits 4,840 4,795 4,845 4,480 -365 -7.6 0
13, 14, 15 Textiles, wearing apparel, leather and related products 600 640 625 625 0 0.2 9
16, 17, 18
Wood and paper products; printing and reproduction of
recorded media 1,285 1,270 1,275 1,210 -65 -5.3 15
19, 20 Coke, refined petroleum and chemical products 5,260 4,520 4,470 3,335 -1135 -25.4 24
21
Basic pharmaceutical products and pharmaceutical
preparations 590 480 445 440 -5 -1.0 6
22, 23
Rubber and plastic products, and other non-metallic mineral
products 1,200 1,240 1,295 1,300 10 0.7 17
24, 25
Basic metals and fabricated metal products, except machinery
and equipment 1,215 1,315 1,295 1,245 -45 -3.6 16
26 Computer, electronic and optical products 2,025 2,085 2,180 1,800 -380 -17.5 19
27 Electrical equipment 555 470 530 560 35 6.3 8
28 Machinery and equipment NEC 1,425 1,655 1,830 2,415 585 32.1 21
29, 30 Transport equipment 2,290 2,510 2,420 2,420 0 0.0 22
31, 32 Other manufacturing: including furniture 305 335 340 345 0 0.4 2
33 Repair and installation of machinery and equipment 890 1,015 1,010 985 -25 -2.5 11
Total manufacturing 26,095 26,315 26,785 25,450 -1,340 -5.0
35, 36, 37, 38,
39 Utilities 5,105 5,285 5,960 5,095 -865 -15 26
41, 42, 43 Construction 1,540 1,605 1,720 1,765 45 3 18
0
Services 0
45, 46, 47
Wholesale1,
retail trade; repair of motor vehicles and
motorcycles 7,375 7,390 7,590 8,395 810 11 29
49,50,51,52,53 Transportation and storage 2,930 3,070 3,125 2,995 -130 -4 23
55, 56 Accommodation and food service activities 1,250 1,305 1,080 1,160 85 8 14
58, 59, 60 Publishing, audiovisual and broadcasting activities 315 390 430 405 -25 -6 4
61 Telecommunications 280 340 300 435 130 44 5
62, 63 IT and other information services 1,215 1,500 1,840 2,100 260 14 20
64, 65, 66 Financial and insurance activities 9,935 8,505 8,370 8,595 225 3 30
68 Real estate activities 400 410 620 385 -235 -38 3
69,70, 71
Legal, accounting, management, architecture, engineering,
technical testing and analysis activities 4,255 5,080 5,655 5,860 205 4 28
72 Scientific research and development 600 635 740 760 20 3 10
73, 74, 75 Other professional, scientific and technical activities 480 515 455 465 10 2 7
77,78,79,80,81
,82 Administrative and support service activities 2,355 3,245 4,030 4,505 475 12 25
85 Education 965 1,040 1,045 1,145 100 10 13
86,87,88,90,
91,92,93,94,95
,96,97,98,99 Other Services2
175 335 300 275 -25 -8 1
Total Services 32,525 33,760 35,575 37,485 1,905 5.4

19
5. Exports by Size of Company
International Exports by size of company
Larger companies employing more than 250 employees export the most, estimated at £15.0 billion in 2014. Large companies account for 55% of all international exports. The Production and Construction sector accounts for 54% of the total value of international exports and 64% of exports from this sector are from large businesses. International exports from medium sized companies increased by £75 million (1%) since 2013. Exports declined in small and large businesses. In the last year it is evident that large businesses in the Production and Construction sector experienced the largest decrease. Chart 11: International Exports by size of business
Source: Exports Statistics Scotland Note: Size of business is based on employment in Scotland. Table 8b and 9b in the additional excel tables shows results for UK employment for 2012-2014
Large
Medium
Small
0
5
10
15
20
25
30
2002 2003 2004 2005 2006 2007 2008 2009 2010 2011 2012 2013 2014
Exp
ort
s (£
bn
)

20
Table 7: Total International Exports by Broad Industry Sector and Size of Company, 2010 – 2014
Notes:
1. Company size based on employment of company in Scotland: Small: <50 employees; Medium: 50-249 employees; Large: 250+
employees.
2. Includes Agriculture, Forestry & Fishing, Mining, Quarrying & Extraction of Petroleum. Excludes the value of oil & gas extracted from
the UK Continental Shelf, see Notes.
3. Includes manufacturing and electricity/gas/water supply.
4. Includes some companies with exports but no reported employment details.
5. All % change calculations are based on unrounded data
Rest of UK Exports by size of company
Larger companies employing more than 250 employees export the most to the rest of the UK. Exports to the rest of the UK from larger companies were estimated at £28.5 billion in 2014 (59 per cent of all rest of UK exports). Rest of UK exports from larger sized companies increased by £590 million (2.1%) from £28.0 billion in 2013 to £28.5 billion in 2014. Rest of UK exports from small sized companies increased by £180 million (1.9%) from £9.6 billion in 2013 to £9.8 billion in 2014.
2010 2011 2012 2013 2014
2013-2014
change
2013-2014
% change
Primary2 1,570 1,915 1,720 1,815 2,115 295 16.4
Large 835 1,195 1,070 1,265 1,510 245 19.3
Medium 540 450 465 450 485 30 6.8
Small 195 270 185 100 125 20 22.1
Production3 &
Construction 13,580 15,290 15,470 16,055 14,740 -1,315 -8.2
Large 9,300 10,645 10,365 10,515 9,430 -1,080 -10.3
Medium 3,360 3,585 3,845 4,590 4,340 -245 -5.4
Small 920 1,065 1,255 950 965 15 1.5
Services 8,225 9,180 9,575 10,455 10,515 60 0.6
Large 3,155 3,825 3,870 4,100 4,065 -35 -0.9
Medium 1,935 2,095 2,140 2,250 2,540 290 12.9
Small 3,135 3,255 3,565 4,105 3,910 -195 -4.7
Total Exports 4 23,445 26,485 26,870 28,415 27,495 -920 -3.2
Total Large 13,290 15,665 15,305 15,875 15,005 -875 -5.5
Total Medium 5,835 6,125 6,450 7,290 7,365 75 1.0
Total Small 4,250 4,590 5,005 5,155 4,995 -160 -3.1

21
Table 8: Total Rest of UK Exports by Broad Industry Sector and Size of Company, 2010 -2014
Notes:
1. Company size: Small: <50 employees; Medium: 50-249 employees; Large: 250+ employees.
2. Includes Agriculture, Forestry & Fishing, Mining, Quarrying & Extraction of Petroleum. Excludes the value of oil & gas extracted from
the UK Continental Shelf,
3. Includes manufacturing and electricity/gas/water supply.
4. Includes some companies with exports but no reported employment details.
Concentration of International Exports The concentration of international exports is skewed with around 30 per cent of international exports attributable to around 15 businesses; 50 per cent of international exports attributable to around 70 businesses, and 60 per cent of international exports attributable to around 130 businesses.
£ million
2010 2011 2012 2013 2014
2013-2014
change
2013-2014
% change
Primary2 3,545 3,465 3,530 3,480 3,970 490 14.1
Large 2,715 2,435 2,600 2,375 2,895 520 21.8
Medium 290 395 380 515 475 -45 -8.3
Small 535 640 550 590 605 15 2.6
Production3 &
Construction 16,595 17,450 17,740 18,415 17,570 -845 -4.6
Large 11,345 12,090 12,120 12,670 11,775 -895 -7.1
Medium 3,635 3,490 3,710 3,945 3,850 -95 -2.4
Small 1,615 1,870 1,915 1,800 1,945 145 8.0
Services 24,145 23,345 24,185 25,125 26,970 1,845 7.3
Large 14,430 12,585 12,685 12,915 13,880 965 7.5
Medium 4,110 5,145 4,810 4,985 5,845 860 17.2
Small 5,605 5,610 6,695 7,225 7,245 20 0.3
Total Exports 4 44,300 44,285 45,475 47,035 48,525 1,490 3.2
Total Large 28,495 27,110 27,400 27,955 28,545 590 2.1
Total Medium 8,035 9,035 8,895 9,450 10,170 720 7.6
Total Small 7,755 8,120 9,155 9,610 9,790 180 1.9

22
6. Comparability of Scottish International Exports Sources There are 4 main sources related to exports from Scotland as summarised below. Charts 12, 13 and 14 show how these compare with Export Statistics Scotland. Table 9: Sources of Export Statistics for Scotland
Source Published Estimates Detail Timeliness SG Export Statistics Scotland
Value of International exports Value of Rest of UK exports. Other associated barriers and assistance information
Export Country and Region and Industry of export
Annual Latest publication Jan 2016 for 2014 Exports
SG Quarterly National Accounts Scotland
Value of International and Rest of UK exports from Scotland (Import Statistics are also reported) consistent with annual national accounts estimates of exports and imports in the SG Supply and Use tables
No breakdown Latest Quarterly results Nov 2015 for Q2 2015
HMRC Regional Trade Statistics
Export value for commodity export sales Internationally. Other estimates are published for Imports, number of importers and exporters
Country Commodity type
Quarterly Latest publication Dec 2015 for Q3 2015
SG Index of Manufactured Exports
Growth in international goods sales from Scottish Manufacturing businesses in constant prices A short term economic indicator derived from the Office of National Statistics Monthly Business Survey returns for manufacturing businesses located in Scotland.
Manufacturing Industry breakdown
Quarterly Latest publication January 2016 for Q3 2015
SG Supply and Use tables
Value of Rest of UK and Rest of World exports Annual estimates by 98 product groups (CPA 2008)
Latest annual results for 2012 (published July 2015)

23
Compared with HMRC and Quarterly National Accounts
Export Statistics Scotland estimate is largely based on the GCS Survey and estimates provided through other official sources as outlined in Table 11. ESS reports the nominal value of goods exported (i.e the nominal value of goods physically exported), and services exported from Scotland. Information is presented broken down by industry group of the business responding to the survey. The questions in the GCS survey to collect nominal value of export have remained unchanged since it began in 2002. Scottish Government national accounts statistics (annual Supply & Use tables and Quarterly National Accounts Scotland) reports estimates of exported goods and services which are consistent with trade definitions applied in the European System of Accounts 2010 (ESA10). One feature of this definition is that exports and imports are now defined on a ‘change of ownership basis’, where, for example, goods which are manufactured under contract from a non-resident owner are no longer counted in exports (but a processing service fee is counted instead). The value of exports measured on a change of ownership basis can differ from that measured on a physical flows basis. The national accounts estimates of trade statistics are based on ESS results which are adjusted to meet the conceptual definitions of ESA10, and also subject to other adjustments required to ensure that total supply and demand for products in the Scottish economy are balanced. HMRC statistics measure trade in goods only, with goods broken down by product type and do not include service exports. This is only broadly comparable with the Manufacturing and Production SIC 2007 Industry sectors from the Export Statistics Scotland estimates shown below. Since 2005, the Exports Statistics Scotland Manufacturing and Production data are lower than the HMRC Regional Trade in Scotland estimate, although follow a similar pattern over time. The Quarterly National Accounts cash price value of total international exports is lower than the total GCS estimate of exports. The QNA estimate also shows a decline in exports between 2011 and 2012 compared with Export Statistics Scotland which has increased in each year since 2004 to 2013, declining between 2013 and 2014.

24
Chart 12 Scottish International Exports 2002 to 2014
Source: Export Statistics Scotland, HMRC RTS, SG Quarterly National Accounts
0
5,000
10,000
15,000
20,000
25,000
30,000
2002 2003 2004 2005 2006 2007 2008 2009 2010 2011 2012 2013 2014
£ m
illi
on
s
Year
Quarterly National Accounts Export Statistics Scotland - Manufacturing and Production
Export Statistics Scotland HMRC Regional Trade for Scotland

25
HMRC Regional Exports of Goods
HMRC Regional Trade Statistics (HMRC RTS) estimates a decrease in exports for all devolved countries between 2013 and 2014, after a period of sustained increase between the years 2004 to 2013. Chart 13: HMRC UK Regional Trade in Goods 2002 to 2014
Source: HMRC Regional Trade Statistics HMRC RTS present some export information in an ‘Unknown region’ in cases where there is an absence of a strong case to allocate value of goods to any one region. An example of this is where oil is processed on rigs in the North Sea and dispatched directly to other countries, the oil does not enter the UK and therefore does not obtain a regional coding. This category is significant in terms of the value of trade falling within it. In 2014 the ‘Unknown region’ represented £37.3 billion, almost 2 times the value attributed to Scotland (£19.6 billion) and 13 per cent of the total UK exports figure for 2014 (£287 billion). Regional value exports are also affected by bias toward reporting at head office level. Although an adjustment is made for this, this this does not fully mitigate the issue.
0
5,000
10,000
15,000
20,000
25,000
30,000
35,000
40,000
45,000
2002 2003 2004 2005 2006 2007 2008 2009 2010 2011 2012 2013 2014
£ m
illi
on
s
Year
Northern Ireland Scotland Wales Unknown Region

26
Rest of UK Exports
The SG Quarterly National Accounts provides an estimate of rest of UK exports. These results are modelled estimates compared with the survey based estimates from company responses reported in Export Statistics Scotland. The Quarterly National Accounts estimates compared with Export Statistics Scotland are similar. The national accounts estimates of exports to RUK are based primarily on results from ESS. Chart 14: Rest of UK exports: Quarterly National Accounts and Export Statistics Scotland 2002 to 2014
Source: Quarterly National Accounts Q2 2015, Export Statistics Scotland 2014
0
10,000
20,000
30,000
40,000
50,000
60,000
2002 2003 2004 2005 2006 2007 2008 2009 2010 2011 2012 2013 2014
£
millio
n
Year
Export Statistics Scotland Quarterly National Accounts
27
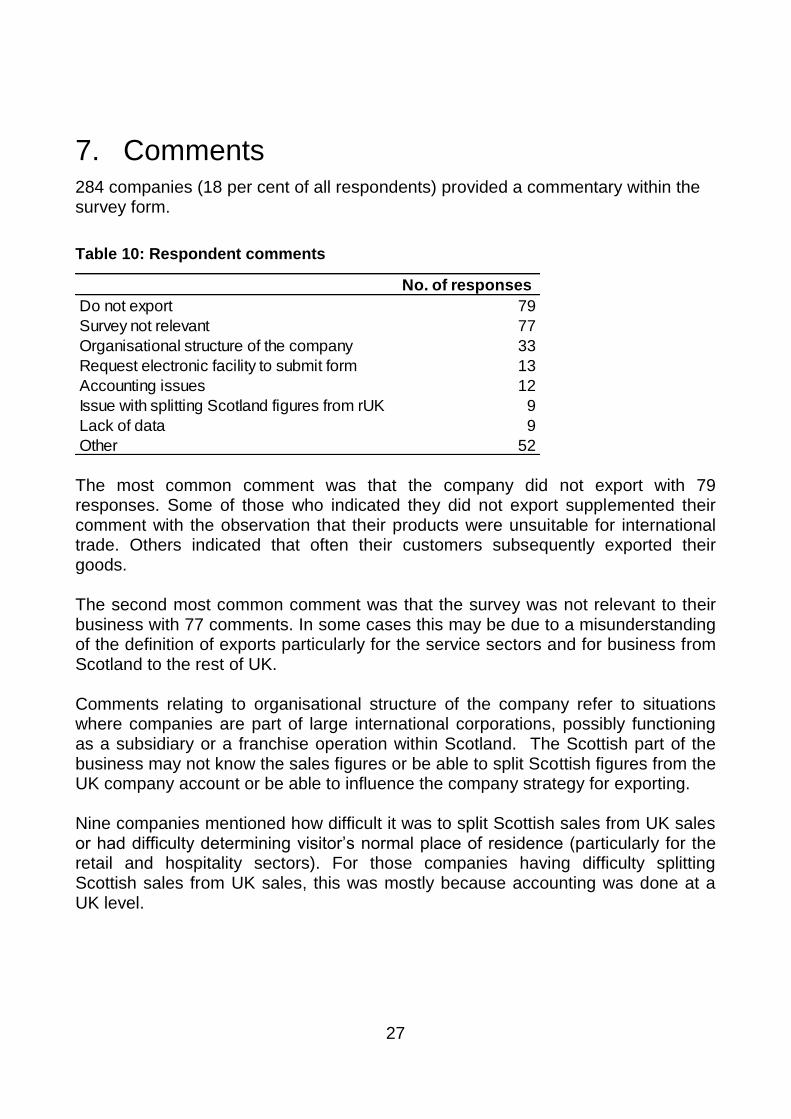
7. Comments 284 companies (18 per cent of all respondents) provided a commentary within the survey form.
Table 10: Respondent comments
The most common comment was that the company did not export with 79 responses. Some of those who indicated they did not export supplemented their comment with the observation that their products were unsuitable for international trade. Others indicated that often their customers subsequently exported their goods. The second most common comment was that the survey was not relevant to their business with 77 comments. In some cases this may be due to a misunderstanding of the definition of exports particularly for the service sectors and for business from Scotland to the rest of UK. Comments relating to organisational structure of the company refer to situations where companies are part of large international corporations, possibly functioning as a subsidiary or a franchise operation within Scotland. The Scottish part of the business may not know the sales figures or be able to split Scottish figures from the UK company account or be able to influence the company strategy for exporting. Nine companies mentioned how difficult it was to split Scottish sales from UK sales or had difficulty determining visitor’s normal place of residence (particularly for the retail and hospitality sectors). For those companies having difficulty splitting Scottish sales from UK sales, this was mostly because accounting was done at a UK level.
No. of responses
Do not export 79
Survey not relevant 77
Organisational structure of the company 33
Request electronic facility to submit form 13
Accounting issues 12
Issue with splitting Scotland figures from rUK 9
Lack of data 9
Other 52
28
8. Background notes These statistics have been prepared by the Office of the Chief Economic Adviser, Scottish Government in collaboration with Scottish Development International. The most recent results should be treated as provisional and may be subject to future revisions.
8.1 Sources and Methodology
The Global Connections Survey (GCS), which is sent to businesses each year by the Scottish Government, informs much of the estimates of International Exports published in this report and is the only source for estimates of exports from Scotland to the rest of the UK. Further to the GCS, relevant estimates for businesses in Scotland are also sourced from official and administrative sources produced by the Office for National Statistics and other parts of the Scottish Government. 1,664 responses were obtained from the Global Connections Survey. A further 1,643 responses were obtained from the ONS Monthly Business Survey or ONS International Trade in Services. These sources are used to estimate export values and/or proportions. Turnover is sourced for most companies from the Inter-Departmental Business register. Other sources are also used in different sectors as outlined in Table 11.

29
Table 11: Sources to produce Export Statistics Scotland Estimate
Variable Sources Description Link
International and rest of UK exports
Global Connections Survey
A sample of 5,500 businesses operating in Scotland were invited to participate in this voluntary survey, and completed responses were received from around 1,700 companies. We would like to thank all of the companies that responded to the survey and all those who have been involved in the survey for their help and advice including: Scottish Development International and Highlands & Islands Enterprise.
SG
Turnover Inter-Departmental Business Register (IDBR)
The IDBR is used as the sampling frame for the Export Statistics Scotland publication. This source is compiled by ONS. The IDBR is also the source of turnover estimates for most business sectors. A link to further information on this source can be found on ONS web site: http://www.ons.gov.uk/ons/about-ons/products-and-services/idbr/index.html.
ONS
Service sector international exports
International Trade in Services
For service sector organisations where no GCS response was received (but the business responded to the ONS International Trade in Services survey) then international exports are estimated from this source. For businesses located across the UK the export estimate is based on employment proportions. The most recent estimates for 2013 were used in 2014: http://www.ons.gov.uk/ons/rel/itis/international-trade-in-services/2013/stb-itis-2013.html.
ONS
Manufacturing sector international exports
Monthly Business Survey
For manufacturing sector organisations, where no GCS response was received, but the business responded to the ONS short-term Monthly Business Survey then international exports are estimated from this source. http://www.ons.gov.uk/ons/about-ons/get-involved/taking-part-in-a-survey/information-for-businesses/a-to-z-of-business-surveys/monthly-business-survey--production-and-services-/index.html
ONS

30
International export values for SIC 11.01 Distilling, rectifying and blending of spirits
HMRC Overseas Trade Statistics
Estimates of international whisky exports are sourced from HMRC Overseas Trade Statistics based on the export values for Scotch Whisky Commodities reported to HMRC. Commodity codes included for 2002-2010: 22083032, 22083038, 22083052, 22083058, 22083072, 22083078. Commodity codes included for 2011-2014: 22083030, 22083041, 22083049, 22083061,22083069, 22083071, 22083079. https://www.uktradeinfo.com/Statistics/OverseasTradeStatistics/Pages/OTS.aspx
HMRC
International and rest of UK export values for SIC 03.11 Marine fishing
Scottish Sea Fisheries Statistics
Estimates of international and rest of UK marine fishing exports are sourced from the SG Marine Scotland publication Scottish Sea Fisheries Statistics. Exports are estimated using the value of landings by Scottish vessels in Tables 1.1b and 1.3: http://www.gov.scot/Topics/Statistics/Browse/Agriculture-Fisheries/PubFisheries
SG
Turnover and international/rest of UK export values for SIC 85.4 Higher education
Higher Education Institution annual reports
Estimates of turnover and international/rest of UK higher education exports are sourced from Higher Education Institution annual reports.
N/A
EU/rest of World export proportions for SIC 85.4 Higher education
HESA student number
Student numbers by Higher Education Institute and domicile for the academic years 2008/09 to 2013/14 are provided by HESA. This data is used to determine the proportions of international exports to the EU and the rest of the World.
HESA
Turnover and international/rest of UK export values for SIC
SG Banking Survey
For 2011 to 2014 the information is based on a Scottish Government collection of total sales and sales to non-UK resident customers for the four largest organisations in this sector.
SG

31
64.191 Banking
Information on exports for the banking sector prior to 2011 were based on export sales information provided by The Committee of Scottish Clearing Bankers (CSCB), now The Committee of Scottish Bankers. The Committee of Scottish Clearing Bankers also provided a split of international and rest of UK sales.
Rest of UK export proportions for SIC 35 Electricity, gas, steam and air conditioning supply
Department for Energy and Climate Change
Estimates were obtained from the publication below: https://www.gov.uk/government/statistics/energy-trends-december-2015-special-feature-article-electricity-generation-and-supply-figures-for-scotland-wales-northern-ireland-and-england-2.
DECC
Scottish Enterprise Account Management Information is also used to identify exporters

32
Timescale for data collection Timescales for Global Connections Survey Data Collection and processing 2014 The Export Statistics Scotland is produced in the following timescales: Table 12: Timetable for collection of data sources for Export Statistics Scotland
Date Task
Dec 2014 Receipt of IDBR for 2014 extract
26th Jan 2015 Global Connections Survey 2013 published
Feb 2015 Publication of International Trade in Services Information
Feb 2015 Publication of 2014 HMRC Overseas Trading Statistics
Feb 2015 SG receipt of ONS Monthly Business Survey
Feb 2015 Publication of HESA 2014 Student Numbers
Feb-Apr 2015 Global Connections Survey 2014 sampling and development of survey material
18th May 2015 Mail out of Global Connections 2014 survey
22nd Jun 2015 2nd Mail out of Global Connections survey
Jul-Aug 2015 Further email contact with business
Aug 2015 Receipt of Scottish Government Banking Information
28th Aug 2015 Mail data collection closes
Sep 2015 Publication of Marine Scotland Information
Sep-Jan 2016 Quality assurance and preparation of publication
Dec 2015 Receipt of DECC information
Jan 2016 Publication of Export Statistics Scotland 2014

33
8.2 Definitions
Industrial classification
This publication provides export estimates for companies classified by the 2007 UK Standard Industrial Classification (SIC) of economic activities. The 2007 classification system was used for the first time in the 2011 publication. Prior to this results were based on the 1992 and 2003 classifications. The 2010 survey results were remapped and an impact document was provided to alert users to the changes in the 2011 survey: http://www.scotland.gov.uk/Topics/Statistics/Browse/Economy/Exports/GCSIntroduction/GCSImpactSIC2007.
Throughout the commentary in this publication, SIC 1-3, SIC 5-9, SIC 35-39 and SIC 41-43 are classed as 'Other' industries, SIC 10-33 are classed as 'Manufacturing' industries and SIC 45-99 are classed as 'Services' industries.
Exports of oil and gas from the UK continental shelf
Total Scottish exports do not include any exports of oil and gas extracted from the UK continental shelf, and so exclude companies classified as SIC 2007 6.1 ‘Extraction of crude petroleum’ and 6.2 ‘Extraction of natural gas’. Exports of services provided to the oil and gas industry are included under SIC 2007 9.1 ‘Support activities for petroleum and natural gas extraction’, 9.9 ‘Support activities for other mining and quarrying’ and 71 ‘Architectural and engineering activities; technical testing and analysis’. The Scottish Government has published experimental estimates of the value of exports of oil and gas and the offshore economy: http://www.gov.scot/Topics/Statistics/Browse/Economy/SNAP/expstats/oilandgas.
Regional and country estimates - industry coverage
Destination estimates exclude SIC 2007 36 ‘Water collection, treatment and supply’, 37 ‘Sewerage’, 39 ‘Remediation activities and other waste management services’, 50 ‘Water transport’, 51 ‘Air transport’, 64 ‘Financial services activities, except insurance and pension funding’ and 65 ‘Insurance, reinsurance and pension funding, except compulsory social security’. This is due to a lack of reliable company information for these industries. The total for these is shown as unallocable in Table 3. Therefore, rankings of individual countries should be treated as indicative.

34
8.3 Interpretation and use of data
Interpretation of time series
Export Statistics Scotland links the responses of businesses in one year with previous years. This is part of the imputation methodology. However it should be noted when interpreting changes on an industry basis (Tables 1, 5 & 6) some companies may have moved industry group between years. The methodology minimises the impact of this and takes measures to correctly code companies consistently across years. When considering time series of exports by business size (Table 7 & 8) it should be noted that some businesses will change size and, therefore, size category between years. Changes in SIC between years are also relevant to these tables. Country of export Country results are subject to a higher degree of sampling error than industry estimates as less information is provided by respondents on country destination. It is important to note that differences in the reported export markets of the companies responding to the survey could affect the year on year changes in the destination estimates, and that ranks of countries with similar export estimates can change considerably. Furthermore, some companies operate as toll manufacturers indicating a one stop destination in the survey return. Other organisations change markets to increase profitability and this also can affect trends across time. It should be noted a small amount of exports remain unallocated. It is possible that exports are transported to countries other than the reported destination as the survey does not collect the final destination of goods or services. The Netherlands is consistently reported as one of the top export destinations for Scotland. However it should be noted that chemicals and refined petroleum may be transported to the Netherlands initially and then transported elsewhere. Rest of UK estimates
Rest of UK exports relate to trade from Scotland to either England, Wales or Northern Ireland. As with international exports, it is possible that exports to the rest of UK are further transported onwards to an international destination as the survey does not collect the final destination of goods or services. Previous articles discussing some of the challenges of estimating UK exports in more detail are available:

35
http://www.scotland.gov.uk/Publications/2007/07/18083820/8 and http://www.scotland.gov.uk/Publications/2005/11/2485808/58104.
8.4 Quality
Global Connections Survey response rates Over all the sectors, the response rate to the Global Connection Survey was 30%. SIC 1-3 ‘Agriculture, Forestry and Fishing’ had the highest response rate at 44% whereas SIC 61 ‘Telecommunications’ had the lowest at 16%. Table 10 (in the excel tables) provides detailed response rate estimates by SIC 2007 Industry sector. As outlined in section 7, the survey returns are checked against other official sources, and supplemented with complete administrative sources of information for relevant sectors, where possible. Revisions with previously published estimates
Estimates for previous years have been revised largely due to new information provided by companies in the 2014 survey responses which have enabled estimation improvements. The 2014 results are provisional, and may be revised in the future if improved information becomes available. The survey weighting methodology used (to estimate results for the entire population of businesses in Scotland) means estimates for previous years will be revised. More details can be found in the methodology section on the web: http://www.scotland.gov.uk/Topics/Statistics/Browse/Economy/Exports/ESSMethodology. Part of the difference between estimates for 2013 compared with 2012 arose due to incorporating the HMRC Overseas Trade Statistics for SIC 11.01. Previously these had been estimated from survey returns. Table 11 (in excel tables) provides a year by year summary of revisions to previously published estimates. Global Connections Survey respondent Burden Respondents were asked the length of time and cost involved of completing the GCS survey. 1,561 respondents provided this information. Time information was more frequently provided compared with cost.

36
86 per cent reported it took less than or equal to 1 hour to complete the form. The maximum time reported was 10 hours and the median was 20 minutes.
Of those respondents who provided a cost, 75 per cent reported it cost their business less than or equal to £50 to complete the form. The maximum reported cost to the respondent’s business was £1,500. The median reported cost was £25.
Of those respondents who provided both a cost and a time, approximately two-thirds reported a cost to their business of less than or equal to an hourly rate of £65/hour to complete the form. The median cost rate to the respondent’s business was £44/hour to complete. Calculating an average cost based on an hourly rate for those respondents providing both cost and time (£86.44) and applying this to those responses that provided a time to complete allows an estimate of burden for those companies who responded. This provides an estimate of total respondent burden which approximates to £94,979. These are the estimated costs to the respondent’s organisation. The cost of printing, distribution, processing and analysis are additional costs for this survey. Table 13: Respondent burden
Number of
responses Minimum Maximum Average Median Total
Cost (£s) 888 1 1,500 55.6 25 49,383
Time in minutes 1,560 1 600 42.3 20 65,927
Average cost
(£ per hour) 887 1.2 2,000 86.4 44
8.5 Comparability and Coherence
There is no UK survey which compares exactly with Export Statistics Scotland. Section 7 of this publication provides charts and commentary comparing Export Statistics Scotland export estimates with other UK and Scottish sources. Total exports for the UK which combine HMRC Overseas Trade Statistics and the UK International Trade in Services are published by Office for National Statistics: http://www.ons.gov.uk/ons/rel/bop/united-kingdom-balance-of-payments/2015/index.html.
8.6 User engagement
Relevance to users

37
The results of this survey are of interest to government policy makers, politicians, the business community, economic commentators, academics and members of the general public with an interest in the Scottish economy. The estimates of international exports provided here relate to exports to destinations out with the UK. The international exports estimate in Table 1 is used in National Indicator “Increase exports”. Further information on this can be found on the Scotland Performs website: http://www.scotland.gov.uk/About/scotPerforms/indicator/exports.
This indicator is also used to monitor the Scottish Government target to increase the value of Scottish exports by 50 per cent by 2017, as described in the Government Economic Strategy: http://www.scotland.gov.uk/Topics/Economy/EconomicStrategy.
The estimates from this publication are used by the Scottish Government in economic modelling and the Scottish Government Quarterly National Accounts Publication. The survey responses also enable Scottish Development International to target their resources and planning to assist companies in Scotland with exporting. More widely, the estimates are utilised by commercial companies, academics and independent researchers. Feedback from users
We are aiming to improve the release and associated commentary. We would welcome any feedback you may have and would be particularly interested in knowing how you make use of the data in your work. Please email any comments to: [email protected].
Next Publication: TBC

38
Annex A: Volume Index of Export Statistics (Experimental Statistics)
Background
Table A1 is a new addition to the Exports Statistics Scotland release. It reports the first estimates of results from Exports Statistics Scotland in volume terms (also referred to as constant price, or real terms estimates). Results are presented in the form of volume indices (where 2012=100) and allow export trends to be analysed over time with the effects of price inflation removed. The volume estimates have been released as experimental official statistics. These are defined in the Code of Practice for Official Statistics as new statistics undergoing evaluation. They are published in order to involve users and stakeholders in their development and as a means to build in quality at an early stage. The volume estimates in this annex do share the National Statistics designation with other results in Exports Statistics Scotland. Users should treat the results in A1 as provisional, and anticipate that the estimates are likely to be revised in future releases as the data sources and methods are developed and improved. Key finding
The volume index of total exports is shown in Chart A1. This indicates that total exports fell strongly between 2002 and 2005, and have grown in most years between 2005 and 2014. Chart A1: Total International exports (Chainlinked volume measure)
Source: Export Statistics Scotland
80
85
90
95
100
105
110
2002 2003 2004 2005 2006 2007 2008 2009 2010 2011 2012 2013 2014
Volu
me
Inde
x
Year
39
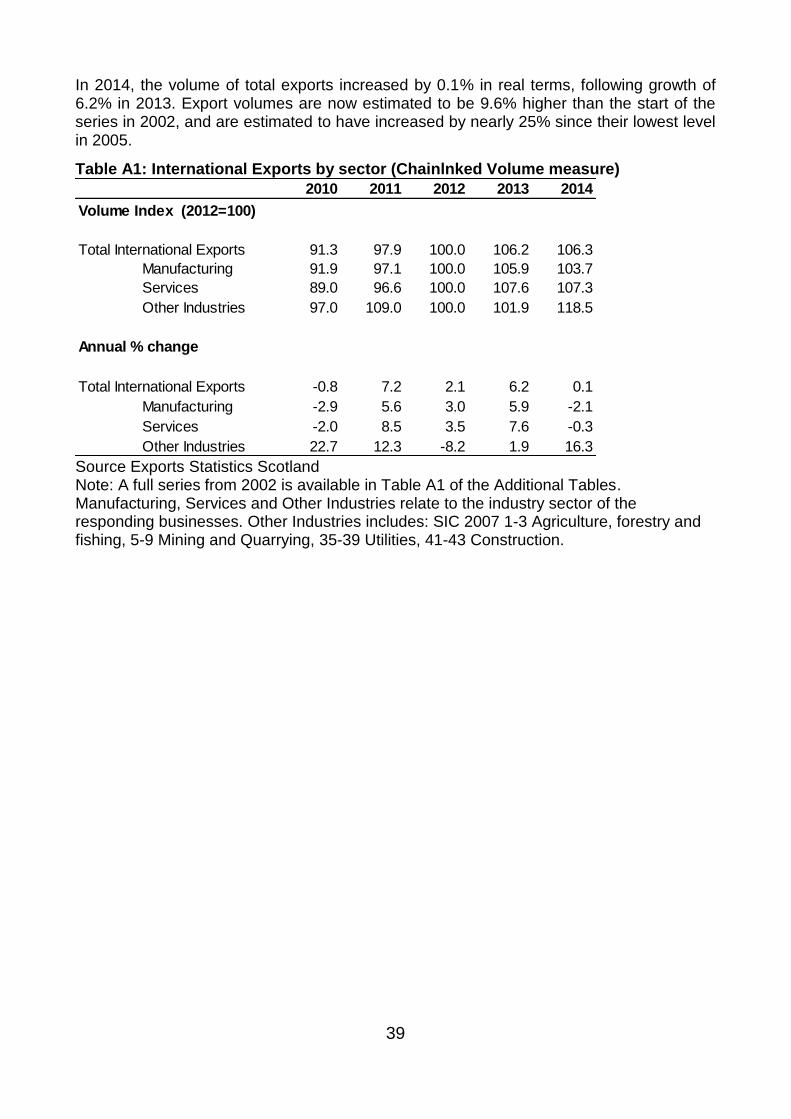
In 2014, the volume of total exports increased by 0.1% in real terms, following growth of 6.2% in 2013. Export volumes are now estimated to be 9.6% higher than the start of the series in 2002, and are estimated to have increased by nearly 25% since their lowest level in 2005.
Table A1: International Exports by sector (Chainlnked Volume measure)
Source Exports Statistics Scotland Note: A full series from 2002 is available in Table A1 of the Additional Tables. Manufacturing, Services and Other Industries relate to the industry sector of the responding businesses. Other Industries includes: SIC 2007 1-3 Agriculture, forestry and fishing, 5-9 Mining and Quarrying, 35-39 Utilities, 41-43 Construction.
2010 2011 2012 2013 2014
Total International Exports 91.3 97.9 100.0 106.2 106.3
Manufacturing 91.9 97.1 100.0 105.9 103.7
Services 89.0 96.6 100.0 107.6 107.3
Other Industries 97.0 109.0 100.0 101.9 118.5
Annual % change
Total International Exports -0.8 7.2 2.1 6.2 0.1
Manufacturing -2.9 5.6 3.0 5.9 -2.1
Services -2.0 8.5 3.5 7.6 -0.3
Other Industries 22.7 12.3 -8.2 1.9 16.3
Volume Index (2012=100)
40
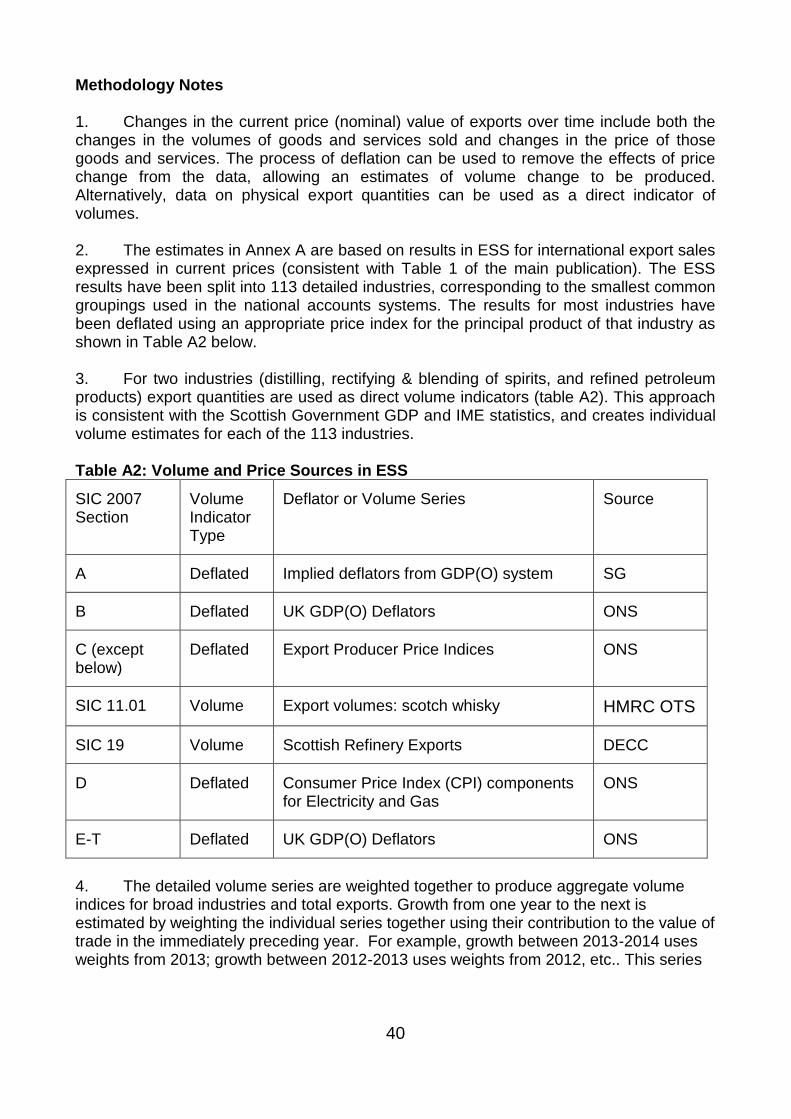
Methodology Notes 1. Changes in the current price (nominal) value of exports over time include both the changes in the volumes of goods and services sold and changes in the price of those goods and services. The process of deflation can be used to remove the effects of price change from the data, allowing an estimates of volume change to be produced. Alternatively, data on physical export quantities can be used as a direct indicator of volumes. 2. The estimates in Annex A are based on results in ESS for international export sales expressed in current prices (consistent with Table 1 of the main publication). The ESS results have been split into 113 detailed industries, corresponding to the smallest common groupings used in the national accounts systems. The results for most industries have been deflated using an appropriate price index for the principal product of that industry as shown in Table A2 below. 3. For two industries (distilling, rectifying & blending of spirits, and refined petroleum products) export quantities are used as direct volume indicators (table A2). This approach is consistent with the Scottish Government GDP and IME statistics, and creates individual volume estimates for each of the 113 industries. Table A2: Volume and Price Sources in ESS
SIC 2007 Section
Volume Indicator Type
Deflator or Volume Series Source
A Deflated Implied deflators from GDP(O) system SG
B Deflated UK GDP(O) Deflators ONS
C (except below)
Deflated Export Producer Price Indices
ONS
SIC 11.01 Volume Export volumes: scotch whisky HMRC OTS
SIC 19 Volume Scottish Refinery Exports DECC
D Deflated Consumer Price Index (CPI) components for Electricity and Gas
ONS
E-T Deflated UK GDP(O) Deflators ONS
4. The detailed volume series are weighted together to produce aggregate volume indices for broad industries and total exports. Growth from one year to the next is estimated by weighting the individual series together using their contribution to the value of trade in the immediately preceding year. For example, growth between 2013-2014 uses weights from 2013; growth between 2012-2013 uses weights from 2012, etc.. This series

41
of annually re-weighted annual growths is then “chain-linked” to produce a continuous series, or chainlinked volume measure (CVM). 5. The reference base year of the published indices has been selected as 2012=100 in common with other economic statistics currently published by the Scottish Government. The choice of base year is presentational only, and does not have any effect on growth rates in the results. Feedback 6. If you have any feedback on the volume statistics, please contact us using the details on page 43 of the main publication.

42
A National Statistics publication for Scotland
The United Kingdom Statistics Authority has designated these statistics as National Statistics, in accordance with the Statistics and Registration Service Act 2007 and signifying compliance with the Code of Practice for Official Statistics. Designation can be interpreted to mean that the statistics: meet identified user needs; are produced, managed and disseminated to high standards; and are explained well.
Correspondence and enquiries
For enquiries about this publication please contact: Gayle Mackie Office of the Chief Economic Advisor Telephone: 0300 244 1432 e-mail: [email protected] For general enquiries about Scottish Government statistics please contact: Office of the Chief Statistician, Telephone: 0131 244 0442, e-mail: [email protected]
How to access background or source data
The data collected for this statistical bulletin may be made available on request, subject to consideration of legal and ethical factors. Please contact [email protected] for further information.
Complaints and suggestions
If you are not satisfied with our service or have any comments or suggestions, please write to the Chief Statistician, 3WR, St Andrews House, Edinburgh, EH1 3DG, Telephone: (0131) 244 0302, e-mail [email protected]. If you would like to be consulted about statistical collections or receive notification of publications, please register your interest at www.gov.scot/scotstat Details of forthcoming publications can be found at www.gov.scot/statistics
Crown Copyright
You may use or re-use this information (not including logos) free of charge in any format or medium, under the terms of the Open Government Licence. See: www.nationalarchives.gov.uk/doc/open-government-licence/