Embed Size (px)
Citation preview
MARKET JUSTIFICATION AND STRATEGIES FOR INDONESIAN AUTOMOTIVE COMPONENT EXPORT PROMOTION
EXPORTING AUTOMOTIVE COMPONENTS GLOBALLY
OCTOBER 2008 – STTA DANN JOHNSON AND STTA YANLI RACHMAN THIS PUBLICATION WAS PRODUCED FOR REVIEW BY THE UNITED STATES AGENCY FOR INTERNATIONAL DEVELOPMENT. IT WAS PREPARED BY DAI
EXPORTING AUTOMOTIVE COMPONENTS GLOBALLY MARKET JUSTIFICATION AND STRATEGIES FOR INDONESIAN AUTOMOTIVE COMPONENT EXPORT PROMOTION DISCLAIMER THE AUTHOR’S VIEWS EXPRESSED IN THIS PUBLICATION DO NOT NECESSARILY REFLECT THE VIEWS OF THE UNITED STATES AGENCY FOR INTERNATIONAL DEVELOPMENT OR THE UNITED STATES GOVERNMENT.
ACKNOWLEDGMENTS This publication was made possible through support provided by the United States Agency for International Development (USAID). The authors wish to express their sincere gratitude to the representatives of business development service (BDS) providers, industry associations, firms, government agencies and other donor organizations that have been supportive in providing us their insight about the automotive component sector and different models and methods used for entering the export market and upgrading core suppliers in the automotive component value chain. This report serves as a product deliverable of the Export Promotion Market Analysis (August - October 2007) completed by SENADA with the assistance of the short-term technical consultant (STTA) Dr. Dann R. Johnson and Yanli Rachman (STTA – Indonesian).
Authors: Dann R. Johnson (Independent Consultant) Yanli Rachman (Independent Consultant)
Other Contributors: Kusnadi Subrata (SENADA Industry Advisor) Widi Budi Prasodjo (SENADA Industry Advisor)
ACRONYMS AND ABBREVIATIONS
AFTA ASEAN Free Trade Area
AISI Indonesian Motorcycle Industry Association
ASEAN Association of Southeast Asian Nations
EPA Economic Partnership Agreement
FDI Foreign direct investment
FMVSS Federal Motor Vehicle Safety Standards
FMCSA Federal Motor Carrier Safety Administration
FTA Free Trade Agreement
FTZ Free Trade Zone
FHWA Federal Highway Administration
GIAMM Gabungan Industri Alat-alat Mobil and Motor
GNI Greater Nagoya Initiative
GPSC Global Purchasing and Supply Chain
IJ-EPA Indonesia – Japan Economic Partnership Agreement
IMF International Monetary Fund
JAPIA Japan Auto Parts Industries Association
JASO Japan Automotive Standards Organization
JETRO Japanese External Trade Organization
JV Joint Venture
KADIN Chamber of Commerce and Industry
KK Kabushiki Gaisha (Japanese Stock Corporation)
MEMA Motor and Equipment manufacturers Association
METI Ministry of Economy, Trade and Industry
MoT The Ministry of Trade (Indonesia)
OEM Original Equipment Manufacturer
ODFC Okinawa Development Finance Corporation
OICA Organization of International Car Association
RFQ Request for Quotation
SME Small and Medium Enterprises in Japan
T1 Tier One Supplier
T2 Tier Two Supplier
T3 Tier Three Supplier
WOFE Wholly Owned Foreign Enterprise
TABLE OF CONTENTS I. EXECUTIVE SUMMARY................................................................................................................06 II. MARKET OVERVIEW.....................................................................................................................07 2.1 Indonesia’s Automotive Export Market Today ............................................................................................ 07 2.2 Worlds within the World.................................................................................................................................... 11 2.3 Country of Origin Branding .............................................................................................................................. 12 2.4 Exporting Schematic for Indonesian Export Process .................................................................................. 12 2.5 Global Market opportunities ............................................................................................................................. 15 2.6 US, Japan and EU - OEM Opportunity.......................................................................................................... 15 2.7 T1 Opportunities................................................................................................................................................. 16 2.8 T2 and T3 Opportunities ................................................................................................................................... 17 III. APPROACHES TO CAPTURE THE EXPORT MARKET ........................................................ 19 3.1 Why Japan............................................................................................................................................................. 19 3.2 Indonesia Bilateral Trade Agreements by “The Institute for Global Justice............................................. 22 3.3 Japan/ASEAN FTA ........................................................................................................................................... 23 3.4 Challenges in Japan’s Market............................................................................................................................. 24 3.5 Corporate Structures in Japan and the Keiretsu............................................................................................. 25 3.6 WOFE vs. Joint Venture Partnership ............................................................................................................. 31 3.7 Criterion for Acquisition. ................................................................................................................................... 32 3.8 Lead time for formation of Japanese Corporation ........................................................................................ 34 IV. VALUE ADDED UPGRADING .............................................................................................35 4.1 Starting a Corporation in Japan......................................................................................................................... 35 4.2 In-Sourcing ........................................................................................................................................................... 36 4.3 Quality ................................................................................................................................................................... 37 4.4 Superior Part Certification Process - by JAPA ............................................................................................... 37 4.5 “Made in Japan..................................................................................................................................................... 38 V. MODEL 1 – EXPORT PROMOTION MODEL ..........................................................................39 5.1 Sample Road Map to Profitability Financials ................................................................................................. 40 5.2 Choosing a location ........................................................................................................................................... 44 VI. MODEL 2 – AUTOMOTIVE TRADE INFORMATION CENTER...........................................45 6.1 Promotion and Sales .......................................................................................................................................... 45 6.2 Single Sector versus Multi Sectoral Consortia ............................................................................................... 46 6.3 Consortia between Competitors and Non-Competitors ............................................................................. 46 6.4 Regional Consortia ............................................................................................................................................. 46 6.5 Global Consortia ................................................................................................................................................ 47 VII. EXPECTED RESULTS............................................................................................................48 APPENDIXES.....................................................................................................................................49 1. Alternative Models for Indonesian Automotive Component Export Promotion Presentation
6
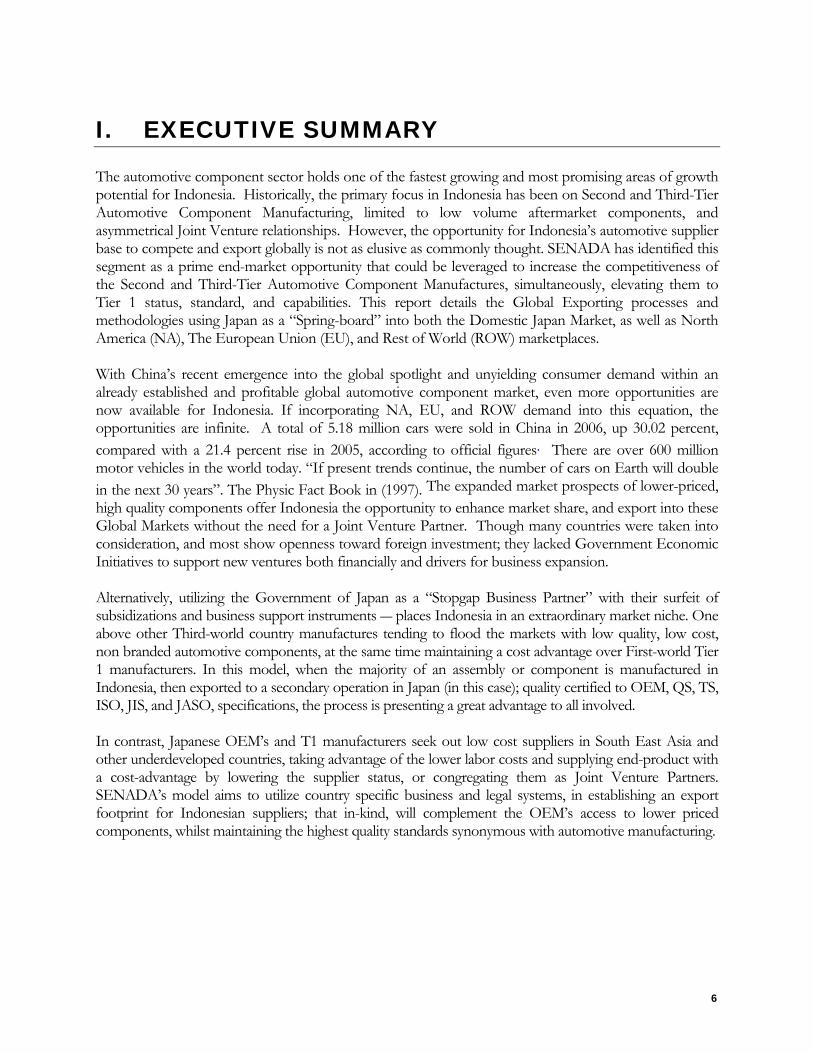
I. EXECUTIVE SUMMARY The automotive component sector holds one of the fastest growing and most promising areas of growth potential for Indonesia. Historically, the primary focus in Indonesia has been on Second and Third-Tier Automotive Component Manufacturing, limited to low volume aftermarket components, and asymmetrical Joint Venture relationships. However, the opportunity for Indonesia’s automotive supplier base to compete and export globally is not as elusive as commonly thought. SENADA has identified this segment as a prime end-market opportunity that could be leveraged to increase the competitiveness of the Second and Third-Tier Automotive Component Manufactures, simultaneously, elevating them to Tier 1 status, standard, and capabilities. This report details the Global Exporting processes and methodologies using Japan as a “Spring-board” into both the Domestic Japan Market, as well as North America (NA), The European Union (EU), and Rest of World (ROW) marketplaces. With China’s recent emergence into the global spotlight and unyielding consumer demand within an already established and profitable global automotive component market, even more opportunities are now available for Indonesia. If incorporating NA, EU, and ROW demand into this equation, the opportunities are infinite. A total of 5.18 million cars were sold in China in 2006, up 30.02 percent, compared with a 21.4 percent rise in 2005, according to official figures. There are over 600 million motor vehicles in the world today. “If present trends continue, the number of cars on Earth will double in the next 30 years”. The Physic Fact Book in (1997). The expanded market prospects of lower-priced, high quality components offer Indonesia the opportunity to enhance market share, and export into these Global Markets without the need for a Joint Venture Partner. Though many countries were taken into consideration, and most show openness toward foreign investment; they lacked Government Economic Initiatives to support new ventures both financially and drivers for business expansion. Alternatively, utilizing the Government of Japan as a “Stopgap Business Partner” with their surfeit of subsidizations and business support instruments ― places Indonesia in an extraordinary market niche. One above other Third-world country manufactures tending to flood the markets with low quality, low cost, non branded automotive components, at the same time maintaining a cost advantage over First-world Tier 1 manufacturers. In this model, when the majority of an assembly or component is manufactured in Indonesia, then exported to a secondary operation in Japan (in this case); quality certified to OEM, QS, TS, ISO, JIS, and JASO, specifications, the process is presenting a great advantage to all involved. In contrast, Japanese OEM’s and T1 manufacturers seek out low cost suppliers in South East Asia and other underdeveloped countries, taking advantage of the lower labor costs and supplying end-product with a cost-advantage by lowering the supplier status, or congregating them as Joint Venture Partners. SENADA’s model aims to utilize country specific business and legal systems, in establishing an export footprint for Indonesian suppliers; that in-kind, will complement the OEM’s access to lower priced components, whilst maintaining the highest quality standards synonymous with automotive manufacturing.
7
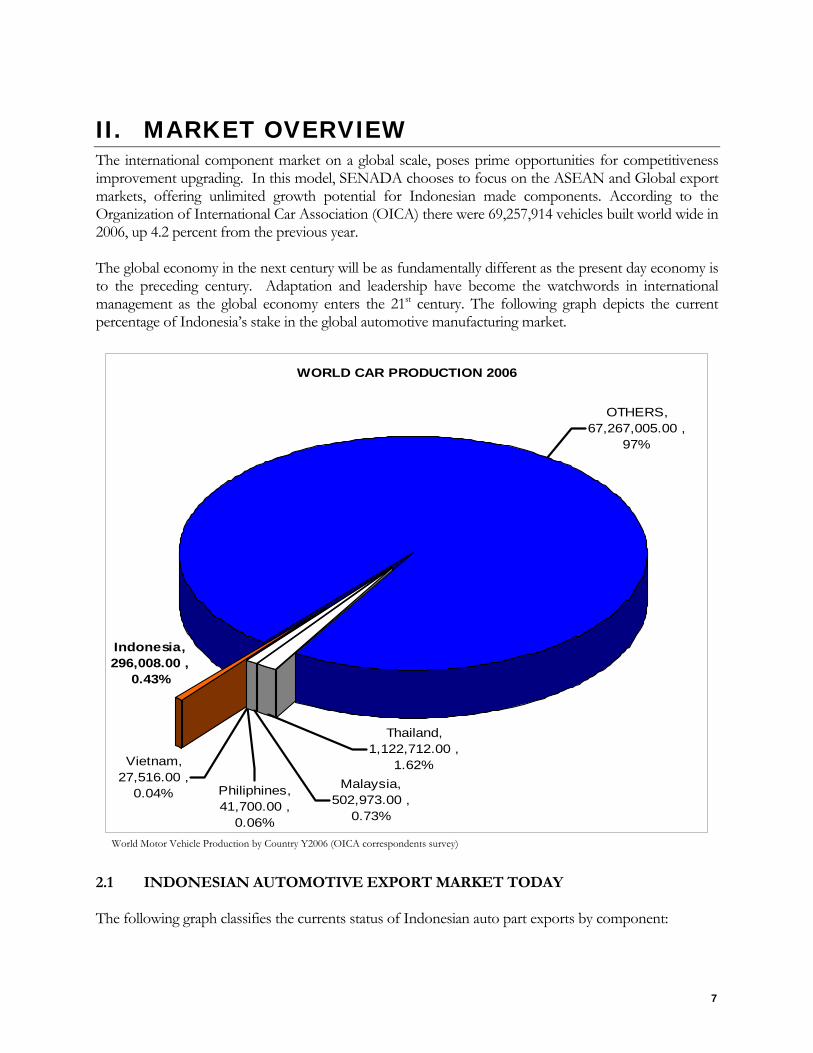
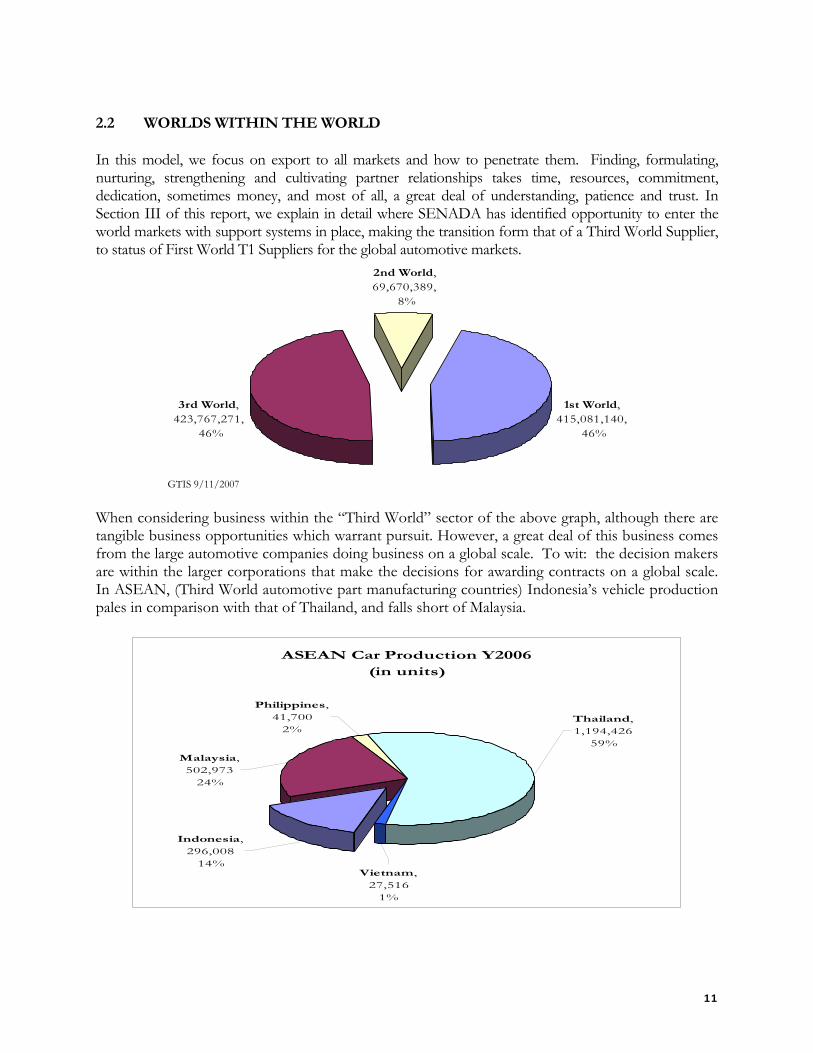
II. MARKET OVERVIEW The international component market on a global scale, poses prime opportunities for competitiveness improvement upgrading. In this model, SENADA chooses to focus on the ASEAN and Global export markets, offering unlimited growth potential for Indonesian made components. According to the Organization of International Car Association (OICA) there were 69,257,914 vehicles built world wide in 2006, up 4.2 percent from the previous year. The global economy in the next century will be as fundamentally different as the present day economy is to the preceding century. Adaptation and leadership have become the watchwords in international management as the global economy enters the 21st century. The following graph depicts the current percentage of Indonesia’s stake in the global automotive manufacturing market.
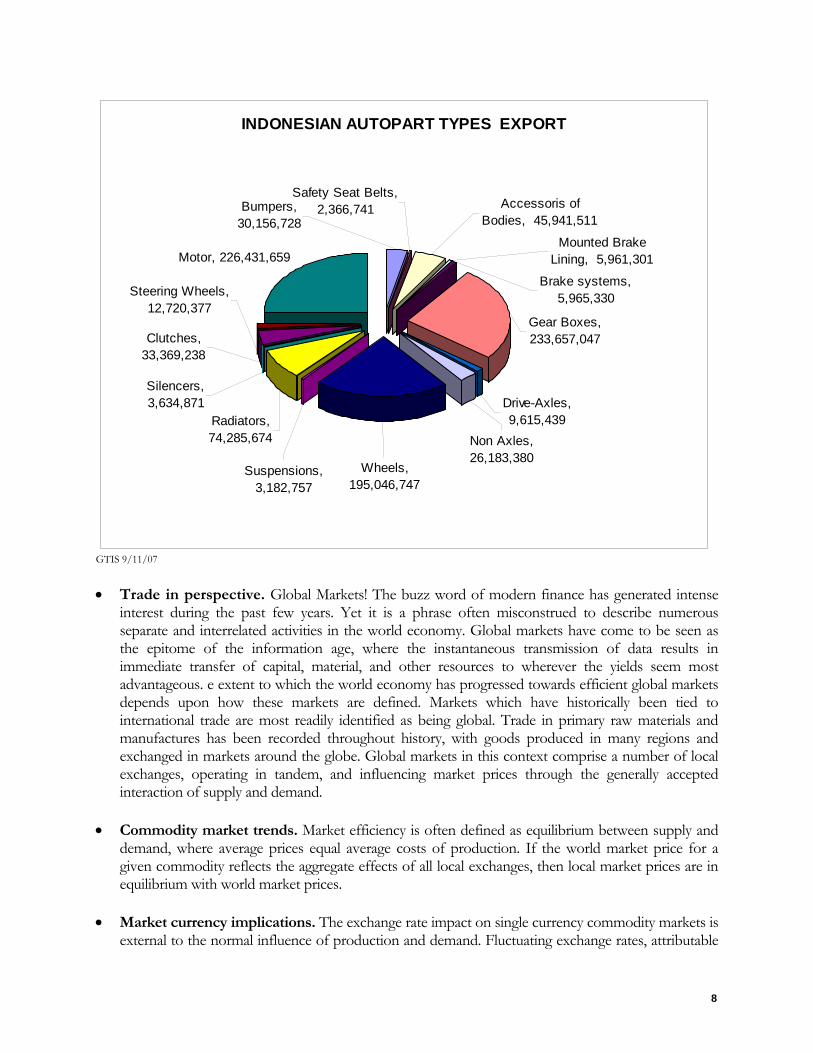
World Motor Vehicle Production by Country Y2006 (OICA correspondents survey) 2.1 INDONESIAN AUTOMOTIVE EXPORT MARKET TODAY The following graph classifies the currents status of Indonesian auto part exports by component:
WORLD CAR PRODUCTION 2006
Thailand, 1,122,712.00 ,
1.62%
Indonesia, 296,008.00 ,
0.43%
Vietnam, 27,516.00 ,
0.04% Philiphines, 41,700.00 ,
0.06%
Malaysia, 502,973.00 ,
0.73%
OTHERS, 67,267,005.00 ,
97%
8
INDONESIAN AUTOPART TYPES EXPORT
Motor, 226,431,659
Wheels, 195,046,747
Silencers, 3,634,871
Steering Wheels, 12,720,377
Clutches, 33,369,238
Radiators, 74,285,674
Suspensions, 3,182,757
Drive-Axles, 9,615,439
Non Axles, 26,183,380
Gear Boxes, 233,657,047
Mounted Brake Lining, 5,961,301
Brake systems, 5,965,330
Accessoris of Bodies, 45,941,511
Safety Seat Belts, 2,366,741 Bumpers,
30,156,728
GTIS 9/11/07 • Trade in perspective. Global Markets! The buzz word of modern finance has generated intense
interest during the past few years. Yet it is a phrase often misconstrued to describe numerous separate and interrelated activities in the world economy. Global markets have come to be seen as the epitome of the information age, where the instantaneous transmission of data results in immediate transfer of capital, material, and other resources to wherever the yields seem most advantageous. e extent to which the world economy has progressed towards efficient global markets depends upon how these markets are defined. Markets which have historically been tied to international trade are most readily identified as being global. Trade in primary raw materials and manufactures has been recorded throughout history, with goods produced in many regions and exchanged in markets around the globe. Global markets in this context comprise a number of local exchanges, operating in tandem, and influencing market prices through the generally accepted interaction of supply and demand.
• Commodity market trends. Market efficiency is often defined as equilibrium between supply and
demand, where average prices equal average costs of production. If the world market price for a given commodity reflects the aggregate effects of all local exchanges, then local market prices are in equilibrium with world market prices.
• Market currency implications. The exchange rate impact on single currency commodity markets is
external to the normal influence of production and demand. Fluctuating exchange rates, attributable
9
to factors those specific to any individual market, introduce an exogenous risk to world trade in these products. Commodities which are denominated in US dollars comprise over 20 percent of total world trade. Not surprisingly, the bulk of this trade (fluctuating around 15 percent of total world trade) is in petroleum and energy products. The comparable proportion to total world trade of these products declined from 5.6 percent to 3.7 percent during the same period, due largely to the rapid expansion in trade of manufactured products. The largest trading volumes for many primary commodities are exchanged in markets established in the United States, where trading occurs for domestic consumption, hedging, speculation, as well as international trade. These exchanges quote commodity prices in US dollars, prices which are widely used as a guideline from which other markets around the globe determine local trading prices. Markets in other nations generally quote commodity prices in local currency, with notable exceptions such as sugar, cotton and petroleum. Local market prices tend to reflect the dollar values converted to local currency for those commodities which are predominantly traded in US markets.
• Equilibrium on a world scale. An efficient global market would by definition reflect the aggregate
demand of all local markets in determining the equilibrium price of a specific commodity. Its correlation with aggregate production would reflect the ability to supply every local market at the prevailing price. Aggregate world supply, however, can be distinguished by two components; namely (a) production for domestic consumption; and, surplus production supplied to the world market. The extent to which a market for a given commodity is considered to be global is determined by the distribution between local and exported production. Roughly 90 percent of total world copper production is exported to the world market, as compared with only 9 percent of maize production. A quarter of cotton production is exported; and both coffee and sugar exports represent around 60 percent of respective production levels. Copper, by this definition, would be considered as highly global while maize would be considered least global. World copper exchanges quote prices in Pound Sterling and US Dollars; maize is generally quoted in US Dollars. Currencies, most notably the US dollar, have been shown to fluctuate widely during short periods. Exchange rate fluctuations are the result of many factors which are rarely related to world trade in dollar denominated commodities. Some local markets depend on international trade in commodities denominated in US Dollars for the majority of their imports and exports. The currency which is used for trading in specific products thus has an appreciable impact on the national balance of payments both for producers and consuming economies. Despite the valuation of many commodities in US Dollars, only a small proportion of world trade in these products involves bilateral exchange with the United States. This phenomenon extends to commodities which are denominated in other currencies. The price observed by local markets shows significant divergence from nominal market prices during periods of exchange rate volatility and results in a spread between nominal market price indices and trade-weighted prices. This spread is not uniform among all commodity markets. Convergence between trade weighted prices and nominal market prices is more significant where there is a greater proportion of international trade in a given commodity relative to total global production. Markets for commodities such as grains and cotton, where the proportion of international trade is lower relative to aggregate world production, show a greater divergence in relative prices due to the greater influence local market demand.
• Market Elasticity. Most commodities have relatively inelastic demand curves, characterized by stable consumption levels and few substitutes. Major importing markets for these products comprise economies which use the commodities in a more diverse range of manufactured goods and capital
10
products. Although primary raw materials are imported by most every local market, irrespective of their stage of industrialization, the major industrialized economies continue to represent the greatest demand for these products. Variations in the market price for these products therefore have less impact on aggregate consumption levels. Their markets exhibit a higher degree of globalization, where a large proportion of total production is exported to the world economy. As such, the value of commodity imports into consuming markets represents a smaller proportion of total imports. Price fluctuations relating to the commodity imports have a less significant impact on the diversified importing economy than for the exporters which have greater reliance on fewer products as revenue sources. Paradoxically, industrialized economies also exhibit a comparatively high income elasticity for imports, which applies to commodities as well as to manufactured goods. Discretionary trade in all goods increases as local income levels rise. The implications of world market trading in primary commodities clearly go beyond the relation of price to volume. Rapid increases in trade of manufactured products increases demand for primary raw materials. As more local economies shift towards the export of manufactured goods, the dependence on exports of single currency trading diminishes. Diversification of production by economies, which formerly depended on a few primary exports, results is a generalized increase in the world demand for the original commodity products. Nowadays business expansion more often than not involves going international or “going-global”. This is true both for the small sole trader who may be selling a highly unique and individual product right up to the Automotive OEM. Going global offers access to thousands (even millions) of more customers and therefore revenue. However, a lot of companies are now jumping onto the global stage but without considering the many challenges they will meet. The international market prospects available to Indonesian automotive suppliers hold enormous potential for profitability. However, many of these suppliers are hindered entering the global market for different reasons, e.g., lack of funding, knowledge, exposure, contacts, etc… Those that have, often find themselves locked into an asymmetrical Joint Venture situation that more times than not, turns out to be far less profitable than an established footprint in the same markets on their own accord. Opportunities within the global 3rd world supplier base also offer an avenue for business and profit increase, but at a much smaller scale than that of Global Exports. When considering the omnipresent amount of competition from other underdeveloped countries, this ideology falls more under the rubric of “Race to the Bottom”, than a “race to go global”. A Wholly Owned Foreign Enterprise (WOFE) in any local is the best case scenario and holds more potential for success and profitability than that of a Joint Venture (JV) as well. In this report, we explain how to expand the Indonesian companies into Japan harnessing Japan’s own Government Subsidies and legal system - allowing the “Parent” Indonesian company to become a member company of the Japanese Business Community – without need for Joint Venture dependency. Japanese OEM’s, more so than others, vie keep their work in-house or in a containable setting where they can maintain a level of control in regards to Manufacturing, Quality and Product Development activities. In 1998 Japan produced 8,056,000 cars, and in 2006 11,484,233. USA, Japan, Germany, and Indonesia Vehicle Production Y2006 (OICA correspondents survey) shows us the huge capacity of work available in first world countries - under favorable circumstance. Cost and quality, and being the most important to the OEM customer base.
11
2.2 WORLDS WITHIN THE WORLD
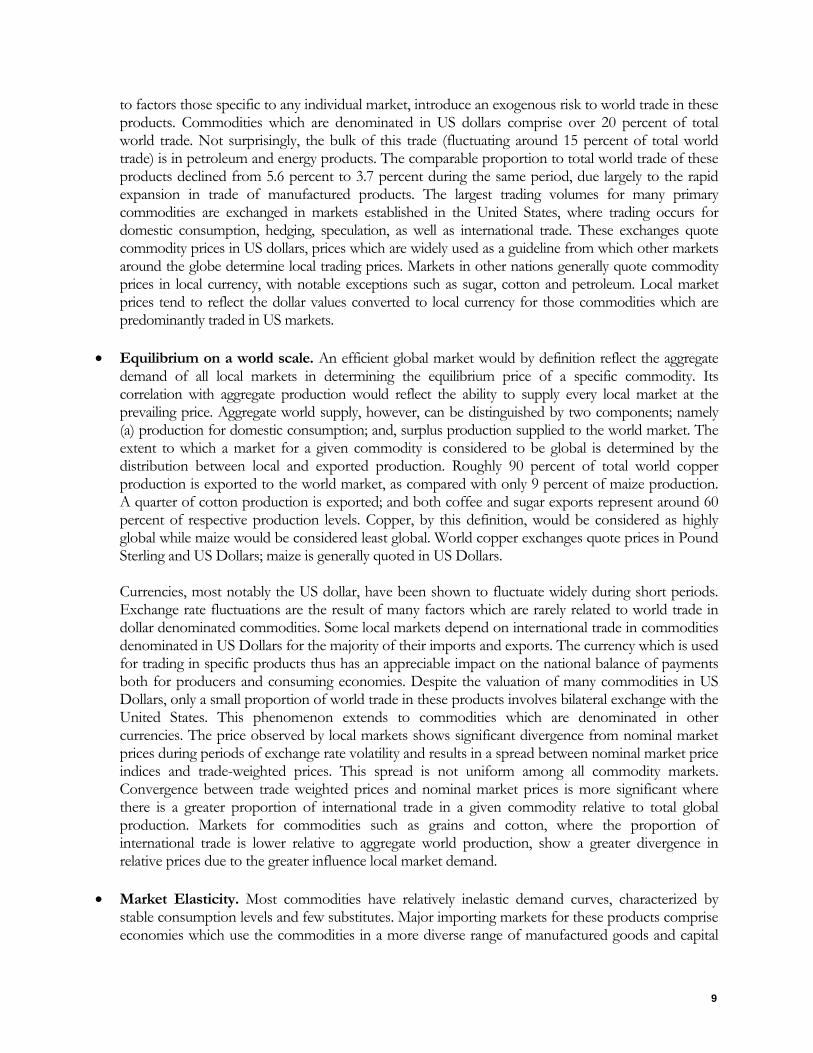
In this model, we focus on export to all markets and how to penetrate them. Finding, formulating, nurturing, strengthening and cultivating partner relationships takes time, resources, commitment, dedication, sometimes money, and most of all, a great deal of understanding, patience and trust. In Section III of this report, we explain in detail where SENADA has identified opportunity to enter the world markets with support systems in place, making the transition form that of a Third World Supplier, to status of First World T1 Suppliers for the global automotive markets.
3rd World, 423,767,271,
46%
1st World, 415,081,140,
46%
2nd World, 69,670,389,
8%
GTIS 9/11/2007
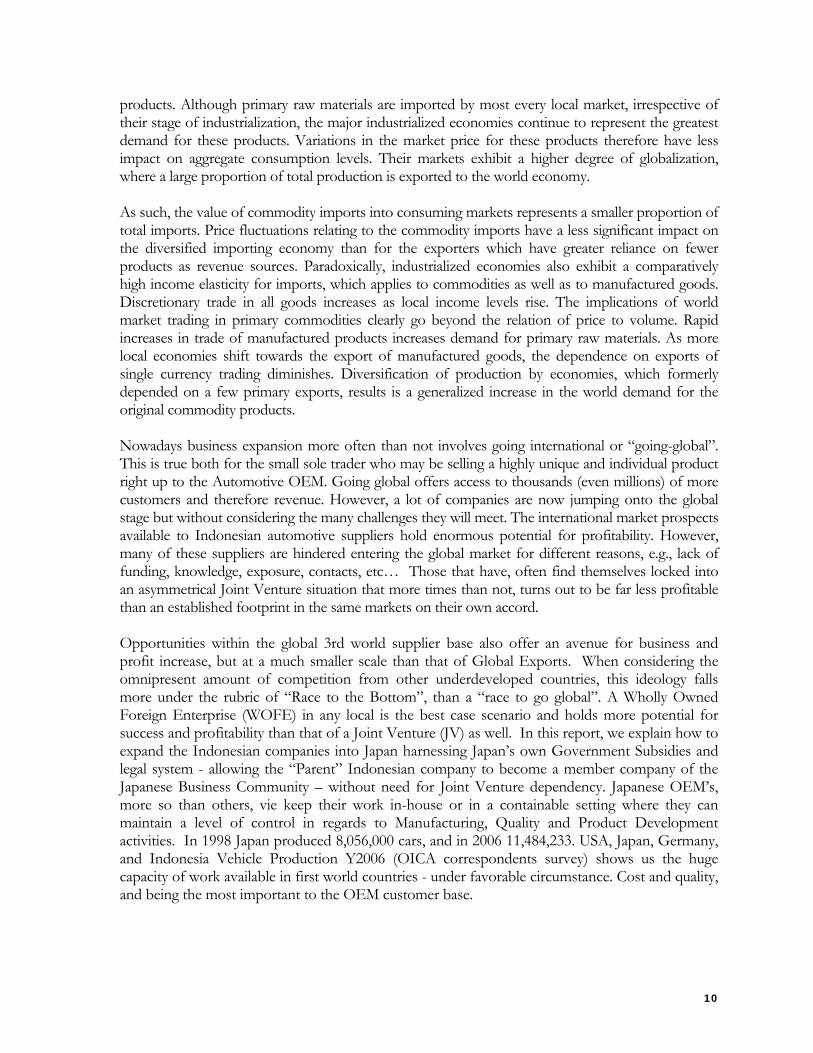
When considering business within the “Third World” sector of the above graph, although there are tangible business opportunities which warrant pursuit. However, a great deal of this business comes from the large automotive companies doing business on a global scale. To wit: the decision makers are within the larger corporations that make the decisions for awarding contracts on a global scale. In ASEAN, (Third World automotive part manufacturing countries) Indonesia’s vehicle production pales in comparison with that of Thailand, and falls short of Malaysia.
ASEAN Car Production Y2006(in units)
Philippines, 41,700
2%
Malaysia, 502,973
24%
Indonesia, 296,008
14%Vietnam,
27,5161%
Thailand, 1,194,426
59%
12
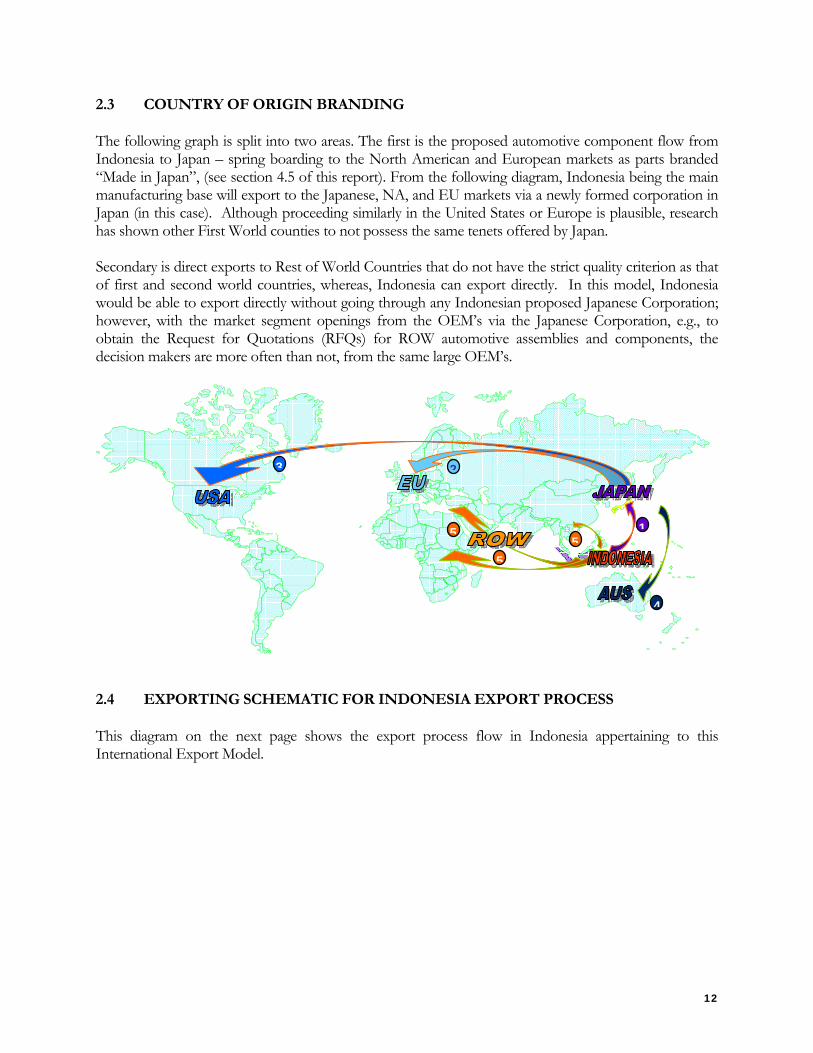
2.3 COUNTRY OF ORIGIN BRANDING
The following graph is split into two areas. The first is the proposed automotive component flow from Indonesia to Japan – spring boarding to the North American and European markets as parts branded “Made in Japan”, (see section 4.5 of this report). From the following diagram, Indonesia being the main manufacturing base will export to the Japanese, NA, and EU markets via a newly formed corporation in Japan (in this case). Although proceeding similarly in the United States or Europe is plausible, research has shown other First World counties to not possess the same tenets offered by Japan. Secondary is direct exports to Rest of World Countries that do not have the strict quality criterion as that of first and second world countries, whereas, Indonesia can export directly. In this model, Indonesia would be able to export directly without going through any Indonesian proposed Japanese Corporation; however, with the market segment openings from the OEM’s via the Japanese Corporation, e.g., to obtain the Request for Quotations (RFQs) for ROW automotive assemblies and components, the decision makers are more often than not, from the same large OEM’s.
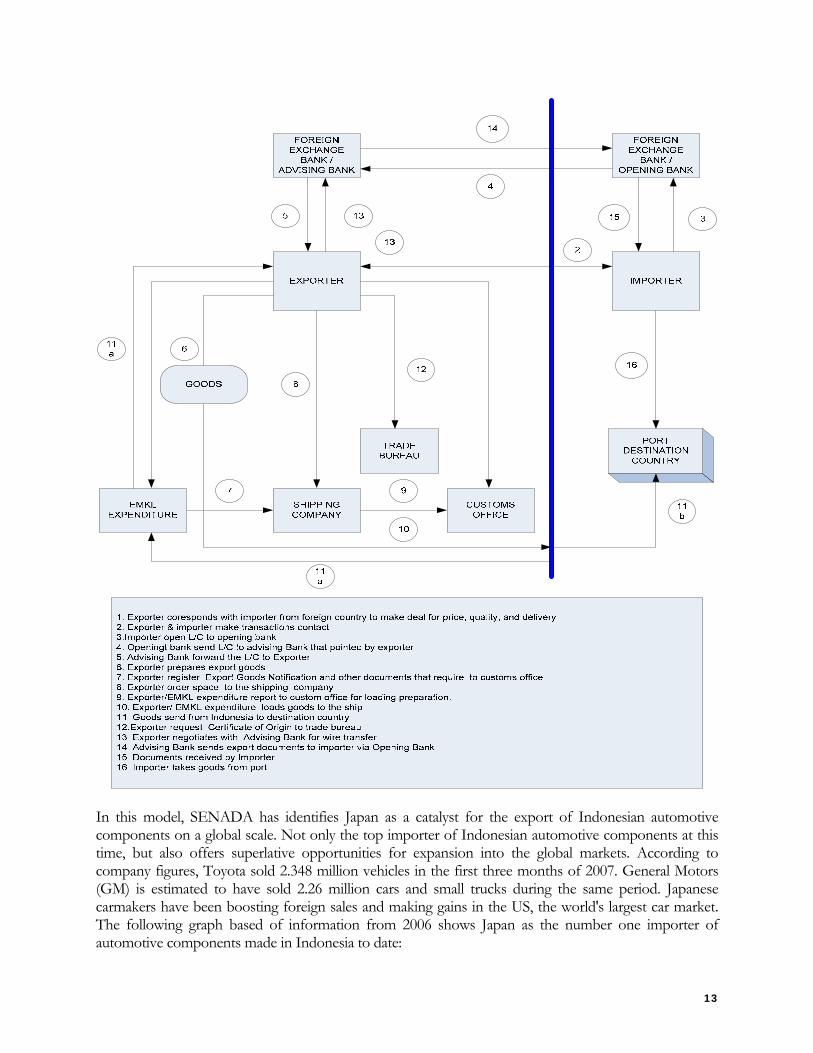
2.4 EXPORTING SCHEMATIC FOR INDONESIA EXPORT PROCESS
This diagram on the next page shows the export process flow in Indonesia appertaining to this International Export Model.
1
23
5
55
4
13
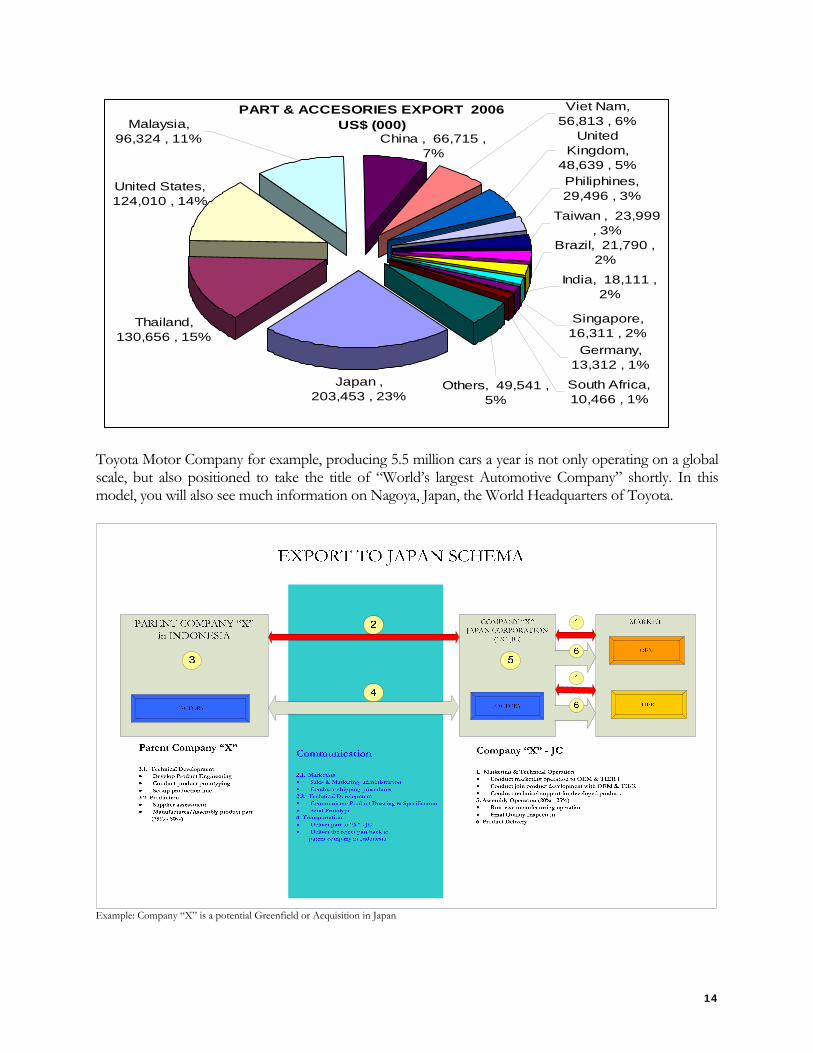
In this model, SENADA has identifies Japan as a catalyst for the export of Indonesian automotive components on a global scale. Not only the top importer of Indonesian automotive components at this time, but also offers superlative opportunities for expansion into the global markets. According to company figures, Toyota sold 2.348 million vehicles in the first three months of 2007. General Motors (GM) is estimated to have sold 2.26 million cars and small trucks during the same period. Japanese carmakers have been boosting foreign sales and making gains in the US, the world's largest car market. The following graph based of information from 2006 shows Japan as the number one importer of automotive components made in Indonesia to date:
14
PART & ACCESORIES EXPORT 2006 US$ (000)
Japan , 203,453 , 23%
Thailand, 130,656 , 15%
United States, 124,010 , 14%
Viet Nam, 56,813 , 6%
China , 66,715 , 7%
Malaysia, 96,324 , 11%
India, 18,111 , 2%
Singapore, 16,311 , 2%
Germany, 13,312 , 1%
South Africa, 10,466 , 1%
Others, 49,541 , 5%
Brazil, 21,790 , 2%
Taiwan , 23,999 , 3%
Philiphines, 29,496 , 3%
United Kingdom,
48,639 , 5%
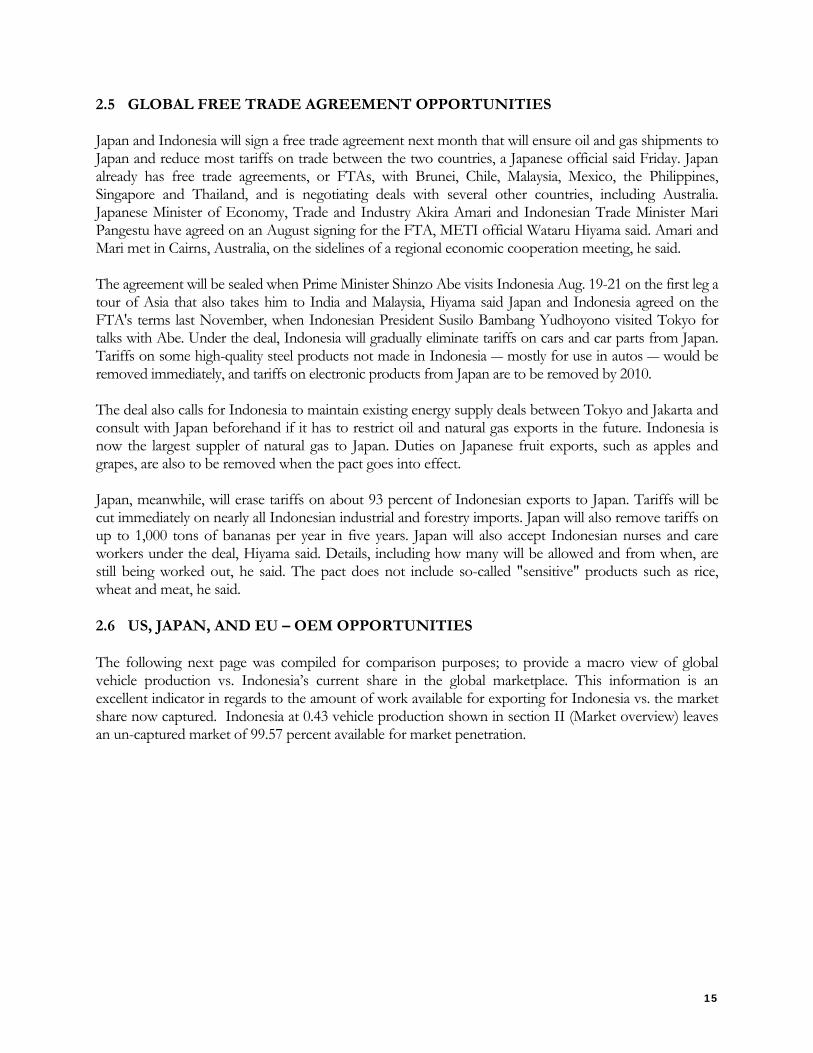
Toyota Motor Company for example, producing 5.5 million cars a year is not only operating on a global scale, but also positioned to take the title of “World’s largest Automotive Company” shortly. In this model, you will also see much information on Nagoya, Japan, the World Headquarters of Toyota.
Example: Company “X” is a potential Greenfield or Acquisition in Japan
15
2.5 GLOBAL FREE TRADE AGREEMENT OPPORTUNITIES Japan and Indonesia will sign a free trade agreement next month that will ensure oil and gas shipments to Japan and reduce most tariffs on trade between the two countries, a Japanese official said Friday. Japan already has free trade agreements, or FTAs, with Brunei, Chile, Malaysia, Mexico, the Philippines, Singapore and Thailand, and is negotiating deals with several other countries, including Australia. Japanese Minister of Economy, Trade and Industry Akira Amari and Indonesian Trade Minister Mari Pangestu have agreed on an August signing for the FTA, METI official Wataru Hiyama said. Amari and Mari met in Cairns, Australia, on the sidelines of a regional economic cooperation meeting, he said. The agreement will be sealed when Prime Minister Shinzo Abe visits Indonesia Aug. 19-21 on the first leg a tour of Asia that also takes him to India and Malaysia, Hiyama said Japan and Indonesia agreed on the FTA's terms last November, when Indonesian President Susilo Bambang Yudhoyono visited Tokyo for talks with Abe. Under the deal, Indonesia will gradually eliminate tariffs on cars and car parts from Japan. Tariffs on some high-quality steel products not made in Indonesia ― mostly for use in autos ― would be removed immediately, and tariffs on electronic products from Japan are to be removed by 2010. The deal also calls for Indonesia to maintain existing energy supply deals between Tokyo and Jakarta and consult with Japan beforehand if it has to restrict oil and natural gas exports in the future. Indonesia is now the largest suppler of natural gas to Japan. Duties on Japanese fruit exports, such as apples and grapes, are also to be removed when the pact goes into effect. Japan, meanwhile, will erase tariffs on about 93 percent of Indonesian exports to Japan. Tariffs will be cut immediately on nearly all Indonesian industrial and forestry imports. Japan will also remove tariffs on up to 1,000 tons of bananas per year in five years. Japan will also accept Indonesian nurses and care workers under the deal, Hiyama said. Details, including how many will be allowed and from when, are still being worked out, he said. The pact does not include so-called "sensitive" products such as rice, wheat and meat, he said.
2.6 US, JAPAN, AND EU – OEM OPPORTUNITIES
The following next page was compiled for comparison purposes; to provide a macro view of global vehicle production vs. Indonesia’s current share in the global marketplace. This information is an excellent indicator in regards to the amount of work available for exporting for Indonesia vs. the market share now captured. Indonesia at 0.43 vehicle production shown in section II (Market overview) leaves an un-captured market of 99.57 percent available for market penetration.
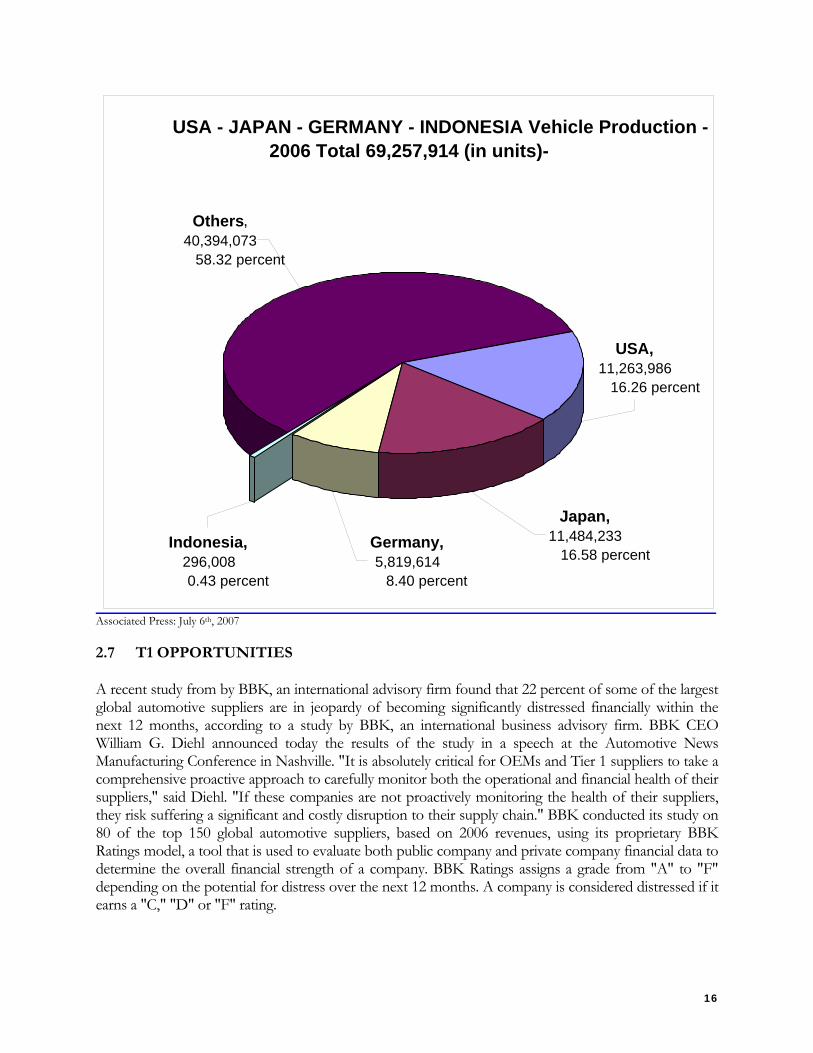
16
Associated Press: July 6th, 2007
2.7 T1 OPPORTUNITIES
A recent study from by BBK, an international advisory firm found that 22 percent of some of the largest global automotive suppliers are in jeopardy of becoming significantly distressed financially within the next 12 months, according to a study by BBK, an international business advisory firm. BBK CEO William G. Diehl announced today the results of the study in a speech at the Automotive News Manufacturing Conference in Nashville. "It is absolutely critical for OEMs and Tier 1 suppliers to take a comprehensive proactive approach to carefully monitor both the operational and financial health of their suppliers," said Diehl. "If these companies are not proactively monitoring the health of their suppliers, they risk suffering a significant and costly disruption to their supply chain." BBK conducted its study on 80 of the top 150 global automotive suppliers, based on 2006 revenues, using its proprietary BBK Ratings model, a tool that is used to evaluate both public company and private company financial data to determine the overall financial strength of a company. BBK Ratings assigns a grade from "A" to "F" depending on the potential for distress over the next 12 months. A company is considered distressed if it earns a "C," "D" or "F" rating.
USA - JAPAN - GERMANY - INDONESIA Vehicle Production -2006 Total 69,257,914 (in units)-
Indonesia,296,0080.43 percent
Germany,5,819,614
8.40 percent
Japan, 11,484,233
16.58 percent
USA, 11,263,986
16.26 percent
Others,40,394,073
58.32 percent
17
Approximately 33 percent of North American suppliers in the study were at various levels of financial distress including 11 companies that received an "F" rating. Asian suppliers were the healthiest with zero companies in distress while 14 percent of European suppliers were distressed. The average rating for Asian suppliers was "A," followed by European suppliers at "B+" and North American suppliers at "B-." Since BBK's first Ratings study for fiscal year 2002, the number of "A" and "F" ratings have increased, indicating that there is little "middle ground" in the industry - suppliers are either healthy or severely distressed. "Over the next few years, consolidation of the supply base will allow suppliers to leverage economies of scale and drive costs down," said Diehl. "The suppliers who find the right balance between outsourcing to lower-cost countries and looking for cost-effective ways to improve efficiency will be well poised for a healthy and sustainable future."
The study also revealed how highly leveraged North American suppliers when compared with their Asian and European counterparts, which makes them vulnerable to financial distress during adverse economic conditions. The average leverage ratio for North American suppliers was 3.46, which is 10 times higher than Asia's (0.32) and six times higher than Europe's (0.6). "Although North American suppliers had a high leverage ratio in 2006, they made great strides to improve it by 31 percent from 2005 when their average was 5.03," said Diehl. In addition, 55 percent of the North American suppliers in the study had revenues that were at least 80 percent automotive-based compared to 43 percent for European suppliers and 41 percent for Asian suppliers.
The average rating for suppliers that had revenues that were at least 80 percent automotive-based was "B-" while the average rating for a supplier that had revenues that were 50 percent or less automotive-based was "A-." "BBK Ratings provides our clients with a complete picture of their suppliers' health," said Diehl. "An auto manufacturer may be receiving quality components on time from a particular supplier, but that manufacturer may not be aware that the supplier is failing to meet its deliverables for another customer, which could eventually have a negative impact on all of its customers.” That’s why OEMs and Tier 1 suppliers need to have a proactive monitoring process to find those hidden weaknesses and take corrective actions before it's too late," said Diehl. This posses the question as to what this has to do with do with Indonesia’s expansion into the global markets? The answer is many fold, but with this globalization distress burden being carried from the top T1 automotive suppliers – the opportunity for future Alliances is omnipresent. Alliances, for Indonesia T1 and T2 companies with a North American, EU, and Japanese Tier 1 suppliers. These Alliances can be mutually rewarding from a cost vantage point, as well as a transfer of technology. If in the event of just “Outsourcing” by the large T1’s suppliers, the benefits are restricted to low cost, low quality components.
2.8 T2 AND T3 OPPORTUNITIES In more cases that not, T2 and T3 support the T1 suppliers to supply the OEM’s for end user vehicles. In the United States, in the case of General Motors, Chrysler and Ford Motor companies, T2 and T3 suppliers fall under a more diverse geopolitical rubric than one of corporate capability. Geopolitics, being the study that analyzes geography, history and social science with reference to spatial politics and patterns at various scales (ranging from home, city, region, state to international and cosmopolites). It examines the political, economic and strategic significance of geography, where geography is defined in terms of the location, size, function, and relationships of places and resources.
In December 1993, General Motors, Chrysler and Ford recognized the need to include our Tier 1 supplier community in the common enterprise supply chain as it applies to opportunities for diverse
18
suppliers. A diverse supplier is a company within the United States, whose majority ownership is held by an individual or group certified as minority by the National Minority Supplier Development Council (NMSDC) or woman-owned (effective 2007) by the Women’s Business Enterprise National Council. The General Motors North America Supplier Diversity Program is similar in concept to the local content requirements of other General Motors regions.
General Motors' policy is to assist minorities and women to achieve economic equality by fostering and encouraging diverse enterprises. An effective means of accomplishing this objective is through the placement of business with diverse suppliers of goods and services. Implementation of this policy shall be effected by the following:
• Identify and purchase goods and services from qualified minority and woman-owned suppliers. Temporary exemptions from the application of customary supplier selection criteria may be permitted by Global Purchasing and Supply Chain (GPSC) in order to accomplish this objective.
• Establish realistic objectives to attain greater minority supplier participation and monitor progress towards these objectives.
• Provide managerial and technical assistance when needed or where the minority company exhibits significant growth potential.
While the responsibility for successful implementation of this policy lies primarily with GPSC, all other divisional, group and staff activities will support GPSC and participate, as appropriate.
Today, because we are customer focused, General Motors clearly understands the demands of our market and our customers. A number of joint ventures and strategic alliances have developed as a result of introductions of major Tier 1 suppliers to diverse suppliers. This direction is strongly supported by our vice president and executive director over GPSC. Our philosophy is this: the more dollars we spend with diverse groups, the more able they will be to buy from us, and the demographics tell us that diverse groups are going to be in the majority in the very near future. General Motors views the issues of buying goods and services from competitive diverse suppliers and the Tier 1 / Tier 2 initiative as good business sense. As we move toward more systems procurement and the elimination of smaller suppliers, it has become increasingly important to retain diverse suppliers in the supply chain. Looking to the near future, supplier relations demand greater cooperation. General Motors has set very aggressive goals for the next few years.
While we emphasize participation in Tier 1 / Tier 2 relationships, General Motors strongly encouraged all suppliers to also explore the creation of strategic alliances as majority shareholders with diverse venture partners. This strategy will ensure that General Motors will achieve its goal of maintaining a minimum of 10 percent diverse supplier participation at the Tier 1 level. Later in SENADA’s model, you will see the Road Map to bring the Indonesian T2 and T3 suppliers to T1 status ― with the incorporation of a WOFE company in Japan.
19
III. APPROACHES TO CAPTURE EXPORT MARKET
3.1 WHY JAPAN?
Notwithstanding the premium subsidizing Japan provides for SME’s the economy is 73.6 percent free, according to our 2007 assessment, which makes it the world's 18th freest economy. Whereas the United States is rated the 4th freest economy, however, the United States offers none of the financial support instruments subsidized by Japan for Japanese Corporations. Japans overall score is 1 percentage point lower than last year, partially reflecting new methodological detail. Japan is ranked 5th out of 30 countries in the Asia–Pacific region, and its overall score is much higher than the regional average.
Japan also enjoys high levels of trade freedom, property rights, business freedom, and freedom from corruption, fiscal freedom, labor freedom, and monetary freedom. The average tariff rate is low, and business regulation is efficient. Virtually all commercial operations are simple and transparent. A very modest, stable deflation in prices has been occurring. Taxes are fairly high, and overall tax revenue is moderate as a percentage of GDP. Contracts in Japan are often imprecise, which can impede smooth judicial handling of commercial disputes. Despite the confusion, contract agreements are highly respected by the judiciary. There is very little corruption in the civil service. Japan is weaker in freedom from government and financial freedom. Total government spending equals more than a third of GDP. The financial sector is wholly modern and developed, but it is also subject to strong government influence and host to a variety of legal restrictions on capital.
• Background. Japan is one of the world's most developed countries. After World War II, it achieved rapid economic growth by pursuing an aggressive export-oriented economic policy, but high levels of protectionism left the country vulnerable. The economy experienced a severe recession in the early 1990s and stagnated for the rest of the decade. Long-term challenges include an immense government debt equaling 170 percent of GDP, a rapidly aging population combined with low birth rates, and the economic dominance of large corporations. Prime Minister Junichiro Koizumi initiated structural reforms, such as privatization of the postal system and banking and financial reforms, but results remain largely unrealized.
• Business Freedom. Starting a business takes an average of 23 days, compared to the world average of 48 days. Obtaining a business license is relatively simple, and closing a business is easy. The government has undertaken much-needed reform measures to ensure greater regulatory transparency. The overall freedom to start, operate, and close a business is strongly protected by the national regulatory environment.
• Trade Freedom. Japan's weighted average tariff rate was 2.4 percent in 2004. Non-transparent regulations, import restrictions, import bans, restrictive sanitary and phytosanitary rules, services and agricultural market access barriers, agriculture and other subsidies, a non-transparent tariff rate quota system, and an inefficient customs process add to the cost of trade. Consequently, an additional 20 percent is deducted from Japan's trade freedom score to account for these non-tariff barriers.
• Fiscal Freedom. Japan has a high income tax rate and a burdensome corporate tax rate. The top income tax rate is 37 percent, and the top corporate tax rate is 30 percent. Other taxes include a
20
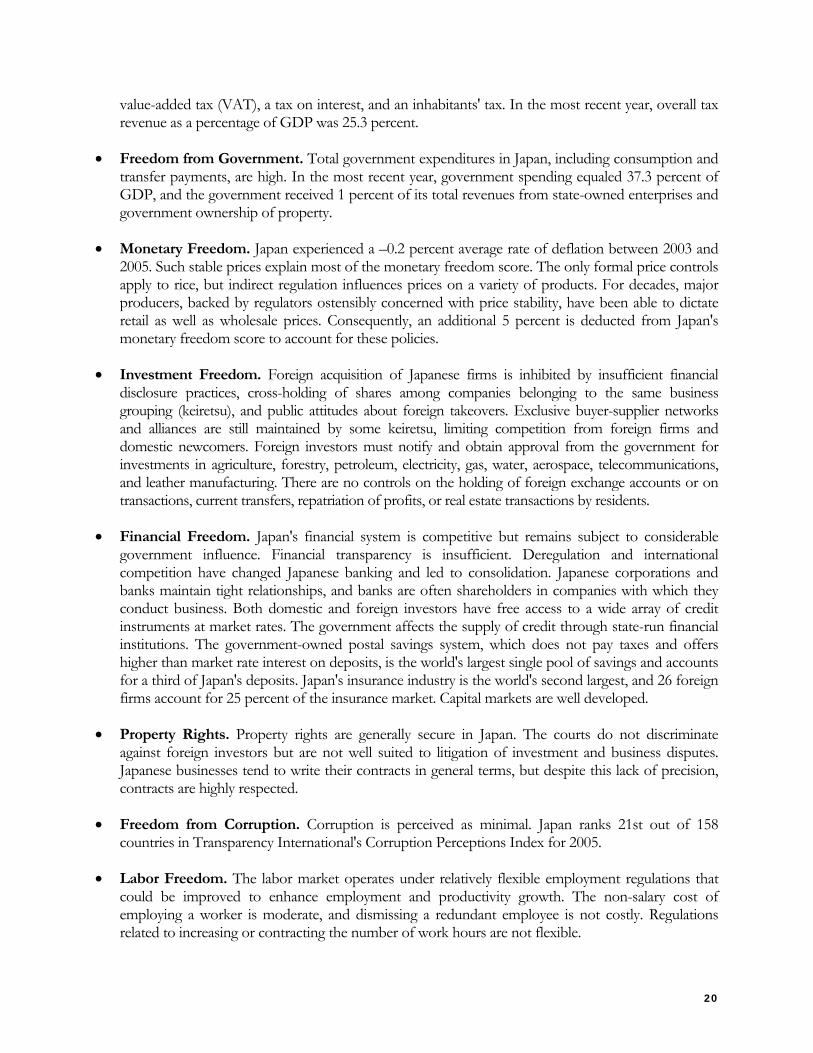
value-added tax (VAT), a tax on interest, and an inhabitants' tax. In the most recent year, overall tax revenue as a percentage of GDP was 25.3 percent.
• Freedom from Government. Total government expenditures in Japan, including consumption and transfer payments, are high. In the most recent year, government spending equaled 37.3 percent of GDP, and the government received 1 percent of its total revenues from state-owned enterprises and government ownership of property.
• Monetary Freedom. Japan experienced a –0.2 percent average rate of deflation between 2003 and 2005. Such stable prices explain most of the monetary freedom score. The only formal price controls apply to rice, but indirect regulation influences prices on a variety of products. For decades, major producers, backed by regulators ostensibly concerned with price stability, have been able to dictate retail as well as wholesale prices. Consequently, an additional 5 percent is deducted from Japan's monetary freedom score to account for these policies.
• Investment Freedom. Foreign acquisition of Japanese firms is inhibited by insufficient financial disclosure practices, cross-holding of shares among companies belonging to the same business grouping (keiretsu), and public attitudes about foreign takeovers. Exclusive buyer-supplier networks and alliances are still maintained by some keiretsu, limiting competition from foreign firms and domestic newcomers. Foreign investors must notify and obtain approval from the government for investments in agriculture, forestry, petroleum, electricity, gas, water, aerospace, telecommunications, and leather manufacturing. There are no controls on the holding of foreign exchange accounts or on transactions, current transfers, repatriation of profits, or real estate transactions by residents.
• Financial Freedom. Japan's financial system is competitive but remains subject to considerable government influence. Financial transparency is insufficient. Deregulation and international competition have changed Japanese banking and led to consolidation. Japanese corporations and banks maintain tight relationships, and banks are often shareholders in companies with which they conduct business. Both domestic and foreign investors have free access to a wide array of credit instruments at market rates. The government affects the supply of credit through state-run financial institutions. The government-owned postal savings system, which does not pay taxes and offers higher than market rate interest on deposits, is the world's largest single pool of savings and accounts for a third of Japan's deposits. Japan's insurance industry is the world's second largest, and 26 foreign firms account for 25 percent of the insurance market. Capital markets are well developed.
• Property Rights. Property rights are generally secure in Japan. The courts do not discriminate against foreign investors but are not well suited to litigation of investment and business disputes. Japanese businesses tend to write their contracts in general terms, but despite this lack of precision, contracts are highly respected.
• Freedom from Corruption. Corruption is perceived as minimal. Japan ranks 21st out of 158 countries in Transparency International's Corruption Perceptions Index for 2005.
• Labor Freedom. The labor market operates under relatively flexible employment regulations that could be improved to enhance employment and productivity growth. The non-salary cost of employing a worker is moderate, and dismissing a redundant employee is not costly. Regulations related to increasing or contracting the number of work hours are not flexible.
21
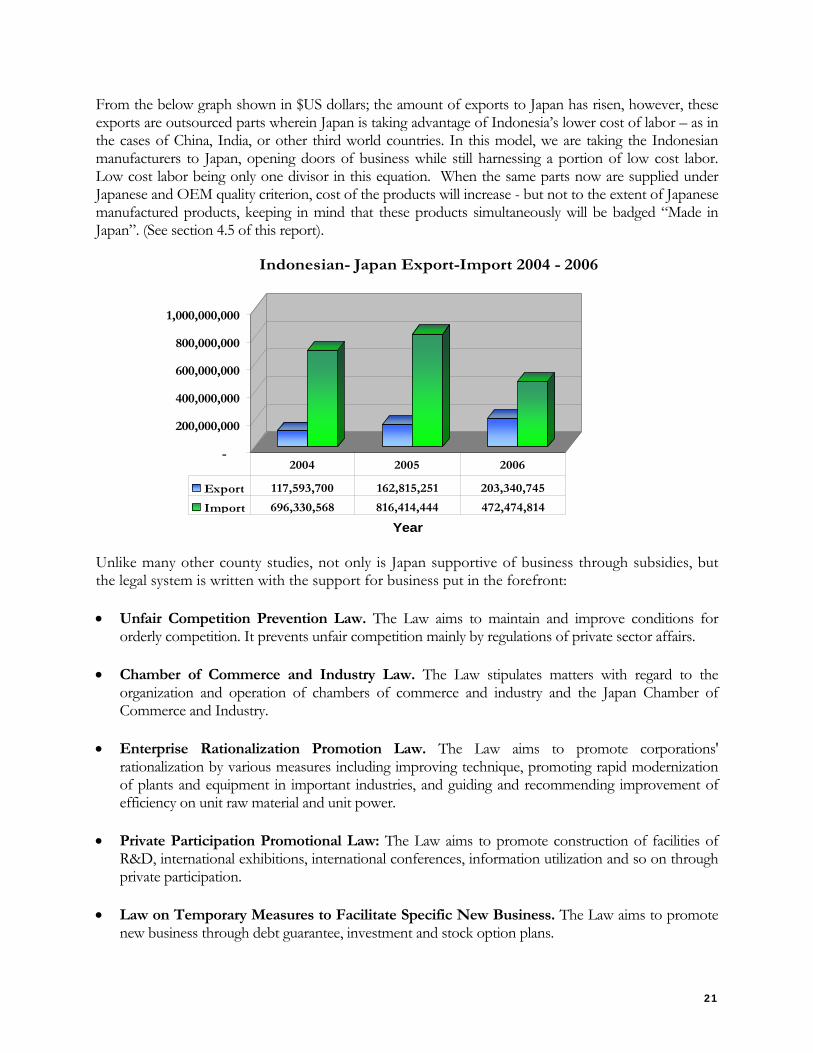
From the below graph shown in $US dollars; the amount of exports to Japan has risen, however, these exports are outsourced parts wherein Japan is taking advantage of Indonesia’s lower cost of labor – as in the cases of China, India, or other third world countries. In this model, we are taking the Indonesian manufacturers to Japan, opening doors of business while still harnessing a portion of low cost labor. Low cost labor being only one divisor in this equation. When the same parts now are supplied under Japanese and OEM quality criterion, cost of the products will increase - but not to the extent of Japanese manufactured products, keeping in mind that these products simultaneously will be badged “Made in Japan”. (See section 4.5 of this report).
Unlike many other county studies, not only is Japan supportive of business through subsidies, but the legal system is written with the support for business put in the forefront: • Unfair Competition Prevention Law. The Law aims to maintain and improve conditions for
orderly competition. It prevents unfair competition mainly by regulations of private sector affairs. • Chamber of Commerce and Industry Law. The Law stipulates matters with regard to the
organization and operation of chambers of commerce and industry and the Japan Chamber of Commerce and Industry.
• Enterprise Rationalization Promotion Law. The Law aims to promote corporations'
rationalization by various measures including improving technique, promoting rapid modernization of plants and equipment in important industries, and guiding and recommending improvement of efficiency on unit raw material and unit power.
• Private Participation Promotional Law: The Law aims to promote construction of facilities of
R&D, international exhibitions, international conferences, information utilization and so on through private participation.
• Law on Temporary Measures to Facilitate Specific New Business. The Law aims to promote
new business through debt guarantee, investment and stock option plans.
-
200,000,000
400,000,000
600,000,000
800,000,000
1,000,000,000
Year
Indonesian- Japan Export-Import 2004 - 2006
Export 117,593,700 162,815,251 203,340,745
Import 696,330,568 816,414,444 472,474,814
2004 2005 2006
22
• Law for Promoting University-Industry Technology Transfer. This law supports the projects and activities of the Technology Licensing Organization, which promotes the transfer of the results of research performed in academia to private enterprises, for the purpose of promoting the industrialization of innovative technology by Japan's universities, to improve industrial technology, and create new industries.
• Law on Temporary Measures to Facilitate Business Innovation. The Law stipulates measures
to facilitate "business innovation" through the effective use of management resources by corporations in the industries facing effects of various and structural changes of economical circumstances in Japan as well as in the world.
• Law on Temporary Measures for Activation of Regional Industrial Agglomerations. In
response to the various structural changes in the economy, this law seeks to promote the independent development of regional industry, and thereby contribute to the sound development of the national economy through measures to use and activate the function of specific industrial agglomerations.
• Law for Facilitating the Creation of New Business. This law seeks to promote, using Japan's
accumulated business resources, the creation of new business, including establishment, manufacture of new products, provision of new roles and improvement of business systems, by providing support for founding a business by individuals or establishment and operation of new companies. After reviewing and by utilizing the business and legal structure in Japan, it is to follow the reasoning why Japan is chosen over North America or the European Union. The next chapter will shed light on using Japan to penetrate the aforementioned areas.
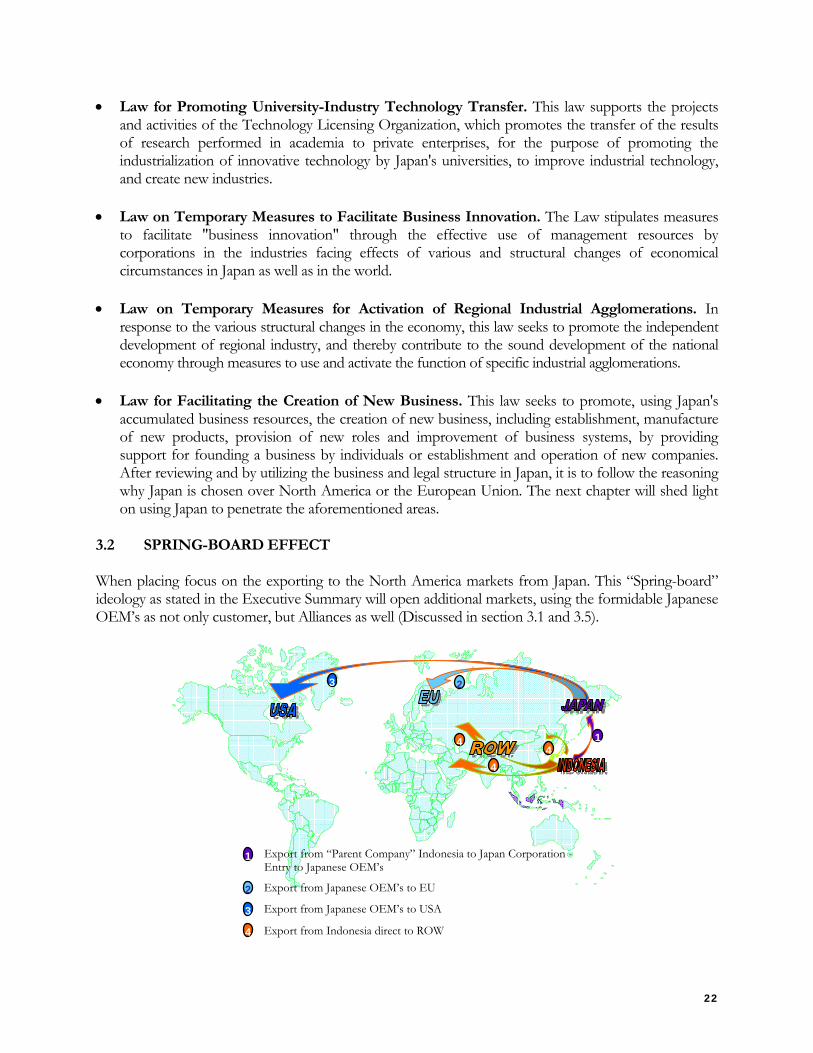
3.2 SPRING-BOARD EFFECT When placing focus on the exporting to the North America markets from Japan. This “Spring-board” ideology as stated in the Executive Summary will open additional markets, using the formidable Japanese OEM’s as not only customer, but Alliances as well (Discussed in section 3.1 and 3.5).
1
1
2
2
3
3
4
44
4
Export from “Parent Company” Indonesia to Japan Corporation - Entry to Japanese OEM’s
Export from Japanese OEM’s to EU
Export from Japanese OEM’s to USA
Export from Indonesia direct to ROW
23
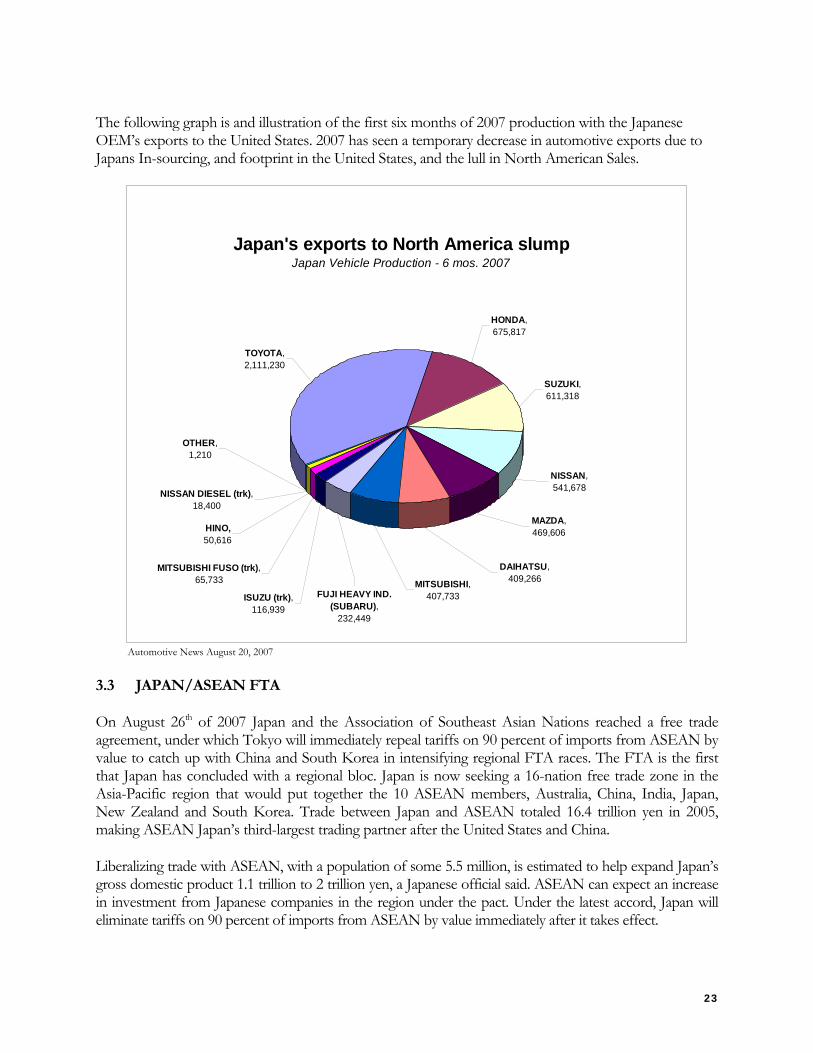
The following graph is and illustration of the first six months of 2007 production with the Japanese OEM’s exports to the United States. 2007 has seen a temporary decrease in automotive exports due to Japans In-sourcing, and footprint in the United States, and the lull in North American Sales.
Japan's exports to North America slumpJapan Vehicle Production - 6 mos. 2007
FUJI HEAVY IND.(SUBARU),
232,449
MITSUBISHI, 407,733
DAIHATSU,409,266
MAZDA,469,606
NISSAN,541,678
SUZUKI,611,318
HONDA,675,817
TOYOTA,2,111,230
ISUZU (trk),116,939
MITSUBISHI FUSO (trk),65,733
OTHER,1,210
NISSAN DIESEL (trk),18,400
HINO,50,616
Automotive News August 20, 2007
3.3 JAPAN/ASEAN FTA
On August 26th of 2007 Japan and the Association of Southeast Asian Nations reached a free trade agreement, under which Tokyo will immediately repeal tariffs on 90 percent of imports from ASEAN by value to catch up with China and South Korea in intensifying regional FTA races. The FTA is the first that Japan has concluded with a regional bloc. Japan is now seeking a 16-nation free trade zone in the Asia-Pacific region that would put together the 10 ASEAN members, Australia, China, India, Japan, New Zealand and South Korea. Trade between Japan and ASEAN totaled 16.4 trillion yen in 2005, making ASEAN Japan’s third-largest trading partner after the United States and China.
Liberalizing trade with ASEAN, with a population of some 5.5 million, is estimated to help expand Japan’s gross domestic product 1.1 trillion to 2 trillion yen, a Japanese official said. ASEAN can expect an increase in investment from Japanese companies in the region under the pact. Under the latest accord, Japan will eliminate tariffs on 90 percent of imports from ASEAN by value immediately after it takes effect.
24
Six major ASEAN members ― Brunei, Indonesia, Malaysia, the Philippines, Singapore and Thailand ― will repeal tariffs on 90 percent of imports from Japan within 10 years in terms of both value and the number of items. A more gradual tariff elimination timetable was set for the remaining four ASEAN members with smaller economies - Cambodia, Myanmar, Laos and Vietnam. Vietnam will eliminate tariffs on 90 percent of imports from Japan within 15 years and others will abolish 85 percent within 18 years. Such major products from Japan as electrical appliances, automobile components and steel are subject to the tariff elimination in principle but excluded in some countries.
For example, tariffs of up to 40 percent have so far been levied when a Japanese manufacturer assembles flat-panel TVs in an ASEAN country, using key components imported from Japan, and sells them in another ASEAN country. Such high tariffs will be eventually eliminated within 10 years in seven ASEAN countries, including Malaysia and Thailand. After immediately eliminating tariffs on 90 percent of imports from ASEAN, meanwhile, Japan will repeal the 3 percent portion within 10 years and lower tariffs on the 6 percent portion. The remaining 1 percent, which represents some farm products like rice, sugar and dairy goods, was excluded from the tariff elimination and reduction. China and South Korea have already concluded free trade accords with ASEAN. Without a similar accord, Japanese products would be less competitive than Chinese and South Korean goods. ASEAN is also in free trade talks with India and Australia.
In FTAs, gradual tariff elimination is common. By immediately repealing tariffs on most imports, Japan aims to speed up liberalization of trade with ASEAN and boost the competitiveness of Japanese products in the region. Japan will have more favorable treatment from ASEAN in tariffs on flat-panel TVs and automobile components, compared with the same South Korean products. Tariffs on those products from Japan will eventually be eliminated in many ASEAN countries but those on such products from South Korea will only be reduced under its pact with ASEAN. Among ASEAN members, Japan has implemented FTAs with Singapore and Malaysia. It has also signed agreements with Indonesia, the Philippines and Thailand, though these have yet to go into effect. It has reached an agreement with Brunei and is negotiating with Vietnam.
3.4 CHALLENGES IN JAPAN’S MARKET
One of the challenges often ignored is that of intercultural communication. Many a well-organized company has been stung by the cultural problems they have faced on the path to international success. Prior to embarking on this path any company should appreciate that “looking before you leap” is crucial and that culture is one of the many considerations to be examined. So how and where does culture impact going global? Companies can go global in many ways and for many reasons. On the whole there are common strategies used by companies of all sizes to connect to the global market. These are:
• Expansion. This is where a company literally expands into another country or countries. This is done by setting up an office, a factory or sales office in another country and continuing to run the business but as a local entity.
• Mergers and Acquisitions. Mergers and acquisitions are the domain of the big players but are becoming increasingly common as firms expand their interests internationally. In such instances a firm buys another to either overtake it or blend with it.
• Joint Ventures. JVs are when two (or more) companies set up a new entity.
25
• Alliances. This is where companies agree to work together closely but still retaining their separate identities. One company may be a supplier to the other or be a sole distributor for the other. Either way, they are doing the same thing but not as a united entity.
• Direct Distribution. A company may decide to sell internationally but from its national base. Products or services may be sold through marketing/advertising campaigns, websites, EBay or many other routes to market.
It may not seem obvious but intercultural communication impacts each and every option stated above; and this manifests in many different ways. Let’s look at some brief examples:
• Expansion - Setting up in a foreign country is not easy. Intercultural communication will come into play when meeting with people, negotiating terms and conditions, managing staff, ensuring the new structure can synchronize with the central office. This is not to mention the potential language difficulties. A company would need to ensure the people it has dealing with the foreign location had good intercultural skills and the competency to work in a foreign environment.
• Mergers and Acquisitions, JVs, Alliances and Licensing. All very similar in nature. Many can be successful but many are not. Statistics show that the failure rate of most mergers and acquisitions lies somewhere between 40-80 percent. If one were to define ‘failure’ as failure to increase shareholder value then statistics show these to be at the higher end of the scale at 83 percent Piero Morosini, author of Managing Cultural Differences: Effective Strategy and Execution across Cultures in Global Corporate Alliances, emphasizes that, "misunderstood national cultural differences have been cited as the most important factors behind the high failure rate of global JVs [joint ventures] and alliances." Problems such ventures face range from different ways of operating, how to build trust, communication styles, interacting with superiors, motivating employees, etc.
• Direct Distribution. When selling directly to other countries or cultures there are umpteen things to look out for. Product wise one has to be aware of areas such as sizes, names, logos, colors, etc. Communications wise how will the language barrier be overcome?
Intercultural communication impacts a business every step of the way on the road to going global. This is true at both a macro and micro-level. What is initially important is to have an appreciation that things are not always done the same outside of your country or culture. From there it is then possible to examine what areas will need attention in order to make your venture succeed. This can be anything from bringing in intercultural trainers to sit with and guide the CEOs and top-level management of two companies engaged in a JV right down to helping a company look at its website to ensure the language, images, pictures and content used are suitable for the target culture. Intercultural communication is in fact a powerful tool that can be used to maximize one’s potential on the international stage. It does so by being pro-active and minimizing obstacles as well as opening horizons and allowing different cultural viewpoints to work together successfully.
3.5 CORPORATE STRUCTURES IN JAPAN AND THE KEIRETSU
There are several types of corporations and organizations under Japanese laws. • Kabushiki-gaisha (Public Company or
Corporation) • Yugengaisha (Private Limited Company) • Goshi Gaishya (Limited Partnership)
• Goumei Gaisya (Unlimited Partnership) • NPO Hojin (Non-profit Organization)
26
Kabushikigaisha is the most well founded and flexible of the organizations, and you will have the trust of your clients. The minimum initial capital required is ten million yen. For Yugengaisha you need three million yen. However, a new law has been introduced, and now you can now set up these companies without the minimum three or ten million yen. To take the advantage of this new law, you have to submit the document which proves that “you have not running a business at present.” Also, no minimum initial capital is required for NPO. While there are a variety of differences among these companies, you are required to set up a Yugen Gaisha or Kabushiki Gaisha to acquire an Investor/Business Manager visa. With some of the businesses, you will also need authorization by the government (e.g. restaurant, antique shop, travel agency, temporal employment agency). One key to the Japanese “economic miracle” that existed up to the 1990s is to be found in the nature of the large Japanese corporation. The ability of these corporations to create a competitive advantage was once admired and envied in the rest of the world. In this part, we will examine the nature of Japanese corporations and how they differ from American corporations. First, we will examine ownership and control of the Japanese corporations—who formally owns them and who actually makes the main decisions. Here, we will consider the hypothesis that Japanese companies differ from American companies because of their very high reliance on debt. Second, we will consider the keiretsu—the groups of Japanese companies. Japanese reliance on groups of companies creates a blend of competition and cooperation that is quite different from American capitalism. Third, we will consider the competitive strategies of the successful Japanese corporations. We will consider their focus on market share as more important than short-run profits, their bias toward continual growth, and their emphasis on product quality and on differentiating their products. Fourth, we will consider the differences in technologies between successful Japanese and American corporations. The Japanese were especially good at “borrowing” technology and then improving upon it and adapting it to their own use. Many Japanese companies employ a technology that is more flexible than that found in comparable American companies—that is, they are able to adapt more readily to market changes. One famous example of this flexibility is the Just-In-Time system, pioneered by Toyota. We will consider why the technologies used were more flexible in Japan and how this flexibility allowed Japanese companies to achieve great success in the economic environment of the 1970s and 1980s. Fifth, we will examine Japanese management as a career, with comparison to the careers of American managers. Sixth, we will consider the role of small firms in Japan. Small firms have had a much more prominent role in Japan than in the United States. Finally, we will summarize the main points and try to draw some conclusions about the sources of the competitive advantage once possessed by the large Japanese corporations. • Ownership and control of large Japanese corporations. Of the more than 1,000,000 corporations
in Japan, only about 2,000 have their stock publicly traded. These are the large corporations and they control more than 40 percent of the assets of all Japanese corporations. The role of individual shareholders in these companies is quite different from that found in the United States.
Several points stand out in this table. First, the importance of financial institutions as holders of stock is much greater in Japan. This grew to over 40 percent by the early 1990s. (In the United States, the importance of pension funds—managed by financial institutions—grew considerably in the 1980s and 1990s. But American banks do not own stock in companies.) Of the financial institutions, banks and insurance companies are among the largest stockholders of Japanese corporations, and thus have
27
considerable influence over management. Second, inter-corporate holding (one corporation owns another corporation) is much more extensive in Japan. Inter-corporate holdings have given rise to two types of corporate groupings: the financial keiretsu, with large corporations grouped together through shareholding or through being related to a large bank, and the production keiretsu, with a dominant corporation connected to many satellite companies as suppliers, subcontractors, and so forth we will consider these types of keiretsu later. Third, the importance of individual shareholders in Japanese corporations is relatively small. Only about one-fourth of all shares are owned by individuals in Japan (23.2 percent as of 1991). Viewed another way: shares of stock represent a relatively small part of the wealth of Japanese individuals. Dividends are quite low ---by 1989, dividends in Japan averaged only 0.4percent of the value of the stocks. The Japanese corporation therefore can retain a larger portion of its profits to use in the company. The Japanese individual shareholder has little voice in corporate decisions. The Board of Directors of a Japanese corporation consists almost entirely of the senior management. One result of this difference in structure is a difference in managerial goals. American executives are concerned primarily with return on investment and the price of the stock in the stock market. Japanese executives are concerned mainly with market share, and only secondarily with return on investment. The price of the stock on the stock market is of little concern to Japanese managers. One frequently noted point about Japanese corporations is their high reliance on debt financing. As of 1981, about 75 percent of assets of Japanese corporations were financed by debt, compared to about half for American corporations. Reliance on debt in Japan was encouraged by relatively low real interest rates. It also reflected the poorly developed stock market in Japan (prior to the 1980s) that forced Japanese companies to develop relationships with banks in order to gain access to money for expansion. (For reasons that we will not go into here, the Japanese reliance on debt has been overstated.). During the 1980s and 1990s, Japanese companies came to rely more on financing by sale of stocks. The proportion of shares of stock owned within each group declined. In the late 1980s, the stock market was greatly overvalued. A few corporate scandals caused stock prices to begin to fall. As stock prices fell, companies sold their shares to try to realize some profit while they could. The result was a collapse of stock prices, precipitating a severe recession in Japan in the early 1990s.
• Corporate groups. As noted above, there are two types of corporate groups (keiretsu) in Japan. These
groups are not formal organizations (such as divisions of the same company). But they do operate through extensive, long-term relationships. Let us first consider the financial (or horizontal) keiretsu.
• Financial (horizontal) keiretsu. There are six main financial groups in Japan. The names are
familiar to many Americans: Mitsui, Mitsubishi, Sumitomo, Fuyo, Sanwa, and Dai-Ichi Kangyo. Each group includes one central commercial bank (called a “main” bank), other financial institutions, at least one general trading company (described in Part VI), and a large number of manufacturing companies in many different industries. (Mitsui, Mitsubishi, and Sumitomo are direct descendants of the pre-war zaibatsu. However, they are quite different today.) Each group has at least one company in each of the major industries.
To illustrate, in 1995, the Mitsubishi group included one “main bank”, a trust bank (a trust bank accepts trust deposits, makes long-term loans, and manages pension accounts), a hazard insurance company, a life insurance company, a construction company, a brewery (Kirin), a rayon producer, a paper mill, three chemical companies, an oil company, a glass company, a steel company, four metals
28
companies, one machinery manufacturer, an electric appliances company, an automobile producer, a producer of heavy transport equipment, a camera company (Nikon), a commerce company, a real estate company, and a few others. Most of these companies have “Mitsubishi” in their name. Each group typically has only one company that produces the same product (avoiding competition within the group). And most companies are members of only one group. Within each group, there are three integrating mechanisms: the Presidents’ Councils, structured economic relationships (such as inter-group borrowing, cross-shareholding, directorships, and trade networks), and group-wide projects.
Each of the groups has a Presidents’ Council. Here, the Presidents of the companies in the group meet each month. In 1995, some 185 of the largest companies in Japan belonged to Presidents’ Councils. (However, Honda, Matsushita, Sony, and Fuji Film did not belong to one of these councils.) Their meetings are informal, with no specified agenda, and are often mainly social. The Councils have no direct control over the individual companies. However, the Presidents often do discuss important problems, especially when there are matters of extreme concern (such as the possible failure of one of the companies). For example, one company of the Mitsui group was involved in a scandal for selling fake antiques. The group pressured the President of that company to resign, loaned the company money, and took other actions to help the company survive. As another example, in the late 1970s, Mazda was on the brink of bankruptcy. At the Presidents’ Council of the Sumitomo group (of which Mazda—Toyo Kogyo—is a member), it was agreed that all companies in the group would switch their purchases to Mazda automobiles. (In contrast, Chrysler was also in financial trouble at the same time. It had to turn to the American government for help.) There are several “structured economic relationships”. First, each group is centered around a bank. This bank is the main source of loans for the companies in the group and is also a major stockholder of the other companies in the group. This bank is usually called the “main bank”. Of the debt of a large Japanese company, typically 10 percent to 20 percent has been loaned by the group’s main bank. By its willingness to lend to a company, the “main-bank” signals to other banks the financial health of the borrower. This allows the company to gain access to loans from other banks as well. The “main bank” also helps group companies to find customers and “comes to the rescue” if group companies start to have financial problems (as with the case of Mazda). Bank loans in Japan have developed unique characteristics. Borrowers can defer loan payments during times of financial adversity. And loans are routinely “rolled over” in Japan, so that they come to have a long life. As noted earlier, another “structured economic relationship” is the considerable inter-corporate shareholding in Japan. Much of this occurs within the groups, so that each company owns a large share of the stock of the other companies within the group. In 1994, the percent of shares held by other members of the group was 23.4 percent for the Sumitomo group, 27.5 percent for the Mitsubishi group, 11.7 percent for the Dai-Ichi Kangyo group, 16 percent for the Sanwa group, 16.5 percent for the Mitsui group, and 14.6 percent for the Fuyo group. The shares owned by people outside of the group usually have little, if any, say in company management. A large portion of the inter-corporate shareholding represents offsetting shares (that is, two companies own shares in each other). Although companies in a group rarely own a large enough share in other group companies to have a controlling interest, this cross-shareholding does act to promote stable, long-term relationships between the companies. It also tends to protect companies from hostile takeovers (which are common in the United States, but are virtually unknown in Japan). Related to the inter-corporate shareholding, but less extensive, is another “structured economic relationship” ― a system of sharing directors. As noted, in Japanese companies, the Board of
29
Directors is dominated by the management. But among outside directors, it is very common to find people who are also directors of other companies within the group. Usually, it is the bank that sends its directors to be directors of the other companies in the group. (In addition, there is an exchange of employees within the group. Commonly, employees take a full-time position with another company in the same group for a period of time. At the end of the period, they are re-employed in their original company.) A final “structured economic relationship” results because companies within the group have preferential trade networks among themselves. Each group has a General Trading Company, which handles a large portion of exporting and importing for the companies within the group. And in Japan, the companies tend to buy proportionally more from other companies within the group (and proportionally less from outsiders). We shall return to these practices in Part VI, when we consider the complaints of American companies that the Japanese market is closed to outsiders. Finally, companies within a group often participate in certain group-wide activities. For example, companies occasionally come-together to start new companies. These are usually large, risky projects in a new industry. Companies also engage in group public relations activities (such as having group exhibits at World Fairs.) There are also group publications, group sporting events, group education centers, group health centers, group marriage advising centers, and so forth. There have been several studies of the effects of the financial keiretsu on Japanese economic performance. From these, several conclusions result. First, the groups allow for stable, reliable business relationships. They assure a steady source of funds to buy new capital goods. They protect group members from the threat of a hostile takeover. And as we will see in Part IV, they allow the companies to maintain “permanent employment” by facilitating transfers of employees between companies within the group. Second, group companies typically are freed from the control of the stock market. The company’s reason for being is its managers and employees, not its stockholders. This creates companies that are willing and able to experiment—companies that are growth-oriented and very competitive. Third, groups reduce the so-called “agency problem” that is found in so many American companies. The “agency problem” means that managers have incentives to use company money in ways that meet their own interests but not the interests of the stockholders. Since managers control information, stockholders are not able to prevent this. In Japan, the fact that the major stockholders are other companies within the group and that the bank is also a stockholder reduces the manager’s control over information and therefore reduces the ability of managers to pursue their independent interests. Fourth, competition in Japan has come to take-place between groups rather than between companies. Groups push member companies to pursue increased market share, to expand capacity (even in bad economic times), to improve products, to move into new activities, and so forth. Since the profit rate of Japanese companies is not high (one estimate is that the rate of return before taxes for large Japanese corporations in 1988 was only 4.92 percent), the amount of competition in Japan must be substantial. Finally, groups in Japan act to reduce risk. This is perhaps their main contribution to Japan’s economic success. (Because of this ability to reduce risk, in Japan new industries are typically developed by existing companies. In contrast, in the United States, new industries are typically developed by new, risk-taking entrepreneurs. The independent entrepreneur is less significant in Japan than in the United States.)
30
• Production (vertical) keiretsu. Large Japanese corporations often have long-term relationships with the companies that produce their parts or other raw materials or with the companies that sell their products. In some cases, these other companies are subsidiaries (that is, the large corporation owns some proportion of the smaller companies). In most cases, however, the smaller company is independent. Many of these independent small companies were originally part of the large (parent) corporation. They were “spun-off” to form independent companies, usually owned by a former employee of the parent corporation. Most of their business involves subcontracting with the parent corporation. In order to reduce their dependence on one company, many of these subcontractors have relationships with several large, parent corporations (four or more is not unusual). If one is to compare American and Japanese manufacturing, one could say that, for parts and raw material production, Japanese companies are less vertically integrated than American companies. This means that Japanese companies are more likely to buy parts and materials from independent companies while American companies are more likely to produce their own parts and materials themselves.
The relation between the large parent corporation and the smaller satellite company is long-term. Typically, when an employee of the parent corporation wishes to create a new company, he receives “seed money” from the large corporation. The parent company will design the product (a part or some material) and provide technical assistance in helping the small company produce it. The large company also provides an assured market to the small company. In return, the small company provides specialized technological knowledge and an assurance that the part or raw material will arrive at the factory of the parent company on time and with high- quality. There are several possible reasons that such a system developed in Japan. One is that large Japanese corporations find it easier to administer a homogeneous labor force (in terms of working conditions). Activities in the small, satellite companies are quite different from those of the large, parent company. We shall consider this desire for homogeneity in the section on Industrial Relations. A second possible reason is that the satellite companies produce products in which the risk of financial failure is high. If the product is not successful in the small company, its failure will not tarnish the corporate image of the large corporation. A third possible reason is that small, satellite companies provide a face-saving way for the large corporation to get rid of workers who are not likely to advance further in the large company. A fourth possible reason is that laws are often not enforced against small Businesses—especially pollution laws, tax laws, and so forth. We will discuss this later in this part. Therefore, large companies may form smaller companies to produce products where pollution is likely to be high, where accident rates are high, and so forth. A final possible reason is that subcontracting with small companies enhances the market power of the large corporation. The large company is able to put great pressure on the smaller company in terms of quality standards and delivery time. The pressure is great because the owner of the small company has much to lose if he loses the contract with the large corporation. One conclusion is clear: the system exists in Japan because it worked—overall efficiency was increased. As an illustration of the vertical groups, let us consider the Japanese automobile industry. As of 1984, Toyota used ten main subcontractors who employed over 73,000 workers. Nissan used seventeen main subcontractors who employed about 46,000 workers. All of the subcontractors were partially owned by the parent company. Toyota’s subcontractors began as departments within Toyota and were “spun-off” into new companies. On the other hand, Nissan made stock purchases of already existing companies, and then transferred Nissan executives to manage them. Toyota’s
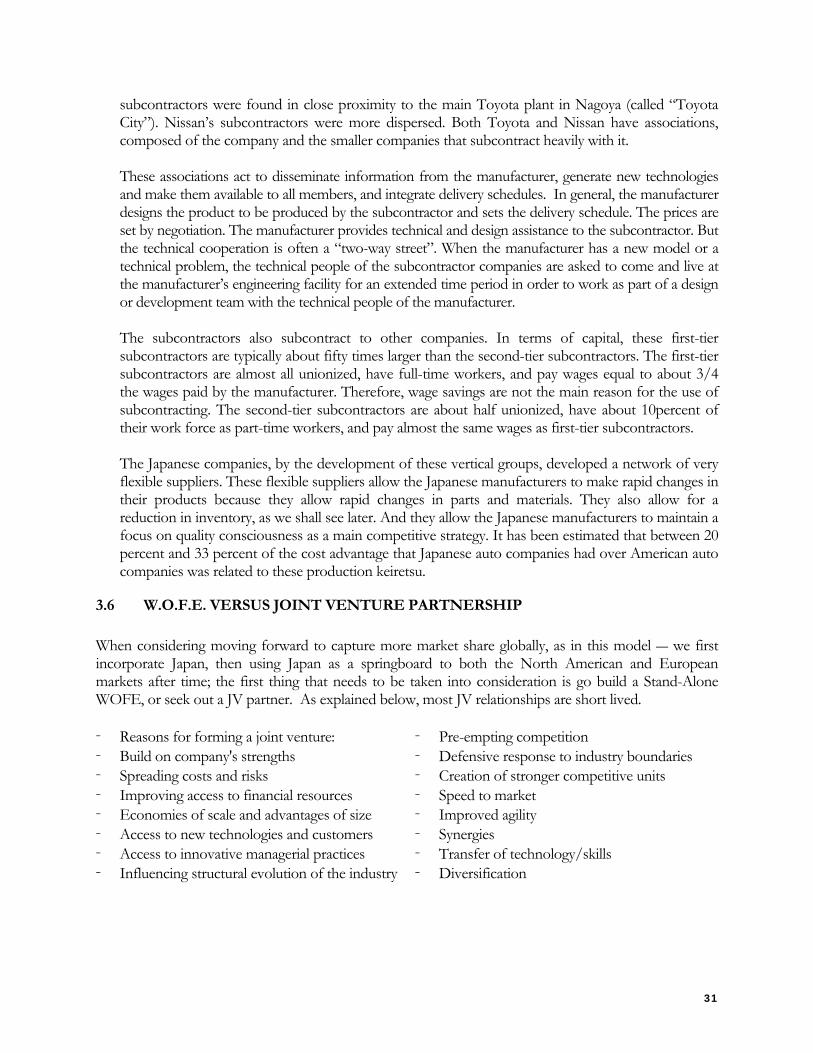
31
subcontractors were found in close proximity to the main Toyota plant in Nagoya (called “Toyota City”). Nissan’s subcontractors were more dispersed. Both Toyota and Nissan have associations, composed of the company and the smaller companies that subcontract heavily with it. These associations act to disseminate information from the manufacturer, generate new technologies and make them available to all members, and integrate delivery schedules. In general, the manufacturer designs the product to be produced by the subcontractor and sets the delivery schedule. The prices are set by negotiation. The manufacturer provides technical and design assistance to the subcontractor. But the technical cooperation is often a “two-way street”. When the manufacturer has a new model or a technical problem, the technical people of the subcontractor companies are asked to come and live at the manufacturer’s engineering facility for an extended time period in order to work as part of a design or development team with the technical people of the manufacturer. The subcontractors also subcontract to other companies. In terms of capital, these first-tier subcontractors are typically about fifty times larger than the second-tier subcontractors. The first-tier subcontractors are almost all unionized, have full-time workers, and pay wages equal to about 3/4 the wages paid by the manufacturer. Therefore, wage savings are not the main reason for the use of subcontracting. The second-tier subcontractors are about half unionized, have about 10percent of their work force as part-time workers, and pay almost the same wages as first-tier subcontractors. The Japanese companies, by the development of these vertical groups, developed a network of very flexible suppliers. These flexible suppliers allow the Japanese manufacturers to make rapid changes in their products because they allow rapid changes in parts and materials. They also allow for a reduction in inventory, as we shall see later. And they allow the Japanese manufacturers to maintain a focus on quality consciousness as a main competitive strategy. It has been estimated that between 20 percent and 33 percent of the cost advantage that Japanese auto companies had over American auto companies was related to these production keiretsu.
3.6 W.O.F.E. VERSUS JOINT VENTURE PARTNERSHIP
When considering moving forward to capture more market share globally, as in this model ― we first incorporate Japan, then using Japan as a springboard to both the North American and European markets after time; the first thing that needs to be taken into consideration is go build a Stand-Alone WOFE, or seek out a JV partner. As explained below, most JV relationships are short lived. - Reasons for forming a joint venture: - Build on company's strengths - Spreading costs and risks - Improving access to financial resources - Economies of scale and advantages of size - Access to new technologies and customers - Access to innovative managerial practices - Influencing structural evolution of the industry
- Pre-empting competition - Defensive response to industry boundaries - Creation of stronger competitive units - Speed to market - Improved agility - Synergies - Transfer of technology/skills - Diversification
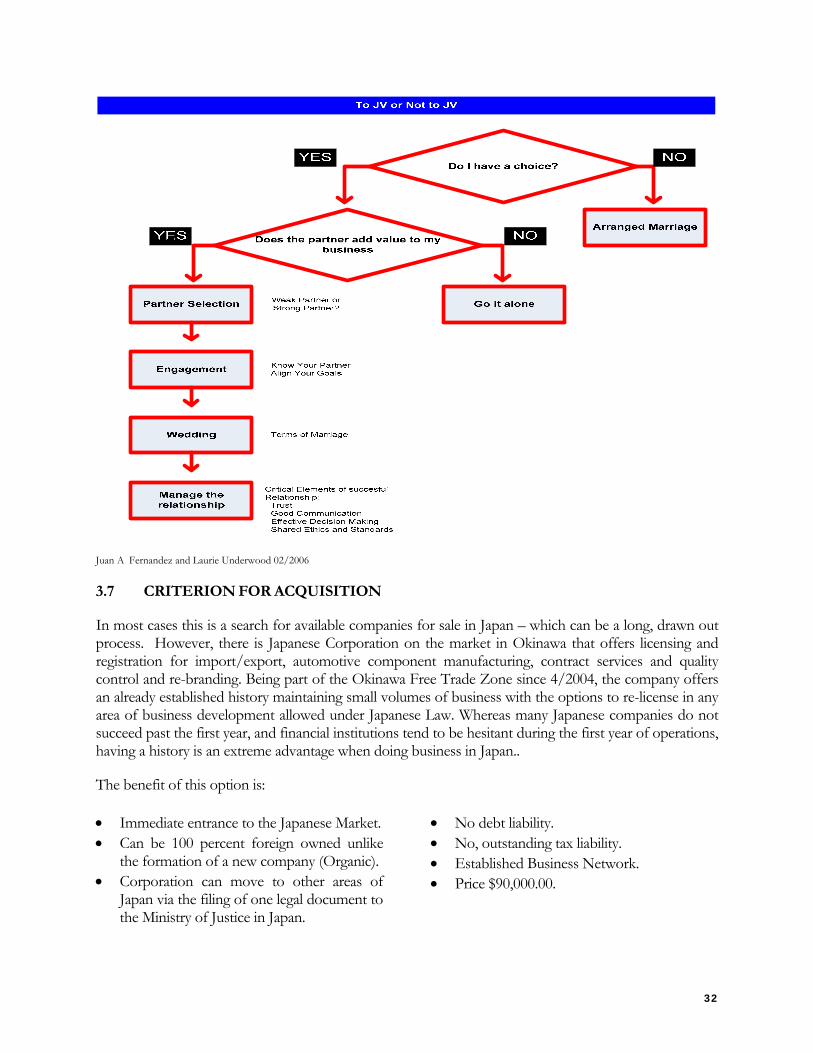
32
Juan A Fernandez and Laurie Underwood 02/2006
3.7 CRITERION FOR ACQUISITION
In most cases this is a search for available companies for sale in Japan – which can be a long, drawn out process. However, there is Japanese Corporation on the market in Okinawa that offers licensing and registration for import/export, automotive component manufacturing, contract services and quality control and re-branding. Being part of the Okinawa Free Trade Zone since 4/2004, the company offers an already established history maintaining small volumes of business with the options to re-license in any area of business development allowed under Japanese Law. Whereas many Japanese companies do not succeed past the first year, and financial institutions tend to be hesitant during the first year of operations, having a history is an extreme advantage when doing business in Japan..
The benefit of this option is: • Immediate entrance to the Japanese Market. • Can be 100 percent foreign owned unlike
the formation of a new company (Organic). • Corporation can move to other areas of
Japan via the filing of one legal document to the Ministry of Justice in Japan.
• No debt liability. • No, outstanding tax liability. • Established Business Network. • Price $90,000.00.
33
There are three methods off acquisition of business namely: (i) merger or consolidation, (ii) stock acquisition, and (iii) asset acquisition.
• Acquisition of local companies. Subject to obtaining the clearance, if required, under the Foreign
Exchange Law,, foreign corporations can acquire Japanese companies, whether listed on the stock exchange or not. Typically, a foreign corporation acquires stock in the Japanese companies by purchasing existing shares of common stock of a Japanese company from the existing shareholder of the target company or, if a target company is listed on a stock exchange, purchasing such shares gradually on the stock exchange. If the target company is a public company, whose share are either listed on a stock exchange or traded in the over-the-counter market, a foreign corporation can acquire a block of shares at once by making a takeover bid (or called tender offer). The takeover bid could be friendly or unfriendly, but it is the only way to acquire a public company on a hostile basis. In order for a foreign corporation to make the takeover bid in Japan, it must comply with the detailed rules concerning the takeover bid stipulated in the Securities and Exchange Law and cabinet orders and ministerial ordinances there under.
In order to facilitate a foreign corporation’s takeover bin in Japan, the relevant rules were amended in June, 1990 so that those who make the takeover bid in Japan may commence it by making a public notice in at least two daily newspapers and filing the takeover bid statement with the Minister of Finance on the day which such public notice is given. Further, under the amended rules, foreign corporations are no longer required to use Securities Company of bank license in Japan as an agent for the takeover bid. In the case of friendly acquisition, one common method is to cause a Japanese target company to issue shares or other equity securities to the foreign acquirer.
Although it is not practical, another way to acquire shares in a Japanese target company is for a foreign corporation to use its subsidiary in Japan, whether existing or newly incorporated, and cause the Japanese subsidiary and the target Japanese company to merger with each other. In Japan, however, the so-called “cash merger” available in the United States in not permissible.
• Acquisition of all of the assets of local companies. In Japan, acquisition of assets as a going
concern is considered as “business”, which generally comprises not only assets and liabilities but also employees and relationships with suppliers and customers. However, if a foreign corporation acquires the business of a Japanese company directly, the foreign corporation will be considered doing business in Japan after the acquisition of the business so the foreign acquirer must establish a branch in Japan to take over the business from the Japanese target company. The establishment of a branch in Japan by a foreign corporation is considered Domestic Direct Investment and requires prior notification and clearance by the Japanese government under the Foreign Exchange Law.
• Sectors where foreign investment is prohibited. Japan will, for the time being, continue to restrict
investment in agriculture, forestry and fisheries, the mining industry, the oil industry and the leather and leather products manufacturing industry. There are several other areas where foreign investment and business activity in Japan come within stricter controls because they are subject to a requirement of license or other approval for their performance pursuant to a low other than the Foreign Exchange Law. Significant such laws include Foreign Securities Firms Act, the Foreign Insures Act and the Banking Act. Further, Japan restricts investment in any area of nature and under circumstance that would seriously and adversely affect national security, public order of public safety.
34
3.8 LEAD TIME FOR FORMATION OF JAPANESE CORPORATION Time required establishing a Japanese corporation is approximately two months after determination of profile of company to be established. • This profile should contain information including the following: trade name, location of head office,
business objectives, business year, amount of capital, issue price of shares, existence of provisions restricting transfer of shares, existence of board of directors, names of directors and representative directors, terms of directors, names of equity participants, and values of their investments.
• If an individual or corporation with an address in Japan is the promoter of a joint-stock corporation and a foreign enterprise is the underwriter of shares in that corporation when it is established (such a situation is called a "formation with outside offering," or Boshû Setsuritsu), affidavits regarding the parent companies may not be required.
• While in this case shares issued when the joint-stock corporation is established are shared by the promoter and foreign enterprise, the joint-stock corporation may be made a 100 percent subsidiary of the foreign enterprise by subsequently transferring the shares held by the promoter. If a joint-stock corporation is incorporated with the joint equity participation of an individual or corporation with a bank account in Japan, it may not be necessary to apply to a bank for capital custody and issuance of a capital custody certificate. In this case, it is sufficient for the capital to be paid into the joint equity participant’s bank account in Japan, and for documentary evidence to be submitted by the representative director of the joint-stock corporation in place of a bank-issued capital custody certificate in order to certify that payment of the full amount of capital has been received.
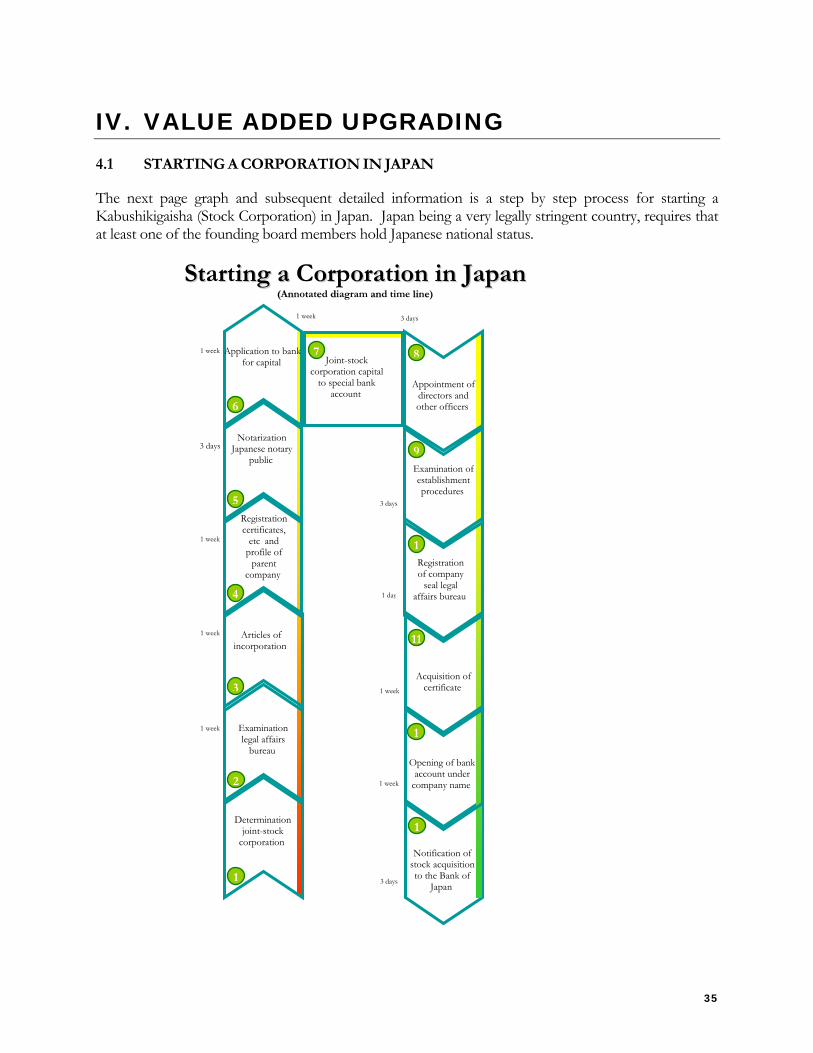
35
IV. VALUE ADDED UPGRADING 4.1 STARTING A CORPORATION IN JAPAN
The next page graph and subsequent detailed information is a step by step process for starting a Kabushikigaisha (Stock Corporation) in Japan. Japan being a very legally stringent country, requires that at least one of the founding board members hold Japanese national status.
SSttarrtiinngg aa Coorrpoorraatiioonn iinn JJaappaann ((Annnottateed ddiagram aannd time lliinee)
1
2
3
4
5
6
7
1
1
11
1
9
8
Determination joint-stock
corporation
Examination legal affairs
bureau
Articles of incorporation
Registration certificates,
etc and profile of
parent company
Notarization Japanese notary
public
Application to bank for capital Joint-stock
corporation capital to special bank
account Appointment of
directors and other officers
Examination of establishment procedures
Registration of company
seal legal affairs bureau
Acquisition of certificate
Opening of bank account under
company name
Notification of stock acquisition to the Bank of
Japan
1 week
1 week
1 week
3 days
1 week
1 week 3 days
3 days
1 day
1 week
1 week
3 days
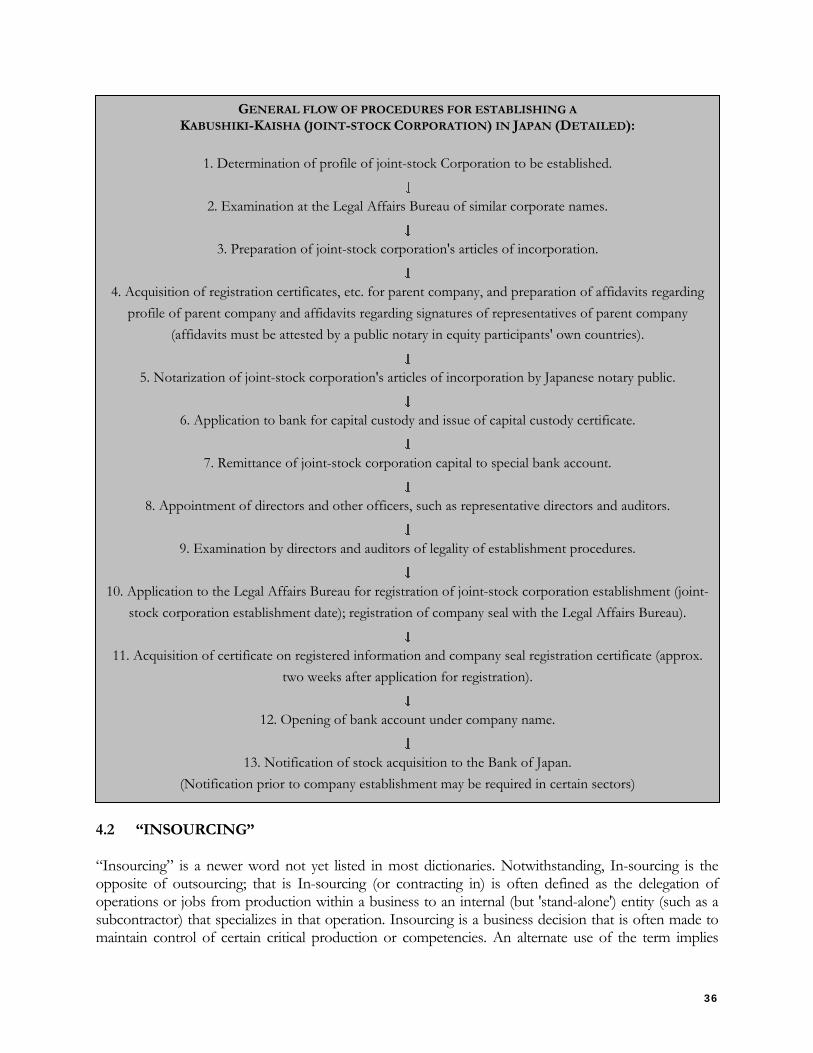
36
4.2 “INSOURCING” “Insourcing” is a newer word not yet listed in most dictionaries. Notwithstanding, In-sourcing is the opposite of outsourcing; that is In-sourcing (or contracting in) is often defined as the delegation of operations or jobs from production within a business to an internal (but 'stand-alone') entity (such as a subcontractor) that specializes in that operation. Insourcing is a business decision that is often made to maintain control of certain critical production or competencies. An alternate use of the term implies
GENERAL FLOW OF PROCEDURES FOR ESTABLISHING A KABUSHIKI-KAISHA (JOINT-STOCK CORPORATION) IN JAPAN (DETAILED):
1. Determination of profile of joint-stock Corporation to be established.
2. Examination at the Legal Affairs Bureau of similar corporate names.
3. Preparation of joint-stock corporation's articles of incorporation.
4. Acquisition of registration certificates, etc. for parent company, and preparation of affidavits regarding
profile of parent company and affidavits regarding signatures of representatives of parent company (affidavits must be attested by a public notary in equity participants' own countries).
5. Notarization of joint-stock corporation's articles of incorporation by Japanese notary public.
6. Application to bank for capital custody and issue of capital custody certificate.
7. Remittance of joint-stock corporation capital to special bank account.
8. Appointment of directors and other officers, such as representative directors and auditors.
9. Examination by directors and auditors of legality of establishment procedures.
10. Application to the Legal Affairs Bureau for registration of joint-stock corporation establishment (joint-
stock corporation establishment date); registration of company seal with the Legal Affairs Bureau).
11. Acquisition of certificate on registered information and company seal registration certificate (approx.
two weeks after application for registration).
12. Opening of bank account under company name.
13. Notification of stock acquisition to the Bank of Japan.
(Notification prior to company establishment may be required in certain sectors)
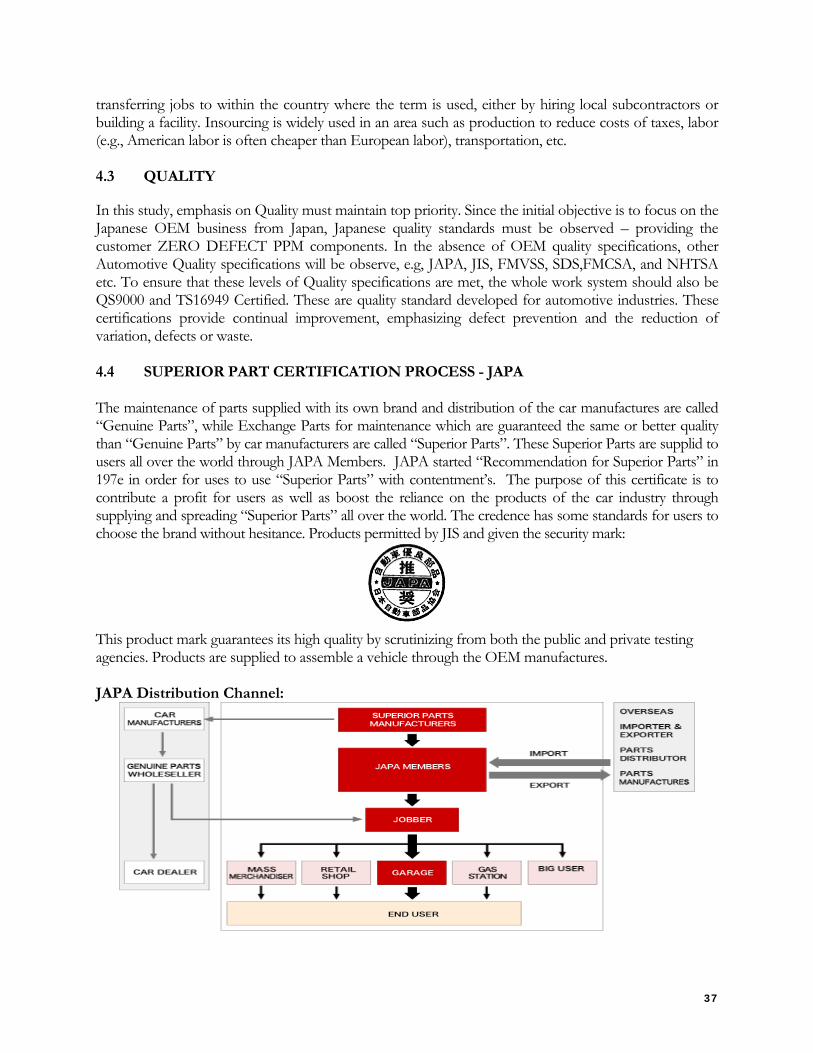
37
transferring jobs to within the country where the term is used, either by hiring local subcontractors or building a facility. Insourcing is widely used in an area such as production to reduce costs of taxes, labor (e.g., American labor is often cheaper than European labor), transportation, etc. 4.3 QUALITY In this study, emphasis on Quality must maintain top priority. Since the initial objective is to focus on the Japanese OEM business from Japan, Japanese quality standards must be observed – providing the customer ZERO DEFECT PPM components. In the absence of OEM quality specifications, other Automotive Quality specifications will be observe, e.g, JAPA, JIS, FMVSS, SDS,FMCSA, and NHTSA etc. To ensure that these levels of Quality specifications are met, the whole work system should also be QS9000 and TS16949 Certified. These are quality standard developed for automotive industries. These certifications provide continual improvement, emphasizing defect prevention and the reduction of variation, defects or waste. 4.4 SUPERIOR PART CERTIFICATION PROCESS - JAPA The maintenance of parts supplied with its own brand and distribution of the car manufactures are called “Genuine Parts”, while Exchange Parts for maintenance which are guaranteed the same or better quality than “Genuine Parts” by car manufacturers are called “Superior Parts”. These Superior Parts are supplid to users all over the world through JAPA Members. JAPA started “Recommendation for Superior Parts” in 197e in order for uses to use “Superior Parts” with contentment’s. The purpose of this certificate is to contribute a profit for users as well as boost the reliance on the products of the car industry through supplying and spreading “Superior Parts” all over the world. The credence has some standards for users to choose the brand without hesitance. Products permitted by JIS and given the security mark:
This product mark guarantees its high quality by scrutinizing from both the public and private testing agencies. Products are supplied to assemble a vehicle through the OEM manufactures. JAPA Distribution Channel:
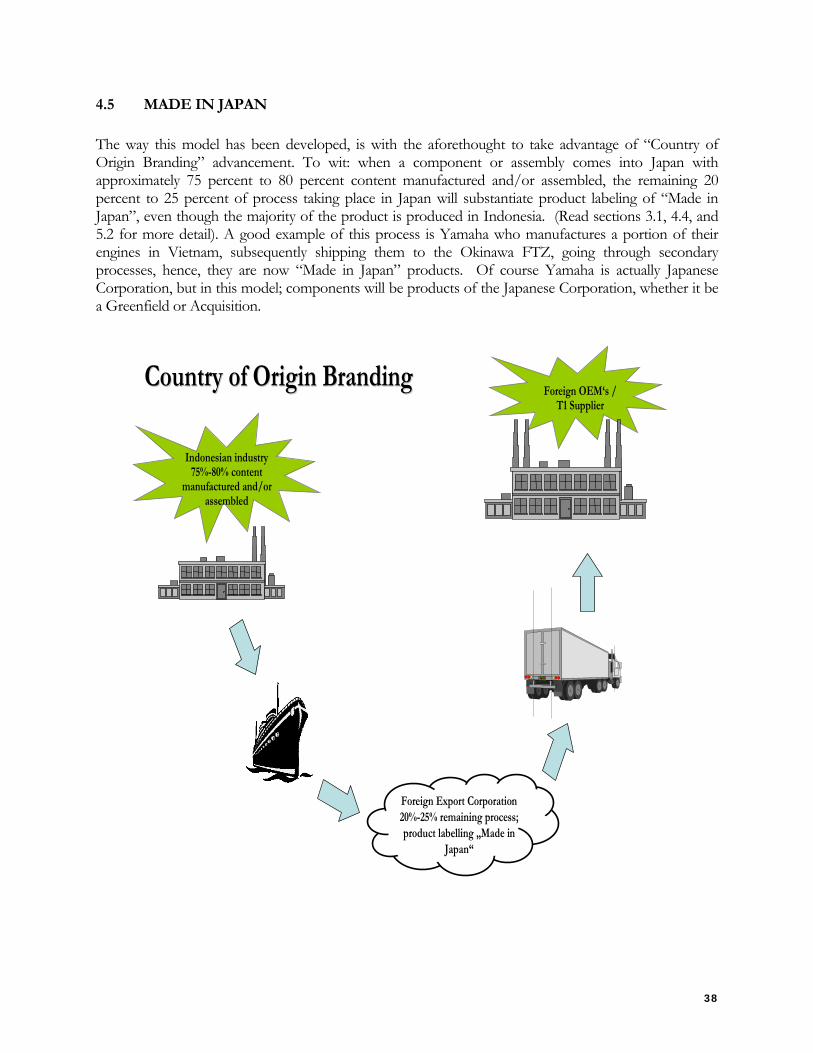
38
4.5 MADE IN JAPAN
The way this model has been developed, is with the aforethought to take advantage of “Country of Origin Branding” advancement. To wit: when a component or assembly comes into Japan with approximately 75 percent to 80 percent content manufactured and/or assembled, the remaining 20 percent to 25 percent of process taking place in Japan will substantiate product labeling of “Made in Japan”, even though the majority of the product is produced in Indonesia. (Read sections 3.1, 4.4, and 5.2 for more detail). A good example of this process is Yamaha who manufactures a portion of their engines in Vietnam, subsequently shipping them to the Okinawa FTZ, going through secondary processes, hence, they are now “Made in Japan” products. Of course Yamaha is actually Japanese Corporation, but in this model; components will be products of the Japanese Corporation, whether it be a Greenfield or Acquisition.
Indonesian industry75%-80% content
manufactured and/or assembled
Foreign Export Corporation20%-25% remaining process; product labelling „Made in
Japan“
Foreign OEM‘s / T1 Supplier
Country of Origin BrandingCountry of Origin Branding
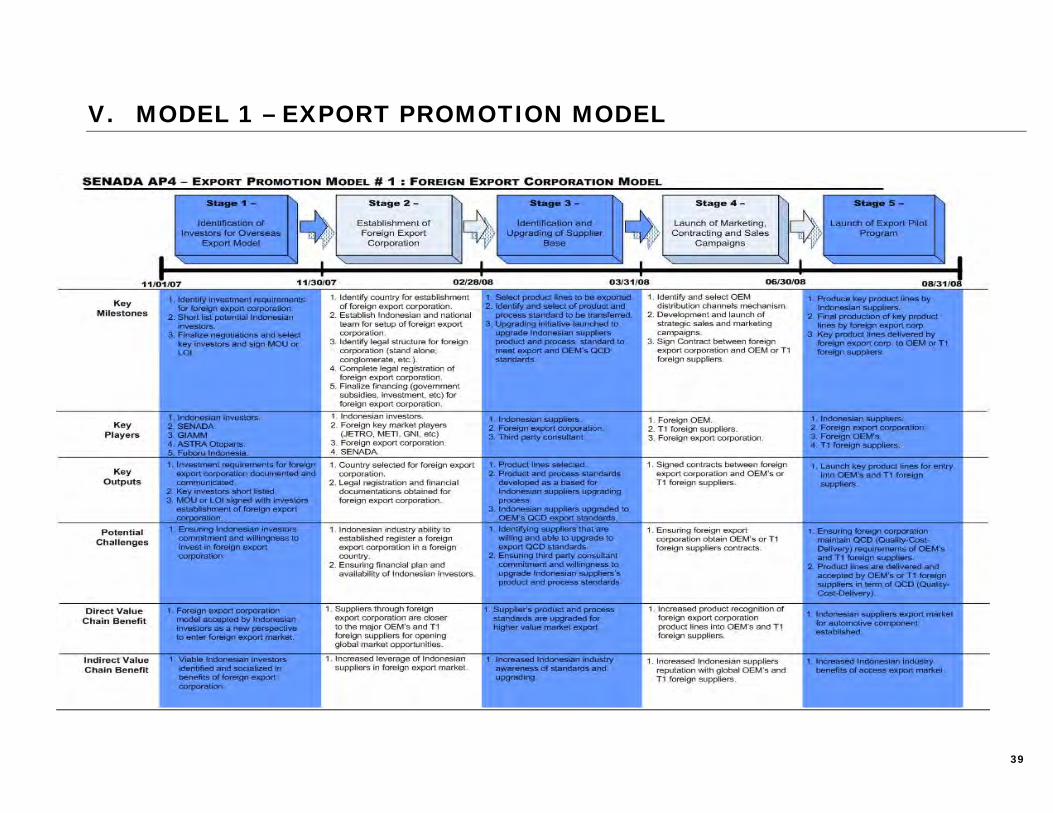
39
V. MODEL 1 – EXPORT PROMOTION MODEL
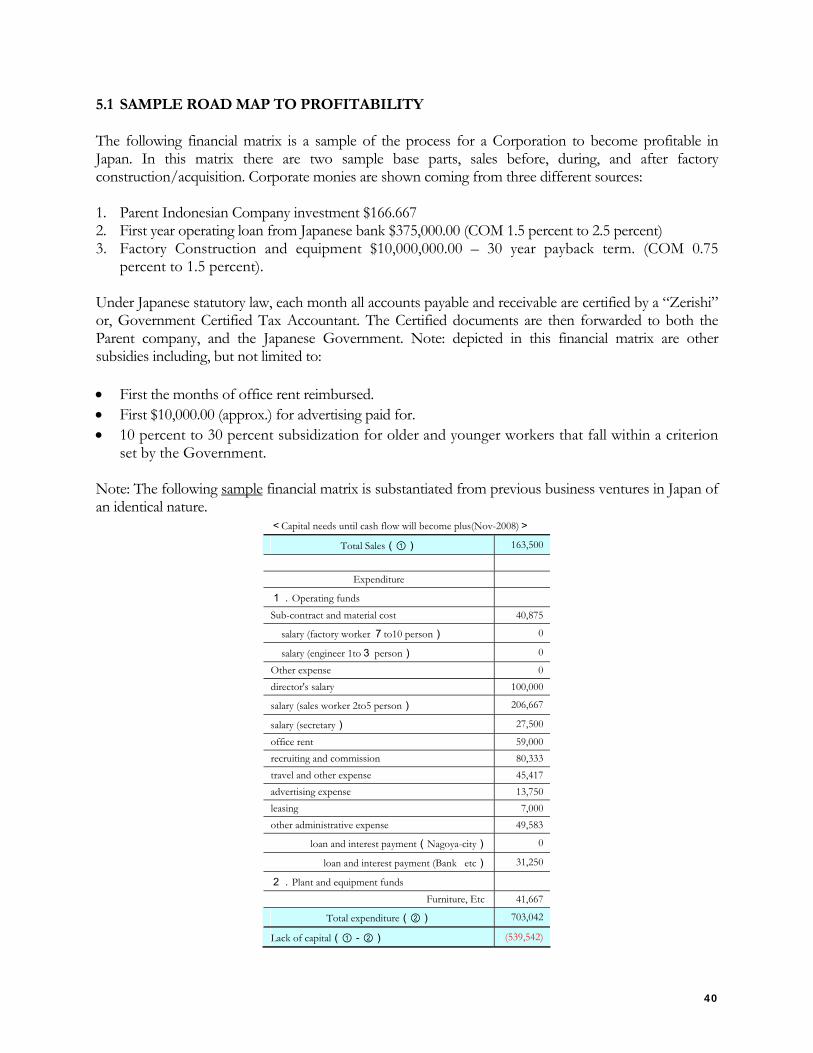
40
5.1 SAMPLE ROAD MAP TO PROFITABILITY The following financial matrix is a sample of the process for a Corporation to become profitable in Japan. In this matrix there are two sample base parts, sales before, during, and after factory construction/acquisition. Corporate monies are shown coming from three different sources: 1. Parent Indonesian Company investment $166.667 2. First year operating loan from Japanese bank $375,000.00 (COM 1.5 percent to 2.5 percent) 3. Factory Construction and equipment $10,000,000.00 – 30 year payback term. (COM 0.75
percent to 1.5 percent). Under Japanese statutory law, each month all accounts payable and receivable are certified by a “Zerishi” or, Government Certified Tax Accountant. The Certified documents are then forwarded to both the Parent company, and the Japanese Government. Note: depicted in this financial matrix are other subsidies including, but not limited to: • First the months of office rent reimbursed. • First $10,000.00 (approx.) for advertising paid for. • 10 percent to 30 percent subsidization for older and younger workers that fall within a criterion
set by the Government. Note: The following sample financial matrix is substantiated from previous business ventures in Japan of an identical nature.
<Capital needs until cash flow will become plus(Nov-2008)>
Total Sales(①) 163,500
Expenditure
1.Operating funds
Sub-contract and material cost 40,875
salary (factory worker 7to10 person) 0
salary (engineer 1to3 person) 0
Other expense 0 director's salary 100,000
salary (sales worker 2to5 person) 206,667
salary (secretary) 27,500
office rent 59,000 recruiting and commission 80,333 travel and other expense 45,417 advertising expense 13,750 leasing 7,000 other administrative expense 49,583
loan and interest payment(Nagoya-city) 0
loan and interest payment (Bank etc) 31,250
2.Plant and equipment funds
Furniture, Etc 41,667
Total expenditure(②) 703,042
Lack of capital(①-②) (539,542)
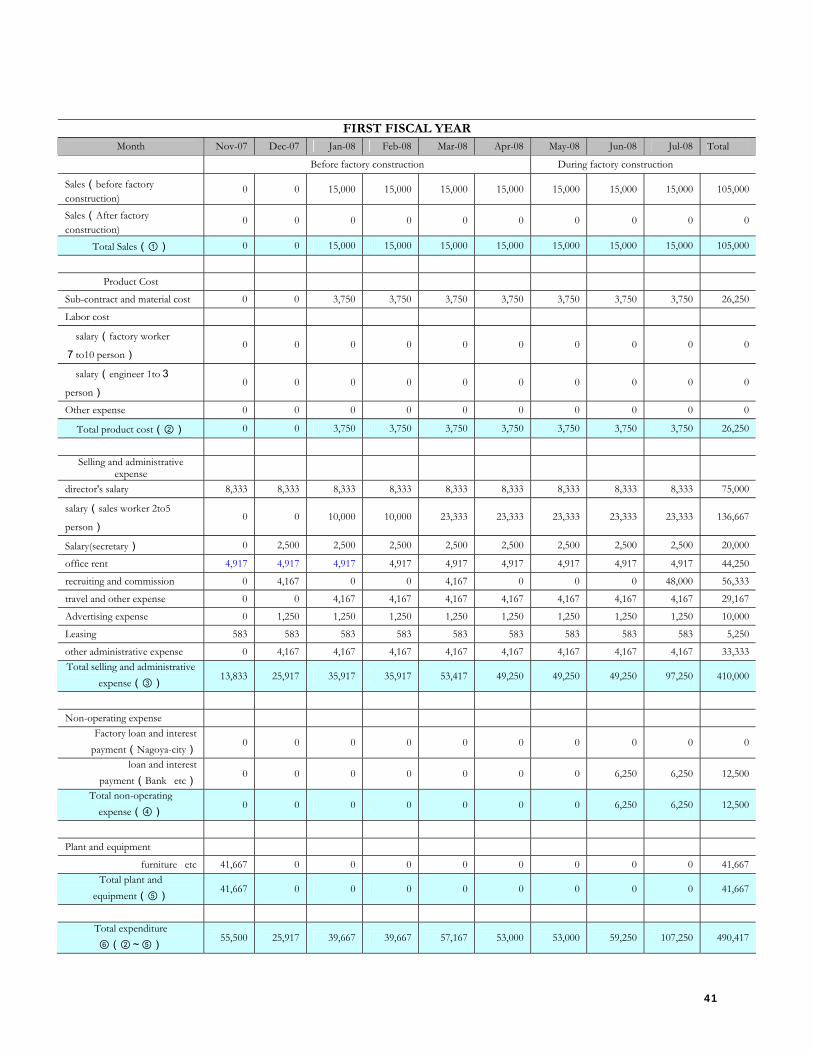
41
FIRST FISCAL YEAR Month Nov-07 Dec-07 Jan-08 Feb-08 Mar-08 Apr-08 May-08 Jun-08 Jul-08 Total
Before factory construction During factory construction Sales(before factory construction)
0 0 15,000 15,000 15,000 15,000 15,000 15,000 15,000 105,000
Sales(After factory construction)
0 0 0 0 0 0 0 0 0 0
Total Sales(①) 0 0 15,000 15,000 15,000 15,000 15,000 15,000 15,000 105,000
Product Cost
Sub-contract and material cost 0 0 3,750 3,750 3,750 3,750 3,750 3,750 3,750 26,250
Labor cost
salary(factory worker
7to10 person) 0 0 0 0 0 0 0 0 0 0
salary(engineer 1to3
person) 0 0 0 0 0 0 0 0 0 0
Other expense 0 0 0 0 0 0 0 0 0 0
Total product cost(②) 0 0 3,750 3,750 3,750 3,750 3,750 3,750 3,750 26,250
Selling and administrative
expense
director's salary 8,333 8,333 8,333 8,333 8,333 8,333 8,333 8,333 8,333 75,000
salary(sales worker 2to5
person) 0 0 10,000 10,000 23,333 23,333 23,333 23,333 23,333 136,667
Salary(secretary) 0 2,500 2,500 2,500 2,500 2,500 2,500 2,500 2,500 20,000
office rent 4,917 4,917 4,917 4,917 4,917 4,917 4,917 4,917 4,917 44,250
recruiting and commission 0 4,167 0 0 4,167 0 0 0 48,000 56,333
travel and other expense 0 0 4,167 4,167 4,167 4,167 4,167 4,167 4,167 29,167
Advertising expense 0 1,250 1,250 1,250 1,250 1,250 1,250 1,250 1,250 10,000
Leasing 583 583 583 583 583 583 583 583 583 5,250
other administrative expense 0 4,167 4,167 4,167 4,167 4,167 4,167 4,167 4,167 33,333 Total selling and administrative
expense(③) 13,833 25,917 35,917 35,917 53,417 49,250 49,250 49,250 97,250 410,000
Non-operating expense Factory loan and interest
payment(Nagoya-city) 0 0 0 0 0 0 0 0 0 0
loan and interest payment(Bank etc)
0 0 0 0 0 0 0 6,250 6,250 12,500
Total non-operating expense(④)
0 0 0 0 0 0 0 6,250 6,250 12,500
Plant and equipment
furniture etc 41,667 0 0 0 0 0 0 0 0 41,667 Total plant and
equipment(⑤) 41,667 0 0 0 0 0 0 0 0 41,667
Total expenditure ⑥(②~⑤)
55,500 25,917 39,667 39,667 57,167 53,000 53,000 59,250 107,250 490,417
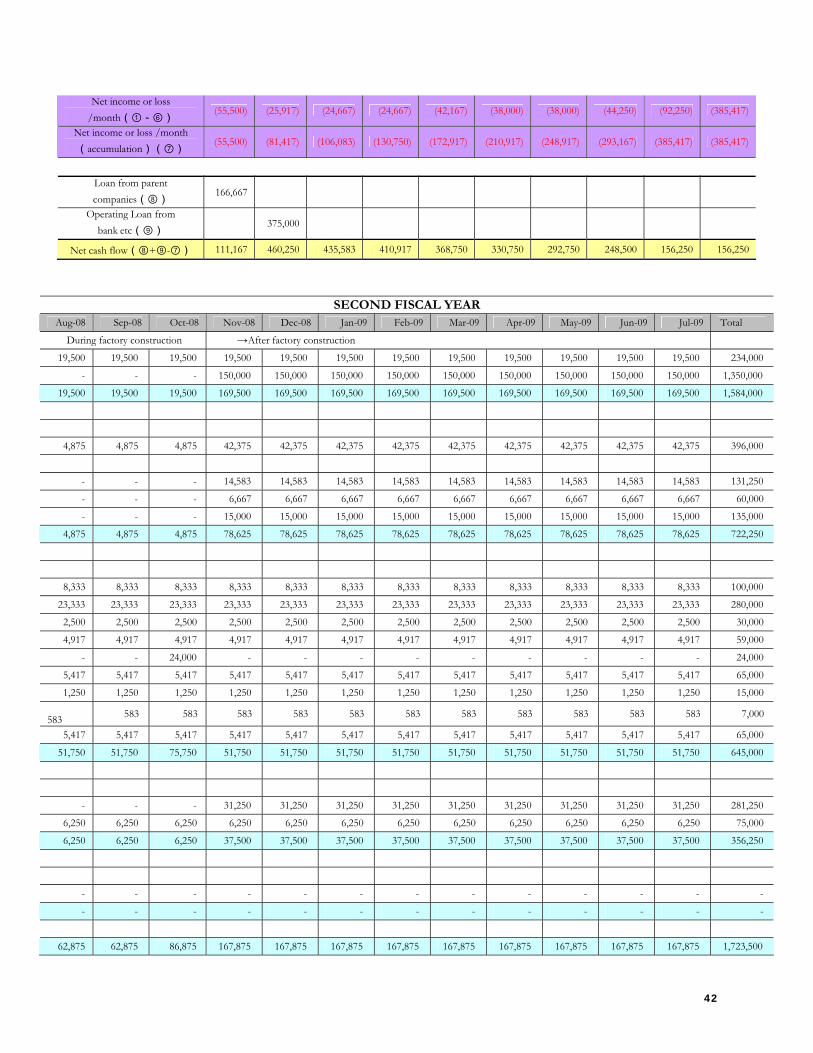
42
Net income or loss /month(①-⑥)
(55,500) (25,917) (24,667) (24,667) (42,167) (38,000) (38,000) (44,250) (92,250) (385,417)
Net income or loss /month (accumulation)(⑦)
(55,500) (81,417) (106,083) (130,750) (172,917) (210,917) (248,917) (293,167) (385,417) (385,417)
Loan from parent companies(⑧)
166,667
Operating Loan from bank etc(⑨)
375,000
Net cash flow(⑧+⑨-⑦) 111,167 460,250 435,583 410,917 368,750 330,750 292,750 248,500 156,250 156,250
SECOND FISCAL YEAR Aug-08 Sep-08 Oct-08 Nov-08 Dec-08 Jan-09 Feb-09 Mar-09 Apr-09 May-09 Jun-09 Jul-09 Total
During factory construction →After factory construction
19,500 19,500 19,500 19,500 19,500 19,500 19,500 19,500 19,500 19,500 19,500 19,500 234,000
- - - 150,000 150,000 150,000 150,000 150,000 150,000 150,000 150,000 150,000 1,350,000
19,500 19,500 19,500 169,500 169,500 169,500 169,500 169,500 169,500 169,500 169,500 169,500 1,584,000
4,875 4,875 4,875 42,375 42,375 42,375 42,375 42,375 42,375 42,375 42,375 42,375 396,000
- - - 14,583 14,583 14,583 14,583 14,583 14,583 14,583 14,583 14,583 131,250
- - - 6,667 6,667 6,667 6,667 6,667 6,667 6,667 6,667 6,667 60,000
- - - 15,000 15,000 15,000 15,000 15,000 15,000 15,000 15,000 15,000 135,000
4,875 4,875 4,875 78,625 78,625 78,625 78,625 78,625 78,625 78,625 78,625 78,625 722,250
8,333 8,333 8,333 8,333 8,333 8,333 8,333 8,333 8,333 8,333 8,333 8,333 100,000
23,333 23,333 23,333 23,333 23,333 23,333 23,333 23,333 23,333 23,333 23,333 23,333 280,000
2,500 2,500 2,500 2,500 2,500 2,500 2,500 2,500 2,500 2,500 2,500 2,500 30,000
4,917 4,917 4,917 4,917 4,917 4,917 4,917 4,917 4,917 4,917 4,917 4,917 59,000
- - 24,000 - - - - - - - - - 24,000
5,417 5,417 5,417 5,417 5,417 5,417 5,417 5,417 5,417 5,417 5,417 5,417 65,000
1,250 1,250 1,250 1,250 1,250 1,250 1,250 1,250 1,250 1,250 1,250 1,250 15,000 583 583 583 583 583 583 583 583 583 583 583 583 7,000
5,417 5,417 5,417 5,417 5,417 5,417 5,417 5,417 5,417 5,417 5,417 5,417 65,000
51,750 51,750 75,750 51,750 51,750 51,750 51,750 51,750 51,750 51,750 51,750 51,750 645,000
- - - 31,250 31,250 31,250 31,250 31,250 31,250 31,250 31,250 31,250 281,250
6,250 6,250 6,250 6,250 6,250 6,250 6,250 6,250 6,250 6,250 6,250 6,250 75,000
6,250 6,250 6,250 37,500 37,500 37,500 37,500 37,500 37,500 37,500 37,500 37,500 356,250
- - - - - - - - - - - - -
- - - - - - - - - - - - -
62,875 62,875 86,875 167,875 167,875 167,875 167,875 167,875 167,875 167,875 167,875 167,875 1,723,500
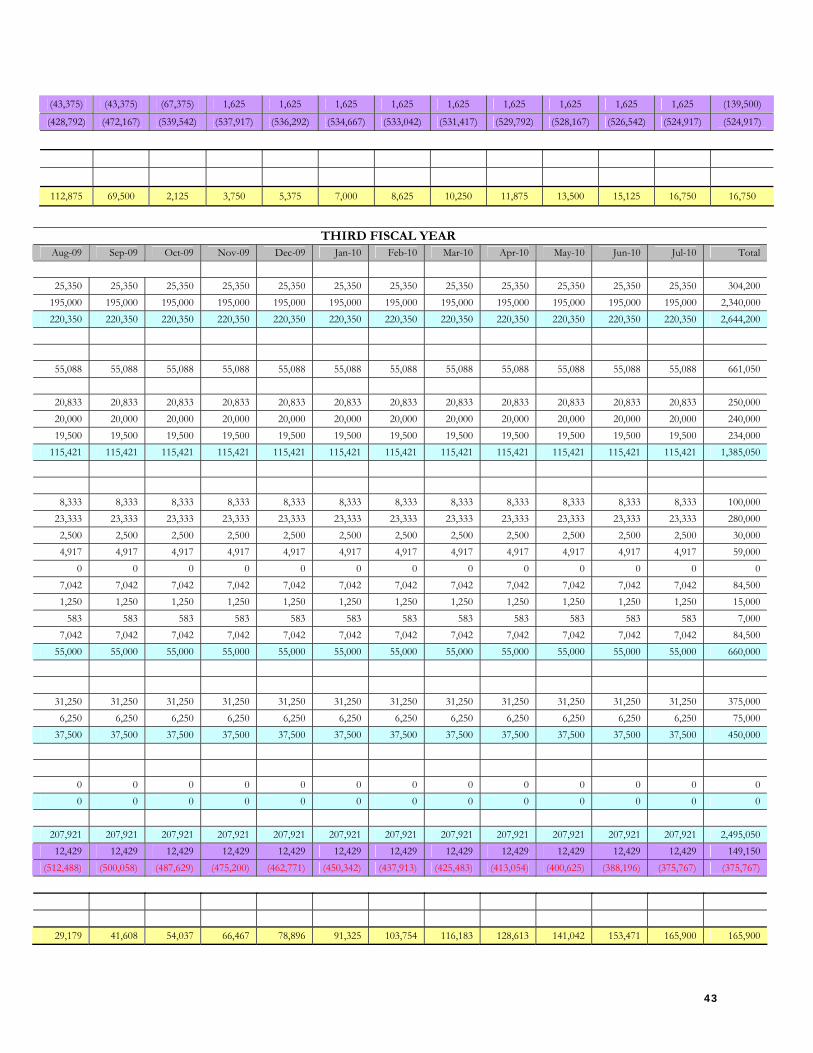
43
THIRD FISCAL YEAR
Aug-09 Sep-09 Oct-09 Nov-09 Dec-09 Jan-10 Feb-10 Mar-10 Apr-10 May-10 Jun-10 Jul-10 Total
25,350 25,350 25,350 25,350 25,350 25,350 25,350 25,350 25,350 25,350 25,350 25,350 304,200 195,000 195,000 195,000 195,000 195,000 195,000 195,000 195,000 195,000 195,000 195,000 195,000 2,340,000 220,350 220,350 220,350 220,350 220,350 220,350 220,350 220,350 220,350 220,350 220,350 220,350 2,644,200
55,088 55,088 55,088 55,088 55,088 55,088 55,088 55,088 55,088 55,088 55,088 55,088 661,050
20,833 20,833 20,833 20,833 20,833 20,833 20,833 20,833 20,833 20,833 20,833 20,833 250,000 20,000 20,000 20,000 20,000 20,000 20,000 20,000 20,000 20,000 20,000 20,000 20,000 240,000 19,500 19,500 19,500 19,500 19,500 19,500 19,500 19,500 19,500 19,500 19,500 19,500 234,000
115,421 115,421 115,421 115,421 115,421 115,421 115,421 115,421 115,421 115,421 115,421 115,421 1,385,050
8,333 8,333 8,333 8,333 8,333 8,333 8,333 8,333 8,333 8,333 8,333 8,333 100,000 23,333 23,333 23,333 23,333 23,333 23,333 23,333 23,333 23,333 23,333 23,333 23,333 280,000 2,500 2,500 2,500 2,500 2,500 2,500 2,500 2,500 2,500 2,500 2,500 2,500 30,000 4,917 4,917 4,917 4,917 4,917 4,917 4,917 4,917 4,917 4,917 4,917 4,917 59,000
0 0 0 0 0 0 0 0 0 0 0 0 0 7,042 7,042 7,042 7,042 7,042 7,042 7,042 7,042 7,042 7,042 7,042 7,042 84,500 1,250 1,250 1,250 1,250 1,250 1,250 1,250 1,250 1,250 1,250 1,250 1,250 15,000
583 583 583 583 583 583 583 583 583 583 583 583 7,000 7,042 7,042 7,042 7,042 7,042 7,042 7,042 7,042 7,042 7,042 7,042 7,042 84,500
55,000 55,000 55,000 55,000 55,000 55,000 55,000 55,000 55,000 55,000 55,000 55,000 660,000
31,250 31,250 31,250 31,250 31,250 31,250 31,250 31,250 31,250 31,250 31,250 31,250 375,000 6,250 6,250 6,250 6,250 6,250 6,250 6,250 6,250 6,250 6,250 6,250 6,250 75,000
37,500 37,500 37,500 37,500 37,500 37,500 37,500 37,500 37,500 37,500 37,500 37,500 450,000
0 0 0 0 0 0 0 0 0 0 0 0 0 0 0 0 0 0 0 0 0 0 0 0 0 0
207,921 207,921 207,921 207,921 207,921 207,921 207,921 207,921 207,921 207,921 207,921 207,921 2,495,050 12,429 12,429 12,429 12,429 12,429 12,429 12,429 12,429 12,429 12,429 12,429 12,429 149,150
(512,488) (500,058) (487,629) (475,200) (462,771) (450,342) (437,913) (425,483) (413,054) (400,625) (388,196) (375,767) (375,767)
29,179 41,608 54,037 66,467 78,896 91,325 103,754 116,183 128,613 141,042 153,471 165,900 165,900
(43,375) (43,375) (67,375) 1,625 1,625 1,625 1,625 1,625 1,625 1,625 1,625 1,625 (139,500)
(428,792) (472,167) (539,542) (537,917) (536,292) (534,667) (533,042) (531,417) (529,792) (528,167) (526,542) (524,917) (524,917)
112,875 69,500 2,125 3,750 5,375 7,000 8,625 10,250 11,875 13,500 15,125 16,750 16,750
44
5.2 CHOOSING A LOCATION
The primary focus of this model has centered on Nagoya, and Okinawa Japan. Nagoya for its access to many of the Japanese OEM’s, Government support, as well as the vast amount of T1 suppliers with operations in the area. Okinawa for its tax advantage and being the only Free Trade Zone in Japan with easy shipping access world wide. When considering which location of the two there are many factors to take into consideration, especially the intent of the product line itself. To wit: each component or assembly will belong to a different marketing schema from one and other.
For example, from years of experience in Japanese Automotive, Wire Harnesses would be recommended to focus on Mazda work, as they have recently been plagued with defects and recalls. Seat Cushions on the other hand would be focused on Toyota at the moment, since Toyota is now in the process of seeking out a Seat Cushion Supplier to support their North American Operations. in this equation it is very important item to keep in mind that once part of the Japanese business paradigm, the corporation itself, can be moved to other areas of Japan, or ability to expand operations to a different location requires very little work from a legal perspective.
45
VI. MODEL 2 - AUTOMOTIVE TRADE INFORMATION CENTER Automotive Trade Information Centre differs with respect to the services they provide. There are those that offer only basic secretariat functions, assist with translations and/or provide market research. There are, however, also those that help members develop a complete export strategy and provide a wider range of services, including collective purchases of inputs, legal assistance, the creation of a consortium brand and other forms of marketing. The two main types of ATIC that can be distinguished are promotional and sales consortia. Within this classification, several varieties of export can be identified: • Single-sector and multi-sector consortia; • Consortia grouping competitors and those offering complementary goods and services; • Regional consortia and those comprising members from several regions; • Consortia targeting a specific region and those active on a global scale. 6.1 PROMOTIONAL AND SALES Whereas the former refers to an alliance created to explore specific export markets by sharing promotional and logistic costs, the latter represents an entity that channels the members’ exports. Promotional consortia thus confine themselves to promoting the products of their members and to assist these in accessing foreign markets. Sales are directly performed by the associated companies. Sales consortia, on the other hand, perform business promotion activities and organize the sale of member firms’ products. To ensure a certain image, these types of consortia often control the quality of the marketed products. While the number of member firms is typically limited in a sales consortium, promotional consortia usually have a significant number of members. Within sales consortia, member firms delegate the authority to do business in their name to the managers of the consortium. Two types of sales consortia exist: (a) trading consortia, i.e. those that purchase the products from the member firms in order to resell them, and (b) consortia acting as export agents. Whereas in the former, the consortium negotiates credits and pays the member firms for their products, in the latter, member firms send their own invoices and attempt to obtain payment from their clients (Renart, 1997). Most sales consortia do not permit member firms to export on their own and require them to make use of the consortium instead. Depending on the consortium, however, the degree to which this is enforced may vary. Whereas some sales consortia apply this rule to all products and countries, others restrict it to the target markets and the products sold through the consortium (Welch and Joynt, 1987). Since the members operate as a group on foreign markets, harmful behavior, inadequate Product quality or excessive prices of one member can have a damaging effect on the exports of the other members. This is likely to be more relevant in sales than in promotional consortia. It is crucial that the documents of incorporation. Specify which measures may be taken if such a situation arises, for example replacing the members’ products.
46
6.2 SINGLE-SECTOR AND MULTI-SECTOR CONSORTIA Single-sector consortia allow activities to focus on member firms’ products, as these are more homogeneous than those of firms belonging to multi-sector consortia. In addition, firms active in a specific sector tend to be acquainted with each other and to have greater knowledge of each other’s businesses than those operating in several sectors. This is likely to improve cooperation among members. The main benefit of multi-sector consortia is that a wider range of products can be offered. For example, a consortium might be able to offer a complete range of hotel supplies (lifts, furniture, decorations, lighting and kitchen equipment). Cost savings are attainable for these types of consortia, provided that products are sufficiently close so that the same promotional methods can be applied to all goods and services. Despite the variety of firms within a multi-sector consortium, the group should be able to portray a common image. It is thus essential that members’ products are compatible with respect to design and quality. Whereas the main binding elements between members of single-sector consortia are their familiarity with each other and the products they produce, members of multi-sector consortia often only share the will to access foreign markets. If member firms produce closely related products, they might perceive each other as competitors and restrict their partnership to certain limited activities. Thus, unless members of a single-sector consortium produce complementary—and not competing— goods, cooperation between member firms may be enhanced within multisector consortia. Although products of the same sector are typically similar to each other, a generalization cannot be made that members of single-sector consortia are competitors while those of multi-sector consortia are not. Even within the same sector, goods often differ greatly from each other so that member firms of a single-sector consortium may in fact produce complementary goods. 6.3 CONSORTIA BETWEEN COMPETITORS AND BETWEEN NON-COMPETITORS When consortia are comprised of direct competitors, activities can be targeted directly to the goods or services produced and economies of scale can be achieved. Above all, more opportunities exist to share R&D projects (Renart, 1999). However, due to a lack of trust and a high potential for conflict, most firms are reluctant to create an alliance with their competitors. If a consortium comprises competing firms, each member is likely to press for his personal goals, which will meet the resistance of the other members. The consortium may thus be hampered in its effectiveness and management costs may be higher than for consortia of non-competitors since conflicts have to be resolved. Nevertheless, there may be a danger that consortia grouping only producers of complementary goods are not able to supply the quantities demanded. 6.4 REGIONAL CONSORTIA Whether consortia comprise members of a specific region or of several regions typically depends on whether the initiative to establish a consortium comes from a national organization of enterprises in a specific sector or a local chamber of commerce. National consortia have the advantage that they can bring geographically dispersed firms into contact. They are thus more representative and may result in less competition between members than regional groups. Regional consortia, on the other hand, often have a specific local purpose, e.g. the promotion of typical food products or artisan goods. These types of consortia often emerge out of industrial districts. There is a two-way relationship between industrial districts and export consortia.
47
6.5 GLOBAL CONSORTIA The geographical outreach of the consortium’s activity is another differentiating characteristic among consortia. If the markets targeted by the consortium are in the same geographic area, costs of operations can be minimized. Not only can transport expenses be reduced, but also information and advertising costs since the cultural distance between different countries within the region is likely to be small. However, as a consortium’s activities move to a more global scale, diversification of export markets will increase. In addition to the different types of consortia outlined above, country specific classifications exist. In Spain a distinction is made between consortia in “origin” and in “destination”, depending on the location of a consortium’s headquarters. Whereas the former refers to consortia with headquarters in the home country (spain in this case), the latter refers to consortia with headquarters abroad and is not as common as the former. Both types may establish subsidiaries in other countries. Some experts further distinguish between hard and soft consortia. Hard consortia are those with long-term objectives that are likely to operate permanently with or without expansion of membership. Soft consortia, by contrast, are those that are formed for a specific purpose and that are dissolved after the task is achieved. They are thus a more informal type of cooperation between firms. Although uncommon, some soft consortia might mature into hard ones when the members perceive the benefits of the collective approach and broaden their objectives and commitments.
48
VII. EXPECTED RESULTS
Through a combination of Automotive Component market opportunities, jurisprudence, bilateral and multilateral trade agreements, we has identified a niche in the Global Marketplace for Indonesian auto parts manufacturers to enter the global market. In association with Japanese Manufactures, this process would allow Indonesian companies to be part in the Japanese business paradigm, subsequently “spring-boarding” or “piggy backing” the Japanese OEM’s and T1’s into further market opportunities in Japan, NA, EU, and Australia. This process can proceed, either as a single company specific entity, or that of a conglomerate using multiple Indonesian companies under the same umbrella new export company in Japan. This model is not only beneficial for Indonesia, but a quid-pro-quo for Japan. To wit: not only will it open new business prospects for the Indonesian supply base, but value added for the Japanese from the large amount of jobs that it would generate for Japanese nationals. On the downside, cultural and language differentials would need to be spotlighted. Many previous companies that have attempted to enter the Japanese business system have unfortunately failed. This failure can be attributed to lack of understanding of Japanese business protocols, language barriers, and cultural differentials. As described in this report, Indonesian suppliers would perform a substantial part of the manufacturing in Indonesia, with secondary operations and quality certifications taking place in Japan, preempting the current dependency on JV partnerships designed only to take advantage of the low labor costs, and Third World market share. In this report, Advantages and Disadvantages need to be carefully weighed out in the decision making process. The following list offers a macro view of what should be taken into consideration.
Advantages: Disadvantages:
Cost and risk of exporting reduced.
Majority of value and profit goes to foreign producer.
Access to foreign investment and other financial resources.
Lack of anonymity.
Access to new technologies and customers in export markets.
High potential for failure, due to power distribution.
Access to innovative managerial practices.
Minimal downward transfer of standards and skilled personnel into local producers.
Expected results: ► Indonesia/Japan Producers ― 1st Tier. The ability to achieve Superior Part Certification from
foreign bodies and be able to supply world class T1 parts without the need for a JV partner is the principal of this model. Also, the recognition of Indonesian automotive parts as “World Class” is a first step into a long financially beneficial endeavor.
► Indonesia Producers ― 2nd/3rd Tier. In this process, the 2nd/3rd Tier Indonesian suppliers
have the opportunity to move into T1 status. The actual company dealing with the OEM’s would be the Japanese Export and Manufacturing Company – in Japan.
► End Market Consumer. Top quality, piece price reduction, Delivery, and ameliorated logistics.

49
APPENDIX
50
ALTERNATIVE MODELS FOR INDONESIAN AUTOMOTIVE COMPONENT EXPORT PROMOTION Presentation ― November 2007
USAID-Financed Project Implemented By DAI
Alternative Models for Indonesian Automotive Component Export Promotion
Jakarta, November 5, 2007Widi B. Prasodjo
Autoparts IVC
USAID-Financed Project Implemented By DAI
SNAPSHOT OF GLOBAL AUTOMOTIVE AND COMPONENT SNAPSHOT OF GLOBAL AUTOMOTIVE AND COMPONENT EXPORT MARKET EXPORT MARKET
Original Equipment Manufacturer (OEM) Original Equipment Manufacturer (OEM) and and
Aftermarket (AM)Aftermarket (AM)
* Source: World Motor Vehicle Production by Country Y2006 (OICA correspondents survey).
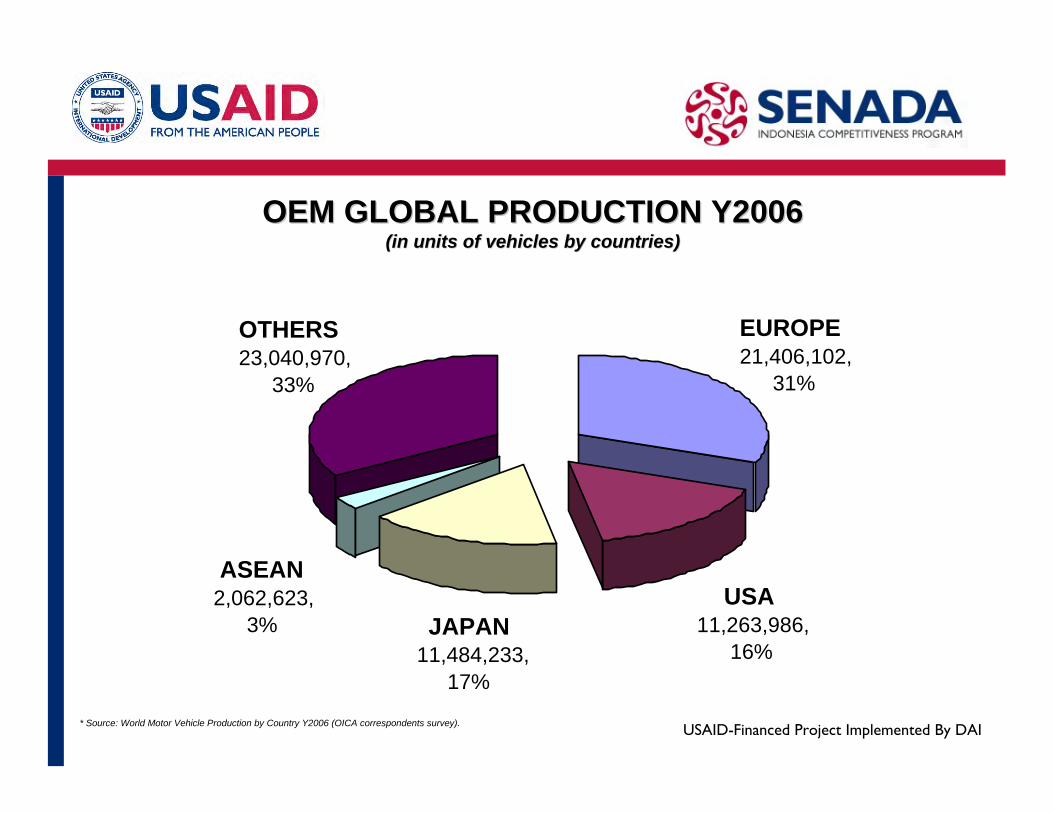
USAID-Financed Project Implemented By DAI
OEM GLOBAL PRODUCTION Y2006OEM GLOBAL PRODUCTION Y2006(in units of vehicles by countries)(in units of vehicles by countries)
* Source: World Motor Vehicle Production by Country Y2006 (OICA correspondents survey).
USA 11,263,986,
16%JAPAN
11,484,233, 17%
ASEAN2,062,623,
3%
OTHERS 23,040,970,
33%
EUROPE 21,406,102,
31%
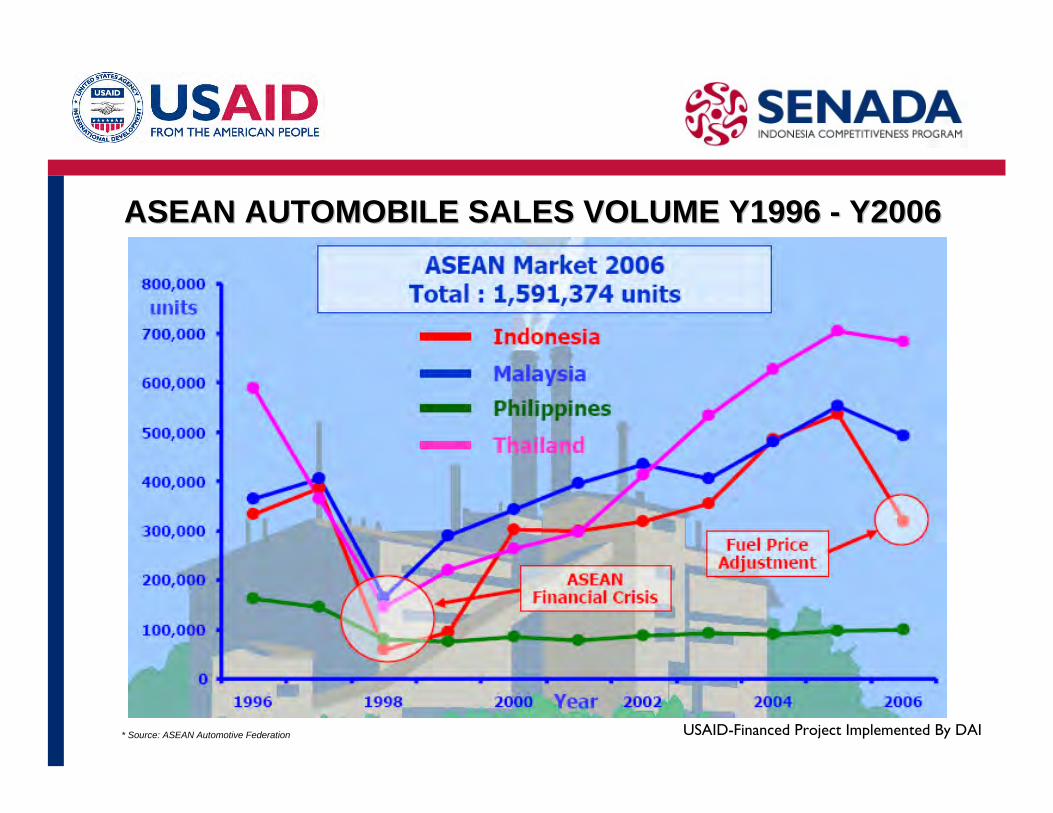
USAID-Financed Project Implemented By DAI* Source: ASEAN Automotive Federation
ASEAN AUTOMOBILE SALES VOLUME Y1996 ASEAN AUTOMOBILE SALES VOLUME Y1996 -- Y2006Y2006
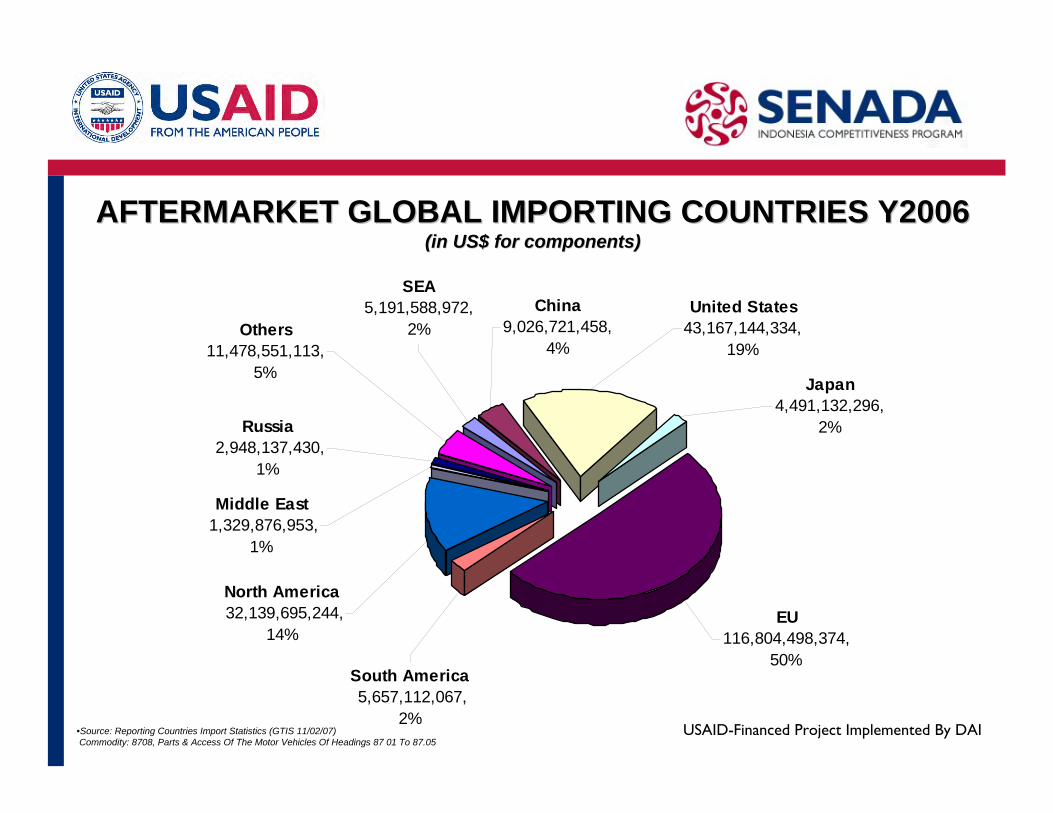
USAID-Financed Project Implemented By DAI
AFTERMARKET GLOBAL IMPORTING COUNTRIES Y2006 AFTERMARKET GLOBAL IMPORTING COUNTRIES Y2006 (in US$ for components)(in US$ for components)
•Source: Reporting Countries Import Statistics (GTIS 11/02/07)Commodity: 8708, Parts & Access Of The Motor Vehicles Of Headings 87 01 To 87.05
Russia 2,948,137,430,
1%
Middle East 1,329,876,953,
1%
North America 32,139,695,244,
14%
South America 5,657,112,067,
2%
Others 11,478,551,113,
5%
SEA5,191,588,972,
2%China
9,026,721,458, 4%
United States 43,167,144,334,
19%
Japan4,491,132,296,
2%
EU116,804,498,374,
50%
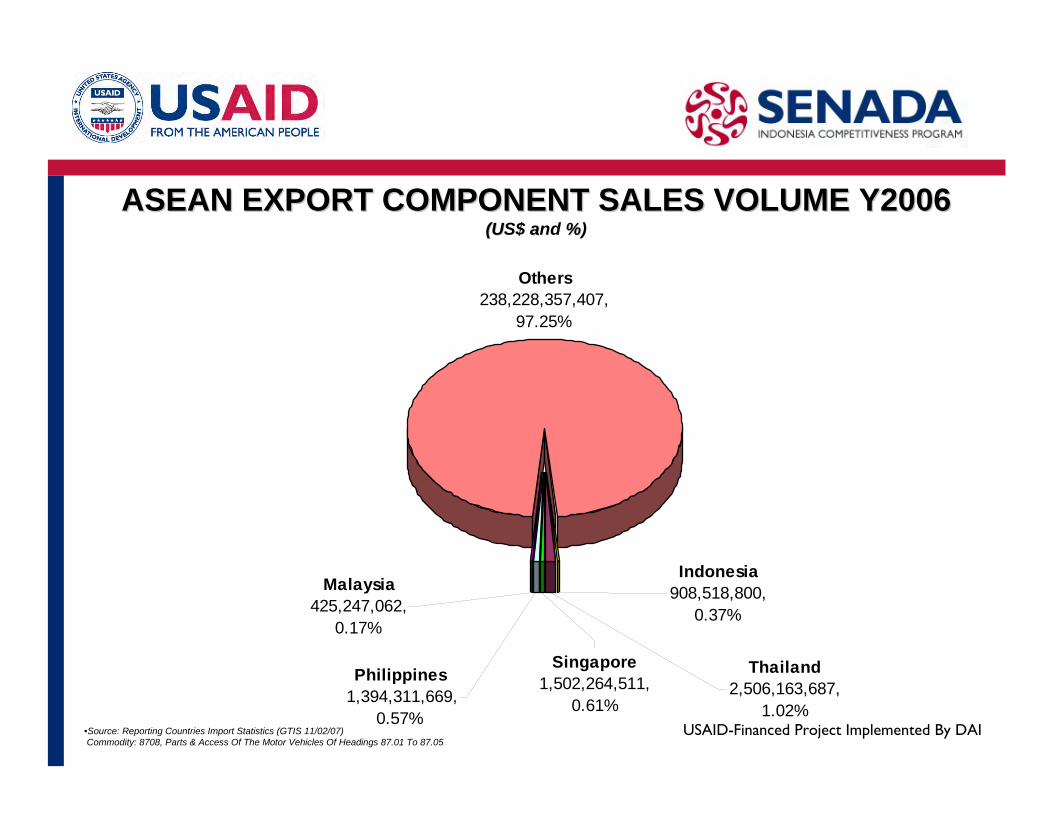
USAID-Financed Project Implemented By DAI
Others238,228,357,407,
97.25%
Indonesia 908,518,800,
0.37%
Thailand2,506,163,687,
1.02%
Singapore1,502,264,511,
0.61%
Philippines1,394,311,669,
0.57%
Malaysia 425,247,062,
0.17%
ASEAN EXPORT COMPONENT SALES VOLUME Y2006 ASEAN EXPORT COMPONENT SALES VOLUME Y2006 (U a %(US$ and %)
•Source: Reporting Countries Import Statistics (GTIS 11/02/07)Commodity: 8708, Parts & Access Of The Motor Vehicles Of Headings 87.01 To 87.05
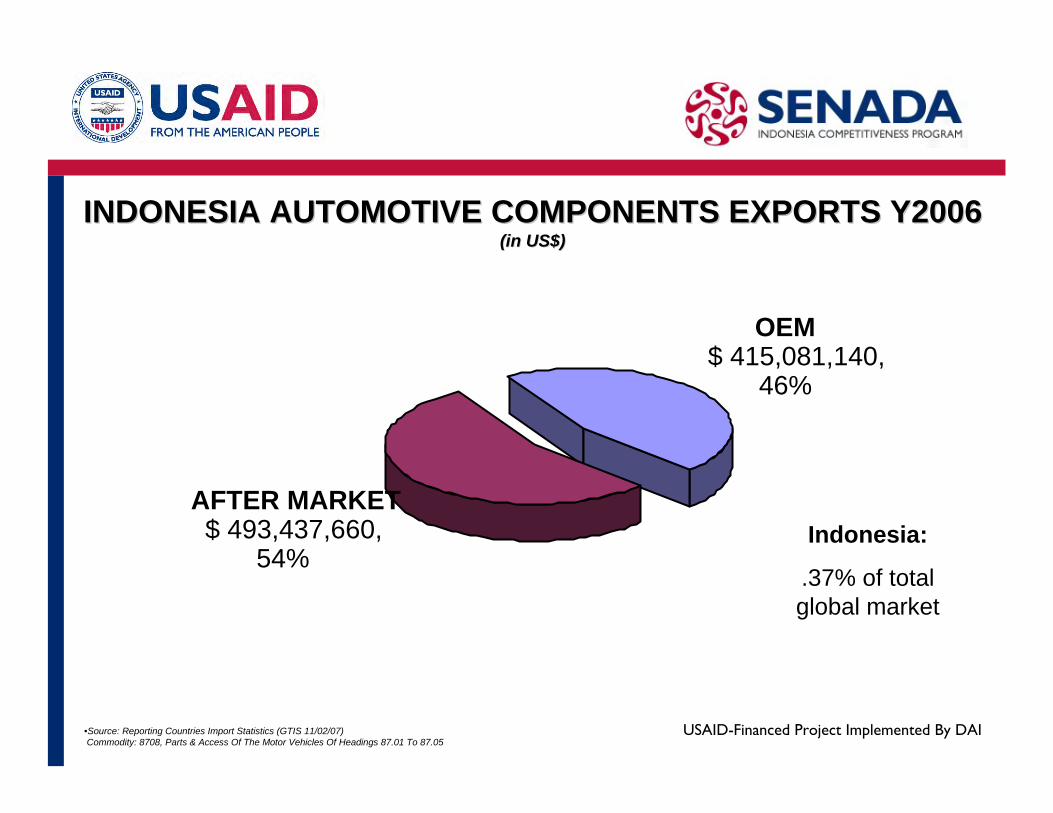
USAID-Financed Project Implemented By DAI
Indonesia:
.37% of total global market
•Source: Reporting Countries Import Statistics (GTIS 11/02/07)Commodity: 8708, Parts & Access Of The Motor Vehicles Of Headings 87.01 To 87.05
AFTER MARKET $ 493,437,660,
54%
OEM $ 415,081,140,
46%
INDONESIA AUTOMOTIVE COMPONENTS EXPORTS Y2006INDONESIA AUTOMOTIVE COMPONENTS EXPORTS Y2006(in US$)(in US$)
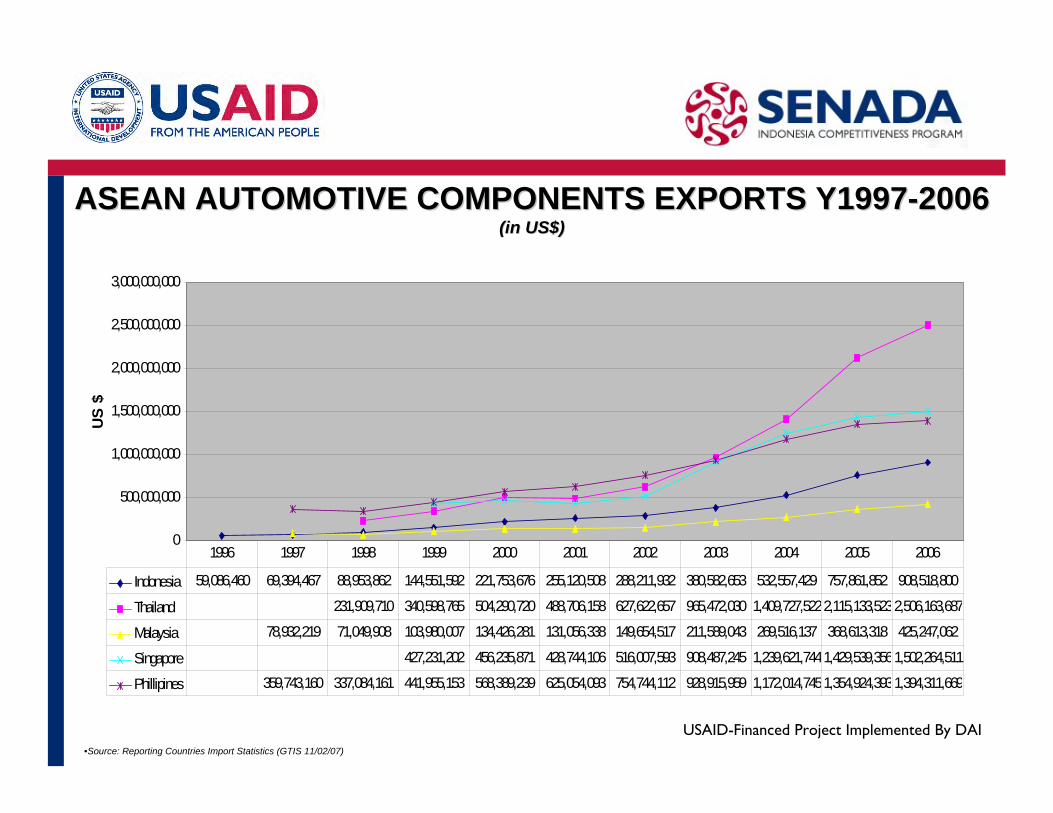
USAID-Financed Project Implemented By DAI
ASEAN AUTOMOTIVE COMPONENTS EXPORTS Y1997ASEAN AUTOMOTIVE COMPONENTS EXPORTS Y1997--20062006(in US$)(in US$)
•Source: Reporting Countries Import Statistics (GTIS 11/02/07)
0
500,000,000
1,000,000,000
1,500,000,000
2,000,000,000
2,500,000,000
3,000,000,000
US
$
Indonesia 59,086,460 69,394,467 88,953,862 144,551,592 221,753,676 255,120,508 288,211,932 380,582,653 532,557,429 757,861,852 908,518,800
Thailand 231,909,710 340,598,765 504,290,720 488,706,158 627,622,657 965,472,030 1,409,727,5222,115,133,5232,506,163,687
Malaysia 78,932,219 71,049,908 103,980,007 134,426,281 131,056,338 149,654,517 211,589,043 269,516,137 368,613,318 425,247,062
Singapore 427,231,202 456,235,871 428,744,106 516,007,593 908,487,245 1,239,621,7441,429,539,3561,502,264,511
Phillipines 359,743,160 337,084,161 441,955,153 568,389,239 625,054,093 754,744,112 928,915,959 1,172,014,7451,354,924,3931,394,311,669
1996 1997 1998 1999 2000 2001 2002 2003 2004 2005 2006
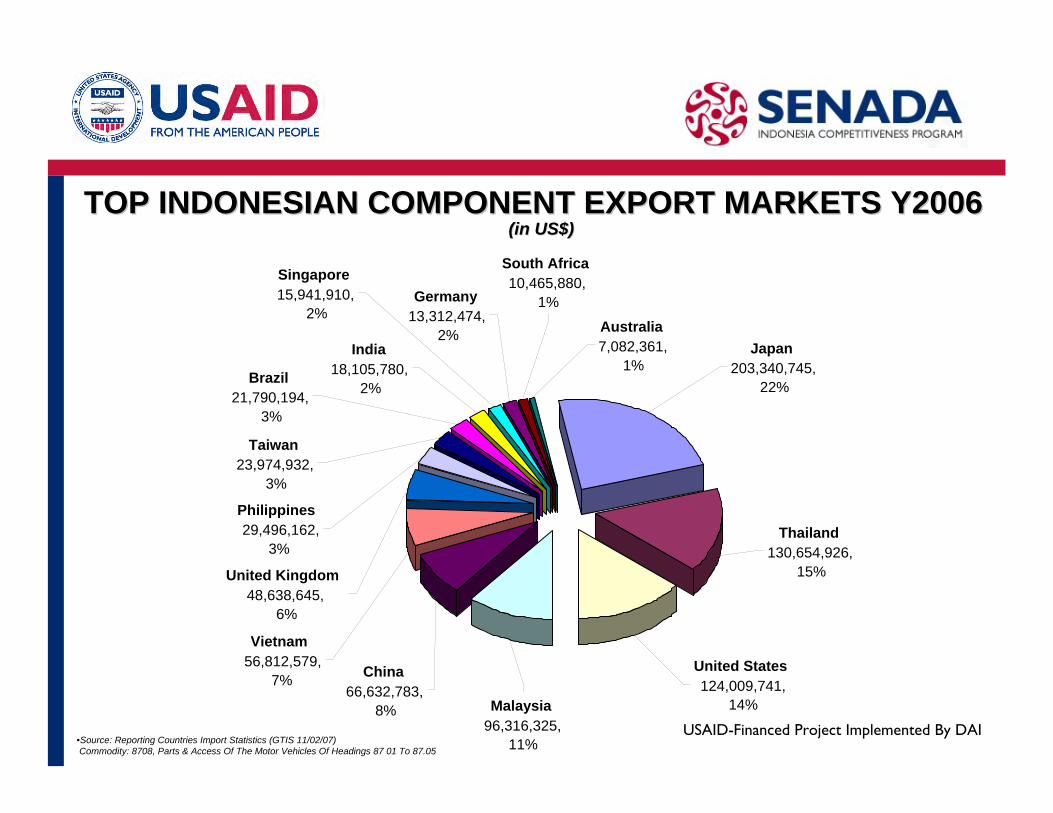
USAID-Financed Project Implemented By DAI
TOP INDONESIAN COMPONENT EXPORT MARKETS Y2006TOP INDONESIAN COMPONENT EXPORT MARKETS Y2006(in US$)(in US$)
•Source: Reporting Countries Import Statistics (GTIS 11/02/07)Commodity: 8708, Parts & Access Of The Motor Vehicles Of Headings 87 01 To 87.05
Taiwan23,974,932,
3%
Philippines29,496,162,
3%
Brazil 21,790,194,
3%
India 18,105,780,
2%
Singapore 15,941,910,
2%Germany
13,312,474, 2%
South Africa 10,465,880,
1%
Australia 7,082,361,
1%
United Kingdom 48,638,645,
6%
Vietnam56,812,579,
7% China 66,632,783,
8% Malaysia 96,316,325,
11%
United States 124,009,741,
14%
Thailand 130,654,926,
15%
Japan 203,340,745,
22%
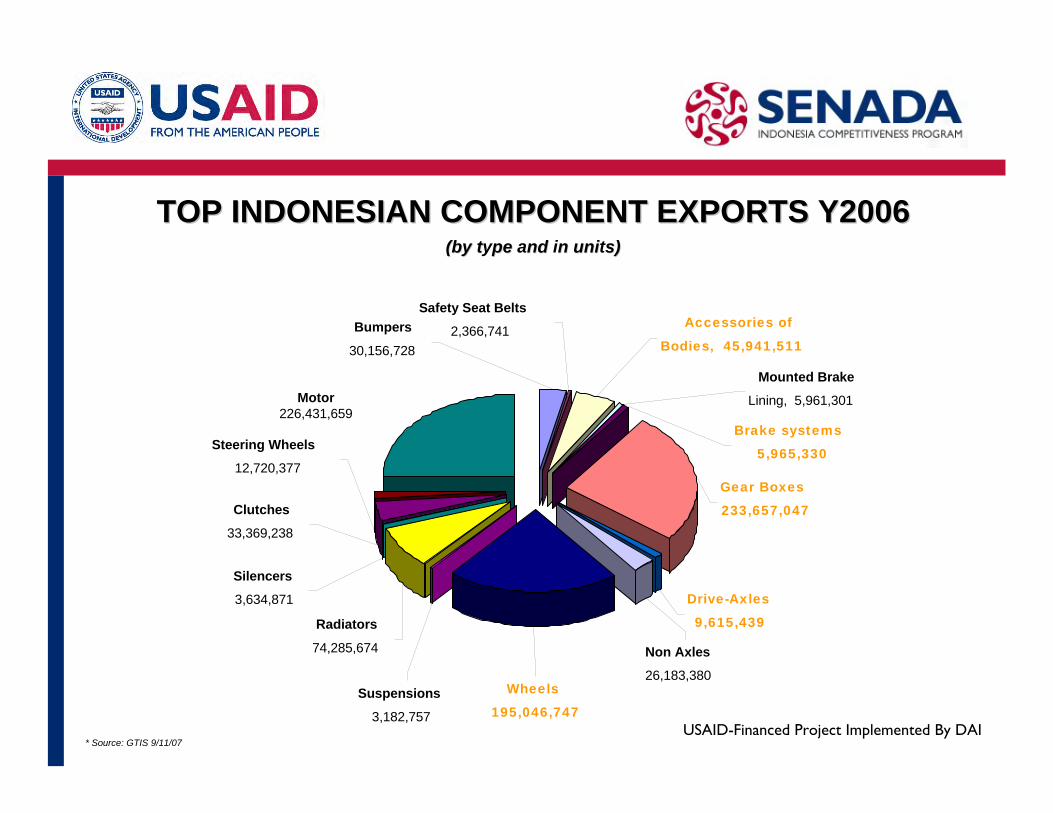
USAID-Financed Project Implemented By DAI* Source: GTIS 9/11/07
TOP INDONESIAN COMPONENT EXPORTS Y2006TOP INDONESIAN COMPONENT EXPORTS Y2006
Motor226,431,659
Wheels
195,046,747
Silencers
3,634,871
Steering Wheels
12,720,377
Clutches
33,369,238
Radiators
74,285,674
Suspensions
3,182,757
Drive-Axles
9,615,439
Non Axles
26,183,380
Gear Boxes
233,657,047
Mounted Brake
Lining, 5,961,301
Brake systems
5,965,330
Accessories of
Bodies, 45,941,511
Safety Seat Belts
2,366,741 Bumpers
30,156,728
(by t pe nd n uni s)(by type and in units)
USAID-Financed Project Implemented By DAI
Original Equipment Manufacturer (OEM) Original Equipment Manufacturer (OEM) and and
Aftermarket (AM)Aftermarket (AM)
CURRENT AND ALTERNATIVE MODELS CURRENT AND ALTERNATIVE MODELS FOR FOR
INDONESIAN AUTOMOTIVE EXPORT PROMOTIONINDONESIAN AUTOMOTIVE EXPORT PROMOTION
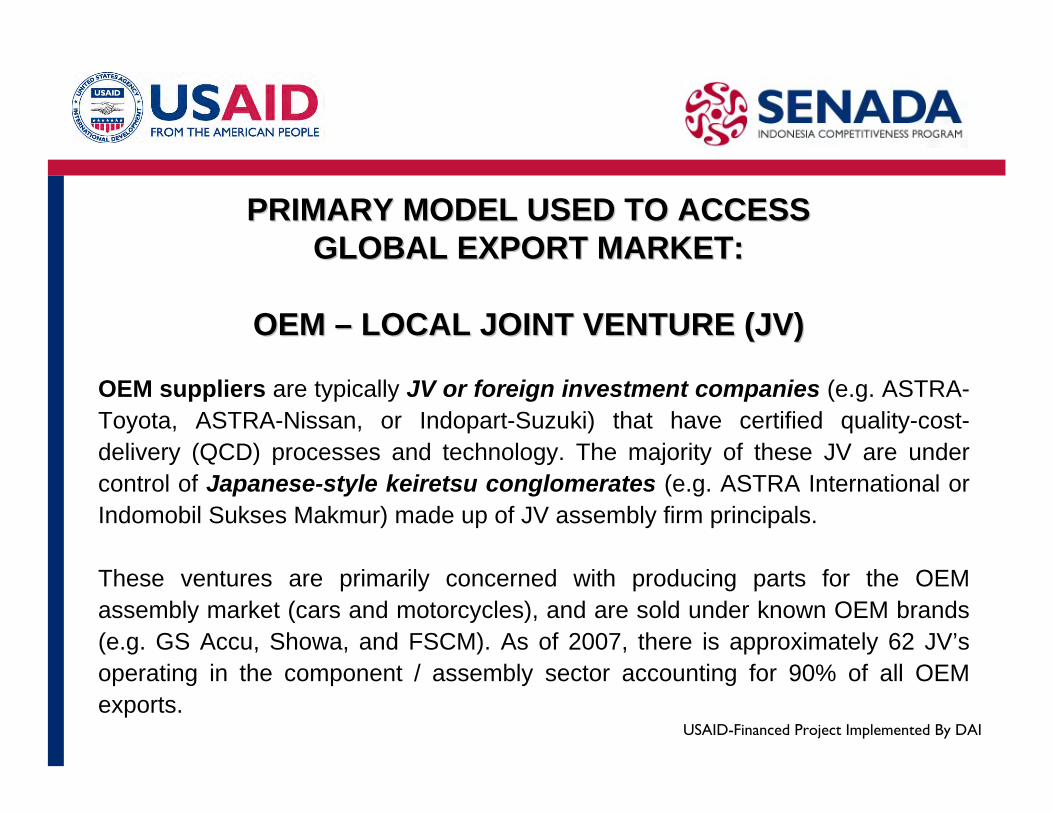
USAID-Financed Project Implemented By DAI
PRIMARY MODEL USED TO ACCESS PRIMARY MODEL USED TO ACCESS GLOBAL EXPORT MARKET:GLOBAL EXPORT MARKET:
OEM OEM –– LOCAL JOINT VENTURE (JV)LOCAL JOINT VENTURE (JV)
OEM suppliers are typically JV or foreign investment companies (e.g. ASTRA-Toyota, ASTRA-Nissan, or Indopart-Suzuki) that have certified quality-cost-delivery (QCD) processes and technology. The majority of these JV are under control of Japanese-style keiretsu conglomerates (e.g. ASTRA International or Indomobil Sukses Makmur) made up of JV assembly firm principals.
These ventures are primarily concerned with producing parts for the OEM assembly market (cars and motorcycles), and are sold under known OEM brands (e.g. GS Accu, Showa, and FSCM). As of 2007, there is approximately 62 JV’s operating in the component / assembly sector accounting for 90% of all OEM exports.
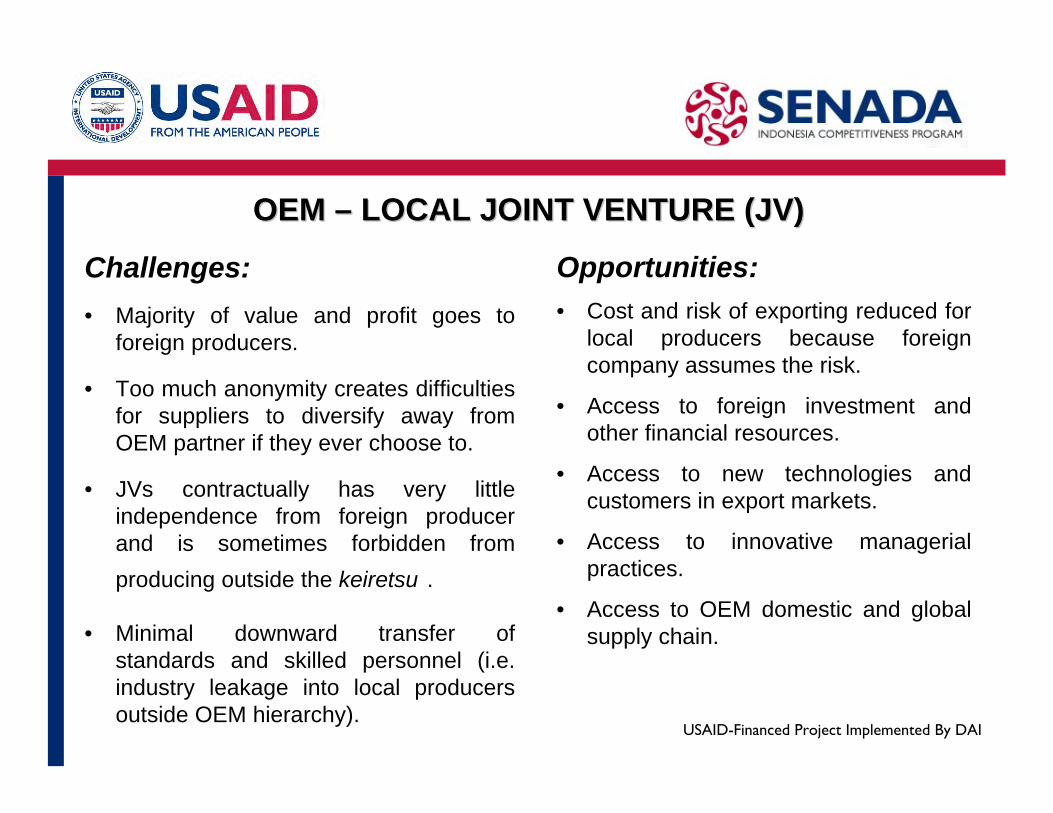
USAID-Financed Project Implemented By DAI
OEM OEM –– LOCAL JOINT VENTURE (JV)LOCAL JOINT VENTURE (JV)
Opportunities:• Cost and risk of exporting reduced for
local producers because foreign company assumes the risk.
• Access to foreign investment and other financial resources.
• Access to new technologies and customers in export markets.
• Access to innovative managerial practices.
• Access to OEM domestic and global supply chain.
Challenges:• Majority of value and profit goes to
foreign producers.
• Too much anonymity creates difficulties for suppliers to diversify away from OEM partner if they ever choose to.
• JVs contractually has very little independence from foreign producer and is sometimes forbidden from producing outside the keiretsu .
• Minimal downward transfer of standards and skilled personnel (i.e. industry leakage into local producers outside OEM hierarchy).
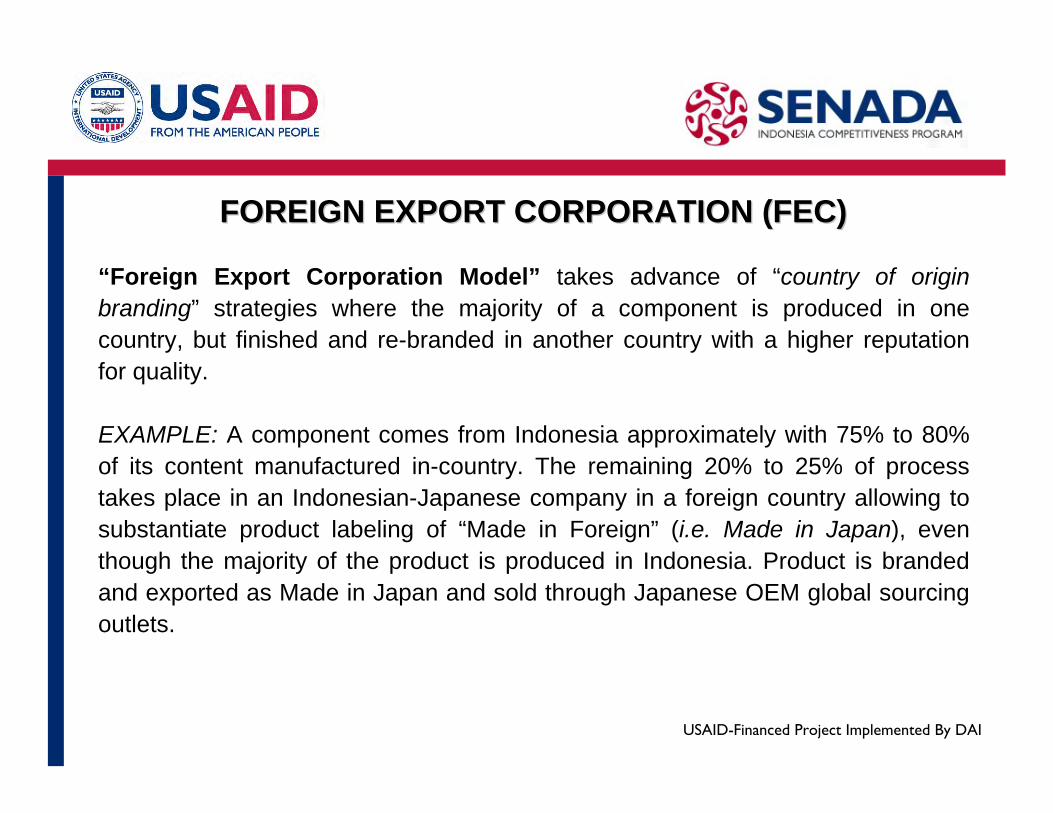
USAID-Financed Project Implemented By DAI
FOREIGN EXPORT CORPORATION (FEC)FOREIGN EXPORT CORPORATION (FEC)
“Foreign Export Corporation Model” takes advance of “country of origin branding” strategies where the majority of a component is produced in onecountry, but finished and re-branded in another country with a higher reputation for quality.
EXAMPLE: A component comes from Indonesia approximately with 75% to 80% of its content manufactured in-country. The remaining 20% to 25% of process takes place in an Indonesian-Japanese company in a foreign country allowing to substantiate product labeling of “Made in Foreign” (i.e. Made in Japan), even though the majority of the product is produced in Indonesia. Product is branded and exported as Made in Japan and sold through Japanese OEM global sourcing outlets.
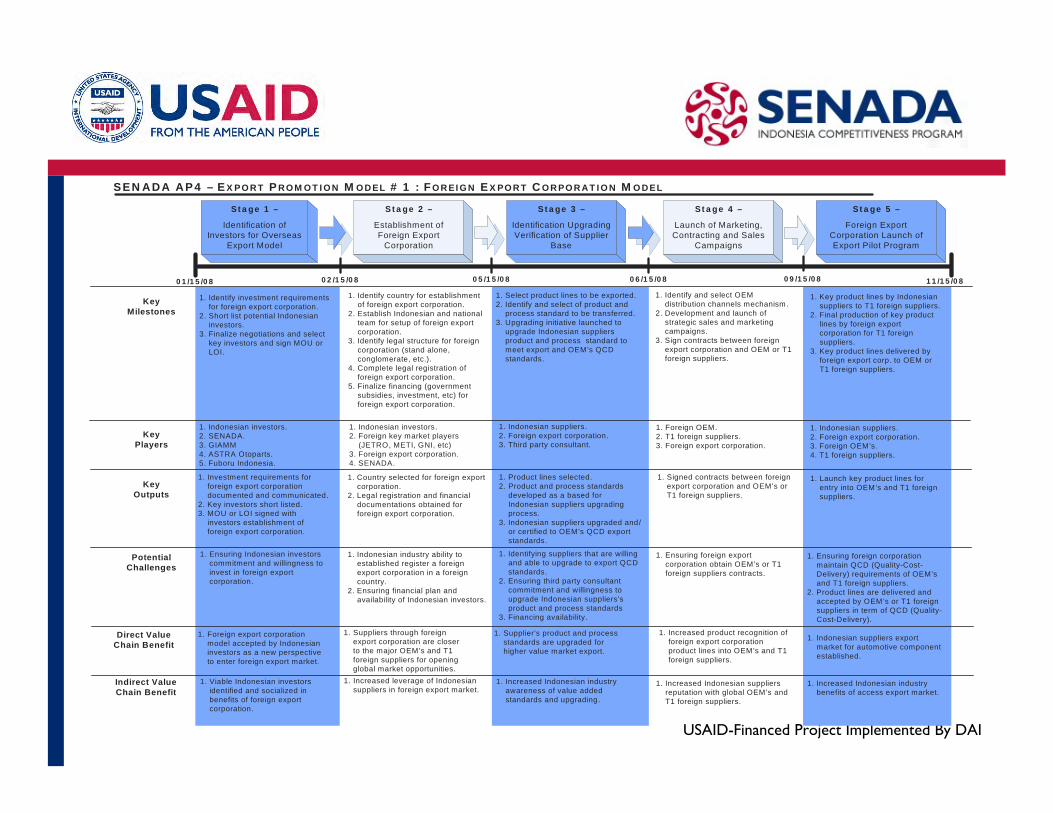
USAID-Financed Project Implemented By DAI
Stage 1 –
Identification of Investors for Overseas
Export Model
Stage 2 –
Establishment of Foreign Export
Corporation
Stage 3 –
Identification Upgrading Verification of Supplier
Base
Stage 4 –
Launch of Marketing, Contracting and Sales
Campaigns
Stage 5 –
Foreign Export Corporation Launch of Export Pilot Program
Key Milestones
Key Players
Key Outputs
Potential Challenges
02/15/08 05/15/08 06/15/08 09/15/0801/15/08 11/15/08
Direct Value Chain Benefit
1. Foreign export corporation model accepted by Indonesian investors as a new perspective to enter foreign export market.
Indirect Value Chain Benefit
1. Viable Indonesian investors identified and socialized in benefits of foreign export corporation.
1. Suppliers through foreign export corporation are closer to the major OEM’s and T1 foreign suppliers for opening global market opportunities.
1. Increased leverage of Indonesian suppliers in foreign export market.
1. Supplier’s product and process standards are upgraded for higher value market export.
1. Increased Indonesian industry awareness of value added standards and upgrading.
1. Increased product recognition of foreign export corporation product lines into OEM’s and T1 foreign suppliers.
1. Increased Indonesian suppliers reputation with global OEM’s and T1 foreign suppliers.
1. Increased Indonesian industry benefits of access export market.
SENADA AP4 – EXPORT PROMOTION MODEL # 1 : FOREIGN EXPORT CORPORATION MODEL
1. Indonesian investors.2. SENADA.3. GIAMM4. ASTRA Otoparts.5. Fuboru Indonesia.
1. Identify country for establishment of foreign export corporation.
2. Establish Indonesian and national team for setup of foreign export corporation.
3. Identify legal structure for foreign corporation (stand alone, conglomerate, etc.).
4. Complete legal registration of foreign export corporation.
5. Finalize financing (government subsidies, investment, etc) for foreign export corporation.
1. Indonesian investors.2. Foreign key market players
(JETRO, METI, GNI, etc)3. Foreign export corporation.4. SENADA.
1. Country selected for foreign export corporation.
2. Legal registration and financial documentations obtained for foreign export corporation.
1. Indonesian industry ability to established register a foreign export corporation in a foreign country.
2. Ensuring financial plan and availability of Indonesian investors.
1. Select product lines to be exported.2. Identify and select of product and
process standard to be transferred.3. Upgrading initiative launched to
upgrade Indonesian suppliers product and process standard to meet export and OEM’s QCD standards.
1. Product lines selected.2. Product and process standards
developed as a based for Indonesian suppliers upgrading process.
3. Indonesian suppliers upgraded and/or certified to OEM’s QCD export standards.
1. Identify and select OEM distribution channels mechanism.
2. Development and launch of strategic sales and marketing campaigns.
3. Sign contracts between foreign export corporation and OEM or T1 foreign suppliers.
1. Signed contracts between foreign export corporation and OEM’s or T1 foreign suppliers.
1. Ensuring foreign export corporation obtain OEM’s or T1 foreign suppliers contracts.
1. Key product lines by Indonesian suppliers to T1 foreign suppliers.
2. Final production of key product lines by foreign export corporation for T1 foreign suppliers.
3. Key product lines delivered by foreign export corp. to OEM or T1 foreign suppliers.
1. Indonesian suppliers.2. Foreign export corporation.3. Foreign OEM’s.4. T1 foreign suppliers.
1. Launch key product lines for entry into OEM’s and T1 foreign suppliers.
1. Ensuring foreign corporation maintain QCD (Quality-Cost-Delivery) requirements of OEM’s and T1 foreign suppliers.
2. Product lines are delivered and accepted by OEM’s or T1 foreign suppliers in term of QCD (Quality-Cost-Delivery).
1. Indonesian suppliers.2. Foreign export corporation.3. Third party consultant.
1. Foreign OEM.2. T1 foreign suppliers.3. Foreign export corporation.
1. Identifying suppliers that are willing and able to upgrade to export QCD standards.
2. Ensuring third party consultant commitment and willingness to upgrade Indonesian suppliers’s product and process standards
3. Financing availability.
1. Identify investment requirements for foreign export corporation.
2. Short list potential Indonesian investors.
3. Finalize negotiations and select key investors and sign MOU or LOI.
1. Investment requirements for foreign export corporation documented and communicated.
2. Key investors short listed.3. MOU or LOI signed with
investors establishment of foreign export corporation.
1. Ensuring Indonesian investors commitment and willingness to invest in foreign export corporation.
1. Indonesian suppliers export market for automotive component established.
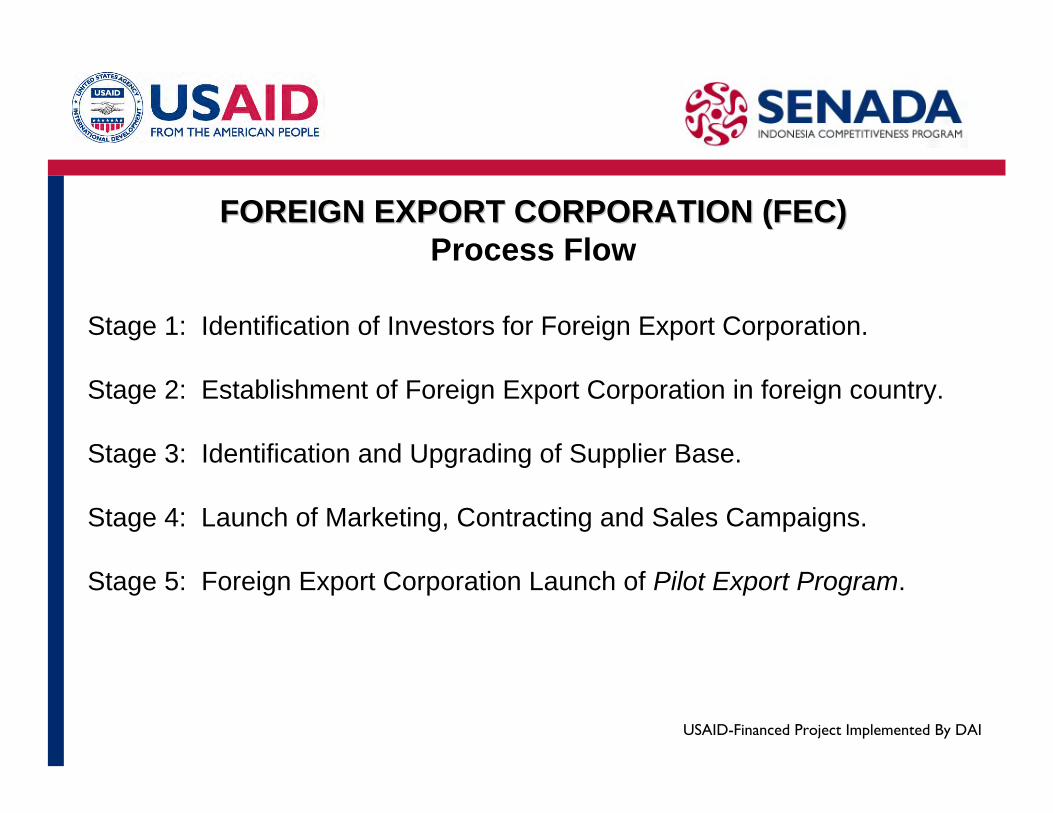
USAID-Financed Project Implemented By DAI
FOREIGN EXPORT CORPORATION (FEC)FOREIGN EXPORT CORPORATION (FEC)Process Flow
Stage 1: Identification of Investors for Foreign Export Corporation.
Stage 2: Establishment of Foreign Export Corporation in foreign country.
Stage 3: Identification and Upgrading of Supplier Base.
Stage 4: Launch of Marketing, Contracting and Sales Campaigns.
Stage 5: Foreign Export Corporation Launch of Pilot Export Program.
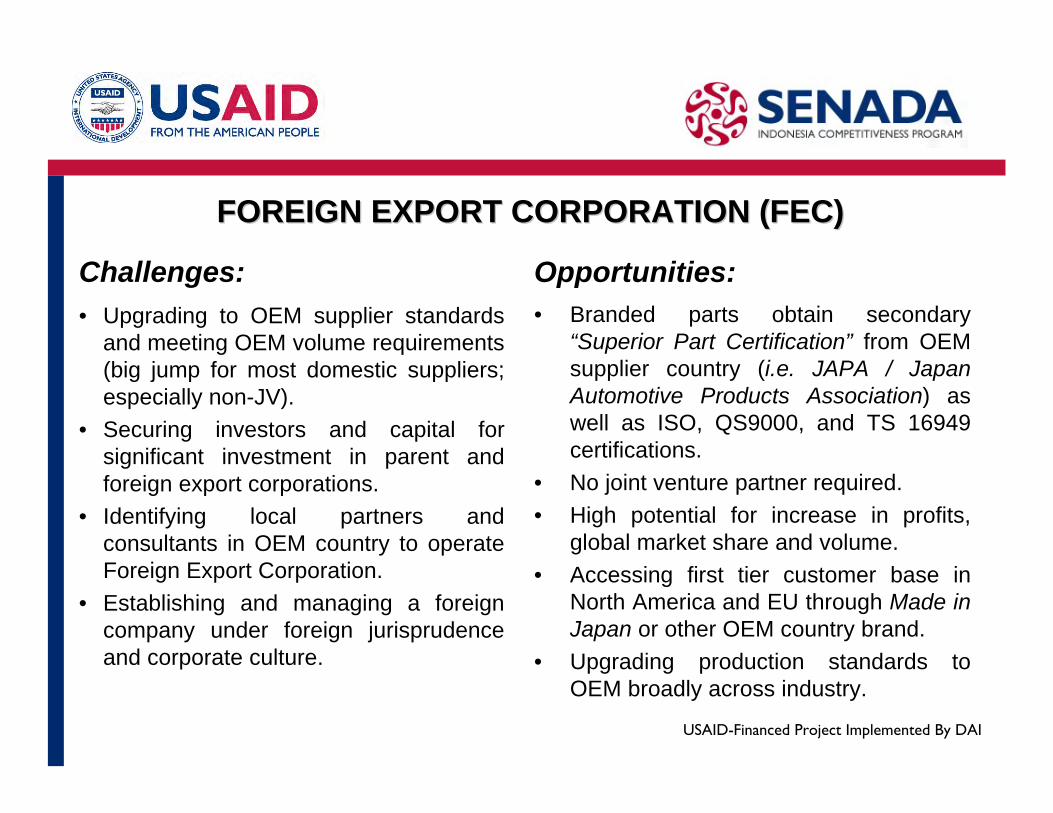
USAID-Financed Project Implemented By DAI
FOREIGN EXPORT CORPORATION (FEC)FOREIGN EXPORT CORPORATION (FEC)
Challenges:• Upgrading to OEM supplier standards
and meeting OEM volume requirements (big jump for most domestic suppliers; especially non-JV).
• Securing investors and capital for significant investment in parent and foreign export corporations.
• Identifying local partners and consultants in OEM country to operate Foreign Export Corporation.
• Establishing and managing a foreign company under foreign jurisprudence and corporate culture.
Opportunities:• Branded parts obtain secondary
“Superior Part Certification” from OEM supplier country (i.e. JAPA / Japan Automotive Products Association) as well as ISO, QS9000, and TS 16949 certifications.
• No joint venture partner required.• High potential for increase in profits,
global market share and volume.• Accessing first tier customer base in
North America and EU through Made in Japan or other OEM country brand.
• Upgrading production standards to OEM broadly across industry.
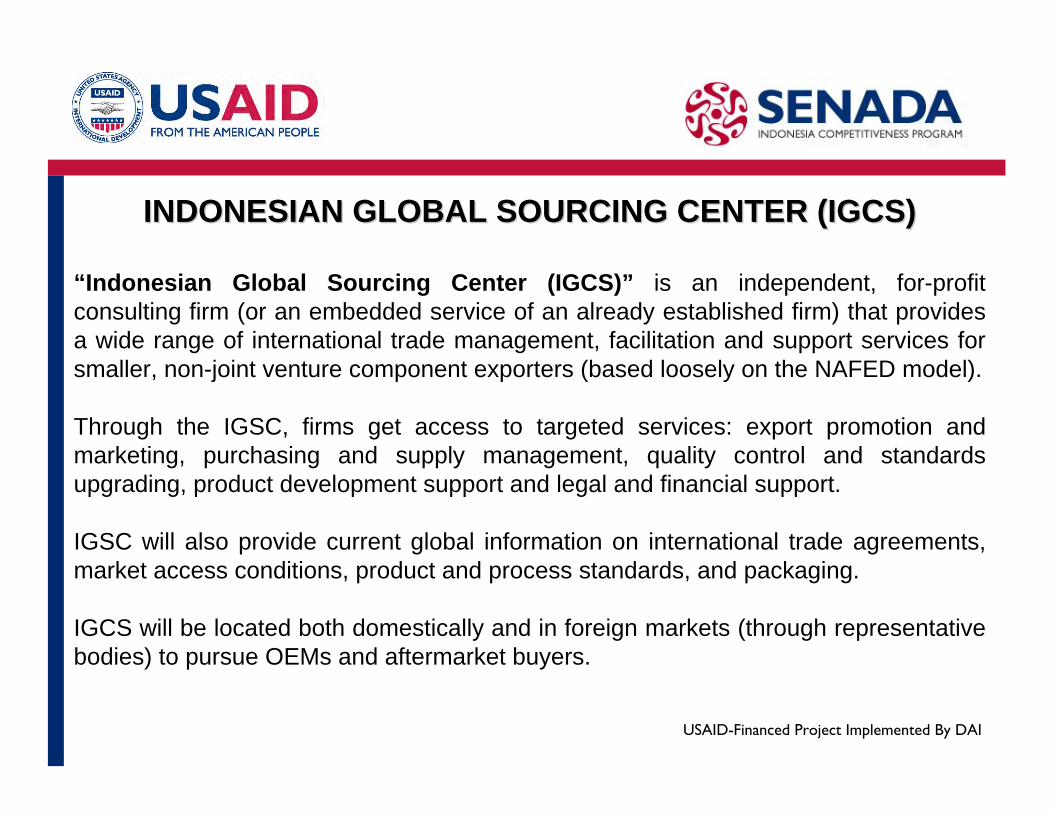
USAID-Financed Project Implemented By DAI
INDONESIAN GLOBAL SOURCING CENTER (IGCS)INDONESIAN GLOBAL SOURCING CENTER (IGCS)
“Indonesian Global Sourcing Center (IGCS)” is an independent, for-profit consulting firm (or an embedded service of an already established firm) that provides a wide range of international trade management, facilitation and support services for smaller, non-joint venture component exporters (based loosely on the NAFED model).
Through the IGSC, firms get access to targeted services: export promotion and marketing, purchasing and supply management, quality control and standards upgrading, product development support and legal and financial support.
IGSC will also provide current global information on international trade agreements, market access conditions, product and process standards, and packaging.
IGCS will be located both domestically and in foreign markets (through representative bodies) to pursue OEMs and aftermarket buyers.
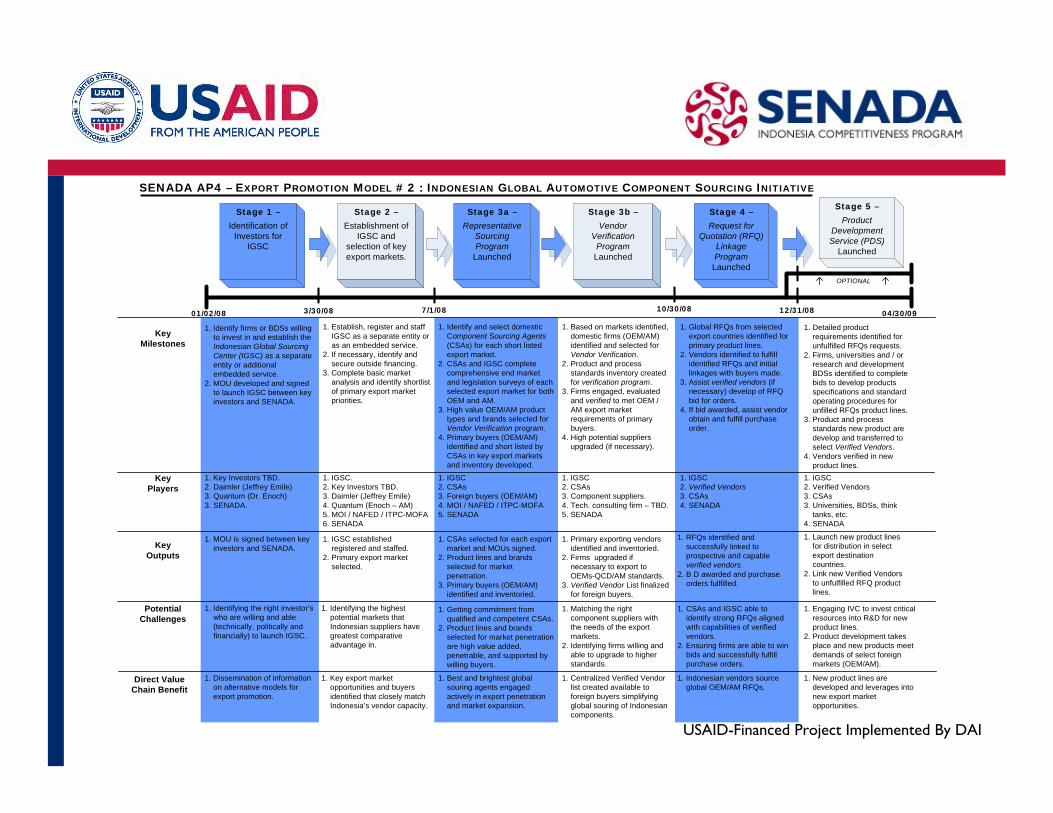
USAID-Financed Project Implemented By DAI
Stage 1 – Identification of
Investors for IGSC
Stage 2 – Establishment of
IGSC and selection of key export markets.
Stage 3a – Representative
Sourcing Program
Launched
Stage 4 – Request for
Quotation (RFQ) Linkage Program
Launched
Stage 5 –Product
Development Service (PDS)
Launched
Key Milestones
Key Players
Key Outputs
Potential Challenges
3/30/08 7/1/0801/02/08 04/30/09
Direct Value Chain Benefit
SENADA AP4 – EXPORT PROMOTION MODEL # 2 : INDONESIAN GLOBAL AUTOMOTIVE COMPONENT SOURCING INITIATIVE
1. Key Investors TBD.2. Daimler (Jeffrey Emile)3. Quantum (Dr. Enoch)3. SENADA.
1. Establish, register and staff IGSC as a separate entity or as an embedded service.
2. If necessary, identify and secure outside financing.
3. Complete basic market analysis and identify shortlist of primary export market priorities.
1. IGSC.2. Key Investors TBD.3. Daimler (Jeffrey Emile)4. Quantum (Enoch – AM)5. MOI / NAFED / ITPC-MOFA6. SENADA
1. Based on markets identified, domestic firms (OEM/AM) identified and selected for Vendor Verification.
2. Product and process standards inventory created for verification program.
3. Firms engaged, evaluated and verified to met OEM / AM export market requirements of primary buyers.
4. High potential suppliers upgraded (if necessary).
1. Global RFQs from selected export countries identified for primary product lines.
2. Vendors identified to fulfill identified RFQs and initial linkages with buyers made.
3. Assist verified vendors (if necessary) develop of RFQ bid for orders.
4. If bid awarded, assist vendor obtain and fulfill purchase order.
1. Detailed product requirements identified for unfulfilled RFQs requests.
2. Firms, universities and / or research and development BDSs identified to complete bids to develop products specifications and standard operating procedures for unfilled RFQs product lines.
3. Product and process standards new product are develop and transferred to select Verified Vendors.
4. Vendors verified in new product lines.
1. Identify firms or BDSs willing to invest in and establish the Indonesian Global Sourcing Center (IGSC) as a separate entity or additional embedded service.
2. MOU developed and signed to launch IGSC between key investors and SENADA.
1. MOU is signed between key investors and SENADA.
1. IGSC 2. CSAs3. Foreign buyers (OEM/AM)4. MOI / NAFED / ITPC-MOFA5. SENADA
1. Primary exporting vendors identified and inventoried.
2. Firms upgraded if necessary to export to OEMs-QCD/AM standards.
3. Verified Vendor List finalized for foreign buyers.
1. IGSC 2. Verified Vendors3. CSAs4. SENADA
1. RFQs identified and successfully linked to prospective and capable verified vendors.
2. B D awarded and purchase orders fullfilled.
1. IGSC 2. Verified Vendors3. CSAs3. Universities, BDSs, think
tanks, etc.4. SENADA
1. Launch new product lines for distribution in select export destination countries.
2. Link new Verified Vendors to unfulfilled RFQ product lines.
1. Engaging IVC to invest critical resources into R&D for new product lines.
2. Product development takes place and new products meet demands of select foreign markets (OEM/AM).
1. CSAs and IGSC able to identify strong RFQs aligned with capabilities of verified vendors.
2. Ensuring firms are able to win bids and successfully fulfill purchase orders.
Stage 3b – Vendor
Verification Program
Launched
1. Identify and select domestic Component Sourcing Agents (CSAs) for each short listed export market.
2. CSAs and IGSC complete comprehensive end market and legislation surveys of each selected export market for both OEM and AM.
3. High value OEM/AM product types and brands selected for Vendor Verification program.
4. Primary buyers (OEM/AM) identified and short listed by CSAs in key export markets and inventory developed.
1. CSAs selected for each export market and MOUs signed.
2. Product lines and brands selected for market penetration.
3. Primary buyers (OEM/AM) identified and inventoried.
1. IGSC established registered and staffed.
2. Primary export market selected.
12/31/08
1. IGSC 2. CSAs3. Component suppliers.4. Tech. consulting firm – TBD.5. SENADA
10/30/08
1. Identifying the right investor's who are willing and able (technically, politically and financially) to launch IGSC.
1. Dissemination of information on alternative models for export promotion.
1. Identifying the highest potential markets that Indonesian suppliers have greatest comparative advantage in.
1. Key export market opportunities and buyers identified that closely match Indonesia’s vendor capacity.
1. Getting commitment from qualified and competent CSAs.
2. Product lines and brands selected for market penetration are high value added, penetrable, and supported by willing buyers.
1. Best and brightest global souring agents engaged actively in export penetration and market expansion.
1. Matching the right component suppliers with the needs of the export markets.
2. Identifying firms willing and able to upgrade to higher standards.
1. Centralized Verified Vendor list created available to foreign buyers simplifying global souring of Indonesian components.
1. New product lines are developed and leverages into new export market opportunities.
1. Indonesian vendors source global OEM/AM RFQs.
OPTIONAL
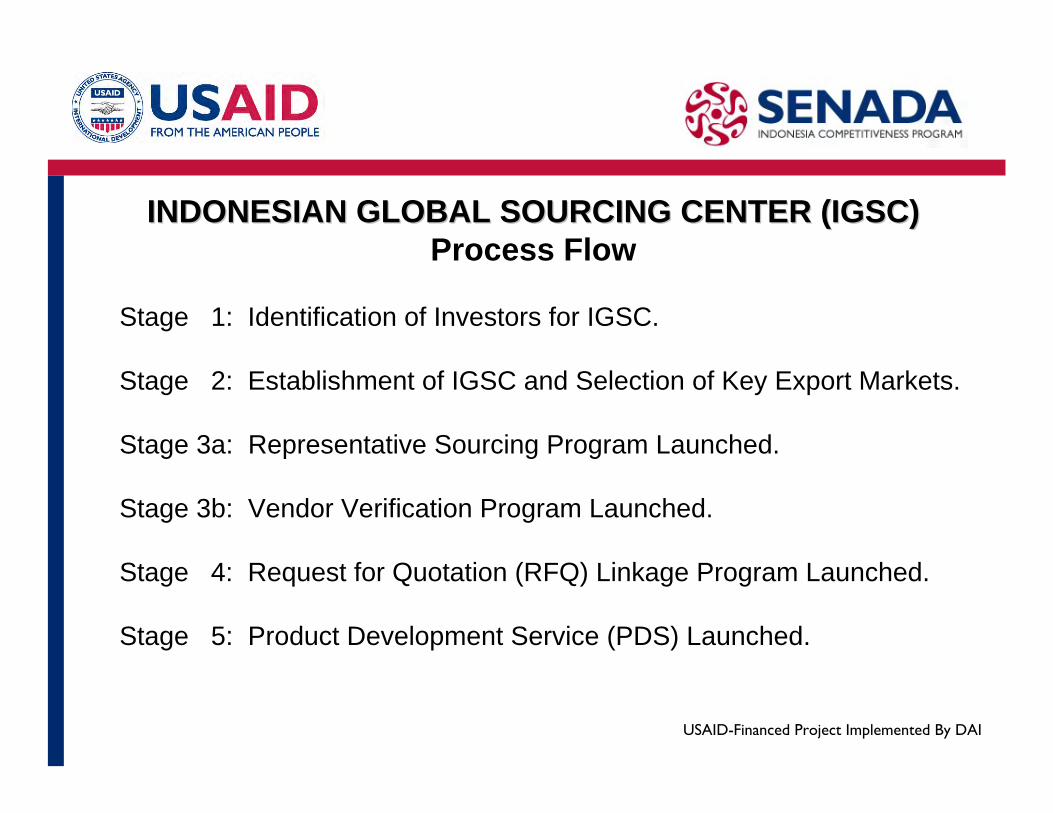
USAID-Financed Project Implemented By DAI
INDONESIAN GLOBAL SOURCING CENTER (IGSC)INDONESIAN GLOBAL SOURCING CENTER (IGSC)Process Flow
Stage 1: Identification of Investors for IGSC.
Stage 2: Establishment of IGSC and Selection of Key Export Markets.
Stage 3a: Representative Sourcing Program Launched.
Stage 3b: Vendor Verification Program Launched.
Stage 4: Request for Quotation (RFQ) Linkage Program Launched.
Stage 5: Product Development Service (PDS) Launched.
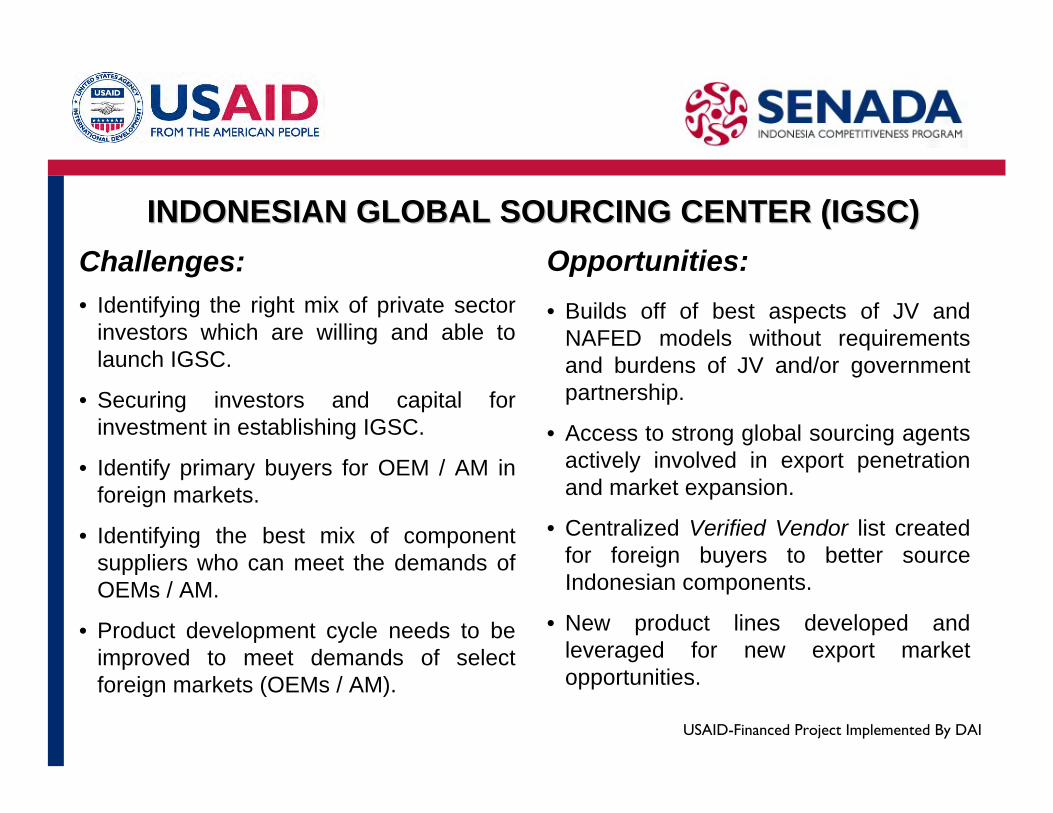
USAID-Financed Project Implemented By DAI
INDONESIAN GLOBAL SOURCING CENTER (IGSC)INDONESIAN GLOBAL SOURCING CENTER (IGSC)Challenges:• Identifying the right mix of private sector
investors which are willing and able to launch IGSC.
• Securing investors and capital for investment in establishing IGSC.
• Identify primary buyers for OEM / AM in foreign markets.
• Identifying the best mix of component suppliers who can meet the demands of OEMs / AM.
• Product development cycle needs to be improved to meet demands of select foreign markets (OEMs / AM).
Opportunities:• Builds off of best aspects of JV and
NAFED models without requirements and burdens of JV and/or government partnership.
• Access to strong global sourcing agents actively involved in export penetration and market expansion.
• Centralized Verified Vendor list created for foreign buyers to better source Indonesian components.
• New product lines developed and leveraged for new export market opportunities.
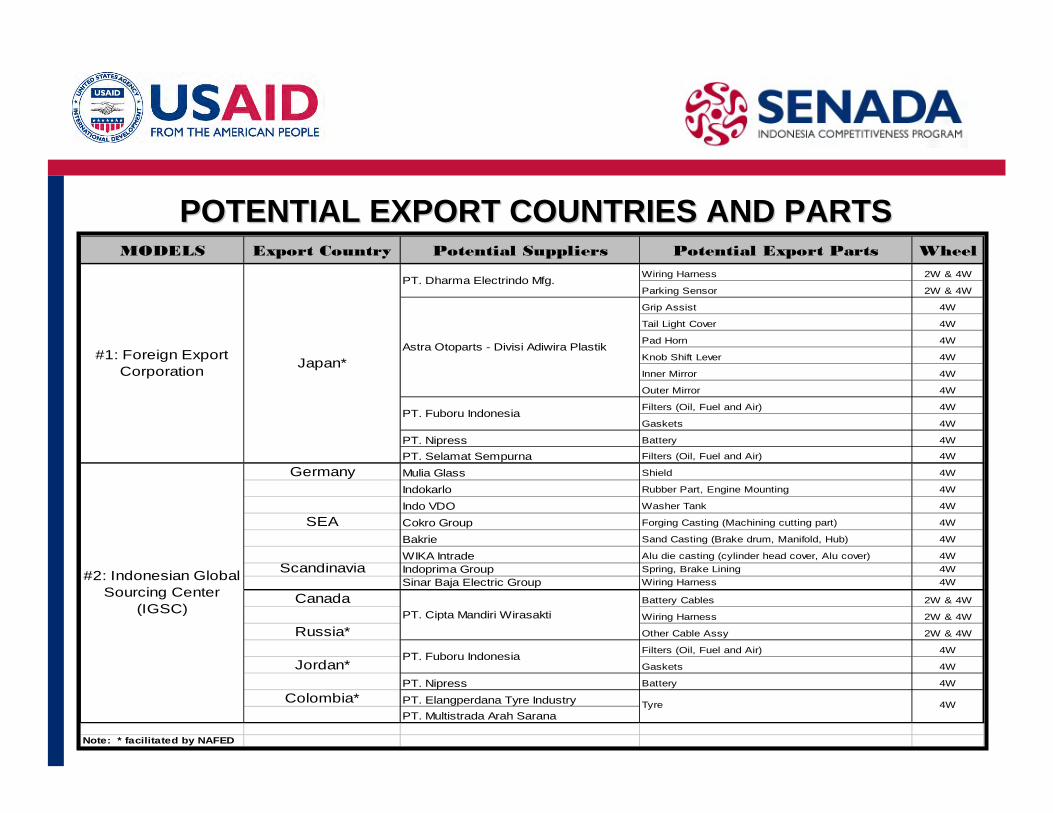
POTENTIAL EXPORT COUNTRIES AND PARTSPOTENTIAL EXPORT COUNTRIES AND PARTSMODELS Export Country Potential Suppliers Potential Export Parts Wheel
Wiring Harness 2W & 4W
Parking Sensor 2W & 4W
Grip Assist 4W
Tail Light Cover 4W
Pad Horn 4W
Knob Shift Lever 4W
Inner Mirror 4W
Outer Mirror 4W
Filters (Oil, Fuel and Air) 4W
Gaskets 4W
PT. Nipress Battery 4W
PT. Selamat Sempurna Filters (Oil, Fuel and Air) 4W
Germany Mulia Glass Shield 4W
Indokarlo Rubber Part, Engine Mounting 4W
Indo VDO Washer Tank 4W
SEA Cokro Group Forging Casting (Machining cutting part) 4W
Bakrie Sand Casting (Brake drum, Manifold, Hub) 4W
WIKA Intrade Alu die casting (cylinder head cover, Alu cover) 4WScandinavia Indoprima Group Spring, Brake Lining 4W
Sinar Baja Electric Group Wiring Harness 4W
Canada Battery Cables 2W & 4W
Wiring Harness 2W & 4W
Russia* Other Cable Assy 2W & 4W
Filters (Oil, Fuel and Air) 4W
Jordan* Gaskets 4W
PT. Nipress Battery 4W
Colombia* PT. Elangperdana Tyre IndustryPT. Multistrada Arah Sarana
Note: * facilitated by NAFED
Tyre 4W
PT. Fuboru Indonesia
PT. Cipta Mandiri Wirasakti
#2: Indonesian Global Sourcing Center
(IGSC)
#1: Foreign Export Corporation Japan*
Astra Otoparts - Divisi Adiwira Plastik
PT. Dharma Electrindo Mfg.
PT. Fuboru Indonesia

51
SENADA – Indonesia Competitiveness Program
BRI II Tower, 8th Fl, Suite 805 Jl. Jendral Sudirman No. 44 – 46
Jakarta 10210 www.senada.or.id