Embed Size (px)
Citation preview

Environmental Pollution 284 (2021) 117373
Available online 17 May 20210269-7491/© 2021 Elsevier Ltd. All rights reserved.
Exposure to wastewater effluent disrupts hypoxia responses in killifish (Fundulus heteroclitus)☆
Samantha C. Lau a, Hossein Mehdi b, Leslie M. Bragg c, Mark R. Servos c, Sigal Balshine b, Graham R. Scott a,*
a Department of Biology, McMaster University, 1280 Main Street West, Hamilton, ON, L8S 4K1, Canada b Department of Psychology, Neuroscience, and Behaviour, McMaster University, 1280 Main Street West, Hamilton, ON, L8S 4K1, Canada c Department of Biology, University of Waterloo, 200 University Ave. W, Waterloo, ON, N2L 3G1, Canada
A R T I C L E I N F O
Keywords: Pollution Respirometry Pharmaceuticals and personal care products Aerobic metabolism Metabolic depression
A B S T R A C T
Hypoxia (low oxygen) often occurs in aquatic ecosystems that receive effluent from municipal wastewater treatment plants (WWTP). The combination of hypoxia and WWTP effluent could impair fish health, because WWTP effluent contains multiple contaminants that could disrupt the physiological pathways fish use to cope with hypoxia, but the interactive effects of these stressors on fish physiology are poorly understood. We have examined this issue by exposing mummichog killifish (Fundulus heteroclitus) to hypoxia (5 and 2 kPa O2) and/or 100% WWTP effluent for 21 days in a full factorial design. We then measured hypoxia tolerance, whole-animal metabolism, gill morphology, haematology, and tissue metabolites. In clean water, killifish responded to chronic hypoxia with improvements in hypoxia tolerance, as reflected by increases in time to loss of equilibrium at 0.5 kPa (tLOE). These improvements occurred in association with increases in the exposed surface of gill lamellae that resulted from a regression of interlamellar cell mass (ILCM). Concurrent exposure to wastewater attenuated the increases in tLOE and gill remodeling in chronic hypoxia, and nearly depleted brain glycogen stores. Therefore, exposure to WWTP effluent can disrupt the physiological mechanisms fish use to cope with chronic hypoxia and impair hypoxia tolerance. Our research suggests that the combination of stressors near WWTPs can have interactive effects on the physiology and health of fish.
1. Introduction
Environmental hypoxia (low oxygen availability) is a common feature of many aquatic ecosystems, and it can occur as a result of natural causes as well as from anthropogenic pollution (Diaz, 2001; Friedrich et al., 2014). Many tide pools, estuarine habitats, stratified or ice-covered lakes and ponds are characterized by naturally low or fluctuating oxygen levels (Diaz and Rosenberg, 2008). In some other cases, the depletion of dissolved oxygen can be linked to eutrophication events due to nutrient loading from fisheries, agricultural run-off, or discharge from wastewater treatment plants that leads to the prolifera-tion of primary producers (Breitburg et al., 2009; Brooks et al., 2006; Carey and Migliaccio, 2009; Diaz, 2001; Diaz and Rosenberg, 2008; Friedrich et al., 2014). The occurrence of such hypoxic events is pre-dicted to increase with further progression of climate change, urbani-zation, and pollution (Friedrich et al., 2014).
Fish exhibit a suite of behavioural, physiological, and biochemical responses to hypoxia that contribute to maintaining the balance be-tween oxygen supply and demand and to thus cope with low oxygen conditions (Bickler and Buck, 2007; Perry et al., 2009; Pollock et al., 2007; Richards, 2011). Such responses have been well described in the literature and often act to improve O2 extraction from the environment (e.g., by increasing gill ventilation and surface area), reduce activity and metabolism, and/or increase anaerobic energy production (Borowiec et al., 2015; Kramer and McClure, 1982; Perry and Tzaneva, 2016; Regan et al., 2017; Sollid et al., 2003). However, hypoxia often occurs concurrent with other environmental stressors, including fluctuations in temperature and/or salinity or pollution (Friedrich et al., 2014). The potential interactions between hypoxia and many other types of stressors are poorly understood, and whether anthropogenic stressors can disrupt the natural adaptive responses to hypoxia remains unresolved.
☆ This paper has been recommended for acceptance by Sarah Harmon. * Corresponding author.
E-mail address: [email protected] (G.R. Scott).
Contents lists available at ScienceDirect
Environmental Pollution
journal homepage: www.elsevier.com/locate/envpol
https://doi.org/10.1016/j.envpol.2021.117373 Received 18 November 2020; Received in revised form 5 May 2021; Accepted 12 May 2021

Environmental Pollution 284 (2021) 117373
2
Effluents discharged from municipal wastewater treatment plants (WWTP) are complex contaminant mixtures that can contain excess nutrients, pharmaceuticals and personal care products (PPCPs), and industrial chemicals (Brooks et al., 2006). The investigation of these contaminants of emerging concern (CECs) are necessary due to their increasing usage and potential for having significant effects on fish and other aquatic life (Corcoran et al., 2010; Kolpin et al., 2002; Metcalfe et al., 2003; Zenker et al., 2014). Exposure to WWTP effluent can have a number of physiological effects on fish, having been shown to disrupt reproductive function (Bahamonde et al., 2015) and metabolic rate (Du et al., 2018, 2019; Mehdi et al., 2018). Hypoxia exposure is also known to affect metabolic rate and its underlying physiological determinants (Fu et al., 2011; Hochachka et al., 1996; Richards et al., 2009). The eutrophication of aquatic environments, including wastewater domi-nated ecosystems, can reduce oxygen levels and potentially lead to hypoxic conditions, but the effects of combined exposure to wastewater effluent and hypoxia are largely unknown.
Given the molecular targets of many pharmaceuticals and other contaminants found in WWTP effluents, exposure to these effluents could disrupt the physiological pathways fish use to cope with hypoxia. For example, the pharmaceuticals in wastewater have molecular targets involved in oxygen sensing (e.g., serotonin reuptake inhibitors), ho-meostatic regulation by the sympathetic nervous system (e.g., beta blockers), and control of metabolic pathways (e.g., anti-diabetics, lipid- lowering drugs) (Arlos et al., 2015; Corcoran et al., 2010; Kolpin et al., 2002; Metcalfe, 2013; Metcalfe et al., 2003). Indeed, exposure to the serotonin reuptake inhibitor, fluoxetine, has been shown to attenuate the cardiovascular and ventilatory responses to hypoxia in Gulf toadfish (Opsanus beta) (Panlilio et al., 2016). Several industrial contaminants (e. g., polychlorinated biphenyls, polycyclic aromatic hydrocarbons) may also disrupt hypoxia signaling pathways that underlie the physiological adjustments to chronic hypoxia, such as the hypoxia inducible factor (HIF) pathway (Chan et al., 1999; Kraemer and Schulte, 2004; Vorrink and Domann, 2014; Silva et al., 2017). However, it is largely unknown whether the concentrations of these contaminants in wastewater effluent is sufficient to disrupt the ability of fish to respond and cope with hypoxia.
The objective of this study was to help address these knowledge gaps in the literature by determining whether exposure to WWTP effluent disrupts the adaptive physiological responses of mummichog killifish (Fundulus heteroclitus) to hypoxia. We examined the effects of chronic exposure to hypoxia and/or municipal wastewater effluent in a full factorial design on metabolism, hypoxia tolerance, and several under-lying respiratory and metabolic traits. Killifish are an ideal model or-ganism for this study as they naturally experience hypoxia and fluctuations in various other environmental conditions in their estuarine habitat (Burnett et al., 2007). This species can also be found in heavily polluted estuarine environments containing high levels of heavy metals and persistent organic pollutants, including dioxins, polyaromatic hy-drocarbons (PAHs), and polychlorinated biphenyls (PCBs), and some wild populations from such environments have evolved exceptional tolerance of pollution exposure (Bugel et al., 2010; Reid et al., 2016; Weis and Weis, 1989). We hypothesized that the response of killifish to chronic hypoxia would be disrupted by exposure to municipal waste-water, such that fish would be less tolerant of hypoxia.
2. Materials and methods
2.1. Study animals and housing
Adult mummichog killifish (Fundulus heteroclitus) were wild caught by a commercial supplier (Aquatic Research Organisms, Hampton, New Hampshire, USA) and shipped to McMaster University in Hamilton, Ontario, Canada in the autumn of 2018. Killifish were kept in well- aerated brackish water (4 ppt), produced by mixing artificial sea salt (Reef Pro Mix Redline Complete Sea Salt, Fritz Aquatics, Mesquite,
Texas) with dechlorinated City of Hamilton tap water. Holding tanks were kept at room temperature (~18 ◦C), and killifish were fed 5 days a week to satiation with commercial pellets (AgloNorse Complete Fish Feed, 0.6–0.9 mm, Tromsø, Norway). The photoperiod was 12 h:12 h light:dark between 0700 and 1900 local time. All animal protocols were developed in accordance with guidelines established by the Canadian Council on Animal Care and were approved by the McMaster University Animal Research Ethics Board.
2.2. Wastewater effluent collection
Wastewater effluent was collected from Woodward Avenue Waste-water Treatment Plant (43◦15′15.6′′N; 79◦46′25.4′′W) in Hamilton, Ontario in March–May of 2019. Woodward WWTP is a secondary con-ventional activated sludge treatment plant with sludge dewatering and digestion and has a maximum daily capacity of 409 million litres (City of Hamilton, 2019). Effluent was collected every Tuesday and Saturday during the exposure period between the hours of 0930 and 1130 local time. Using a submersible sump-pump, wastewater effluent from the final clarifier chimney was collected into 20 L carboys (Reliance Rect-angular AquaPak Containers, BPA Free) for transportation to McMaster University. Effluent was stored in a dark and refrigerated cold room at 4 ◦C for at most three days before use in chronic exposures (see below). We obtained water quality data of 24 h composite samples from each day of effluent collection from the City of Hamilton Environmental Laboratory (Figs. S1-3). For each effluent collection, we also preserved a sample of effluent (500 mL) in pre-cleaned amber glass bottles con-taining sodium azide (1 g/L) and ascorbic acid (50 mg/L) and stored these samples at 4 ◦C for up to 2 days until extractions for analytical chemistry, and there were no systematic differences between treatment groups in the duration of storage before extraction.
2.3. Chronic exposures of fish
Killifish were exposed to wastewater and/or hypoxia in a full factorial design in 40 L aquaria for 21 days at room temperature (~18 ◦C). Conditions of normoxia (well aerated to ~20 kPa O2), mod-erate hypoxia (5.0 ± 0.1 kPa), or severe hypoxia (2.0 ± 0.1 kPa) were maintained in clean water (Hamilton dechlorinated tap water adjusted to 4 ppt with artificial sea salt) or in 100% wastewater effluent. Each of these 6 chronic exposure groups was replicated 2–3 times over the period of wastewater collection (24 fish per tank). Wastewater effluent was brought up to room temperature and 4 ppt salinity immediately before use. For hypoxic treatments, oxygen tension (PO2) was reduced from 20 kPa to the treatment setpoint over the first three days of exposure, and was maintained by injecting N2 gas using O2 controllers that we have previously described (Borowiec et al., 2015). Bubble wrap was held on the water surface in the hypoxic treatments to reduce O2 diffusion from the air and to prevent aquatic surface respiration. Water was gently mixed with a submersible aquarium pump and filtered through a sponge filter (but not a charcoal filter). Every 72 h, faeces and other debris were removed, physicochemical parameters were measured (pH, conductivity, total dissolved solids, salinity, temperature, and NH3, NO2, NO3 levels; Table S1), and the appropriate tank water was renewed (clean water or wastewater). Because effluent was stored for ~3 days after collection before use, which we anticipated would lead to the degradation of some contaminants found in the water, we took water samples (125 mL) for analytical chemistry from each tank replicate in each wastewater treatment group to provide an indication of the level of exposure. We also anticipated that the concentrations of some contam-inants may change over the 3 days between water changes, so paired water samples (125 mL) were performed once for each wastewater tank replicate – one immediately after a water change and the second immediately prior to the next water change. Water samples were pre-served using sodium azide and ascorbic acid as described above. After completing the 21-day exposure, one subset of fish in each tank was
S.C. Lau et al.

Environmental Pollution 284 (2021) 117373
3
immediately euthanized for tissue sampling, and two other subsets of fish were used for respirometry and hypoxia tolerance measurements (see below). We were not able to make all measurements in all in-dividuals, so the number of individuals used for each measurement is clearly indicated in each figure and table. In all cases, we used in-dividuals from every tank replicate for every measurement.
2.4. Analytical chemistry of water samples
Preserved water samples were analyzed for twenty-two PPCPs, me-tabolites, and other CECs using previously established methods (Arlos et al., 2015; Mehdi et al., 2021). The analyzed chemicals included lipid regulators, anti-epileptics, analgesics, antibacterials, antibiotics, anti-depressants, non-steroidal anti-inflammatory agents (NSAIDs), herbi-cides, and industrial chemicals (Table 1). Wastewater effluent samples were first divided into 100 mL aliquots, and tank samples were divided into 50 mL aliquots. Each sample was individually spiked with 100 μL of 100 μg/L of isotopically labelled standards prior to extraction. Solid phase extraction (SPE) was performed using Agilent Bond Elute Plexa cartridges (6 cc, 500 mg) on samples adjusted to pH 2, with final extracts reconstituted in 500 μL methanol with internal standards. These extracts were then stored at − 20 ◦C until analysis using an Agilent 1260 HPLC with 6460 triple quad mass spectrometer (LC-MS/MS) with Agilent Jet Stream (AJS) electrospray ionization in both positive and negative modes (Mehdi et al., 2021). Of all the preserved water samples, tech-nical issues precluded the analysis of three samples of wastewater tank replicates. Some individual data points for acetaminophen and caffeine were excluded due to problems with matrix effects for these particular compounds.
2.5. Sampling of fish tissues
The sampled fish were first euthanized with a sharp blow to the head followed by spinal transection, and the tail was severed for blood collection. A portion of blood (5 μL) was stored in Drabkin’s reagent for determining haemoglobin concentration according to product
instructions (Sigma-Aldrich, St. Louis, MO, USA). The remaining blood was collected in a heparinized capillary tube and centrifuged at 12,700 g for 5 min to determine haematocrit. Brain, liver, and axial white muscle were excised, weighed, freeze-clamped in liquid nitrogen, and then stored at − 80 ◦C for later analysis of metabolites. Gills were dissected, placed in 0.2 M PBS (274 mmol/L NaCl, 30.4 mmol/L Na2HPO4, 5.4 mmol/L KCl, 3.0 mmol/L KH2PO4; pH 7.8) containing fixative (2% paraformaldehyde and 2% glutaraldehyde) for at least 48 h, then stored in PBS at 4 ◦C for later analysis of gill morphometrics.
2.6. Respirometry and hypoxia tolerance
Killifish were subjected to two series of measurements of metabolism and hypoxia tolerance. In one subset of fish from each chronic exposure group, we used stop-flow respirometry in clean water at 4 ppt to mea-sure standard metabolic rate (SMR) and critical oxygen tension (Pcrit). Fish were fasted for the last 48 h of chronic exposures and were then transferred at ~1700–1900 local time to 90 mL cylindrical acrylic chambers containing normoxic water, which were covered in dark plastic to minimize visual disturbance. Measurements of O2 consump-tion rate (MO2) were made overnight in normoxia using an automated respirometry system (AutoResp, Loligo Systems, Viborg, Denmark) that has been previously described in detail (Borowiec et al., 2015, 2020). MO2 was determined from the depletion of water oxygen content over time, and is expressed relative to body mass (μmol/g/h). SMR was calculated as the average of the lowest 10 MO2 measurements that were made overnight during the inactive phase. Starting at ~1100–1200 the following day, resting metabolic rate (RMR) was calculated as the average MO2 measured at 100% air saturation. MO2 was continuously measured throughout a stepwise hypoxia protocol, during which the water O2 level was reduced by 10% air saturation every 10 min, as previously described (Borowiec et al., 2015, 2020). Critical PO2 (Pcrit) was calculated using the ‘Respirometry’ package in R. In a second subset of fish from each chronic exposure group, we measured time to loss of equilibrium (tLOE) by exposing fish to an O2 tension of 0.5 kPa in 5 L aquaria. Fish were monitored continuously, and tLOE was determined as the duration of time at 0.5 kPa until the fish was unable to maintain an upright position in the water column and was unresponsive to a gentle tail pinch.
2.7. Gill histology
Gill histology was performed for the first gill arch for the normoxic and severe hypoxic exposure groups in both clean water and waste-water. We followed methods that have been previously described in detail for cryoprotection, embedding, sectioning at 5 μm in a cryostat, and haematoxylin and eosin staining (Du et al., 2018). For each indi-vidual, 10–15 brightfield images were taken of sections throughout the whole gill arch tissue using a Nikon Eclipse E8000 microscope (Nikon Instruments, Melville, New York, USA). Gill morphometrics were analyzed using ImageJ (v1.52a) software (Rasband, 2008).
2.8. Tissue metabolite assays
Lactate, free-glucose, and glycogen levels were determined in brain, muscle, and liver. For muscle and liver samples, tissues were first ground into fine powder using an insulated mortar and pestle that were pre- cooled using liquid nitrogen and were then stored at − 80 ◦C. Approxi-mately 20 mg of these powdered tissues and whole brain samples were homogenized in ~300 μL of ice-cold 6% HClO4. Homogenate was then vortexed, an aliquot of 100 μL was immediately frozen in liquid nitrogen and stored at − 80 ◦C for later analysis of glucose and glycogen, and the remaining unfrozen homogenate was used for analysis of lactate. Assays were carried out using standard protocols that have been previously described in detail (Borowiec et al., 2018).
Table 1 Average concentrations of various classes of contaminants and some associated metabolites measured in tank water during wastewater exposures.
Class Chemical Concentration (ng/L)
Lipid Regulator Gemfibrozil 10.0 (±1.4) Atorvastatin 10.5 (±3.4) p-hydroxy Atorvastatin 26.6 (±5.9) o-hydroxy Atorvastatin 20.5 (±6.1)
Antiepileptic Carbamazepine 44.4 (±3.0) Analgesic Acetaminophen 27.2 (±26.2) Stimulant Caffeine 266.1 (±150.8) Antibacterial Triclosan 12.6 (±2.8)
Sulfamethazine 16.0 (±1.2) Antibiotic Monensin <DL
Trimethoprim 22.6 (±4.1) Lincomycin 7.0 (±1.1) Sulfamethoxazole 63.9 (±5.5)
Antidepressant Fluoxetine 2.2 (±0.6) Norfluoxetine 2.2 (±0.6) Venlafaxine 89.2 (±6.8) Desvenlafaxine 155.3 (±12.9)
NSAID Ibuprofen 152.5 (±51.1) Naproxen 131.2 (±41.5) Diclofenac 154.4 (±9.3)
Herbicide Atrazine 4.6 (±0.2) Industrial Bisphenol A 138.3 (±48.0)
Data above represent measurements of samples taken once from each tank replicate in each wastewater treatment group immediately after the renewal of tank water with fresh effluent (see Materials and Methods), shown as means (±SEM) of all measurements made in wastewater (n = 13–14). <DL indicates measurement that was below the detection limit. NSAID: Nonsteroidal anti- inflammatory drug.
S.C. Lau et al.
Environmental Pollution 284 (2021) 117373
4
2.9. Statistical analysis
All statistical analyses were performed using the lme4 package (Bates et al., 2015) in R (version 3.6.2, R Core Team, 2019). We tested for the main and interactive effects of chronic hypoxia and chronic wastewater exposure using linear mixed effects models. We included body mass and sex as additional fixed independent variables. Further-more, to account for any differences in the potency of wastewater as the exposures proceeded, start date of each tank replicate was included in the model as a covariate. Although absolute values of metabolic rate (SMR and RMR in μmol/h) was analyzed statistically with body mass as a covariate, these data are reported normalized to body mass (μmol/g/h) to facilitate comparison with previous literature. Data were log or square root transformed if necessary, to meet the assumptions of the model. Tukey HSD post-hoc tests were used to identify significant pairwise differences (a) between clean water and wastewater within each chronic oxygen treatment, (b) between normoxia and hypoxia within the clean water groups, and (c) between normoxia and hypoxia within the wastewater groups. Data are reported as means ± standard error (SEM) unless otherwise stated, and in all analyses, α was set to 0.05.
3. Results
3.1. Water quality and contaminant concentrations
Several indices of water quality during the exposures were compa-rable between clean and wastewater treatments (Table S1). Although ammonia and nitrate levels were high in the collected wastewater effluent (Fig. S1), nitrogenous wastes were reduced by the in-tank filters during exposures and did not vary between treatments or as a function of time. However, killifish were exposed to the complex mixture of con-taminants present in the wastewater effluent. Of the twenty-two con-taminants that were measured, all but one (monensin) were detected in tank water from the wastewater treatment groups (Table 1). Over the course of our chronic exposures, the quality of water collected from the treatment plant seemed to improve and the concentrations of target chemical contaminants declined or remained stable, and the magnitude of changes for some contaminants appeared to vary between normoxia and hypoxia. This was supported by measurements of several water quality parameters in 24-h composite samples of final effluent that were taken on the dates of collection (Figs. S1-S3), and from measurements of target chemical contaminants in the wastewater collected for exposures (Figs. S4-S8). Nevertheless, we used a staggered tank replicate design to help minimize undesired systematic variation between treatment groups, and we accounted for any such variation that did exist by including start date of each tank replicate as a covariate in our statistical models. However, the concentrations of target contaminants were higher in wastewater at the time of collection (Figs. S4-S8) compared to those measured after the three-day storage period when wastewater was added to tanks after water changes (Table 1). Degradation of some (but not all) contaminants continued during the tank exposures (Table S2). Therefore, the data in Table 1 provides a relative indication of the exposure conditions in wastewater, but only approximate the variable concentrations that were likely experienced during chronic exposures.
3.2. Metabolic rate
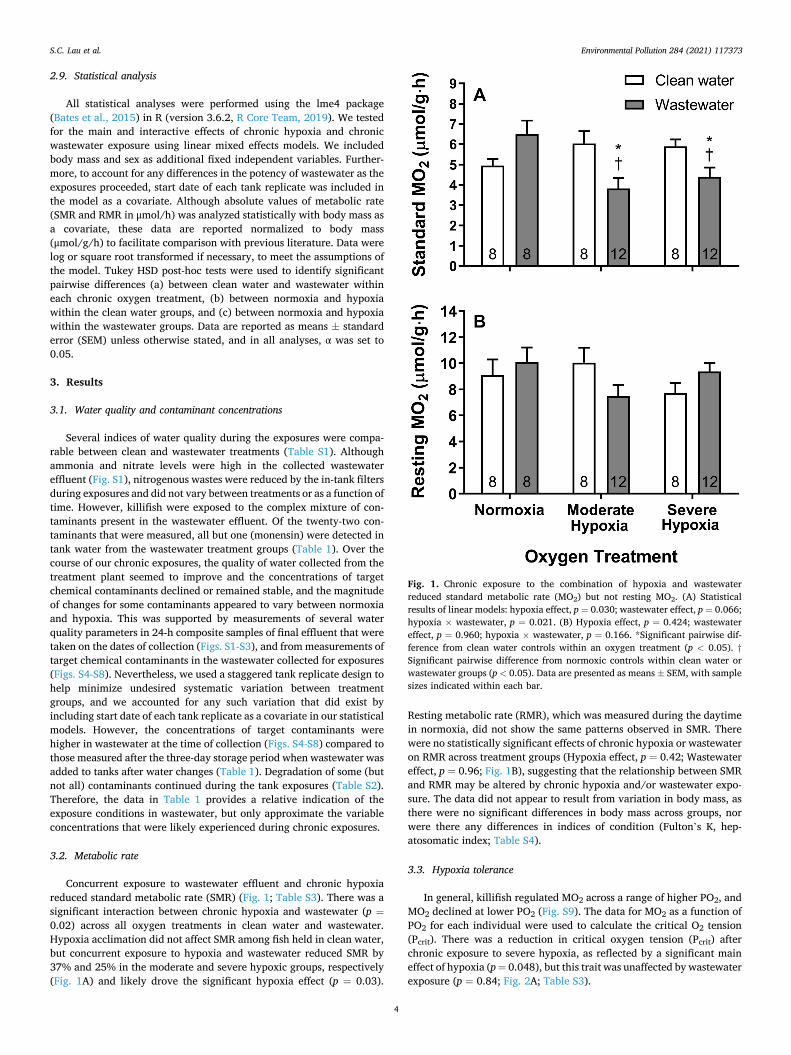
Concurrent exposure to wastewater effluent and chronic hypoxia reduced standard metabolic rate (SMR) (Fig. 1; Table S3). There was a significant interaction between chronic hypoxia and wastewater (p =0.02) across all oxygen treatments in clean water and wastewater. Hypoxia acclimation did not affect SMR among fish held in clean water, but concurrent exposure to hypoxia and wastewater reduced SMR by 37% and 25% in the moderate and severe hypoxic groups, respectively (Fig. 1A) and likely drove the significant hypoxia effect (p = 0.03).
Resting metabolic rate (RMR), which was measured during the daytime in normoxia, did not show the same patterns observed in SMR. There were no statistically significant effects of chronic hypoxia or wastewater on RMR across treatment groups (Hypoxia effect, p = 0.42; Wastewater effect, p = 0.96; Fig. 1B), suggesting that the relationship between SMR and RMR may be altered by chronic hypoxia and/or wastewater expo-sure. The data did not appear to result from variation in body mass, as there were no significant differences in body mass across groups, nor were there any differences in indices of condition (Fulton’s K, hep-atosomatic index; Table S4).
3.3. Hypoxia tolerance
In general, killifish regulated MO2 across a range of higher PO2, and MO2 declined at lower PO2 (Fig. S9). The data for MO2 as a function of PO2 for each individual were used to calculate the critical O2 tension (Pcrit). There was a reduction in critical oxygen tension (Pcrit) after chronic exposure to severe hypoxia, as reflected by a significant main effect of hypoxia (p = 0.048), but this trait was unaffected by wastewater exposure (p = 0.84; Fig. 2A; Table S3).
Fig. 1. Chronic exposure to the combination of hypoxia and wastewater reduced standard metabolic rate (MO2) but not resting MO2. (A) Statistical results of linear models: hypoxia effect, p = 0.030; wastewater effect, p = 0.066; hypoxia × wastewater, p = 0.021. (B) Hypoxia effect, p = 0.424; wastewater effect, p = 0.960; hypoxia × wastewater, p = 0.166. *Significant pairwise dif-ference from clean water controls within an oxygen treatment (p < 0.05). †Significant pairwise difference from normoxic controls within clean water or wastewater groups (p < 0.05). Data are presented as means ± SEM, with sample sizes indicated within each bar.
S.C. Lau et al.

Environmental Pollution 284 (2021) 117373
5
Wastewater exposure impeded the improvement with hypoxia acclimation in a key metric of hypoxia tolerance, the time to loss of equilibrium (tLOE) in near anoxia (0.5 kPa) (Fig. 2B; Table S3). There was a significant main effect of chronic hypoxia on tLOE (p < 0.001), driven largely by fish in clean water, which increased tLOE by 1.79-fold on average after acclimation to moderate hypoxia and 3.56-fold after acclimation to severe hypoxia. There was also a significant effect of wastewater on tLOE (p < 0.01), which completely eliminated improve-ments in tLOE in fish acclimated to moderate hypoxia and appeared to reduce the improvements in those acclimated to severe hypoxia.
3.4. Gill morphology
Wastewater exposure disrupted changes in gill morphology that were associated with hypoxia acclimation (Fig. 3; Table S3). The total height, width, and density of lamellae did not vary significantly across treatment groups (Fig. 3B–D), but there was a significant interaction (p = 0.03) between hypoxia and wastewater on the proportion of lamellae that were covered by interlamellar cell mass (ILCM; Fig. 3E). Chronic exposure to severe hypoxia in clean water led to a large reduction in the proportional height of the ILCM, which appeared to drive the significant main effect of hypoxia on this trait (p < 0.01). In contrast, among wastewater exposed fish, the proportional ILCM height was unchanged by chronic hypoxia.
3.5. Haematology
Wastewater exposure also altered haematology (Table 2, S3). Fish in clean water responded to chronic hypoxia with increases in haematocrit (hypoxia effect, p < 0.001) and decreases in mean corpuscular haemo-globin concentration (MCHC; hypoxia effect, p = 0.01), such that there was no significant change in blood haemoglobin content (hypoxia effect, p = 0.88). Wastewater affected these haematological responses, increasing haematocrit in normoxia and/or moderate hypoxia and increasing blood haemoglobin in moderate hypoxia (hypoxia × waste-water, p = 0.01).
3.6. Tissue metabolites
Exposure to wastewater affected glycogen stores in normoxia and hypoxia (Fig. 4; Table S3). Wastewater had a particularly detrimental effect on glycogen stores in brain tissue, for which there was significant hypoxia × wastewater interaction (p = 0.04) and concurrent exposure to wastewater and severe hypoxia led to nearly complete glycogen deple-tion (Fig. 4A). There was also a significant hypoxia × wastewater interaction on glycogen content in liver (p = 0.03), but in this tissue, wastewater exposure appeared to minimize glycogen depletion in severe hypoxia (Fig. 4B), although the decrease in liver glycogen in severe hypoxia compared to normoxia in clean water was not quite significant (p = 0.075). In contrast, there was no significant variation in muscle glycogen content, nor were there significant variations in concentrations of glucose or lactate in any tissue (Tables S3, S5).
4. Discussion
Aquatic hypoxia is prevalent in many ecosystems that are heavily burdened by contaminants, including those that receive effluent discharge from municipal wastewater treatment plants, but the inter-active effects of hypoxia and wastewater effluent on fish physiology and health are poorly understood. This study helps address this knowledge gap, showing that exposure to wastewater effluent can disrupt many key physiological adjustments for coping with chronic hypoxia. Wastewater exposure had relatively modest effects on killifish in normoxia, but it impeded the improvements in hypoxia tolerance in response to chronic hypoxia and disrupted the plasticity of several associated physiological traits. This suggests that the ability of fish to cope with other natural or anthropogenic stressors may be impaired in environments contaminated with wastewater effluent.
4.1. Wastewater exposure had modest physiological effects in normoxia
The evidence emerging from our findings here in killifish and those from previous studies suggest that the metabolic impacts of wastewater exposure may differ between species. The lack of any effect on metabolic rate in killifish from exposure to wastewater in normoxia is similar to previous findings in round goby that were cage exposed to the receiving waters near a WWTP (McCallum et al., 2017). In contrast, some other species exhibit a prominent increase in metabolic rate in response to wastewater exposure, including bluegill sunfish (Lepomis macrochirus) (Du et al., 2018, 2019) and rainbow darter (Etheostoma caeruleum) (Mehdi et al., 2018). These differences between studies are unlikely to have been caused by differences in exposure conditions, because the approximate range of contaminant concentrations observed here are generally comparable to those detected in wastewater effluents and surface waters near municipal WWTPs in previous studies (McCallum et al., 2017; Du et al., 2019; Fick et al., 2017; Metcalfe et al., 2010; Verlicchi et al., 2012). This could indicate that some species are more sensitive and experience a greater metabolic cost of wastewater expo-sure than others. Killifish are often found in contaminated sites and are considered to be a relatively tolerant species, and several populations have evolved especially high resistance to persistent organic pollutants
Fig. 2. Wastewater exposure attenuated the improvement in hypoxia tolerance (as reflected by the time to loss of equilibrium during acute exposure to 0.5 kPa O2) in response to chronic hypoxia without affecting critical O2 tension. (A) Statistical results of linear models: hypoxia effect, p = 0.048; wastewater effect, p = 0.836; hypoxia × wastewater, p = 0.561. (B) Hypoxia effect, p < 0.001; wastewater effect, p = 0.002; hypoxia × wastewater, p = 0.072. Other statis-tical information as in Fig. 1.
S.C. Lau et al.

Environmental Pollution 284 (2021) 117373
6
(Crawford et al., 2020; Reid et al., 2016; Weis, 2002). However, it is possible that degradation of some contaminants within exposure tanks weakened the magnitude of exposure here, but exposure had several physiological effects in hypoxia and there did not appear to be any overall difference between normoxia and hypoxia in the level of
degradation (Table S2). Killifish may therefore experience less meta-bolic stress than other less tolerant species when exposed to wastewater effluent, and thus avoid increases in whole-animal energy demands.
Fig. 3. Morphological changes in the gills of killifish in response to exposure to hypoxia and/or wastewater. (A) Representative images of the gills of killifish exposed to normoxia in clean water, severe hypoxia in clean water, normoxia in wastewater, and severe hypoxia in wastewater. Slides are stained with haematoxylin and eosin. Scale bar represents 50 μm and all images are shown at the same scale. (B) Statistical results of linear models: hypoxia effect, p = 0.165; wastewater effect, p =0.847; hypoxia × wastewater, p = 0.236. (C) Hypoxia effect, p = 0.451; wastewater effect, p = 0.502; hypoxia × wastewater, p = 0.392. (D) Hypoxia effect, p =0.269; wastewater effect, p = 0.719; hypoxia × wastewater, p = 0.244. (E) Hypoxia effect, p = 0.001; wastewater effect, p = 0.617; hypoxia × wastewater, p = 0.027. Other statistical information as in Fig. 1.
S.C. Lau et al.

Environmental Pollution 284 (2021) 117373
7
4.2. Wastewater exposure disrupts responses to chronic hypoxia
One of the most significant impacts of wastewater exposure was the attenuation of plastic improvements in hypoxia tolerance, as reflect by
time to loss of equilibrium (tLOE) in near anoxia (0.5 kPa), which nor-mally occur in response to chronic hypoxia (Fig. 2B). Killifish in clean water responded to chronic hypoxia with increases in tLOE, consistent with previous findings in several killifish species (Borowiec et al., 2015, 2020), which could reflect an improved ability to match O2 supply and O2 demand during hypoxia. The effect of wastewater that reduced tLOE in chronic hypoxia could not be explained by a metabolic cost of exposure that increased O2 demands, because combined exposure to wastewater and hypoxia reduced rather than increased SMR (Fig. 1). Wastewater exposure could have instead reduced tLOE by impairing tissue O2 supply. This possibility is supported by our observation that wastewater exposure blunted the plastic responses of gill morphology to chronic hypoxia, eliminating the regression of the ILCM that occurred in response to chronic hypoxia in clean water (Fig. 3). The regression of the ILCM is considered advantageous in hypoxia by increasing the surface area of the gills for O2 diffusion (Sollid et al., 2003). Wastewater exposure could have also reduced tLOE by reducing the ability of killifish to use anaerobic metabolism. Glycogen stores in the brain are a key fuel for anaerobic metabolism that help determine the ability to maintain ATP levels and avoid losing equilibrium in severe hypoxia (Speers--Roesch et al., 2013). Therefore, the low brain glycogen reserves in kil-lifish that were chronically exposed to wastewater and hypoxia (Fig. 4A) likely reduced the ability to fuel anaerobic metabolism and thus con-strained tLOE.
Exposure to wastewater effluent had no effects on Pcrit. Killifish responded to chronic hypoxia with decreases in Pcrit, consistent with previous findings in killifish and other species (Borowiec et al., 2015, 2020; Fu et al., 2011), but this plastic response was unaffected by wastewater exposure (Fig. 2A). This contrasts recent findings in three-spined stickleback (Gasterosteus aculeatus), in which waterborne copper exposure (20 μg/L) impaired improvements in Pcrit that result from hypoxia acclimation (Fitzgerald et al., 2019). Pcrit is often considered to reflect the ability to extract oxygen from the environment during hypoxia, and is considered to be a useful indicator of hypoxia tolerance in many species (Regan et al., 2019; Rogers et al., 2016; Speers-Roesch et al., 2013). However, in hypoxia-tolerant species such as killifish that readily depress metabolic rate (Borowiec et al., 2018), the reductions in MO2 below Pcrit (Fig. S9) could reflect a facultative reduction in O2 demands rather than a hypoxia-induced constraint on tissue O2 supply. This may explain why wastewater exposure impaired gill plasticity but had no effect on the decreases in Pcrit in response to chronic hypoxia. Furthermore, this leads to the possibility that effects of contaminant exposure on gill morphology will only affect Pcrit for spe-cies in which MO2 depression below Pcrit results from O2 supply limi-tation. For example, many populations of threespine stickleback do not employ metabolic depression in hypoxia (Regan et al., 2017), which may make Pcrit more susceptible to contaminant exposure in stickleback than it is in killifish.
The disruption of hypoxia responses could be attributed to several of the chemical contaminants in wastewater effluent. Selective serotonin reuptake inhibitors (SSRIs) like fluoxetine could inhibit serotonin signaling by oxygen sensing neuroepithelial cells in the gills, which may have disrupted key cardiorespiratory adjustments to hypoxia exposure. Indeed, in gulf toadfish, hypoxia exposure during acute intraperitoneal treatment of 20 or 50 μg/g of fluoxetine have been shown to accentuate oxyconformation (i.e., decreased regulation index) and reduce the ventilatory response, respectively (Amador et al., 2018; Panlilio et al., 2016). Serotonin also regulates glycogenolysis in the brain of rainbow trout (Perez-Maceira et al., 2012), so SSRI exposure could have also contributed to the effects of hypoxia and wastewater exposure on glycogen levels that were observed here. β-Blockers such as propranolol can affect heart rate in zebrafish larvae at waterborne exposure con-centrations of 0.05 mM (Fraysse et al., 2006), can disrupt oxygen chemoreception by neuroepithelial cells in the gills of rainbow trout at concentrations of 1–2 mM in the gill perfusate (Burleson and Milsom, 1990), and can disrupt blood-flow distribution through the gills of
Table 2 The effects of hypoxia and/or wastewater exposure on haematological traits.
Normoxia (20 kPa) Moderate hypoxia (5 kPa)
Severe hypoxia (2 kPa)
Clean WW Clean WW Clean WW
Hct (%) 24.32 ±0.98 (7)
30.51 ±3.70* (11)
26.55 ±1.90 (11)
34.91 ±1.73* (15)
35.00 ±1.24y
(13)
37.50 ±1.74 (12)
[Hb] (g/dl)
9.09 ±0.64 (7)
9.39 ±0.67 (13)
7.78 ±0.46 (11)
10.08 ±0.53* (19)
10.46 ±0.31 (12)
9.89 ±0.60 (13)
MCHC (g/dl)
37.48 ±2.46 (7)
43.33 ±11.99 (11)
29.73 ±1.04 (11)
29.93 ±2.24 (15)
29.41 ±0.72 (12)
25.98 ±1.21y
(12)
Clean, clean water; WW, wastewater; Hct, haematocrit; [Hb], blood haemo-globin content; MCHC, mean corpuscular haemoglobin concentration. Data are expressed as means ± SEM (n). Statistical results of linear models are as follows. Hct: hypoxia effect, p < 0.001; wastewater effect, p = 0.063; hypoxia ×wastewater, p = 0.279. [Hb]: hypoxia effect, p = 0.881; wastewater effect, p =0.664; hypoxia × wastewater, p = 0.013. MCHC: hypoxia effect, p = 0.010; wastewater effect, p = 0.754; hypoxia × wastewater, p = 0.230. Statistical symbols as in Fig. 1.
Fig. 4. The effects of hypoxia and/or wastewater exposure on glycogen content in brain and liver. (A) Statistical results of linear models: hypoxia effect, p =0.149; wastewater effect, p = 0.706; hypoxia × wastewater, p = 0.038. (B) Hypoxia effect, p = 0.417; wastewater effect, p = 0.270; hypoxia × wastewater, p = 0.028. Other statistical information as in Fig. 1.
S.C. Lau et al.

Environmental Pollution 284 (2021) 117373
8
rainbow trout at 0.1 mM in gill perfusate (Payan and Girard, 1977). Ligands of the aryl hydrocarbon receptor (AHR), such as polycyclic ar-omatic hydrocarbons (PAHs), polychlorinated biphenyls (PCBs), and other persistent organic pollutants, could also disrupt cellular responses to hypoxia (Fleming et al., 2009; Kraemer and Schulte, 2004). This is because many of the biochemical and physiological responses to hyp-oxia result from activation of the hypoxia-inducible factor (HIF) pathway (Pelster and Egg, 2018), and there can be cross-talk between HIF-α and AHR signaling as they require the same dimerization partner (HIF-1β, also called the AHR Nuclear Translocator or ARNT) to drive the expression of target genes. Given that many of the cellular responses to hypoxia lead to adjustments in flux through metabolic pathways, it is also possible that such changes could be disrupted by the various pharmaceuticals that target metabolic pathways (e.g., statins such as atorvastatin, diabetes medications such as metformin, etc.). Although exposure to wastewater makes it difficult to disentangle the relative effects of each of these contaminants, it is nevertheless important to understand the emergent effects of the complex real-world contaminant mixtures that enter the environment and how they might interact with other abiotic stressors like hypoxia.
4.3. Conclusions
Our findings suggest that the interaction between the chemical contaminants in wastewater and the other abiotic stressors near WWTPs may have significant detrimental effects on the physiology and health of fish. Wastewater exposure disrupted the physiological adjustments employed by killifish to cope with chronic hypoxia and thus impaired hypoxia tolerance. Chronic exposure to the combination of wastewater and hypoxia also led to the near depletion of brain glycogen reserves, which could put animals at extreme risk if faced with an additional metabolic stress (e.g., heat waves). Our results thus demonstrate that the real-world complex mixtures of contaminants in wastewater can have significant emergent effects on fish health and the ability to cope with environmental variability, at least in part by disrupting respiratory and metabolic processes. Further studies should prioritize the elucidation of mechanisms underlying the interactive effects of wastewater and other abiotic stressors, including hypoxia and other stressors that are pro-jected to become more prevalent with climate change (warming tem-peratures, reduced pH). Such mechanistic approaches can improve our capacity to predict the impacts of aquatic pollution at organismal and population levels.
Credit author statement
Samantha C. Lau: Conceptualization, Methodology, Formal analysis, Writing – original draft, Visualization. Hossein Mehdi: Conceptualiza-tion, Methodology, Formal analysis. Leslie M. Bragg: Investigation. Mark R. Servos: Resources. Sigal Balshine: Conceptualization, Funding acquisition. Graham R. Scott: Conceptualization, Methodology, Re-sources, Writing – review & editing, Supervision, and Funding acquisition.
Declaration of competing interest
The authors declare that they have no known competing financial interests or personal relationships that could have appeared to influence the work reported in this paper.
Acknowledgements
The authors would like to thank Brittney Borowiec, Catie Ivy, Melissa Muzzatti, Andy Turko, Oliver Wearing, and Claire West for assistance with animal care, tissue sampling, and experimental design. Hadi Dhiyebi and Nivetha Srikanthan provided essential help with analytical chemistry of water samples. Special thanks to various people with the
City of Hamilton for exceptional help and assistance – including John Beaton, Shane Blanchard, Lian Dang, Robert Diluca, Richard Fee, Scott Gardin, Rocco Iannarelli, Darco Kodric, Jerzy Rakowski, Bert Pos-edowski, Mark Bainbridge, and all the plant operators at Woodward Avenue Wastewater Treatment Plant. This research was supported by funding to G.R.S. and S.B. from the Royal Bank of Canada (RBC) Blue Water Initiative (made possible by a generous gift from the RBC Foun-dation), as well as a Natural Sciences and Engineering Research Council of Canada (NSERC) Discovery Grant to S.B. G.R.S. is supported by the Canada Research Chairs Program.
Appendix A. Supplementary data
Supplementary data to this article can be found online at https://doi. org/10.1016/j.envpol.2021.117373.
References
Amador, M.H.B., Schauer, K.L., McDonald, M.D., 2018. Does fluoxetine exposure affect hypoxia tolerance in the Gulf toadfish, Opsanus beta? Aquat. Toxicol. 199, 55–64. https://doi.org/10.1016/j.aquatox.2018.03.023.
Arlos, M.J., Bragg, L.M., Parker, W.J., Servos, M.R., 2015. Distribution of selected antiandrogens and pharmaceuticals in a highly impacted watershed. Water Res. 72, 40–50. https://doi.org/10.1016/j.watres.2014.11.008.
Bahamonde, P.A., Fuzzen, M.L., Bennett, C.J., Tetreault, G.R., McMaster, M.E., Servos, M.R., Martyniuk, C.J., Munkittrick, K.R., 2015. Whole organism responses and intersex severity in rainbow darter (Etheostoma caeruleum) following exposures to municipal wastewater in the Grand River basin, ON, Canada. Part A. Aquat. Toxicology 159, 290–301. https://doi.org/10.1016/j.aquatox.2014.11.023.
Bates, D., Machler, M., Bolker, B.M., Walker, S.C., 2015. Fitting linear mixed-effects models using lme4. J. Stat. Software 67, 1–48. https://doi.org/10.18637/jss.v067. i01.
Bickler, P.E., Buck, L.T., 2007. Hypoxia tolerance in reptiles, amphibians, and fishes: life with variable oxygen availability. Annu. Rev. Physiol. 69, 145–170. https://doi.org/ 10.1146/annurev.physiol.69.031905.162529.
Borowiec, B.G., Darcy, K.L., Gillette, D.M., Scott, G.R., 2015. Distinct physiological strategies are used to cope with constant hypoxia and intermittent hypoxia in killifish (Fundulus heteroclitus). J. Exp. Biol. 218, 1198–1211. https://doi.org/ 10.1242/jeb.114579.
Borowiec, B.G., Hoffman, R.D., Hess, C.D., Galvez, F., Scott, G.R., 2020. Interspecific variation in hypoxia tolerance and hypoxia acclimation responses in killifish from the family Fundulidae. J. Exp. Biol. 223, jeb209692. https://doi.org/10.1242/ jeb.209692.
Borowiec, B.G., McClelland, G.B., Rees, B.B., Scott, G.R., 2018. Distinct metabolic adjustments arise from acclimation to constant hypoxia and intermittent hypoxia in estuarine killifish (Fundulus heteroclitus). J. Exp. Biol. 221 https://doi.org/ 10.1242/jeb.190900 jeb.190900.
Breitburg, D.L., Hondorp, D.W., Davias, L.A., Diaz, R.J., 2009. Hypoxia, Nitrogen, and Fisheries: integrating effects across local and global landscapes. Ann. Rev. Mar. Sci. 1, 329–349. https://doi.org/10.1146/annurev.marine.010908.163754.
Brooks, B.W., Riley, T.M., Taylor, R.D., 2006. Water quality of effluent-dominated ecosystems: ecotoxicological, hydrological, and management considerations. Hydrobiologia 556, 365–379. https://doi.org/10.1007/s10750-004-0189-7.
Bugel, S.M., White, L.A., Cooper, K.R., 2010. Impaired reproductive health of killifish (Fundulus heteroclitus) inhabiting Newark Bay, NJ, a chronically contaminated estuary. Aquat. Toxicol. 96, 182–193. https://doi.org/10.1016/j. aquatox.2009.10.016.
Burleson, M.L., Milsom, W.K., 1990. Propranolol inhibits O2-sensitive chemoreceptor activity in trout gills. Am. J. Physiol. Regul. Integr. Comp. Physiol. 258, R1089–R1091. https://doi.org/10.1152/ajpregu.1990.258.4.r1089.
Burnett, K.G., Bain, L.J., Baldwin, W.S., Callard, G.V., Cohen, S., Di Giulio, R.T., Evans, D.H., Gomez-Chiarri, M., Hahn, M.E., Hoover, C.A., Karchner, S.I., Katoh, F., MacLatchy, D.L., Marshall, W.S., Meyer, J.N., Nacci, D.E., Oleksiak, M.F., Rees, B.B., Singer, T.D., Stegeman, J.J., Towle, D.W., Van Veld, P.A., Vogelbein, W.K., Whitehead, A., Winn, R.N., Crawford, D.L., 2007. Fundulus as the premier teleost model in environmental biology: opportunities for new insights using genomics. Comp. Biochem. Physiol. D Genomics Proteom. 2, 257–286. https://doi.org/ 10.1016/j.cbd.2007.09.001.
Carey, R.O., Migliaccio, K.W., 2009. Contribution of wastewater treatment plant effluents to nutrient dynamics in aquatic systems. Environ. Manag. 44, 205–217. https://doi.org/10.1007/s00267-009-9309-5.
Chan, W.K., Yao, G., Gu, Y.Z., Bradfield, C.A., 1999. Cross-talk between the aryl hydrocarbon receptor and hypoxia inducible factor signaling pathways. J. Biol. Chem. 274, 12115–12123. https://doi.org/10.1074/jbc.274.17.12115.
City of Hamilton, 2019. Wastewater Collection and Treatment Profile. https://www.ha milton.ca/home-property-and-development/water-sewer/wastewater-collection-t reatment, 4.9.20.
Corcoran, J., Winter, M.J., Tyler, C.R., 2010. Pharmaceuticals in the aquatic environment: a critical review of the evidence for health effects in fish. Crit. Rev. Toxicol. 40, 287–304. https://doi.org/10.3109/10408440903373590.
S.C. Lau et al.

Environmental Pollution 284 (2021) 117373
9
Crawford, D.L., Schulte, P.M., Whitehead, A., Oleksiak, M.F., 2020. Evolutionary physiology and genomics in the highly adaptable killifish (Fundulus heteroclitus). Comp. Physiol. 10, 637–671. https://doi.org/10.1002/cphy.c190004.
Diaz, R.J., 2001. Overview of hypoxia around the world. J. Environ. Qual. 30, 275–281. https://doi.org/10.2134/jeq2001.302275x.
Diaz, R.J., Rosenberg, R., 2008. Spreading dead zones and consequences for marine ecosystems. Science 321, 926–929. https://doi.org/10.1126/science.1156401.
Du, S.N.N., Choi, J.A., McCallum, E.S., McLean, A.R., Borowiec, B.G., Balshine, S., Scott, G.R., 2019. Metabolic implications of exposure to wastewater effluent in bluegill sunfish. Comp. Biochem. Physiol. C Toxicol. Pharmacol. 224, 108562. https://doi.org/10.1016/j.cbpc.2019.108562.
Du, S.N.N., McCallum, E.S., Vaseghi-Shanjani, M., Choi, J.A., Warriner, T.R., Balshine, S., Scott, G.R., 2018. Metabolic costs of exposure to wastewater effluent lead to compensatory adjustments in respiratory physiology in bluegill sunfish. Environ. Sci. Technol. 52, 801–811. https://doi.org/10.1021/acs.est.7b03745.
Fick, J., Lindberg, R.H., Tysklind, M., Larsson, D.G.G.J., 2010. Predicted critical environmental concentrations for 500 pharmaceuticals. Regul. Toxicol. Pharmacol. 58, 516–523. https://doi.org/10.1016/j.yrtph.2010.08.025.
Fitzgerald, J.A., Urbina, M.G., Rogers, N.J., Bury, N.R., Katsiadaki, I., Wilson, R.W., Santos, E.M., 2019. Sublethal exposure to copper supresses the ability to acclimate to hypoxia in a model fish species. Aquat. Toxicol. 217, 105325. https://doi.org/ 10.1016/j.aquatox.2019.105325.
Fleming, C.R., Billiard, S.M., Di Giulio, R.T., 2009. Hypoxia inhibits induction of aryl hydrocarbon receptor activity in topminnow hepatocarcinoma cells in an ARNT- dependent manner. Comp. Biochem. Physiol. C Toxicol. Pharmacol. 150, 383–389. https://doi.org/10.1016/j.cbpc.2009.06.003.
Fraysse, B., Mons, R., Garric, J., 2006. Development of a zebrafish 4-day embryo-larval bioassay to assess toxicity of chemicals. Ecotoxicol. Environ. Saf. 63, 253–267. https://doi.org/10.1016/j.ecoenv.2004.10.015.
Friedrich, J., Janssen, F., Aleynik, D., Bange, H.W., Boltacheva, N.A., Caǧatay, M.N., Dale, A.W., Etiope, G., Erdem, Z., Geraga, M., Gilli, A., Gomoiu, M.T., Hall, P.O.J., Hansson, D., He, Y., Holtappels, M., Kirf, M.K., Kononets, M.Y., Konovalov, S.K., Lichtschlag, A., Livingstone, D.M., Marinaro, G., Mazlumyan, S.A., Naeher, S., North, R.P., Papatheodorou, G., Pfannkuche, O., Prien, R.D., Rehder, G., Schubert, C. J., Soltwedel, T., Sommer, S., Stahl, H., Stanev, E.V., Teaca, A., Tengberg, A., Waldmann, C., Wehrli, B., Wenzhofer, F., 2014. Investigating hypoxia in aquatic environments: diverse approaches to addressing a complex phenomenon. Biogeosciences 11, 1215–1259. https://doi.org/10.5194/bg-11-1215-2014.
Fu, S.J., Brauner, C.J., Cao, Z.D., Richards, J.G., Peng, J.L., Dhillon, R., Wang, Y.X., 2011. The effect of acclimation to hypoxia and sustained exercise on subsequent hypoxia tolerance and swimming performance in goldfish (Carassius auratus). J. Exp. Biol. 214, 2080–2088. https://doi.org/10.1242/jeb.053132.
Hochachka, P.W., Buck, L.T., Doll, C.J., Land, S.C., 1996. Unifying theory of hypoxia tolerance : molecular/metabolic defense and rescue mechanisms for surviving oxygen lack. Proc. Natl. Acad. Sci. Unit. States Am. 93, 9493–9498. https://doi.org/ 10.1073/pnas.93.18.9493.
Kolpin, D.W., Furlong, E.T., Meyer, M.T., Thurman, E.M., Zaugg, S.D., Barber, L.B., Buxton, H.T., 2002. Pharmaceuticals, hormones, and other organic wastewater contaminants in U.S. streams, 1999-2000: a national reconnaissance. Environ. Sci. Technol. 36, 1202–1211. https://doi.org/10.1021/es011055j.
Kraemer, L.D., Schulte, P.M., 2004. Prior PCB exposure suppresses hypoxia-induced up- regulation of glycolytic enzymes in Fundulus heteroclitus. Comp. Biochem. Physiol. C Toxicol. Pharmacol. 139, 23–29. https://doi.org/10.1016/j.cca.2004.08.015.
Kramer, D.L., McClure, M., 1982. Aquatic surface respiration, a widespread adaptation to hypoxia in tropical freshwater fishes. Environ. Biol. Fish. 7, 47–55. https://doi.org/ 10.1007/BF00011822.
McCallum, E.S., Du, S.N.N., Vaseghi-Shanjani, M., Choi, J.A., Warriner, T.R., Sultana, T., Scott, G.R., Balshine, S., 2017. In situ exposure to wastewater effluent reduces survival but has little effect on the behaviour or physiology of an invasive Great Lakes fish. Aquat. Toxicol. 184, 37–48. https://doi.org/10.1016/j. aquatox.2016.12.017.
Mehdi, H., Lau, S.C., Synyshyn, C., Salena, M.G., McCallum, E.S., Muzzatti, M.M., Bowman, J.E., Mataya, K., Bragg, L.M., Servos, M.R., Kidd, K.K., Scott, G.R., Balshine, S., 2021. Municipal wastewater as an ecological trap: effects on fish communities across seasons. Sci. Total Environ. 759, 143430. https://doi.org/ 10.1016/j.scitotenv.2020.143430.
Mehdi, H., Dickson, F.H., Bragg, L.M., Servos, M.R., Craig, P.M., 2018. Impacts of wastewater treatment plant effluent on energetics and stress response of rainbow darter (Etheostoma caeruleum) in the Grand River watershed. Comp. Biochem. Physiol. B Biochem. Mol. Biol. 224, 270–279. https://doi.org/10.1016/j. cbpb.2017.11.011.
Metcalfe, C.D., 2013. Pharmaceutical contaminants of emerging concern in the environment. Environ. Toxicol. Chem. 32, 1683–1684. https://doi.org/10.1002/ etc.2293.
Metcalfe, C.D., Chu, S., Judt, C., Li, H., Oakes, K.D., Servos, M.R., Andrews, D.M., 2010. Antidepressants and their metabolites in municipal wastewater, and downstream exposure in an urban watershed. Environ. Toxicol. Chem. 29, 79–89. https://doi. org/10.1002/etc.27.
Metcalfe, C.D., Miao, X.S., Koenig, B.G., Struger, J., 2003. Distribution of acidic and neutral drugs in surface waters near sewage treatment plants in the lower Great Lakes, Canada. Environ. Toxicol. Chem. 22, 2881–2889. https://doi.org/10.1897/ 02-627.
Panlilio, J.M., Marin, S., Lobl, M.B., McDonald, M.D., 2016. Treatment with the selective serotonin reuptake inhibitor, fluoxetine, attenuates the fish hypoxia response. Sci. Rep. 6, 31148. https://doi.org/10.1038/srep31148.
Payan, P., Girard, J.P., 1977. Adrenergic receptors regulating patterns of blood flow through the gills of trout. Am. J. Physiol. 232, H18–H23. https://doi.org/10.1152/ ajpheart.1977.232.1.H18.
Pelster, B., Egg, M., 2018. Hypoxia-inducible transcription factors in fish: expression, function and interconnection with the circadian clock. J. Exp. Biol. 221, jeb163709. https://doi.org/10.1242/jeb.163709.
Perez-Maceira, J.J., Mancebo, M.J., Aldegunde, M., 2012. Serotonin-induced brain glycogenolysis in rainbow trout (Oncorhynchus mykiss). J. Exp. Biol. 215, 2969–2979. https://doi.org/10.1242/jeb.070649.
Perry, S.F., Jonz, M.G., Gilmour, K.M., 2009. Chapter 5 Oxygen sensing and the hypoxic ventilatory response. In: Fish Physiology. Academic Press, pp. 193–253. https://doi. org/10.1016/S1546-5098(08)00005-8.
Perry, S.F., Tzaneva, V., 2016. The sensing of respiratory gases in fish: mechanisms and signalling pathways. Respir. Physiol. Neurobiol. 224, 71–79. https://doi.org/ 10.1016/j.resp.2015.06.007.
Pollock, M.S., Clarke, L.M.J., Dube, M.G., 2007. The effects of hypoxia on fishes: from ecological relevance to physiological effects. Environ. Rev. 15, 1–14. https://doi. org/10.1139/a06-006.
Rasband, W.S., 2008. Image J. U.S. National Institutes of Health, Bethesda, Maryland, USA. https://imagej.nij.gov/ij/.
R Core Team, 2019. R: A Language and Environment for Statistical Computing. Foundation for Statistical Computing, Vienna, Austria. https://www.R-project.org/.
Regan, M.D., Gill, I.S., Richards, J.G., 2017. Metabolic depression and the evolution of hypoxia tolerance in threespine stickleback, Gasterosteus aculeatus. Biol. Lett. 13, 20170392. https://doi.org/10.1098/rsbl.2017.0392.
Regan, M.D., Mandic, M., Dhillon, R.S., Lau, G.Y., Farrell, A.P., Schulte, P.M., Seibel, B. A., Speers-Roesch, B., Ultsch, G.R., Richards, J.G., 2019. Don’t throw the fish out with the respirometry water. J. Exp. Biol. 222, jeb200253 https://doi.org/10.1242/ jeb.200253.
Reid, N.M., Proestou, D.A., Clark, B.W., Warren, W.C., Colbourne, J.K., Shaw, J.R., Karchner, S.I., Hahn, M.E., Nacci, D., Oleksiak, M.F., Crawford, D.L., Whitehead, A., 2016. The genomic landscape of rapid repeated evolutionary adaptation to toxic pollution in wild fish. Science 354, 1305–1308. https://doi.org/10.1126/science. aah4993.
Richards, J.G., 2011. Physiological, behavioral and biochemical adaptations of intertidal fishes to hypoxia. J. Exp. Biol. 214, 191–199. https://doi.org/10.1242/jeb.047951.
Richards, J.G., Farrell, A.P., Brauner, C.J., 2009. Metabolic and molecular responses of fish to hypoxia. In: Fish Physiology: Hypoxia, vol. 27, pp. 426–428. https://doi.org/ 10.1016/S1546-5098(08)00010-1.
Rogers, N.J., Urbina, M.A., Reardon, E.E., McKenzie, D.J., Wilson, R.W., 2016. A new analysis of hypoxia tolerance in fishes using a database of critical oxygen level (Pcrit). Conserv. Physiol. 4, cow012. https://doi.org/10.1093/conphys/cow012.
Silva, G.S. da, Fe, L.M.L., Silva, M. de N.P. da, Val, V., 2017. Ras oncogene and Hypoxia- inducible factor-1 alpha (Hif-1α) expression in the Amazon fish Colossoma macropomum (Cuvier, 1818) exposed to benzo[a]pyrene. Genet. Mol. Biol. 40, 491–501. https://doi.org/10.1590/1678-4685-GMB-2016-0066.
Sollid, J., De Angelis, P., Gundersen, K., Nilsson, G.E., 2003. Hypoxia induces adaptive and reversible gross morphological changes in crucian carp gills. J. Exp. Biol. 206, 3667–3673. https://doi.org/10.1242/jeb.00594.
Speers-Roesch, B., Mandic, M., Groom, D.J.E., Richards, J.G., 2013. Critical oxygen tensions as predictors of hypoxia tolerance and tissue metabolic responses during hypoxia exposure in fishes. J. Exp. Mar. Biol. Ecol. 449, 239–249. https://doi.org/ 10.1016/j.jembe.2013.10.006.
Verlicchi, P., Al Aukidy, M., Zambello, E., 2012. Occurrence of pharmaceutical compounds in urban wastewater: removal, mass load and environmental risk after a secondary treatment-A review. Sci. Total Environ. https://doi.org/10.1016/j. scitotenv.2012.04.028.
Vorrink, S.U., Domann, F.E., 2014. Regulatory crosstalk and interference between the xenobiotic and hypoxia sensing pathways at the AhR-ARNT-HIF1α signaling node. Chem. Biol. Interact. 218, 82–88. https://doi.org/10.1016/j.cbi.2014.05.001.
Weis, J.S., 2002. Tolerance to environmental contaminants in the mummichog, Fundulus heteroclitus. Hum. Ecol. Risk Assess. 8, 933–953. https://doi.org/10.1080/1080- 700291905756.
Weis, J.S., Weis, P., 1989. Tolerance and stress in a polluted environment. Bioscience 39, 89–95. https://doi.org/10.2307/1310907.
Zenker, A., Cicero, M.R., Prestinaci, F., Bottoni, P., Carere, M., 2014. Bioaccumulation and biomagnification potential of pharmaceuticals with a focus to the aquatic environment. J. Environ. Manag. 133, 378–387. https://doi.org/10.1016/j. jenvman.2013.12.017.
S.C. Lau et al.