Embed Size (px)
Citation preview

1
(Incorporated in Hong Kong with limited liability)
(Stock Code: 966)
FINAL RESULTS FOR THE YEAR ENDED 31 DECEMBER 2006 The Board of Directors of China Insurance International Holdings Company Limited is pleased to announce the audited consolidated results of the Company and its subsidiaries for the year ended 31 December 2006 as follows: CONSOLIDATED INCOME STATEMENT
For the year ended 31 December 2006 (Expressed in Hong Kong dollars)
Note 2006 2005 $’000 $’000
Revenue Gross premiums written and policy fees 3 12,373,454 8,611,673 Less: Premiums ceded to reinsurers (222,920) (267,726) Net premiums written and policy fees 12,150,534 8,343,947 Change in unearned premium provisions, net of reinsurance (216,961) (125,913) Net earned premiums and policy fees 11,933,573 8,218,034 Net investment income 4(a) 1,189,711 722,283 Net realised investment gains 4(b) 559,510 71,211 Net unrealised investment gains 4(c) 634,873 21,079 Net exchange gain/(loss) 22,836 (94,892) Other income 5 39,781 15,056 Total revenue 14,380,284 8,952,771 Benefits, losses and expenses Policyholders’ benefits 6 (2,365,092) (1,422,941) Net commission expenses (1,194,817) (809,157) Administrative and other expenses (1,466,531) (1,179,857) Change in life insurance funds, net of reinsurance (8,229,133) (5,785,225) Goodwill impairment - (250,000) Total benefits, losses and expenses (13,255,573) (9,447,180)
Profit/(loss) from operations 1,124,711 (494,409) Share of profits/(losses) of associates 4,070 (48,728) Finance costs 7(a) (144,184) (88,299)
Profit/(loss) before taxation 7 984,597 (631,436) Income tax (charge)/credit 8 (326,256) 36,083
Profit/(loss) after taxation 658,341 (595,353)
Attributable to:
Equity holders of the Company 510,765 (433,763) Minority interests 147,576 (161,590)
658,341 (595,353)
cents cents Earnings/(loss) per share attributable
to the equity holders of the Company 10 Basic 38.1 (32.5)
Diluted 37.7 (32.4)

2
CONSOLIDATED BALANCE SHEET
As at 31 December 2006 (Expressed in Hong Kong dollars)
Note 2006 2005 $’000 $’000
Assets
Statutory deposits 547,443 487,806 Fixed assets - Investment properties 106,077 105,480
- Other property, plant and equipment 1,034,690 554,027 1,140,767 659,507 Goodwill 228,185 228,185 Interest in associates 350,678 315,298 Deferred tax assets 2,697 3,298 Investments in debt and equity securities 25,553,330 18,122,506 Amounts due from group companies 7,036 314 Insurance debtors 11 453,167 342,060 Reinsurers’ share of insurance contract provisions 391,907 472,176 Other debtors 562,340 608,778 Tax recoverable 3,581 5,585 Pledged deposits at bank 93,676 97,980 Deposits at bank with original maturity more than three months 4,637,850 1,773,928 Cash and cash equivalents 6,081,010 4,216,360 40,053,667 27,333,781
Liabilities Life insurance funds 24,406,372 15,453,533 Unearned premium provisions 852,968 591,267 Provision for outstanding claims 2,186,166 2,149,978 Investment contract liabilities 115,681 75,857 Deferred tax liabilities 666,555 80,554 Interest-bearing notes 2,844,819 2,789,471 Securities sold under repurchase agreements 2,490,366 1,923,499 Amounts due to group companies 413 - Insurance creditors 12 240,030 380,171 Accrued charges and other creditors 601,130 421,507 Current taxation 56,141 37,470 Insurance protection fund 10,385 7,229 34,471,026 23,910,536 Net assets 5,582,641 3,423,245
Capital and reserves attributable to the Company’s
equity holders
Share capital 70,313 66,824 Reserves 4,108,006 2,440,334 4,178,319 2,507,158 Minority interests 1,404,322 916,087 Total equity 5,582,641 3,423,245

3
NOTES TO THE FINAL FINANCIAL RESULTS (Expressed in Hong Kong dollars) 1 Basis of preparation
These financial statements have been prepared in accordance with all applicable Hong Kong Financial Reporting Standards (“HKFRSs”), which collective term includes all applicable individual Hong Kong Financial Reporting Standards, Hong Kong Accounting Standards (“HKASs”) and Interpretations issued by the HKICPA, accounting principles generally accepted in Hong Kong and the requirements of the Hong Kong Companies Ordinance. These financial statements also comply with the applicable disclosure provisions of the Rules Governing the Listing of Securities on The Stock Exchange of Hong Kong Limited. The accounting policies adopted in 2005 have been consistently applied to the 2006 financial results.
2 Segment reporting
a. Segmental income statement for 2006 2006
Corporate
Life and other
Reinsurance insurance businesses Total
$’000 $’000 $’000 $’000
Revenue Gross premiums written 1,541,568 10,823,201 - 12,364,769
Policy fees - 8,685 - 8,685
1,541,568 10,831,886 - 12,373,454
Less: Premiums ceded to reinsurers (164,565) (58,355) - (222,920)
Net premiums written and
policy fees 1,377,003 10,773,531 - 12,150,534
Change in unearned premium
provisions, net of reinsurance (136,910) (80,051) - (216,961)
Net earned premiums and policy fees 1,240,093 10,693,480 - 11,933,573
Net investment income 160,608 987,901 41,202 1,189,711
Net realised investment gains 133,572 371,170 54,768 559,510
Net unrealised investment gains 9,254 611,685 13,934 634,873
Net exchange gain/(loss) 66,971 (42,036) (2,099) 22,836
Other income 5,614 19,264 68,977 93,855
Inter-segment transactions - (12,219) (41,855) (54,074)
1,616,112 12,629,245 134,927 14,380,284
Benefits, losses and expenses
Policyholders’ benefits (820,867) (1,544,225) - (2,365,092)
Net commission expenses (326,213) (868,604) - (1,194,817)
Administrative and other
expenses (87,992) (1,321,052) (111,561) (1,520,605)
Change in life insurance funds,
net of reinsurance - (8,229,133) - (8,229,133)
Inter-segment transactions 30,521 11,334 12,219 54,074
(1,204,551) (11,951,680) (99,342) (13,255,573)
Profit from
operations 411,561 677,565 35,585 1,124,711
Share of (losses)/profits of
associates - (362) 4,432 4,070
Finance costs - (65,081) (79,103) (144,184)
Profit/(loss)
before taxation 411,561 612,122 (39,086) 984,597
Income tax charge (15,905) (298,836) (11,515) (326,256)
Profit/(loss)
after taxation 395,656 313,286 (50,601) 658,341
Minority interests - (156,685) 9,109 (147,576)
Profit/(loss) attributable
to equity holders 395,656 156,601 (41,492) 510,765

4
2 Segment reporting (Continued)
b. Segmental balance sheet for 2006 2006 Corporate
Life and other
Reinsurance insurance businesses Total
$’000 $’000 $’000 $’000
Statutory deposits - 497,675 49,768 547,443
Investment properties 106,077 - - 106,077
Other property, plant and equipment 2,785 970,025 61,880 1,034,690
Debt securities 1,383,586 18,257,752 186,717 19,828,055
Direct equity securities 710,972 1,956,041 492,080 3,159,093
Equity investment funds - 2,485,383 40,589 2,525,972
Composite investment funds 40,210 - - 40,210
Cash and bank deposits 1,603,704 8,000,884 1,207,948 10,812,536
Goodwill - 154,909 73,276 228,185
Interest in associates - 3,968 346,710 350,678
Reinsurers’ share of insurance contract
provisions 353,462 38,445 - 391,907
Other segment assets 486,701 520,343 21,777 1,028,821
Total assets 4,687,497 32,885,425 2,480,745 40,053,667
Life insurance funds - 24,406,372 - 24,406,372
Unearned premium provisions 527,934 325,034 - 852,968
Provision for outstanding claims 2,133,272 52,894 - 2,186,166
Investment contract liabilities - 115,681 - 115,681
Interest-bearing notes - 1,493,025 1,351,794 2,844,819
Securities sold under repurchase
agreements - 2,490,366 - 2,490,366
Deferred tax liabilities 11,050 648,775 6,730 666,555
Other segment liabilities 128,056 713,791 66,252 908,099
Total liabilities 2,800,312 30,245,938 1,424,776 34,471,026
Minority interests - 1,326,727 77,595 1,404,322
Net assets attributable to the equity
holders of the Company 1,887,185 1,312,760 978,374 4,178,319

5
2 Segment reporting (Continued)
c. Segmental income statement for 2005 2005
Corporate
Life and other
Reinsurance insurance businesses Total $’000 $’000 $’000 $’000
Revenue
Gross premiums written 1,256,403 7,351,092 - 8,607,495
Policy fees - 4,178 - 4,178
1,256,403 7,355,270 - 8,611,673 Less: Premiums ceded to reinsurers (218,557) (49,169) - (267,726)
Net premiums written and policy fees 1,037,846 7,306,101 - 8,343,947 Change in unearned premium
provisions, net of reinsurance (26,029) (99,884) - (125,913) Net earned premiums and policy fees 1,011,817 7,206,217 - 8,218,034 Net investment income 131,244 556,233 34,806 722,283
Net realised investment gains/(losses) 47,763 (4,914) 28,362 71,211 Net unrealised investment gains 12,673 6,377 2,029 21,079 Net exchange (loss)/gain (65,930) (30,147) 1,185 (94,892)
Other income/(loss) 469 (1,862) 31,382 29,989 Inter-segment transactions (300) - (14,633) (14,933)
1,137,736 7,731,904 83,131 8,952,771
Benefits, losses and expenses Policyholders’ benefits (750,623) (672,318) - (1,422,941)
Net commission expenses (235,554) (573,603) - (809,157) Administrative and other expenses (47,729) (1,091,112) (55,949) (1,194,790)
Change in life insurance funds, net of reinsurance - (5,785,225) - (5,785,225)
Goodwill impairment - - (250,000) (250,000)
Inter-segment transactions 11,453 - 3,480 14,933 (1,022,453) (8,122,258) (302,469) (9,447,180)
Profit/(loss) from
operations 115,283 (390,354) (219,338) (494,409) Share of losses of
associates - (616) (48,112) (48,728) Finance costs - (5,290) (83,009) (88,299)
Profit/(loss)
before taxation 115,283 (396,260) (350,459) (631,436) Income tax (charge)/credit (41,674) 75,382 2,375 36,083
Profit/(loss)
after taxation 73,609 (320,878) (348,084) (595,353)
Minority interests - 161,590 - 161,590
Profit/(loss) attributable
to equity holders 73,609 (159,288) (348,084) (433,763)

6
2 Segment reporting (Continued)
d. Segmental balance sheet for 2005 2005
Corporate
Life and other
Reinsurance insurance businesses Total
$’000 $’000 $’000 $’000
Statutory deposits - 439,756 48,050 487,806
Investment properties 105,480 - - 105,480
Other property, plant and equipment 3,266 494,682 56,079 554,027
Debt securities 1,473,640 14,841,992 403,891 16,719,523
Direct equity securities 325,721 183,486 140,291 649,498
Equity investment funds - 745,105 - 745,105
Composite investment funds 8,380 - - 8,380
Cash and bank deposits 1,191,774 4,523,827 372,667 6,088,268
Goodwill - 154,909 73,276 228,185
Interest in associates - 4,188 311,110 315,298
Reinsurers’ share of insurance contract
provisions 444,751 27,425 - 472,176
Other segment assets 437,524 490,267 32,244 960,035
Total assets 3,990,536 21,905,637 1,437,608 27,333,781
Life insurance funds - 15,453,533 - 15,453,533
Unearned premium provisions 369,327 221,940 - 591,267
Provision for outstanding claims 2,106,450 43,528 - 2,149,978
Investment contract liabilities - 75,857 - 75,857
Interest-bearing notes - 1,441,500 1,347,971 2,789,471
Securities sold under repurchase
agreements - 1,923,499 - 1,923,499
Deferred tax liabilities 405 80,049 100 80,554
Other segment liabilities 125,921 699,111 21,345 846,377
Total liabilities 2,602,103 19,939,017 1,369,416 23,910,536
Minority interests - 916,087 - 916,087
Net assets attributable to equity
holders of the Company 1,388,433 1,050,533 68,192 2,507,158

7
3 Gross premiums written and policy fees
Turnover represents gross premiums written and policy fees from reinsurance business and life insurance business. 2006
Reinsurance Life insurance Investment
contracts contracts contracts Total
$’000 $’000 $’000 $’000
Gross premiums written 1,541,568 10,823,201 - 12,364,769
Policy fees - - 8,685 8,685
1,541,568 10,823,201 8,685 12,373,454
2005
Reinsurance Life insurance Investment
contracts contracts contracts Total
$’000 $’000 $’000 $’000
Gross premiums written 1,256,403 7,351,092 - 8,607,495
Policy fees - - 4,178 4,178
1,256,403 7,351,092 4,178 8,611,673
4 Investment income
2006 2005
$’000 $’000
Net investment income (note (a)) 1,189,711 722,283
Net realised investment gains (note (b)) 559,510 71,211
Net unrealised investment gains (note (c)) 634,873 21,079
2,384,094 814,573
(a) Net investment income
Interest income from debt securities:
- Held-to-maturity 64,802 71,653
- Available-for-sale 706,352 449,718
- Designated at fair value through profit or loss 32,685 30,532
Dividend income from direct equity securities:
- Available-for-sale 7,259 2,447
- Designated at fair value through profit or loss 16,478 13,683
Dividend income from equity investment funds:
- Available-for-sale 148,685 -
- Designated at fair value through profit or loss 41,444 78,792
Dividend income from composite investment funds:
- Designated at fair value through profit or loss 1,561 144
Bank deposits and other interest income 227,651 113,317
Rentals receivable from investment properties 2,094 2,207
Interest expenses on securities sold under
repurchases agreements (59,300) (40,210)
1,189,711 722,283

8
4 Investment income (Continued)
2006 2005
$’000 $’000
(b) Net realised investment gains
Debt securities:
- Available-for-sale 1,233 13,414
- Designated at fair value through profit or loss 6,156 10,635
Direct equity securities:
- Available-for-sale 146,169 16,210
- Designated at fair value through profit or loss 194,826 44,135
Equity investment funds:
- Designated at fair value through profit or loss 209,664 (16,023)
Investment properties 1,462 -
Derivative financial instruments - 2,840
559,510 71,211
(c) Net unrealised investment gains
Debt securities:
- Designated at fair value through profit or loss (6,310) 10,502
Direct equity securities:
- Designated at fair value through profit or loss 204,667 11,842
Equity investment funds:
- Designated at fair value through profit or loss 433,770 (11,477)
Composite investment funds:
- Designated at fair value through profit or loss 393 627
Derivative financial instruments (1,244) -
Surplus on revaluation of investment properties 3,597 9,585
634,873 21,079
5 Other income
2006 2005
$’000 $’000
Income from asset management business 8,371 4,379
Income from insurance intermediary business 14,335 10,964
Income from pension business 376 -
Net loss on sale of fixed assets (213) (295)
Others 16,912 8
39,781 15,056

9
6 Policyholders’ benefits
2006
Reinsurance Life insurance contracts contracts Total
$’000 $’000 $’000
Claims and claim adjustment expenses 917,945 309,564 1,227,509
Less: Reinsurers’ share (97,078) (37,476) (134,554)
820,867 272,088 1,092,955
Surrenders - 1,159,625 1,159,625
Annuity and maturity payments - 72,959 72,959
Policy dividends - 39,553 39,553
820,867 1,544,225 2,365,092
2005 Reinsurance Life insurance contracts contracts Total
$’000 $’000 $’000
Claims and claim adjustment expenses 923,169 188,158 1,111,327
Less: Reinsurers’ share (172,546) (27,853) (200,399)
750,623 160,305 910,928
Surrenders - 483,210 483,210 Annuity and maturity payments
- 22,523 22,523
Policy dividends - 6,280 6,280
750,623 672,318 1,422,941
7 Profit/(loss) before taxation
Profit/(loss) before taxation is arrived at after charging: 2006 2005 $’000 $’000
(a) Finance costs: Interest on interest-bearing notes 144,184 85,169 Interest on other loans - 3,130 144,184 88,299
(b) Other items: Impairment of goodwill on a subsidiary - 250,000 Depreciation of fixed assets 47,666 40,353
10
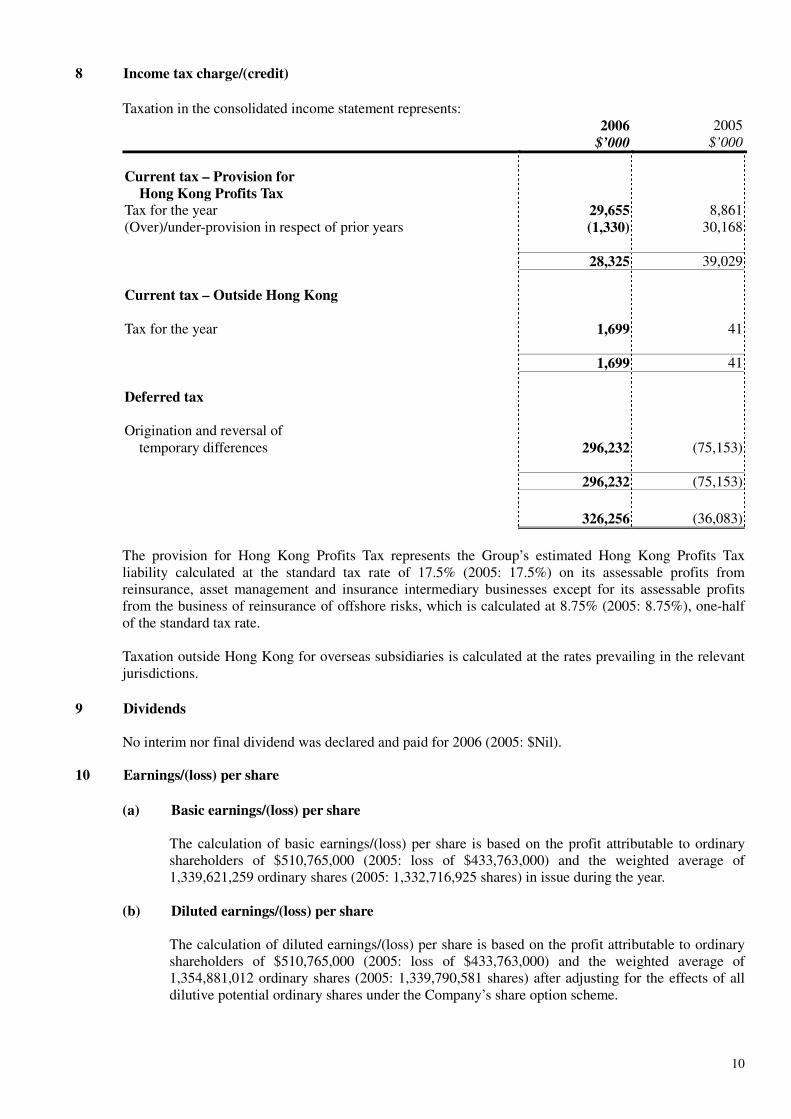
8 Income tax charge/(credit)
Taxation in the consolidated income statement represents: 2006 2005 $’000 $’000
Current tax – Provision for Hong Kong Profits Tax Tax for the year 29,655 8,861 (Over)/under-provision in respect of prior years (1,330) 30,168 28,325 39,029 Current tax – Outside Hong Kong Tax for the year 1,699 41 1,699 41 Deferred tax Origination and reversal of temporary differences 296,232 (75,153) 296,232 (75,153)
326,256 (36,083)
The provision for Hong Kong Profits Tax represents the Group’s estimated Hong Kong Profits Tax liability calculated at the standard tax rate of 17.5% (2005: 17.5%) on its assessable profits from reinsurance, asset management and insurance intermediary businesses except for its assessable profits from the business of reinsurance of offshore risks, which is calculated at 8.75% (2005: 8.75%), one-half of the standard tax rate. Taxation outside Hong Kong for overseas subsidiaries is calculated at the rates prevailing in the relevant jurisdictions.
9 Dividends
No interim nor final dividend was declared and paid for 2006 (2005: $Nil).
10 Earnings/(loss) per share
(a) Basic earnings/(loss) per share
The calculation of basic earnings/(loss) per share is based on the profit attributable to ordinary shareholders of $510,765,000 (2005: loss of $433,763,000) and the weighted average of 1,339,621,259 ordinary shares (2005: 1,332,716,925 shares) in issue during the year.
(b) Diluted earnings/(loss) per share
The calculation of diluted earnings/(loss) per share is based on the profit attributable to ordinary shareholders of $510,765,000 (2005: loss of $433,763,000) and the weighted average of 1,354,881,012 ordinary shares (2005: 1,339,790,581 shares) after adjusting for the effects of all dilutive potential ordinary shares under the Company’s share option scheme.

11
10 Earnings/(loss) per share (Continued)
(c) Reconciliations 2006 2005 Number of Number of shares shares
Weighted average number of ordinary shares used in calculating basic earnings/(loss) per share 1,339,621,259 1,332,716,925 Deemed issue of ordinary shares for no consideration 15,259,753 7,073,656 Weighted average number of ordinary shares used in calculating diluted earnings/(loss) per share 1,354,881,012 1,339,790,581
11 Insurance debtors
The Group
2006 2005
$’000 $’000
Amounts due from insurance
customers and suppliers 352,953 225,408
Deposits retained by cedants 100,214 116,652
453,167 342,060
All of the insurance debtors are expected to be recovered within one year. Amounts due from insurance customers and suppliers include amounts due from fellow subsidiaries of $8,219,000 (2005: $5,572,000) which are trade related in nature. The following is an ageing analysis of amounts due from insurance customers and suppliers (net of impairment loss):
The Group
2006 2005
$’000 $’000
Not yet due 275,942 138,013
Current 60,186 72,030
More than 3 months but less than 12 months 14,612 9,776
More than 12 months 2,213 5,589
352,953 225,408
12
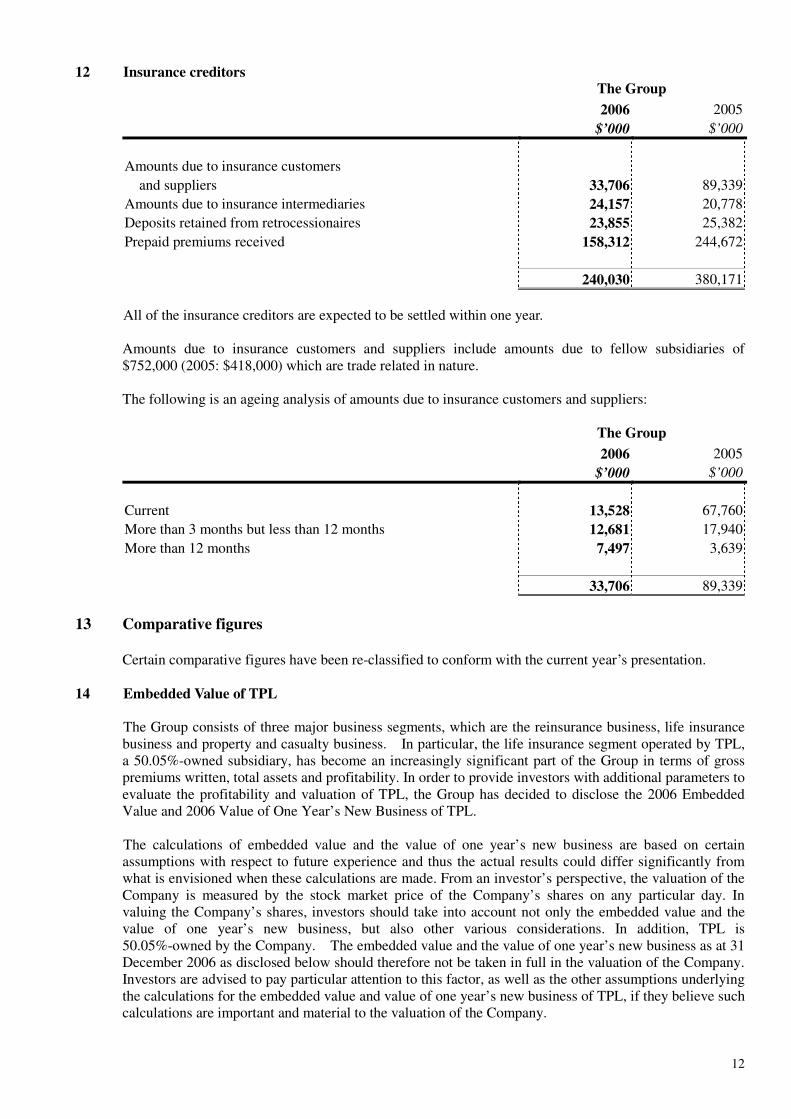
12 Insurance creditors
The Group
2006 2005
$’000 $’000
Amounts due to insurance customers
and suppliers 33,706 89,339
Amounts due to insurance intermediaries 24,157 20,778
Deposits retained from retrocessionaires 23,855 25,382
Prepaid premiums received 158,312 244,672
240,030 380,171
All of the insurance creditors are expected to be settled within one year.
Amounts due to insurance customers and suppliers include amounts due to fellow subsidiaries of $752,000 (2005: $418,000) which are trade related in nature. The following is an ageing analysis of amounts due to insurance customers and suppliers:
The Group
2006 2005
$’000 $’000
Current 13,528 67,760
More than 3 months but less than 12 months 12,681 17,940
More than 12 months 7,497 3,639
33,706 89,339
13 Comparative figures
Certain comparative figures have been re-classified to conform with the current year’s presentation. 14 Embedded Value of TPL
The Group consists of three major business segments, which are the reinsurance business, life insurance business and property and casualty business. In particular, the life insurance segment operated by TPL, a 50.05%-owned subsidiary, has become an increasingly significant part of the Group in terms of gross premiums written, total assets and profitability. In order to provide investors with additional parameters to evaluate the profitability and valuation of TPL, the Group has decided to disclose the 2006 Embedded Value and 2006 Value of One Year’s New Business of TPL.
The calculations of embedded value and the value of one year’s new business are based on certain assumptions with respect to future experience and thus the actual results could differ significantly from what is envisioned when these calculations are made. From an investor’s perspective, the valuation of the Company is measured by the stock market price of the Company’s shares on any particular day. In valuing the Company’s shares, investors should take into account not only the embedded value and the value of one year’s new business, but also other various considerations. In addition, TPL is 50.05%-owned by the Company. The embedded value and the value of one year’s new business as at 31 December 2006 as disclosed below should therefore not be taken in full in the valuation of the Company. Investors are advised to pay particular attention to this factor, as well as the other assumptions underlying the calculations for the embedded value and value of one year’s new business of TPL, if they believe such calculations are important and material to the valuation of the Company.

13
14 Embedded Value of TPL (Continued)
Embedded Value
At 31 December 2006, HK$ Million
Adjusted net worth a 2,168 Value of in-force business before cost of capital and expense overrun b 2,789 Cost of capital c 295 Expense overrun d 44
Value of in-force business after cost of capital and expense overrun e=b-c-d 2,450 Embedded Value f=a+e 4,618
Adjusted net worth is equal to the sum of : (i) Shareholders’ net assets of TPL as measured on a PRC statutory basis; (ii) net of tax adjustment for the difference between the market value of certain investment assets and
the carrying value reported on a PRC statutory basis. TPL’s expense overrun is due to its significant investments in establishing a branch network infrastructure, initiating relationships with business partners, establishing computer systems and hiring a highly professional management team. As such expense overrun is due to the start-up costs of beginning and expanding upon TPL’s business operations, the management of the Group and TPL believe that the expense overrun will diminish over time as TPL’s scale of operations increases in the future.
Value of One Year’s New Business
At 31 December 2006, HK$ Million
Value of one year’s new business before cost of capital and expense overrun
a
1,133 Cost of capital b 161
Expense overrun c 543 Value of one year’s new business after cost of capital and expense overrun
d=a-b-c
429

14
MANAGEMENT REVIEW AND ANALYSIS
CONSOLIDATED FINANCIAL RESULTS The performance highlights of the Group for the Year are as follows: For the year ended 31 December, HK$ million 2006 2005 Change
Gross premiums written and policy fees 12,373.45 8,611.67 43.7% Net investment income 1,189.71 722.28 64.7% Net realised investment gains 559.51 71.21 7.9 Times Net unrealised investment gains 634.87 21.08 30.1 Times Net exchange gain/(loss) 22.84 (94.89) nm Goodwill impairment - (250.00) nm Profit/(loss) before taxation 984.60 (631.44) nm Profit/(loss) after taxation 658.34 (595.35) nm Net profit/(loss) attributable to the equity holders
510.77
(433.76)
nm
Basic earnings/(loss) per share (HK cent) 38.1 (32.5) nm
The net profit/(loss) attributable to the equity holders by each business line is summarised below: For the year ended 31 December, HK$ million 2006 2005 Change
Reinsurance 395.66 73.61 5.4 Times Life insurance 156.60 (159.29) nm Property and casualty insurance1 3.37 (52.99) nm Corporate and other businesses (44.86) (45.09) (0.5%)
510.77 (183.76) nm Goodwill impairment - (250.00) nm
Net profit/(loss) attributable to the equity holders 510.77 (433.76) nm
1 The property and casualty insurance business is operated by TPI which is an associate of the Group
under the Hong Kong Financial Reporting Standards and is not consolidated into the Group on a line-by-line basis. Therefore, the property and casualty insurance business does not constitute a separate segment of the Group. Instead, the share of results of TPI for the financial year is recognised and reported as “Share of profits/(losses) of associates” in the consolidated income statement. The equity interest of TPI held by the Group at the balance sheet date is recognised and reported as “Interest in associates” in the consolidated balance sheet.
The gross premiums written and policy fees for the Year increased significantly to HK$12,373.45 million from HK$8,611.67 million in the Last Year. The increase was mainly due to the strong premium growth in the life insurance business in which premiums increased by 47.2% to HK$10,823.20 million from HK$7,351.09 million in the Last Year. The net profit attributable to the equity holders for the Year was HK$510.77 million (2005: loss of HK$433.76 million). The Group’s results improved over that of the Last Year primarily because of improvements in profitability at each of our business segments.
The reinsurance business contributed net profit to the equity holders of HK$395.66 million (2005: HK$73.61 million). The improvement in net profit was mainly due to increased underwriting profits and strong investment returns during the Year. The life insurance business contributed net profit to the equity holders of HK$156.60 million (2005: loss of HK$159.29 million). The profit was mainly due to continued increases in premiums and strong investment returns during the Year.

15
The property and casualty business contributed a net profit to the equity holders of HK$3.37 million (2005: loss of HK$52.99 million). The profit represents a positive turnaround at the property and casualty business during the Year.
BUSINESS REVIEW
REINSURANCE BUSINESS The Group’s reinsurance business is operated by CIRe, which is a Hong Kong-incorporated company and wholly-owned by the Group. CIRe is mainly engaged in the underwriting of all classes of reinsurance business except for casualty reinsurance business outside of Asia. CIRe’s key markets are Hong Kong and Macau, China, Japan, the rest of Asia, Europe and other parts of the world. The key financial data and key performance indicators of the reinsurance business are summarised below: For the year ended 31 December, HK$ million 2006 2005 Change
Gross premiums written 1,541.57 1,256.40 22.7% Net premiums written 1,377.00 1,037.85 32.7% Net earned premiums 1,240.09 1,011.82 22.6% Net claims incurred (820.87) (750.62) 9.4% Net commission expenses (326.21) (235.55) 38.5% Underwriting profit 61.51 8.74 7 Times Total investment income 303.43 191.68 58.3% Net exchange gain/(loss) 66.97 (65.93) nm Profit before taxation 411.56 115.28 3.6 Times Profit attributable to the equity holders 395.66 73.61 5.4 Times
Solvency margin ratio 135.7% 133.8% 1.9pts Technical reserves ratio 186.1% 200.7% (14.6pts) Retained ratio 89.3% 82.6% 6.7pts Earned premiums ratio 80.4% 80.5% (0.1pt) Loss ratio 66.2% 74.2% (8.0pts) Expense ratio 28.8% 25.0% 3.8pts Combined ratio 95.0% 99.2% (4.2pts)
Profit Attributable to the equity holders
CIRe contributed net profit to the equity holders of HK$395.66 million (2005: HK$73.61 million). This net profit attributable to the equity holders for the Year represents CIRe’s best annual results ever. The positive performance during the Year was mainly due to higher equity investment income, positive exchange rate movements, and higher interest rates on cash deposits. The underwriting profit also increased to HK$61.51 million from HK$8.74 million in the Last Year. The higher underwriting profit was due to strong premium growth and the absence of major catastrophe claims during the Year. Gross Premiums Written
CIRe’s gross premiums written increased by 22.7% to HK$1,541.57 million from HK$1,256.40 million in the Last Year. The increase was primarily due to the continued growth of the underlying insurance markets within Asia.

16
CIRe’s geographical distribution of gross premiums written is summarised as follows: For the year ended 31 December, HK$ million 2006 % of Total 2005 % of Total
Hong Kong & Macau 307.42 19.9% 335.82 26.7% Mainland China (& Taiwan) 354.93 23.0% 223.86 17.8% Japan 96.92 6.3% 86.72 6.9% Rest of Asia 417.06 27.1% 347.23 27.7% Europe 264.01 17.1% 184.79 14.7% Other 101.23 6.6% 77.98 6.2%
1,541.57 100.0% 1,256.40 100.0%
The premiums from Asian markets constituted 76.3% of the total gross premiums written for 2006 (2005: 79.1%). During the Year, CIRe maintained its selective and strict underwriting strategy. CIRe has grown its top-line gross premiums while putting much emphasis and effort on underwriting and risk management. The diversity of CIRe’s geographical exposure has increased over the Year. In the Hong Kong market, the underwriting profitability of the past few years has resulted in keener competition amongst the primary insurers and in the original policy premium rates. The Hong Kong primary insurers are also increasing their retention of insurance risks. This Hong Kong industry trend, in addition to the conservative underwriting strategy adopted by CIRe, has meant that CIRe’s gross premiums written from the local market has decreased from that of Last Year.
Net Claims Incurred
CIRe’s net claims incurred increased by 9.4% to HK$820.87 million from HK$750.62 million in the Last Year. The loss ratio decreased to 66.2% from 74.2% in the Last Year. The top three major claims in terms of gross losses during the Year were as follows: For the year ended 31 December 2006, HK$ million Gross
loss incurred Net retained loss incurred
% retention
Typhoon "Bilis", China 27.02 21.95 81.2% Earthquake in Central Java 10.61 10.61 100.0% Motor Vessel "Hyundai Fortune" 9.49 5.22 55.0%
During 2006, no major catastrophe impacted the insurance and reinsurance markets. Therefore, the trend of high frequency, severe catastrophes, which had been prevalent since 2004, did not occur during the Year. Due to absence of major catastrophes, as well as the normal development of prior years' claims settlements against loss reserve provisions, CIRe produced reasonable underwriting profit during the Year, registering a combined ratio of 95.0% (2005: 99.2%).
Investment Performance The total investment income and the investment yield of CIRe on a pre-tax basis recognised in the consolidated income statement are summarised as follows: For the year ended 31 December, HK$ million 2006 2005 Change
Net investment income 160.61 131.25 22.4% Net realised investment gains 133.57 47.76 179.7% Net unrealised investment gains 9.25 12.67 (27.0%)
Total investment income 303.43 191.68 58.3%
Total investment yield 9.1% 5.9% 3.2pts

17
The strong investment income for the Year was a significant contributor to the performance of the reinsurance business. CIRe’s net investment income increased significantly by 58.3% due to the strong performance of global equity markets, particularly in Hong Kong, improved net investment yields and a larger investment asset base, which resulted from premium growth. The above investment income and investment yield do not include a net exchange gain of HK$66.97 million (2005: loss of HK$65.93 million). LIFE INSURANCE BUSINESS The Group’s life insurance segment is operated by TPL, which is a PRC-incorporated company and is 50.05%-owned by the Group. TPL is principally engaged in the underwriting of life insurance policies in Mainland China. The key financial data of the life insurance business is summarised below: For the year ended 31 December, HK$ million 2006 2005 Change
Gross premiums written (including investment contract premiums) under PRC GAAP 10,930.01 7,449.28 46.7%
Less: Investment contract premiums (106.81) (98.19) 8.8%
Gross premiums written under HK GAAP 10,823.20 7,351.09 47.2%
Net premiums written and policy fees 10,773.53 7,306.10 47.5% Net earned premiums and policy fees 10,693.48 7,206.22 48.4% Total investment income 1,970.76 557.70 253.4% Net exchange loss (42.04) (30.15) 39.4% Policyholders’ benefits (1,544.23) (672.32) 129.7% Net commission expenses (868.60) (573.60) 51.4% Change in life insurance funds, net of reinsurance (8,229.13) (5,785.23) 42.2% Administrative and other expenses (1,321.05) (1,091.11) 21.1% Finance costs (65.08) (5.29) 12.3 Times Profit/(loss) before taxation 612.12 (396.26) nm Profit/(loss) after taxation 313.29 (320.88) nm Profit/(loss) attributable to the equity holders 156.60 (159.29) nm
18
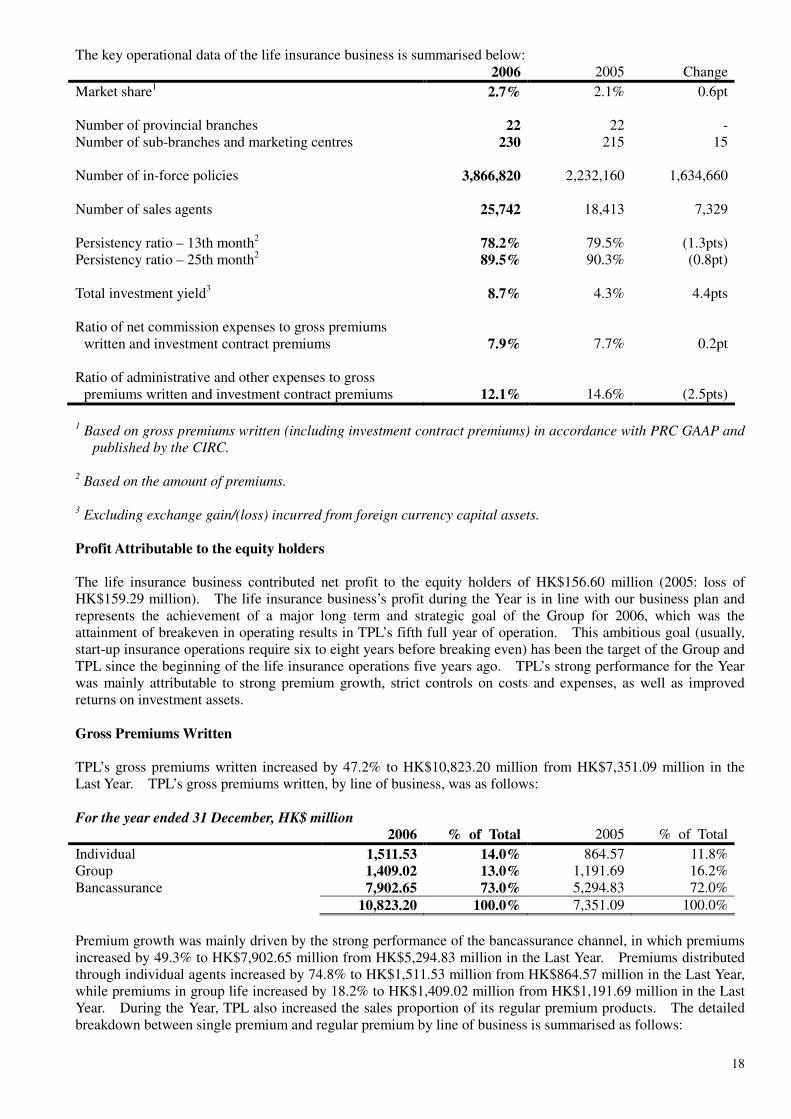
The key operational data of the life insurance business is summarised below: 2006 2005 Change
Market share1 2.7% 2.1% 0.6pt Number of provincial branches 22 22 - Number of sub-branches and marketing centres 230 215 15 Number of in-force policies 3,866,820 2,232,160 1,634,660 Number of sales agents 25,742 18,413 7,329 Persistency ratio – 13th month2 78.2% 79.5% (1.3pts) Persistency ratio – 25th month2 89.5% 90.3% (0.8pt) Total investment yield3 8.7% 4.3% 4.4pts Ratio of net commission expenses to gross premiums
written and investment contract premiums 7.9% 7.7% 0.2pt Ratio of administrative and other expenses to gross
premiums written and investment contract premiums 12.1% 14.6% (2.5pts)
1 Based on gross premiums written (including investment contract premiums) in accordance with PRC GAAP and
published by the CIRC. 2 Based on the amount of premiums. 3 Excluding exchange gain/(loss) incurred from foreign currency capital assets.
Profit Attributable to the equity holders
The life insurance business contributed net profit to the equity holders of HK$156.60 million (2005: loss of HK$159.29 million). The life insurance business’s profit during the Year is in line with our business plan and represents the achievement of a major long term and strategic goal of the Group for 2006, which was the attainment of breakeven in operating results in TPL’s fifth full year of operation. This ambitious goal (usually, start-up insurance operations require six to eight years before breaking even) has been the target of the Group and TPL since the beginning of the life insurance operations five years ago. TPL’s strong performance for the Year was mainly attributable to strong premium growth, strict controls on costs and expenses, as well as improved returns on investment assets.
Gross Premiums Written TPL’s gross premiums written increased by 47.2% to HK$10,823.20 million from HK$7,351.09 million in the Last Year. TPL’s gross premiums written, by line of business, was as follows: For the year ended 31 December, HK$ million 2006 % of Total 2005 % of Total
Individual 1,511.53 14.0% 864.57 11.8% Group 1,409.02 13.0% 1,191.69 16.2% Bancassurance 7,902.65 73.0% 5,294.83 72.0%
10,823.20 100.0% 7,351.09 100.0%
Premium growth was mainly driven by the strong performance of the bancassurance channel, in which premiums increased by 49.3% to HK$7,902.65 million from HK$5,294.83 million in the Last Year. Premiums distributed through individual agents increased by 74.8% to HK$1,511.53 million from HK$864.57 million in the Last Year, while premiums in group life increased by 18.2% to HK$1,409.02 million from HK$1,191.69 million in the Last Year. During the Year, TPL also increased the sales proportion of its regular premium products. The detailed breakdown between single premium and regular premium by line of business is summarised as follows:

19
Individual 2006 % of Total 2005 % of Total
Single Premium 58.15 3.8% 58.98 6.8% Regular Premium – First Year 787.79 52.1% 499.25 57.8% Regular Premium – Renewal Year 665.59 44.1% 306.34 35.4%
1,511.53 100.0% 864.57 100.0%
Group
2006 % of Total 2005 % of Total
Employee Benefit (“EB”) 572.13 40.6% 586.06 49.2% Annuity 836.89 59.4% 605.63 50.8%
1,409.02 100.0% 1,191.69 100.0%
Bancassurance 2006 % of Total 2005 % of Total
Single Premium 7,048.27 89.2% 4,868.50 91.9% Regular Premium – First Year 472.56 6.0% 341.80 6.5% Regular Premium – Renewal Year 381.82 4.8% 84.53 1.6%
7,902.65 100.0% 5,294.83 100.0%
TPL’s long-term strategy is to gradually increase the proportion of regular premium products in its overall sales. Regular premium products have relatively higher actuarial profit margins. In 2006, regular premium products accounted for 96.2% (Last Year: 93.2%) of the total premium produced by individual agents. Regular premium products in the bancassurance channel also recorded a significant increase of 100.4% to HK$854.38 million from HK$426.33 million in the Last Year. The higher proportion of regular premium products significantly enhances the quality and value of TPL’s premium income from an actuarial, profit margin perspective. Financial Strength and Solvency Margin The solvency margin ratios of TPL under the CIRC regulations were as follows: At 31 December, RMB million 2006 2005
Actual Solvency Margin 1,834 2,051.28 Minimum Statutory Solvency Margin 1,240 805.58 Solvency Margin Ratio 148% 255%
Investment Performance
The total investment income and the investment yield of TPL on a pre-tax basis recognised in the income statement are summarised as follows: For the year ended 31 December, HK$ million 2006 2005 Change
Net investment income 987.90 556.23 77.6% Net realised investment gains/(losses) 371.17 (4.91) nm Net unrealised investment gains 611.69 6.38 95.9 Times Total investment income 1,970.76 557.70 253.4%
Total investment yield 8.7% 4.3% 4.4pts

20
TPL’s strong increase in investment income in 2006 was primarily due to the strong performance of the equities market in the PRC, as well as the enlarged investment asset base from the rapid growth in premiums written. The above investment income and investment yield do not include a net exchange loss of HK$42.04 million (2005: HK$30.15 million).
PROPERTY AND CASUALTY INSURANCE BUSINESS
The Group’s property and casualty insurance business is operated by TPI, which is a PRC-incorporated company and is 40.025%-owned by the Group. It is principally engaged in the underwriting of motor, marine and non-marine insurance policies in Mainland China. As discussed in the “Consolidated Financial Result” section of the Management Review and Analysis, TPI is not consolidated into the Group on a line-by-line basis. Therefore, except for the profit/(loss) attributable to the equity holders, the following key financial data and ratios of TPI should not be applied to the consolidated financial statements. For the year ended 31 December, HK$ million 2006 2005 Change
Gross premiums written 2,000.42 1,323.13 51.2% Net premiums written 1,588.95 1,094.49 45.2% Net earned premiums 1,383.85 888.34 55.8% Total investment income 102.94 29.63 247.4% Profit/(loss) after taxation 8.43 (132.40) nm Profit/(loss) attributable to the equity holders 3.37 (52.99) nm
Technical reserves ratio 93.4% 112.3% (18.9pts) Retained ratio 79.4% 82.7% (3.3pts) Earned premiums ratio 69.2% 67.1% 2.1pts Loss ratio 56.6% 68.4% (11.8pts) Expense ratio 51.2% 54.6% (3.4pts) Combined ratio 107.8% 123.0% (15.2pts)
Profit Attributable to the equity holders TPI contributed net profit to the equity holders of HK$3.37 million (2005: loss of 52.99 million). As such, TPI has achieved its long-standing, strategic objective of attaining breakeven in operating result for the full year of 2006, which is TPI’s fifth full year of operations.
Gross Premiums Written TPI’s gross premiums written increased by 51.2% to HK$2,000.42 million from HK$1,323.13 million in the Last Year. The detailed breakdown of TPI’s gross premiums written was as follows: For the year ended 31 December, HK$ million Business Line 2006 % of Total 2005 % of Total
Motor 1,457.08 72.8% 894.30 67.6% Marine 136.52 6.8% 125.88 9.5% Non-marine 406.82 20.4% 302.95 22.9%
2,000.42 100.0% 1,323.13 100.0%

21
Combined Ratio The combined ratio is one of the key performance indicators of the property and casualty insurance business. TPI’s cautious expansion plan, together with strict cost controls and risk management, have significantly reduced its expense ratio to 51.2% from 54.6% in the Last Year. In addition to an improvement of the loss ratio to 56.6% from 68.4%, the combined ratio of TPI has effectively been reduced to 107.8% from 123.0% in the Last Year. The trend of TPI’s loss ratio, expense ratio and combined ratio is as follows: For the year ended 31 December 2006 2005 2004
Loss ratio 56.6% 68.4% 56.4% Expense ratio 51.2% 54.6% 67.9%
Combined ratio 107.8% 123.0% 124.3%
TPI’s improved combined ratio and strong investment income allowed TPI to achieve operating profitability in 2006.
CORPORATE AND OTHER BUSINESSES The corporate and other businesses are mainly comprised of the corporate company, asset management business and insurance intermediary business. The corporate company is mainly responsible for overall group strategic planning, overall group capital management and deployment in support of the operating businesses, investor relations, credit ratings and research analysts relations, and compliance with the listing and other laws and regulations of Hong Kong. Asset management business at Hong Kong operated by CIGAML
The Group’s asset management business at Hong Kong is operated by CIGAML which is a Hong Kong-incorporated company and is wholly-owned by the Group. CIGAML is licensed with Hong Kong’s Securities & Futures Commission, and is mainly engaged in the provision of investment consultancy services to the Group in managing its non-RMB investment portfolio. CIGAML currently is a cost centre of the Group because the asset management fee income received from the Group companies are eliminated at the consolidated level, while the corresponding expenses, such as salary and incentive compensation paid to fund managers, are absorbed in full at the consolidated level. Investors are advised to pay particular attention to this factor when evaluating the financial performance of CIGAML. In 2006, CIGAML made substantial contributions to the Group, as the investment returns on its non-RMB funds managed on behalf of CIRe and other companies of the Group were very strong. Please note that CIGAML’s strong performance in the Year is not fully reflected by the following table due to inter-companies elimination as required by the Group’s accounting policies. The key financial data of CIGAML is summarised below: For the year ended 31 December, HK$ million 2006 2005 Change
Asset management fee income 8.12 4.38 85.4% Total investment income 21.24 19.08 11.3% Profit attributable to the equity holders 2.37 6.72 (64.7%)
Insurance intermediary business The Group’s insurance intermediary business is substantially operated by SINO-RE, which is a Hong Kong-incorporated company and is wholly-owned by the Group. SINO-RE is mainly engaged in the rendering of brokering services for reinsurance and insurance companies. SINO-RE’s key markets are Hong Kong, Macau and Mainland China.

22
The key financial data of SINO-RE is summarised below: For the year ended 31 December, HK$ million 2006 2005 Change
Insurance intermediary income 14.34 10.97 30.7% Profit attributable to the equity holders 13.17 5.65 133.1%
SINO-RE’s profit attributable to the equity holders increased by 133.1% to HK$13.17 million from HK$5.65 million in the Last Year. SINO-RE’s insurance intermediary income has produced strong and stable growth in 2006 as a result of its increasing number of clients and the strong business growth of its core clients. OUTLOOK Reinsurance business – CIRe
Entering into the January 2007 renewal season, the global reinsurance market has been stable. With the continued strong economic growth of many Asian and other major economies, in addition to strong investment markets and below-average catastrophe losses, most reinsurers around the world have registered very positive results in 2006. Therefore, the renewal terms and conditions for most reinsurance markets and most classes of reinsurance are relatively stable. Nevertheless, the softening of original insurance rates in many Asian markets continues unabated, due to intense competition by local as well as multi-national insurance players. Notwithstanding this softening trend in the markets, CIRe intends to strictly adhere to its conservative, yet progressive, underwriting strategy with the overall aim of achieving underwriting profitability. CIRe is continuing to expand into the Mainland China insurance markets through two representative offices in Beijing and Shanghai. CIRe believes that its growth prospects in Mainland China are very attractive, especially since CIRe possesses certain competitive advantages in this market relative to its peers. CIRe remains one of the few Asian based reinsurers which has secured strong credit ratings by international credit rating agencies (A- by S&P, Fitch, and A.M. Best).
CIRe expects to produce solid results in 2007 in the absence of any unexpected market events.
Life insurance business – TPL After accomplishing its ambitious strategic objective of breaking even in its fifth full year of operations and delivering a very positive result in 2006, TPL is set to begin its next phase of development for the coming years. TPL plans to further develop its individual life business by recruiting more agents. TPL will also continue to enhance its bancassurance operations by exploring closer working models with its bancassurance partners. In the year ahead, TPL will add seven new branches in major provincial cities as well as further expand its sub-branches network to include areas with strong insurance potential. TPL’s senior management will continue to emphasize the critical importance of increasing the actuarial profit value of its products sold. More efforts will be made to increase the proportion of regular premium products produced through the individual agency and bancassurance channels. TPL also aims to further improve its client service platform, cost controls, efficiency, underwriting and asset liability matching. Because of the need for further investment in expanding the branch network and individual agency force, as well as the other important operational measures described above, and because it may be very likely that the above-average investment returns produced in 2006 will not be replicated in 2007, the profitability of TPL in 2007 may not reach the levels achieved in 2006. However, the planned expansion and further bolstering of TPL’s services platform will produce a very strong and solid foundation for the future. It is anticipated that these initiatives will substantially enhance shareholders’ value and profitability over the long term.

23
Property and casualty insurance business – TPI After a successful year in 2006 in which TPI achieved its strategic objective of breaking even in operating profit in its fifth full year of operations, the senior management of TPI will continue to focus on profitably building up TPI’s presence in Mainland China’s property and casualty insurance industry. TPI will continue to expand its premium income in 2007 in order to obtain the necessary scale to optimize its expense ratio. At the same time, TPI will focus on enhancing its underwriting controls and standards in order to maintain a satisfactory loss ratio. TPI plans to establish three to four new provincial branches in the year to come. With the market conditions and competition in the PRC property and casualty insurance industry gradually improving, TPI is expected to move into a new phase of development in which it consistently produces reasonable returns to the Group. Investments
In 2006, global financial and investment markets produced significantly-above-average returns, particularly in the equity markets of the PRC and Hong Kong. While it may be unlikely that the significantly-above-average investment returns in 2006 will be sustainable annually into the future, CIIH’s focus on developing strong investment operations will allow the Group and its various operations to produce sustainable, attractive and stable investment returns on a yearly basis. This will continue to be a priority of CIIH in the years to come.
PURCHASE, SALE OR REDEMPTION OF THE COMPANY’S LISTED SECURITIES During the Year neither the Company nor any of its subsidiaries have purchased, sold or redeemed any of the Company’s listed securities.
CORPORATE GOVERNANCE The annual financial report for the year has been reviewed by the audit committee of the board of directors of the Company. During the Year, the Company has adopted the Code Provisions set out in the Code as the corporate governance practices of the Company. During the Year, the Company has applied the principles and complied with the Code Provisions, with the following exceptions: (1) The Non-Executive Directors were not appointed for a specific term, but are subject to retirement by
rotation and re-election at the Company’s Annual General Meeting in accordance with the Company’s Articles of Association; and
(2) The Chairman of the Independent Board Committee has not attended the Extraordinary General Meetings
of the Company held on 23 February 2006 and 18 August 2006. The Company will endeavor to ensure that the Chairman of the Independent Board Committee (if any) would also be available to answer questions at any future general meeting to approve a connected transaction or any other transaction that is subject to independent shareholders’ approval.
REVIEW OF FINANCIAL STATEMENTS The figures in respect of the preliminary announcement of the Group’s results for the year ended 31 December 2006 have been compared by the Company’s auditors, KPMG, Certified Public Accountants, to the amounts set out in the Group’s draft consolidated financial statements for the year and the amounts were found to be in agreement. This work performed by KPMG in this respect was limited and did not constitute an audit, review or other assurance engagement and consequently no assurance has been expressed by the auditors on this announcement.

24
DEFINITIONS In the Preliminary Final Results Announcement, the following expressions shall have the following meanings unless the context requires otherwise: “CIGAML” China Insurance Group Assets Management Limited “CIRC” China Insurance Regulatory Commission “CIRe” China International Reinsurance Company Limited “Code” Code on Corporate Governance Practices as set out in Appendix 14 of the Listing
Rules “Directors” The directors of the Company, including the independent non-executive directors “HK GAAP” Accounting principles generally accepted in Hong Kong “HKICPA” Hong Kong Institute of Certified Public Accountants “Independent shareholders” Shareholder(s) other than China Insurance (Holdings) Company Limited,
Industrial and Commercial Bank of China (Asia) Limited and their respective associates
“Last Year” The year ended 31 December 2005 “Listing Rules” The Rules Governing the Listing of Securities on the Stock Exchange of Hong
Kong Limited “nm” Not mentioned “PRC GAAP” Accounting principles generally accepted in the PRC “Share(s)” Share(s) of HK$0.05 each in the capital of the Company “SINO-RE” SINO-RE Reinsurance Brokers Limited “the Company” or “CIIH” China Insurance International Holdings Company Limited “the Group” CIIH and its subsidiaries “the PRC” The People’s Republic of China “the Year” The year ended 31 December 2006 “TPI” The Tai Ping Insurance Company, Limited “TPL” Tai Ping Life Insurance Company, Limited “RMB” Renminbi “HKD” Hong Kong dollars
By Order of the Board FENG Xiaozeng
Chairman Hong Kong, 26 March 2007 As at the date of this announcement, the Board comprises of 11 directors, of which Mr. FENG Xiaozeng, Mr. LIN Fan, Mr. SONG Shuguang, Mr. XIE Yiqun, Mr. NG Yu Lam Kenneth, Mr. SHEN Koping Michael and Mr. LAU Siu Mun Sammy, are executive directors of the Company, Mr. ZHENG Changyong is a non-executive director of the Company and Dr. WU Jiesi, Mr. CHE Shujian and Mr. LAU Wai Kit are independent non-executive directors of the Company.