Embed Size (px)
Citation preview

Expropriation of minority shareholders and payout policy
Amedeo De Cesari *
Aston Business School, Birmingham, U.K.
Abstract
Drawing on the agency cost explanation of payout policy, I hypothesize that controlled firms with weak corporate governance set-ups, in which controlling shareholders have strong incentives to expropriate minority shareholders, pay out more and/or tend to prefer dividends over repurchases when disgorging cash. I study a sample of Italian controlled firms and find strong evidence in support of my hypotheses. A firm’s share of dividends in total payout (dividends plus repurchases) is negatively related to the size of the cash flow stake of the firm’s controlling shareholder and positively associated with the wedge between the controlling shareholder’s control rights and cash flow rights. Furthermore, family-controlled firms, which are less severely affected by agency problems than other Italian controlled firms, choose lower payouts and are characterized by smaller fractions of dividends in total payout. Keywords: Dividend, repurchase, controlling shareholder, minority shareholder, family firm JEL Classification: G32, G35
* Corresponding author: Amedeo De Cesari, Assistant Professor in Finance, Finance, Accounting, and Law Group, Aston Business School, Aston University, Aston Triangle, Birmingham B4 7ET, the United Kingdom; Tel.: +44 (0) 121 2043028; email: [email protected].

- 1 -
The agency conflicts between corporate insiders and corporate outsiders are the main focus of
corporate governance research. In firms with highly dispersed ownership structures (widely held firms),
these conflicts are between the firms’ managers and the firms’ shareholders (Berle and Means, 1932;
Jensen and Meckling, 1976). In firms controlled by one or more shareholders with large stakes (controlled
firms), the interests of the firms’ controlling shareholders often collide with those of the firms’ minority
shareholders. In both widely held and controlled firms, agency conflicts arise because corporate insiders
have an incentive to pursue private benefits at the expense of corporate outsiders.
In this paper, I investigate whether firms determine the level of their payouts and the mix between
dividend payments and stock repurchases in order to mitigate agency conflicts and boost firm value. I
focus on a sample of Italian non-financial controlled firms listed on the Milan stock market in the period
1999-2004. Italy is a country characterized by firms with concentrated ownership structures, significant
private benefits accruing to controlling shareholders, and the usage of control-enhancing devices to
magnify control rights relative to cash flow rights; also, family-controlled firms are prevalent in Italy (see,
e.g., Bianchi, Bianco, and Enriques, 2001; Faccio and Lang, 2002; Nenova, 2003). In the Italian corporate
governance system, the primary agency conflict is between large controlling shareholders and minority
shareholders.
It is commonly argued that firms pay out cash to constrain corporate insiders’ ability to expropriate
corporate outsiders, mitigate agency problems, and increase firm value. When a payout takes place, cash
reserves fall, and corporate insiders can use a lower amount of freely available cash to pursue private
interests (Jensen, 1986). Also, payouts may force firms to raise new external finance and improve their
governance to obtain the external funding at better terms (Easterbrook, 1984). John and Knyazeva (2006)
suggest that, besides the level of payout, the composition of total payout also has an influence on agency
costs. They argue that dividend payouts, unlike stock repurchases, carry implicit commitments to similar
or larger payouts in future periods. This argument is supported by the existing evidence showing that firms
tend to distribute stable and increasing dividends (Lintner, 1956; Brav, Graham, Harvey, and Michaely,
2005) and that markets react negatively to dividend cuts (see, e.g., Aharony and Swary, 1980). Further,

- 2 -
firms believe that a stock repurchase is a more flexible payout method than a dividend payment (see, e.g.,
Brav, Graham, Harvey, and Michaely, 2005). John and Knyazeva (2006) conclude that dividend
payments, owing to the conveyed pre-commitment signal to future cash distributions, are more powerful
mechanisms than repurchases to attenuate agency conflicts. To summarize, the agency cost explanation of
payout policy implies that weakly governed firms choose larger payouts and/or tend to prefer dividends
over repurchases.
I hypothesize that weakly governed Italian controlled firms have three main features. First, their
controlling shareholders hold a small fraction of cash flow rights. A controlling shareholder with a small
cash flow stake receives a small part of the cash paid out by its firm to shareholders. She, therefore, has a
strong incentive to divert firm resources. Second, the difference between the control rights and the cash
flow rights held by their controlling shareholders is large. When the wedge between a controlling
shareholder’s control and cash flow stakes is large, the controlling shareholder has the power to
expropriate minority shareholders owing to her significant control stake. At the same time, her small cash
flow stake does not curb her tendency to indulge in self-serving behaviours. Finally, their controlling
shareholders are not families. In an Italian non-financial firm that is not controlled by a family, there is an
additional layer of agency conflicts. In particular, the firm’s controlling shareholder, which is normally
either the state or a widely held firm, is a complex organization with its own agency problems. For
example, in a state-controlled firm there is a discrepancy between the objectives of the politicians, who
control the firm through appointed managers, and the citizens who, as tax payers, own the firm.
Using a sample of observations for Italian non-financial controlled firms listed on the Milan stock
exchange (sample period 1999-2004), I test whether firms with weak corporate governance pay out more
and/or tend to prefer dividends over repurchases when paying out cash. On the whole, I find evidence in
favour of the notion that a firm’s payout policy is designed to reduce agency conflicts and costs. A crucial
conclusion arising from my findings is that firms seem to place far more weight on the composition of
total payout (the dividend-repurchase mix) rather than on the level of total payout. More specifically, I
show that both the odds that a firm uses dividends rather than repurchases and the fraction of the firm’s

- 3 -
dividend payout in total payout are negatively associated with the cash flow stake of the firm’s controlling
shareholder and positively related to the wedge between the control rights and the cash flow rights of the
controlling shareholder. I also find that family-controlled firms tend to pay out less than non-family-
controlled firms. In addition, family-controlled firms are more likely to disburse cash by repurchasing
stock rather than paying dividends. They are also characterized by a larger fraction of total payout that is
represented by stock repurchases.
In most cases, the main findings of this study are robust to the presence of outliers, variations in the
specifications of the regressions used, changes in sample compositions, and variations in the definitions of
some crucial variables.
Some of the findings reported in this study are completely novel. To the best of my knowledge, there
are no previously published studies documenting that firms with controlling shareholders with small cash
flow stakes and large differences between their control and cash flow rights are characterized by larger
fractions of dividend payout in total payout. Moreover, this study offers some insights on the payout
policy of family-controlled firms, which is a scarcely developed strand of finance research. In terms of
previous evidence, Gugler (2003) shows that Austrian family-controlled firms have lower dividend
payouts than Austrian counterparts that are controlled by the state. Hu, Wang, and Zhang (2007) find that
U.S. family-controlled firms are less likely to have a positive dividend payout, pay out lower dividends,
and tend to prefer repurchases over dividends. Overall, the main findings of this paper carry implications
that stretch well beyond the Italian context given that the typical features of Italian firms, which are
concentrated ownership and family control, are commonly found in many firms, not only outside the
U.S.A. (see, e.g., La Porta, Lopez-de-Silanes, and Shleifer, 1999; Villalong and Amit, 2006; Holderness,
2009).
The paper is structured as follows. In Section I, I revise the previous related literature and formulate
several testable hypotheses. Section II contains a description of the data collection process and of the
variables used in the study. The empirical findings are presented and described in Section III. In Section

- 4 -
IV, I summarize the results of a series of robustness tests. Finally, Section V contains some concluding
remarks.
I. Literature review and testable hypotheses
A. Agency problems and payout policy
In modern corporations, agency problems arise from the conflicts between corporate insiders and
corporate outsiders. In widely held firms, characterized by a highly dispersed ownership structure, the
firms’ managers are the only corporate insiders, and the firms’ shareholders can be defined as the
corporate outsiders. In controlled firms, i.e. firms that are not widely held, the controlling shareholders are
the firms’ corporate insiders together with the managers under their control. In contrast, the firms’
minority shareholders can be defined as the corporate outsiders.
It is often argued that distributions of cash to shareholders can be used to mitigate agency costs. Cash
distributions are beneficial because they reduce the stock of cash that corporate insiders can divert to
pursue private interests (Jensen, 1986). Moreover, payouts lead to a decrease in the retained earnings
available for investments. This decrease may force firms to resort to external capital and improve their
governance in order to raise it at better terms (Easterbrook, 1984). An implication of these arguments is
that firms in which corporate outsiders are more likely to be expropriated pay out more cash. In this
framework, payout policy is seen as a governance control mechanism that limits corporate insiders’ self-
serving actions.
Why should corporate insiders pass up opportunities to expropriate corporate outsiders by paying out
cash? A possible answer is provided by La Porta, Lopez-de-Silanes, Shleifer, and Vishny (2000). They
suggest that firms affected by serious governance problems need to establish a reputation of fair treatment
of corporate outsiders in order to raise external capital at favourable terms. These firms can use large
distributions of cash to shareholders to boost their reputation. Similarly, Faccio, Lang, and Young (2001)
contend that investors are likely to heavily discount the market values of firms with low payouts and weak

- 5 -
corporate governance set-ups. Investors are also less likely to supply capital to these firms. Hence, firms
with weak governance may use dividend payments and share repurchases to boost their market valuations
and facilitate their access to the capital market.
There is no lack of empirical evidence confirming that a firm’s payout policy is designed to attenuate
agency problems.1 The existing literature supports the notion that firms with larger cash flows and fewer
growth opportunities have larger dividend payouts (see, e.g., Fama and French, 2001; Fenn and Liang,
2001) and repurchase payouts (see, e.g., Dittmar, 2000; Fenn and Liang, 2001). Since cash-rich firms with
few investment opportunities are likely targets of corporate outsiders’ expropriation, this evidence is
consistent with an agency cost-based explanation of payout policy.2 Both Rozeff (1982) and Jensen,
Solberg, and Zorn (1992) report a negative relation between dividend payout and insider ownership. This
finding shows that firms in which the insiders’ incentives are better aligned with those of the outsiders are
less in need of high payouts to alleviate agency problems. Noronha, Shome, and Morgan (1996) present
similar results for a sample of firms with low growth opportunities and weak non-dividend corporate
governance control mechanisms.3 Dewenter and Warther (1996) compare the dividend policy of U.S.
firms with that of Japanese firms, arguing that dividend policy is a less relevant control mechanism in
Japan. In support of their argument, they find that in Japan both firms’ managers and investors are less
averse to dividend cuts and omissions. Hu and Kumar (2004) analyze the impact of managerial
entrenchment on firms’ dividend and total payout, i.e. the sum of dividends and repurchases. On the
whole, they present evidence that payouts are larger in firms managed by more entrenched executives.4
1 A few studies reject the notion that firms pay out cash to mitigate agency conflicts. For instance, La Porta, Lopez-de-Silanes, Shleifer, and Vishny (2000) find that firms from countries with better legal protection of minority shareholders pay out larger dividends. Fenn and Liang (2001) show that, in most cases, the fraction of a firm’s stock owned by its executives does not affect the firm’s propensity to pay dividends and repurchase shares. Grinstein and Michaely (2005) reject the hypothesis that the monitoring activity of institutional investors has a significant influence on firms’ dividend, repurchase, and total payout policy. 2 The existence of asymmetric information costs (Myers and Majluf, 1984; Myers, 1984) and other financing costs (e.g., flotation costs) can also explain why firms with a lot of investment opportunities and little cash are reluctant to choose high payouts. 3 Noronha, Shome, and Morgan (1996) consider two non-dividend control mechanisms: The presence of large shareholders and the incentive component of managerial compensation. 4 As proxies of managerial entrenchment, Hu and Kumar (2004) consider the following factors in their baseline regressions: CEO compensation package, CEO tenure, CEO ownership, presence of large outside shareholders, and

- 6 -
Finally, John and Knyazeva (2006) investigate whether a firm’s dividend payout, repurchase payout, and
total payout are functions of two indices of corporate governance: One measuring the strength of the
firm’s internal control mechanisms and one reflecting the effectiveness of the firm’s external control
mechanisms. They report that firms with weak governance mechanisms tend to pay out more.
John and Knyazeva (2006) postulate that, besides the level of cash distributions, the type of cash
distributions has a bearing on agency costs. They expect the fraction of total payout represented by
dividend payments to be a decreasing function of the strength of corporate governance. John and
Knyazeva (2006) argue that dividend payments are more effective than repurchases to address agency
conflicts because current dividends are associated with an implicit pre-commitment to future dividends.
This argument derives from the fact that dividend cuts are greeted negatively by the market (see, e.g.,
Aharony and Swary, 1980). Also, firms are reluctant to increase dividends to levels that cannot be
sustained in the future (Lintner, 1956; Brav, Graham, Harvey, and Michaely, 2005). A firm that provides
dividends today is, therefore, implicitly pre-committing itself to paying similar or larger dividends
tomorrow. In contrast, repurchases are a more flexible way to distribute cash than dividends (Jagannathan,
Stephens, and Weisbach, 2000; Guay and Harford, 2000; Brav, Graham, Harvey, and Michaely, 2005).
The completion rates of announced repurchase programs are in many cases low (Stephens and Weisbach,
1998), and there is no evidence that failure to complete repurchase programs triggers negative reactions
from the market. On the whole, the market sees repurchases as far weaker pre-commitment signals of
future cash distributions than dividend payments. John and Knyazeva (2006) find empirical support for
their argument and show that weakly governed firms are more likely to prefer dividends over repurchases
when paying out cash.
board independence. In contrast with agency cost-based explanations of payout policy, they find that a more independent board is associated with larger payouts.

- 7 -
B. Testable hypotheses
The agency-based explanations of payout policy outlined in the previous section have two main
implications. First, firms that are highly affected by agency problems choose larger payouts than better
governed counterparts. Second, firms characterised by weak governance tend to mitigate agency problems
by increasing the fraction of total payout that is distributed through dividend payments. I take advantage
of these implications to formulate several testable hypotheses.
1. Cash flow rights and control rights of controlling shareholders
The cash flow rights or ownership rights of a firm’s controlling shareholder are the fraction of the
cash distributed by the firm to shareholders that accrues to the controlling shareholder. For instance, if a
shareholder owns 30% of the cash flow rights of a firm that pays out 100 through dividend payments, the
shareholder receives 30 from the firm. If the firm distributes 100 through repurchases, the shareholder
may get less or more than 30 because shareholders have the option not to tender their shares in repurchase
programs. I expect an inverse relation between the size of a controlling shareholder’s cash flow rights
(ownership stake) and her propensity to expropriate minority shareholders. Controlling shareholders with
large (small) ownership stakes have weak (strong) incentives to avoid payouts and, instead, use their
firms’ cash to pursue private benefits. This is the case because they receive a large (small) part of the cash
that is distributed to shareholders. Hence, agency costs are decreasing in the size of the ownership stake of
the controlling shareholder.5
Based on this relation, I formulate the following hypotheses:
H1: The level of a firm’s payout is a decreasing function of the size of the cash flow rights of its
controlling shareholder.
5 Several empirical studies find a negative relation between a firm’s value and performance and the cash flow rights of its controlling shareholder (see, e.g., Claessens, Djankov, Fan, and Lang, 2002; La Porta, Lopez-de-Silanes, Shleifer, and Vishny, 2002; Mitton, 2002; Joh, 2003; Laeven and Levine, 2008; Gompers, Ishii, and Metrick, 2008). These findings support the notion that controlling shareholders pursue private interests less when they own a larger ownership stake.

- 8 -
H2: The share of a firm’s dividend payout in total payout is a decreasing function of the size of the
cash flow rights of the firm’s controlling shareholder.
Gugler and Yurtoglu (2003) is the only published research that tests H1 using a methodology that, like
in this paper, considers control-enhancing devices such as pyramidal group structures to precisely
compute cash flow rights. They study the dividend policy of a sample of German firms and present
evidence that is at odds with my expectations.6 There is no previous research that provides tests of H2.
Another variable that is often suggested as measure of potential minority shareholders’ expropriation
is the wedge between a controlling shareholder’s control rights and cash flow rights (see, e.g., Faccio,
Lang, and Young, 2001; Claessens, Djankov, Fan, and Lang, 2002). A shareholder’s control rights in a
firm are defined as the fraction of the firm’s voting shares that the shareholder owns. Controlling
shareholders with more control rights benefit from a stronger degree of control. Non-voting shares and
pyramids are control-enhancing devices that are used in Italy by controlling shareholders to gain control
rights in excess of cash flow rights (see, e.g., Bianchi, Bianco, and Enriques, 2001; Faccio and Lang,
2002). Non-voting shares, which carry cash flow rights, may be sold to minority shareholders in order to
allow controlling shareholders’ to boost their degree of control without requiring further investments. As
for pyramidal structures, a simple example can be used to explain why they are control-enhancing
mechanisms. Assume that both Firm A and Firm B are controlled by an investor, Investor A and Investor
B respectively, who holds 40% of her firm’s control rights. Investor A has a direct stake in Firm A and
there is no discrepancy between her control rights and her cash flow rights. In contrast, Investor B controls
Firm B through a pyramidal control chain that is structured as follows: Investor B owns 50% of Firm C
that, in turn, has a 40% direct stake in Firm B. Investor B holds 20% of the cash flow rights of Firm B
(50% x 40% = 20%), and has control rights (40%) exceeding ownership rights. Is minority shareholders
6 Gugler and Yurtoglu (2003) report a positive relation between the size of a controlling shareholder’s cash flow rights and the level of her firm’s dividend payout.

- 9 -
expropriation more likely in Firm A or in Firm B? Expropriation is more likely in Firm B because in this
firm there is a deeper separation between control and ownership and the size of the controlling
shareholder’s cash flow stake is smaller. To generalize, agency costs are a positive function of the wedge
between controlling shareholders’ control rights and cash flow rights.7
In light of this conclusion, I propose the following hypotheses:
H3: The level of a firm’s payout is an increasing function of the wedge between the control rights and
the cash flow rights of its controlling shareholder.
H4: The share of a firm’s dividend payout in total payout is an increasing function of the wedge
between the control rights and the cash flow rights of the firm’s controlling shareholder.
I am not aware of previous studies that test H4. As regards H3, supporting evidence is provided by
Faccio, Lang, and Young (2001) for the dividend policy of European and Asian firms that are group-
affiliated and tightly-controlled.8 In contrast, Gugler and Yurtoglu (2003) show that in Germany larger
deviations of control rights from cash flow rights are associated with lower dividend payments.
2. Family firms
Family-controlled firms make up for 80% of the observations used in my baseline regressions. The
other two major groups of controlled firms are state-controlled firms (12% of the sample) and firms
7 The positive association between agency costs and the wedge between control and cash flow rights is confirmed by several studies documenting that firms with larger differences between control and cash flow rights have worse performances and lower market valuations (see, e.g., Claessens, Djankov, Fan, and Lang, 2002; Mitton, 2002; Joh, 2003; Laeven and Levine, 2008; Gompers, Ishii, and Metrick, 2008). 8 Faccio, Lang, and Young (2001) run regressions of several dividend payout measures on the ratio between cash flow and control rights (O/C). By construction, there is an inverse relation between O/C and the difference between control rights and cash flow rights. In regressions with Italian firms, the sign of the coefficient on O/C is in most cases positive. However, possibly owing to the small size of the Italian sample (only 110 observations), the coefficients on O/C are normally statistically insignificant.

- 10 -
controlled by corporations that are widely-held (7% of the sample). I expect firms controlled by families
to be less affected by agency problems than other controlled firms.
As for state-controlled firms, my expectation is based on an argument similar to that put forward by
Gugler (2003). Like in any controlled corporation, in a state-controlled firm minority shareholders can be
expropriated by entrenched controlling shareholders. A second additional problem is that politicians are de
facto in command of state firms, through appointed managers, even though they are not the residual
claimants of the state’s equity investments in the firms. Their citizens are the residual claimants. In
principle, politicians have a duty to manage state-controlled firms in the best interest of their citizens. As a
matter of fact, they do not have an investment in these firms and, therefore, probably lack enough
incentives to serve their citizens. The situation is worsened by the absence of adequate monitoring by a
large number of citizens with small personal interests in the firm. Hence, in state firms there is a further
layer of principal-agent conflicts that is not found in family firms.
For similar reasons, agency problems are probably deeper in firms controlled by widely held
corporations than in family-controlled firms. Conflicts between entrenched controlling shareholders and
minority shareholders can be found in both types of firms. However, it is likely that additional agency
costs arise when the controlling shareholder is a widely held company that is managed by executives and
not directly by its shareholders. This kind of agency costs is of far smaller relevance, if any, in family
firms.
Based on the arguments outlined above, I put forward the following hypotheses:
H5: Firms controlled by families pay out less than other controlled firms.
H6: The share of dividend payout in total payout is smaller in firms controlled by families than in
other controlled firms.
- 11 -
The previous evidence is limited but, on the whole, supportive of H5 and H6. Gugler (2003) finds that
Austrian family-controlled firms choose smaller dividend payouts than state-controlled firms. Hu, Wang,
and Zhang (2007) report that U.S. family-controlled firms are less likely to make dividend payments and
pay lower dividends than other U.S. firms. Moreover, they document that, in family-controlled firms,
dividend payments make up for a smaller fraction of total payout.
II. Data collection and variable construction
I use information from the website of the Italian stock exchange (www.borsaitaliana.it) and Thomson
Datastream to identify a list of 276 Italian non-financial firms listed on the Italian exchange in the sample
period January 1999 – December 2004.9 For each firm, I collect data on dividends, repurchases, and other
variables for the sample period. After excluding firm-years for widely held firms and observations with
missing data, the base dataset employed in the empirical tests comprises 176 firms and 630 firm-year
observations. In the sub-sections that follow, I describe the data sources and the variables used in the
empirical analyses.
A. Dividend and repurchase payout
For a particular firm-year, I use data from Worldscope to compute DIV, a measure of dividend payout.
DIV is equal to the total cash dividends paid by the firm in the fiscal year (item 04551) multiplied by 100
and divided by the firm’s market capitalization (item 08001) at the end of the previous fiscal year. I also
create the dummy variable DDIV that takes the value one if DIV is larger than zero; else, DDIV is set to
zero.
According to Article 2,428 of the Italian Civil Code, the directors of Italian listed firms must report
information on repurchase transactions in their annual report. More specifically, they must disclose the
number and the nominal value of own shares purchased during the fiscal year. For a particular firm-year, I
9 Like in most previous literature, I do not consider financial firms because their payout policy is likely to be a function of industry-specific factors that are not relevant when studying the payout policy of industrial firms.

- 12 -
resort to the firm’s annual report to collect the number of ordinary shares repurchased on the open
market.10 Firms are not required to disclose data on the prices at which they repurchase stock. Hence,
based on information from annual reports, it is not possible to precisely estimate the amount of cash that
firms disgorge through repurchases. To circumvent this problem, I assume that purchases of own shares
are made at average market closing prices. For a certain firm-year, the value of the distributed cash
through repurchases is calculated as the product between the number of the firm’s shares bought back in
the year and the average market price of the firm’s stock over the year.11 In order to find the repurchase
payout (REP) for the firm-year, I first of all scale the value of the distributed cash by 1000 to make it
comparable with Worldscope items that are expressed in thousands. I then divide the resulting figure by
the firm’s market capitalization (Worldscope item 08001) at the end of the previous year and, finally,
multiply it by 100. If REP is larger than zero, the dummy variable DREP is equal to one; else, DREP is
equal to zero.
I construct the total payout measure PAYOUT, which is the sum of DIV and REP, and the dummy
DPAYOUT that takes the value one when PAYOUT is positive. I also build a measure of the fraction of
total payout that is paid out through dividends. This measure (%DIV), which can be computed only for
positive values of total payout, is the ratio between DIV and PAYOUT, times 100.
In this study, the payout measures DIV, DDIV, REP, DREP, PAYOUT, DPAYOUT, and %DIV are the
dependent variables. Panel A of Table I contains some descriptive statistics for these variables. Dividend
payouts are larger and more common than repurchase payouts. The average value of DIV is 2.17, whereas
that of REP is only 0.35. The average of DDIV is 0.72. This value implies that in 72% of the firm-years in
the sample there is a positive dividend payout. In contrast, firms distribute cash through repurchases only
in 30% of the years. As for the total payout measures, the average value of PAYOUT is 2.52 and the 10 In the sample period 1999 – 2004, repurchases on the open market were, by far, the most common type of buyback in Italy. The law (Article 132 of the Legislative Decree no. 58 of 24 February 1998) also allowed listed firms to employ self-tender offers to purchase own stock. Through a keyword search on the database Factiva, I identify the very few self-tender offers that took place in the sample period (starting and finishing dates in parentheses): Telecom Italia Spa on saving shares (17/02/2000 – 17/03/2000), Ras Spa on both ordinary and saving shares (9/12/2002 – 10/01/2003), and Roland Europe Spa on ordinary shares (26/11/2004 – 20/12/2004). 11 The average price is adjusted for stock splits and similar transactions occurring over the year in order to make it compatible with the end-of-year number of repurchased shares.

- 13 -
dummy DPAYOUT is equal to one in 76% of the observations. Finally, the mean value of %DIV is 86.
This finding shows that 86% of the distributed cash is paid out using cash dividends.
B. Ownership variables
The main independent variables used in the empirical analyses reflect several features of a firm’s
ownership structure. I collect ownership data from Consob’s (“National Commission for Companies and
Stock Market”) website.12 For each Italian listed firm, the website contains semi-annual reports showing
all the ownership stakes that are equal or larger than 2%.13 In these reports, a “formal” ultimate owner is
associated with each ownership stake. A stake can be made up of several smaller stakes controlled either
directly by the owner or indirectly through other investors.
In order to compute the control rights of the ultimate owner of the stake in a firm, I first need to
identify all the links of the control chains the owner employs to control the stake. When the ultimate
owner has a direct stake in the firm, the control chain is very simple and includes only one link. Control
chains are far more complex when the owner uses pyramids and indirectly controls the stake through
intermediate firms. For instance, if Firm A is the owner of a stake in Firm C through an intermediate stake
in Firm B, I need to trace back the control stakes, within the control chain, from Firm C to Firm A. In
particular, first I need to identify the control rights of Firm B in Firm C and, then, I need to focus on the
control rights of Firm A in Firm B. Given that an ultimate owner’s control rights in a firm are a measure
of the owner’s ability to control the firm, I only take into account voting ordinary shares when
determining control stakes.14 When a control chain is made up of firms listed on the Italian stock
exchange, the control stakes within the chain can be easily computed retrieving information from the
12 www.consob.it; according to the website, Consob is the “public authority responsible for regulating the Italian securities markets”. 13 The ownership data included in the Consob’s reports are as of either the end of June or the end of December. 14 In this study, I assume that both saving and privileged shares do not carry voting rights. In the sample period, holders of privileged shares enjoyed limited voting rights in Italy. More specifically, they had the right to vote in extraordinary meetings of shareholders that decide on particularly relevant but infrequent corporate actions.

- 14 -
Consob’s website. As for unlisted firms, I attempt to retrieve the necessary data from firms’ annual
reports, the database Factiva, and the World Wide Web.
If a stake’s “formal” ultimate owner, as indicated by the Consob’s ownership reports, is an individual
investor, I assume that she is the “actual” ultimate owner of the stake. If the formal ultimate owner is an
Italian listed firm, I use the ownership information provided by Consob to identify its ultimate owners and
enlarge the existing control chains accordingly.15 I follow a similar procedure when the Consob’s reports
indicate that the stake’s ultimate owner is an Italian unlisted firm and suitable information (from firms’
annual reports, the database Factiva, and the World Wide Web) on the firm’s owners can be found. If this
information is not available, I assume that the actual ultimate owner is the Italian unlisted firm.16 Finally,
there are some infrequent cases in which according to Consob the ultimate owner of the stake is a foreign
firm. In this case, it is simply assumed that the firm is also the stake’s actual ultimate owner.
I follow the “weakest link” principle to estimate the degree of control of an owner over a stake in a
firm.17 According to this principle, if an ultimate owner has some voting rights in a firm through a
pyramidal control chain, the owner’s control rights are measured by the weakest link in the control chain,
i.e. by the smallest control stake along the chain. For example, assume that Firm A holds 30% of the
control rights of Firm B that, in turn, has a 40% control stake in Firm C. The control rights of Firm A in
Firm C amount to 30% because the weakest link in the control chain is 30%. If an ultimate owner uses
several control chains to hold a control stake in a firm, the owner’s control rights in the firm are measured
by the sum of the weakest links of all the control chains. In a particular fiscal year, a firm is considered as
controlled if there is at least one ultimate owner that, through one or several control chains, holds a
15 For example, assume that Firm B, which is a listed firm, is the Consob formal owner of a stake in Firm C. In this case, I utilize the Consob’s ownership reports on Firm B to expand the control chains of the stake in Firm C by adding the links from Firm B to its ultimate owners. 16 In a few cases, the stake’s formal ultimate owner is a foreign firm that, according to the non-Consob sources used in this research, is owned by an Italian individual. For example, some Italian families control Italian firms through firms incorporated abroad, especially in Luxembourg and the Netherlands. In this study, these foreign firms owned by Italian individuals are assumed to be unlisted Italian firms. 17 Applications of the weakest link principle are very frequent in the past literature (see, e.g., Claessens, Djankov, and Lang, 2000; Claessens, Djankov, Fan, and Lang, 2002; Faccio and Lang, 2002; Barontini and Caprio, 2006).

- 15 -
fraction of the firm’s control rights that is equal to or larger than 20%.18 I use the latest available
ownership data before the start of the fiscal year to determine whether the firm is controlled over the year
and to build the ownership variables of this section. Since the aim of this study is to investigate the payout
policy of controlled firms, observations for firms that are widely held are excluded from the sample.
The variable CRIGHTS is the percentage of the control rights held by the ultimate owner with the
largest control stake, i.e. the controlling shareholder. A firm that is controlled by an Italian individual
investor or by an Italian unlisted firm is defined as family-controlled. The dummy FAMILY is equal to one
for observations related to family-controlled firms; else, FAMILY is set to zero. When computing the
ownership variables in this section, I exclude firm-year observations belonging to controlled firms whose
controlling shareholder is a foreign firm. I apply this filter to the data for two reasons. First, the objective
of this study is to focus on the payout policy of Italian listed firms that are controlled either by Italian
firms or Italian individual investors. Second, I do not have information on the ownership structure of
foreign firms that is, in terms of quality and depth, comparable to that used for Italian controlling
shareholders.
For each firm-year, I compute the cash flow rights, or ownership rights, of the firm’s controlling
shareholder. I create the variable ORIGHTS, which is the percentage of cash flow rights held by the
controlling shareholder. An investor with cash flow rights in a firm has the right to receive a fraction of
the firm’s cash distributions to shareholders. Hence, I consider holdings of both voting and non-voting
shares when measuring cash flow rights. The cash flow stake of a controlling shareholder is estimated by
multiplying the cash flow rights of all the links of the chain the shareholder uses to control the stake. For
example, a controlling shareholder owns 15% of the cash flow rights of Firm A if the shareholder has a
50% cash flow stake in Firm B that, in turn, owns a 30% cash flow stake in Firm A (50% x 30% = 15%).
If the shareholder uses several control chains, I add the cash flow rights from all of them to calculate the
shareholder’s overall stake. Finally, I create the variable WEDGE by subtracting ORIGHTS from
18 The 20% control threshold has been used in several previous studies (see, e.g., La Porta, Lopez-de-Silanes, and Shleifer, 1999; Claessens, Djankov, and Lang, 2000; Faccio and Lang, 2002).

- 16 -
CRIGHTS. This variable is a measure of the discrepancy between the control rights and the cash flow
rights held by a controlling shareholder.
Some descriptive statistics for the ownership variables of this section can be found in Panel B of Table
I. As expected, the mean of CRIGHTS (50%) is larger than that of ORIGHTS (44%). Also, the average
value of WEDGE is 6%. It is worth noticing that the minimum value of this variable is negative (-4%). For
a few observations in the sample, the controlling shareholder has fewer control rights than cash flow
rights. A shared feature of these observations is that a stake in the controlled firm is held through a
wholly-owned subsidiary of the firm itself. Following the Italian law, the voting rights of the subsidiary
cannot be exercised in shareholder meetings of the parent firm. At the same time, the subsidiary keeps its
cash flow rights attached to the stake in the parent firm. In this scenario, the controlling shareholder has,
through the subsidiary, a cash flow stake in the controlled firm that does not carry any voting rights. The
average value of the dummy FAMILY is 0.8. This finding implies that 80% of the observations are for
firms controlled by families.
C. Other variables
Additional independent variables are constructed to control for factors that should affect a firm’s
payout policy. Most of these variables are of accounting nature and built upon data from Worldscope.
It is commonly expected that, all else equal, firms with higher cash flows and profits choose larger
payouts. This expectation is confirmed by the previous literature both for dividends (see, e.g. Fama and
French, 2001; John and Knyazeva, 2006; Denis and Osobov, 2008) and repurchases (see, e.g., John and
Knyazeva, 2006; Skinner, 2008). Moreover, there is some evidence supporting the notion that dividend
payments are more associated with “permanent” cash flows and profits whereas repurchases are more
likely to be paid out of “temporary” cash flows and profits (Guay and Harford, 2000; Jagannathan,
Stephens, and Weisbach, 2000). To control for firm profitability, I use two independent variables, one for
operating profits and one for non-operating profits. The first one is OI and it is given by a firm’s operating
income (Worldscope item 01250) scaled by its total assets (Worldscope item 02999). The second one,

- 17 -
which is called NOI, is computed in a similar way. A firm’s non-operating income is the difference
between the firm’s net income (Worldscope item 01706) and its operating income. Non-operating income
scaled by total assets gives NOI.
I use a firm’s market-to-book ratio as a measure of its growth opportunities. High values of this ratio
are normally interpreted as an indication of the existence of valuable investment opportunities. I expect
firms with fewer growth opportunities (lower market-to-book ratios) to pay out more. My expectation is
based on previous evidence on both dividends (see, e.g., Fama and French, 2001; John and Knyazeva,
2006) and repurchases (see, e.g., Fenn and Liang, 2001; Kahle, 2002). The market-to-book ratio (MB) is
computed scaling the sum of a firm’s market capitalization (Worldscope item 08001) and total debt
(Worldscope item 03255) by its total assets.
All else equal, small firms should be more reluctant than large firms to distribute internally generated
cash because external financing is likely to be more costly to them. For example, small firms are normally
less well-known by investors than large firms. Hence, small firms, when issuing new securities, bear
larger levels of the asymmetric information costs highlighted by Myers (1984) and Myers and Majluf
(1984). Previous studies confirm the existence of a positive relation both between firm size and dividends
(see, e.g., Fama and French, 2001; John and Knyazeva, 2006; Denis and Osobov, 2008) and between firm
size and repurchases (see, e.g., Dittmar, 2000; Fenn and Liang 2001). The firm size measure used in this
study is the variable TA, which is the natural logarithm of a firm’s total assets in thousands.
Owing to agency and financial distress costs, the marginal cost of raising new debt is an increasing
function of current leverage (Jensen and Meckling, 1976; Fazzari, Hubbard, and Petersen, 1988). Hence,
highly levered companies, which face large costs of debt financing, should rely more on internal financing
than less levered counterparts. Following this argument, I expect high leverage firms to be more reluctant
to pay out cash than low leverage firms. This expectation is supported by the existing research both on
dividends (see, e.g., Jensen, Solberg and Zorn, 1992; John and Knyazeva, 2006) and repurchases (see,
e.g., Dittmar, 2000; Kahle, 2002). LEV is the leverage measure that is used in this study. The numerator of
LEV is total debt, while its denominator is found by adding market capitalization to total debt. For each

- 18 -
firm-year observation, the variables OI, NOI, MB, TA, and LEV are calculated using end-of-year data from
the previous fiscal year.
Among the control variables, I also include a measure of firm risk (VAR). High risk firms, which are
characterized by volatile performances, should have a lower propensity to pay out cash than firms with
lower risk. A firm with volatile performance is highly exposed to the risk that valuable future investment
opportunities are foregone because of the lack of internally generated funds to be invested. Hence, high
risk firms should tend to distribute a small fraction of their earnings. Fenn and Liang (2001) find that the
volatility of operating income is negatively related to both total payout and dividend payout but positively
related to repurchase payout. There is also evidence that the volatility of stock returns is negatively
associated with both dividend (see, e.g., John and Knyazeva, 2006; Chay and Suh, 2009) and repurchase
payout (see, e.g., John and Knyazeva, 2006). On the whole, I expect firms with more volatile performance
to choose lower payout levels than counterparts with less volatile performance. For a particular firm-year,
VAR is the sample variance of all the daily log-returns in the previous period. I use Thomson Datastream
data to compute the log-returns. VAR should reflect both operating and financial risk (see, e.g., Christie,
1982) and be an increasing function of firm performance variability.
A firm’s managers and directors holding stock options on the shares of their firm are potentially
reluctant to make dividend payments that reduce the price of their firm’s stock and the value of their
options. They would rather prefer to pay out cash through repurchases. Similarly, managers and directors
that are going to receive stock grants in the future may avoid distributing dividends because they reduce
the prospective value of these grants. Finally, firms may buy back own stock to create a reserve of
treasury shares that are used to fund stock grant and/or stock option plans. Overall, I expect firms with
ongoing stock option and/or stock grant plans for their executives and directors to prefer share repurchases
over dividend payments more than firms without this kind of plans. This expectation is also supported by
some empirical studies (Fenn and Liang, 2001; Dittmar, 2000; Kahle, 2002; Cuny, Martin, and

- 19 -
Puthenpurackal, 2009). I use data from annual reports to build the dummy variable OPT.19 This variable is
equal to one in years in which there are ongoing stock option and/or stock grant plans for managers and
directors. These plans are assumed to be ongoing if in the year one or more of the following events takes
place. First, stock options and/or stock grants are attributed to directors and/or general managers. Second,
stock options are exercised by directors and/or general managers. Third, rights to obtain future stock
grants conditional on the attainment of predefined performance targets are awarded to directors and/or
general managers. The value of OPT is set to zero if none of these events takes place in the year. OPT is
the only independent variable for which contemporaneous values are used.
On the right hand side of every regression model, I always include a constant term and sets of year
and industry dummies. Coefficients on these variables are not reported in the paper.
Descriptive statistics for the variables OI, NOI, MB, TA, LEV, VAR, and OPT are presented in Panel C
of Table I.
III. Results
A. Univariate differences
The three panels of Table II include a series of univariate t-tests to investigate whether the means of
the payout variables used in this study are related to the cash flow rights held by a firm’s controlling
shareholder (ORIGHTS), the difference between the control rights and the cash flow rights of a firm’s
controlling shareholder (WEDGE), and whether a firm is controlled by a family. For robustness purposes,
Table II also includes non-parametric Mann-Whitney-Wilcoxon tests (MWW tests) on the distributions of
the payout variables.
19 Annex 3C of CONSOB Regulation no. 11,971 of 14 May 1999 requires companies to report some detailed information about incentive plans for directors and general managers in their notes to the annual financial statement. For each director and general manager, information on options held at the beginning of the period, on options granted, exercised and expired during the period, and on options held at the end of the period must be provided. Information on stock grants must be disclosed too. They are treated like options that are granted and exercised immediately.
- 20 -
In Panel A, I test whether the means and the distributions of the payout variables for observations
belonging to firms with above-median values of ORIGHTS are different from the means and the
distributions of the same variables for firm-years with below-median values of ORIGHTS. The cash flow
stake of a controlling shareholder does not have a statistically significant influence neither on the level of
total payout (PAYOUT) nor on the probability of a positive payout (DPAYOUT). The tests provide
insignificant results also for the level of dividend payout (DIV), the probability of a positive dividend
payout (DDIV), and the probability of repurchases (DREP). Based on the t-tests, I can conclude that the
level of repurchase payout (REP) is significantly larger and the value of %DIV is significantly smaller for
observations with above-median cash flow rights. However, only the second of these findings is supported
by the MWW tests at a 10% level of statistical significance.
Panel B includes some tests of the impact of the variable WEDGE on the firm’s payout policy.
Findings for the variable PAYOUT are mixed. According to the results of the t-test, there is a statistically
insignificant relation between WEDGE and PAYOUT. However, the MWW test indicates that the
distribution of PAYOUT is significantly different between firm-years with an above-median WEDGE and
observations with a below-median WEDGE. DPAYOUT is significantly larger, at a 1% level, in firm-years
with above-median values of WEDGE. These firm-years are also characterized by statistically significant
(at least at a 5% level) larger values of the variables DIV and DDIV. It is unclear whether WEDGE is
significantly related to REP given that the t-test and the MWW test provide opposite answers. Owing to
the lack of statistically significant results, nothing can be concluded with respect to DREP. Finally, the
value of %DIV is significantly larger, at a 1% level, for observations with an above-median WEDGE.
In Panel C, I investigate whether the payout policy of family-controlled firms is different from that of
non-family-controlled counterparts. The results of the tests for all of the payout variables are always
statistically significant at least at a 5% level. The values of the variables PAYOUT, DPAYOUT, DIV, and
DDIV are lower in firm-years belonging to family-controlled firms. These firms are characterized by
larger values of the variables REP and DREP. As for %DIV, the value of this variable is larger for non-
family-controlled firms.

- 21 -
1. Summary of the main univariate findings
On the whole, the results of the univariate tests support the notion that firms with weak governance
set-ups choose larger payouts and tend to replace repurchases with dividend payments. The univariate
findings support five of the six testable hypotheses of Section I.B. First, I find a negative relation between
the cash flow stake of a firm’s controlling shareholder and the share of the firm’s dividend payout in total
payout (H2). Second, the probability that a firm has a positive payout is an increasing function of the
wedge between the control rights and the cash flow rights held by the firm’s controlling shareholder (H3).
Third, there is also a positive relation between this wedge and the fraction of dividend payout in total
payout (H4). Fourth, both the probability of a positive payout and the level of total payout are lower in
firms controlled by families than in other controlled firms (H5). Finally, in family-controlled firms,
dividend payments have a lower weight in total payout (H6).
B. Regression analyses
1. Controlling shareholders’ control rights and cash flow rights
I investigate whether the probability of a positive payout is dependent on the size of the control stake
of a firm’s controlling shareholder and on the difference between her control rights and her cash flow
rights. More specifically, I run three Logit regressions of the binary variables DPAYOUT, DDIV, and
DREP on either the variable ORIGHTS or WEDGE. In the regressions, I also include the dummy FAMILY
and the other independent variables that may affect a firm’s payout policy. However, all the multivariate
findings for FAMILY are separately analyzed in the following section. Coefficient estimates, z-statistics,
and marginal effects for the Logit regressions are presented in Table III. In the DPAYOUT regressions, the
coefficients on ORIGHTS and WEDGE are not statistically significant. I conclude that neither the size of a
controlling shareholder’s cash flow stake nor the wedge between the controlling shareholder’s control and
cash flow rights affect the probability that the firm has a positive payout. In contrast, ORIGHTS and
WEDGE are significant determinants of both DDIV and DREP. The coefficient on ORIGHTS (WEDGE) is
negative (positive) in the DDIV specification and positive (negative) in the DREP regression.

- 22 -
Among the other independent variables, OI, NOI, VAR, and OPT are the most statistically significant
predictors of the payout variables. Overall, as OI, NOI, and OPT increase, the probability of a positive
payout becomes larger. This probability decreases when VAR increases.
I also want to test whether, among firms with positive payout, the odds of making dividend payments
rather than repurchases is a function of the variables ORIGHTS and WEDGE. I consider the observations
with positive payout and separate them into non-overlapping sets, one for each of the three possible
payout outcomes. One set comprises firm-years with positive dividend payout and zero repurchase payout.
A second set is made up of observations with zero dividend payout and positive repurchase payout. The
remaining observations with positive dividend and repurchase payouts go into the final set. I estimate a
Multinomial Logit regression with three possible outcomes, one for each of the three sets above. As base
outcome, I choose that in which dividends are not paid and stock is repurchased. Results for the
Multinomial Logit model are reported in Table IV.20 The odds of distributing cash through dividends
rather than repurchases seem to be dependent on both ORIGHTS and WEDGE in a statistically significant
way. To be more specific, these odds are a negative function of ORIGHTS and a positive function of
WEDGE. In terms of economic significance, a unit increase in ORIGHTS leads to a 6.48% reduction (e -
0.067 – 1 = -0.0648) in the ratio between the probability of paying dividends without repurchasing stock
(DDIV=1 and DREP=0) and the probability of not paying dividends and repurchasing stock (DDIV=0 and
DREP=1). This ratio increases by 19.96% (e 0.182 – 1 = 0.1996) when WEDGE is raised by one unit. I
conclude that firms whose controlling shareholders own large cash flow stakes tend to prefer dividends
over repurchases less than firms controlled by shareholders with small cash flow stakes. Furthermore, the
preference for dividends, at the expense of repurchases, is an increasing function of the difference between
the controlling shareholders’ control and cash flow rights.
20 It is not straightforward to interpret the coefficients of Multinomial Logit models because they are log-odds. A simple example should clarify how the coefficients of these models can be interpreted. Assume that a model with one base outcome and several alternative outcomes is estimated. The base outcome is called “outcome 1” and one of the alternative outcomes is “outcome 2”. If, in the regression for outcome 2, the coefficient on a dependent variable is 0.5, the model predicts that a unit increase in the variable changes the ratio between the probability of outcome 2 and the probability of outcome 1 by a factor of 1.65 (e 0.5 =1.65), i.e. the ratio between the two probabilities increases by 65%.

- 23 -
As for other controls with statistically significant coefficients, there is a positive relation between
profitability (OI and NOI) and the odds of paying dividends rather than making repurchases. Additionally,
the coefficient on VAR is negative and significant in the model for the second alternative outcome. The
findings for the dummy FAMILY are analyzed in the following section.
In Table V, I report the estimates for the coefficients, the t-statistics, and the marginal effects of the
final set of the regressions. The dependent variables are PAYOUT, DIV, REP, and %DIV, and the main
independent variables are ORIGHTS and WEDGE. Since the dependent variables are censored either at
zero or at zero and 100, I use a Tobit estimation method. Findings for the Tobit regressions are reported in
Panels A and B of Table V. From these regressions, I conclude that both ORIGHTS and WEDGE are not
statistically significant predictors of PAYOUT. What this finding suggests is that the magnitude of a
controlled firm’s payout is not dependent on either the size of the cash flow stake of the firm’s controlling
shareholder or the wedge between the controlling shareholder’s control and cash flow rights. Coefficients
on ORIGHTS and WEDGE are insignificant in DIV specifications too, whereas the two regressors appear
to be significantly related to REP. In particular, the magnitude of repurchase payout is positively
associated with ORIGHTS and negatively related to WEDGE. A crucial finding in Table V is that the
fraction of dividends in total payout (%DIV) is a negative function of the controlling shareholder’s cash
flow rights (ORIGHTS) and a positive function of the difference between the control and the cash flow
rights of the controlling shareholder (WEDGE). Considering the reported marginal effects, I can conclude
that when ORIGHTS (WEDGE) increases by one, %DIV changes by -0.22 (0.49).
In the Tobit regressions, coefficients on four controls are normally significant. To be specific, there
are positive relations between both OI and NOI and the dependent variables. The coefficient on VAR is
negative and statistically significant, except in the %DIV regressions. Finally, when OPT is equal to one,
both PAYOUT and REP are larger whereas the weight of dividends in total payout (%DIV) is smaller. As
usual, the results for FAMILY are described in the section that follows.

- 24 -
2. Family-controlled vs. Non-family-controlled firms
In Panels A and B of Table III, the coefficient on the dummy FAMILY is statistically significant only
in the DREP model. When the value of the binary variable changes from zero to one, the probability of a
firm making repurchases increases. On the other hand, the probabilities of positive total payout and
dividend payout are not dependent on whether a firm is controlled by a family.
The results presented on Panels A and B of Table IV suggest that the odds of paying dividends rather
than repurchasing own stock are significantly smaller in family-controlled firms. The four coefficients on
FAMILY are always negative and statistically significant at a 1% level. Based on the coefficient estimates,
when the value of FAMILY increases from zero to one, the ratio between the probability of the first
alternative outcome (DDIV=1 and DREP=0) and the probability of the base outcome (DDIV=0 and
DREP=1) decreases by a very large amount (e.g., e -16.604 -1 = -0.99).
Finally, in the Tobit regressions (Panels A and B of Table V) the coefficients on FAMILY are always
statistically significant. The estimates of these regressions suggest that family-controlled firms are
characterized by smaller total and dividend payouts and larger repurchase payouts. Also, in the dividend-
repurchase trade-off, firms controlled by families tend to use dividends less when disbursing cash. As for
the economic significance of the findings, a change in FAMILY from zero to one leads to a decrease in
PAYOUT ranging from 0.266 to 0.268 standard-deviations (one standard deviation is 3.49) and to a fall in
%DIV that ranges from 11.21 to 11.78.
3. Summary of the main multivariate findings
The multivariate tests provide an overall support for the notion that weakly governed firms use payout
policy to mitigate corporate governance conflicts. Agency costs are reduced mainly by increasing the
fraction of dividend payments in total payout rather than by paying out more. Four of the six testable
hypotheses of Section I.B are supported by the multivariate findings. First, I report that the odds of paying
dividends rather than repurchasing own stock are negatively related to the cash flow stake of the firm’s
controlling shareholder (H2) and positively associated with the wedge between the control and the cash

- 25 -
flow rights of the controlling shareholder (H4). Second, the weight of a firm’s dividend payout in total
payout (dividends plus repurchases) decreases when the size of the cash flow rights of the firm’s
controlling shareholder increases (H2) and when the difference between the controlling shareholder’s
control rights and cash flow rights decreases (H4). Third, the level of total payout is lower in firms
controlled by families than in other controlled firms (H5). Finally, family-controlled firms are
characterized both by lower ratios between dividend and total payout and by a lower likelihood of
distributing cash through dividends payments rather than repurchases (H6).
IV. Robustness checks
I investigate the robustness of the multivariate findings presented in Section C.B by carrying out a
series of robustness tests. The aim of these tests is to analyze whether the sign and significance of the
relations between the payout variables and the main independent variables (ORIGHTS, WEDGE, and
FAMILY) are sensitive to the presence of outliers, changes in regression specifications, variations in
sample compositions, and changes in variable definitions. There are five sets of robustness checks.
First, I analyze whether the findings are driven by outliers. I winsorize all of the continuous variables
at 2.5% and 97.5% and re-run the regressions. The results of the multivariate analyses on winsorized
variables are qualitatively similar to those on the original variables.
Second, in the original regressions of Tables III to V, I never include the regressors ORIGHTS and
WEDGE together. The latter variable is a function of the former, and the two variables are strongly
negatively correlated. In the sample, the Pearson correlation coefficient between ORIGHTS and WEDGE
is highly statistically significant and equal to -0.64. Hence, multicollinearity problems are likely to arise
from the contemporaneous inclusion of the two variables. Nevertheless, in some strands of the existing
research it is not uncommon to estimate specifications comprising, at the same time, independent variables
similar to ORIGHTS and WEDGE (see, e.g., Claessens, Djankov, Fan, and Lang, 2002; Laeven and
Levine, 2008). In line with this previous research, I re-estimate the regressions of Tables III to V always

- 26 -
including, on the right hand side, both ORIGHTS and WEDGE. Overall, the signs of the coefficients on
both variables are not affected by their contemporaneous inclusion. However, the statistical significance of
these coefficients is dramatically reduced. For example, both in the Multinomial Logit model and in the
%DIV regression, the coefficient on WEDGE is positive and statistically significant whereas that on
ORIGHTS is negative but statistically insignificant.
Third, I use two alternative measures of the wedge between a controlling shareholder’s control and
cash flow rights. First, I compute a relative measure of this wedge by taking the ratio between WEDGE
times 100 and the size of the control rights. Second, I create a binary variable that is equal to one when
WEDGE is positive. By replacing WEDGE with either of the two alternative measures, I obtain
multivariate results that are qualitatively consistent with those for WEDGE.
Fourth, in this study I use a sample that comprises non-financial firms, including utilities. It is often
argued that the financial policies of utilities differ from those of other non-financial firms because utilities
are regulated firms. I investigate whether the main findings of this study are sensitive to the exclusion of
these firms. I re-estimate the regressions of Tables III to V on reduced samples that exclude firm-years
belonging to utilities. The changes in sample composition only produce a noteworthy variation in the
findings: The coefficients on FAMILY become marginally statistically insignificant (p-values of 0.14 and
0.15) in the Tobit regressions.
Finally, in accordance with several previous studies (see, e.g., La Porta, Lopez-de-Silanes, and
Shleifer, 1999; Claessens, Djankov, and Lang, 2000; Faccio and Lang, 2002), in this paper a firm is
defined as controlled if at least one of its shareholders owns 20% or more of its control rights. I repeat the
multivariate analyses assuming that control is achieved by holding either 35% or 50% of a firm’s voting
rights. The original findings are affected in two ways when these alternative control thresholds are chosen.
First, the negative relation between ORIGHTS and DPAYOUT becomes statistically significant. Second, in
the Tobit regressions, the coefficient on FAMILY is confirmed to be negative; however, this coefficient
becomes insignificant from the statistical viewpoint.

- 27 -
V. Conclusion
The focus of this study is on the payout policy of firms controlled by shareholders with large control
stakes. In controlled firms, the main agency conflict is that between controlling shareholders and minority
shareholders. The conflict arises because controlling shareholders have an incentive to engage in self-
dealing activities that benefit them at the expense of minority shareholders. According to the agency cost
explanation of payout policy, in firms with weak governance set-ups, in which controlling shareholders
are likely to pursue private interests, agency conflicts can be attenuated in two ways. First, large payouts
can be chosen in order to reduce the stock of freely available cash that can be misused (Jensen, 1984) and
possibly force firms to raise new external capital and fall under the scrutiny of the market (Easterbrook,
1984). Second, when choosing between dividend payments and stock repurchases, dividends can be
preferred because, in contrast with repurchases, they carry implicit commitments to future dividend
payouts (John and Knyazeva, 2006).
I test the validity of the agency explanation of payout policy in the Italian context. The sample used in
the tests comprises observations for Italian non-financial controlled firms and the sample period is 1999-
2004. The main finding of my tests, which supports the notion that a firm’s payout policy is designed to
reduce its agency problems, is that firms with weak corporate governance tend to prefer dividends over
repurchases more and have larger shares of dividends in total payout than better governed counterparts. In
the study, firms with weak governance and severe agency problems are defined as those that are not
controlled by families and those having controlling shareholders that own small fractions of their cash
flow rights and posses control rights that significantly exceed cash flow rights. An additional finding in
support of the agency explanation of payout policy is that family-controlled firms pay out less than firms
controlled by other types of shareholders.
I run a series of robustness checks. I report that my findings are very robust, with the exception of the
negative relation between family control and the level of payout. Unfortunately, this relation turns

- 28 -
statistically insignificant when I exclude utilities from the sample and when I choose higher control
thresholds to identify controlled firms.

- 29 -
References Aharony, J. and I. Swary, 1980, “Quarterly dividend and earnings announcements and stockholders’
returns: An empirical analysis,” Journal of Finance 35, 1-12.
Barontini, R. and I. Caprio, 2006, “The effect of family control on firm value and performance: Evidence from Continental Europe,” European Financial Management 12, 689-723.
Berle, A.A. and G.C. Means, 1932, “The modern corporation and private property”. Harcourt, Brace & World, New York.
Bianchi, M., Bianco, M., and L. Enriques, 2001, “Pyramidal groups and the separation between ownership and control in Italy,” available at SSRN: http://ssrn.com/abstract=293882.
Brav, A., Graham, J.R., Harvey, C.R., and R. Michaely, 2005, “Payout policy in the 21st century,” Journal of Financial Economics 77, 483-527.
Chay, J.B. and J. Suh, 2009, “Payout policy and cash-flow uncertainty,” Journal of Financial Economics 93, 88-107.
Christie, A.A., 1982, “The stochastic behavior of common stock variances. Value, leverage, and interest rate effects,” Journal of Financial Economics 10, 407-432.
Claessens, S., Djankov, S., and L.H.P. Lang, 2000, “The separation of ownership and control in East Asian Corporations,” Journal of Financial Economics 58, 81-112.
Claessens, S., Djankov, S., Fan, J.P.H., and L.H.P. Lang, 2002, “Disentangling the incentive and entrenchment effects of large shareholdings,” Journal of Finance 57, 2741-2771.
Cuny, C.J., Martin, G.S., and J.J. Puthenpurackal, 2009, “Stock options and total payout,” Journal of Financial and Quantitative Analysis 44, 391-410.
Denis, D.J. and I. Osobov, 2008, “Why do firms pay dividends? International evidence on the determinants of dividend policy,” Journal of Financial Economics 89, 62-82.
Dewenter, K.L. and V.A. Warther, 1998, “Dividends, asymmetric information, and agency conflicts: Evidence from comparison of the dividend policies of Japanese and U.S. firms,” Journal of Finance 53, 879-904.
Dittmar, A.K., 2000, “Why do firms repurchase stock?” Journal of Business 73, 331-355.
Easterbrook, F.H., 1984, “Two agency costs explanations of dividends,” American Economic Review 74, 650-659.
Faccio, M., and L.H.P. Lang, 2002, “The ultimate ownership of Western European corporations,” Journal of Financial Economics 65, 365-395.
Faccio, M., Lang, L.H.P., and L. Young, 2001, “Dividends and expropriation,” American Economic Review 2001, 54-78.
Fama, E.F. and K.R. French, 2001, “Disappearing dividends: Changing firm characteristics or lower propensity to pay?” Journal of Financial Economics 60, 3-43.
Fazzari, S.R., Hubbard, G., and B. Petersen, 1988, “Financing constraints and corporate investment,” Brooking Papers on Economic Activity 1, 141-195.
Fenn, G.W. and N. Liang, 2001, “Corporate payout policy and managerial stock incentives,” Journal of Financial Economics 60, 45-72.
Gompers, P.A., Ishii, J., and A. Metrick, 2008, “Extreme governance: An analysis of dual-class firms in the United States,” available at SSRN: http://ssrn.com/abstract=562511.

- 30 -
Grinstein, Y. and R. Michaely, 2005, “Institutional holdings and payout policy,” Journal of Finance 60, 1389-1426.
Guay, W. and J. Harford, 2000, “The cash-flow permanence and information content of dividend increases versus repurchases,” Journal of Financial Economics 57, 385-415.
Gugler, K., 2003, “Corporate governance, dividend payout policy, and the interrelation between dividends, R&D, and capital investment,” Journal of Banking and Finance 27, 1297-1321.
Gugler, K. and B.B. Yurtoglu, 2003, “Corporate governance and dividend pay-out policy in Germany,” European Economic Review 47, 731-758.
Holderness, C.G., 2009, “The myth of diffuse ownership in the United States,” Review of Financial Studies 22, 1377-1408.
Hu, A. and P. Kumar, 2004, “Managerial entrenchment and payout policy,” Journal of Financial and Quantitative Analysis 39, 759-790.
Hu, Y., Wang, D., and S. Zhang, 2007, “Founding family ownership, management, and payout policy,” Available at SSRN: http://ssrn.com/abstract=1024300.
Jagannathan, M., Stephens, C.P., and M.S. Weisbach, 2000, “Financial flexibility and the choice between dividends and stock repurchases,” Journal of Financial Economics 57, 355-384.
Jensen, G.R., Solberg, D.P., and T.S. Zorn, 1992, “Simultaneous determinants of insider ownership, debt, and dividend policies,” Journal of Financial and Quantitative Analysis 27, 247-263.
Jensen, M.C., 1986, “Agency cost of free cash flow, corporate finance, and takeovers,” American Economic Review 76, 323-329.
Jensen, M.C. and W. Meckling, 1976, “Theory of the firm: Managerial behavior, agency costs and ownership structure,” Journal of Financial Economics 3, 305-360.
Joh, S.W., 2003, “Corporate governance and firm profitability: Evidence from Korea before the economic crisis,” Journal of Financial Economics 68, 287-322.
John, K. and A. Knyazeva, 2006, “Payout policy, agency conflicts, and corporate governance,” available at SSRN: http://ssrn.com/abstract=841064.
Kahle, K.M., 2002, “When a buyback isn’t a buyback: Open market repurchases and employee options,” Journal of Financial Economics 63, 235-261.
Laeven, L. and R. Levine, 2008, “Complex ownership structures and corporate valuations,” Review of Financial Studies 21, 579-604.
La Porta, R., Lopez-de-Silanes, F., and A. Shleifer, 1999, “Corporate ownership around the world,” Journal of Finance 54, 471-517.
La Porta, R., Lopez-de-Silanes, F., Shleifer, A., and R.W. Vishny, 2000, “Agency problems and dividend policy around the world,” Journal of Finance 55, 1-33.
La Porta, R., Lopez-de-Silanes, F., Shleifer, A., and R.W. Vishny, 2002, “Investor protection and corporate valuation,” Journal of Finance 57, 1147-1170.
Lintner, J., 1956, “Distribution of incomes of corporations among dividends, retained earnings, and taxes,” American Economic Review 46, 97-113.
Mitton, T., 2002, “A cross-firm analysis of the impact of corporate governance on the East Asian financial crisis,” Journal of Financial Economics 64, 215-241.
Myers, S.C., 1984, “The capital structure puzzle,” Journal of Finance 39, 575-592.
- 31 -
Myers, S.C. and N.S. Majluf, 1984, “Corporate financing and investment decisions when firms have information the investors do not have,” Journal of Financial Economics 13, 187-221.
Nenova, T., 2003, “The value of corporate voting rights and control: A cross-country analysis,” Journal of Financial Economics 68, 325-351.
Noronha, G.M., Shome, D.K., and G.E. Morgan, 1996, “The monitoring rationale for dividends and the interaction of capital structure and dividend decisions,” Journal of Banking and Finance 20, 439-454.
Rozeff, M., 1982, “Growth, beta, and agency costs as determinants of dividend payout ratios,” Journal of Financial Research 3, 249-259.
Skinner, D.J., 2008, “The evolving relation between earnings, dividends, and stock repurchases,” Journal of Financial Economics 87, 582-609.
Stephens, C.P. and M.S. Weisbach, 1998, “Actual share reacquisitions in open-market repurchase programs,” Journal of Finance 53, 313-333.
Villalonga, B. and R. Amit, 2006, “How do family ownership, control and management affect firm value?” Journal of Financial Economics 80, 385-417.

32
Table I Descriptive statistics for all of the dependent and independent variables used in the study
This table reports the descriptive statistics for a set of variables for samples of firm-years (fiscal years) belonging to the period 1999-2004. Only observations for controlled firms are included in the samples. A firm is defined as controlled if at least one of the firm’s shareholders holds 20% or more of the firm’s control rights. The data necessary to build the variables is obtained from Thomson Datastream, Worldcope, firms’ annual reports, Consob’s website, the database Factiva, and the World Wide Web. For a particular firm-year, DIV (REP) is the ratio between the cash distributed by the firm in the year through dividend payments (repurchases) multiplied by 100 and the firm’s market capitalization at the end of the previous year. The binary variable DDIV (DREP) is equal to one if DIV (REP) is larger than zero, otherwise it is set to zero. PAYOUT is the sum between DIV and REP, and the dummy DPAYOUT equals one when PAYOUT is positive. %DIV is computed dividing the product between DIV and 100 by PAYOUT. For each firm-year, the ownership variables are constructed based on the latest available information before the start of the fiscal year. CRIGHTS and ORIGHTS are, respectively, the fraction of the firm’s control rights and the fraction of the firm’s cash flow rights held by the shareholder with the largest control stake (i.e. the controlling shareholder). WEDGE is the difference between CRIGHTS and ORIGHTS. The binary variable FAMILY is set to one if the firm is controlled by a family. For a particular firm-year, the variables OI, NOI, MB, TA, and LEV are computed using information as of the end of the previous fiscal year. TA is the book value of total assets. OI and NOI are operating and non-operating income respectively scaled by TA. MB is the sum of market capitalization and total debt divided by TA. LEV is the ratio between total debt and the sum of market capitalization and total debt. VAR is the sample variance of the daily log-returns in the previous fiscal year. If, in the current fiscal year, there are ongoing stock option and/or stock grant plans for managers and directors, OPT is set to one; otherwise, it is equal to zero. For each of the variables above, the table reports the number of observations, the mean value, the median value, the standard deviation, the minimum value, the maximum value, the value of the first quartile, and the value of the third quartile.
PANEL A: Payout variables
Variable Observations Mean Median Standard deviation Minimum Maximum First
quartile Third
quartile
DIV 630 2.171 1.655 3.236 0 47.141 0 3.072 DDIV 630 0.717 1 - - - - - REP 630 0.347 0 1.131 0 13.058 0 0.091 DREP 630 0.297 0 - - - - - PAYOUT 630 2.519 1.883 3.487 0 47.141 0.018 3.413 DPAYOUT 630 0.759 1 - - - - - %DIV 478 85.915 100 27.393 0 100 85.825 100 PANEL B: Ownership variables
Variable Observations Mean Median Standard deviation Minimum Maximum First
quartile Third
quartile
CRIGHTS 630 50.082 51.267 15.4145 20.321 91.143 37 59.683 ORIGHTS 630 44.195 49.875 19.834 0.347 91.143 29.776 57.57 WEDGE 630 5.887 0 10.277 -3.695 45.548 0 9.288 FAMILY 630 0.805 1 - - - - - PANEL C: Other variables
Variable Observations Mean Median Standard deviation Minimum Maximum First
quartile Third
quartile
OI 630 0.015 0.027 0.134 -2.608 0.192 -0.014 0.068 NOI 630 -0.006 -0.014 0.124 -0.618 2.652 -0.04 0.009 MB 630 1.086 0.841 0.894 0.052 11.21 0.629 1.241 TA 630 13.166 12.917 1.807 9.755 18.362 11.823 14.341 LEV 630 0.334 0.301 0.236 0 0.967 0.14 0.508 VAR 630 0.0007 0.0006 0.0006 0.0001 0.0109 0.0004 0.0008 OPT 630 0.23 0 - - - - -

33
Table II Univariate tests on the payout variables
In the table, the mean values and the distributions of the payout variables PAYOUT, DPAYOUT, DIV, DDIV, REP, DREP, and %DIV are compared across different sub-samples through standard t-tests on means and non-parametric Mann-Whitney-Wilcoxon tests on distributions. Information from Worldcope and firms’ annual reports for the period 1999-2004 is used to build the payout variables. For a particular firm-year, DIV (REP) is the ratio between the cash distributed by the firm in the year through dividend payments (repurchases) multiplied by 100 and the firm’s market capitalization at the end of the previous year. The binary variable DDIV (DREP) is equal to one if DIV (REP) is larger than zero, otherwise it is set to zero. PAYOUT is the sum between DIV and REP, and the dummy DPAYOUT equals one when PAYOUT is positive. %DIV is computed dividing the product between DIV and 100 by PAYOUT. In Panel A, the mean values (distributions) of the payout variables for observations related to firms with controlling shareholders holding above-median fractions of cash flow rights are compared to the mean values (distributions) of the same variables for observations of firms with controlling shareholders possessing below-median cash flow stakes. In Panel B, the mean values and the distributions of the payout variables are compared across two sub-samples: One with above-median values of the variable wedge, which is the difference between the controlling shareholder’s control and cash flow rights, and one with below-median values of this variable. Finally, in Panel C the first sub-sample of observations is for family-controlled firms and the second comprises observations for firms controlled by other controlling shareholders. In each of the three panels, the last two columns report the two-sided p-values of the t-tests and of the Mann-Whitney-Wilcoxon (MWW) tests. PANEL A: Cash flow rights
Variable Observations
Mean for observations with cash flow rights above median
Mean for observations with cash flow rights below median
Median for observations with cash flow rights above median
Median for observations with cash flow rights below median
p-value of t-test
p-value of MWW-
test
PAYOUT 630 2.482 2.555 1.679 2.125 0.7955 0.4945 DPAYOUT 630 0.772 0.745 1 1 0.4266 0.4262 DIV 630 2.022 2.318 1.485 1.835 0.252 0.2006 DDIV 630 0.711 0.723 1 1 0.7441 0.7439 REP 630 0.46 0.237 0 0 0.013 0.1125 DREP 630 0.317 0.277 0 0 0.2657 0.2654 %DIV 478 82.025 89.804 100 100 0.0018 0.0885 PANEL B: Wedge
Variable Observations
Mean for observations with
wedge above median
Mean for observations with
wedge below median
Median for observations with
wedge above median
Median for observations with
wedge below median
p-value of t-test
p-value of MWW-
test
PAYOUT 630 2.733 2.393 2.309 1.519 0.2374 0.0009 DPAYOUT 630 0.8240 0.72 1 1 0.0033 0.0034 DIV 630 2.511 1.972 2.112 1.372 0.0436 0.0001 DDIV 630 0.807 0.665 1 1 0.0001 0.0001 REP 630 0.222 0.421 0 0 0.0331 0.2815 DREP 630 0.283 0.305 0 0 0.5688 0.5684 %DIV 478 91.61 82.091 100 100 0.0002 0.0071 PANEL C: Family-controlled vs. non-family-controlled firms
Variable Observations
Mean for observations of
family-controlled firms
Mean for observations of
non-family-controlled firms
Median for observations of
family-controlled-firms
Median for observations of
non-family-controlled firms
p-value of t-test
p-value of MWW-
test
PAYOUT 630 2.274 3.499 1.69 2.382 0.0004 0.0007 DPAYOUT 630 0.742 0.83 1 1 0.0416 0.0417 DIV 630 1.881 3.368 1.489 2.313 < 0.0001 <0.0001 DDIV 630 0.69 0.83 1 1 0.0021 0.0022 REP 630 0.41 0.091 0 0 0.005 <0.0001 DREP 630 0.339 0.122 0 0 < 0.0001 <0.0001 %DIV 478 82.754 97.566 100 100 < 0.0001 < 0.0001

34
Table III Logit models: The controlling shareholder’s cash flow rights, the wedge between the controlling shareholder’s control and cash flow rights, and family-controlled vs. non-family-controlled firms
This table reports the estimates for six Logit regressions (three in Panel A and three in Panel B) of the dependent variables DPAYOUT, DDIV, and DREP on several independent variables. The regressions are run on samples of firm-years (fiscal years) belonging to firms with controlling shareholders. The sample period is 1999-2004. The data necessary to build the variables is obtained from Thomson Datastream, Worldcope, firms’ annual reports, Consob’s website, the database Factiva, and the World Wide Web. For a particular firm-year, the binary variable DDIV (DREP) is equal to one if the firm pays dividends (repurchases stock) in the fiscal year, otherwise it is set to zero. The dummy DPAYOUT equals one if at least one of the variables DDIV and DREP is equal to one. ORIGHTS is the fraction of the firm’s cash flow rights held by the controlling shareholder (i.e. the shareholder with the largest control stake above 20%). WEDGE is the difference between the fraction of the firm’s control rights possessed by the controlling shareholder and ORIGHTS. The binary variable FAMILY is set to one if the firm is controlled by a family. These ownership variables are constructed based on the latest available information before the start of the fiscal year. For a particular firm-year, the variables OI, NOI, MB, TA, and LEV are computed using information as of the end of the previous fiscal year. TA is the book value of total assets. OI and NOI are operating and non-operating income respectively scaled by TA. MB is the sum of market capitalization and total debt divided by TA. LEV is the ratio between total debt and the sum of market capitalization and total debt. VAR is the sample variance of the daily log-returns in the previous fiscal year. If, in the current fiscal year, there are ongoing stock option and/or stock grant plans for managers and directors, OPT is set to one; otherwise, it is equal to zero. Both year and industry dummies are included among the independent variables; however, results for these dummies are not reported. For each independent variable, the table shows the coefficient estimate, the z-statistic robust to heteroscedasticity and within-firm correlation (in parentheses), and the marginal effect (in brackets). When the independent variable is a dummy, the marginal effect is for a discrete change in the variable from zero to one. The table also reports the number of observations and the value of the log-likelihood function for every regression. PANEL A: Cash flow rights and family-controlled firms Dependent variables:
DPAYOUT DDIV DREP Independent variables: ORIGHTS -0.012 -0.024 ** 0.011 * (-1.15) (-2.25) (1.66) [-0.002] [-0.004] [0.002] FAMILY 0.048 -0.126 1.519 *** (0.1) (-0.24) (3.33) [0.006] [-0.02] [0.212] OI 25.676 *** 46.679 *** 3.8 * (4.44) (6.37) (1.67) [3.406] [7.675] [0.689] NOI 24.896 *** 45.735 *** 0.312 (4.27) (6.2) (0.15) [3.302] [7.52] [0.057] MB 0.259 0.311 * -0.139 (1.25) (1.69) (-0.83) [0.034] [0.051] [-0.025] TA 0.075 0.008 0.179 ** (0.7) (0.07) (1.98) [0.01] [0.001] [0.032] LEV -1.522 * -0.364 -0.698 (-1.88) (-0.43) (-0.95) [-0.202] [-0.06] [-0.127] VAR -1,704.415 *** -2,189.245 *** -1,111.196 ** (-4.14) (-5.65) (-2.57) [-226.077] [-360.088] [-201.689] OPT 1.186 *** 1.123 *** 0.855 *** (3.25) (2.76) (2.89) [0.127] [0.154] [0.172] Observations 630 630 630 Log-likelihood value -203.847 -179.857 -322.84
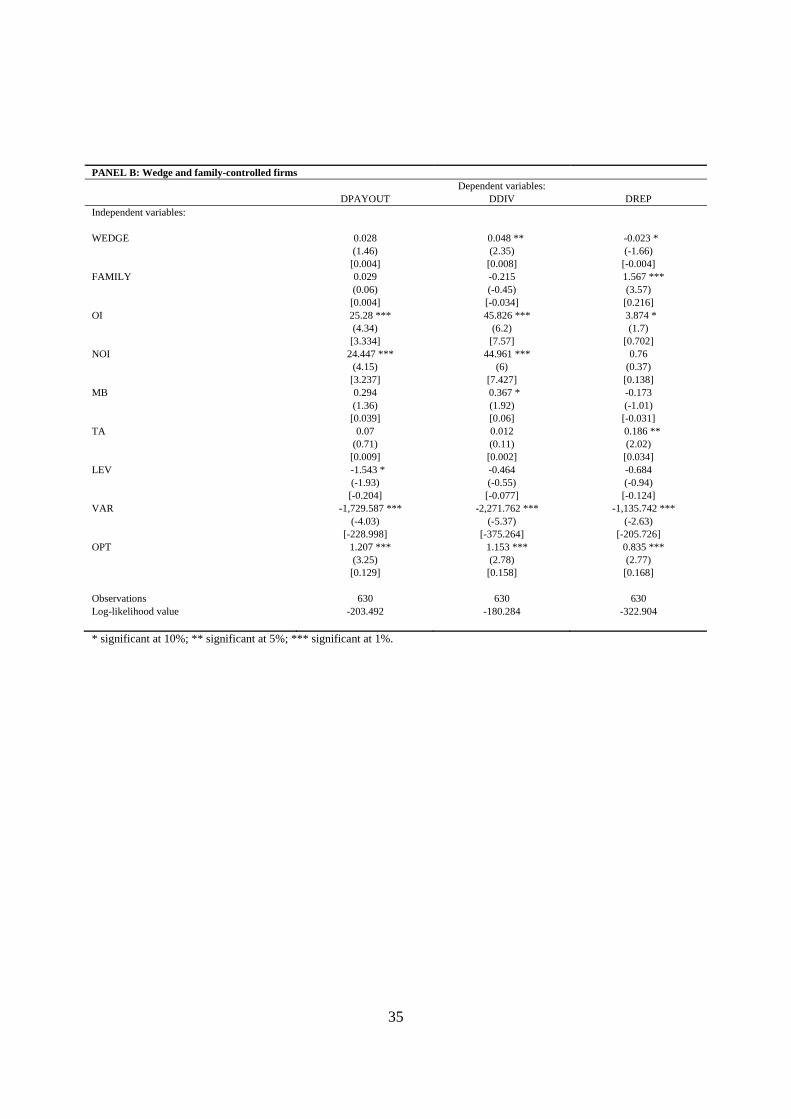
35
PANEL B: Wedge and family-controlled firms Dependent variables:
DPAYOUT DDIV DREP Independent variables: WEDGE 0.028 0.048 ** -0.023 * (1.46) (2.35) (-1.66) [0.004] [0.008] [-0.004] FAMILY 0.029 -0.215 1.567 *** (0.06) (-0.45) (3.57) [0.004] [-0.034] [0.216] OI 25.28 *** 45.826 *** 3.874 * (4.34) (6.2) (1.7) [3.334] [7.57] [0.702] NOI 24.447 *** 44.961 *** 0.76 (4.15) (6) (0.37) [3.237] [7.427] [0.138] MB 0.294 0.367 * -0.173 (1.36) (1.92) (-1.01) [0.039] [0.06] [-0.031] TA 0.07 0.012 0.186 ** (0.71) (0.11) (2.02) [0.009] [0.002] [0.034] LEV -1.543 * -0.464 -0.684 (-1.93) (-0.55) (-0.94) [-0.204] [-0.077] [-0.124] VAR -1,729.587 *** -2,271.762 *** -1,135.742 *** (-4.03) (-5.37) (-2.63) [-228.998] [-375.264] [-205.726] OPT 1.207 *** 1.153 *** 0.835 *** (3.25) (2.78) (2.77) [0.129] [0.158] [0.168] Observations 630 630 630 Log-likelihood value -203.492 -180.284 -322.904 * significant at 10%; ** significant at 5%; *** significant at 1%.

36
Table IV Multinomial Logit models: The controlling shareholder’s cash flow rights, the wedge between the controlling shareholder’s control and cash flow rights, and family-controlled vs. non-family-controlled firms
This table shows the estimates for two Multinomial Logit models (one in Panel A and one in Panel B) with three alternative outcomes based on the variables DDIV and DREP. The models are estimated using samples of firm-years (fiscal years) belonging to firms with controlling shareholders. The sample period is 1999-2004. The data necessary to build the variables used in the Multinomial Logit models is obtained from Thomson Datastream, Worldcope, firms’ annual reports, Consob’s website, the database Factiva, and the World Wide Web. For a particular firm-year, the binary variable DDIV (DREP) is equal to one if the firm pays dividends (repurchases stock) in the fiscal year, otherwise it is set to zero. Observations with DDIV=0 and DREP=1 (i.e. with zero dividends and positive stock repurchase activity) constitute the base outcome of the model. There are two alternative outcomes: The first is DDIV=1 and DREP=0 and the second is DDIV=1 and DREP=1. ORIGHTS is the fraction of the firm’s cash flow rights held by the controlling shareholder (i.e. the shareholder with the largest control stake above 20%). WEDGE is the difference between the fraction of the firm’s control rights possessed by the controlling shareholder and ORIGHTS. The binary variable FAMILY is set to one if the firm is controlled by a family. These ownership variables are constructed based on the latest available information before the start of the fiscal year. For a particular firm-year, the variables OI, NOI, MB, TA, and LEV are computed using information as of the end of the previous fiscal year. TA is the book value of total assets. OI and NOI are operating and non-operating income respectively scaled by TA. MB is the sum of market capitalization and total debt divided by TA. LEV is the ratio between total debt and the sum of market capitalization and total debt. VAR is the sample variance of the daily log-returns in the previous fiscal year. If, in the current fiscal year, there are ongoing stock option and/or stock grant plans for managers and directors, OPT is set to one; otherwise, it is equal to zero. Both year and industry dummies are included among the independent variables; however, results for these dummies are not reported. For each independent variable, the table shows the coefficient estimate and the z-statistic robust to heteroscedasticity and within-firm correlation (in parentheses). The table also reports the number of observations and the value of the log-likelihood function. PANEL A: Cash flow rights and family-controlled firms Base outcome: DDIV=0 and DREP=1 Alternative outcomes:
DDIV=1 and DREP=0 DDIV=1 and DREP=1 Independent variables: ORIGHTS -0.067 *** -0.056 ** (-2.82) (-2.39) FAMILY -16.604 *** -15.054 *** (-6.45) (-6.08) OI 58.165 *** 60.157 *** (4.76) (5.07) NOI 58.412 *** 57.599 *** (5.46) (5.44) MB 0.163 0.075 (0.32) (0.14) TA -0.297 -0.141 (-0.9) (-0.41) LEV 0.846 0.636 (0.49) (0.36) VAR -401.673 -1,641.745 * (-0.58) (-1.89) OPT -0.411 0.426 (-0.44) (0.46) Observations 478 478 Log-likelihood value -297.289 -297.289

37
PANEL B: Wedge and family-controlled firms Base outcome: DDIV=0 and DREP=1 Alternative outcomes:
DDIV=1 and DREP=0 DDIV=1 and DREP=1 Independent variables: WEDGE 0.182 *** 0.154 ** (2.82) (2.43) FAMILY -17.649 *** -15.964 *** (-9.76) (-11.52) OI 62.299 *** 64.92 *** (4.14) (4.39) NOI 61.023 *** 61.231 *** (4.29) (4.27) MB 0.275 0.163 (0.51) (0.29) TA -0.473 -0.308 (-1.64) (-1.04) LEV 1.891 1.917 (1.15) (1.12) VAR -481.23 -1,660.812 * (-0.63) (-1.81) OPT -0.492 0.326 (-0.51) (0.35) Observations 478 478 Log-likelihood value -292.073 -292.073 * significant at 10%; ** significant at 5%; *** significant at 1%.

38
Table V Tobit models: The controlling shareholder’s cash flow rights, the wedge between the controlling shareholder’s control and cash flow rights, and family-controlled vs. non-family-controlled firms
This table reports the estimates for eight Tobit regressions (four in Panel A and four in Panel B) of the dependent variables PAYOUT, DIV, REP, and %DIV on several independent variables. The regressions are run on samples of firm-years (fiscal years) belonging to firms with controlling shareholders. The sample period is 1999-2004. The data necessary to build the variables is obtained from Thomson Datastream, Worldcope, firms’ annual reports, Consob’s website, the database Factiva, and the World Wide Web. For a particular firm-year, DIV (REP) is the ratio between the cash distributed by the firm in the year through dividend payments (repurchases) multiplied by 100 and the firm’s market capitalization at the end of the previous year. PAYOUT is the sum between DIV and REP, and %DIV is computed dividing the product between DIV and 100 by PAYOUT. ORIGHTS is the fraction of the firm’s cash flow rights held by the controlling shareholder (i.e. the shareholder with the largest control stake above 20%). WEDGE is the difference between the fraction of the firm’s control rights possessed by the controlling shareholder and ORIGHTS. The binary variable FAMILY is set to one if the firm is controlled by a family. These ownership variables are constructed based on the latest available information before the start of the fiscal year. For a particular firm-year, the variables OI, NOI, MB, TA, and LEV are computed using information as of the end of the previous fiscal year. TA is the book value of total assets. OI and NOI are operating and non-operating income respectively scaled by TA. MB is the sum of market capitalization and total debt divided by TA. LEV is the ratio between total debt and the sum of market capitalization and total debt. VAR is the sample variance of the daily log-returns in the previous fiscal year. If, in the current fiscal year, there are ongoing stock option and/or stock grant plans for managers and directors, OPT is set to one; otherwise, it is equal to zero. Both year and industry dummies are included among the independent variables; however, results for these dummies are not reported. For each independent variable, the table shows the coefficient estimate, the t-statistic robust to heteroscedasticity and within-firm correlation (in parentheses), and the marginal effect (in brackets). When the independent variable is a dummy, the marginal effect is for a discrete change in the variable from zero to one. The table also reports the number of observations and the value of the log-likelihood function for every regression. PANEL A: Cash flow rights and family-controlled firms Dependent variables:
PAYOUT DIV REP %DIV Independent variables: ORIGHTS -0.0008 -0.011 0.02 ** -0.649 *** (-0.08) (-1.22) (2.52) (-2.99) [-0.005] [-0.007] [0.004] [-0.22] FAMILY -1.351 ** -1.65 ** 1.592 *** -41.573 *** (-2.13) (-2.54) (3.11) (-3.06) [-0.937] [-1.065] [0.263] [-11.209] OI 25.28 *** 29.858 *** 6.269 * 399.68 *** (5.38) (5.25) (1.87) (2.72) [16.533] [17.702] [1.366] [135.219] NOI 22.706 *** 27.704 *** 0.612 431.054 *** (4.58) (4.65) (0.23) (2.68) [14.849] [16.425] [0.133] [145.833] MB -0.468 -0.416 -0.27 0.151 (-1.62) (-1.43) (-1.41) (0.04) [-0.306] [-0.247] [-0.059] [0.051] TA 0.127 0.202 0.04 -1.749 (0.71) (1.15) (0.34) (-0.58) [0.083] [0.12] [0.009] [-0.592] LEV -1.219 -0.7 -0.649 16.006 (-0.93) (-0.56) (-0.7) (0.66) [-0.797] [-0.415] [-0.141] [5.415] VAR -3,090.729 *** -3,117.176 *** -1,368.058 ** 10.410.52 (-4.15) (-3.72) (-2.47) (0.73) [-2,021.245] [-1,848.096] [-298.156] [3,522.067] OPT 0.977 * 0.525 1.212 *** -22.539 ** (1.84) (1.01) (2.79) (-2.57) [0.664] [0.319] [0.321] [-8.329] Observations 630 630 630 478 Log-likelihood value -1,386.997 -1,031.369 -582.682 -1,043.682

39
PANEL B: Wedge and family-controlled firms Dependent variables:
PAYOUT DIV REP %DIV Independent variables: WEDGE 0.009 0.026 -0.039 *** 1.459 *** (0.54) (1.61) (-2.71) (3.6) [0.006] [0.015] [-0.008] [0.487] FAMILY -1.342 ** -1.666 ** 1.723 *** -45.346 *** (-2.12) (-2.56) (3.46) (-3.63) [-0.929] [-1.075] [0.278] [-11.779] OI 25.274 *** 29.572 *** 6.349 * 398.956 *** (5.4) (5.24) (1.85) (2.7) [16.521] [17.512] [1.376] [133.207] NOI 22.695 ** 27.444 *** 1.435 422.441 *** (4.57) (4.63) (0.52) (2.74) [14.835] [16.252] [0.311] [141.048] MB -0.458 -0.384 -0.334 1.611 (-1.59) (-1.35) (-1.64) (0.4) [-0.299] [-0.227] [-0.072] [0.538] TA 0.121 0.203 0.055 -2.321 (0.69) (1.2) (0.44) (-0.77) [0.079] [0.12] [0.012] [-0.775] LEV -1.194 -0.722 -0.646 14.129 (-0.91) (-0.59) (-0.69) (0.61) [-0.78] [-0.428] [-0.14] [4.717] VAR -3,105.511 *** -3,144.974 *** -1,412.046 ** 10,166.54 (-4.16) (-3.74) (-2.6) (0.72) [-2,030.02] [-1,862.401] [-306.058] [3,394.49] OPT 0.962 * 0.543 1.171 *** -21.437 ** (1.81) (1.03) (2.73) (-2.4) [0.653] [0.33] [0.307] [-7.799] Observations 630 630 630 478 Log-likelihood value -1,386.847 -1,300.845 -582.926 -1,041.461 * significant at 10%; ** significant at 5%; *** significant at 1%.