Embed Size (px)
Citation preview

For many of us, eating requires little thought,
preparation or time thanks to modern food technologies. We can quickly nourish ourselves with fast food, frozen entrees and processed snacks that minimally disrupt our daily lives. We quickly feel the effect of a satisfied appetite, but less obvious are the environmental impacts of food and agriculture. Recent books such as Michael Pollan’s The Omnivore’s Dilemma raise questions about the potential for a better food system1. Further, the implications of global climate change raise concern about the carbon footprint of food. This factsheet will examine the most recent scientific assessments of food and climate systems to help clarify how we can make intuitive and climate-friendly food choices.
The flow of foodResearchers use the word foodshed to describe the inputs for growing, moving and storing food for a specific geographic area2. (The concept is similar to that of “watershed,” the region drained by a river or other body of water.) Figure 1 shows foodsheds in the upper Midwest region, including foodsheds for the Detroit, Grand Rapids and Chicago metropolitan areas. Economics (patterns of trade) and ecology (land used in the production and
transportation of food) both determine the range of these regions. Foodsheds highlight the flow of food from the farm to the dinner table3. The foodshed concept can help us imagine the global food system in which the food we eat comes from locations across the country and the world. Much of the energy that goes into foodsheds comes
from burning fossil fuels, which contributes to greenhouse gas emissions that can warm our planet.
The food system is multifacetedOur food system is a network of people, processes and technologies that work together to provide the food we eat. It often includes the farmer, processing plant, delivery truck, sales clerk, consumer and others in between4. All aspects of the food system have impacts on the environment. Scientists use life cycle assessment (LCA) to understand as much as possible about a food system’s environmental impacts5. For example, an LCA of sweet corn would take into account not only the energy used to manufacture the fertilizer used to grow the crop but also the environmental impact of that fertilizer on nearby watersheds. By analyzing the entire life cycle of food products, we can better see the connections between food and the environment. The next few pages will focus on the greenhouse gas emissions from food systems.
A Consumer’s Guide to
Local Food Systemsand Greenhouse Gases
E x t e n s i o n B u l l e t i n E 3 1 7 8 • N e w • J u n e 2 0 1 2
Marci Baranski, Kristin Babbie and Richard PirogArizona State University; James Madison College, Michigan State University;Center for Regional Food Systems, Michigan State University, respectively

A Consumer’s Guide to Local Food Systems and Greenhouse Gases
Greenhouse gas emissions and food systemsGreenhouse gas (GHG) emissions are produced in the growing, processing, packaging, transportation, sale and consumption of food. Three main greenhouse gases — carbon dioxide, methane and nitrous oxide — are emitted from processes in the food system, such as nitrous oxide release from the soil7. The persistence — how long the gas is active — and impact of these GHGs in the atmosphere
is called the global warming potential. Methane, which persists in the atmosphere for a shorter period than carbon dioxide but absorbs more heat, has a greater overall impact than carbon dioxide. Of the three gases, nitrous oxide has the highest global warming potential. A similar measure of global warming impact is the carbon footprint of food (also known as CO2e: carbon dioxide equivalent). A carbon footprint is the total amount of greenhouse gas emissions from a specific unit of food8.
Figure 1: This map shows a satellite photo and foodshed model of the upper Mississippi region. This foodshed model shows the amount of farmland needed to feed the major metropolitan areas on the map. The pink areas are urban areas, the yellow areas are part of the urban foodshed, and the green areas are prime farmland (figure from Schuble, Bowen and Martin,
20116 ).
2

A Consumer’s Guide to Local Food Systems and Greenhouse Gases
Food consumption accounts for about 15 percent of GHG emissions per person in the United States9. Within the food system are certain “hot spots” of GHG emissions that we can work to reduce10.
• Growing food: Agriculture alone — meaning all processes on the farm but not beyond it — creates about 6 percent of the total U.S. GHG emissions11. Though we can make educated estimates, the variety of food products and consumption in the United States makes it difficult to determine exact numbers on GHG emissions from agriculture. Production accounts for the majority of GHG emissions in agriculture, mostly from soil microbial processes and manure11. Burning fuel to power farm equipment emits carbon dioxide5. Fertilizer is a major source of nitrous oxide emissions, which escape from the soil into the atmosphere5.
• Transporting food to markets: The chain of transportation within the food system is called “food miles,” or the average distance that food travels from the farm to your fork. According to the Leopold Center, produce traveling to the upper Midwest from production centers across the continental United States travels an average of 1,500 miles12. Transportation of food accounts
for about 11 percent of the GHG emissions from the food system13. Experts suggest that technological and infrastructural changes could help reduce emissions from transportation14.
• From farm to fork: Food consumption is the second largest GHG impact of households15. The energy used for refrigeration results in one of the main GHG effects from food production. Some products require constant refrigeration as soon as they leave the farm. Wasted food also wastes the energy and subsequent GHG emissions used to produce it. Meat that is discarded in retail, industry and the home accounts for 20 percent of the total GHG emissions of meat production16. (Ways to reduce emissions from the home are discussed below.)
The relative GHG emissions from these three parts of the food system depend on the type of food. Livestock and meat production tend to have higher greenhouse gas emissions than plant-based production16 (Figure 2). A significant portion of the total emissions from plant-based proteins such as lentils and dry beans comes from cooking and storage in the home; however, as shown in Figure 2, the total emissions from lentils are approximately 1/30 those of beef on a per-kilogram basis.
Post farmgate emissions (includesprocessing, transport, retail, cooking,waste disposal)
Production emissions (includes all emissionsbefore product leaves the farm)
LambBeef
CheesePork
Farm
ed salm
onTurkey
Chicken
Canned tuna
Eggs
Potatoes
Rice
Peanut butte
rNuts
Yogurt
Brocc
oliTo
fu
Dry beans
Milk (2
%)
Tomato
es
Lentils
45
40
35
30
25
20
15
10
5
0
kg C
O2e
Kilogram (kg) of consumed food
39.2
27.0
13.512.1 11.9 10.9
6.96.1
4.82.9 2.7 2.5 2.3 2.2 2.0 2.0 2.0 1.9
1.1 0.9
Figure 2: This chart shows foods and their
GHG emissions based on data
for U.S. food production, energy
use and food imports (for lamb,
salmon and some cheese)16.
Most foods have the highest GHG
emissions during the production
phase, but some plant-based
foods have relatively higher
emissions from transportation,
cooking and waste. These
measurements are based on
the food weight (in kilograms,
based on the fresh weight for
vegetables and dry weight of
lentils and beans) and the amount
of emissions in carbon dioxide
equivalents (CO2e). (Figure
adapted with permission from
Hamerschlag, 201116.)
3
A Consumer’s Guide to Local Food Systems and Greenhouse Gases
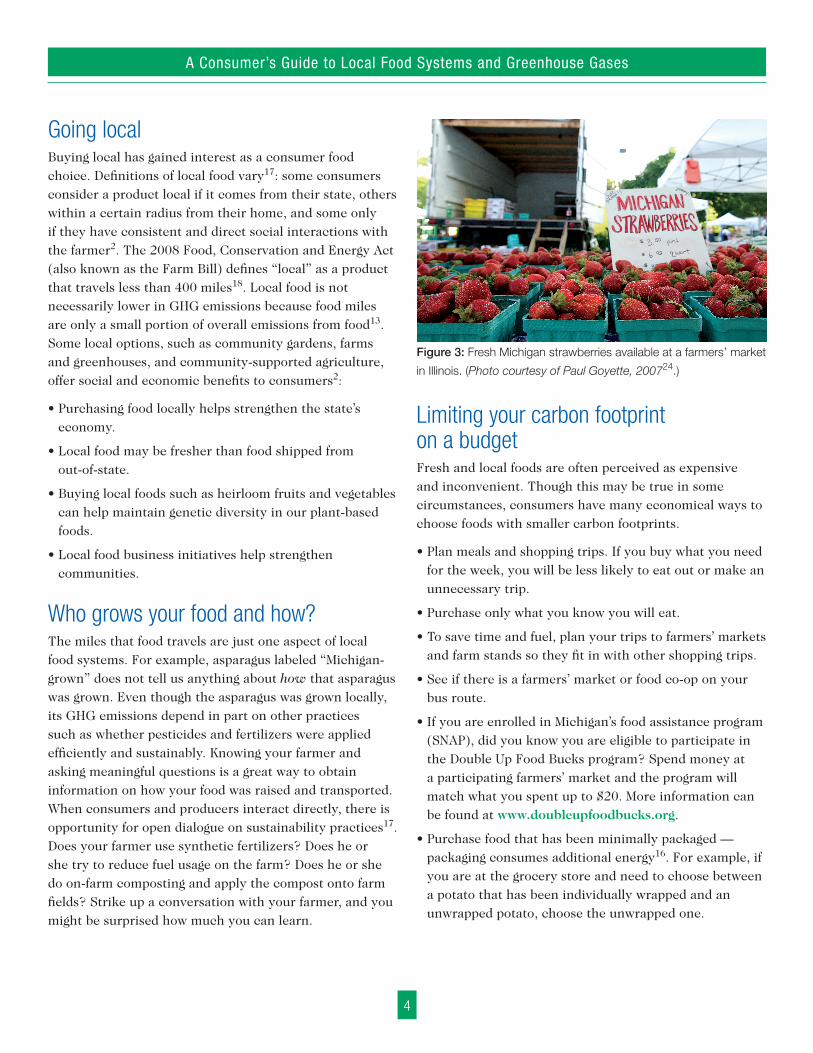
Going localBuying local has gained interest as a consumer food choice. Definitions of local food vary17: some consumers consider a product local if it comes from their state, others within a certain radius from their home, and some only if they have consistent and direct social interactions with the farmer2. The 2008 Food, Conservation and Energy Act (also known as the Farm Bill) defines “local” as a product that travels less than 400 miles18. Local food is not necessarily lower in GHG emissions because food miles are only a small portion of overall emissions from food13. Some local options, such as community gardens, farms and greenhouses, and community-supported agriculture, offer social and economic benefits to consumers2:
• Purchasing food locally helps strengthen the state’s economy.
• Local food may be fresher than food shipped from out-of-state.
• Buying local foods such as heirloom fruits and vegetables can help maintain genetic diversity in our plant-based foods.
• Local food business initiatives help strengthen communities.
Who grows your food and how?The miles that food travels are just one aspect of local food systems. For example, asparagus labeled “Michigan-grown” does not tell us anything about how that asparagus was grown. Even though the asparagus was grown locally, its GHG emissions depend in part on other practices such as whether pesticides and fertilizers were applied efficiently and sustainably. Knowing your farmer and asking meaningful questions is a great way to obtain information on how your food was raised and transported. When consumers and producers interact directly, there is opportunity for open dialogue on sustainability practices17. Does your farmer use synthetic fertilizers? Does he or she try to reduce fuel usage on the farm? Does he or she do on-farm composting and apply the compost onto farm fields? Strike up a conversation with your farmer, and you might be surprised how much you can learn.
Limiting your carbon footprint on a budgetFresh and local foods are often perceived as expensive and inconvenient. Though this may be true in some circumstances, consumers have many economical ways to choose foods with smaller carbon footprints.
• Plan meals and shopping trips. If you buy what you need for the week, you will be less likely to eat out or make an unnecessary trip.
• Purchase only what you know you will eat.
• To save time and fuel, plan your trips to farmers’ markets and farm stands so they fit in with other shopping trips.
• See if there is a farmers’ market or food co-op on your bus route.
• If you are enrolled in Michigan’s food assistance program (SNAP), did you know you are eligible to participate in the Double Up Food Bucks program? Spend money at a participating farmers’ market and the program will match what you spent up to $20. More information can be found at www.doubleupfoodbucks.org.
• Purchase food that has been minimally packaged — packaging consumes additional energy16. For example, if you are at the grocery store and need to choose between a potato that has been individually wrapped and an unwrapped potato, choose the unwrapped one.
Figure 3: Fresh Michigan strawberries available at a farmers’ market
in Illinois. (Photo courtesy of Paul Goyette, 200724.)
4

A Consumer’s Guide to Local Food Systems and Greenhouse Gases
5
• Reduce, reuse and recycle food packaging.
• Limit your consumption of out-of-season produce. Wait for summer to enjoy those Michigan-grown strawberries! Instead, take a bite of a fresh peach or pear during the fall or an apple during the winter.
• Learn to cook and prepare dry beans and lentils. These foods are relatively inexpensive and high in nutrients.
• Eat more raw foods or foods that haven’t been processed to reduce energy use. Uncooked and unprocessed foods such as fruits and vegetables can be less expensive per serving than processed foods19.
• Cook for multiple people or make several servings of food at once. Leftovers are convenient and save energy!
• If you have open yard space, consider composting your food scraps and using the compost to start or improve a garden.
• Backyard gardeners and residents with lawns should be aware of the environmental impact of fertilizer and apply it properly.
• Consider splitting a community-supported agriculture (CSA) share with a friend or family member. To become a member of a CSA, you will pay one price at the beginning of the season and in return receive a weekly share of fresh produce from your farmer.
• Some local farms and greenhouses offer work-share programs where individuals exchange a few hours of labor a week for a CSA share. For those living near a farm, this a great option to get your hands dirty each week while receiving fresh food at no monetary cost.
• Major lifestyle changes, such as eating a healthy, balanced diet high in fruits and vegetables and whole grains20 and eating the minimum number of calories that your lifestyle requires, may have a greater overall impact on GHG emissions than other consumer decisions13,14.
Challenges to accessing sustainable local foodLocal and fresh food has become more widespread over the past decade, but many people still do not have access to these options. “Food desert” is a term used to describe an area that lacks grocery stores, farmers’ markets, CSA membership or other fresh food sources21. For people
living in food deserts, food options are very limited. A 2006 study on the impact of food deserts on public health in Chicago found a direct link between food deserts and significant health problems21. Access to sustainable, healthy food is not just an environmental issue but a public health issue as well. Community organizations have recently worked to expand food choices in these areas. For example, some gas stations and convenience stores have started to carry fruits and vegetables. Organizations in Detroit have collaborated to initiate the Detroit Food Justice Task Force to address food justice issues22. “Farm-to-school” programs connect K-12 schools with local farms to bring healthy lunch options to students23. You can get involved at the grass-roots level by contacting your local MSU Extension office or farm-to-school coordinator, or having conversations with community members and finding organizations working on food issues.
As the effects of climate change challenge our planet, it is crucial to reduce our collective environmental impact. Following the suggestions above and purchasing sustainably grown local food may help reduce your greenhouse gas emissions while supporting Michigan’s economy.
Online resources for finding local food sourcesThere are a number of ways to purchase fresh food while supporting your local economy. The following resources are useful tools for locating farmers in your area:
• www.LocalHarvest.org Local Harvest is an advanced search tool that allows you to locate sustainably grown food in your area.
• http://search.ams.usda.gov/farmersmarkets/ The U.S. Department of Agriculture maintains a database of farmers’ markets across the country where you can search for nearby farmers’ markets.
• www.mifma.org/find-a-farmers-market The Michigan Farmers Market Association allows users to search for farmers’ markets in their area by city, county or day of the week that markets are held.

A Consumer’s Guide to Local Food Systems and Greenhouse Gases
6
• www.michiganfarmfun.com The Michigan Farm Marketing & Agri-Tourism Association and Farm Bureau Insurance of Michigan produce an annual directory of agricultural offerings statewide. Visit the Web site to access the most recent directory.
This factsheet was reviewed by Laura DeLind, PhD and Philip Howard, PhD. Publication of this factsheet was supported by GISER, Graduates in Integrative Society and Environment Research, at Arizona State University.
References 1 Pollan, M. 2006. The Omnivore’s Dilemma. New York:
Penguin Press. 2 Peters, C.J., N.L. Bills, J.L. Wilkins and G.W. Fick. 2008.
Foodshed analysis and its relevance to sustainability. Renewable Agriculture and Food Systems 24:1-7.
3 Kloppenburg, J., Jr, J. Hendrickson and G.W. Stevenson. 1996. Coming in to the foodshed. Agriculture and Human Values 13:33-42.
4 Center for Sustainable Systems. 2010. U.S. Food System. Available at http://css.snre.umich.edu/css_doc/CSS01-06.pdf.
5 USDA. 2010. Energy Use in the U.S. Food System. Available at www.ers.usda.gov/publications/err94/.
6 Schuble, T.J., E.E. Bowen and P.A. Martin. 2011. Modeling the relationship between food, energy, and environmental impacts. Available at www.esri.com/news/arcuser/0911/making-connections.html.
7 IPCC. 2007. Climate Change 2007: Synthesis Report. Contribution of Working Groups I, II and III to the Fourth Assessment Report of the Intergovernmental Panel on Climate Change [R.K. Pachauri and A. Reisinger (eds.)]. Geneva, Switzerland: IPCC.
8 Hillier, J., et al. 2009. The carbon footprints of food crop production. International Journal of Agricultural Sustainability 7:107-18.
9 Kim, B., and R. Neff. 2009. Measurement and communication of greenhouse gas emissions from U.S. food consumption via carbon calculators. Ecological Economics 69:186-96.
10 Brodt, S. 2008. The Low Carbon Diet: Reducing Energy Intensity and Greenhouse Gas Emissions in the Food System Using a Life Cycle Assessment Approach. Available at http://asi.ucdavis.edu/sarep/sfr/lifecycleassessments/files/Brodt-_Low_Carbon_Diet_-_Reducing_Energy_GHG_in_Food_Sys.pdf.
11 EPA. 2011. 2011 U.S. Greenhouse Gas Inventory Report. Available at http://epa.gov/climatechange/emissions/usinventoryreport.html.
12 Leopold Center for Sustainable Agriculture. 2001. Food, Fuel, and Freeways. Available at www.leopold.iastate.edu/pubs/staff/ppp/food_mil.pdf.
13 Weber, C., and H.S. Matthews. 2008. Food-miles and the relative climate impacts of food choices in the United States. Environmental Science & Technology 42:3508-13.
14 Garnett, T. 2011. Where are the best opportunities for reducing greenhouse gas emissions in the food system (including the food chain)? Food Policy 36:S23-32.
15 California Energy Commission. 2009. Assessment of household carbon footprint reduction potentials. Available at www.osti.gov/bridge/purl.cover.jsp?purl=/971193-pu1xa5/.
16 Hamerschlag, K. 2011. Meat eater’s guide to climate change and health. Environmental Working Group. Available at www.ewg.org/meateatersguide/.
17 Hinrichs, C. 2003. The practice and politics of food system localization. Journal of Rural Studies 19:33-45.
18 Farm Bill. 2008. Available at www.usda.gov/documents/Bill_6124.pdf.
19 USDA. 2012. Are healthy foods really more expensive? Available at www.ers.usda.gov/Publications/EIB96/EIB96.pdf.
20 Baroni, L., L. Cenci, M. Tettamanti and M. Berati. 2006. Evaluating the environmental impact of various dietary patterns combined with different food production systems. European Journal of Clinical Nutrition 1-8.
21 Mari Gallagher Research & Consulting Group. 2006. Examining the Impact of Food Deserts on Public Health in Chicago. Available at www.marigallagher.com/site_media/dynamic/project_files/4_Chi-FindingsOnly.pdf.
22 Detroit Food Justice — www.detroitfoodjustice.org/.23 National Farm to School Network — www.farmtoschool.org/
aboutus.php.24 Goyette, P. 2007. Michigan strawberries. Available at
www.flickr.com/photos/pgoyette/529732759/in/photostream/.
MSU is an affirmative-action, equal-opportunity employer, committed to achieving excellence through a diverse workforce and inclusive culture that encourages all people to reach their full potential. Michigan State University Extension programs and materials are open to all without regard to race, color, national origin, gender, gender identity, religion, age, height, weight, disability, political beliefs, sexual orientation, marital status, family status or veteran status. Issued in furtherance of MSU Extension work, acts of May 8 and June 30, 1914, in cooperation with the U.S. Department of Agriculture. Thomas G. Coon, Director, MSU Extension, East Lansing, MI 48824. This information is for educational purposes only. Reference to commercial products or trade names does not imply endorsement by MSU Exten-sion or bias against those not mentioned.