Embed Size (px)
Citation preview

EXTENT AND IMPACT OF GULLY EROSION IN A WATERSHED IN THE SUB
HUMID ETHIOPIAN HIGHLANDS
A Dissertation
Presented to the Faculty of the Graduate School
of Cornell University
in Partial Fulfillment of the Requirements for the Degree of
Doctor of Philosophy
by
Assefa Derebe Zegeye
January 2017

©2017 Assefa Derebe Zegeye

EXTENT AND IMPACT OF GULLY EROSION IN A WATERSHED IN THE SUB
HUMID ETHIOPIAN HIGHLANDS
Assefa Derebe Zegeye, Ph.D.
Cornell University 2017
Gully erosion is rampant in the Ethiopian highlands leading to high sediment loads in
rivers. While gully expansion and rehabilitation have been researched in the semi-arid
regions of Ethiopia, few studies have been conducted in the more humid regions. The
objective of this dissertation is, therefore, to quantify the gully erosion and its impact
and to identify factors controlling this erosion in the highland regions where rainfall
exceeds potential evaporation in the monsoon rain phase. The study was carried out in
the 608 ha Debre Mawi watershed, 30km south of Lake Tana, where gullies are rapidly
expanding.
This dissertation is composed of five chapters. Chapter one sets the context. Chapter
two reports on the rate of gully expansion and the associated sediment loss. The results
show that an equivalent amount of 127 t ha-1 yr-1 of soil was lost between 2005 and 2013
due to expanding gullies. The net gully area in the entire watershed increased from 4.5
ha (0.7%) in 2005 to 20.4 ha (3.4%) in 2013. Collapse of gully banks and retreat of
headcuts was most severe in locations where elevated groundwater tables saturated the
gully heads and bank soils. Chapter 3 reports on the measurements of discharge and
sediment concentrations at the upstream and downstream of one of the gullies in the
watershed. The result shows that about 92% of the total sediment was carried off by the

runoff originated within the gully indicating that the control of upland erosion is
ineffective when gullies are present downstream.
Finally, in the fourth chapter the suitability of plant species is investigated for stabilizing
shallow gullies. Root systems of 26 indigenous and exotic plant species from grasses,
shrubs and trees were excavated and then used to determine their root tensile strength
and density. We found that grasses have comparative advantages over shrubs and trees
in stabilizing shallow gully banks due to their fibrous root system.
These investigations fill in some of the gaps in knowledge of this extreme form of land
degradation in the Ethiopian highlands and begin to provide viable options for further
research and investment in management strategies.

iii
BIOGRAPHICAL SKETCH
Assefa Derebe Zegeye was born in 1980 in the Amhara Regional State, North Achefer District,
Ethiopia. After he completed high school at Bahir Dar Tana Haik Comprehensive Secondary
School, he joined Gondar Teachers’ college in 1998 and received a diploma in the field of
mathematics in 1990. He also received a bachelor of education in Mathematics in 2006 from
Bahir Dar University. He served in teaching and leading different governmental schools and
offices for more than 8 years. After he received a master of professional science (MPS) in the
field of watershed management and hydrology from Cornell University, hosted at Bahir Dar
University in May 2009, he has been employed by the Amhara Regional Agricultural Research
Institute (ARARI) as soil and water management researcher since June 2009 until his PhD leave
in 2012. Assefa served as a research center director at Adet Agricultural Research Center
(AARC) for one year before his PhD leave of study at Cornell University, in August 2012. He
is married and has three children (two daughters and a boy). His research interest is soil and
water conservation, hydrological modeling and related fields.

iv
This work is dedicated for those who were killed in 2016 for the liberty of Ethiopia

v
ACKNOWLEDGEMENTS
Above all, always and forever I thank GOD with his beloved mother, St. Mary, for giving me
strength and patience during my course and field work. Then my thanks goes to the Soil and
Crop Sciences Section of the School of Integrative Plant Science and the College of Agriculture
and Life Sciences for their support to study at Cornell. Additionally, I thank Cornell University
for allowing me to study my PhD where I obtained ample of experiences from the renowned
professors, researchers, and the Cornell community in general.
I would like to express my deepest gratitude to my major advisor professor Tammo S. Steenhuis,
for his unreserved help in supervision, guidance, intellectual encouragement, patience and
critical and constructive comments during the four years of study. I have also the utmost respect
and gratitude towards my committee members Prof. Harold M. van Es and Prof. William Philpot
who provided me with instruction through courses and critical comments for my PhD research.
In addition, I have to say thank you to Profs. Todd Walter, Martin Wells and Rebecca Schneider
for their interesting and very helpful teaching approach. My appreciation extends to Dr. Eddy
J. Langendoen, a researcher at the US, Department of Agriculture, Oxford, MS. He has taught
me many things and has offered me a great deal of constructive feedback, as well as valuable
and very critical comments on the research outputs. His intellectual encouragements and help
are unforgettable. A special expression of gratitude goes also to Karl J. Niklas, professor of
plant biology at Cornell University who provided me with good insight on how to work with
plant root analysis in the field and laboratory. Dr. Wolde Mekuria’s contributions for this
dissertation were very significant in commenting, writing, and editing the papers. I have a
special respect and appreciation for him. I have to give a special appreciation to Tigist Yazie,
Semagn Asredie and Haimanote Kebede who facilitate my arrival and my living in Ithaca during
the first year of my study. Soil and Water Lab colleagues at Cornell and my colleagues at Bahir

vi
Dar University were so friendly and very helpful and understanding. I have had an enjoyable
time with you during the entire study program. Seifu Admassu, Christian Guzman, Cathelijne
Stoof, Wondimu Bayu, Birru Yitaferu, Tadele Amare, Tesfaye Feyisa and Mengistu Muche
have also played a special role in the completion of this study. I greatly thank all my field
assistants at Debre Mawi and their coordinator Mr. Debeb who were curious in collecting data
in the field. This gratitude is extended to all of the farmers in the community who helped and
allowed for the study to take place on their fields, providing lodging and time graciously.
Finally, yet importantly, I appreciate the endeavor and courage of my wife Haimanot Amare,
my mother-in-law, Alem Gobezie, and my younger brother Kefale Derebe and the rest of my
family. A special love I receive from my kids: Meklit Assefa, Yohannes (John) Assefa and
Bisrat Assefa, was a strength for me during the challenges I was facing during my study. I am
extremely happy to have such a family.
vii
TABLE OF CONTENTS
BIOGRAPHICAL SKETCH ...................................................................................................... iii
ACKNOWLEDGEMENTS ........................................................................................................ v
TABLE OF CONTENTS .......................................................................................................... vii
LIST OF FIGURES .................................................................................................................... ix
LIST OF TABLES ..................................................................................................................... xi
CHAPTER 1 ............................................................................................................................... 1
INTRODUCTION ...................................................................................................................... 1
REFERENCES ....................................................................................................................... 4
CHAPTER 2 ............................................................................................................................... 8
MORPHOLOGICAL DYNAMICS OF GULLY SYSTEMS IN THE SUBHUMID
ETHIOPIAN HIGHLANDS: THE DEBRE MAWI WATERSHED ........................................ 8
Abstract .................................................................................................................................. 8
2.1 Introduction ................................................................................................................ 9
2.2 Materials and Methods ............................................................................................. 13
2.3 Results ...................................................................................................................... 25
2.4 Discussion ................................................................................................................ 37
2.5 Conclusions .............................................................................................................. 46
REFERENCES ..................................................................................................................... 48
CHAPTER 3 ............................................................................................................................. 55
SOIL LOSS FROM A GULLY IN THE SUB-HUMID ETHIOPIAN HIGHLANDS: THE
DEBRE MAWI WATERSHED ............................................................................................... 55
Abstract ................................................................................................................................ 55
3.1 Introduction .............................................................................................................. 56
3.2 Materials and methods.............................................................................................. 58
3.3 Results ...................................................................................................................... 68
3.4 Discussion ................................................................................................................ 76
3.5 Conclusion ................................................................................................................ 84
REFERENCES ..................................................................................................................... 85
CHAPTER 4 ............................................................................................................................. 93

viii
RIPROOT MODEL TO ESTIMATE THE MECHANICAL REINFORCEMENT OF
ETHIOPIAN HIGHLAND PLANT ROOTS TO GULLY BANK STABILITY .................... 93
Abstract ................................................................................................................................ 93
4.1 Introduction .............................................................................................................. 94
4.2 Materials and methods ............................................................................................... 96
4.3 Results .................................................................................................................... 105
4.4 Discussion .............................................................................................................. 112
4.5 Conclusions ............................................................................................................ 117
REFERENCES ................................................................................................................... 119
CHAPTER 5 ........................................................................................................................... 131
CONCLUSION ...................................................................................................................... 131
REFERENCES ................................................................................................................... 134
APPENDIX A: CHAPTER TWO .......................................................................................... 135
Appendix A1:Development of gully erosion ..................................................................... 135
Appendix A2: Field visits and Lab analysis ....................................................................... 137
Appendix A3: Gully characterization data ......................................................................... 138
APPENDIX B: CHAPTER THREE ...................................................................................... 144
Appendix B1: Discharge and sediment measurement ........................................................ 144
Appendix B2 peak events with the associated hysteresis loops ......................................... 148
Appendix B3 Gully headcut treatment ............................................................................... 157
APPENDIX C: CHAPTER FOUR ......................................................................................... 158
Appendix C1: Tensile strength tester ................................................................................. 158
Appendix C2 Root tensile strength testing results for 7 grass species ............................... 158
Appendix C3 Root tensile strength testing results for 10 tree species ............................... 168
Appendix C3 Root tensile strength testing results for 9 shrubs species ............................. 181
Appendix C4: Root fiber pictures ...................................................................................... 193

ix
LIST OF FIGURES
Figure 2.1. Examples of gully expansion controlled by (a, b) bank geometry (height
and slope), (c) tension cracks, (d) landslide, (e) soil pipes and (f) saturated Vertisols
(gully development on conservation ditches, narrow ditch upstream of gully headcut)
in the subhumid Debre Mawi (a,b,d, and f), Mota (c) and Geregera (e) watersheds
(pictures taken in 2013). ............................................................................................... 11
Figure 2.2. Location of the Debre Mawi watershed within the Blue Nile River basin,
Ethiopia (top figures). The watershed map (bottom) shows the contour lines, elevation,
stream lines, and the 13 studied gullies (indicated by the labels beginning with the
letter G). Projected coordinate system: WGS_1984_UTM_Zone_37N ....................... 15
Figure 2.3. (a) Cross section segmentation methodology to determine the cross-
sectional area of the gullies. (b) Measured profiles of a cross section located on gully
G6 during the 2013 rain phase, showing the lateral and downward expansion of the
gully. ............................................................................................................................. 18
Figure 2.4. The relationship between gully formation locations and topographic
wetness index (TWI), and gully expansion rate between (a) 2005 and (b) 2013 in the
Debre Mawi watershed, Ethiopia. Lines represent gully edges digitized from aerial
imagery. ........................................................................................................................ 25
Figure 2.5. The observed expansion of the 13 study gullies in the Debre Mawi
watershed (see Figure 2.2 for gully location): (a) cumulative headcut retreat and
rainfall during the 2013 rain phase, (b) increase in gully surface area and volume
during the 2013 and 2014 rain phases, and (c) increase in the combined gully surface
area and the total summer rainfall (RF) between 2011 and 2014. .............................. 29
Figure 2.6. Fitting a linear (a) and a power-type (b) relationships between both the
linear (L) and volumetric (V) gully retreat and drainage area (DA) of the 13 gullies. 34
Figure 2.7. Comparison of minimum groundwater table depth, gully headcut depth,
and the average groundwater table fluctuation between morning and night for the 13
study gullies in the Debre Mawi watershed, Ethiopia for the 2013 rain phase. .......... 36
Figure 2.8. Examples of gully expansion in the Debre Mawi watershed. Top four
photos: expansion of gullies G8 and G11 during the 2013 rain phase and the trees
which fell in to the gullies from upstream, Bottom image: expansion of gullies G6 and
G11 between 2005 and 2013. ....................................................................................... 43
Figure 3.1. (a) the small rectangle in the basin is where Debre Mawi found, (b) gully
networks in the Debre Mawi watershed, the deep black shows the study gully shown in
c, (c) the expansion of the study gully between 2005 and 2013 (Zegeye et al., 2016),
(d) the study gully looking downstream ........................................................................ 60
Figure 3.2. Measured profiles of a cross-section, showing the lateral and downward
expansion of the gully and the longitudinal retreat (the broken line) of the gully
between 28 June to 18 Sep 2013 ................................................................................... 63
x
Figure 3.3. Gully headcut treatment started in May 2014, in the Debre-Mawi
watershed. Pictures under group (a) show the gully before treatment, (b) the action of
regrading, (c) the planting of vegetation, and (d) the success and challenge of gully
treatment. ...................................................................................................................... 67
Figure 3.4. Number of peak events and the associated number of hysteresis loops.
(Left) Shows the number of times that the peak SSC (suspended sediment
concentration; g L-1) occurred either at the rising or the falling limb of the
hydrograph, (right) shows the number of hysteresis loops depending the sediment
dynamics at the inlet and outlet, Q stands for discharge (L s-1). .................................. 72
Figure 3.5. (a, b) the 10 minute instantaneous suspended sediment concentration (SSC
in g L-1; y-axis) versus discharge flow rate (q in L s−1; x-axis), (c, d)-the peak events of
SSC versus peak discharge flow rate, and (e, f)-the total daily sediment load (L in t; y-
axis) versus discharge (Q in m3; x-axis) ....................................................................... 78
Figure 3.6. The peak suspended sediment concentration (SSC; g L-1) and the event
rainfall (P; mm) as a function of time .......................................................................... 79
Figure 3.7. Examples of hysteresis loops occurred on six event days at the inlet and
outlet of the gully in the Debre Mawi watershed on both years (2013-2014), SSC
stands for suspended sediment concentration (g L-1) ................................................... 81
Figure 4.1. Location of Debre Mawi watershed in north western Ethiopia and its land
use in 2014 .................................................................................................................... 99
Figure 4.2. Examples illustrating the excavation of plant roots under the vertical
projection of the above ground biomass, the rope and the stick shows the diameter of
the excavated soil under the projection, (a) S.rhombiflia (shrub), (b and c)
A.decurrens (tree) (d) C.palmensis (tree) , (e) H.dregeana (grass) ........................... 101
Figure 4.3. Fifteen plant species roots out of 26 selected plants. .............................. 104
Figure 4.4. Root tensile strength (Tr, MPa) plotted against root diameter (D, mm) for
roots of 26 exotic and indigenous plant species of Ethiopia. The left side represents
the measured tensile strength whereas the right side represents the predicted tensile
strength values listed in Table 4.1. ............................................................................. 108
Figure 4.5. Root cohesion values (Cr) as a function of soil depth for 26 plant species
.................................................................................................................................... 111
Figure 4.6. Relationships between soil cohesion (Cr) and volumetric root ratio (RVR)
and root tensile strength (Tr) ..................................................................................... 113
Figure 4.7. Average cohesion (Cr) of three plant types as a function of soil depth ... 117

xi
LIST OF TABLES
Table 2.1. The combined length, area and volume of the total gully network in the 608
ha Debre Mawi watershed obtained from satellite imagery in 2005 and 2013. ......... 26
Table 2.2. Increase in surface area and corresponding soil loss of the 13 gullies in the
Debre Mawi watershed in the period between 2005 and 2014. Surface area up to
March 2013 was obtained by digitizing the gully edges on aerial imagery and the next
two rain phases by manual measurement.. ................................................................... 30
Table 2.3. List of soil and gully topographic factors for the 13 study gully heads in the
Debre Mawi watershed, as well as observed gully head erosion during the 2013 and
2014 rain phases (between July and September). ........................................................ 32
Table 2.4. Power-type and linear regression equations of the longitudinal headcut
retreat, L, and the volumetric gully expansion, V, with the controlling factors, X, listed
in the first column: L or V = aXb. . ............................................................................... 37
Table 2.5. Relations of the volumetric gully headcut erosion (V) with the headward
migration length (L) and the lateral erosion (W) during the 2013 rain phase for the 13
gullies in the Debre Mawi watershed ........................................................................... 40
Table 3.1. Characteristics of a gully, from outlet to the upstream largest headcut
which is 80 m downstream of the inlet weir, in the Debre-Mawi watershed to show the
headcut retreat. ............................................................................................................. 68
Table 3.2. The minimum and maximum ranges of peak events in 2013 and 2014
monsoon seasons in the Debre Mawi watershed. ......................................................... 71
Table 3.3. The runoff, sediment load (SL), and average suspended sediment
concentration (SSC) for both storm and base flows at the inlet and outlet of the gully
for 2013 and 2014 rain phases. .................................................................................... 72
Table 3.4. Examples of peak events in 2013 and 2014 rain phases with the associated
hysteresis loops at the inlet and outlet of the gully in the Debre Mawi watershed ...... 75
Table 4.1. The added cohesion (Cr) values for 26 plant species based on RipRoot
model, Tr stands for tensile strength of roots, RVR is root volume ratio, a, b and R2
are values for the power relationships ....................................................................... 109

1
CHAPTER 1
INTRODUCTION
Soil erosion caused by water is one of the most important land degradation processes
worldwide. Gully erosion is one of the most damaging forms of soil erosion which can
be expressed interms of onsite effects such as reduction of land productivity, destruction
of property and natural habitats and offsite effects such as sedimentation of reservoirs
and rivers which call for immediate solution (Bradford et al., 1973; Poesen et al., 1996;
Poesen et al., 2003; Avni, 2005; Haregeweyn et al., 2006; Nyssen et al., 2006; Tamene
et al., 2006; Fleitmann et al., 2007; Zema et al., 2012; Haregeweyn et al., 2013; Wang
and Shao, 2013; Zhao et al., 2013; Borrelli et al., 2014; Ayele et al., 2015; Gessesse et
al., 2015; Kou et al., 2015).
Gullies are also effective links for transferring runoff and sediment from uplands to
valley bottoms and permanent channels, where they aggravate offsite effects of water
erosion. It has been recognized that gully erosion is an important sediment source,
contributing up to 90% of the total annual sediment yield from a watershed (Vandaele
and Poesen, 1995; Poesen et al., 1996; Nyssen et al., 2001; Poesen et al., 2003; Nyssen
et al., 2004; Simon and Rinaldi, 2006; Simon et al., 2008; Zegeye et al., 2014). This has
threatened the life time of downstream reservoirs and has seriously affected the
livelihood and well-being of rural communities that rely on them for drinking water,
small-scale irrigation or fisheries.

2
Many reasons are given in the literature for gully formation and expansion. Capra et al.
(2009) and Campo‐Bescós et al. (2013) reported that heavy rains result in a rapid mass
movement in the gullies by undercutting the banks (Muñoz-Robles et al., 2010;
Lanckriet et al., 2015). Similarly, gully formation may be initiated with the occurrence
of convergent shallow subsurface flow that leads to seepage-induced erosion of surface
soils, gully heads and sidewalls (Tebebu et al., 2010; Tilahun et al., 2013; Vanmaercke
et al., 2016). Soil properties and soil types can also play a role in gully formation and
expansion (Valentin et al., 2005; Frankl et al., 2014). Similarly, in pasture bottom lands,
piping has been mentioned as the reason for the development of permanent gullies
(Valentin et al., 2005; Zegeye et al., 2014). Finally, the extent of the drainage area at
the gully head has been linked with the severity of gully erosion (Nyssen et al., 2002;
Vandekerckhove et al., 2003; Frankl et al., 2012; Frankl et al., 2013; Vanmaercke et al.,
2016).
Although gully erosion is a common feature throughout the Ethiopian Highlands, most
gully erosion studies in Ethiopia have been carried out in the semi-arid Tigray region,
northern Ethiopia (e.g., Nyssen et al., 2006; Tamene et al., 2006; Frankl et al., 2012;
Frankl et al., 2013). Conservation structures that are effective in preventing gullying by
overland flow in semi-arid regions (Nyssen et al., 2004; Nyssen et al., 2006), may not
be effective in the humid Ethiopian highlands regions where interflow elevates
groundwater tables in the valley bottom promoting gully formation and expansion
(Tebebu et al., 2010; Dagnew et al., 2015). Any gully rehabilitation practices that do
not try to deal with the actual gully formation mechanics, including lack of maintenance

3
of the installed erosion control structures, are doomed to fail. The Ethiopian landscape
is a living example. Failed structures can be found in almost every gully where repairs
were attempted. Trees planted on the bank are now in the gullies. A diversion structure
in the Debre Mewi watershed to treat gullies formed a new gully following the diversion
(Zegeye et al., 2014). In addition, quantitative information on the effectiveness of gully
bank treatments is rarely available. Therefore, it is important to have a better
understanding of gully erosion processes to propose appropriate protective measures
In this dissertation, gully erosion processes and factors controlling these processes and
the severity of gully erosion in the Debre Mawi sub-humid watershed is presented in
chapter 2. The sediment contribution of gullies is quantified by studying the sediment
budget and sediment dynamics in a small catchment (17 ha) consisting of one large gully
in the Debre Mawi watershed as shown in chapter 3. The investigation of plant root
systems for stabilizing shallow gullies is presented in chapter 4. Finally, the dissertation
findings are summarized in chapter 5.

4
REFERENCES
Avni, Y.: Gully incision as a key factor in desertification in an arid environment, the Negev
highlands, Israel, Catena, 63, 185-220, 2005.
Ayele, G. K., Gessess, A. A., Addisie, M. B., Tilahun, S. A., Tebebu, T. Y., Tenessa, D. B.,
Langendoen, E. J., Nicholson, C. F., Steenhuis, T. S.: A Biophysical and Economic
Assessment of a Community‐based Rehabilitated Gully in the Ethiopian Highlands,
Land Degradation & Development, doi:10.1002/ldr.2425, 2015.
Borrelli, P., Märker, M., Panagos, P., Schütt, B.: Modeling soil erosion and river sediment
yield for an intermountain drainage basin of the Central Apennines, Italy, Catena,
114, 45-58, doi:10.1016/j.catena.2013.10.007, 2014.
Bradford, J. M., Farrell, D., Larson, W.: Mathematical evaluation of factors affecting gully
stability, Soil Science Society of America Journal, 37, 103-107, 1973.
Campo‐Bescós, M., Flores‐Cervantes, J., Bras, R., Casalí, J., Giráldez, J.: Evaluation of a
gully headcut retreat model using multitemporal aerial photographs and digital
elevation models, Journal of Geophysical Research: Earth Surface, 118, 2159-2173,
2013.
Capra, A., Porto, P., Scicolone, B.: Relationships between rainfall characteristics and
ephemeral gully erosion in a cultivated catchment in Sicily (Italy), Soil and Tillage
Research, 105, 77-87, 2009.
Dagnew, D. C., Guzman, C. D., Zegeye, A. D., Tibebu, T. Y., Getaneh, M., Abate, S., Zemale,
F. A., Ayana, E. K., Tilahun, S. A., Steenhuis, T. S.: Impact of conservation practices
on runoff and soil loss in the sub-humid Ethiopian Highlands: The Debre Mawi
watershed, Journal of Hydrology and Hydromechanics, 63, 214-223, 2015.
Fleitmann, D., Dunbar, R. B., McCulloch, M., Mudelsee, M., Vuille, M., McClanahan, T. R.,
Cole, J. E., Eggins, S.: East African soil erosion recorded in a 300 year old coral
colony from Kenya, Geophysical Research Letters, 34,
doi:DOI:10.1029/2006GL028525, 2007, 2007.
Frankl, A., Deckers, J., Moulaert, L., Van Damme, A., Haile, M., Poesen, J., Nyssen, J.:
Integrated solutions for combating gully erosion in areas prone to soil piping:
innovations from the drylands of Northern Ethiopia, Land Degradation &
Development, 2014.
Frankl, A., Poesen, J., Deckers, J., Haile, M., Nyssen, J.: Gully head retreat rates in the semi-
arid highlands of Northern Ethiopia, Geomorphology, 173, 185-195, 2012.

5
Frankl, A., Poesen, J., Haile, M., Deckers, J., Nyssen, J.: Quantifying long-term changes in
gully networks and volumes in dryland environments: The case of Northern Ethiopia,
Geomorphology, 201, 254-263, 2013.
Gessesse, B., Bewket, W., Bräuning, A.: Model‐based characterization and monitoring of
runoff and soil erosion in response to land use/land cover changes in the Modjo
watershed, Ethiopia, Land Degradation & Development, 26, 711-724, doi:DOI:
10.1002/ldr.2276, 2015.
Haregeweyn, N., Poesen, J., Nyssen, J., De Wit, J., Haile, M., Govers, G., Deckers, S.:
Reservoirs in Tigray (Northern Ethiopia): characteristics and sediment deposition
problems, Land Degradation & Development, 17, 211-230, doi:10.1002/ldr.698,
2006.
Haregeweyn, N., Poesen, J., Verstraeten, G., Govers, G., Vente, J., Nyssen, J., Deckers, J.,
Moeyersons, J.: Assessing the performance of a spatially distributed soil erosion and
sediment delivery model (WATEM/SEDEM) in Northern Ethiopia, Land
Degradation & Development, 24, 188-204, doi:10.1002/ldr.1121, 2013.
Kou, M., Jiao, J., Yin, Q., Wang, N., Wang, Z., Li, Y., Yu, W., Wei, Y., Yan, F., Cao, B.:
Successional Trajectory Over 10 Years of Vegetation Restoration of Abandoned
Slope Croplands in the Hill‐Gully Region of the Loess Plateau, Land Degradation &
Development, doi:10.1002/ldr.2356, 2015.
Lanckriet, S., Frankl, A., Mesfin, G., Descheemaeker, K., Nyssen, J.: Gully cut‐and‐fill cycles
as related to agro‐management: a historical curve number simulation in the Tigray
Highlands, Earth Surface Processes and Landforms, 40, 796-808, 2015.
Muñoz-Robles, C., Reid, N., Frazier, P., Tighe, M., Briggs, S. V., Wilson, B.: Factors related
to gully erosion in woody encroachment in south-eastern Australia, Catena, 83, 148-
157, 2010.
Nyssen, J., Haile, M., Poesen, J., Deckers, J., Moeyersons, J.: Removal of rock fragments and
its effect on soil loss and crop yield, Tigray, Ethiopia, Soil Use and Management, 17,
179-187, 2001.
Nyssen, J., Poesen, J., Moeyersons, J., Deckers, J., Haile, M., Lang, A.: Human impact on the
environment in the Ethiopian and Eritrean highlands—a state of the art, Earth-science
reviews, 64, 273-320, 2004.
Nyssen, J., Poesen, J., Moeyersons, J., Luyten, E., Veyret‐Picot, M., Deckers, J., Haile, M.,
Govers, G.: Impact of road building on gully erosion risk: a case study from the

6
northern Ethiopian highlands, Earth Surface Processes and Landforms, 27, 1267-
1283, 2002.
Nyssen, J., Poesen, J., Veyret‐Picot, M., Moeyersons, J., Haile, M., Deckers, J., Dewit, J.,
Naudts, J., Teka, K., Govers, G.: Assessment of gully erosion rates through interviews
and measurements: a case study from Northern Ethiopia, Earth Surface Processes and
Landforms, 31, 167-185, 2006.
Poesen, J., Nachtergaele, J., Verstraeten, G., Valentin, C.: Gully erosion and environmental
change: importance and research needs, Catena, 50, 91-133, 2003.
Poesen, J., Vandaele, K., Van Wesemael, B.: Contribution of gully erosion to sediment
production on cultivated lands and rangelands, IAHS Publications-Series of
Proceedings and Reports-Intern Assoc Hydrological Sciences, 236, 251-266, 1996.
Simon, A., Derrick, D., Alonso, C., Bankhead, N.: Application of a deterministic bank-
stability model to design a reach-scale restoration project, USDA-ARS and US Army
Corps of Engineers, 2008.
Simon, A., Rinaldi, M.: Disturbance, stream incision, and channel evolution: The roles of
excess transport capacity and boundary materials in controlling channel response,
Geomorphology, 79, 361-383, 2006.
Tamene, L., Park, S., Dikau, R., Vlek, P.: Analysis of factors determining sediment yield
variability in the highlands of northern Ethiopia, Geomorphology, 76, 76-91,
doi:10.1016/j.geomorph.2005.10.007, 2006.
Tebebu, T., Abiy, A., Dahlke, H., Easton, Z., Zegeye, A., Tilahun, S., Collick, A., Kidnau, S.,
Moges, S., Dadgari, F.: Surface and subsurface flow effect on permanent gully
formation and upland erosion near Lake Tana in the northern highlands of Ethiopia,
Hydrology and Earth System Sciences Discussions, 7, 5235-5265, doi:10.5194/hess-
14-1827-2010, 2010.
Tilahun, S., Guzman, C., Zegeye, A., Engda, T., Collick, A., Rimmer, A., Steenhuis, T.: An
efficient semi-distributed hillslope erosion model for the subhumid Ethiopian
Highlands, Hydrology and Earth System Sciences, 17, 1051-1063, 2013.
Valentin, C., Poesen, J., Li, Y.: Gully erosion: impacts, factors and control, Catena, 63, 132-
153, doi:10.1016/j.catena.2005.06.001, 2005.

7
Vandaele, K., Poesen, J.: Spatial and temporal patterns of soil erosion rates in an agricultural
catchment, central Belgium, Catena, 25, 213-226, 1995.
Vandekerckhove, L., Poesen, J., Govers, G.: Medium-term gully headcut retreat rates in
Southeast Spain determined from aerial photographs and ground measurements,
Catena, 50, 329-352, 2003.
Vanmaercke, M., Poesen, J., Van Mele, B., Demuzere, M., Bruynseels, A., Golosov, V.,
Bezerra, J. F. R., Bolysov, S., Dvinskih, A., Frankl, A.: How fast do gully headcuts
retreat?, Earth-Science Reviews, 2016.
Wang, Y., Shao, M.: Spatial variability of soil physical properties in a region of the Loess
Plateau of PR China subject to wind and water erosion, Land Degradation &
Development, 24, 296-304, doi:10.1002/ldr.1128, 2013.
Zegeye, A., Damtew, S., Tilahun, A., Langendoen, E., Dagnew, D., Guzman, C., Tebeby, T.,
Steenhuis, T.: Gully development processes in the Ethiopian Highlands, In: 2nd
International Conference on the Advancements of Science and Technology, eds B.
Bantyirga, M. Mehari, VS Rao, BL Manocha, KK Singh, S. Geremew, and E. Tadesse
(Bahir Dar: Bahir Dar Institute of Technology). pp 220-229, 2014.
Zema, D., Bingner, R., Denisi, P., Govers, G., Licciardello, F., Zimbone, S.: Evaluation of
runoff, peak flow and sediment yield for events simulated by the AnnAGNPS model
in a Belgian agricultural watershed, Land Degradation & Development, 23, 205-215,
doi:10.1002/ldr.1068, 2012.
Zhao, G., Mu, X., Wen, Z., Wang, F., Gao, P.: Soil erosion, conservation, and eco‐environment changes in the loess plateau of China, Land Degradation &
Development, 24, 499-510, doi:10.1002/ldr.2246, 2013.

8
CHAPTER 2
MORPHOLOGICAL DYNAMICS OF GULLY SYSTEMS IN THE SUBHUMID
ETHIOPIAN HIGHLANDS: THE DEBRE MAWI WATERSHED
Abstract
Gully expansion in the Ethiopian Highlands dissects vital agricultural lands with the
eroded materials adversely impacting downstream resources, for example as they
accumulate in reservoirs. While gully expansion and rehabilitation have been more
extensively researched in the semiarid region of Ethiopia, few studies have been
conducted in the (sub) humid region. For that reason, we assessed the severity of gully
erosion by measuring the expansion of 13 selected permanent gullies in the subhumid
Debre Mawi watershed, 30 km south of Lake Tana, Ethiopia. In addition, the rate of
expansion of the entire drainage network in the watershed was determined using 0.5 m
resolution aerial imagery from flights in 2005 and 2013. About 0.6 Mt (or 127 t ha-1 yr-
1) of soil was lost during this period due to actively expanding gullies. The net gully
area in the entire watershed increased more than 4-fold from 4.5 ha in 2005 to 20.4 ha
in 2013 (> 3% of the watershed area), indicating the growing severity of gully erosion
and hence land degradation in the watershed.
Soil losses were caused by upslope migrating gully heads through a combination of
gully head collapse and removal of the failed material by runoff. Collapse of gully banks
and retreat of headcuts was most severe in locations where elevated groundwater tables
saturated gully heads and banks, destabilizing the soils by decreasing the shear strength.
Elevated groundwater tables were therefore the most important cause of gully

9
expansion. Additional factors that strongly relate to bank collapse were the height of the
gully head and the size of the drainage area. Soil physical properties (e.g., texture and
bulk density) only had minor effects.
Conservation practices that address factors controlling erosion are the most effective in
protecting gully expansion. These consist of lowering water table and regrading the
gully head and sidewalls to reduce the occurrence of gravity-induced mass failures.
Planting suitable vegetation on the regraded gully slopes will in addition decrease the
risk of bank failure by reducing pore-water pressures and reinforcing the soil. Finally,
best management practices that decrease runoff from the catchment will reduce the
amount of gully-related sediment loss.
2.1 Introduction
Gully erosion is likely the most serious form of land degradation (Poesen et al., 2003).
Gullies form because they are an energy-efficient way for runoff to travel from uplands
to valley bottoms (Gyssels and Poesen, 2003; Simon et al., 2011). Gullies can contribute
more than 90% of catchment sediment yield (Tebebu et al., 2010; Simon et al., 2011;
Zegeye et al., 2014). They have also been found to damage structures and transport
routes (Nyssen et al., 2004b; Valentin et al., 2005).
Gullying is a threshold-dependent process controlled by a wide range of factors
(Valentin et al., 2005), including rainfall and flowing water, soil properties, and
drainage area. Capra et al. (2009) and Campo et al. (2013) found that most of the gully
erosion took place during heavy rainfall events – i.e., storm events were one of the
drivers for gully erosion. The mechanical actions of the flowing water can result in a

10
rapid mass movement in the gullies by undercutting of the banks (See Figure 2.1;
Lanckriet et al., 2015). When these mechanical actions at the gully head exceed the
cohesive strength of soil, erosion proceeds upslope through a headward cutting gully
(Muñoz-Robles et al., 2010). Interactions between such processes are important since
hydraulic erosion promotes bank collapse, which then modifies subsequent hydraulic
erosion (Thorne, 1990; Avni, 2005) Similarly, gully formation is initiated with the
occurrence of convergent shallow subsurface flow that leads to seepage-induced erosion
of surface soils, gully heads and sidewalls (Figure 2.1f; Vanmaercke et al., 2016;
Tilahun et al., 2013a) as well as sliding (Figure 2.1d). Soil saturation by a rising water
table decreases the soil shear strength (Poesen, 1993; Langendoen and Simon, 2008),
and therefore destabilizes banks (Simon et al., 2000; Langendoen et al., 2013). Active
gully networks are therefore predominantly found in the saturated valley bottomlands
(Tebebu et al., 2010; Steenhuis et al., 2014), and the deepest and the most spectacular
gullies occur in the bottom of the watershed, where, in subhumid monsoonal and wetter
climates, the soil becomes saturated starting around the middle of the rain phase and
then remain saturated until the end of the rain phase (Tebebu et al., 2014).
Soil properties and soil types also play a role in gully formation and expansion. For
example, Vertisols, heavy clay soils with a high proportion of swelling clays (IUSS
Working Group WRB, 2015), form deep wide cracks from the surface downward when
they dry out (Figure 2.1c) and are prone to the development of pipes (Figure 2.1e) that
can collapse and thereby turn into large rills or gullies (Valentin et al., 2005; Frankl et
al., 2014). This may be one of the reasons that most severe gully areas are often

11
associated with Vertisols (Valentin et al., 2005; Tebebu et al., 2014; Frankl et al., 2014).
Similarly, in pasture bottom lands, piping often leads to development of permanent
gullies (Jones, 1987; Zegeye et al., 2014). These pipes are part of gully networks and
during the rain phase, the infiltrating rainfall discharges through the pipes, which
increases the lower soil horizon’s vulnerability to erosion.
Figure 2.1. Examples of gully expansion controlled by (a, b) bank geometry (height
and slope), (c) tension cracks, (d) landslide, (e) soil pipes and (f) saturated Vertisols
(gully development on conservation ditches, narrow ditch upstream of gully
headcut) in the subhumid Debre Mawi (a,b,d, and f), Mota (c) and Geregera (e)
watersheds (pictures taken in 2013).
The drainage area at the gully head is one of the parameters explaining linear, areal and
volumetric gully headcut retreat (Vandekerckhove et al., 2003; Frankl et al., 2012,

12
2013b; Vanmaercke et al., 2016). Runoff-contributing drainage area can be used as a
surrogate for runoff, especially if it is assumed that the rainfall amount is equal for all
drainage areas and that surface conditions and land use are also very similar (Oostwoud
and Bryan, 2001). Frankl et al. (2012) reported for the semi-arid Tigray region in
northern Ethiopia that among all environmental characteristics in a catchment, only the
drainage area had a strong positive association with gully headcut retreat (hereafter,
headcut retreat refers to the longitudinal gully growth and bank failure refers to cross-
sectional gully growth). Similarly, when data from stable and unstable subcatchments
were combined, the main factors related to gully volume were drainage area of gully
and stream heads (Muñoz-Robles et al., 2010). Nyssen et al. (2002) claimed that
increasing the drainage area of the gully head enhances gully development.
Additionally, long-term retreat rates often show negative-exponential trends with
runoff-contributing area of the gully head, which could be explained by the declining
runoff-contributing area of the gully head as it moves upslope (Begin et al., 1980).
Most gully erosion studies in Ethiopia have been carried out in the semiarid Tigray
region in northern Ethiopia (e.g., Billi and Dramis, 2003; Nyssen et al., 2006; Tamene
et al., 2006; Nyssen et al., 2008; Frankl et al., 2011, 2012, 2013, 2014). In this region,
rehabilitation of gully erosion has been relatively successful (soil loss has been
decreased to a range of 1-6 t ha-1) by using check dams and upland soil and water
conservation (SWC) measures (Nyssen et al., 2004a, 2006, 2009). Using repeat
photographs from 2006 to 2009, Frankl et al. (2011, 2013c) found that about 25% of the
assessed gully sections were stabilized as a result of siltation behind check dams.

13
However, such physical structures have been ineffective in controlling gully erosion in
the (sub) humid Ethiopian Highlands, where gullies are formed in saturated Vertisol
areas and where water often bypasses the check dams (Dagnew et al., 2015).
Importantly, the amount of interflow and surface flow in the humid region is different
from that in the arid and semiarid regions (Bayabil et al, 2010; Engida et al, 2011;
Tilahun et al., 2013a, b; Steenhuis et al., 2014). Conservation structures that are
effective in preventing gullying by overland flow in semiarid regions (Nyssen et al.,
2004a, 2006), may not be effective in the humid Ethiopian Highlands, where interflow
elevates groundwater tables in the valley bottom that promote gully formation and
expansion (Tebebu et al., 2010).
Thus, there is a clear need for a better understanding of gully erosion processes and
factors in the subhumid Ethiopian Highlands in order to design effective gully control
or rehabilitation measures. The objectives of this study were therefore (1) to understand
gully erosion processes in the subhumid Ethiopian Highlands and identify factors
controlling these processes for effective conservation practices, and (2) to provide
quantitative estimates of the severity of gully erosion in the subhumid Debre Mawi
watershed.
2.2 Materials and Methods
2.2.1 Description of the Study Area
The study area, the Debre Mawi watershed, is located in the subhumid highlands of
northwestern Ethiopia, 30 km south of Bahir Dar along the road to Adet between 11o20’
and 11o22’ N and 37o24’ and 37o26’ E. The watershed drains an area of 608 ha. The

14
altitude ranges from 2186 to 2366 m a.s.l. (Figure 2.2); the elevations of the gullies
considered in this study range from 2212 to 2272 m a.s.l. Rainfall is unimodal with an
average value of 1240 mm yr-1. The majority of the annual rainfall falls between June
and the beginning of September and averages 900 mm yr-1. The rainfall gauge station
located at the northern part of the Debre Mawi watershed (Figure 2.2) has been started
since 2008 by the Adet Agricultural Research Center to record the rainfall in rain phase
only. The dry season lasts between 8 and 9 months. The mean daily temperatures is
20°C.
The hydro-geomorphology of the Debre Mawi watershed is strongly controlled by the
geological setting. The lava dykes in the watershed affect the hydrology upslope, forcing
subsurface flow to the surface resulting in saturated source areas for surface runoff
(Abiy, 2009). Soils are mainly Nitisols in the uplands, Vertisols in the bottom slopes,
and Regosols on the steep hillslopes. In total, 92% of the watershed is cultivated, 6% is
rangeland and the remaining 2% is mainly covered by eucalyptus trees and shrubs, a
small village and the road linking Bahir Dar with Adet. The small indigenous shrubs are
predominantly found on the steep hillslopes.

15
Figure 2.2. Location of the Debre Mawi watershed within the Blue Nile River basin,
Ethiopia (top figures). The watershed map (bottom) shows the contour lines,
elevation, stream lines, and the 13 studied gullies (indicated by the labels beginning
with the letter G). Projected coordinate system: WGS_1984_UTM_Zone_37N
16
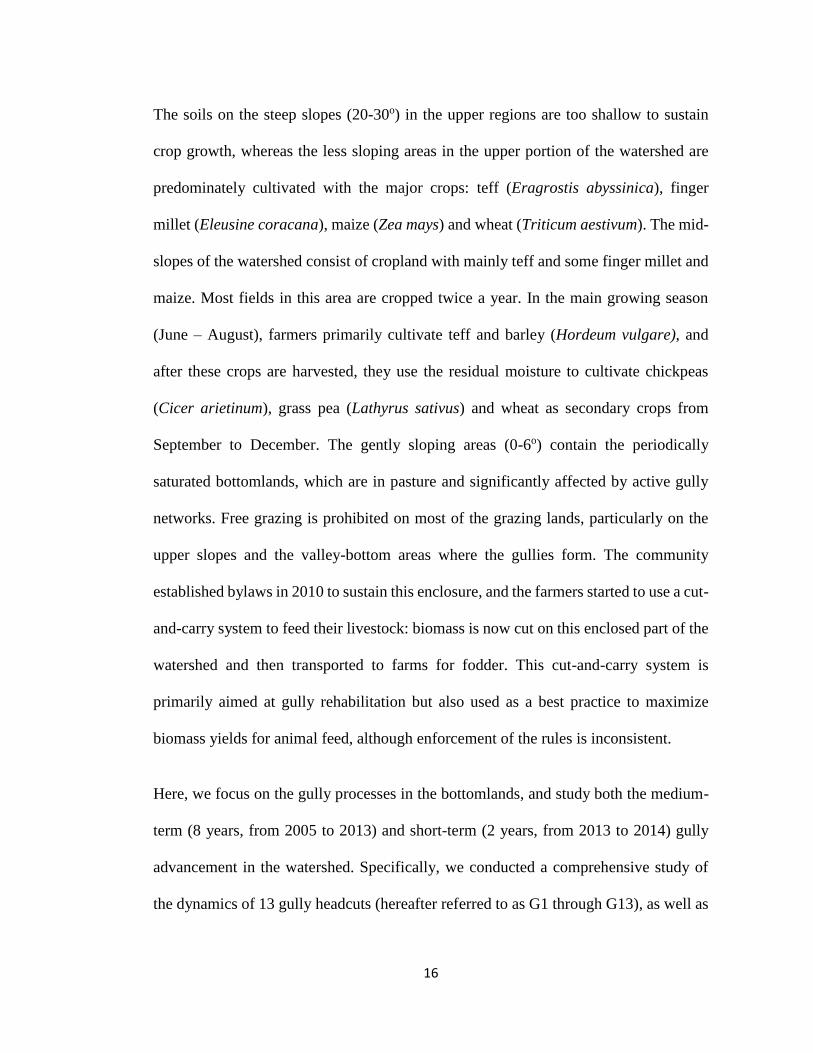
The soils on the steep slopes (20-30o) in the upper regions are too shallow to sustain
crop growth, whereas the less sloping areas in the upper portion of the watershed are
predominately cultivated with the major crops: teff (Eragrostis abyssinica), finger
millet (Eleusine coracana), maize (Zea mays) and wheat (Triticum aestivum). The mid-
slopes of the watershed consist of cropland with mainly teff and some finger millet and
maize. Most fields in this area are cropped twice a year. In the main growing season
(June – August), farmers primarily cultivate teff and barley (Hordeum vulgare), and
after these crops are harvested, they use the residual moisture to cultivate chickpeas
(Cicer arietinum), grass pea (Lathyrus sativus) and wheat as secondary crops from
September to December. The gently sloping areas (0-6o) contain the periodically
saturated bottomlands, which are in pasture and significantly affected by active gully
networks. Free grazing is prohibited on most of the grazing lands, particularly on the
upper slopes and the valley-bottom areas where the gullies form. The community
established bylaws in 2010 to sustain this enclosure, and the farmers started to use a cut-
and-carry system to feed their livestock: biomass is now cut on this enclosed part of the
watershed and then transported to farms for fodder. This cut-and-carry system is
primarily aimed at gully rehabilitation but also used as a best practice to maximize
biomass yields for animal feed, although enforcement of the rules is inconsistent.
Here, we focus on the gully processes in the bottomlands, and study both the medium-
term (8 years, from 2005 to 2013) and short-term (2 years, from 2013 to 2014) gully
advancement in the watershed. Specifically, we conducted a comprehensive study of
the dynamics of 13 gully headcuts (hereafter referred to as G1 through G13), as well as

17
factors controlling these dynamics. Gullies G1 and G9 through G13 are located in the
central part of the watershed, and gullies G2 through G8 are located at the bottom flat
area of the watershed (Figure 2.2). All gullies except G11 and part of G6 are situated on
communal grazing lands that were enclosed recently.
2.2.2 Data collection and analysis
2.2.2.1 Measuring gully widening and headcut retreat during the 2013 and 2014 rain
phases
During the 2013 and 2014 monsoon rain phases, for 13 gullies, we measured (1) the
headcut retreat (longitudinal growth) and gully widening (or lateral retreat) 10-30 m
downslope from the headcut, and (2) the gully expansion rates and associated amount
of soil loss along the total gully length.
To measure the headcut retreat and widening of the 13 gullies, we divided the gully
downslope of the headcut into three to eight uniform segments. The average distance
between two consecutive cross sections was 3.6 m and varied from 1 m to 10 m with a
standard deviation of 2.7 m. This method of measuring the gully is relatively precise,
simple, and low-cost compared with other methods (Casali et al., 2006, 2015). Gully
cross-sectional geometry was surveyed by dividing the cross section into trapezoidal
segments at abrupt changes in the bank and then measuring the width and depth of the
gully at each segment (Figure 2. 3).

18
Figure 2.3. (a) Cross section segmentation methodology to determine the cross-
sectional area of the gullies. (b) Measured profiles of a cross section located on
gully G6 during the 2013 rain phase, showing the lateral and downward expansion
of the gully.
Cross-sectional area (A), surface area (S) and volume (V) were then calculated using
Eqs. (2.1, 2.2 and 2.3) respectively:
)1.2()(2
1 1
1
11
n
i
iiii hwhwA

19
)2.2()2
(1
1
1
jjN
j
j
WWLS
)3.2()2
(1
1
1
jjN
j
j
AALV
where n is the number of trapezoidal segment sides of height h and located a distance w
from the left gully edge in a cross section (Figure 2.3a), i is a trapezoidal segment index,
W is cross section width, j is cross section index, N is number of cross sections, and Lj
is length of the gully section between cross sections j and j+1.
Measurements were carried out repeatedly (about eight times for large gullies to five
times for small gullies mainly following large rainstorms and the period between
surveys not exceeding 2 weeks) using a tape meter and benchmark pins installed 5 to
10 m from the gully edges. However, a few gullies expanded more than this distance
and the affected pins were reinstalled 5 to 10 m upslope of the newly formed gully bank.
To estimate gully expansion and the amount of soil loss from total gully reach, three
gully topographic surveys (before and after the rain phases of 2013 and 2014) were
conducted. The total soil loss volume over the monitoring period was then obtained by
taking the difference in VT after and before the 2013 and 2014 rain phase. The mass of
the soil loss was calculated by multiplying the soil loss volume for each subsection
(calculated using Eq. (2.3)) by the measured average bulk density of the soils (see
Section 2.3).
The relationships between the change in gully headcut dimensions (lateral, headward
and volumetric erosion) and the controlling factors (daily rainfall, cumulative rainfall,

20
water table, drainage area, headcut height, and soil physical properties such as bulk
density and soil texture) were analyzed. Additionally, empirical relationships between
the volumetric retreat (V) and the lateral (W) and longitudinal (L) retreat were
developed.
2.2.2.2 Gully erosion dynamics from 2005 to 2013
To place the 2-year gully expansion (Section 2.2.2.1) in a broader context, we measured,
in addition, the gully dynamics over an 8-year period. Following the approach of Frankl
et al. (2013a), we determined the surficial land loss area due to gullying for the Debre
Mawi watershed by digitizing all gully edges in Google Earth from Digital Globe image
(resolution was approximately 0.5 m) collected on 6 Mar 2005 and 22 Mar 2013 and
supplemented with data from CNES/Astrium on 22 April 2012.
Gullies were digitized by determining the location of each gully in the watershed using
a hand-held GPS with a horizontal accuracy of about 3 m on August 2013, after which
its coordinates were imported into Google Earth to situate all gullies on the imagery.
The gully edges were then digitized using Google Earth’s polygon mapping tool. Then
the digitized polygons were saved as KML files from Google Earth into a designated
folder on the computer and the KML files were converted to shape-file format using
ESRI’s ArcGIS software, which was also used to calculate the surface area and the
length of each gully. Since gully volume could not be obtained from aerial
measurements, it was derived from the digitized gully surface area through a regression
of the surface area and volume of the measurements of the 13 gullies with surface area

21
in 2013 ranging from 260 to 14,050 m2 (Table 2.2, Figure A1-1a). The following
regression equation was obtained.
)4.2(98.054.0 2226.1 RSV
where S is the gully surface area (m2) obtained from Google Earth and V is the predicted
volume (m3) of the gully. The total gully volume for the entire watershed is then simply
the sum of all individual gully volumes. The goodness-of-fit parameters (see Section
2.2.2.4) between measured volume and estimated volume (Figure A1-1b) by Eq. (2.4)
are R2 = 0.98, NSE = 0.99 and PBIAS = -0.8%. Obviously Eq. (2.4) is only valid in the
subhumid Debre Mawi watershed where the valley soils are deep and the depth is not
restricted by bedrock. The area to volume relationship developed by Frankl et al.,
(2013b) for gullies in the semiarid Ethiopian highlands has a different form because of
bedrock at shallow depth that limits the vertical growth.
2.2.2.3 Additional measurements to determine factors controlling gully expansion
Ground water elevation is believed to be one of the most important factors for gully
formation and bank instability (Tebebu et al., 2010). Therefore, groundwater depths
were measured using a piezometer installed 5-10 m above each gully head (13
piezometers). Intrusion of silt and sand to the piezometer was prevented by wrapping
filter fabric around the 40 cm long screened bottom end. All piezometers were capped
to prevent rainwater entry and were set in concrete to prevent any physical damage.
Groundwater table elevations were read using a measuring tape twice a day: in the
morning and in the evening.
22
Daily precipitation was measured at 5 min intervals using an automatic tipping-bucket,
self-emptying rain gauge installed in the northern portion of the watershed. The drainage
area (DA) above the gully heads was determined from topographic analysis in a
geographical information system (GIS) using a digital elevation model (DEM) with 30
m horizontal resolution.
A total of 55 soil samples for bulk density (BD) and for textural analysis were collected
from different soil layers along the profile of the sidewalls near the gully head (the
number of layers varied from three to five depending on the gully depth). Samples for
BD were collected with a 98-cm3 (5 cm high) cylindrical core sampler. Soil samples
were dried for 24 h at 105 °C, and bulk density was calculated by dividing the mass of
the oven-dried soil by the volume of the core. The textural analysis was carried out using
the hydrometer method after sieving (Day, 1965).
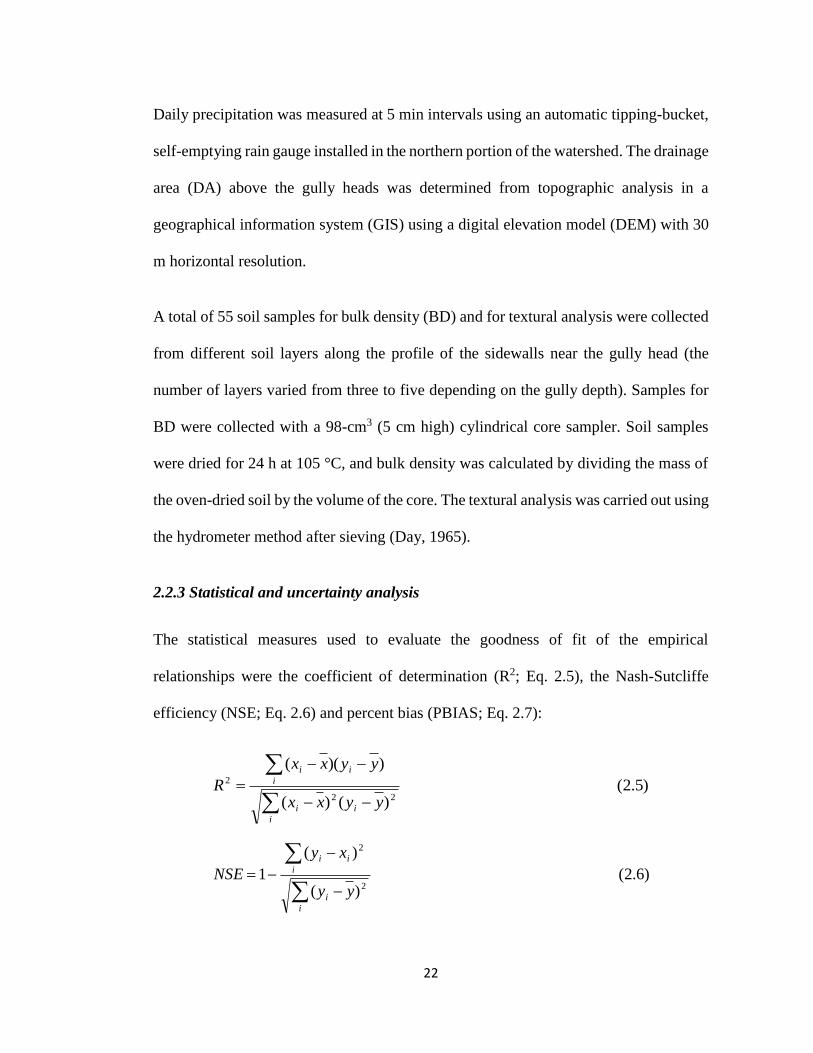
2.2.3 Statistical and uncertainty analysis
The statistical measures used to evaluate the goodness of fit of the empirical
relationships were the coefficient of determination (R2; Eq. 2.5), the Nash-Sutcliffe
efficiency (NSE; Eq. 2.6) and percent bias (PBIAS; Eq. 2.7):
)5.2()()(
))((
22
2
i
ii
i
ii
yyxx
yyxx
R
)6.2()(
)(
12
2
i
i
i
ii
yy
xy
NSE

23
)7.2(100*
)(
i
i
i
ii
y
yx
PBIAS
where xi and yi are the predicted and observed values, respectively and the overbar
indicates their arithmetic mean value. The R2 (ranging from 0 to 1) describes the degree
of collinearity between predicted and measured data, and is sensitive to extreme values
and insensitive to proportional differences. NSE is a normalized statistic that determines
the relative magnitude of the residual variance (ranging from-∞ to1). In general, based
on Ritter and Muñoz-Carpena (2013), NSE > 0.65 is considered acceptable; NSE = 1
indicates a perfect fit, and an NSE < 0 suggests that the mean of the observed values is
a better predictor than the evaluated model itself. PBIAS is the average tendency of
predicted values with respect to their observed counterparts (ranging between -100 and
+100). The optimal value of PBIAS is zero, with values close to zero indicating accurate
model simulation.
In order to determine the uncertainly of the calculated gully measures, the following
errors were considered:(1) error generated from using the average bulk density to
calculate the amount of soil loss, (2) measurement errors of length width and cross-
sectional area of the gully and, (3) the accuracy of the drainage area estimated from the
digital elevation model (DEM).
We obtained the measurements errors as follows. The bulk density measurement error
was equated with the standard deviation of all bulk density samples (three to five
samples were taken for up to five layers of each gully). The absolute measurement error

24
of the gully length and width was assumed to be related to tape measurement and was
estimated at 0.1 m. The absolute measurement error of the cross-sectional area was 1
m2 based on previous experience.
The absolute drainage area (DA) measurement error was mainly attributed to the
accuracy of the DEM that was used to delineate the drainage area. For this, we used the
relationship of the relative errors (%reDA) in 14 subcatchments studied by Oksanen and
Sarjakoski (2005), which is %𝑟𝑒DA = 11.3 exp(-0.0006 DA). The absolute error is then
eDA = 0.113 DA exp(-0.0006 DA).
To calculate the uncertainty of the surface area (S), volume (V) and soil loss (SL) of the
gullies we used the method presented by Ku (1966) on the propagation of error (e) as:
)8.2())(())(()(2/122 yexeyxe
)9.2()/)(()/)((*)(2/122 yyexxexyxye
where e(x) and e(y) are the absolute errors of the variables x and y that stand for either
length, width, area, volume or bulk density. The absolute error for headcut retreat
measurement in each gully was obtained by first calculating the absolute error for each
gully segment using Eqs. (2.8 and 2.9). Finally, we used Eq. (2.8) to calculate the
combined error from all segments in each gully (Table 2.3). The absolute relative error
in predicting gully volume for the 13 gullies was obtained by subtracting the measured
volume from the predicted gully volume using Eq. (2.4) and then dividing for each gully
by the measured value. Then we calculated the combined error for the combined

25
volumes of the 13 gullies using Eq. (2.8). The error in volume (ev) calculated from the
digitized surface area for all gullies in the watershed was estimated based on the errors
calculated from the 13 gullies investigated in more detail. This relationship is as follows,
ev = 0.25 S1.02.
2.3 Results
2.3.1 Gully expansion rates at the watershed scale (2005 – 2013)
Figure 2.4. The relationship between gully formation locations and topographic
wetness index (TWI), and gully expansion rate between (a) 2005 and (b) 2013 in the
Debre Mawi watershed, Ethiopia. Lines represent gully edges digitized from aerial
imagery.
The expansion of the gully network in the Debre Mawi watershed significantly impacted
the landscape (Figure 2.4, Table 2.1,). Based on the digitized aerial images of 2005 and
2013 we found that the total length of the gully network increased from 8.7 km in 2005

26
to 26 km in 2013 (Table 2.1, Table A1). The surface area taken up by the gully expanded
from 4.5 ± 0.17 ha in 2005 to 20.4 ± 0.4 ha (or 3% of the watershed) in 2013 or
equivalent to 2 ha yr-1. Using Eq. (2.4), this represents a soil loss of about 0.80 ± 0.013
Mt over the total watershed which is equivalent to 127 t ha-1 yr-1 (Tables 2.1 and 2.2).
Table 2.1. The combined length, area and volume of the total gully network in the
608 ha Debre Mawi watershed obtained from satellite imagery in 2005 and 2013.
The “soil loss” in the last column represents the total soil loss from the gully
network preceding the date of measurements and is calculated as the fourth column
times the bulk density. Errors were estimated using Eqs. (2.8 - 2.10), n.a indicates
not calculated
Year Gully length
km
Gully area
ha
Gully volume
103 m3
Soil loss
103 t
2005 8.7 4.5 140 168
Estimated error in 2005 n.a 0.17 3.5 5
2013 26.0 20.4 654 784
Estimated error in 2013 n.a 0.4 0.87 13
Increase from 2005 to 2013 17.3 15.9 514 616
Relative change, % 2005-2013 199 350 366 366
2.3.2 Expansion rates of the thirteen gullies (2005-2014)
In this section we discuss the 13 gullies (G1-G13) monitored in more detail. They have
a combined watershed area of 200 ± 9.4 ha (Table 2.3). Measurements were used from
both aerial imagery (up to March 23, 2013) and manual measurement (2013-2014 rain
phases) (Table 2.2). The surface area of the 13 gullies was 0.7± 0.05 ha in 2005 and
expanded to a total of 3.8 ± 0.26 ha in 2014. The corresponding soil loss from these
gullies between 2005 and 2014 was estimated at 156 ±9 thousand tons (Table 2.2). This
is equivalent to 78 t ha-1 yr-1 (ranging from 7 to 350 t ha-1 yr-1 with standard deviation
of 90 t ha-1 yr-1 for the individual gullies). During the last 2 years of the study (2013-

27
2014), the land area lost due to the expansion of the 13 gullies was 0.17 ± 0.014 ha
(Table 2.2), which is about 10 thousand tons of soil (of which about 60% or 47 t ha-1
occurred in 2013) and is equivalent to 25 ± 0.8 t ha-1 yr-1. The soil loss of the individual
gullies ranged from 14 ± 3 t (1.5 ± 0.3 t ha-1 yr-1) for G12 to 5445 ± 804 t (205 ± 52 t
ha-1 yr-1) for G6 (Table 2.2). In 2014, the longitudinal growth of most gullies (G1, G2,
G3, G6, G7, G10, G12 and G13) was significantly reduced resulting in less annual soil
loss (Table 2.3).
The recorded precipitation during the 2013 rain phase (44 days of rainfall) was 917 mm,
and in 2014 (31 days of rainfall) it was 1107 mm (Figure 2.5c). The gully headcut retreat
in 2013 ranged from 0.04 to 36 m, with a combined total of 103 m (Figure 2.5a, Table
2.3), whereas the total retreat in 2014 ranged from 0 to 7 m, with a combined total of 19
m (Table 2.3). Over these two monsoon seasons (2013-2014), about 608 ± 33 m2 of
cultivated land was consumed by only the longitudinal headcut retreat of the 13 gullies.
This is equivalent to 36% of the increase in total surface area (both longitudinal and
lateral retreat of the entire gully) of the 13 gullies during 2013-2014, and about 1.5% of
the total surface area of the 13 gullies since their formation up to 2014. During 2013-
2014, the soil loss solely due to headcut migration equalled 2875 ± 248 t (Table 2.3),
which represented 30% of the total soil loss from the 13 gullies in the same period
presented in Table 2.2. The total 2-year soil loss caused by the linear headcut retreat of
the individual gullies varied from 0.9 (G7) to 1260 t (G5) (Figure. 2.5b, Table 2.3).
During 2013, only 6 of the 13 gullies (G3, G4, G5, G6, G8, and G11) actively expanded
with lateral retreat (widening) varying from 3 to 11 m and a headward retreat varying

28
from 6 to 36 m, while the other gullies remained fairly stable. The headcuts of gullies
G3 and G8 migrated the farthest, 36 m and 24 m respectively, but only during the 2013
rain phase. However, because of the relatively shallow headcut depth (1.4 m) and
narrow width (2.6 m) of gully G3, its headcut migration contributed little (only 7%) to
the total soil loss of the 13 gullies (Figure 2.5b). As shown in Figure 2.5b, the four
largest gullies (G5, G6, G8, and G11) were responsible for about 94% of the total soil
loss from the 13 gullies. The relationships between the lateral and longitudinal retreat
and the associated volumetric soil losses are discussed in Section 2.2.4.

29
Figure 2.5. The observed expansion of the 13 study gullies in the Debre Mawi
watershed (see Figure 2.2 for gully location): (a) cumulative headcut retreat and
rainfall during the 2013 rain phase, (b) increase in gully surface area and volume
during the 2013 and 2014 rain phases, and (c) increase in the combined gully
surface area and the total summer rainfall (RF) between 2011 and 2014.

30
Table 2.2. Increase in surface area and corresponding soil loss of the 13 gullies in the Debre Mawi watershed in the period
between 2005 and 2014. Surface area up to March 2013 was obtained by digitizing the gully edges on aerial imagery and the
next two rain phases by manual measurement. Error stands to absolute error.
Gully
name
Gully surface area (m2) Bulk density
(g cm-3)
2005 - 2014 2013-2014
From aerial image Manual
measurement
6/3/05 4/5/11 3/4/12 23/3/13 18/9/13 18/10/1
4
mea
sure
d
Error Chan
ge in
area
(m2)
Error
(m2)
Chang
in
volume
(m3)
error
(m3)
Soil
loss
(t)
Error
(t)
Change
in
volume
(m3)
Error
(m3)
Soil
loss (t)
Error
(t)
G1 140 265 390 420 440 440 1.26 0.02 300 42 709 84 894 107 52.1 9 66 11
G2 785 2700 3330 3560 3573 3575 1.19 0.02 2790 395 10354 817 12321 1005 63.1 11 75 13
G3 210 530 600 1430 1460 1460 1.14 0.05 1250 177 3712 360 4232 447 102.8 18 117 21
G4 230 400 450 750 780 785 1.17 0.11 555 78 1488 157 1740 244 104.0 18 122 24
G5 2820 10700 11500 13700 13960 14050 1.16 0.04 11230 1588 56511 3383 65553 4618 2000.3 346 2320 411
G6 1720 6770 8100 9110 9580 9960 1.22 0.18 8240 1165 38076 2467 46453 7492 4462.8 773 5445 1239
G7 110 365 365 385 390 390 1.15 0.05 280 40 639 78 735 95 12.7 2 15 3
G8 365 2140 2860 3740 3850 3890 1.19 0.09 3525 498 12856 1038 15299 1674 640.3 111 762 143
G9 40 730 1050 1120 1150 1180 1.19 0.09 1140 161 3102 328 3691 485 195.3 34 232 44
G10 50 190 400 455 460 460 1.25 0.11 410 58 928 116 1160 180 13.2 2 17 3
G11 152 600 750 890 1020 1070 1.23 0.07 918 130 2540 263 3124 363 565.0 98 695 126
G12 50 170 240 255 255 260 1.22 0.06 210 30 428 58 522 75 11.6 2 14 3
G13 199 240 345 365 370 370 1.14 0.05 171 24 405 47 462 58 12.6 2 14 3
Total 6800 25800 30380 36180 37288 37890 1.19 0.30 31019 2091 131748 4432 156186 9053 8236 861 9894 1321

31
2.3.3 Factors controlling gully headcut retreat and their relationships with gully 5
dimensions (2013)
The linear headcut retreat of the gullies varied by more than an order of magnitude and
was not related to geographic location. This variation should, therefore, be explained by
other factors including: groundwater elevation, soil physical properties (texture, bulk
density, and porosity), gully head height, and drainage area (Table 2.3). 10
The correlation between the observed change in linear gully headcut retreat (RL) and the
precipitation recorded during the day of the gully head retreat occurrence varied
between -0.23 and 0.88. Some of the big gullies such as G5, G6 and G11 showed strong
correlation (RL, G5 = 0.88, p = 0.009 and RL, G6 = 0.84, p = 0.017), whereas gullies with
the greatest linear retreat (LG3 = 36 m and LG8 = 24 m; Figure 2.5a) showed weak 15
relationships (RL, G3 = 0.27, p = 0.55 and RL, G8 = 0.34, p = 0.37). The probable reason
for these fairly low correlation coefficients is that there was a time delay between daily
rainfall and saturation of the soil surrounding the gully (Tebebu et al., 2010, Tilahun et
al., 2013b). Saturation of the gully banks is principally responsible for destabilizing the
gully head (Tebebu et al (2010). Due to such slow saturation processes, the daily 20
precipitation and gully head retreat on the same day are not correlated well. This does
not mean that precipitation was not related to retreat since the largest retreat rates were
observed on 13 Aug 2013 after the maximum recorded daily rainfall (94 mm) on 7 Aug
2013 with little or no rainfall within this period (Figure 2.5a).

32
Table 2.3. List of soil and gully topographic factors for the 13 study gully heads in the Debre Mawi watershed, as well as 25 observed gully head erosion during the 2013 and 2014 rain phases (between July and September). BD is bulk density and DA is
drainage area. Ave stands for the average values for 1st-3rd and 5th columns, and total stands for other all columns.
Gully
name Min.
water
table
depth
(m)
Clay
cont
ent
(%)
Mean bulk
density (g cm-3)
head
cut
depth
(m)
Drainage area
(ha)
Linear
headcut
retreat(m)
Area retreat
(m2)
Volumetric
retreat (m3)
Soil loss (t)
2013-2014 2013-2014 2013-2014
measu
red
error measu
red
error 2013 2014 measure
d error meas
ured
error measu
red
error
G1 1.50 58 1.26 0.02 3.9 12.8 1.44 0.4 0 3.3 0.46 9 1.5 11 2.0
G2 1.22 53 1.19 0.02 2.2 13 1.46 2.2 0.5 10.9 1.32 32 5.3 38.5 6.4
G3 0.02 55 1.14 0.05 1.4 41.6 4.59 36 0 22.5 3.17 146 25.3 167 29.7
G4 0.59 59 1.17 0.11 2 1.7 0.19 7 5 15.7 1.57 61 7.9 72 11.3
G5 0.05 60 1.16 0.04 4.8 68 7.38 10 3 101.5 10.16 1087 167 1260 199.4
G6 0.08 67 1.22 0.18 4.6 13.3 1.49 12 0 182.0 25.66 413 71.5 504 114.7
G7 1.36 59 1.15 0.05 1.4 0.7 0.08 0.2 0 0.7 0.09 1 0.1 0.9 0.2
G8 0.07 56 1.19 0.09 3.3 17.4 1.95 24.4 7 108.9 12.10 237 34.5 281 46.1
G9 1.20 59 1.19 0.09 3.4 6.8 0.77 3.8 1.65 21.2 2.46 73 9.5 87 13.2
G10 1.44 55 1.25 0.11 2.5 6.5 0.73 0.7 0 2.7 0.38 6 1.0 7.5 1.5
G11 0.45 66 1.23 0.07 4.2 9.2 1.03 6.2 1.4 123.4 14.17 356 55.6 437 72.2
G12 1.38 66 1.22 0.06 1.9 4.1 0.46 0.07 0 5.0 0.71 3 0.6 4 0.7
G13 1.25 60 1.14 0.05 1.3 4.8 0.54 0.04 0.8 10.1 1.18 3 0.5 2.8 0.6
Total
/Ave 0.82 59.5 1.19 0.30 2.84 200 9.4 103 19 608 33.6 2427 195 2873 248

33
The combined linear retreat (daily and cumulative) of the 13 gully heads in 2013 was
compared with three different rainfall amounts: daily rainfall recorded during the retreat
events, cumulative rainfall between gully head retreat events, and the cumulative
rainfall since the beginning of the rain phase. The combined linear headcut retreat
showed a moderate relationship with daily rainfall (RL = 0.76, p = 0.13), but fairly strong
relationship with cumulative rainfall between retreat events (RL = 0.91, p = 0.01). Note
that the relationship with daily rainfall was relatively high due to the retreat that
occurred on 13 Aug 2013 during the largest rainfall event as discussed above. When
this rainfall was excluded from the analysis, the correlation was reduced to RL = 0.035
(p = 0.95). The combined cumulative linear retreat was highly correlated with the
cumulative rainfall since the beginning of the rain phase (RL = 0.99, p = 0.0001). This
clearly indicates that cumulative rainfall, and thus gradual wetting and saturation of the
soil, is more important to headcut retreat than the wetting and surface runoff from daily
rainfall or individual storms.
The drainage area for the studied gullies varied from 0.7 (± 0.1) to 68 (± 7) ha with an
average value of 15.4 ha and standard deviation of 18.9 ha (Table 2.3). In order to
understand whether drainage area is related to both linear and volumetric retreat of the
gully in 2013, simple linear regression models (Figure 2.6a) and power-law
relationships (Figure 2.6b) between drainage area (DA, in ha) and cumulative headcut
retreat length (L, in m) and increase in gully volume (V, in m3) were developed. Since
rainfall in 2014 was less erosive and small gullies did not retreat, we did not use
regression relationships for the 2014 rain phase.

34
Figure 2.6. Fitting a linear (a) and a power-type (b) relationships between both the
linear (L) and volumetric (V) gully retreat and drainage area (DA) of the 13 gullies.
The predicted L and V using regression equations in Figure 2.6a were compared linearly
with the measured L and V. The goodness-of-fit parameters for the length L and volume
V were RL2 = 0.28 (p = 0.06), NSEL = 0.11 and PBIASL = 52%, and RV
2 = 0.69 (p <<
0.01), NSEV = 0.47 and PBIASV = 49%, respectively. Similarly, the predicted L and V
using a power-type regression equations in Figure 2.6b were compared with the

35
measured L and V. The goodness-of-fit parameters were RL2 = 0.33, NSEL = -0.36 and
PBIASL = 98%, and RV2 = 0.48, NSEV = 0.48, and PBIASV = 49%. For both the linear
and power-type fitting the R2 and NSE of the volumetric gully retreat were larger than
those for the gully linear retreat.
Figure 2.7 shows the water table rise above the gully bottom for all 13 gullies during
the rain phase, which indicates mostly saturated gully head and bank soils. In this study,
the water table measurements were carried out twice a day (i.e., in the morning and
evening). The groundwater table fluctuated between these readings (Figure 2.7), but the
variation was not significant (p = 0.98). The water table decreased between morning
and evening readings on average by 0.7 cm with a standard deviation of 4.0 cm. The
greatest fluctuations were observed at G2 (Figure 2.7). The power-type regression
model between the minimum water table depth during the rain phase (ranging from 0.02
m at G3 to 1.5 m at G1) and the linear retreat and volumetric expansion of the 13 gullies
had fairly high coefficients of determination with length (R2L= 0.62) and volume (R2
V
= 0.60) (Table 2.4).

36
Figure 2.7. Comparison of minimum groundwater table depth, gully headcut depth,
and the average groundwater table fluctuation between morning and night for the
13 study gullies in the Debre Mawi watershed, Ethiopia for the 2013 rain phase.
By fitting a simple linear regression, the volumetric gully expansion was significantly
related to the height of the gully headcut (R2V = 0.49, p = 0.007). However, the linear
retreat of the gully was not explained by the headcut height (R2L = 0.0004, p = 0.9). The
reason is likely the fact that gully G3, which had large linear retreat but small headcut
height affected the analysis. When this gully is excluded from the analysis, the R2L for
the linear and power relationship between the gully linear retreat and gully head height
increased from 0.0004 to 0.26 (p = 0.09) and from 0.21 to 0.52, respectively. In this
case, the gully height fairly well explained the linear retreat. Note that gully heads of
lower height are relatively more stable than those with greater heights. When the height
of the gully increases, gully bank failure occurs due to gravitational forces that tend to
move soil downslope exceed the forces of friction and cohesion that resist movement.

37
An equivalent increase in gully head stability can be obtained by regrading the gully
head to a lower slope.
Table 2.4. Power-type and linear regression equations of the longitudinal headcut
retreat, L, and the volumetric gully expansion, V, with the controlling factors, X,
listed in the first column: L or V = aXb. The goodness of the fit is represented by the
coefficient of determination, R2.
Controlling
factors (X)
L= aXb
For linear
regression
equation of L
with (X)
V = aXb
For linear
regression
equation of
V with (X)
a b R2 R2 p a b R2 R2 p
Water table 0.73 1.11 0.62 0.64 0.001 12.7 1.09 0.60 0.49 0.009
Drainage area 0.21 1.047 0.33 0.28 0.06 2.32 1.26 0.47 0.67 0.0007
Headcut depth 0.25 2.16 0.21 0.0004 0.9 1.57 3.24 0.47 0.49 0.007
Clay content 110.7 -1.05 0.023 0.05 0.46 0.000 4.04 0.018 0.08 0.35
Bulk density 5.73 -6.2 0.008 0.13 0.23 26.8 1.28 0.0004 0.02 0.67
The major soil texture for all gully banks was clay-sized (53 to 67% with standard
deviation of 4.5%), and an average bulk density of 1.2 ± 0.3 g cm-3 (Table 2.3). The
gully head retreat rates were only weakly correlated with the texture (Table 2.4),
probably because of the limited range in soil texture. Linear regression and power-type
regression of clay content with the volumetric and linear headcut retreat were not
therefore significant (Table 2.4).
2.4 Discussion
2.4.1 Effects of gully erosion on agricultural lands

38
Gully expansion affect the economic feasibility of soil conservation measures in
reducing the amount of land available to farm. In 2013, the net gully area in the Debre
Mawi watershed was 3% of the watershed area. If additional strips of 1 m width on each
side of the gully area is not cultivated, the total area taken up by gullies becomes 5% of
the total watershed area.
Most gullies in the watershed were not stable and impaired more than 16 ha of
agricultural land from 2005 to 2013. Gully expansion in the Debre Mawi watershed is
not evenly distributed because the upper slopes of the watershed (about 50% of the
watershed area) experience reduced gully formation because mainly the soil is not
saturated (Tilahun et al., 2013b, Steenhuis et al., 2014; Tebebu et al., 2015). Gully
expansion therefore affects mostly the bottomlands where soils become saturated
around the beginning of July (Tilahun et al., 2013b). A loss of 2 ha of productive
farmland per year is considerable for any farmer, but even more significant in a region
with small farmsteads. As farmers’ land holding in the Ethiopian Highlands is about 1
ha of land per household (Sonneveld and Keyzer, 2003), the land loss observed between
2005 and 2013 could have provided farmland for 16 farming households in the
watershed.
The rate of soil erosion (2005 - 2014) due to gully expansion in the subhumid Debre
Mawi watershed (127 t ha-1 yr-1) is more than 5 times as much as the upland erosion
reported by Tebebu et al. (2010) and Zegeye et al. (2010) in this watershed(Tebebu et
al., 2010; Zegeye et al., 2010). The soil loss relative to the change in gully surface area
is about 4000 t ha-1 yr-1 or 400 kg m-2 yr-1, which is more than 2-fold the rate reported

39
by Daba et al. (2003) for semiarid eastern Ethiopia over a 30-year period. One of the
reasons for the difference is that the gullies in the subhumid Debre Mawi watershed are
much deeper than in the semiarid area studied by Daba et al. (2003). Another reason is
that the soils are more often saturated in a humid climate than in semiarid areas. Upland
soil and water conservation practices are not effective for areas with gullies because
sediment concentration in the runoff increased greatly, effectively negating any positive
effect of upstream practices (Zegeye et al., 2015)
2.4.2 The relationship between gully headcut dimensions and their controlling
factors
Table 2.5 lists the goodness-of-fit parameters Eqs. (2.5–2.7) of the power-law and linear
regression relations between the change in gully volumetric headcut erosion (V), the top
width retreat or lateral expansion (W) and the linear headward migration of the headcut
(L). Both the power and linear regression analyses (Table 2.5) show that the volumetric
gully expansion (V) was strongly related to top width retreat (p < 0.01), whereas no
significant relation was found between V and L (p = 0.36). Similar results were obtained
using a power-law relationship (Table 2.5). Additionally, as shown in Table 1.1, the
relative change between 2005 and 2013 in net gully area (350%) is more than 2-fold the
relative change in length (199%). This indicates that sideways or lateral gully retreat is
a more important mechanism of soil loss and gully expansion than linear migration of
gully headcuts. Note that the R2 value can sometimes be misleading, as indicated by the
other goodness-of-fit parameters assessed. For example, the V-L power-law relationship
for all 13 gullies has an R2 = 0.83, which indicates a good fit between gully volume and
linear gully extension. However, based on NSE and PBIAS (Table 2.5), the relationship

40
between gully volumetric expansion predicted by the V-L equation (V=18.3L0.91) and
the observed volumetric expansion is not in the acceptable range (NSE = -0.004, PBIAS
= -32.4). This indicates that assessing the quality of fits between gully expansion
parameters cannot solely be done based on R2, and that good fits also require other
measures like NSE and PBIAS to be in the acceptable range.
Both the linear (Figure 2.6a) and power-type (Figure 2.6b) regression relationships
indicated that drainage area predicted the volumetric gully erosion (V) better than the
linear headward migration (L) of the gully headcut. This suggests that the larger the
drainage area, the greater the lateral expansion is by collapsing gully banks, and hence
the greater the sediment production. Studies in the semiarid Ethiopian Highlands with
relatively shallow soils over bedrock have indicated that drainage area (which was not
significantly related in the Debre Mawi catchment with deep sols) was a major
controlling factor of gully head retreat (Poesen et al., 2003; Frankl et al., 2012).
Table 2.5. Relations of the volumetric gully headcut erosion (V) with the headward
migration length (L) and the lateral erosion (W) during the 2013 rain phase for the
13 gullies in the Debre Mawi watershed. The observed gully volumes were fitted as
functions of L or W using power-law and linear regression models. V–W and V–L
refer to V as a function of W or L, respectively.
Relationship Power law relationship (V = a x b) Predicted versus measured
a b R2 R2 NSE PBIAS V–W 0.65 2.15 0.63 0.63 0.89 -21
V–L 18.3 0.91 0.83 0.83 -0.004 -32.4
Linear regression (V = mx + n) Predicted versus measured
m n R2 p R2 NSE PBIAS
V–W 33 -115 0.87 6.2E-06 0.89 0.88 11
V–L 6.9 112 0.07 0.36 0.08 0.08 0
x represents W or L; a, b, m, and n are constants.
Similar relationships were also developed by Vandekerchkhove et al. (2003) for
semiarid southeastern Spain (V = 0.069 DA0.38, R2 = 0.51) and Frankl et al. (2012) for

41
the semiarid Tigray region in northern Ethiopia (V = 0.53 DA0.31, R2 = 0.27). Note that,
in the Debre Mawi watershed, gully volume expansion is stronger related to drainage
area than in southeastern Spain and the Tigray region, as the power-law exponent is
about 4 times greater in the Debre Mawi watershed; the larger the exponent, the greater
the increase in V per unit increase in drainage area (Frankl et al., 2013). The ratio of the
volumetric expansion relations for Debre Mawi and the Tigray region is 4.4 DA0.95,
which shows a near linear increase in this ratio with drainage area. For a gully draining
10 ha of land in the Debre Mawi watershed, the volumetric expansion is on average
almost 40 times greater than that of a gully draining the same area in the semiarid Tigray
region studied by Frankl et al. (2012). The greater retreat rates in Debre Mawi are caused
by the rainfall amounts during the rain phase exceeding potential evaporation with
excess water saturating the valley bottoms (see Section 2.3.3). In addition, the Vertisol
soils are up to 10 m deep overlying the bedrock. This combined with high groundwater
tables, the potential for erosion is greater in the Debre Mawi watershed compared with
the drier semiarid regions of Tigray and southeastern Spain where soils are also thinner.
These findings are in accordance with Frankl et al. (2013) in that the establishment of
relationships like in Figure 2.6, is necessarily region-specific and only representative of
similar environmental settings with respect to climate, topography, lithology, soil and
vegetation.
2.4.3 Viable gully erosion control measures for the sub-humid Ethiopian highlands
Gully erosion can rapidly change landscapes as can be seen for instance for G6, G8, and
G11 in Figure 2.8. Gully G6 has expanded laterally into cultivated land through erosion

42
of the right bank (west bank), whereas lateral erosion of the left bank, located on
grassland, was rather limited. This decreased gully expansion on the grassed bank may
be due to the effect of the grasses either in terms of increasing the topsoil shear strength
(De Baets et al, 2008) or drying out the soil through evapotranspiration (Pollen and
Simon, 2005) and thereby reducing soil saturation. Also, grasses could modify overland
flow and infiltration patterns, and therefore affect subsurface drainage. Gully G11 was
surrounded by cultivated land on both sides, and hence expanded laterally through
erosion of both left (south) and right (north) banks. In 2012 the land adjacent to the left
bank was planted with eucalyptus trees to halt erosion.
In 2013, erosion of this left (south) bank was significantly reduced, and gully
development then occurred through extension in northeastern direction and lateral
expansion in northern direction instead (see Figure 2.8). The lesson learned from these
two gullies (G6 and G11) is that vegetation may reduce gully expansion by increasing
soil shear strength through their roots, slowing down the storm runoff and trapping
sediments which was also observed by among others, Gyssels and Poesen (2003) and
De Baets et al. (2006). Therefore, planting suitable species on the gully face and around
the boundary may reduce or slow down bank failure and water-induced erosion
especially for fairly deep gullies.

43
Figure 2.8. Examples of gully expansion in the Debre Mawi watershed. Top four
photos: expansion of gullies G8 and G11 during the 2013 rain phase and the trees
which fell in to the gullies from upstream, Bottom image: expansion of gullies G6
and G11 between 2005 and 2013.
In contrast to the above explanation, although both banks of G8 were surrounded by
grasses (Figure 2.8), the gully head migrated uphill by about 25 m in 2 months. The
reasons for this could be that (1) both banks were steep and deep enough for gravity-
induced bank failure and that (2) the surrounding soil was highly saturated (Table 2.3)
and bank layers near the bottom were more erodible than the overlying layer, causing a

44
preferential retreat that undercut the bank and consequent cantilever failures (Figure
A1-3).
Our monitoring data also contained valuable information regarding the effectiveness of
soil and water conservation measures such as soil bunds that were extensively installed
across the upper portion of the catchment since 2012. Dagnew et al. (2015), in the same
watershed, reported that soil bunds reduced runoff by 60%, sediment concentration by
36%, and sediment load by 80%, which resulted in a significant reduction of runoff
volume and sediment loads in the first 2 years of implementation. However a reduction
of downslope sediment concentration was not significant due to the presence of large
gullies near the watershed outlet. Further, the SWC measures (soil bunds), aimed to
reduce the development of rills and gullies in the area, were implemented on saturated
Vertisol areas, and have rather led to gully initiation and development (see Figure 2.1f;
Steenhuis et al., 2014, Dagnew et al., 2015). These soil and water conservation measures
appear to be ineffective on these locations as they cannot reduce or stop upslope gully
headcut migration of gullies downslope, which requires alternative, structural measures.
Similarly, diversion waterways have been tested in the watershed to arrest gully heads,
but have produced new gully branches (Zegeye et al., 2014). Our data therefore support
the findings of Dagnew et al. (2015), which indicate that the extensive implementation
of soil and water conservation measures on periodically saturated Vertisol areas may
have exacerbated, rather than mitigated gully formation and expansion.
In the bottomlands of the watershed with Vertisols dominant, gully formation was
severe due to alternate swelling and shrinking of expanding clays resulting in deep

45
cracks in the dry season (Figure 2.1c). As was previously observed by Frankl et al.
(2012), the shrink-swell behavior of Vertisols eventually developed into pipes (Figure
2.1d) and contributed to gully development. Though pipes contribute to gully formation,
we observed in this study that they are also important to drain excess subsurface water
near the gully banks, thereby potentially mitigating gully expansion. For example, soil
pipes in the heads of gullies G7 and G13 drained the elevated groundwater table
resulting in only minor headcut retreat (Table 2.3). This implies that gully expansion
rates could be reduced by controlling the water table and therefore the pore-water
pressures in the gully head (Zegeye et al., 2016). For example, drop pipes are a common
practice in the United States (Field Office Technical Guide standard 587; NRCS, 2015)
to control groundwater and surface water level to halt erosion of gully heads up to 15 m
in height, but they can be very costly (>$50,000 each). Moreover, most of the Debre
Mawi watershed gullies are deep gullies (up to 7 m) that are therefore susceptible to
gravity-induced bank collapse. Regrading the gully head and bank slopes decreases their
weight and reduces the probability of bank failure (Langendoen et al., 2014, Zegeye et
al., 2016).
In the semiarid Tigray region of northern Ethiopia, Frankl et al. (2012) recommended
the application of a subsurface geo-membrane (vertical dam) at the gully head to
increase groundwater levels and subsequently decrease soil cracking and soil piping.
However, this may not be effective in the (sub) humid region of Ethiopian Highlands as
we have shown that elevated groundwater tables increases the rate of gully expansion

46
(Table 2.4, Figure 2.1f). Therefore, gully mitigation measures in the subhumid
Ethiopian Highlands and similar climate types should aim to reduce soil water content.
2.5 Conclusions
Field observations in the Debre Mawi watershed indicate that permanent valley‐bottom
gully drainage networks and in particular gully widening and headcut retreat are
important erosion processes severely impacting the productive farmlands.
Gully mapping and monitoring indicated that the continued gully incision, lateral
expansion and headward extension are governed by the collapse of the gully head and
sidewalls, and the subsequent removal of the failed materials by flowing water (Figures
2.1 and 2.7). About 5% of the watershed area has been impaired by the expanding gully
network. The gully expansion rate at the watershed scale between 2005 and 2013 was
127 t ha-1 yr-1 (Table 2.1). The headcut migration of the 13 gullies during the 2013 rain
phase varied significantly from 0.04 to 36 m yr-1 (Table 2.3 and Figure 2.5).
Understanding the controlling factors of gully head migration and lateral expansion of
gullies is crucial to design appropriate gully control measures. Retreat rates depended
most strongly on groundwater table elevation (Table 2.4). The elevated water tables
saturate the soils surrounding the gullies thereby reducing the soil erosion resistance.
An elevated groundwater table may also lead to seepage-induced erosion. Additionally,
the gully head depth and the drainage area, which is representative of surface runoff
magnitude, were other factors controlling gully erosion in the Debre Mawi watershed
47
(Table 2.4). Therefore, conservation practices that address these parameters may be
most effective.
The lateral retreat for deep gullies contributes the most to the volumetric gully erosion
in the Debre Mawi watershed (Table 2.5). Therefore, regrading the gully head and bank
slopes could reduce the occurrence of gravity-induced bank collapse for deep gullies.
Studies need to be designed to evaluate the effects of controlling groundwater
movement, for example by subsurface drainage, on the stability of Vertisols. Vegetation
may play a vital role in reducing soil water and increasing soil shear strength. The
planting of an assemblage of suitable, native plant species (both herbaceous and woody)
is being tested in the watershed.
ACKNOWLEDGMENTS
This research was supported financially by Borlaug LEAP-016258-82, International
Foundation for Science (IFS-W/5407-1), Cornell University (Presbyterian Church,
Hudson H. Lyon research fund and Bradfield research award) and PEER Science
Program of USAID (ID-OAA-A-11-00012).

48
REFERENCES
Abiy, A.Z.: Geological controls in the formations and expansions of gullies over
hillslope hydrological processes in the highlands of Ethiopia, Northern Blue
Nile Region, MPS Thesis, Cornell University, NY, US, 2009.
Avni, Y.: Gully incision as a key factor in desertification in an arid environment, the
Negev Highlands, Israel, Catena, 63, 185-220, 2005.
Begin, Z.B., Meyer, D.F., and Schumm, S.A.: Knick point migration due to base level
lowering, American Society of Civil Engineers Journal of Waterways Port
Coastal and Ocean Division, 106, 369–388, 1980.
Billi, P. and Dramis, F.: Geomorphological investigation on gully erosion in the Rift
Valley and the northern highlands of Ethiopia, Catena, 50, 353– 368, 2003.
Bayabil, H. K., Tilahun, S.A., Collick, A. S., and Steenhuis, T. S.: Are runoff
processes ecologically or topographically driven in the Ethiopian highlands?
The case of the Maybar watershed, Ecohydrol, 3, 457-466, 2010.
Campo-Bescós, M. A., Flores-Cervantes, J. H., Bras, R. L., Casalí, J. and Giráldez, J.
V.: Evaluation of a gully headcut retreat model using multitemporal aerial
photographs and digital elevation models, JOURNAL OF GEOPHYSICAL
RESEARCH: EARTH SURFACE, 118, 2159–2173, 2013.
Capra, A., Porto, P. and Scicolone, B.: Relationships between rainfall characteristics
and ephemeral gully erosion in a cultivated catchment in Sicily (Italy), Soil
Tillage Res., 105(1), 77–87, 2009
Casalí, J., Loizu, J., Campo, M. A., De Santisteban, L. M., and Álvarez-Mozos, J.:
Accuracy of methods for field assessment of rill and ephemeral gully erosion,
Catena, 67, 128–138, 2006.
Casalí, J., Giménez, R. and Campo-Bescós M. A.: Gully geometry: what are we
measuring? SOIL, 1, 509–513, 2015, doi:10.5194/soil-1-509-2015
Daba, S., Rieger, W. and Strauss, P.: Assessment of gully erosion in eastern Ethiopia
using photogrammetric techniques, Catena, 50, 273-291, 2003.
Day, P.R.: Particle fractionation and particle-size analysis, in: Methods of soil
analysis, Part 1, C.A. Black et al (ed.), Agronomy, 9, 545-567, 1965.
De Baets, S., Poesen, J., Gyssels, G., and Knapen, A.: Effects of grass roots on the
erodibility of top soils during concentrated flow, Geomorphology, 76(1), 54-
67, 2006.

49
De Baets, S., Poesen, J., Reubens, B., Wemans, K., De Baerdemaeker, J., and Muys,
B.: Root tensile strength and root distribution of typical Mediterranean plant
species and their contribution to soil shear strength, Plant and Soil, 305(1-2),
207-226, 2008.
Dagnew, D. C., Guzman, C. D., Zegeye, A. D., Tebebu, T.Y., Menelik, G., Solomon,
A., Zemale, F.A., Ayana, E.K., Tilahun, S. A., and Steenhuis, T. S.: Impact of
conservation practices on runoff and soil loss in the sub-humid Ethiopian
Highlands: The Debre Mawi watershed, J.Hydrol.Hydromech., 63, 214-
223,doi:10.1515-johh-2015-0021, 2015.
Engda, T. A., Bayabil, H. K., Legesse, E. S., Ayana, E. K., Tilahun, S. A., Collick, A.
S., Easton, Z. M., Rimmer, A., Awulachew, S. B., and Steenhuis, T. S.:
Watershed hydrology of the (semi) humid Ethiopian highlands, in: Nile River
basin: Hydrology, Climate, and Land Use, A. Melesse, Springer Science, New
York, 145-162, 2011.
Frankl, A., Poesen, J., Deckers, J., Haile, M., and Nyssen, J.: Gully head retreat rates
in the semi-arid highlands of Northern Ethiopia, Geomorphology, 173, 185-
195, 2012.
Frankl, A., Zwertvaegher, A., Poesen, J., and Nyssen, J.: Transferring Google Earth
Observations to GIS-software: example from gully erosion study, International
Journal of Digital Earth, 6, 196-201, doi: 10.1080/17538947.2012.744777,
2013a.
Frankl, A., Nyssen, J., De Dapper,M., Haile, Mitiku, Billi, P., Munro, R.N., Deckers,
J., Poesen, J.: Linking long-term gully and river channel dynamics to
environmental change using repeat photography (North Ethiopia),
Geomorphology, 129, 238–251, 2011
Frankl A, Poesen J, Scholiers N, Jacob M, Haile M, Deckers J, Nyssen J.: Factors
controlling the morphology and volume (V)–length (L) relations of permanent
gullies in the Northern Ethiopian Highlands, Earth Surface Processes and
Landforms, 38(14), 1672–1684, 2013b.
Frankl, A. Poesen, J., Haile, M., Deckers J. and Nyssen, J.: Quantifying long-term
changes in gully networks and volumes in dryland environments: The case of
Northern Ethiopia, Geomorphology, 201, 254-263, 2013c.
Frankl, A. Deckers, J. Moulaert, L. Van Damme, A. Haile, M. Poesen J. and Nyssen
J.: Integrated solutions for combating gully erosion in areas prone to soil
piping: innovations from the drylands of Northern Ethiopia, Land Degradation
& Development, 2014.

50
Gyssels, G. and Poesen, J.: The importance of plant root characteristics in controlling
concentrated flow erosion rates, Earth Surf. Process. Landforms, 28, 371-384,
2003.
IUSS Working Group WRB.: World Reference Base for Soil Resources 2014, update
2015, International soil classification system for naming soils and creating
legends for soil maps, World Soil Resources Reports No. 106, FAO, Rome,
2015.
Jones J. A. A.: The effects of soil piping on contributing areas and erosion patterns,
Earth Surface Processes and Landforms,12,229-248,
DOI: 10.1002/esp.3290120303, 1987.
Ku H. H.: Notes on the Use of Propagation of Error Formulas, JOURNAL OF
RESEARCH of the National Bureau of Standards - C. Engineering and
Instrumentation, 70C, No.4, 1966.
Lanckriet, S., Frankl, A., Mesfin, G., Descheemaeker, K., and Nyssen, J.: Gully cut-
and-fill cycles as related to agro-management: a historical curve number
simulation in the Tigray Highlands, Earth Surf. Process, Landforms, 40(6),
796-808, doi: 10.1002/esp.3687, 2015.
Langendoen, E. J. and Simon, A.: Modeling the evolution of incised streams, II:
Streambank erosion, Journal of Hydraulic Engineering, 134, 905-915, 2008.
Langendoen, E. J., Tebebu, T. Y., Steenhuis, T. S., and Tilahun, S. A.: Assessing gully
widening and its control in the Debre-Mawi Watershed, northern Ethiopia, in:
Proceedings of the first International Conference on Science and Technology
towards the Development of East Africa (ICST), Bahir Dar, Ethiopia, 214–
222, 2013
Langendoen, E.J., Zegeye, A.D., Tebebu, T.Y., Steenhuis, T.S., Ayele, G.K., Tilahun,
S.A., and Ayana, E.K.: Using computer models to design gully erosion control
structures for humid northern Ethiopia, in: proceedings of Hydro-Engineering
for Environmental Challenges, 11th International Conference on Hydroscience
& Engineering (ICHE 2014), Hamburg, 28 Sep - 02 October 2014, ISBN 978-
3-939230-32-8, 2014.
Muñoz-Robles, C., Reid, N., Frazier, P., Tighe, M., Briggs, S. V., and Wilson, B.:
Factors related to gully erosion in woody encroachment in South-Eastern
Australia, Catena, 83, 148-157, 2010.
Nyssen, J., Poesen, J., Moeyersons, J., Luyten, E., Veyret, P.M., Deckers, J., Haile,
M., and Govers, G.: Impact of road building on gully erosion risk: a case study

51
from the northern Ethiopian Highlands, Earth Surf. Process Landforms, 27,
1267–1283, 2002.
Nyssen, J., Veyret-Picot, M., Poesen, J., Moeyersons, J., Haile, M., Deckers, J., and
Govers, G.: The effectiveness of loose rock check dams for gully control in
Tigray, northern Ethiopia, Soil Use and Management, 20, 55-64, doi:
10.1079/SUM2003223, 2004a.
Nyssen, J., Poesen, J., Moeyersons, J., Deckers, J., Haile, M., and Lang, A.: Human
impact on the environment in the Ethiopian and Eritrean Highlands: A state of
the Art, Earth-Science Reviews, 64, 273-320, 2004b.
Nyssen, J., Poesen, J., Veyret-Picot, M., Moeyersons, J., Haile, M., Deckers, J., Dewit,
J., Naudts, J., Teka, K., and Govers, G.: Assessment of gully erosion rates
through interviews and measurements: a case study from northern Ethiopia,
Earth Surf. Process. Landforms 31, 167–185, doi: 10.1002/esp.1317, 2006.
Nyssen, J., Poesen, J., Moeyersons, J., Haile, M., and Deckers, J.: Dynamics of soil
erosion rates and controlling factors in the Northern Ethiopian Highlands-
Towards a Sediment Budget, Earth Surf. Process. Landforms, 33, 695-711,
2008.
Nyssen, J., Clymans, W., Poesen, J., Vandecasteele, I., De Baets, S., Haregeweyn, N.,
Naudts, J., Hadera, A., Moeyersons, J., Haile, M., and Deckers, J.: How soil
conservation affects the catchment sediment budget – a comprehensive study
in the north Ethiopian highlands, Earth Surf. Process. Landforms 34, 1216–
1233, 2009.
Oksanen J.& Sarjakoski T.: Error propagation analysis of DEM‐based drainage basin
delineation, International Journal of Remote Sensing, 26, (14), 3085-3102,
DOI:10.1080/01431160500057947, 2005.
Oostwoud Wijdenes, D.G. and Bryan, R.B.: Gully-head erosion processes on a semi-
arid valley floor in Kenya: a case study into temporal variation and sediment
budgeting, Earth Surf. Process. Landforms 26, 911–933, doi: 10.1002/esp.225,
2001.
Poesen, J.: Gully typology and gully control measures in the European loess belt, in:
Farm Land Erosion in Temperate Plains Environment and Hills, Wicherek, S.,
Elsevier, Amsterdam, 221– 239, 1993.
Poesen J, Nachtergale J, Vertstraeten G, Valentin C.: Gully erosion and environmental
change. Importance and research needs. Catena, 50 (2–4), 91– 134, 2003
52
Pollen, N. and Simon, A.: Estimating the mechanical effects of riparian vegetation on
stream bank stability using a fiber bundle model, Water Resources Research,
41, W07025, doi: 10.1029/2004WR003801, 2005.
Ritter, A., and Muñoz-Carpena, R.: Performance evaluation of hydrological models:
Statistical significance for reducing subjectivity in goodness-of-fit
assessments, Journal of Hydrology 480, 33–45, 2013.
Simon, A., Curini, A., Darby, S. E., and Langendoen, E. J.: Bank and near-bank
processes in an incised channel, Geomorphology, 35, 193–217, 2000.
Simon, A., Pollen-Bankhead, N., and Thomas, R.E.: Development and application of a
deterministic bank stability and toe erosion model for stream restoration, in:
Stream Restoration in Dynamic Fluvial Systems: Scientific Approaches,
Analyses, and Tools, AGU, Washington, DC, A. Simon, S.J. Bennett and J.M.
Castro, 453–474, 2011.
Sonneveld, B. and Keyzer, M.: Land under pressure: Soil conservation concerns and
opportunities for Ethiopia, Land Degradation & Development, 14, 5-23, 2003.
Steenhuis, T. S., Tebebu, T.Y., Ayele, G. K., Guzman, C.D., Bayabil, H.K., Zegeye,
A.D., Mogus, M., Dagnew, D.C., Stoof, C.R., and Tilahun, S.A.: Prioritizing
landscape interventions in the Ethiopian highlands, Geophysical Research
Abstracts, EGU General Assembly, May 2014, 16, EGU2014-16338, 2014.
Tamene, L., Park, S.J., Dikau, R., and Vlek, P.L.G.: Analysis of factors determining
sediment yield variability in the highlands of northern Ethiopia,
Geomorphology, 76, 76– 91, 2006.
Tebebu, T. Y., Abiy, A. Z., Zegeye, A. D., Dahlke, H. E., Easton, Z. M., Tilahun, S.
A. Collick, A. S. Kidnau, S., Moges, S., Dadgari, F., and Steenhuis, T. S.:
Surface and subsurface flow effect on permanent gully formation and upland
erosion near Lake Tana in the northern highlands of Ethiopia, Hydrol. Earth
Syst. Sci., 14, 2207–2217, 2010.
Tebebu, T.Y., Zegeye, A. D., Langendoen, E. J., Ayele, G. K., Tilahun, S. A., Ayala,
E. K., and Steenhuis, T.S.: Arresting gully formation in the Ethiopian
Highlands, in: proceeding of rainwater management for resilient livelihoods in
Ethiopia, ILRI, W. Mekuria, Nairobi, Kenya, 196–203, 2014.
Tebebu, T.Y., Steenhuis, T.S., Dagnew, D.C., Guzman, C.D., Bayabil ,H.K., Zegeye,
A.D., Collick, A.S., Langan, S., McAllister, C., Langendoen, E.J., Yitaferu, B.,
and Tilahun, S.A.: Improving efficacy of landscape interventions in the (sub)
humid Ethiopian highlands by improved understanding of runoff processes,
Front. Earth Sci. 3, 49, doi: 10.3389/feart.2015.00049, 2015.

53
Thorne, C. R.: Effects of Vegetation on Riverbank Erosion and Stability, Vegetation
and Erosion, 125-144, http://www.lsln.net.au/jspui/handle/1/4071, 1990.
Tilahun, S. A., Guzman, C. D., Zegeye, A. D., Engda, T. A., Collick, A. S.,
Rimmer, A., and Steenhuis, T. S.: An efficient semi-distributed hillslope
erosion model for the subhumid Ethiopian Highlands, Hydrol. Earth Syst. Sci.,
17, 1051-1063, doi:10.5194/hess-17-1051-2013, 2013a.
Tilahun, S. A., Mukundan, R., Demisse, B. A., Engda, T. A., Guzman, C. D.,
Tarakegn, B. C., Easton, Z. M., Collick, A. S., Zegeye, A. D., Schneiderman,
E. M., Parlange, J.Y., and Steenhuis, T. S.: A saturation excess erosion model,
American Society of Agricultural and Biological Engineers, 56(2), 681-695,
2013b, doi: 10.13031/2013.42675, 2013b.
Valentin, C., Poesen, J., and Li, Y.: Gully Erosion: Impacts, Factors and Control,
Catena, 63, 132-153, 2005.
Vandekerckhove, L., Poesen, J., and Govers, G.: Medium-term gully headcut retreat
rates in southeast Spain determined from aerial photographs and ground
measurements, Catena, 50, 329-352, 2003.
Vanmaercke, M., Poesen, J., Van Mele, B., Demuzere, M., Bruynseels, A., Golosov,
V., Bezerra, J. F. R., Bolysov, S., Dvinskih, A., Frankl, A.: How fast do gully
headcuts retreat? Earth-Science Reviews, 154, 336–355, doi:10.1016/j.earscirev.2016.01.009, 2016.
Zegeye, A. D., Steenhuis, T. S., Blake, R. W., Kidnau, S., Collick, A. S., and Dadgari,
F.: Assessment of soil erosion processes and farmer perception of land
conservation in Debre Mewi watershed near Lake Tana, Ethiopia,
Ecohydrology & Hydrobiology, 10, 297-306, 2010.
Zegeye, A.D., Amare, S.D., Tilahun, S.A., Langendoen, E.J., Dagnew, D. C.,
Guzman, C.D., Tebebu, T .Y., and Steenhuis, T.S.: Gully development
processes in the Ethiopian highlands, in: Proceedings of the second
International Conference on the Advancements in Science and Technology
(ICAST), Bahir Dar University, 220-229, 2014.
Zegeye, A.D., Amare, S.D., Tilahun, S.A., Dagnew, D.C., Addisie, M.B., Ayele, G.K.,
Guzman, C.D., Langendoen, E.J., Tebebu, T .Y., Kassie, T.A., Tilahun, S.A.,
and Steenhuis, T.S.: Sediment production from gully erosion in the (sub)
humid Ethiopian highlands: The Debre Mawi watershed, TROPILAKES
general assembly, Bahir Dar, Ethiopia, 23-29 September 2015.
Zegeye A.D., Amare S.D., Tilahun S.A., Steenhuis T.S., Langendoen E.J.: Calibration
and validation of the CONCEPTS computer model for predicting gully erosion

54
and control in the sub-humid Ethiopian Highlands: The Debre Mawi
watershed, in: Proceedings of the 4th International Conference on the
Advancements in Science and Technology (ICAST), Bahir Dar University, 9-
21, 2016.

55
CHAPTER 3
SOIL LOSS FROM A GULLY IN THE SUB-HUMID ETHIOPIAN
HIGHLANDS: THE DEBRE MAWI WATERSHED
Abstract
Land use changes in many landscapes result in gully formations carving up agricultural
land and filling up downstream reservoirs. This is the case in the Ethiopian highlands
where gullies are one of the main reasons for elevated sediment concentrations in rivers
that have been increasing over the last 50 years. Despite the major effect of gully erosion
on sediment loads, its contribution to the amount of soil loss and sediment concentration have
not been well quantified. Our objectives are to better understand sediment contributed by gullies
and to explore effective control measures. A gully in the Debre Mawi watershed, 30 km south
of Lake Tana, was selected for this purpose. We measured the discharge and sediment
concentrations upstream and downstream of the 5-m deep gully located in a valley bottom of a
13 ha catchment over a 2-year period. The results demonstrated that the sediment concentration
at the outlet was about 8 times greater than at the inlet. The sediment budget calculation showed
that about 92% of the total sediment carried by the runoff originated within the gully. This was
confirmed by the sediment loss pattern in the outflow where sediment concentrations are greater
for a given flow in the beginning of the runoff event than near the end implying that sediment
transport in the gully system is primarily controlled by the quantity of sediment available in the
channel or bank failure. Thus, in order to reduce sediment loads in rivers, designing cost-
effective measures to treat gullies should be a priority for future research.

56
3.1 Introduction
Land use changes in many landscapes result in upland erosion and gully formation,
reducing land productivity, carving up agricultural land, and filling up downstream
reservoirs (Bradford et al., 1973; Ghimire and Uprety, 1990; Bunt et al., 2004;
Fleitmann et al., 2007; Zema et al., 2012; De Vente et al., 2013; Haregeweyn et al.,
2013; Borrelli et al., 2014; Palazón et al., 2014; Ben Slimane et al., 2015; Gessesse et
al., 2015). This is affecting the livelihood and well-being of rural communities that rely
on waterways for drinking water, small-scale irrigation, or fisheries, which are seriously
affected (Poesen et al., 1996; Poesen et al., 2003; Haregeweyn et al., 2006; Tamene et
al., 2006; Haregeweyn et al., 2013), and calls are being made for immediate solutions
(Cao et al., 2006; García et al., 2010; Wang and Shao, 2013; Zhao et al., 2013; Ayele et
al., 2015; Kou et al., 2015).
Some of the major sediment sources which are widely recognized are road
embankments (Jones et al., 2000; Nyssen et al., 2002; Arnaez et al., 2004; Cerdà, 2007;
De Oña et al., 2009; Pereira et al., 2015), unprotected upper catchments (Klein, 1984;
Collins et al., 1997; Collins et al., 2001; Jain and Goel, 2002; Zheng, 2006; Turkelboom
et al., 2008; Cerdà et al., 2016) and gullies (Gomez et al., 2003; Poesen et al., 2003;
Valentin et al., 2005; De Vente et al., 2007; Tebebu et al., 2010; Langendoen et al.,
2014; Ben Slimane et al., 2015).
The relative contributions of sediment by gullies in a catchment vary: 53% in Kenya
(Oostwoud Wijdenes and Bryan, 1994), 44% in Central Belgium (Vandaele and Poesen,

57
1995), 80% in Southeast Portugal (Vandaele et al., 1996), 60-80% in USA (Simon and
Rinaldi, 2006), and 85% in Southwest Virginia (Clark and Wynn, 2007). The sediment
contributing potential of gullies is attributed to the fact that they are effective links to
transport sediment downstream (Bradford et al., 1973; Nyssen et al., 2001; Poesen et
al., 2003).
In the Ethiopian highlands where the population has been increasing rapidly, forest and
grass lands have been replaced by continuous cultivation decreasing organic matter
content and increasing erosion (Nyssen et al., 2004; Bewket and Sterk, 2005; Tebebu et
al., 2015) and gully erosion has become rampant (Tebebu et al., 2010; Frankl et al.,
2013; Langendoen et al., 2014). In addition, many of the reservoirs recently constructed
rapidly fill with sediments after only a few years. For example, the Gindae and Maidelle
reservoirs in northern Ethiopia have lost their dead storage in less than a quarter of the
expected life time (Tamene et al., 2006; Haregeweyn et al., 2013). Another example is
Lake Alemaya, which was 50% of its original size in 2003 mainly due to siltation (Daba
et al., 2003), and currently does not exists anymore (Tsegaye, 2014).
Although gully erosion has already been acknowledged as an important source of
erosion in temperate, arid, and semi-arid regions for a long time (Ireland et al., 1939;
Simon et al., 2011), it was not recognized as an important erosion process until 1997 in
semi-arid Ethiopia (Hawando, 1997) and until 2010 in the sub humid and humid
highlands of Ethiopia when the first refereed paper on gully erosion appeared by Tebebu
et al. (2010). More recently, a few conference proceedings papers have been presented

58
(Langendoen et al., 2013; Langendoen et al., 2014) for the “wet” Ethiopian highlands.
Most of studies in this region were concerned with sheet and rill erosion and are reported
as the most important problems in the region (Bewket and Sterk, 2005; Hurni et al.,
2005; Zegeye et al., 2010; Amare et al., 2014). This may be one of the reasons that the
government of Ethiopia has started a large-scale soil and water conservation (SWC)
campaign mainly focused on controlling sheet or rill erosion in the uplands (Nyssen et
al., 2006; Dagnew et al., 2015). Although this has resulted in sediment load reduction
due to decreased amounts of runoff, sediment concentrations at the outlet of catchments
have remained elevated when gullies are present (Zegeye et al., 2014; Dagnew et al.,
2015; Zegeye et al., 2016).
Since gully erosion is one of the main causes of the increased sediment concentration,
it is the focus of this dissertation. The objective of this paper is, therefore, to begin
investigating the interaction of upland and gully erosion and to quantify the portion of
sediment originating from a gully in order to be able to design effective erosion control
practices in the sub-humid Debre Mawi watershed.
3.2 Materials and methods
3.2.1 Area description
The study was conducted in the Debre Mawi watershed, located near Lake Tana in the
upper Blue Nile Basin at 11°20'13" N and 37°25'55" E (Figure 3.1). The watershed
drains an area of 608 ha. Its elevation ranges from 2,186 to 2,368 m above sea level.

59
The slope in the watershed ranges from 1 to 2% for flat bottom lands and from 8 to 30%
elsewhere. Rainfall is unimodal and averages 1,240 mm annually. More than 70% of
the average annual rainfall occurs in the period from June to August. The average
monthly temperature is 20°C.
While the watershed is located in the most productive region of the country, the land is
being severely affected by expanding gully networks (Figure 3.1) and to a lesser degree
by sheet and rill erosion on the cultivated slopes (Zegeye et al., 2010; Langendoen et
al., 2013; Amare et al., 2014; Langendoen et al., 2014). The gully networks are mainly
found in the periodically saturated bottom lands (Figure 3.1b) with a high regional
groundwater table and in some upland areas where lava dykes in the watershed affect
the hydrology, forcing subsurface flow to the surface and causing saturated source areas
(Abiy, 2009; Tebebu et al., 2010).

60
Figure 3.1. (a) the small rectangle in the basin is where Debre Mawi found, (b)
gully networks in the Debre Mawi watershed, the deep black shows the study gully
shown in c, (c) the expansion of the study gully between 2005 and 2013 (Zegeye et
al., 2016), (d) the study gully looking downstream
Discharge and sediment measurements were taken to monitor one selected gully (Figure
3.1c, d) located at the periodically saturated bottom lands of the watershed with
elevation ranges from 2,215 to 2,227 m a.s.l. with a channel slope of 0.03. The gully,
up to 30 m downstream from the headcut, is characterized by near-vertical head and
side walls 3 to 4 m high while its average depth is 5 m. At a distance of greater than 30
m downstream from the headcut, the upper 0.5 to 1.0 m of the sidewall is vertical, and

61
the lower sidewall has an average angle less than 45o. The lower slopes are relatively
stable as long as runoff is insufficient to transport the debris slumped from the sidewalls.
Two weirs were installed in the gully, one at the entrance (inlet) and one at the outlet of
the gully, located 389 m downstream. The two rectangular weirs were constructed using
concrete. The inlet and outlet weirs have two and four steps respectively (Figure B1-1).
At the start of the study (in 2013), a 4 m deep headcut along the gully was found 92 m
downstream of the inlet weir (Table 3.1, Figure 3.1). The area draining into the inlet of
the gully was 13.2 ha. Drainage of the area between the weirs occurred through
subsurface flow.
3.2.2 Measuring gully geometry
To determine the amount of soil loss from the gully, the 389 m gully was divided into
35 cross sections with the distance between two successive cross-sections varying
between 6 m and 13 m depending mainly on the uniformity of the gully width. Three
gully topographic surveys were conducted: before the rainy phase on 28 June 2013, after
the rainy phases on 18 Sep 2013 (Figure 3.2), and after the rainy phase on 18 Oct 2014.
Width was measured using benchmark pins installed 5 to 10 m from the gully edges and
a tape measure. Gully cross-sectional geometry was surveyed by dividing the section
into several trapezoidal segments at abrupt changes in profile, and measuring the width
and depth of each segment (Figure 3.2). Cross-sectional area (A) was then calculated
as:

62
𝐀 =𝟏
𝟐∑|(𝒘𝒊ℎ𝒊+𝟏 − 𝒘𝒊+𝟏𝒉𝒊)| (3.1)
𝒏−𝟏
𝒊=𝟏
where n is the number of trapezoidal segment sides of height h and located a distance w
(cross-section width) from the left gully edge in a cross-section (Figure 3.2), i is a
trapezoidal segment index.
The gully volume (V) was calculated as:
V = ∑𝟏
𝟐𝐋𝐣(𝐀𝐣
𝐍−𝟏
𝐣=𝟏
+ 𝐀𝐣+𝟏) (3.2)
where the subscript j is cross-section index, N is number of cross-sections, and Lj is
channel length of the gully section between cross-sections j and j+1.

63
Figure 3.2. Measured profiles of a cross-section, showing the lateral and downward
expansion of the gully and the longitudinal retreat (the broken line) of the gully
between 28 June to 18 Sep 2013
The total soil loss volume over the monitoring period was then obtained by the
difference in VT after and before the 2013 and 2014 rainy phases. To convert the volume
of soil loss (obtained from gully topographic measurements) to mass, four soil bulk
density (BD) samples were collected from four soil layers of the sidewalls of the gully
2 m downstream from the headcut with a 98 cm3 cylindrical core sampler.
3.2.3 Measuring runoff and sediment concentration
During rainfall-runoff events, at 10-minute intervals, stage height and stream velocity
were measured and sediment samples were collected at both weirs from the beginning
of the storm until base level was reached or when the flow stopped. Sediment samples

64
were collected in one-liter bottles at two-thirds of the depth of the stream starting at the
initial rise of the hydrograph until the initial depth was reached again. Stage height was
measured manually by tape measure and the runoff velocity in the stream was measured
by timing a float, put in at a distance 5 m upstream of the weir. This distance was
selected in such a way that we had confidence that the gully cross-sectional area was
almost similar to the weir cross-sectional area at about this distance at both weirs so that
over or underestimation due to the cross-sectional change would be minimal.
Additionally, during days without rainfall (or only base flow), discharge and sediment
measurements were made and samples were collected three times daily (morning, noon
and evening) at the two weirs.
The discharge was determined in two different ways: (1) by multiplying the wetted
cross-sectional area above the weir by two-thirds of the surface velocity; and (2) through
rating curve for the occasions that the velocity is not available. We developed the rating
curve (q versus h) for the inlet and outlet weirs for the 2014 monsoon season (Figure
B1-2) by fitting a power relationship (Eqs. B1-S1 and B1-S2) for each “step” of the
weir. The predicted versus the measured discharge is shown in Figure B1-3.
Sediment concentrations were determined by filtration of the samples over pre-weighed
filter papers in the laboratory, which were then oven-dried for 24 hours at 105 °C and
reweighed to the nearest 0.001 g. The suspended sediment load (SL) was then calculated
using the equation SL = qc where q is discharge, and c is sediment concentration. Total
amounts of runoff and suspended sediment per event were then obtained by integrating
the individual measurements over time.

65
3.2.4 Gully sediment budget calculation
An annual sediment budget for the gully can be formulated simply as:
𝜌(𝑉𝑡 − 𝑉𝑡−∆𝑡) = (𝑆𝐿𝑜𝑢𝑡𝑙𝑒𝑡,𝛥𝑡 − 𝑆𝐿𝑖𝑛𝑙𝑒𝑡,∆𝑡) (3.3)
where V (m3) is the volume of gully, 𝜌 is the bulk density (t m-3) and SL (t) is cumulative
sediment lost over Δt at the outlet or at the inlet as indicated by the subscripts. In
addition, we can quantify the gully enrichment ratio, ε, in sediment mass at the outlet
relative to the inlet for the 2013-2014 rainy phase as:
휀 =𝑆𝐿𝑜𝑢𝑡𝑙𝑒𝑡,𝛥𝑡 − 𝑆𝐿𝑖𝑛𝑙𝑒𝑡,𝛥𝑡
𝑆𝐿𝑖𝑛𝑙𝑒𝑡,𝛥𝑡 (3.4)
Further, we can calculate the portion of sediment that originates from the gully itself as:
𝛿 =𝑆𝐿𝑜𝑢𝑡𝑙𝑒𝑡,𝛥𝑡 − 𝑆𝐿𝑖𝑛𝑙𝑒𝑡,𝛥𝑡
𝑆𝐿𝑜𝑢𝑡𝑙𝑒𝑡,∆𝑡 (3.5)
Note that it was assumed that no overland flow enters the gully from the surrounding
area and this influx was negligible in comparison to the influx at the outlet weir and the
sediment produced in the gully.
3.2.5 Analysis of sediment transport and discharge relationship
To understand the relationship between sediment transport and discharge, hysteresis
effect analysis, which is controlled by the sediment availability dynamics, has been used
(Simon et al., 2000; Russell et al., 2001; Simon et al., 2004; Bača, 2008; Rinaldi et al.,

66
2009; Smith and Dragovich, 2009; Gellis, 2013). Hysteresis loops could be clockwise,
counterclockwise or mixed. The hysteresis loop may be positive (clockwise) when the
peak of concentration arrives before the peak of discharge and may be negative
(counter-clockwise) when the peak of concentration arrives after the peak of discharge.
Mixed loops occur when multi-peaked floods occur due to the sediment availability or
due to the rainfall intensity conditions, which control the duration of the peak events
(Walling, 1977; Bača, 2008). Most studies describe clockwise or positive hysteresis
loops where higher suspended-sediment concentrations occur on the rising limb of the
hydrograph and lower concentrations occur on the recessional limb (House and
Warwick, 1998; Asselman, 1999; Bača, 2008). Counterclockwise hysteresis loops occur
less frequently and have been explained by a delayed source from tributaries or due to
bank collapse on the recessional limb of the hydrograph or sediment originating from
distant sources (Klein, 1984; Seeger et al., 2004; Smith and Dragovich, 2009).
In addition to sediment budget calculation, identification of the peak event conditions
such as the peak of the sedigraph and the peak of the hydrograph that controls hysteresis
effect were carried out for the inlet and outlet of the gully on both study years. The
relationships between discharge (q) and suspended sediment concentration (SSC) was
performed and the types of hysteretic patterns were identified.
3.2.6 Installing gully headcut controlling structures

67
Figure 3.3. Gully headcut treatment started in May 2014, in the Debre-Mawi
watershed. Pictures under group (a) show the gully before treatment, (b) the action
of regrading, (c) the planting of vegetation, and (d) the success and challenge of
gully treatment.
To assess the effect of controlling headcut retreat on downstream sediment
concentration, some headcut controlling techniques were tested prior to the 2014 rainy
season (Figure 3.3). These include regrading the side-walls and headcut to a 45 degree
angle and planting elephant grass and Sesbania sesban on the regraded banks at the
headcut of one gully (marked G6) located about 80 m below the inlet weir. In addition,
to dissipate the flow energy, a gabion check-dam immediately beneath the headcut in
combination with a series of downstream wooden check-dams were installed. The
elephant grasses were planted with 0.2 m spacing between rows and 0.1m between

68
plants. The susbania susban plant seeds were sown 0.2 m between rows and no spacing
between seeds. A total of 86 labour (about 516 USD) was used for regrading the bank
and to install the check dams and bamboos.
3.3 Results
3.3.1 Soil loss based on gully measurements
Table 3.1. Characteristics of a gully, from outlet to the upstream largest headcut
which is 80 m downstream of the inlet weir, in the Debre-Mawi watershed to show
the headcut retreat.
Gull
y y
ear
Aver
age
wid
th
(m)
Aver
age
dep
th
(m)
Gull
y l
ength
from
outl
et
to t
he
hea
dcu
t (m
)
Tota
l gull
y
area
(m
2)
Tota
l gull
y
volu
me
(m3)
Soil
loss
(t)
2013 initial 21.7 4.0 297 8430 23,515 28,688
2013 final* 22.9 4.3 309 8894 26,328 32,120
2014 final 23.8 4.7 309 9273 27,313 33,321
*Can also considered to be the initial value for 2014.
After the cross-sections, lengths and bulk density of the gully were measured in the 2-
year period, the following results were obtained. In 2013, the gully retreated about 12 m
uphill but did not retreat upwards in 2014 due to stabilization of the gully headcut with
regrading of the side-walls and headcut to a 45 degree angle, planting elephant grass
and Sesbania sesban on the regraded banks, and dissipation of the flow energy using a
gabion check-dam at the headcut (Figure 3.3) One of the surveyed cross sections, XS-
11 located about 16 m downstream from the headcut of the gully, shows that the width
increased from 8 m to 17 m between the end of June and mid-September 2013 (Figure

69
3.2). The net gully surface area increased by 464 m2 in 2013 and by 379 m2 in 2014.
The total volume of soil lost in 2013 was 2813 m3 and in 2014 was 985 m3 (Table 3.1).
The average bulk density of the soils surrounding the gully was 1.22 g cm-3. Hence, the
total soil loss as calculated from the gully characteristics in 2013 was 3,432 t (197 t ha-
1), and in 2014 was 1,201 t (69 t ha-1), with little variations in total rainfall amount (see
the next section).
3.3.2 Rainfall and observed discharge and sediment concentration at the inlet and
outlet of the gully
3.3.2.1 Rainfall
The total rainfall amount during the 2013 rain phase was 912 mm and the daily rainfall
from the start of discharge measurements varied from 2 mm to 94 mm. During the 2014
rain phase the total rainfall was 942 mm while the daily rainfall varied between 6 mm
and 42 mm (Table 3.2). During our field measurements, the maximum rainfall events
were 94 mm recorded on 7 Aug 2013 and 42 mm recorded on 10 Sep 2014 (42 mm).
The 2014 rainy phase average rainfall intensity (Table B2-1) in the catchment ranged
between 1.2 and 45.6 mm h−1 (mean = 14.8 mm h−1; SD =11.8 mm h−1). The rainfall
intensity in 2013 was not recorded due to technical misalignment of the automatic rain
gauge.
3.3.2.2 Discharge and sediment
Storm runoff at the inlet during the 2013 rainy phase (Table 3.2) ranged from 7 m3 to
2,612 m3 (mean = 232 m3 and SD = 463 m3) with the total runoff volume being 8,136

70
m3 (62 mm). At the outlet, the runoff ranged from 22 to 3,535 m3 (mean = 402 m3 and
SD = 663 m3) with a total storm runoff of 14,058 m3 (81 mm). In the 2014 rainy phase,
the total runoff at the inlet was 8,748 m3 (66 mm) and at the outlet was 12,896 m3 (74
mm) (Table 3.2). Including the base flow during the study time, the total flows at the
inlet and at the outlet respectively, were 21,809 m3 (165 mm) and 37,132 m3 (213 mm)
during the 2013 rain phase and 19,274 m3 (146 mm) and 30910 m3 (178 mm) during the
2014 rain phase (Table 3.3).
In 2013 rain phase, the storm-generated sediment load passing the gully inlet ranged
from 0.01t to 82t (mean = 4 t and SD = 14 t) with a total sediment load of 151 t and at
the outlet ranged from 1 t to 323 t (mean = 35 t and SD = 66 t) with a total load of 1236
t (Table 3.2). During base flow, 7 t of soil entered the gully and 573 t was transported
out of the gully (Table 3.3). Thus in the 2013 rain phase, the total sediment load entering
the gully was 158 t (equivalent to 12 t ha-1) and leaving the gully was 1,809 t (Table
3.3). During the 2014 rain phase, after the gully headcut was arrested, the storm-
generated sediment load at the inlet ranged from 0.01 t to 13 t (mean = 2 t and SD = 3
t) with a total load of 61 t and at the outlet, the load ranged from 0.2 t to 163 t (mean =
25 t and SD = 36 t) with a total load of 764 t. During base flow, 14 t and 284 t of
sediment loads were measured at the inlet and outlet, respectively. Thus, total sediment
loads of 75 t (5.7 t ha-1) at the inlet and 1,048 t at the outlet of the gully were measured
during the 2014 monsoon season (Table 3.3).

71
Table 3.2. The minimum and maximum ranges of peak events in 2013 and 2014 monsoon seasons in the Debre Mawi
watershed. Q, q, P, SL and SSC stand for runoff (m3), discharge(L s-1), a single daily rainfall, sediment load and suspended
sediment concentration, respectively.
Year INLET OUTLET
Duration
(hrs)
P
(mm)
Max.q
(L s-1)
Max.Q
(m3)
Min
SSC
(g L-1)
Max.
SSC (g
SL-1)
Peak
SL (t)
Total
Q (m3)
Total
SL (t)
Duration
(hrs)
Max.q
(L s-1)
Max.
Q
(m3)
Min.
SSC
(g L-1)
Max.
SSC
(g L-1)
Peak
SL (t)
Total
Q (m3)
Total
SL (t)
2013 min 0:1 2 8 5 0.5 2 0.1 7 0.01 0:30 14 8 10 15 0.3 22 1
max 3:0 94 749 449 48 69 2.7 2612 82 3:10 715 429 70 200 77 3535 323
mean 0:5 15 113 68 5 15 2.7 232 4.3 1:11 149 89 38 88 10 402 35
SD 0:3 16 167 100 8 13 4.2 463 14 0:37 178 107 12 35 17 663 66
Total - 523 - 2366 - - 0.6 8136 151 - - - - - 353 14058 1236
2014 Min 0:1 6 2.4 1.4 0.1 1 0.0 1.5 0.01 0:30 7 4.4 13 29 0.2 8 0.2
max 4:2 42 467 280 11 32 8.9 1097 13 5:10 800 480 65 127 39 1737 163
mean 1:4 19 111 66 3 12 1.0 282 2 1:53 142 85 26 69 7 416 25
SD 1:6 11 123 74 3 8 1.8 345 3 1:16 168 101 11 24 9 505 36
Total - 589 - 2055 - - 32 8748 61 - - - - - 205 12896 764

72
Table 3.3. The runoff, sediment load (SL), and average suspended sediment concentration
(SSC) for both storm and base flows at the inlet and outlet of the gully for 2013 and 2014
rain phases.
Ye
ar
Storm flow Base flow Total
Runoff
(m3)
SSC (g
L-1)
SL
(t)
Runoff
(m3)
SSC
(g L-1)
SL
(t)
Runoff
(m3)
SSC
(g L-1)
SL
(t)
2013
Inlet 8136 19 151 13673 0.5 7 21809 7 158
Outlet 14058 88 1236 23074 25 573 37132 49 1809
Enrichment ratio 0.7 4 7 0.7 47 81 0.7 5.7 10
The portion of sediment
yield from gully 0.4 0.8 0.9 0.4 1 1 0.4 0.86 0.9
2014
Inlet 8748 7 61 10526 1.3 14 19274 4 75
Outlet 12896 59 764 18014 16 284 30910 34 1048
Enrichment ratio 0.5 8 12 0.7 11 19 0.6 7.7 13
The portion of sediment
yield from gully 0.3 0.9 0.9 0.4 0.9 1 0.4 0.89 0.9
Figure 3.4. Number of peak events and the associated number of hysteresis loops.
(Left) Shows the number of times that the peak SSC (suspended sediment
concentration; g L-1) occurred either at the rising or the falling limb of the
hydrograph, (right) shows the number of hysteresis loops depending the sediment
dynamics at the inlet and outlet, Q stands for discharge (L s-1).
3.3.3 Peak flood events

73
During the study period (2013-2014 rain phases), a total of 66 peak flood events (35 in
2013 and 31 in 2014) in each weir were analyzed (Figure 3.4, Table B2-1). The total
sediment load produced by the total peak flows of 35 events in 2013 was 53 t at the inlet
and 353 t at the outlet. These loads are equivalent to 35% and 29% of the total sediment
load produced respectively in the inlet and outlet of the gully due to those 35 events.
Similarly, a total of 32 t (52%) at the inlet and 205 t (27%) at the outlet were produced
with a total of 31 peak events in 2014 (Table 3.2 and Table B2-1).
The peak discharges at the inlet during flood events of 2013 varied from 8.4 Ls-1 to 749
L s-1 with an average peak value of 113 L s-1 and SD of 167 L s-1. Similarly, the ranges
of peak discharges in 2014 and peak suspended sediment concentration (PSSC) in both
2013 and 2014 rain phases are presented in Table 3.2.
The maximum suspended sediment concentration (69 g L-1) at the inlet was observed
on 9 July 2013 while the maximum discharge (749 L s-1), load (82 t) and rainfall (94
mm) were observed after a month on 7 Aug 2013. This maximum SSC is considered to
be an outlier as it was occurred with minimum flow and produced relatively little load
(Table 3.4). During this peak event, the second maximum SSC (43 g L-1) was observed
(Table 3.4). Similarly, the maximum SSC (200 g L-1) at the outlet was observed on 9
Sep 2013 while the maximum discharge (715 L s-1), load (323 t, representing about 26%
of the total load in 2013) and rainfall (94 mm) were observed on 7 Aug 2013. In 2014,
all the above-mentioned maximum events coincided on 21 July 2014 at the inlet but not
at the outlet, i.e., the maximum discharge (800 L s-1) was recorded on the same day as

74
inlet, but the maximum SSC (127 g L-1) and load (163 t, representing 21% of the total
load in 2014) were observed on 5 Aug 2014 (Table 3.4). A total of five events at the
inlet (two in 2013 and three in 2014) transported more than 30 g L-1 and a total of 11
events at the outlet (nine in 2013 and two in 2014) transported more than 100 g L-1
(Table B2-1).
The duration of the flood events at the inlet of 2013 varied between 0:10 and 3:00 hours
with an average 0:50 hours and SD of 0:31 hours (see the rest in Table 3.2). 13 events
at the inlet of 2013 were longer than average duration, while 19 events were shorter. At
the outlet in 2014, the event on 7 August 2014 took the longest duration (2:50 hours) to
reach the peak SSC while the runoff took only 0:20 hours to reach its peak.

75
Table 3.4. Examples of peak events in 2013 and 2014 rain phases with the associated hysteresis loops at the inlet and outlet of
the gully in the Debre Mawi watershed. Q, q, SL and SSC stand for runoff, discharge, sediment load and suspended sediment
concentration, respectively, C is clockwise loop, CC is counterclockwise loop and M is mixed loop
DATE INLET OUTLET
Durat
ion
(hrs)
Peak
q
(Ls-1)
Peak
Q
(m3)
peak
SSC
(gL-1)
Peak
SL (t)
Total
Q
(m3)
Total
SL (t)
Loop Durat
ion
(hrs)
Peak
q
(Ls-1)
Peak
Q
(m3)
peak
SSC
(gL-1)
Peak
SL (t)
Total
Q
(m3)
Total
SL
(t)
Loop
7/9/2013 0:30 15 9 69 0.6 25.7 1.6 C 0:50 30 18 12 0.2 74 0.9 C
8/4/2013 1:00 41 25 7 0.2 82.2 0.3 M 1:00 73 44 166 7.3 175 14 CC
8/7/2013 3:00 749 449 43 19 2612 82 C 3:10 715 429 126 54 3535 323 M
9/3/2013 1:20 464 278 17 4.7 642 7.5 C 2:40 640 384 156 60 1889 200 M
9/9/2013 1:20 552 331 19 6.3 806 6.7 C 1:50 640 384 200 77 1130 166 M
6/24/2014 1:30 268 161 31 5 312 7 C 2:40 236 142 87 12 663 51 M
6/25/2014 0:50 115 69 31 2 120 2.5 C 2:00 187 112 97 11 381 33 CC
7/21/2014 2:10 467 280 32 9 734 13 C 2:30 800 480 81 39 1257 87 M
8/5/2014 3:00 324 194 13 2.5 1097 8.3 C 3:50 307 184 127 23 1737 163 M
9/9/2014 3:30 323 192 12 2.3 775 3.6 M 3:50 453 272 81 22 1437 69 M

76
The number of observation when peak SSC and peak discharges occurred is shown in
Figure 3.4. From a total of 35 peak events in 2013 monsoon season, PSSC and peak
discharges simultaneously occurred (coincided) only 49% of the time at the inlet and
29% of the time at the outlet of all events. 37% (at the inlet) and 57% (at the outlet) of
PSSC events occurred earlier than the peak discharge, whereas only 14% (at both weirs)
of PSSC occurred later than the peak discharges (see Figure 3.4 for 2014).
3.3.4 Effect of gully head treatment
The gully headcut treatment, although partially failing, was successful in controlling the
uphill migration of the headcut for a year as compared to other untreated gullies (from
our observation) in the watershed (Table 3.1). Despite this, in the 2014 rain phase with
little erosion, the sediment yield was still about 60% that of the previous year (Table
3.3). Similarly, the daily averaged sediment concentration decreased only by 25% at the
outlet (Table 3.3). This percentage was calculated by comparing the difference between
the outlet and inlet sediment concentrations in 2013 with the difference between the
outlet and inlet sediment in 2014. The recorded precipitation during the 2013 rain phase
(44 days of rainfall) was 917 mm and 2014 (31 days of rainfall) was 1107 mm.
3.4 Discussion
As the objective of this manuscript is to investigate the interaction of upland and gully
erosion and to quantify the portion of sediment originated from a gully, we will first
review the soil and water conservation practices implemented in the watershed and use
the observations presented in the results section. Then by comparing the concentration

77
and loads in the inlet and outlet and by analyzing the sediment concentration discharge
relationship during the storm events, we will try to understand the dynamics of the
sediment availability between upland and gully erosion by comparing the hysteresis in
these relationships (Simon et al., 2000; Russell et al., 2001; Simon et al., 2004; Bača,
2008; Rinaldi et al., 2009; Smith and Dragovich, 2009; Gellis, 2013).
Extensive soil and water conservation measures were implemented in the Debre Mawi
watershed in 2012 consisting of infiltration furrows, with soil thrown downhill forming
bunds, and biological soil conservation materials planted on the bunds. As explained in
the result section, the inlet sediment concentration and load is much lower than at the
outlet. Although we do not have observations of the impact of SWC measures for the
study sub-watershed, there were observations in the north part of the watershed with
similar SWC measures which found that there was a reduction of 60 % in discharge and
80 % in sediment loads at the outlet of the 95 ha sub-watershed (Dagnew et al., 2015).
Sediment concentrations were reduced in the watersheds not containing gullies in the
uplands but minimally at the outlet of the watershed where gullies were prevalent
(Dagnew et al., 2015; Tilahun et al., 2015).
3.4.1 Sediment concentration
The sediment concentrations for each sample at the inlet and outlet collected at 10
minute interval during the runoff events are shown in Figure 3.4. The sediment
concentration at the outlet is distinctly greater than at the inlet. In addition, the inlet
concentration are greater at the beginning of the rain phase compared with later in in the
rain phase similar to that reported for other upland watersheds by Guzman et al. (2013)

78
while the outflow does not show a distinct trend and is almost constant throughout the
rain phase (Figures 3.5 and B1-4). In addition, the peak concentrations increase slightly
with peak flow, with the inlet concentrations distinctly lower than the outlet
concentrations.
Figure 3.5. (a, b) the 10 minute instantaneous suspended sediment concentration
(SSC in g L-1; y-axis) versus discharge flow rate (q in L s−1; x-axis), (c, d)-the peak
events of SSC versus peak discharge flow rate, and (e, f)-the total daily sediment
load (L in t; y-axis) versus discharge (Q in m3; x-axis)

79
The sediment balance in 2013 (Eq. 3.3) does not close. The volume of soil lost as
derived from the gully measurements is almost twice that of the sediment lost at the
outlet in 2013 (compare Tables 3.1 and 3.3). The most likely reason is that gully cross
section measures can be used to characterize the soil loss over a long period but are not
precise enough to calculate short term losses by taking the difference of two large
numbers. Even a small error in the total volume gives a large error in the soil lost from
the gully.
Figure 3.6. The peak suspended sediment concentration (SSC; g L-1) and the event
rainfall (P; mm) as a function of time
80
The sediment yield from the inlet and outlet gully of each of the rainy phases are
summarized on daily basis in Table B2-1 and on an annual basis in Table 3.3. The gully
enrichment ratio (Eq. 3.4) for storm-generated sediment load in 2013 was 7.2 and it was
11.5 in 2014 (Table 3.3) which means, about 90% (Eq. 3.5) of the suspended sediment
load originated from the gully (Table 3.3, Figure 3.6). Including the base flow, over
90% of the sediment passing the outlet originated from the gully or the amount of
sediment transported out of the gully was 10 to 14 times greater than what was delivered
at the inlet (Table 3.3).
In 2014, sediment concentration at the outlet of the gully slightly decreases towards the
end of the rainy phase (similar to the inlet weir), whereas it increased during the 2013
rainy phase (Figure 3.6). Also, sediment load and sediment concentration were
respectively reduced by 40% and 25% in 2014 as compared to 2013. One of the reasons
for this reduction could be the gully headcut treatment in 2014 (Figure B3-1) but also
could be due to the less erosive rains in 2014 (Table B1). Farmers in the watershed
remarked as well that 2014 was a year with little soil loss.
3.4.2 Hysteresis effect
The number of hysteresis loops in each loop type (clockwise, counterclockwise and
mixed) and the number of times that the peak SSC occurred relative to the peak
discharge are clearly described in Figure 3.4. The large number of clockwise loops at
the inlet in Figure 3.4 could be explained by one or both of the two hypotheses: (1) the
previous storm events supply sediment to the channel (Bača, 2008). This in-channel
sediment becomes the source of sediment on the rising limb of the next event and

81
clockwise hysteresis occurs, or (2) if the current runoff event was relatively lower than
the previous, the runoff in the upper catchment will flow in the rill channel already
formed by previous high storm events (i.e., new rills may not be formed). In this case,
the only sediment source is the channel and the runoff will carry the available sediment
in the channel. Therefore, the channel becomes the source of sediment on the rising limb
and clockwise hysteresis occurs. Such conditions mostly occurred at the inlet of the
gully (see Figure 3.7 as an example).
Figure 3.7. Examples of hysteresis loops occurred on six event days at the inlet and
outlet of the gully in the Debre Mawi watershed on both years (2013-2014), SSC
stands for suspended sediment concentration (g L-1)
Counter-clockwise hysteresis effect occurs when the sediment source is at a distance in
the hillslope area or when the current failed material from the bank is transported and
reached at the falling limb of hydrograph. The former case may occur during extreme

82
events when the uphill runoff flows ‘above’ the previously formed rill channel. In this
case, new rills may be formed and eroded soil can be transported to the gully and the
peak SSC may occur on the falling limbs and counterclockwise hysteresis loops occurs.
As shown in Figure 3.7, on both years (2013-2014), a mix of both clockwise and
counter-clockwise hysteresis loops occurred at the outlet whereas clockwise (positive)
hysteresis loops occurred at the inlet on the same event days at the outlet. Also, the large
number of mix-up hysteresis loops (Figures 3.4, 3.7) at the outlet is related to the bank
failure that there was always sufficient sediment to transport by runoff so that a number
of peak SSCs reached both on the rising and recession limbs of the hydrograph.
Therefore, both the sediment budget calculation and the hysteresis loop analysis
demonstrated that gully erosion is the most dominant sediment source erosion feature.
3.4.3 Interactions of gullies and SWC practices and implications
According to the study of Dagnew et al. (2014, 2015) in the Debre Mawi watershed, the
implementation of upper catchment soil and water conservation (SWC) structures,
consisting of soil bunds integrated with biological measures, did not affect a significant
reduction in the sediment concentration while the runoff and the total sediment load
were significantly reduced by the upper catchment conservation structures. This is
attributed to the presence of gullies that negated any decrease in concentration by the
upland soil and water conservation practices.

83
The higher sediment concentration at gully outlet is related to the erosion of
unconsolidated sediment of the bottom of the gully, which was contributed by the failing
banks caused mainly by the ground water level increase during the rainy phase (Tebebu
et al., 2010), which induces gully sidewall collapse. This caused more than 90% of the
total sediment transported out of the gully to originate within the gully, resulting in an
elevated and fairly constant runoff-generated mean daily sediment concentration
throughout the rainy phase in contrast to the behavior of sediment concentration related
to upland erosion processes (Zegeye et al., 2010; Amare et al., 2014). This implies that
conservation programs that do not include gully rehabilitation may not reduce
downstream sediment concentrations.
3.4.4 Success and challenges of gully erosion control
As referred to section 3.3.4, the headcut treatment in the gully was only successful in
controlling the longitudinal growth of gully head while partially successful in cross
sectional (side walls) retreat indicating that the design should be improved. The left
sidewall of the headcut was not regraded effectively, and retreated about 1.5 m.
Additionally, almost all the wooden check dams installed below the gabion check dam
were severely damaged and carried away by a single high flow event, 152 mm on June
10, 2014. This rainfall amount was equivalent to 14% of the recorded rainfall during the
2014 monsoon season. On the right side of the treated gully, the planted vegetation
(elephant grass and Sesbania sesban) and soil started slumping as shown in the last photo
of Figure 3.3. These conditions negated the efforts to reduce the sediment load and
concentration significantly at the gully outlet. One of the possible reasons is that the

84
vegetation was planted so close to the rainy season that the flow could damage the
vegetation before the below (roots) and above ground biomasses were established well.
This indicates that vegetation should be planted at the end of the rainy season so that
there are nine months of growth for establishing the plant biomass.
3.5 Conclusion
Because of the rapid gully expansion in the humid northern Ethiopian highlands,
suspended sediment load and concentrations have been increasing despite the recent
emphasis on soil and water conservation practices. The result demonstrated that the
sediment concentration at the outlet was about 8 times greater than the concentration at
the inlet. Both the sediment budget calculation and the hysteresis loop analysis
demonstrated that most of the sediment (about 92%) was originated from the gully
indicating that gullies impact the functioning of downstream reservoirs as its relative
sediment contribution is shown in this study. The result supports the claim that gully
headcut treatment significantly reduced the uphill growth and hence fairly reduced
sediment load and concentration. This study is a good indicator of what areas within a
watershed need to be targeted to reduce sediment load and concentration.
ACKNOWLEDGMENTS
This research was supported financially by The Norman E. Borlaug Leadership
Enhancement in Agriculture Program (Borlaug LEAP-016258-82), International
Foundation for Science (IFS-W/5407-1), Cornell University and MWEI, Ethiopia.

85
REFERENCES
Abiy, A. Z.: Geological controls in the formations and expansions of Gullies over hillslope
hydrological processes in the highlands of Ethiopia, Northern Blue Nile Region,
Cornell University, 2009.
Amare, T., Zegeye, A. D., Yitaferu, B., Steenhuis, T. S., Hurni, H., Zeleke, G.: Combined
effect of soil bund with biological soil and water conservation measures in the
northwestern Ethiopian highlands, Ecohydrology & Hydrobiology, 14, 192-199,
doi:10.1016/j.ecohyd.2014.07.002, 2014.
Arnaez, J., Larrea, V., Ortigosa, L.: Surface runoff and soil erosion on unpaved forest roads
from rainfall simulation tests in northeastern Spain, Catena, 57, 1-14,
doi:10.1016/j.catena.2003.09.002, 2004.
Asselman, N. E.: Suspended sediment dynamics in a large drainage basin: the River Rhine,
Hydrological processes, 13, 1437-1450, doi:org/10.1623/hysj.53.1.224, 1999.
Ayele, G. K., Gessess, A. A., Addisie, M. B., Tilahun, S. A., Tebebu, T. Y., Tenessa, D. B.,
Langendoen, E. J., Nicholson, C. F., Steenhuis, T. S.: A Biophysical and Economic
Assessment of a Community‐based Rehabilitated Gully in the Ethiopian Highlands,
Land Degradation & Development, doi:10.1002/ldr.2425, 2015.
Bača, P.: Hysteresis effect in suspended sediment concentration in the Rybárik basin,
Slovakia/Effet d'hystérèse dans la concentration des sédiments en suspension dans le
bassin versant de Rybárik (Slovaquie), Hydrological Sciences Journal, 53, 224-235,
doi:org/10.1623/hysj.53.1.224, 2008.
Ben Slimane, A., Raclot, D., Evrard, O., Sanaa, M., Lefevre, I., Le Bissonnais, Y.: Relative
Contribution of Rill/Interrill and Gully/Channel Erosion to Small Reservoir Siltation
in Mediterranean Environments, Land Degradation & Development,
doi:10.1002/ldr.2387, 2015.
Bewket, W., Sterk, G.: Dynamics in land cover and its effect on stream flow in the Chemoga
watershed, Blue Nile basin, Ethiopia, Hydrological Processes, 19, 445-458,
doi:10.1002/hyp.5542, 2005.
Borrelli, P., Märker, M., Panagos, P., Schütt, B.: Modeling soil erosion and river sediment
yield for an intermountain drainage basin of the Central Apennines, Italy, Catena,
114, 45-58, doi:10.1016/j.catena.2013.10.007, 2014.
Bradford, J. M., Farrell, D., Larson, W.: Mathematical evaluation of factors affecting gully
stability, Soil Science Society of America Journal, 37, 103-107, 1973.

86
Bunt, C. M., Cooke, S. J., Schreer, J. F., Philipp, D. P.: Effects of incremental increases in silt
load on the cardiovascular performance of riverine and lacustrine rock bass,
Ambloplites rupestris, Environmental Pollution, 128, 437-444, 2004.
Cao, C. S., Chen, L., Gao, W., Chen, Y., Yan, M.: Impact of planting grass on terrene roads to
avoid soil erosion, Landscape and urban planning, 78, 205-216,
doi:10.1016/j.landurbplan.2005.07.007, 2006.
Cerdà, A.: Soil water erosion on road embankments in eastern Spain, Science of the Total
Environment, 378, 151-155, 2007.
Cerdà, A., Keesstra, S., Pereira, P., Matrix-Solera, J., Giménez-Morera, A., Úbeda, X.,
Francos, M., Alcañiz, M., Jordán, A.: Long-term changes in soil erosion due to forest
fires. A rainfall simulation approach in Eastern Spain, 2016.
Clark, L., Wynn, T.: Methods for determining streambank critical shear stress and soil
erodibility: implications for erosion rate predictions, Transactions of the ASABE, 50,
95-106, 2007.
Collins, A., Walling, D., Leeks, G.: Sediment sources in the Upper Severn catchment: a
fingerprinting approach, Hydrology and Earth System Sciences Discussions, 1, 509-
521, 1997.
Collins, A., Walling, D., Sichingabula, H., Leeks, G.: Suspended sediment source
fingerprinting in a small tropical catchment and some management implications,
Applied Geography, 21, 387-412, 2001.
Daba, S., Rieger, W., Strauss, P.: Assessment of gully erosion in eastern Ethiopia using
photogrammetric techniques, Catena, 50, 273-291, 2003.
Dagnew, D. C., Guzman, C. D., Zegeye, A. D., Tibebu, T. Y., Getaneh, M., Abate, S., Zemale,
F. A., Ayana, E. K., Tilahun, S. A., Steenhuis, T. S.: Impact of conservation practices
on runoff and soil loss in the sub-humid Ethiopian Highlands: The Debre Mawi
watershed, Journal of Hydrology and Hydromechanics, 63, 214-223, 2015.
De Oña, J., Osorio, F., Garcia, P. A.: Assessing the effects of using compost–sludge mixtures
to reduce erosion in road embankments, Journal of hazardous materials, 164, 1257-
1265, 2009.
De Vente, J., Poesen, J., Arabkhedri, M., Verstraeten, G.: The sediment delivery problem
revisited, Progress in Physical Geography, 31, 155-178, 2007.

87
De Vente, J., Poesen, J., Verstraeten, G., Govers, G., Vanmaercke, M., Van Rompaey, A.,
Arabkhedri, M., Boix-Fayos, C.: Predicting soil erosion and sediment yield at regional
scales: Where do we stand?, Earth-Science Reviews, 127, 16-29,
doi:10.1016/j.earscirev.2013.08.014, 2013.
Fleitmann, D., Dunbar, R. B., McCulloch, M., Mudelsee, M., Vuille, M., McClanahan, T. R.,
Cole, J. E., Eggins, S.: East African soil erosion recorded in a 300 year old coral
colony from Kenya, Geophysical Research Letters, 34,
doi:DOI:10.1029/2006GL028525, 2007, 2007.
Frankl, A., Poesen, J., Haile, M., Deckers, J., Nyssen, J.: Quantifying long-term changes in
gully networks and volumes in dryland environments: The case of Northern Ethiopia,
Geomorphology, 201, 254-263, 2013.
García, M. H., Motta, D., Abad, J. D., Langendoen, E. J.: A computational platform for
physically-based bank evolution and long-term meander migration, In: Meeting
Proceedings. 2010.
Gellis, A. C.: Factors influencing storm-generated suspended-sediment concentrations and
loads in four basins of contrasting land use, humid-tropical Puerto Rico, Catena, 104,
39-57, doi:org/10.1016/j.catena.2012.10.018, 2013.
Gessesse, B., Bewket, W., Bräuning, A.: Model‐based characterization and monitoring of
runoff and soil erosion in response to land use/land cover changes in the Modjo
watershed, Ethiopia, Land Degradation & Development, 26, 711-724, doi:DOI:
10.1002/ldr.2276, 2015.
Ghimire, G., Uprety, B.: Causes and effects of siltation on the environment of Nepal,
Environmentalist, 10, 55-65, 1990.
Gomez, B., Banbury, K., Marden, M., Trustrum, N. A., Peacock, D. H., Hoskin, P. J.: Gully
erosion and sediment production: Te Weraroa Stream, New Zealand, Water
Resources Research, 39, 2003.
Guzman, C., Tilahun, S., Zegeye, A., Steenhuis, T.: Suspended sediment concentration–
discharge relationships in the (sub-) humid Ethiopian highlands, Hydrology and Earth
System Sciences, 17, 1067-1077, doi:10.5194/hess-17-1-2013, 2013.
Haregeweyn, N., Poesen, J., Nyssen, J., De Wit, J., Haile, M., Govers, G., Deckers, S.:
Reservoirs in Tigray (Northern Ethiopia): characteristics and sediment deposition
problems, Land Degradation & Development, 17, 211-230, doi:10.1002/ldr.698,
2006.

88
Haregeweyn, N., Poesen, J., Verstraeten, G., Govers, G., Vente, J., Nyssen, J., Deckers, J.,
Moeyersons, J.: Assessing the performance of a spatially distributed soil erosion and
sediment delivery model (WATEM/SEDEM) in Northern Ethiopia, Land
Degradation & Development, 24, 188-204, doi:10.1002/ldr.1121, 2013.
Hawando, T.: Desertification in Ethiopian highlands, Rala Report, 1997.
House, W. A., Warwick, M. S.: Hysteresis of the solute concentration/discharge relationship
in rivers during storms, Water Research, 32, 2279-2290, 1998.
Hurni, H., Tato, K., Zeleke, G.: The implications of changes in population, land use, and land
management for surface runoff in the upper Nile basin area of Ethiopia, Mountain
Research and Development, 25, 147-154, doi:10.1659/0276-4741(2005)025[0147:
TIOCIP] 2.0.CO;2, 2005.
Ireland, H. A., Sharpe, C. F. S., Eargle, D.: Principles of gully erosion in the Piedmont of
South Carolina, vol 633. US Dept. of Agriculture, 1939.
Jain, S. K., Goel, M.: Assessing the vulnerability to soil erosion of the Ukai Dam catchments
using remote sensing and GIS, Hydrological Sciences Journal, 47, 31-40, 2002.
Jones, J. A., Swanson, F. J., Wemple, B. C., Snyder, K. U.: Effects of roads on hydrology,
geomorphology, and disturbance patches in stream networks, Conservation Biology,
14, 76-85, 2000.
Klein, M.: Anti clockwise hysteresis in suspended sediment concentration during individual
storms: Holbeck Catchment; Yorkshire, England, Catena, 11, 251-257, 1984.
Kou, M., Jiao, J., Yin, Q., Wang, N., Wang, Z., Li, Y., Yu, W., Wei, Y., Yan, F., Cao, B.:
Successional Trajectory Over 10 Years of Vegetation Restoration of Abandoned
Slope Croplands in the Hill‐Gully Region of the Loess Plateau, Land Degradation &
Development, doi:10.1002/ldr.2356, 2015.
Langendoen, E., Tebebu, T., Steenhuis, T., Tilahun, S.: Assessing gully widening and its
control in the Debra-Mawi watershed, northern Ethiopia, In: Proceedings Conference
on Science and Technology Towards the Development of East Africa (ICST 2013),
eds N. Gabbiye, E. Kaba, KK Monocha Singh, and S. Sharma (Bahir Dar University
Institute of Technology: Ethiopia). pp 214-222, 2013.
Langendoen, E., Zegeye, A., Tebebu, T., Steenhuis, T., Ayele, G., Tilahun, S., Ayana, E.:
Using computer models to design gully erosion control structures for humid northern
Ethiopia, ICHE 2014, Hamburg-Lehfeldt & Kopmann (eds)-Bundesanstalt für
Wasserbau, 2014.

89
Nyssen, J., Haile, M., Poesen, J., Deckers, J., Moeyersons, J.: Removal of rock fragments and
its effect on soil loss and crop yield, Tigray, Ethiopia, Soil Use and Management, 17,
179-187, 2001.
Nyssen, J., Poesen, J., Moeyersons, J., Deckers, J., Haile, M., Lang, A.: Human impact on the
environment in the Ethiopian and Eritrean highlands—a state of the art, Earth-science
reviews, 64, 273-320, 2004.
Nyssen, J., Poesen, J., Moeyersons, J., Luyten, E., Veyret‐Picot, M., Deckers, J., Haile, M.,
Govers, G.: Impact of road building on gully erosion risk: a case study from the
northern Ethiopian highlands, Earth Surface Processes and Landforms, 27, 1267-
1283, 2002.
Nyssen, J., Poesen, J., Veyret‐Picot, M., Moeyersons, J., Haile, M., Deckers, J., Dewit, J.,
Naudts, J., Teka, K., Govers, G.: Assessment of gully erosion rates through interviews
and measurements: a case study from Northern Ethiopia, Earth Surface Processes and
Landforms, 31, 167-185, 2006.
Oostwoud Wijdenes, D., Bryan, R.: Gully headcuts as sediment sources on the Njemps flats
and initial low-cost gully control measures, Advances in GeoEcology, 27, 205-205,
1994.
Palazón, L., Gaspar, L., Latorre, B., Blake, W., Navas, A.: Evaluating the importance of
surface soil contributions to reservoir sediment in alpine environments: a combined
modelling and fingerprinting approach in the Posets-Maladeta Natural Park, Solid
Earth, 5, 963, doi:10.5194/se-5-963-2014, 2014.
Pereira, P., Gimeìnez-Morera, A., Novara, A., Keesstra, S., Jordán, A., Masto, R., Brevik, E.,
Azorin-Molina, C., Cerdà, A.: The impact of road and railway embankments on runoff
and soil erosion in eastern Spain, Hydrology and Earth System Sciences Discussions,
12, 12947-12985, doi:10.5194/hessd-12-12947-2015, 2015.
Poesen, J., Nachtergaele, J., Verstraeten, G., Valentin, C.: Gully erosion and environmental
change: importance and research needs, Catena, 50, 91-133, 2003.
Poesen, J., Vandaele, K., Van Wesemael, B.: Contribution of gully erosion to sediment
production on cultivated lands and rangelands, IAHS Publications-Series of
Proceedings and Reports-Intern Assoc Hydrological Sciences, 236, 251-266, 1996.
Rinaldi, M., Simoncini, C., Piégay, H.: Scientific design strategy for promoting sustainable
sediment management: the case of the Magra River (Central‐Northern Italy), River
research and applications, 25, 607-625, doi:10.1002/rra.1243, 2009.

90
Russell, M., Walling, D., Hodgkinson, R.: Suspended sediment sources in two small lowland
agricultural catchments in the UK, Journal of Hydrology, 252, 1-24, 2001.
Seeger, M., Errea, M.-P., Beguerıa, S., Arnáez, J., Martı, C., Garcıa-Ruiz, J.: Catchment soil
moisture and rainfall characteristics as determinant factors for discharge/suspended
sediment hysteretic loops in a small headwater catchment in the Spanish Pyrenees,
Journal of Hydrology, 288, 299-311, 2004.
Simon, A., Curini, A., Darby, S. E., Langendoen, E. J.: Bank and near-bank processes in an
incised channel, Geomorphology, 35, 193-217, 2000.
Simon, A., Dickerson, W., Heins, A.: Suspended-sediment transport rates at the 1.5-year
recurrence interval for ecoregions of the United States: transport conditions at the
bankfull and effective discharge?, Geomorphology, 58, 243-262, 2004.
Simon, A., Pollen‐Bankhead, N., Thomas, R. E.: Development and application of a
deterministic bank stability and toe erosion model for stream restoration, Stream
Restoration in Dynamic Fluvial Systems, 453-474, 2011.
Simon, A., Rinaldi, M.: Disturbance, stream incision, and channel evolution: The roles of
excess transport capacity and boundary materials in controlling channel response,
Geomorphology, 79, 361-383, 2006.
Smith, H. G., Dragovich, D.: Interpreting sediment delivery processes using suspended
sediment-discharge hysteresis patterns from nested upland catchments, south-eastern
Australia, Hydrological processes, 23, 2415, doi:10.1002/hyp.7357, 2009.
Tamene, L., Park, S., Dikau, R., Vlek, P.: Analysis of factors determining sediment yield
variability in the highlands of northern Ethiopia, Geomorphology, 76, 76-91,
doi:10.1016/j.geomorph.2005.10.007, 2006.
Tebebu, T., Abiy, A., Dahlke, H., Easton, Z., Zegeye, A., Tilahun, S., Collick, A., Kidnau, S.,
Moges, S., Dadgari, F.: Surface and subsurface flow effect on permanent gully
formation and upland erosion near Lake Tana in the northern highlands of Ethiopia,
Hydrology and Earth System Sciences Discussions, 7, 5235-5265, 2010.
Tebebu, T. Y., Steenhuis, T. S., Dagnew, D. C., Guzman, C. D., Bayabil, H. K., Zegeye, A.
D., Collick, A. S., Langan, S., MacAlister, C., Langendoen, E. J.: Improving efficacy
of landscape interventions in the (sub) humid Ethiopian highlands by improved
understanding of runoff processes, Frontiers in Earth Science, 3, 49, 2015.

91
Tilahun, S. A., Guzman, C. D., Zegeye, A. D., Dagnew, D. C., Collick, A. S., Yitaferu, B.,
Steenhuis, T. S.: Distributed discharge and sediment concentration predictions in the
sub‐humid Ethiopian highlands: the Debre Mawi watershed, Hydrological Processes,
29, 1817-1828, 2015.
Tsegaye, K. K.: Action, inaction and environmental destruction: Socionatural determinants of
the disappearance of Lake Alemaya (Haromaya), Eastern Ethiopia, Eastern Ethiopia
(August 2014), doi:org/10.2139/ssrn.2625984, 2014.
Turkelboom, F., Poesen, J., Trébuil, G.: The multiple land degradation effects caused by land-
use intensification in tropical steeplands: a catchment study from northern Thailand,
Catena, 75, 102-116, 2008.
Valentin, C., Poesen, J., Li, Y.: Gully erosion: impacts, factors and control, Catena, 63, 132-
153, doi:10.1016/j.catena.2005.06.001, 2005.
Vandaele, K., Poesen, J.: Spatial and temporal patterns of soil erosion rates in an agricultural
catchment, central Belgium, Catena, 25, 213-226, 1995.
Vandaele, K., Poesen, J., Marques da Silva, J. R., Desmet, P.: Rates and predictability of
ephemeral gully erosion in two contrasting environments, Géomorphologie: relief,
processus, environnement, 2, 83-95, 1996.
Walling, D.: Assessing the accuracy of suspended sediment rating curves for a small basin,
Water Resources Research, 13, 531-538, 1977.
Wang, Y., Shao, M.: Spatial variability of soil physical properties in a region of the Loess
Plateau of PR China subject to wind and water erosion, Land Degradation &
Development, 24, 296-304, doi:10.1002/ldr.1128, 2013.
Zegeye, A., Damtew, S., Tilahun, A., Langendoen, E., Dagnew, D., Guzman, C., Tebeby, T.,
Steenhuis, T.: Gully development processes in the Ethiopian Highlands, In: 2nd
International Conference on the Advancements of Science and Technology, eds B.
Bantyirga, M. Mehari, VS Rao, BL Manocha, KK Singh, S. Geremew, and E. Tadesse
(Bahir Dar: Bahir Dar Institute of Technology). pp 220-229, 2014.
Zegeye, A. D., Langendoen, E. J., Stoof, C. R., Tilahun, S. A., Dagnew, D. C., Zimale, F. A.,
Guzman, C. D., Yitaferu, B., Steenhuis, T. S.: Morphological dynamics of gully
systems in the sub-humid Ethiopian Highlands: The Debre Mawi watershed,
doi:10.5194/soil-2016-13, 2016, 2016.
Zegeye, A. D., Steenhuis, T. S., Blake, R. W., Kidnau, S., Collick, A. S., Dadgari, F.:
Assessment of soil erosion processes and farmer perception of land conservation in

92
Debre Mewi watershed near Lake Tana, Ethiopia, Ecohydrology & Hydrobiology,
10, 297-306, doi:10.2478/v10104-011-0013-8, 2010.
Zema, D., Bingner, R., Denisi, P., Govers, G., Licciardello, F., Zimbone, S.: Evaluation of
runoff, peak flow and sediment yield for events simulated by the AnnAGNPS model
in a Belgian agricultural watershed, Land Degradation & Development, 23, 205-215,
doi:10.1002/ldr.1068, 2012.
Zhao, G., Mu, X., Wen, Z., Wang, F., Gao, P.: Soil erosion, conservation, and eco‐environment changes in the loess plateau of China, Land Degradation &
Development, 24, 499-510, doi:10.1002/ldr.2246, 2013.
Zheng, F.-L.: Effect of vegetation changes on soil erosion on the Loess Plateau, Pedosphere,
16, 420-427, 2006.

93
CHAPTER 4
RIPROOT MODEL TO ESTIMATE THE MECHANICAL REINFORCEMENT OF
ETHIOPIAN HIGHLAND PLANT ROOTS TO GULLY BANK STABILITY
Abstract
To control gully erosion in the northwestern Ethiopian Highlands, different species of
grasses and trees are often planted on the gully banks. However, the effectiveness of
such biological conservation measures to stabilize gullies in Ethiopia have not been
investigated. This study aims at investigating the suitability of different tree and grass
species in stabilizing gullies. The root systems of 26 indigenous and exotic plant species
of three plant types (grasses, shrubs and trees) were sampled, and root tensile strength
and distribution were determined. The Rip-Root model was used to quantify the added
cohesion derived from the plant roots. Among all tested roots, E.floccifolia (grass),
Tephrosia (tree) and R.abbysinica (shrub) had the strongest roots. The root volumetric
ratio in the top 0.6 m of soil ranged from 0.03 to 0.46%. A. Abyssinica provided the
maximum cohesion (i.e., 33 kPa) to the top soil reinforcement. We found that, for a
given plant species, the root volumetric ratio had a greater effect on root cohesion than
root tensile strength. Plant species with a fibrous root system provided greater cohesion
values and could enhance gully bank stability at the top soils more than plants having a
tap root system.

94
We detected that grasses have comparative advantages over shrub and trees in
stabilizing gully banks due to their fibrous root system. The results supported that the
use of plant species to stabilize gully banks and thereby reduce gully erosion in the
highlands of Ethiopia need to be integrated with physical conservation measures.
4.1 Introduction
Gully erosion in the Ethiopian highlands is a serious problem, which has resulted in land
degradation (Tebebu et al., 2010) and reservoir sedimentation with associated health
and economic problems (Haregeweyn et al., 2005). Gully erosion control measures were
mostly restricted to the construction of physical Soil and Water Conservation (SWC)
measures such as check dams. Very recently, there have been efforts to integrate the
physical and biological conservation measures, mainly by planting grass and forage tree
species on gully banks and in between the physical SWC structures (Dagnew et al.,
2015). Amare et al. (2014) investigated the influence of these interventions on soil
erosion at experimental plot in sub humid Ethiopia. For example, they investigated that
plant species such as elephant grass integrated with soil bund significantly reduced soil
erosion as compared to soil bund only. However, systematic studies how these plants
affect soil strength and ultimately erosion has not been carriedout in Ethiopia. The lack
of such studies could be attributed to the lack of appropriate methods to investigate the
effects of plant systems to on soil strength in erosion. Moreover, excavating the roots,
and separating the roots from the soil in order to investigate the root systems of different
plant species and their strength requires much effort and is labour intensive and requires
extended time.

95
Understanding the characteristics of root systems of plants is crucial as roots affect the
soil physical properties, such as infiltration rate, aggregate stability, moisture content,
and shear strength, which play roles in soil conservation (Gyssels et al., 2005). Roots
reduce runoff and soil erosion in both dry and wet seasons(De Baets et al., 2008). The
effectiveness of plant roots in reducing runoff and soil erosion is affected by the
distribution and number of fibrous roots less than 1 mm in diameter (Li et al., 1991),
root surface area density (Zhou and Shangguan, 2005), and root length densities or root
densities (Gyssels and Poesen, 2003; De Baets et al., 2006; Gyssels et al., 2006;
Vannoppen et al., 2015). Further, studies have demonstrated that the root systems of
plants play a critical role in stabilizing banks of gullies and streams by enhancing the
soil shear strength (Simon and Collison, 2002; Pollen et al., 2004; Pollen and Simon,
2005; De Baets et al., 2008; De Baets et al., 2009).
Roots reinforce the soil, which is commonly represented through an added shear
resistance or cohesion (Waldron, 1977; Willatt and Sulistyaningsih, 1990). The
magnitude of this cohesion depends on the root characteristics of a plant species such
as: distribution, tensile strengths, tensile modulus, the interface friction with the soil,
and the orientation with respect to the principal direction of strain (Wu et al., 1979;
Gyssels et al., 2005; Pollen and Simon, 2005; De Baets et al., 2008; Langendoen and
Simon, 2008). In the most simplistic models, the increase in shear strength depends
entirely on the tensile strength of the roots and the root-area ratio (Wu et al., 1979; De
Baets et al., 2007; De Baets et al., 2008).

96
Although several experimental studies conducted elsewhere in the world have
demonstrated the role of the root systems of grasses, shrub and trees in stabilizing soils,
studies investigating the contribution of the root systems of indigenous and exotic tree
species of the northwestern Ethiopian highlands in increasing soil shear strength are
lacking. In this study, the enhancement of soil shear strength due to the presence of roots
will be investigated by using the Rip-Root model.
The Rip-Root model calculates root reinforcement using a progressive breaking
algorithm that is driven by the number and species of roots present in the steam bank,
and the driving forces acting on the bank geometry being studied (Pollen and Simon,
2005). Wu et al. (1979) developed a simple perpendicular root model, which has been
applied in many studies to estimate the increase in soil shear strength through roots.
This model uses root tensile strength and root distribution to estimate the increase in
soil shear strength. However, Pollen and Simon (2005) found that the Wu’s
perpendicular root models tend to overestimate root-reinforcement and hence recently
developed a dynamic fiber bundle Rip-Root model accounting for the progressive
manner of root breaking.
The present study was conducted in the northwestern highlands of Ethiopia to: (i)
determine the enhancement of soil shear strength by roots of 26 local and exotic plant
species, and (ii) investigate which plants are most appropriate to strengthen the gully
banks and thereby reduce gully erosion.
4.2 Materials and methods
4.2.1 Study Area

97
This study was conducted in Debre Mawi watershed, northwestern Ethiopian highlands.
It is located 30 km south of Lake Tana along the road from Bahir Dar to Adet between
latitudes 11o20’13’’ and 11o21’58’’ N and longitudes 37o24’07’’ and 37o25’55’’ E
(Figure 3.1). The Debre Mawi watershed covers an area of 608 ha. The semi-humid
climate is characterized by a major dry phase lasting from October until May. The rainy
phase peaks from July until the beginning of September. The average annual rainfall for
the years from 1996 to 2014 was 1280 mm yr-1.
The major land uses in the watershed include cropland (92% of the total area),
forests/woodlots and residences (2%), and rangeland (6%). Vegetation consists of
shrubs, eucalypts woodland, with scattered acacia and related tree species and an
occasional groundcover of annual herbs which is absent during long dry periods. The
steep slopes in the upper part of the watershed where the top soil is too shallow to sustain
crop growth is covered by small indigenous bushes and shrubs, whereas the flatter areas
in the lower and upper part of the watershed are predominantly used for the cultivation
of major crops such as tef (Eragrostis abyssinica), finger-millet (Eleusine coracana),
maize (Zea mays) and wheat (Triticum aestivum).
Though the flat areas (lower slope areas) are potentially the most productive, the rapidly
developing gullies are fragmenting the fertile land and aggravating soil losses (Tebebu
et al., 2010; Zegeye et al., 2010). More than 20 ha or 3% of land in the Debre Mawi
watershed is severely affected by gully erosion (Zegeye et al., 2016). In response to the
problems of land degradation, the government of Ethiopia has started a large-scale SWC
campaign in the watershed (Dagnew et al., 2015). However, the campaign work was
98
mainly focused on controlling sheet or rill erosion whereas little attention was given for
gully controlling strategies. As a result, sediment load and concentration at the outlet of
the watershed has not been decreasing though SWC measures were implemented in the
watershed (Zegeye et al., 2014). Further, efforts exerted to rehabilitate gullies using
check dams, diversion of flow direction and plantations were not successful, as such
practices do not affect the actual gully formation mechanics in the sub-humid Debre
Mawi watershed (Langendoen et al., 2013; Langendoen et al., 2014; Zegeye et al., 2014;
Dagnew et al., 2015).

99
Figure 4.1. Location of Debre Mawi watershed in north western Ethiopia and its
land use in 2014

100
4.2.2 Sampling and experimental design.
The most abundant plant species in the watershed were identified by interviewing the
local community and through transect walks. Since the objective is to control erosion,
the species were preferably selected from lands where gully networks predominate and
as much as possible, most species were collected from the same location to reduce errors
arising from spatial variability. Roots of 26 different plant species comprising 7 grasses,
10 shrubs and 9 tree species growing in the Debre Mawi watershed were sampled to
determine their physical properties (such as tensile strength and root volumetric ratio).
Of the 26 sampled plants, 18 (70%) were indigenous and 8 (30%) were exotic. The
excavation of each plant was carried out manually within the area delineated by the
vertical projection of the above-ground biomass (De Baets et al., 2007) and to a depth of
0.6 m (Figure 4.2). The size of excavated area is a function of the width of the above-
ground biomass in each plant species. Care was taken to avoid any damage to roots
during the excavation process. After excavation, the roots were packed immediately in
a plastic bag to preserve their moisture content and then transported to the Adet
Agricultural Research Center where they were stored at 4°C and root volumetric ratio
for each plant was determined (Figure 4.3). To determine root fiber direction or
orientation, a microscope was used through which pictures of root fibers were taken by
a digital camera.

101
Figure 4.2. Examples illustrating the excavation of plant roots under the vertical
projection of the above ground biomass, the rope and the stick shows the diameter of
the excavated soil under the projection, (a) S.rhombiflia (shrub), (b and c)
A.decurrens (tree) (d) C.palmensis (tree) , (e) H.dregeana (grass)
4.2.3 Determination of root volumetric ratio (RVR) and tensile strength (Tr)
We estimated the root volumetric ratio (RVR) of each sampled plant by immersing the
sample in a predetermined calibrated cylinder (a volume of 5 litter) filled with water.
The increase in water level after immersion of roots in the cylinder was equated to the
total volume of roots. This volume was divided by the volume of excavated soil with a
depth of 0.6 m under the projection of the above-ground biomass to determine a plant-
mean root volumetric ratio (Eq. 4.1).

102
)1.4(V
VRVR R
where RVR is the volumetric fraction of the soil occupied by roots, 𝑉𝑅 is the volume of
roots which is equivalent to the displaced water when the roots were immersed in the
cylinder, V is the total volume of the soil from which the roots were sampled to a depth
of 0.6 meter. Using this soil depth will underestimate the maximum RVR, as most roots
of a plant are generally found at depths up to 0.2 m. It also doesn’t account for roots
growing at greater depths.
Following the determination of RVR of each plant, the roots were put in a 15% ethanol
solution at a temperature of 4°C (De Baets et al., 2008) for 3 to 5 days until transported to
the Addis Ababa Leather Industry Development Institute (LIDI) for determining root
tensile strength. This conservation method was proposed by Bischetti et al. (2005) as an
alternative method to preserve root moistures for several months and showed results
equivalent with fresh root samples.
The root tensile strength tests were then carried out in the LIDI research and testing
laboratory using a Testometric M350-20AT materials testing machine (Figure C1-1),
which has a speed range of 0.001 to 500 mm min-1. Selecting an appropriate test speed
is very important. Velocities recorded for the expansion or retreat of gully systems by
rapid landslides or mass movements ranged from 1 to 300 mm min-1 (Cruden and
Varnes, 1996). According to De Baets et al. (2008), a smaller test speed has to be
performed when a critical tensile strength has to be assessed for very slow soil erosion
processes. Therefore, a speed of 10 mm min-1 was selected (Bischetti et al., 2005; Mattia

103
et al., 2005; De Baets et al., 2008). The tested root length was 0.1 m for all roots as shown
in Table C1.
From a total of 3350 roots collected from all selected plant species, 319 were found
undamaged and data were collected from these roots (Table C1). Out of the 319 roots,
241 (76%) were successfully tested. Before testing, root diameter was measured at three
points, i.e. near the upper grip, at the middle and near the bottom grip, using a digital
caliper. Clamping is the most critical issue when measuring root tensile strength (De
Baets et al., 2008). The 241 specimens (76%) broke successfully near and at the middle
of their test length. 78 specimens (24%) broke near or at the position of clamping, or
slipped out of the clamps. These tests were considered as invalid, and not used in data
analysis. Additional data is given in Table C1.
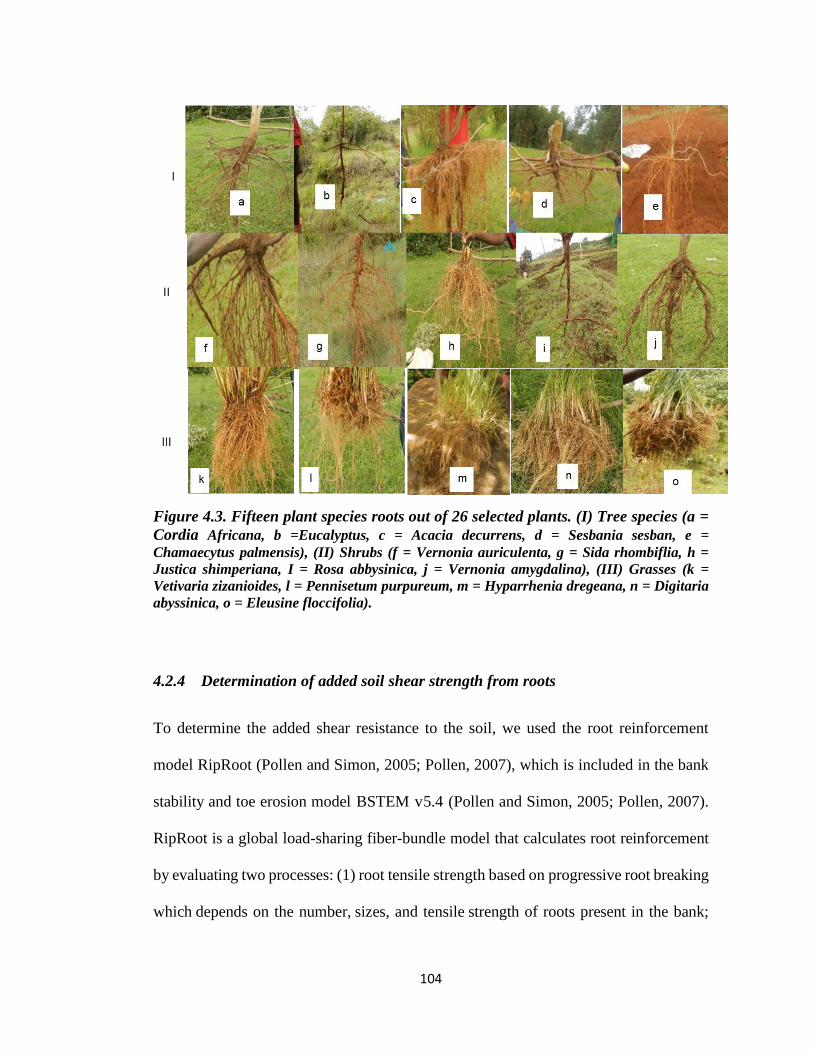
104
Figure 4.3. Fifteen plant species roots out of 26 selected plants. (I) Tree species (a =
Cordia Africana, b =Eucalyptus, c = Acacia decurrens, d = Sesbania sesban, e =
Chamaecytus palmensis), (II) Shrubs (f = Vernonia auriculenta, g = Sida rhombiflia, h =
Justica shimperiana, I = Rosa abbysinica, j = Vernonia amygdalina), (III) Grasses (k =
Vetivaria zizanioides, l = Pennisetum purpureum, m = Hyparrhenia dregeana, n = Digitaria
abyssinica, o = Eleusine floccifolia).
4.2.4 Determination of added soil shear strength from roots
To determine the added shear resistance to the soil, we used the root reinforcement
model RipRoot (Pollen and Simon, 2005; Pollen, 2007), which is included in the bank
stability and toe erosion model BSTEM v5.4 (Pollen and Simon, 2005; Pollen, 2007).
RipRoot is a global load-sharing fiber-bundle model that calculates root reinforcement
by evaluating two processes: (1) root tensile strength based on progressive root breaking
which depends on the number, sizes, and tensile strength of roots present in the bank;
105
and (2) root pull-out based on the friction at the root-soil interface, which is a function
of root and soil properties and pore-water pressures. The reported root cohesion (Table
4.1) is an average for the top 0.2 m of the soil profile, which fieldwork has shown to
generally include the majority of fine roots that contribute to the reinforced root-soil
matrix (S imon and Co l l i son , 2002 ; Po l l en e t a l . , 2004 ; Langendoen e t
a l . , 2009 ) . The Ethiopian indigenous and exotic plant species are not included in
RipRoot’s built-in database of vegetation species. Thus, we used our measured root
tensile strength-diameter relationship and root distribution data to run the model.
Statistical analysis
Tests for normality (Kolmogorov–Smirnov D statistic) and equality of variance (Levene
statistic) were conducted and found that root tensile strength, RVR and cohesion were
not normally distributed. Hence, a non-parametric test, a Kruskal–Wallis (K) test was
performed to test the significance of the difference between grasses, shrubs and trees in
root tensile strength, RVR and cohesion. Also, we carried out such tests to test the
significance of differences in root tensile strength, RVR and cohesion within a plant
species (i.e., within grass, shrub and tree species). Further, the differences in the three
parameters between fibrous and tap root system were tested using the same statistical test.
Power law equations were fitted through the root tensile strength diameter relationships
using a least square error method. Correlation tests were conducted to determine the
relationship between plant root cohesion (Cr), and RVR and tensile strength.
4.3 Results

106
4.3.1 Root tensile strength and volumetric ratio
The results demonstrated that smaller roots are stronger per unit area than large roots,
resulting in decreasing root tensile strength (Tr) with increasing root diameter (D) for
all but one of the tested plant species (Figure 4.4, Table 4.1). In all tested species, strong
correlation between tensile strength and diameter were detected (mean R2 = 0.67 ±0.18).
Weak relationship (R2 = 0.27) between tensile strength and diameter was found for the
C.palmensis, while strong correlation (R2 = 0.94) between tensile strength and diameter
was found for R.abbysinica. The total broken roots (Figure 4.4d) were fitted better with
logarithm relationship and its R2 is 0.35 which is less than the average of individual.
The mean tensile strength of the investigated grass species ranged from 23 to72 MPa,
of shrub species from 8 to 46 MPa and of tree species from 19 to 66 MPa. The maximum
tensile strength value (i.e., 384 MPa) was recorded for Tephrosia with a root diameter
of 0.13 mm. Within a vegetation type group, E.floccifolia (grass), Tephrosia (tree) and
R.abbysinica (shrub) have relatively the strongest roots, whereas V.zizanioides (grass),
C.africana (tree) and A.Elaphroxylon (shrub) have the weakest roots. However, the
median root tensile strength between the three groups of plant types was not
significantly different (p > 0.05).
The root volumetric ratio of each tested plant was less than 1% (Table 4.1). The
maximum root volumetric ratio of 0.46% was measured for Digitaria abyssinica (grass)
roots. In general, the grass species had higher RVRs compared with shrub and tree
species. The specie Acacia decurrens and the species Vernonia auriculenta and Justica
shimperiana had the largest RVRs in the tree and shrub vegetation groups, respectively.

107
We found no significant difference in RVR between the three groups of plant types (p
> 0.05). Regarding root system architecture, all grasses, tree species such as Acacia
decurrens and Chamaecytus palmensis, and shrub specie Justica shimperiana typically
had a dense and fibrous root system, whereas other investigated shrub and tree species
had a tap root system (Figure 4.3, Table 4.1). Our results indicated that plants having
fibrous root system have significantly (p < 0.05) higher tensile strength than plants
having tap root system.
All tested grasses showed parallel fibers, whereas shrubs displayed transversal fibers
(Table 4.1). About 50 % of the tested roots did not have clear fiber direction, 40% of
which were tree roots. The roots which have parallel fibers (e.g., S.natalensis,
Tephrosia, S.rhombiflia) had greater tensile strength. Roots having transverse fibers or
normal to the root length (e.g., H.dregeana, C.palmensis, V.amygdalina) were mostly
weak in tension. Additional data is given in Figure C2-1.

108
Figure 4.4. Root tensile strength (Tr, MPa) plotted against root diameter (D, mm)
for roots of 26 exotic and indigenous plant species of Ethiopia. The left side
represents the measured tensile strength whereas the right side represents the
predicted tensile strength values listed in Table 4.1.

109
Table 4.1. The added cohesion (Cr) values for 26 plant species based on RipRoot model, Tr stands for tensile strength of roots, RVR is root
volume ratio, a, b and R2 are values for the power relationships Tr = aD-b, where D is mean root diameter), P is parallel, T is transverse and
U stands for the root fibers’ direction is not clearly observed
Species Local
name
Scientific name Species
type
total
roots
Fiber
direction
Tested
roots
successively
tested roots
Tr, ave.
(MPa)
RVR
(%)
Diameter
(mm)
a b R2 Cr at depth
of 0.2m
Godir D.abyssinica Grass 907 P 12 9 42 0.46 0.43-1.17 37 -0.48 0.52 33
Akirma E.floccifolia Grass 419 P 12 9 72 0.26 0.28-0.86 26 -1.09 0.78 11.7
senbelet H.dregeana Grass 241 U 11 10 36.3 0.18 0.39-1.50 26 -0.97 0.93 10
vetiver V.zizanioides Grass 244 U 10 8 23 0.24 0.41-1.82 23 -0.29 0.67 9.2
Elephant grass P.purpureum Grass 110 P 18 10 44.5 0.11 0.41-1.33 36 -0.73 0.61 6.5
Murie S.natalensis Grass 158 P 8 7 53 0.15 0.2-1.28 28 -0.58 0.77 4.4
Shenbeko A.donax Grass 60 P 16 10 33.3 0.06 0.71-2.02 35 -0.3 0.47 3.8
Simiza J.shimperiana Shrub 144 U 16 11 20.5 0.28 0.57-2.84 23 -0.64 0.89 15.1
Dengorita V.auriculenta Shrub 69 U 11 9 27 0.28 0.14-3.27 21 -0.67 0.68 10
Yergib Ater C.cajan Shrub 33 U 12 10 37 0.11 0.19-3.46 38 -0.48 0.67 9.8
Grawa V.amygdalina Shrub 33 T 17 12 20.4 0.11 0.30-5.00 18 -0.94 0.77 3.7
Gorjejit S.rhombiflia Shrub 53 P 11 9 27.6 0.07 0.41-3.0 26 -0.75 0.75 3.4
Agam C.edulis Shrub 51 T 15 11 24.9 0.09 0.39-3.9 26 -0.44 0.72 3.4
Gesho R.prinoids Shrub 14 T 6 4 24.6 0.04 1.45-3.63 45 -0.88 0.9 2.2
Qega R.abbysinica Shrub 13 U 8 7 46 0.07 0.23-3.78 36 -0.97 0.94 2.3
Ambacho A.elaphroxylon Shrub 8 T 7 7 8 0.03 1.02-2.13 12 -0.93 0.57 0.4
Yabsha Girar A.abssynica Tree 25 U 11 8 29.4 0.13 0.55-3.65 30 -0.19 0.51 15
Susbania S.sesban Tree 83 U 14 12 49.5 0.19 0.33-6.34 53 -0.5 0.86 12.3
Yeferenj girar A.decurrens Tree 417 U 17 11 34.6 0.21 0.33-2.93 34 -0.38 0.63 11.8
Tephrosia Tephrosia Tree 88 P 14 12 66.4 0.1 0.13-3.12 31 -1.02 0.91 7.9
Nech girar A.seyal Tree 14 U 14 13 41 0.03 0.31-3.00 39 -0.62 0.76 6.5
TreeLucerne C.palmensis Tree 48 T 8 6 29.3 0.16 0.56-2.38 25 0.44 0.27 5.8
wanza C.africana Tree 49 U 13 9 19.5 0.16 0.55-6.20 22 -0.28 0.59 4.9
Bahir zaf E.camaldulensis Tree 23 U 14 9 21.5 0.12 0.24-3.20 18 -0.57 0.49 3.3
Misana C.macrostachyus Tree 14 T 11 9 19.7 0.05 0.48-3.65 19 -0.43 0.45 2.9
Gravilia G. ronusta Tree 32 P 13 9 40.4 0.07 0.37-2.28 22 -1.09 0.92 1.3

110
4.3.2 Cohesion as influenced by plant species type
Our results demonstrated that the estimated root cohesion (Cr) values at a depth of 0.2
m (Table 4.1) varied between 0.4 kPa (Elaphroxylon; shrub) and 33 kPa (Digitaria
abyssinica; grass). Root cohesion values of grasses were generally twice of shrubs and
approximately half greater than those of trees (Table 4.1). We detected that the
effectiveness of the tested plant species in stabilizing the banks of gullies decreases with
increasing depth (Figure 4.5). For example, based on the Rip-Root model analysis,
Digitaria abyssinica (grass), Shimperiana (shrub) and acacia Abssynica (tree) can
increase the soil cohesion by 33, 15.1 and 15 kPa, respectively, in the upper 0.2 m of
the soil, but their effectiveness decreases progressively by 33% when increasing the
depth by 0.1 m. In the 0 to 0.2 m depth, significant (p < 0.05) difference in mean root
cohesion between plant species having fibrous root systems (e.g., all grasses or Accasia
decurrens (tree)) and tap root systems (e.g., Cordia africana (wanza), Eucalyptus, and
Rosa Abbysinica (Qega)) was detected. Plant root cohesion (Cr) was significantly
correlated with root volumetric ratio (R2 = 0.74, p << 0.05), while the relationship
between Cr and tensile strength (Tr) was not significant (R2 = 0.06, p > 0.05).

111
Figure 4.5. Root cohesion values (Cr) as a function of soil depth for 26 plant species
112
4.4 Discussion
4.4.1 Increased cohesion versus Tr and RVR
Our results (Figure 4.6, Table 4.1) demonstrated that plants having higher root volume
ratio distribution (RVR) can better contribute to enhance the strength of soil compared
with plants having higher tensile strength. For example, the roots of R.abbysinica
(shrub), G.ronusta (tree) and S.natalensis (grass) have greater tensile strength.
However, their smaller value of RVR reduced their effectiveness in increasing the
strength of soils. This was supported by the significant relationship between Cr and
RVR. In general, plants having fibrous root systems with the large number of fine strong
roots could contribute the highest amount of soil reinforcement in line with the study by
De Baets et al. (2008).
Our results are comparable to those of previous studies (Wu et al., 1979; Pollen et al.,
2004; Genet et al., 2005; Pollen and Simon, 2005; De Baets et al., 2008; Burylo et al.,
2012), in that root tensile strength and root diameter are inversely related when fitted
with a power law equation. The maximum tensile strength values of 354 MPa observed
in Tefrosia roots with a diameter of 0.13 mm is not surprising as also observed by
previous studies. For example, Genet et al. (2005) observed the strength values of 132–
201 MPa in roots < 0.9 mm in diameter for three tree species; Bischetti et al. (2005)
found extremely high values (up to 750 MPa) in roots 0.2–0.5 mm in diameter in
several tree species.

113
Figure 4.6. Relationships between soil cohesion (Cr) and volumetric root ratio
(RVR) and root tensile strength (Tr)
Previous studies that did not use the Rip-Root model reported different Cr values. For
example, trees (Greenway, 1987) and rush plants increased up to 304 kPa (De Baets et

114
al., 2008), which are greater than our findings (Table 4.1). This may be due to the
difference in the estimating ability of models. Most researches used Wu’s model ( see
section 4.1) that over predicts root cohesion relative to the Rip-Root model (Pollen et
al., 2004; Pollen and Simon, 2005).
4.4.2 Root reinforcement
The increase in soil cohesion due to the presence of plant roots decreases with soil depth,
which indicates that the tested species can only reinforce the top 50 cm of the soil profile
efficiently. Because gullies in the Debre Mawi are mostly deeper than 0.5 m (Tebebu et
al., 2010; Zegeye et al., 2016) , the investigated species listed in Table 4.1 might not be
effective in stabilizing gullies in study site. This finding is in line with Langendoen et
al. (2013) who claimed that root reinforcement provided by vegetation has a limited
stabilizing effect. Therefore, gully sidewall stabilization with vegetation would best be
provided only if integrated with other protective measures such as a combination of
gully bottom grade control to prevent further incision, and toe protection to prevent
sidewall steepening (Langendoen et al., 2013). Similarly, Mediterranean vegetation
studied by Cammeraat et al. (2005) and De Baets et al. (2008) showed similar findings
in that the root reinforcing effect of Mediterranean vegetation is limited and only
present in the upper 0.4 m and 0.5 m of top soil, respectively.
However, the tested grass and shrub species could reduce the probability of gully
initiation and could stabilize the banks of gullies provided that the height of the gully
banks can be reduced through regrading to decrease the bank slope, or by elevating the
115
channel bed through constructing check dams to trap sediments. Grass and shrub species
can then be planted or sowed on the regraded bank or on the deposited silt.
4.4.3 Impacts of root fiber direction on the root strength
The tensile strength of the roots of the tested plant species was related to fiber structure
or orientation (Table 4.1). The root fiber structure or orientation may therefore affect
the strength of plant roots. This finding is in line with Niklas and Spatz (2012) in that
plant roots that produce many parallel fibers (in a binding matrix) will shear little. These
authors further elaborated that if a fiber breaks, the stress is redistributed evenly among
the remaining fibers. Root fibers that are aligned parallel to the length, are strong in
tension and that the tensile elastic modulus in the longitudinal direction can be three
times more than the modulus measured in the transverse direction. The root cellulose
has a higher tensile elastic modulus and a greater tensile strength measured along its
molecular chain length than when measured normal to its length (Niklas and Spatz,
2012). Microscopic pictures for few plant root fibers is given Figure C2-1.
4.4.4 Relative contribution of plant species and implications of erosion protection
strategies
The results demonstrated that differences between grasses, shrubs and trees in shear
strength were not significant. However, grasses displayed higher shear resistance
compared with trees and shrubs (Figure 4.7) in the top soil (upper 0-0.2 m of the soil).
Nevertheless, the shear resistance of shrubs and trees could increase with age, as the
root biomass of shrubs and trees increases progressively with time when compared to
grasses (Waldron and Dakessian, 1982).
116
Grasses, such as Digitaria abyssinica, Floccifolia, Dregeana, Zizanioides or
Purpureum (in the order of increasing soil shear strength from 6 - 33 kPa), can be
planted on small gullies to stabilize the 0–0.30 m of topsoil. These species have also
other benefits. Purpureum (elephant grass) gives high biomass for livestock feed and
revegetates very quickly to provide continuous added shear resistance (Amare et al.,
2014). Dregeana (Senbelet) is used for animal fodder and for covering the roof of a
house and can increase economical return. Digitaria abyssinica and E. floccifolia can
be planted as well in natural drainage lines or on gully bottoms to prevent soil
detachment by water as they have strong roots. Deep rooted shrubs, such as
Shimperiana, Auriculenta and trees like Acacia abssynica, can be used to stabilize gully
walls as they provide an extra cohesion more than one meter of soil depth.

117
Figure 4.7. Average cohesion (Cr) of three plant types as a function of soil depth
Generally, the tested grass and shrub species could reduce the probability of gully
initiation and could stabilize the banks of gullies provided that the height of the gully
banks can be reduced through regrading to decrease the bank slope, or by elevating the
channel bed through constructing check dams to trap sediments. Grass and shrub species
can then be planted or sowed on the regraded bank or on the deposited silt.
4.5 Conclusions
Our results demonstrated that the common plant species grown in the study watershed
can effectively stabilize gully banks to a depth of 0.2 m and their effectiveness in

118
stabilizing gully banks decreases with soil depth. Grasses have comparative advantages
over shrub and trees in stabilizing gully banks due to their fibrous root system. The
results support the conclusion that the use of plant species to stabilize gully banks and
thereby reduce gully erosion in the highlands of Ethiopia needs to be integrated with
other gully rehabilitation measures such as reshaping or regrading of gully banks and
construction physical structures like check dams. Our findings contribute to the success
of the huge SWC campaign led by the Ethiopian government by providing science-
based information on: (a) effectiveness of different plant species in controlling gully
erosion, (b) technical requirements that should be considered when using biological
conservation measures, and (c) identifying the better integration of physical and
biological conservation measures.
ACKNOWLEDGEMENTS
This research was supported financially by The Norman E. Borlaug Leadership
Enhancement in Agriculture Program (Borlaug LEAP-016258-82), International
Foundation for Science (IFS-W/5407-1), Cornell University (Hudson H. Lyon fund,
Bradfield Research award). I would like to thank Addis Ababa Leather Industry
Development Institute (LIDI) who allowed me to use the materials testing machine for
my root tensile strength tests. Petros*, Kibrom and Tsegab, working in the LIDI
laboratory, gave me their unreserved support and is really unforgotten.

119
REFERENCES
Abiy, A. Z.: Geological controls in the formations and expansions of Gullies over hillslope
hydrological processes in the highlands of Ethiopia, Northern Blue Nile Region,
Cornell University, 2009.
Amare, T., Zegeye, A. D., Yitaferu, B., Steenhuis, T. S., Hurni, H., Zeleke, G.: Combined
effect of soil bund with biological soil and water conservation measures in the
northwestern Ethiopian highlands, Ecohydrology & Hydrobiology, 14, 192-199,
doi:10.1016/j.ecohyd.2014.07.002, 2014.
Arnaez, J., Larrea, V., Ortigosa, L.: Surface runoff and soil erosion on unpaved forest roads
from rainfall simulation tests in northeastern Spain, Catena, 57, 1-14,
doi:10.1016/j.catena.2003.09.002, 2004.
Asselman, N. E.: Suspended sediment dynamics in a large drainage basin: the River Rhine,
Hydrological processes, 13, 1437-1450, doi:org/10.1623/hysj.53.1.224, 1999.
Avni, Y.: Gully incision as a key factor in desertification in an arid environment, the Negev
highlands, Israel, Catena, 63, 185-220, 2005.
Ayele, G. K., Gessess, A. A., Addisie, M. B., Tilahun, S. A., Tebebu, T. Y., Tenessa, D. B.,
Langendoen, E. J., Nicholson, C. F., Steenhuis, T. S.: A Biophysical and Economic
Assessment of a Community‐based Rehabilitated Gully in the Ethiopian Highlands,
Land Degradation & Development, doi:10.1002/ldr.2425, 2015.
Bača, P.: Hysteresis effect in suspended sediment concentration in the Rybárik basin,
Slovakia/Effet d'hystérèse dans la concentration des sédiments en suspension dans le
bassin versant de Rybárik (Slovaquie), Hydrological Sciences Journal, 53, 224-235,
doi:org/10.1623/hysj.53.1.224, 2008.
Ben Slimane, A., Raclot, D., Evrard, O., Sanaa, M., Lefevre, I., Le Bissonnais, Y.: Relative
Contribution of Rill/Interrill and Gully/Channel Erosion to Small Reservoir Siltation
in Mediterranean Environments, Land Degradation & Development,
doi:10.1002/ldr.2387, 2015.
Bewket, W., Sterk, G.: Dynamics in land cover and its effect on stream flow in the Chemoga
watershed, Blue Nile basin, Ethiopia, Hydrological Processes, 19, 445-458,
doi:10.1002/hyp.5542, 2005.
Bischetti, G. B., Chiaradia, E. A., Simonato, T., Speziali, B., Vitali, B., Vullo, P., Zocco, A.:
Root strength and root area ratio of forest species in Lombardy (Northern Italy), Plant
and soil, 278, 11-22, 2005.

120
Borrelli, P., Märker, M., Panagos, P., Schütt, B.: Modeling soil erosion and river sediment
yield for an intermountain drainage basin of the Central Apennines, Italy, Catena,
114, 45-58, doi:10.1016/j.catena.2013.10.007, 2014.
Bradford, J., Piest, R.: Erosional development of valley-bottom gullies in the upper
midwestern United States, Thresholds in geomorphology, 75-101, 1980.
Bradford, J. M., Farrell, D., Larson, W.: Mathematical evaluation of factors affecting gully
stability, Soil Science Society of America Journal, 37, 103-107, 1973.
Bunt, C. M., Cooke, S. J., Schreer, J. F., Philipp, D. P.: Effects of incremental increases in silt
load on the cardiovascular performance of riverine and lacustrine rock bass,
Ambloplites rupestris, Environmental Pollution, 128, 437-444, 2004.
Burylo, M., Rey, F., Mathys, N., Dutoit, T.: Plant root traits affecting the resistance of soils to
concentrated flow erosion, Earth Surface Processes and Landforms, 37, 1463-1470,
2012.
Cammeraat, E., van Beek, R., Kooijman, A.: Vegetation succession and its consequences for
slope stability in SE Spain, Plant and Soil, 278, 135-147, 2005.
Campo‐Bescós, M., Flores‐Cervantes, J., Bras, R., Casalí, J., Giráldez, J.: Evaluation of a
gully headcut retreat model using multitemporal aerial photographs and digital
elevation models, Journal of Geophysical Research: Earth Surface, 118, 2159-2173,
2013.
Cao, C. S., Chen, L., Gao, W., Chen, Y., Yan, M.: Impact of planting grass on terrene roads to
avoid soil erosion, Landscape and urban planning, 78, 205-216,
doi:10.1016/j.landurbplan.2005.07.007, 2006.
Capra, A., Porto, P., Scicolone, B.: Relationships between rainfall characteristics and
ephemeral gully erosion in a cultivated catchment in Sicily (Italy), Soil and Tillage
Research, 105, 77-87, 2009.
Cerdà, A.: Soil water erosion on road embankments in eastern Spain, Science of the Total
Environment, 378, 151-155, 2007.
Cerdà, A., Keesstra, S., Pereira, P., Matrix-Solera, J., Giménez-Morera, A., Úbeda, X.,
Francos, M., Alcañiz, M., Jordán, A.: Long-term changes in soil erosion due to forest
fires. A rainfall simulation approach in Eastern Spain, 2016.

121
Clark, L., Wynn, T.: Methods for determining streambank critical shear stress and soil
erodibility: implications for erosion rate predictions, Transactions of the ASABE, 50,
95-106, 2007.
Collins, A., Walling, D., Leeks, G.: Sediment sources in the Upper Severn catchment: a
fingerprinting approach, Hydrology and Earth System Sciences Discussions, 1, 509-
521, 1997.
Collins, A., Walling, D., Sichingabula, H., Leeks, G.: Suspended sediment source
fingerprinting in a small tropical catchment and some management implications,
Applied Geography, 21, 387-412, 2001.
Cruden, D. M., Varnes, D. J.: Landslides: investigation and mitigation. Chapter 3-Landslide
types and processes, Transportation research board special report, 1996.
Daba, S., Rieger, W., Strauss, P.: Assessment of gully erosion in eastern Ethiopia using
photogrammetric techniques, Catena, 50, 273-291, 2003.
Dagnew, D. C., Guzman, C. D., Zegeye, A. D., Tibebu, T. Y., Getaneh, M., Abate, S., Zemale,
F. A., Ayana, E. K., Tilahun, S. A., Steenhuis, T. S.: Impact of conservation practices
on runoff and soil loss in the sub-humid Ethiopian Highlands: The Debre Mawi
watershed, Journal of Hydrology and Hydromechanics, 63, 214-223, 2015.
De Baets, S., Poesen, J., Gyssels, G., Knapen, A.: Effects of grass roots on the erodibility of
topsoils during concentrated flow, Geomorphology, 76, 54-67, 2006.
De Baets, S., Poesen, J., Knapen, A., Barberá, G., Navarro, J.: Root characteristics of
representative Mediterranean plant species and their erosion-reducing potential during
concentrated runoff, Plant and Soil, 294, 169-183, 2007.
De Baets, S., Poesen, J., Reubens, B., Muys, B., De Baerdemaeker, J., Meersmans, J.:
Methodological framework to select plant species for controlling rill and gully
erosion: application to a Mediterranean ecosystem, Earth Surface Processes and
Landforms, 34, 1374-1392, 2009.
De Baets, S., Poesen, J., Reubens, B., Wemans, K., De Baerdemaeker, J., Muys, B.: Root
tensile strength and root distribution of typical Mediterranean plant species and their
contribution to soil shear strength, Plant and Soil, 305, 207-226, 2008.
De Oña, J., Osorio, F., Garcia, P. A.: Assessing the effects of using compost–sludge mixtures
to reduce erosion in road embankments, Journal of hazardous materials, 164, 1257-
1265, 2009.

122
De Vente, J., Poesen, J., Arabkhedri, M., Verstraeten, G.: The sediment delivery problem
revisited, Progress in Physical Geography, 31, 155-178, 2007.
De Vente, J., Poesen, J., Verstraeten, G., Govers, G., Vanmaercke, M., Van Rompaey, A.,
Arabkhedri, M., Boix-Fayos, C.: Predicting soil erosion and sediment yield at regional
scales: Where do we stand?, Earth-Science Reviews, 127, 16-29,
doi:10.1016/j.earscirev.2013.08.014, 2013.
Fleitmann, D., Dunbar, R. B., McCulloch, M., Mudelsee, M., Vuille, M., McClanahan, T. R.,
Cole, J. E., Eggins, S.: East African soil erosion recorded in a 300 year old coral
colony from Kenya, Geophysical Research Letters, 34,
doi:DOI:10.1029/2006GL028525, 2007, 2007.
Frankl, A., Deckers, J., Moulaert, L., Van Damme, A., Haile, M., Poesen, J., Nyssen, J.:
Integrated solutions for combating gully erosion in areas prone to soil piping:
innovations from the drylands of Northern Ethiopia, Land Degradation &
Development, 2014.
Frankl, A., Poesen, J., Deckers, J., Haile, M., Nyssen, J.: Gully head retreat rates in the semi-
arid highlands of Northern Ethiopia, Geomorphology, 173, 185-195, 2012.
Frankl, A., Poesen, J., Haile, M., Deckers, J., Nyssen, J.: Quantifying long-term changes in
gully networks and volumes in dryland environments: The case of Northern Ethiopia,
Geomorphology, 201, 254-263, 2013.
García, M. H., Motta, D., Abad, J. D., Langendoen, E. J.: A computational platform for
physically-based bank evolution and long-term meander migration, In: Meeting
Proceedings. 2010.
Gellis, A. C.: Factors influencing storm-generated suspended-sediment concentrations and
loads in four basins of contrasting land use, humid-tropical Puerto Rico, Catena, 104,
39-57, doi:org/10.1016/j.catena.2012.10.018, 2013.
Genet, M., Stokes, A., Salin, F., Mickovski, S. B., Fourcaud, T., Dumail, J.-F., van Beek, R.:
The influence of cellulose content on tensile strength in tree roots, Plant and soil, 278,
1-9, 2005.
Gessesse, B., Bewket, W., Bräuning, A.: Model‐based characterization and monitoring of
runoff and soil erosion in response to land use/land cover changes in the Modjo
watershed, Ethiopia, Land Degradation & Development, 26, 711-724, doi:DOI:
10.1002/ldr.2276, 2015.

123
Ghimire, G., Uprety, B.: Causes and effects of siltation on the environment of Nepal,
Environmentalist, 10, 55-65, 1990.
Gomez, B., Banbury, K., Marden, M., Trustrum, N. A., Peacock, D. H., Hoskin, P. J.: Gully
erosion and sediment production: Te Weraroa Stream, New Zealand, Water
Resources Research, 39, 2003.
Greenway, D.: Vegetation and slope stability, Slope stability: geotechnical engineering and
geomorphology/edited by MG Anderson and KS Richards, 1987.
Guzman, C., Tilahun, S., Zegeye, A., Steenhuis, T.: Suspended sediment concentration–
discharge relationships in the (sub-) humid Ethiopian highlands, Hydrology and Earth
System Sciences, 17, 1067-1077, doi:10.5194/hess-17-1-2013, 2013.
Gyssels, G., Poesen, J.: The importance of plant root characteristics in controlling
concentrated flow erosion rates, Earth Surface Processes and Landforms, 28, 371-
384, 2003.
Gyssels, G., Poesen, J., Bochet, E., Li, Y.: Impact of plant roots on the resistance of soils to
erosion by water: a review, Progress in Physical Geography, 29, 189-217, 2005.
Gyssels, G., Poesen, J., Liu, G., Van Dessel, W., Knapen, A., De Baets, S.: Effects of cereal
roots on detachment rates of single‐and double‐drilled topsoils during concentrated
flow, European Journal of Soil Science, 57, 381-391, 2006.
Haregeweyn, N., Poesen, J., Nyssen, J., De Wit, J., Haile, M., Govers, G., Deckers, S.:
Reservoirs in Tigray (Northern Ethiopia): characteristics and sediment deposition
problems, Land Degradation & Development, 17, 211-230, doi:10.1002/ldr.698,
2006.
Haregeweyn, N., Poesen, J., Nyssen, J., Verstraeten, G., De Vente, J., Govers, G., Deckers, S.,
Moeyersons, J.: Specific sediment yield in Tigray-Northern Ethiopia: assessment and
semi-quantitative modelling, Geomorphology, 69, 315-331, 2005.
Haregeweyn, N., Poesen, J., Verstraeten, G., Govers, G., Vente, J., Nyssen, J., Deckers, J.,
Moeyersons, J.: Assessing the performance of a spatially distributed soil erosion and
sediment delivery model (WATEM/SEDEM) in Northern Ethiopia, Land
Degradation & Development, 24, 188-204, doi:10.1002/ldr.1121, 2013.
Hawando, T.: Desertification in Ethiopian highlands, Rala Report, 1997.
Holeman, J. N.: The sediment yield of major rivers of the world, Water Resources Research,
4, 737-747, 1968.

124
House, W. A., Warwick, M. S.: Hysteresis of the solute concentration/discharge relationship
in rivers during storms, Water Research, 32, 2279-2290, 1998.
Hurni, H., Tato, K., Zeleke, G.: The implications of changes in population, land use, and land
management for surface runoff in the upper Nile basin area of Ethiopia, Mountain
Research and Development, 25, 147-154, doi:10.1659/0276-4741(2005)025[0147:
TIOCIP] 2.0.CO;2, 2005.
Jain, S. K., Goel, M.: Assessing the vulnerability to soil erosion of the Ukai Dam catchments
using remote sensing and GIS, Hydrological Sciences Journal, 47, 31-40, 2002.
Jones, J. A., Swanson, F. J., Wemple, B. C., Snyder, K. U.: Effects of roads on hydrology,
geomorphology, and disturbance patches in stream networks, Conservation Biology,
14, 76-85, 2000.
Klein, M.: Anti clockwise hysteresis in suspended sediment concentration during individual
storms: Holbeck Catchment; Yorkshire, England, Catena, 11, 251-257, 1984.
Kou, M., Jiao, J., Yin, Q., Wang, N., Wang, Z., Li, Y., Yu, W., Wei, Y., Yan, F., Cao, B.:
Successional Trajectory Over 10 Years of Vegetation Restoration of Abandoned
Slope Croplands in the Hill‐Gully Region of the Loess Plateau, Land Degradation &
Development, doi:10.1002/ldr.2356, 2015.
Lanckriet, S., Frankl, A., Mesfin, G., Descheemaeker, K., Nyssen, J.: Gully cut‐and‐fill cycles
as related to agro‐management: a historical curve number simulation in the Tigray
Highlands, Earth Surface Processes and Landforms, 40, 796-808, 2015.
Langendoen, E., Tebebu, T., Steenhuis, T., Tilahun, S.: Assessing gully widening and its
control in the Debra-Mawi watershed, northern Ethiopia, In: Proceedings Conference
on Science and Technology Towards the Development of East Africa (ICST 2013),
eds N. Gabbiye, E. Kaba, KK Monocha Singh, and S. Sharma (Bahir Dar University
Institute of Technology: Ethiopia). pp 214-222, 2013.
Langendoen, E., Zegeye, A., Tebebu, T., Steenhuis, T., Ayele, G., Tilahun, S., Ayana, E.:
Using computer models to design gully erosion control structures for humid northern
Ethiopia, ICHE 2014, Hamburg-Lehfeldt & Kopmann (eds)-Bundesanstalt für
Wasserbau, 2014.
Langendoen, E. J., Alonso, C. V.: Modeling the evolution of incised streams: I. Model
formulation and validation of flow and streambed evolution components, Journal of
Hydraulic Engineering, 134, 749-762, 2008.

125
Langendoen, E. J., Richard Lowrance, R., Simon, A.: Assessing the impact of riparian
processes on streambank stability, Ecohydrology, 2, 360-369, 2009.
Langendoen, E. J., Simon, A.: Modeling the evolution of incised streams. II: Streambank
erosion, Journal of hydraulic engineering, 134, 905-915, 2008.
Li, X.-L., Marschner, H., George, E.: Acquisition of phosphorus and copper by VA-
mycorrhizal hyphae and root-to-shoot transport in white clover, Plant and Soil, 136,
49-57, 1991.
Marcus, W. A.: Lag-time routing of suspended sediment concentrations during unsteady flow,
Geological Society of America Bulletin, 101, 644-651, 1989.
Mattia, C., Bischetti, G. B., Gentile, F.: Biotechnical characteristics of root systems of typical
Mediterranean species, Plant and soil, 278, 23-32, 2005.
Mossa, J.: Sediment dynamics in the lowermost Mississippi River, Engineering Geology, 45,
457-479, 1996.
Muñoz-Robles, C., Reid, N., Frazier, P., Tighe, M., Briggs, S. V., Wilson, B.: Factors related
to gully erosion in woody encroachment in south-eastern Australia, Catena, 83, 148-
157, 2010.
Niklas, K. J., Spatz, H.-C.: Plant physics. University of Chicago Press, 2012.
Nyssen, J., Haile, M., Poesen, J., Deckers, J., Moeyersons, J.: Removal of rock fragments and
its effect on soil loss and crop yield, Tigray, Ethiopia, Soil Use and Management, 17,
179-187, 2001.
Nyssen, J., Poesen, J., Moeyersons, J., Deckers, J., Haile, M., Lang, A.: Human impact on the
environment in the Ethiopian and Eritrean highlands—a state of the art, Earth-science
reviews, 64, 273-320, 2004.
Nyssen, J., Poesen, J., Moeyersons, J., Luyten, E., Veyret‐Picot, M., Deckers, J., Haile, M.,
Govers, G.: Impact of road building on gully erosion risk: a case study from the
northern Ethiopian highlands, Earth Surface Processes and Landforms, 27, 1267-
1283, 2002.
Nyssen, J., Poesen, J., Veyret‐Picot, M., Moeyersons, J., Haile, M., Deckers, J., Dewit, J.,
Naudts, J., Teka, K., Govers, G.: Assessment of gully erosion rates through interviews
and measurements: a case study from Northern Ethiopia, Earth Surface Processes and
Landforms, 31, 167-185, 2006.

126
Oostwoud Wijdenes, D., Bryan, R.: Gully headcuts as sediment sources on the Njemps flats
and initial low-cost gully control measures, Advances in GeoEcology, 27, 205-205,
1994.
Palazón, L., Gaspar, L., Latorre, B., Blake, W., Navas, A.: Evaluating the importance of
surface soil contributions to reservoir sediment in alpine environments: a combined
modelling and fingerprinting approach in the Posets-Maladeta Natural Park, Solid
Earth, 5, 963, doi:10.5194/se-5-963-2014, 2014.
Pereira, P., Gimeìnez-Morera, A., Novara, A., Keesstra, S., Jordán, A., Masto, R., Brevik, E.,
Azorin-Molina, C., Cerdà, A.: The impact of road and railway embankments on runoff
and soil erosion in eastern Spain, Hydrology and Earth System Sciences Discussions,
12, 12947-12985, doi:10.5194/hessd-12-12947-2015, 2015.
Poesen, J., Nachtergaele, J., Verstraeten, G., Valentin, C.: Gully erosion and environmental
change: importance and research needs, Catena, 50, 91-133, 2003.
Poesen, J., Vandaele, K., Van Wesemael, B.: Contribution of gully erosion to sediment
production on cultivated lands and rangelands, IAHS Publications-Series of
Proceedings and Reports-Intern Assoc Hydrological Sciences, 236, 251-266, 1996.
Pollen, N.: Temporal and spatial variability in root reinforcement of streambanks: accounting
for soil shear strength and moisture, Catena, 69, 197-205, 2007.
Pollen, N., Simon, A.: Estimating the mechanical effects of riparian vegetation on stream bank
stability using a fiber bundle model, Water Resources Research, 41, 2005.
Pollen, N., Simon, A., Collison, A.: Advances in assessing the mechanical and hydrologic
effects of riparian vegetation on streambank stability, Riparian vegetation and fluvial
geomorphology, 125-139, 2004.
Rinaldi, M., Simoncini, C., Piégay, H.: Scientific design strategy for promoting sustainable
sediment management: the case of the Magra River (Central‐Northern Italy), River
research and applications, 25, 607-625, doi:10.1002/rra.1243, 2009.
Russell, M., Walling, D., Hodgkinson, R.: Suspended sediment sources in two small lowland
agricultural catchments in the UK, Journal of Hydrology, 252, 1-24, 2001.
Seeger, M., Errea, M.-P., Beguerıa, S., Arnáez, J., Martı, C., Garcıa-Ruiz, J.: Catchment soil
moisture and rainfall characteristics as determinant factors for discharge/suspended
sediment hysteretic loops in a small headwater catchment in the Spanish Pyrenees,
Journal of Hydrology, 288, 299-311, 2004.

127
Simon, A., Collison, A. J.: Quantifying the mechanical and hydrologic effects of riparian
vegetation on streambank stability, Earth Surface Processes and Landforms, 27, 527-
546, 2002.
Simon, A., Curini, A., Darby, S. E., Langendoen, E. J.: Bank and near-bank processes in an
incised channel, Geomorphology, 35, 193-217, 2000.
Simon, A., Derrick, D., Alonso, C., Bankhead, N.: Application of a deterministic bank-
stability model to design a reach-scale restoration project, USDA-ARS and US Army
Corps of Engineers, 2008.
Simon, A., Dickerson, W., Heins, A.: Suspended-sediment transport rates at the 1.5-year
recurrence interval for ecoregions of the United States: transport conditions at the
bankfull and effective discharge?, Geomorphology, 58, 243-262, 2004.
Simon, A., Pollen‐Bankhead, N., Thomas, R. E.: Development and application of a
deterministic bank stability and toe erosion model for stream restoration, Stream
Restoration in Dynamic Fluvial Systems, 453-474, 2011.
Simon, A., Rinaldi, M.: Disturbance, stream incision, and channel evolution: The roles of
excess transport capacity and boundary materials in controlling channel response,
Geomorphology, 79, 361-383, 2006.
Smith, H. G., Dragovich, D.: Interpreting sediment delivery processes using suspended
sediment-discharge hysteresis patterns from nested upland catchments, south-eastern
Australia, Hydrological processes, 23, 2415, doi:10.1002/hyp.7357, 2009.
Soler, M., Latron, J., Gallart, F.: Relationships between suspended sediment concentrations
and discharge in two small research basins in a mountainous Mediterranean area
(Vallcebre, Eastern Pyrenees), Geomorphology, 98, 143-152, 2008.
Tamene, L., Park, S., Dikau, R., Vlek, P.: Analysis of factors determining sediment yield
variability in the highlands of northern Ethiopia, Geomorphology, 76, 76-91,
doi:10.1016/j.geomorph.2005.10.007, 2006.
Tebebu, T., Abiy, A., Dahlke, H., Easton, Z., Zegeye, A., Tilahun, S., Collick, A., Kidnau, S.,
Moges, S., Dadgari, F.: Surface and subsurface flow effect on permanent gully
formation and upland erosion near Lake Tana in the northern highlands of Ethiopia,
Hydrology and Earth System Sciences Discussions, 7, 5235-5265, doi:10.5194/hess-
14-1827-2010, 2010.

128
Thorne, C. R.: Effects of vegetation on riverbank erosion and stability, Vegetation and
erosion, 125-144, 1990.
Tilahun, S., Guzman, C., Zegeye, A., Engda, T., Collick, A., Rimmer, A., Steenhuis, T.: An
efficient semi-distributed hillslope erosion model for the subhumid Ethiopian
Highlands, Hydrology and Earth System Sciences, 17, 1051-1063, 2013.
Tsegaye, K. K.: Action, inaction and environmental destruction: Socionatural determinants of
the disappearance of Lake Alemaya (Haromaya), Eastern Ethiopia, Eastern Ethiopia
(August 2014), doi:org/10.2139/ssrn.2625984, 2014.
Turkelboom, F., Poesen, J., Trébuil, G.: The multiple land degradation effects caused by land-
use intensification in tropical steeplands: a catchment study from northern Thailand,
Catena, 75, 102-116, 2008.
Valentin, C., Poesen, J., Li, Y.: Gully erosion: impacts, factors and control, Catena, 63, 132-
153, doi:10.1016/j.catena.2005.06.001, 2005.
Vandaele, K., Poesen, J.: Spatial and temporal patterns of soil erosion rates in an agricultural
catchment, central Belgium, Catena, 25, 213-226, 1995.
Vandaele, K., Poesen, J., Marques da Silva, J. R., Desmet, P.: Rates and predictability of
ephemeral gully erosion in two contrasting environments, Géomorphologie: relief,
processus, environnement, 2, 83-95, 1996.
Vandekerckhove, L., Poesen, J., Govers, G.: Medium-term gully headcut retreat rates in
Southeast Spain determined from aerial photographs and ground measurements,
Catena, 50, 329-352, 2003.
Vanmaercke, M., Poesen, J., Van Mele, B., Demuzere, M., Bruynseels, A., Golosov, V.,
Bezerra, J. F. R., Bolysov, S., Dvinskih, A., Frankl, A.: How fast do gully headcuts
retreat?, Earth-Science Reviews, 2016.
Vannoppen, W., Vanmaercke, M., De Baets, S., Poesen, J.: A review of the mechanical effects
of plant roots on concentrated flow erosion rates, Earth-Science Reviews, 150, 666-
678, 2015.
Waldron, L.: The shear resistance of root-permeated homogeneous and stratified soil, Soil
Science Society of America Journal, 41, 843-849, 1977.
Waldron, L., Dakessian, S.: Effect of grass, legume, and tree roots on soil shearing resistance,
Soil Science Society of America Journal, 46, 894-899, 1982.

129
Walling, D.: Assessing the accuracy of suspended sediment rating curves for a small basin,
Water Resources Research, 13, 531-538, 1977.
Wang, Y., Shao, M.: Spatial variability of soil physical properties in a region of the Loess
Plateau of PR China subject to wind and water erosion, Land Degradation &
Development, 24, 296-304, doi:10.1002/ldr.1128, 2013.
Willatt, S., Sulistyaningsih, N.: Effect of plant roots on soil strength, Soil and Tillage
Research, 16, 329-336, 1990.
Wu, T. H., McKinnell III, W. P., Swanston, D. N.: Strength of tree roots and landslides on
Prince of Wales Island, Alaska, Canadian Geotechnical Journal, 16, 19-33, 1979.
Zegeye, A., Damtew, S., Tilahun, A., Langendoen, E., Dagnew, D., Guzman, C., Tebeby, T.,
Steenhuis, T.: Gully development processes in the Ethiopian Highlands, In: 2nd
International Conference on the Advancements of Science and Technology, eds B.
Bantyirga, M. Mehari, VS Rao, BL Manocha, KK Singh, S. Geremew, and E. Tadesse
(Bahir Dar: Bahir Dar Institute of Technology). pp 220-229, 2014.
Zegeye, A. D., Langendoen, E. J., Stoof, C. R., Tilahun, S. A., Dagnew, D. C., Zimale, F. A.,
Guzman, C. D., Yitaferu, B., Steenhuis, T. S.: Morphological dynamics of gully
systems in the sub-humid Ethiopian Highlands: The Debre Mawi watershed,
doi:10.5194/soil-2016-13, 2016, 2016.
Zegeye, A. D., Steenhuis, T. S., Blake, R. W., Kidnau, S., Collick, A. S., Dadgari, F.:
Assessment of soil erosion processes and farmer perception of land conservation in
Debre Mewi watershed near Lake Tana, Ethiopia, Ecohydrology & Hydrobiology,
10, 297-306, 2010.
Zema, D., Bingner, R., Denisi, P., Govers, G., Licciardello, F., Zimbone, S.: Evaluation of
runoff, peak flow and sediment yield for events simulated by the AnnAGNPS model
in a Belgian agricultural watershed, Land Degradation & Development, 23, 205-215,
doi:10.1002/ldr.1068, 2012.
Zhao, G., Mu, X., Wen, Z., Wang, F., Gao, P.: Soil erosion, conservation, and eco‐environment changes in the loess plateau of China, Land Degradation &
Development, 24, 499-510, doi:10.1002/ldr.2246, 2013.
Zheng, F.-L.: Effect of vegetation changes on soil erosion on the Loess Plateau, Pedosphere,
16, 420-427, 2006.

130
Zhou, Z. C., Shangguan, Z. P.: Soil anti‐scouribility enhanced by plant roots, Journal of
Integrative Plant Biology, 47, 676-682, 2005.

131
CHAPTER 5
CONCLUSION
Gully erosion is one of the most damaging forms of soil erosion. In the Ethiopian
highlands, gullies are particularly severe covering large tracts of areas and silting up
rivers and reservoirs (Daba et al., 2003; Tebebu et al., 2010; Haregeweyn et al., 2013).
Extensive areas of agricultural lands are affected each year leading to irreversible
changes in soil productivity and affecting the food security (Sonneveld and Keyzer,
2003). Controlling gully erosion is more difficult and expensive than sheet and rill
erosion. Once gullies are formed huge investment are required to rehabilitate the gully.
It also requires a knowledge of the actual gully development processes in the targeted
area.
A continuous expansion of the gully network was observed throughout the Debre Mawi
watershed. We observed deep tension cracks and pipe networks continuously
developing near the gully edges during the beginning of the rainy season, and that
promoted gully bank failure even with minimum rainfall. Once formed, gully bank
instability occurs when the surrounding area is saturated, weakening soil shear strength
thereby increasing the probability of bank collapse (Tebebu et al., 2010; Langendoen et
al., 2014; Zegeye et al., 2014).
We found that most large gullies are formed in the periodically saturated bottom lands.
The elevated water tables saturate the soils surrounding the gullies thereby reducing the
soil strength and leading to a seepage-induced erosion. Additionally, the gully head

132
depth and the drainage area are other factors controlling gully erosion in the Debre Mawi
watershed. Therefore, conservation practices that address these parameters may be most
effective.
The gully expansion mapping showed that about 5% of the study watershed area has
been impaired by the expanding gully network resulting in an equivalent soil loss of
about 127 t ha-1 yr-1 between 2005 and 2013. In one gully, the headcut migrated up to
36 m in 2013 rain phase. The discharge and sediment measurements at the inlet and
outlet of a gully shows that about 92% of the sediment load was orignated from the
gully itself, indicating that upland erosion practices do not decrease sediment
concentrations at the outlet when gullies are present at downstream.
To control gully erosion in the northwestern Ethiopian Highlands, different species of
grasses and trees are often planted on the gully banks. However, the effectiveness of
such biological conservation measures to stabilize gullies in Ethiopia have not been
investigated. The root tensile strength and distribution of 26 indigenous and exotic plant
species of three plant types (grasses, shrubs and trees) were determined. The Rip-Root
model was used to quantify the added cohesion derived from the plant roots. Among
all tested roots, E.floccifolia (grass), Tephrosia (tree) and R.abbysinica (shrub) had the
strongest roots. A. Abyssinica provided the maximum cohesion (i.e., 33 kPa) to the top
soil reinforcement. Plant species with a fibrous root system provided greater cohesion
values and could enhance gully bank stability at the top soils more than plants having a
tap root system. The results support the use of plant species as a strategy to stabilize
gully banks less than 3 m deep. These biological measures for reducing gully erosion in

133
the highlands of Ethiopia should be integrated with other rehabilitation measures such
as reshaping or regrading of gully banks and construction of physical structures like
check dams. To gain experience in headcut stabilization, a headcut treatment on a 5 m-
deep gully was tested and showed a significant reduction in the uphill growth and a
reduction of sediment load and concentration for one year after the treatment. The outlet
sediment concentrations were still by much greater than that at the inlet because of the
downstream bank failure.
In general, comprehensive assessment of the causes of gully formation such as the
hydrological (surface and subsurface water level) and geotechnical processes (soil shear
strength, mass wasting, and gravity) need to be better understood in order to take
appropriate and effective measures to control gully erosion. Equally as important is the
need to sustain the implemented measures. Further, planting vegetation in the saturated
gully area at the end of the rainy season in order to establish the above and below ground
biomasses to increase performances in resisting bank failure of shallow and regraded
deeper gullies for the next rainy season. Finally, including the findings of this
dissertation to the SWC campaign led by the Ethiopian government, it can contribute its
success by providing science-based information that will make practices more effective.

134
REFERENCES
Daba, S., Rieger, W., Strauss, P.: Assessment of gully erosion in eastern Ethiopia using
photogrammetric techniques, Catena, 50, 273-291, 2003.
Haregeweyn, N., Poesen, J., Verstraeten, G., Govers, G., Vente, J., Nyssen, J., Deckers, J.,
Moeyersons, J.: Assessing the performance of a spatially distributed soil erosion and
sediment delivery model (WATEM/SEDEM) in Northern Ethiopia, Land Degradation
& Development, 24, 188-204, doi:10.1002/ldr.1121, 2013.
Langendoen, E., Zegeye, A., Tebebu, T., Steenhuis, T., Ayele, G., Tilahun, S., Ayana, E.: Using
computer models to design gully erosion control structures for humid northern Ethiopia,
ICHE 2014, Hamburg-Lehfeldt & Kopmann (eds)-Bundesanstalt für Wasserbau, 2014.
Sonneveld, B., Keyzer, M.: Land under pressure: soil conservation concerns and opportunities
for Ethiopia, Land Degradation & Development, 14, 5-23, 2003.
Tebebu, T., Abiy, A., Dahlke, H., Easton, Z., Zegeye, A., Tilahun, S., Collick, A., Kidnau, S.,
Moges, S., Dadgari, F.: Surface and subsurface flow effect on permanent gully
formation and upland erosion near Lake Tana in the northern highlands of Ethiopia,
Hydrology and Earth System Sciences Discussions, 7, 5235-5265, doi:10.5194/hess-
14-1827-2010, 2010.
Zegeye, A., Damtew, S., Tilahun, A., Langendoen, E., Dagnew, D., Guzman, C., Tebeby, T.,
Steenhuis, T.: Gully development processes in the Ethiopian Highlands, In: 2nd
International Conference on the Advancements of Science and Technology, eds B.
Bantyirga, M. Mehari, VS Rao, BL Manocha, KK Singh, S. Geremew, and E. Tadesse
(Bahir Dar: Bahir Dar Institute of Technology). pp 220-229, 2014.

135
APPENDIX A: CHAPTER TWO
Appendix A1:Development of gully erosion
Figure A1-1. a) The measured volume versus gully surface area for the13 gullies. The
regression equation obtained in this relationship was used to estimate the volumes of all
gullies in the Deebre mawi watershed presented at Table 2.1 in the manuscript, Table S1, in
the supplementary table, whose surface areas were digitized from Google in 2005 and 2013,
(b) the predicted volume obtained using the equation obtained in (a) or Eq. (4) in the
manuscript, versus measured volume of the 13 gullies

136
Figure A1-2. Some causes of gully formation observed in the Debre Mawi watershed.
Rat forms holes in the dry season (top left) and runoff enter into the hole in raining
phase that forms a network of pipes and ultimately develop in to gully. The picture
(right) shows that the lower layer of the bank was more erodible than the layer
overlaid it that caused a preferential retreat and resulted in over hanged bank which in
turn resulted a bank failure. This picture was taken at the headcut of gully G8 by the
author in July 2013.

137
Appendix A2: Field visits and Lab analysis
Figure A1-3. A) field and laboratory experiments (bulk density, ground water table, and soil
texture), (b) Field visits and learning in the field by Bahir Dar University Graduate students
under supervision of United State professors (Dr Eddy Langendoen and Dr Tammo Steenhuis)

138
Appendix A3: Gully characterization data Table A3-1: Measured length and area of the gullies in the Debre Mawi watershed obtained
from Google image in 2005. The volume was calculated with equation Eq. (2.4) in the
manuscript: Vp = 0.54 A1.1226, where Vp is predicted volume and A is area of a gully. The soil
loss was calculated as Vp times average bulk density (1.2 g cm-3).
No Length (m) Area (m2) Volume (m3) Soil loss (ton)
1 46 3 2 2
2 27 54 72 86
3 36 72 103 124
4 35 83 122 146
5 41 94 141 169
6 50 130 211 253
7 33 148 247 297
8 38 152 256 307
9 66 181 317 381
10 67 189 334 400
11 163 205 368 442
12 48 227 417 501
13 94 228 420 504
14 65 267 511 613
15 100 297 581 698
16 85 298 583 699
17 98 390 812 974
18 197 419 884 1061
19 150 422 893 1072
20 243 454 978 1174
21 277 486 1062 1275
22 85 496 1090 1308
23 79 507 1120 1344
24 84 532 1186 1423
25 118 597 1368 1642
26 162 617 1422 1707
27 186 642 1494 1793

139
No Length (m) Area (m2) Volume (m3) Soil loss (ton)
28 121 643 1498 1797
29 422 747 1799 2159
30 218 858 2132 2559
31 346 937 2375 2851
32 210 967 2470 2964
33 235 1057 2754 3305
34 269 1284 3496 4195
35 365 1356 3737 4484
36 390 1669 4819 5783
37 439 1961 5876 7051
38 465 2426 7624 9149
39 415 2883 9424 11309
40 241 3720 12881 15457
41 559 4254 15181 18217
42 504 4796 17584 21101
43 869 7349 29676 35611
Sum 8743 45099 140321 168385
MIN 27 3 2 2
MAX 869 7349 29676 35611
AVE 203 1049 3263 3916
SD 153 1074 3855 4626

140
Table A3-2: Measured length and area of 245 gullies in the Debre Mawi watershed obtained from Google image in 2013, arranged in ascending
order of their surface area in five columns. The total calculations in each column is given at the end of the table and the total magnitude of 245
gullies is presented at Table 2.1 in the manuscript. The volume was calculated with equation Eq. (2.4) in the manuscript: Vp = 0.54 A1.1226, where
Vp is predicted volume and A is area of a gully which was obtained from the regression relation between measured volume and area of the 13
gullies (Figure S1a). The soil loss (SL) was calculated as Vp times average bulk density (1.2 g cm-3).
No Gully area ranged 10-90 m2 Gully area ranged 90-180 m2 Gully area ranged 180-400 m2 Gully area ranged 400-800 m2 Gully area >800 m2
Length
(m)
Area
(m2)
Vp
(m3)
SL
(ton)
Length
(m)
Area
(m2)
Vp
(m3)
SL
(ton)
Length
(m)
Area
(m2)
Vp
(m3)
SL
(ton)
Length
(m)
Area
(m2)
Vp
(m3)
SL
(ton)
Length
(m)
Area
(m2)
Vp
(m3)
SL
(ton)
1 73 12 11 13 157 97 146 176 90 183 322 386 97 402 841 1009 113 880 2201 2641
2 39 19 21 25 29 102 156 188 313 186 328 393 48 410 863 1035 307 888 2223 2668
3 315 22 24 29 254 103 159 190 189 192 341 409 44 412 868 1042 64 894 2242 2690
4 36 27 31 37 62 110 172 207 31 195 346 415 182 433 922 1107 120 982 2516 3019
5 47 28 32 38 506 110 173 207 239 200 357 429 22 441 942 1130 47 1033 2678 3214
6 96 29 33 39 447 111 173 207 218 202 363 436 40 457 986 1184 15 1053 2740 3288
7 286 33 39 47 40 113 177 213 130 204 367 441 21 463 1001 1201 14 1062 2770 3323
8 205 34 41 49 318 114 180 217 11 220 401 481 127 465 1006 1207 279 1069 2792 3351
9 221 34 41 49 30 116 183 220 35 221 404 485 115 475 1034 1241 161 1090 2861 3433
10 151 38 47 56 22 118 187 224 25 221 405 486 54 476 1035 1242 48 1103 2901 3481
11 27 39 48 58 113 119 190 228 90 223 408 489 54 483 1054 1265 110 1119 2952 3543
12 83 40 49 59 25 120 190 228 49 227 417 500 33 508 1121 1345 35 1124 2970 3564
13 119 41 51 61 99 120 192 230 119 233 432 518 8 508 1121 1346 79 1154 3067 3680
14 50 48 63 75 83 123 197 237 243 235 436 523 48 531 1184 1421 56 1208 3242 3890
15 74 50 65 78 90 123 198 238 14 236 439 526 113 531 1184 1421 53 1215 3266 3920
16 67 51 67 81 22 127 205 246 24 243 454 544 74 549 1233 1479 80 1252 3390 4069
17 130 52 68 82 67 127 206 247 97 245 458 550 135 550 1237 1485 162 1321 3619 4343

141
No Gully area ranged 10-90 m2 Gully area ranged 90-180 m2 Gully area ranged 180-400 m2 Gully area ranged 400-800 m2 Gully area >800 m2
Length
(m)
Area
(m2)
Vp
(m3)
SL
(ton)
Length
(m)
Area
(m2)
Vp
(m3)
SL
(ton)
Length
(m)
Area
(m2)
Vp
(m3)
SL
(ton)
Length
(m)
Area
(m2)
Vp
(m3)
SL
(ton)
Length
(m)
Area
(m2)
Vp
(m3)
SL
(ton)
18 34 52 69 83 28 127 206 247 158 250 470 564 225 551 1239 1487 116 1367 3774 4529
19 42 52 69 83 60 128 207 249 372 251 472 566 89 556 1254 1505 71 1427 3979 4775
20 86 53 70 84 258 130 210 252 76 252 476 571 23 564 1276 1531 14 1615 4631 5557
21 88 57 77 92 173 131 213 256 81 260 494 593 59 580 1321 1585 144 1682 4867 5841
22 459 57 77 93 184 132 215 258 32 268 512 615 29 584 1331 1597 24 1688 4887 5864
23 456 61 83 100 68 132 216 259 44 269 514 617 51 602 1381 1657 160 1706 4951 5941
24 34 62 84 101 256 133 216 259 37 270 517 620 165 604 1388 1665 123 1843 5443 6531
25 32 62 86 103 267 135 221 266 65 274 526 631 56 606 1391 1670 39 2256 6974 8369
26 230 63 86 103 115 138 227 272 70 287 557 668 49 617 1423 1708 19 2264 7007 8408
27 24 68 95 114 199 142 235 282 251 297 581 697 292 620 1433 1720 38 2293 7116 8539
28 75 70 99 119 38 142 235 282 65 299 587 704 49 625 1447 1737 42 2458 7751 9301
29 98 70 99 119 32 144 239 286 57 304 598 718 45 641 1491 1789 317 2522 7996 9596
30 59 71 100 120 493 144 240 287 22 308 608 730 38 642 1493 1792 31 2583 8234 9881
31 45 73 104 125 176 147 246 295 379 314 622 747 489 677 1594 1913 179 2639 8454 10145
32 42 73 104 125 367 150 252 302 25 316 628 753 98 695 1647 1977 75 2818 9162 10994
33 20 74 105 126 160 151 253 304 20 324 646 775 15 714 1701 2041 38 2876 9393 11271
34 22 75 107 128 58 151 253 304 143 329 660 791 22 723 1729 2075 75 3255 10933 13120
35 25 75 108 129 21 151 254 304 544 331 664 796 35 734 1761 2114 16 3273 11010 13212
36 43 78 113 136 34 152 255 307 65 332 666 799 116 746 1796 2156 21 3656 12609 15131
37 43 79 114 137 55 157 266 319 76 336 675 810 151 769 1865 2238 119 3942 13827 16593
38 34 79 115 138 186 157 266 319 18 338 681 817 21 776 1884 2261 61 4360 15644 18773
39 87 80 116 139 29 159 271 325 698 348 706 847 45 777 1888 2266 27 4416 15895 19074
40 31 80 116 139 63 159 271 325 43 352 714 857 51 783 1906 2287 22 5089 18912 22694

142
No Gully area ranged 10-90 m2 Gully area ranged 90-180 m2 Gully area ranged 180-400 m2 Gully area ranged 400-800 m2 Gully area >800 m2
Length
(m)
Area
(m2)
Vp
(m3)
SL
(ton)
Length
(m)
Area
(m2)
Vp
(m3)
SL
(ton)
Length
(m)
Area
(m2)
Vp
(m3)
SL
(ton)
Length
(m)
Area
(m2)
Vp
(m3)
SL
(ton)
Length
(m)
Area
(m2)
Vp
(m3)
SL
(ton)
41 32 84 123 147 67 162 276 332 86 352 716 859 225 785 1911 2293 23 5693 21697 26037
42 78 84 124 148 151 162 277 332 97 352 716 860 93 812 1994 2393 300 5768 22049 26458
43 100 84 124 149 52 164 280 335 107 356 725 870 40 825 2031 2437 35 5891 22630 27156
44 113 87 129 154 20 164 280 336 31 379 783 939 36 825 2034 2440 72 6051 23384 28060
45 72 89 133 160 63 170 294 353 39 381 787 945 37 827 2038 2446 40 6172 23959 28750
46 241 91 137 164 48 170 294 353 119 384 795 955 17 846 2094 2513 52 6386 24983 29979
47 66 91 137 165 102 175 304 364 47 385 798 958 76 852 2113 2536 40 7372 29786 35744
48 313 93 140 168 71 177 309 371 25 388 807 969 109 852 2114 2537 184 12577 57344 68813
49 32 96 145 174 35 180 315 378 271 391 815 977 90 859 2136 2564 43 13371 61811 74173
Sum 5174 2960 4119 4943 6294 6773 11178 13414 6076 13946 27191 32629 4150 30764 71738 86085 4304 149755 539521 647425
MIN 20 12 11 13 20 97 146 176 11 183 322 386 8 402 841 1009 14 880 2201 2641
MAX 459 96 145 174 506 180 315 378 698 391 815 977 489 859 2136 2564 317 13371 61811 74173
AVE 106 60 84 101 128 138 228 274 124 285 555 666 85 628 1464 1757 88 3056 11011 13213
SD 107 22 36 44 125 22 44 53 140 63 150 180 85 142 403 483 80 2741 12577 15093

143
Table A3-3: The 14 sub-catchments studied by Oksanen and Sarjakoski (2005) that are used to develop
equation to calculate errors for the 13 gully head drainage areas in the Debre Mawi watershed
14 sub-catchments studied by
Oksanen and Sarjakoski (2005), DA in Debre Mawi watershed
DA,km2 DA,Ha
Relative error
(%)
DA
name DA (ha)
Relative error
(%)
Absolute error
(ha)
0.554 55.4 24 G1 12.8 11.22 1.44
0.765 76.5 16 G2 13 11.22 1.46
2.773 277.3 16 G3 41.6 11.03 4.59
2.904 290.4 8 G4 1.7 11.30 0.19
11.653 1165.3 3 G5 68 10.86 7.38
12.806 1280.6 4 G6 13.3 11.22 1.49
26.372 2637.2 3 G7 0.7 11.31 0.08
0.592 59.2 15 G8 17.4 11.19 1.95
0.885 88.5 14 G9 6.8 11.26 0.77
2.119 211.9 5 G10 6.5 11.27 0.73
6.782 678.2 5 G11 9.2 11.25 1.03
13.87 1387 3 G12 4.1 11.28 0.46
22.416 2241.6 3 G13 4.8 11.28 0.54
47.933 4793.3 1 Sum 200 9.4

144
APPENDIX B: CHAPTER THREE
Appendix B1: Discharge and sediment measurement
Figure B1-1. Schematic figures of inlet and outlet Weirs at the study gully (top), (a) weir
construction from concret, (b) a room in the field used to temporarily store sediment samples
sample and also a living room for field assistants (data collecter)

145
Figure B1-2. Rating curves at the inlet (a) and outlet (b) of the study gully in 2014, G6 refers to
the code given for the studied gully (see Chapter 2)

146
Figure B1-3. The predicted discharge fitted with the measured discharge[HMVE1]

147
Figure B1- 4. Comparison of sediment concentration at the inlet and outlet weirs as a function of
time in 2013 and 2014. The top in each plot at a & b belongs to sediment concentrations at the
outlet and the bottom in a & b are concentrations at inlet.
Figure B1-5. Visual observation of sediment concentration at the inlet (right) and outlet (left),
Picture taken on 6 August 2014 at the gully.

148
Appendix B2 peak events with the associated hysteresis loops
Table B2-1. Peak and total discharge and suspended sediment (c) characteristics in 2013, q is discharge, Q is runoff, C, AC and M are clockwise,
anticlockwise and mixed loops respectively.
Date INLET OUTLET
Duration RF
(mm)
Max.q
(L s-1)
Max.Q
(m3)
Min.c
(g L-1)
Max.
c (g
L-1)
Peak
Load
(Mg)
Total Q
(m3)
Total
Load
(Mg)
Loop Duration
(hrs)
Max.q
(L s-1)
Max.Q
(m3)
Min.c(g
L-1)
Max.
c(g L-
1)
Load
(Mg)
Total Q
(m3)
Total
Load
(Mg)
LOOP
7/9/2013 0:30 32.3 15 9 48 69 0.60 26 1.60 C 0:50 30 18 10 15 0.3 74 0.9 C
7/10/2013 0:20 2 11 7 2 8 0.05 15 0.08 C 0:30 14 8 38 47 0.4 22 0.9 M
7/16/2013 1:20 12 206 124 9 22 2.73 357 8.90 C 1:30 231 139 46 116 16.1 540 49.3 AC
7/20/2013 1:10 18.6 132 79 15 35 2.72 252 6.24 C 1:20 180 108 48 115 12.4 397 37.6 AC
7/21/2013 1:20 5.3 243 146 7 29 4.24 551 11.1 C 1:30 250 150 44 94 14.2 701 55.6 C
7/22/2013 1:30 9.5 243 146 4 21 3.04 527 5.86 M 1:40 269 161 63 85 13.6 725 54.6 C
7/25/2013 1:20 14.2 195 117 3 17 1.95 537 5.54 C 1:30 288 173 36 80 13.7 639 46.4 M
7/26/2013 1:00 18.3 141 85 8 14 1.20 236 2.86 M 1:10 214 128 42 69 8.9 466 28.2 M
7/28/2013 0:50 18.4 58 35 6 8 0.29 92 0.68 M 0:45 100 60 38 75 4.5 212 11.5 M
7/29/2013 0:40 19.2 29 17 4 6 0.11 53 0.31 C 0:50 55 33 58 66 2.2 95 5.9 M
8/2/2013 0:30 30.9 21 13 1 3 0.04 43 0.09 C 0:50 26 15 22 72 1.1 60 2.7 M
8/4/2013 1:00 15.2 41 25 2 7 0.17 82 0.34 M 1:00 73 44 37 166 7.2 175 14.2 AC
8/7/2013 3:00 94 749 449 11 43 19.2 2612 82.2 C 3:10 715 429 31 96 41.2 3535 323 M
8/8/2013 1:10 9 41 25 5 25 0.62 105 1.57 M 1:10 113 68 43 106 7.2 241 21.2 M
8/9/2013 0:30 2.6 18 11 7 18 0.19 29 0.41 C 0:30 30 18 34 78 1.4 53 2.9 C
8/10/2013 0:40 3.8 29 17 7 11 0.20 49 0.43 C 0:50 45 27 30 64 1.7 91 4.9 C
8/12/2013 0:50 14.3 83 50 6 20 1.02 253 4.07 C 1:20 100 60 45 114 6.8 277 21.5 M
8/14/2013 0:30 8.8 21 13 5 8 0.11 33 0.22 C 1:00 50 30 42 72 2.1 127 7.7 C

149
Date INLET OUTLET
Duration RF
(mm)
Max.q
(L s-1)
Max.Q
(m3)
Min.c
(g L-1)
Max.
c (g
L-1)
Peak
Load
(Mg)
Total Q
(m3)
Total
Load
(Mg)
Loop Duration
(hrs)
Max.q
(L s-1)
Max.Q
(m3)
Min.c(g
L-1)
Max.
c(g L-
1)
Load
(Mg)
Total Q
(m3)
Total
Load
(Mg)
LOOP
8/16/2013 0:30 8.5 18 11 5 13 0.14 31 0.27 C 0:40 73 44 42 96 4.2 65 3.4 M
8/17/2013 0:20 14.3 15 9 5 10 0.09 21 0.15 C 0:40 39 24 48 62 1.5 65 3.4 M
8/18/2013 0:20 7.6 15 9 3 5 0.04 21 0.08 C 0:40 39 24 42 84 2.0 65 4.5 M
8/20/2013 0:10 15.3 8 5 2 2 0.01 7 0.01 C 0:40 30 18 33 60 1.1 50 2.6 AC
8/22/2013 0:30 8.5 37 22 2 9 0.19 43 0.21 C 0:40 61 36 32 69 2.5 95 5.6 M
8/23/2013 0:30 16.7 11 7 2 5 0.04 17 0.06 C 0:40 21 13 33 70 0.9 39 2.0 M
8/26/2013 0:30 15.6 41 25 2 8 0.20 47 0.27 C 1:30 87 52 21 87 4.5 240 13.9 M
8/27/2013 0:30 9 18 11 2 8 0.08 23 0.09 C 1:10 55 33 23 60 2.0 152 6.7 C
8/28/2013 0:20 4.2 29 17 1 6 0.10 30 0.14 C 0:40 79 47 26 79 3.8 76 5.2 C
8/29/2013 0:30 4.4 11 7 1 2 0.02 17 0.03 C 0:30 14 8 30 47 0.4 22 0.9 AC
8/31/2013 0:50 23.9 132 79 2 9 0.69 131 0.90 C 1:40 157 94 43 87 8.2 248 17.5 M
9/2/2013 1:20 7.4 113 68 2 12 0.80 157 0.96 C 1:50 134 81 44 115 9.3 433 33.9 M
9/3/2013 1:20 16.4 464 279 2 17 4.66 642 7.48 C 2:40 640 384 48 156 59.8 1889 200.2 M
9/4/2013 0:50 9.5 132 79 2 14 1.08 139 0.93 C 1:30 165 99 30 100 9.9 343 27.6 AC
9/5/2013 1:00 12 50 30 1 4 0.12 120 0.24 C 2:10 165 99 32 94 9.3 640 49.1 M
9/6/2013 0:30 11 21 13 2 5 0.06 30 0.13 C 1:00 35 21 31 75 1.6 74 4.5 AC
9/9/2013 1:20 10.4 552 331 2 19 6.18 806 6.70 C 1:50 640 384 70 200 76.7 1130 166 M

150
Table B2-2. Peak and total discharge and suspended sediment (c) characteristics in 2014. I is peak rainfall intensity, q is discharge, Q is runoff, C,
AC and M are clockwise, anticlockwise and mixed loops respectively.
Date RF
(mm)
I
(mm
hr-1)
INLET OUTLET
Duration Max.q
(L s-1)
Max.Q
(m3)
Min.c
(g L-1)
Max.
c (g
L-1)
Peak
Load
(Mg)
Total Q
(m3)
Total
Load
(Mg)
Loop Duration
(hrs)
Max.q
(L s-1)
Max.Q
(m3)
Min.c(g
L-1)
Max.
c(g L-
1)
Load
(Mg)
Total Q
(m3)
Total
Load
(Mg)
LOOP
6/24/2014 6 2.4 1:30 268 161 9 31 4.90 312 7.0 C 2:40 236 142 33 87 12 663 50.8 M
6/25/2014 37 2.4 0:50 115 69 7 31 2.16 120 2.5 C 2:00 187 112 21 97 11 381 33.3 AC
6/26/2014 24 2.4 0:20 6 4 6 12 0.04 8 0.1 C 1:00 15 9 29 108 0.9 21 1.4 AC
7/1/2014 7 31.2 0:20 9 5 7 22 0.11 9 0.2 C 0:30 12 7 13 35 0.2 12 0.3 AC
7/7/2014 8 7.2 0:40 7 4 2 18 0.08 11 0.1 M 0:30 7 4 37 80 0.3 8 0.4 AC
7/13/2014 14 14.4 0:40 15 9 3 20 0.18 15 0.2 M 0:50 8 5 14 48 0.2 15 0.4 M
7/19/2014 20 9.6 0:40 3 2 4 11 0.02 4 0.0 C 2:20 15 9 14 61 0.5 21 0.7 M
7/21/2014 33 14.4 2:10 467 280 11 32 8.91 734 13.0 C 1:30 800 480 65 81 39.1 1257 87.0 M
7/22/2014 6 2.4 2:10 97 58 3 8 0.49 282 1.7 M 3:00 204 122 29 69 8.4 590 35.5 M
7/25/2014 12 24 1:30 7 4 4 17 0.07 17 0.1 M 1:50 13 8 16 90 0.7 30 1.5 M
7/28/2014 8 38.4 0:50 13 8 5 14 0.11 22 0.3 C 1:00 23 14 41 95 1.3 42 2.9 M
7/31/2014 23 9.6 3:40 34 20 2 11 0.23 130 0.7 C 2:20 60 36 19 72 2.6 163 8.0 M
8/3/2014 25 28.8 1:00 63 38 2 19 0.71 89 0.8 C 1:40 100 60 24 92 5.5 115 5.8 M
8/4/2014 22 28.8 4:10 59 36 2 7 0.24 437 1.7 M 3:50 60 36 18 67 2.4 440 17.6 M
8/5/2014 31 19.2 3:00 324 195 2 13 2.61 1097 8.3 C 3:50 307 184 33 127 23.4 1737 162.8 M
8/6/2014 29 45.6 0:10 2 1 2 9 0.01 1 0.0 C 0:30 10 6 21 35 0.2 8 0.2 M
8/7/2014 11 12 4:10 222 133 1 7 0.98 1021 4.6 C 5:10 173 104 18 82 8.5 1136 59.8 M
8/11/2014 7 24 1:10 23 14 0 9 0.12 44 0.2 C 0:40 15 9 36 82 0.7 10 0.5 M
8/17/2014 14 12 1:20 159 95 0 19 1.82 322 3.3 C 2:00 267 160 15 67 10.7 439 22.6 M
8/19/2014 7 7.2 1:00 23 14 1 5 0.06 41 0.2 C 1:10 23 14 30 47 0.7 27 1.1 M
8/22/2014 31 12 3:20 190 114 1 12 1.37 673 4.3 C 3:00 267 160 32 83 13.3 752 38.1 M

151
Date RF
(mm)
I
(mm
hr-1)
INLET OUTLET
Duration Max.q
(L s-1)
Max.Q
(m3)
Min.c
(g L-1)
Max.
c (g
L-1)
Peak
Load
(Mg)
Total Q
(m3)
Total
Load
(Mg)
Loop Duration
(hrs)
Max.q
(L s-1)
Max.Q
(m3)
Min.c(g
L-1)
Max.
c(g L-
1)
Load
(Mg)
Total Q
(m3)
Total
Load
(Mg)
LOOP
8/23/2014 11 7.2 0:50 19 11 2 5 0.06 42 0.2 C 1:00 56 34 18 49 1.7 98 3.5 AC
8/30/2014 21 14.4 1:40 176 106 2 9 0.99 259 1.3 C 2:10 220 132 24 65 8.6 449 20.7 M
9/9/2014 31 9.6 3:30 323 194 1 12 2.27 775 3.6 M 3:50 453 272 32 81 22.1 1437 68.9 M
9/10/2014 42 2.4 4:20 268 161 0 9 1.51 1011 3.5 C 4:20 267 160 27 69 11.1 1443 69.7 M
9/13/2014 10 4.8 1:50 271 163 0 7 1.10 706 2.7 C 1:10 200 120 15 70 8.4 808 41.9 M
9/14/2014 25 21.6 1:30 89 54 1 3 0.15 272 0.4 C 0:40 110 66 36 48 3.2 319 13.2 AC
9/18/2014 12 26.4 0:40 47 28 0 1 0.02 40 0.0 C 1:00 19 11 21 29 0.3 39 1.0 M
9/21/2014 10 2.4 0:50 37 22 0 3 0.08 60 0.1 M 1:10 60 36 22 47 1.7 120 4.8 C
9/24/2014 21 30 2:10 48 29 0 7 0.21 130 0.4 M 1:00 173 104 20 38 3.9 252 7.9 M
9/25/2014 32 8.4 0:50 44 26 1 2 0.05 63 0.1 C 0:50 55 33 21 35 1.2 65 1.8 AC

152
Figure B2-1 Examples of hysteresis loops at the inlet in three days of 2013 rainy phase

153
Figure B2-2 Examples of hysteresis loops at the outlet in three days of 2013 rainy phase

154
Figure B2-3 Examples of hysteresis loops at the inlet in three days of 2014 rainy phase

155
Figure B2-4 Examples of hysteresis loops at the outlet in three days of 2014 rainy phase

156
Figure B2-5. Examples of hysteresis loops occurred on two event days at the inlet and outlet of the gully
in the Debre Mawi watershed on both years (2013-2014)

157
Appendix B3 Gully headcut treatment
Figure B3-1. Gully headcut treatment procedure from social work until implementation

158
APPENDIX C: CHAPTER FOUR
Appendix C1: Tensile strength tester
Figure C1-1. Root tensile strength testing using Testometric M350-20AT materials testing machine
Appendix C2 Root tensile strength testing results for 7 grass species
Table C1-1 Testing results of tensile strength per diameter for seven grass species. Results are given in both tables and figures
consecutively
Type of sample : H.dregeana [Senbelet] Test Name : Tensile strength of plant roots
Sample code : P-3292 Test Type : Tensile
Environmental condition : Temp-20, RH-60% Test Date : 24/07/2014 14:27
Tested by : Petros A. Test Speed : 10.000 mm/min
Checked by : Aster M. Pretension : Off
Sample Length : 100.000 mm

159
Test No Type of
failure
Diameter
(mm)
Area (mm²) Force @
Peak (N)
Elong. @
Peak (mm)
Stress @
Peak (MPa)
Strain @
Peak (%)
1 Slip 1.500 1.767 26.400 26.134 14.939 26.134
2 at grip 1.420 1.584 34.700 24.166 21.911 24.166
3 Slip 1.200 1.131 19.800 26.992 17.507 26.992
4 centre 1.120 0.985 31.600 26.016 32.075 26.016
5 at grip 1.050 0.866 21.700 9.343 25.061 9.343
6 centre 0.470 0.173 9.800 26.171 56.486 26.171
7 slip 1.430 1.606 26.800 24.079 16.687 24.079
8 centre 0.410 0.132 8.100 16.813 61.352 16.813
9 at grip 1.270 1.267 44.400 15.060 35.050 15.060
10 at grip 0.440 0.152 8.300 12.007 54.586 12.007
11 centre 0.390 0.119 7.500 22.664 62.783 22.664
Min 0.390 0.119 7.500 9.343 14.939 9.343
Mean 0.973 0.889 21.736 20.859 36.221 20.859
Max 1.500 1.767 44.400 26.992 62.783 26.992
S.D. 0.453 0.648 12.417 6.370 19.020 6.370
C. of V. 46.519 72.864 57.124 30.540 52.511 30.540
L.C.L. 0.669 0.454 13.395 16.579 23.444 16.579
U.C.L. 1.277 1.325 30.078 25.138 48.999 25.138

160
Type of sample : E.floccifolia [Akirma] Test Name : Tensile strength of plant roots
Sample code : P-3293 Test Type : Tensile
Environmental condition : Temp-20, RH-60% Test Date : 25/07/2014 07:47
Tested by : Petros A. Test Speed : 10.000 mm/min
Checked by : Aster M. Pretension : Off
Sample Length : 100.000 mm
Comments :
Test No Type of
failure
Diameter
(mm)
Area (mm²) Force @
Peak (N)
Elong. @
Peak (mm)
Stress @
Peak (MPa)
Strain @
Peak (%)
1 at grip 0.360 0.102 10.700 18.224 105.121 18.224
2 centre 0.290 0.066 6.200 9.522 93.865 9.522
3 centre 0.300 0.071 6.600 11.121 93.371 11.121
4 centre 0.860 0.581 13.700 23.723 23.585 23.723
5 centre 0.360 0.102 11.300 11.414 111.015 11.414
6 at grip 0.570 0.255 16.900 29.646 66.229 29.646
7 centre 0.510 0.204 16.500 9.267 80.771 9.267
8 at grip 0.280 0.062 6.000 7.839 97.442 7.839
9 centre 0.330 0.086 5.600 7.519 65.474 7.519
10 centre 0.680 0.363 17.600 20.563 48.462 20.563
11 centre 0.660 0.342 12.100 11.532 35.368 11.532
12 at grip 0.390 0.119 12.900 13.550 107.987 13.550
Min 0.280 0.062 5.600 7.519 23.585 7.519
Mean 0.466 0.196 11.342 14.493 77.391 14.493
Max 0.860 0.581 17.600 29.646 111.015 29.646
S.D. 0.189 0.162 4.432 7.013 29.450 7.013
C. of V. 40.488 82.462 39.077 48.388 38.054 48.388
L.C.L. 0.346 0.093 8.526 10.037 58.679 10.037
U.C.L. 0.586 0.299 14.158 18.949 96.103 18.949

161
Type of sample : P.purpureum [Elephant] Test Name : Tensile strength of plant roots
Sample code : P-3294 Test Type Tensile
Environmental condition : Temp-20, RH-60% Test Date : 25/07/2014 08:41
Tested by : Petros A. Test Speed : 10.000 mm/min
Checked by : Aster M. Pretension : Off
Sample Length : 100.000 mm
Comments :
Test No Type of failure Diameter
(mm)
Area (mm²) Force @
Peak (N)
Elong. @
Peak (mm)
Stress @
Peak (MPa)
Strain @
Peak (%)
1 centre 1.880 2.776 97.000 12.104 34.943 12.104
2 At grip 1.230 1.188 30.900 21.573 26.005 21.573
3 centre 1.010 0.801 37.600 6.979 46.931 6.979
4 centre 1.130 1.003 50.000 7.874 49.857 7.874
5 At grip 0.910 0.650 28.700 17.900 44.127 17.900
6 centre 0.410 0.132 10.700 30.584 81.045 30.584
7 centre 0.880 0.608 22.700 11.177 37.322 11.177
8 centre 0.760 0.454 15.400 18.138 33.947 18.138
9 centre 0.680 0.363 16.700 9.141 45.984 9.141
10 centre 0.580 0.264 7.800 17.025 29.522 17.025
11 At grip 0.660 0.342 10.300 10.857 30.106 10.857
12 centre 0.520 0.212 12.900 11.378 60.743 11.378
13 At grip 1.500 1.767 31.400 12.320 17.769 12.320

162
14 At grip 1.950 2.986 2.800 0.204 0.938 0.204
15 At grip 1.230 1.188 42.300 23.336 35.599 23.336
16 centre 1.330 1.389 36.900 14.184 26.560 14.184
17 centre 0.570 0.255 6.100 13.642 23.905 13.642
18 centre 0.690 0.374 13.800 18.010 36.905 18.010
Min 0.410 0.132 2.800 0.204 0.938 0.204
Mean 0.996 0.931 26.333 14.246 36.789 14.246
Max 1.950 2.986 97.000 30.584 81.045 30.584
S.D. 0.453 0.845 22.322 6.894 17.302 6.894
C. of V. 45.526 90.782 84.768 48.396 47.030 48.396
L.C.L. 0.770 0.511 15.233 10.817 28.185 10.817
U.C.L. 1.221 1.351 37.434 17.674 45.393 17.674
Type of sample : D.abyssinica [Godir] Test Name: Tensile strength of plant roots
Sample code : P-3295 Test Type : Tensile
Environmental condition : Temp-20, RH-60% Test Date : 25/07/2014 09:46
Tested by : Petros A. Test Speed : 10.000 mm/min
Checked by : Aster M. Pretension : Off
Sample Length : 100.000 mm
Comments :
Test No Type of failure Diameter
(mm)
Area (mm²) Force @
Peak (N)
Elong. @
Peak (mm)
Stress @
Peak (MPa)
Strain @
Peak (%)

163
1 centre 0.910 0.650 26.900 38.297 41.360 38.297
2 centre 0.580 0.264 11.800 20.239 44.662 20.239
3 At grip 0.500 0.196 11.100 30.089 56.532 30.089
4 At grip 0.520 0.212 8.400 24.333 39.553 24.333
5 At grip 1.170 1.075 27.100 17.269 25.206 17.269
6 centre 0.630 0.312 15.900 29.330 51.007 29.330
7 centre 0.780 0.478 22.200 26.510 46.459 26.510
8 centre 1.080 0.916 35.700 22.720 38.970 22.720
9 centre 1.030 0.833 35.900 30.723 43.085 30.723
10 centre 0.720 0.407 15.300 17.283 37.578 17.283
11 At grip 0.340 0.091 4.300 15.827 47.361 15.827
12 centre 0.430 0.145 7.700 22.483 53.023 22.483
Min 0.340 0.091 4.300 15.827 25.206 15.827
Mean 0.724 0.465 18.525 24.592 43.733 24.592
Max 1.170 1.075 35.900 38.297 56.532 38.297
S.D. 0.272 0.329 10.845 6.692 8.267 6.692
C. of V. 37.525 70.766 58.542 27.212 18.904 27.212
L.C.L. 0.552 0.256 11.634 20.340 38.480 20.340
U.C.L. 0.897 0.674 25.416 28.844 48.986 28.844
Type of sample : S.natalensis [murie] Test Name : Tensile strength of plant roots

164
Sample code : P-3296 Test Type : Tensile
Environmental condition : Temp-20, RH-60% Test Date : 25/07/2014 11:32
Tested by : Petros A. Test Speed : 10.000 mm/min
Checked by : Aster M. Pretension : Off
Sample Length : 100.000 mm
Comments :
Test No Type of
failure
Diameter (mm) Area (mm²) Force @
Peak (N)
Elong. @
Peak (mm)
Stress @
Peak (MPa)
Strain @
Peak (%)
1 centre 1.280 1.287 33.500 23.053 26.034 23.053
2 centre 0.350 0.096 4.100 10.071 42.615 10.071
3 centre 0.410 0.132 4.100 9.749 31.055 9.749
4 centre 0.260 0.053 4.500 17.576 84.757 17.576
5 centre 0.270 0.057 3.900 8.410 68.116 8.410
6 At grip 0.200 0.031 2.000 9.720 63.662 9.720
7 centre 0.340 0.091 4.400 19.927 48.462 19.927
8 centre 0.410 0.132 5.100 14.466 38.629 14.466
Min 0.200 0.031 2.000 8.410 26.034 8.410
Mean 0.440 0.235 7.700 14.121 50.416 14.122
Max 1.280 1.287 33.500 23.053 84.757 23.053
S.D. 0.347 0.427 10.463 5.517 20.146 5.517
C. of V. 78.936 181.552 135.888 39.067 39.959 39.067
L.C.L. 0.150 -0.122 -1.048 9.509 33.574 9.509
U.C.L. 0.730 0.592 16.448 18.734 67.258 18.734

165
Type of sample : V.zizanioides [vetiver] Test Name : Tensile strength of plant roots
Sample code : P-3297 Test Type : Tensile
Environmental condition : Temp-20, RH-60% Test Date : 25/07/2014 11:58
Tested by : Petros A. Test Speed : 10.000 mm/min
Checked by : Aster M. Pretension : Off
Sample Length : 100.000 mm
Comments :
Test No Type of failure Diameter
(mm)
Area (mm²) Force @
Peak (N)
Elong. @
Peak (mm)
Stress @
Peak (MPa)
Strain @
Peak (%)
1 centre 1.280 1.287 26.700 12.970 20.749 12.970
2 centre 1.650 2.138 46.900 24.932 21.934 24.932
3 centre 1.540 1.863 55.700 22.728 29.904 22.728
4 centre 1.820 2.602 45.400 10.897 17.451 10.897
5 centre 1.660 2.164 41.700 19.573 19.268 19.573
6 At grip 0.960 0.724 26.200 28.793 36.197 28.793
7 At grip 0.950 0.709 18.800 14.186 26.523 14.186
8 At grip 0.810 0.515 14.300 13.397 27.751 13.397

166
9 At grip 0.480 0.181 5.800 12.623 32.052 12.623
10 centre 0.410 0.132 3.300 8.673 24.995 8.673
Min 0.410 0.132 3.300 8.673 17.451 8.673
Mean 1.156 1.231 28.480 16.877 25.682 16.877
Max 1.820 2.602 55.700 28.793 36.197 28.793
S.D. 0.507 0.902 18.236 6.701 5.979 6.701
C. of V. 43.881 73.270 64.030 39.706 23.279 39.706
L.C.L. 0.793 0.586 15.435 12.083 21.405 12.083
U.C.L. 1.519 1.877 41.525 21.671 29.959 21.671
Type of sample : A.donax [shembeko] Test Name : Tensile strength of plant roots
Sample code : P-3298 Test Type : Tensile
Environmental condition : Temp-20, RH-60% Test Date : 25/07/2014 12:33
Tested by : Petros A. Test Speed : 10.000 mm/min
Checked by : Aster M. Pretension : Off
Sample Length : 100.000 mm
Comments :
Test No Type of failure Diameter
(mm)
Area (mm²) Force @
Peak (N)
Elong. @
Peak (mm)
Stress @
Peak (MPa)
Strain @
Peak (%)
1 Break at the bottom clamp 1.810 2.573 77.200 9.387 30.003 9.387

167
2 Break at the center 1.560 1.911 45.800 4.169 23.962 4.169
3 Break at the upper clamp 2.020 3.205 92.800 5.469 28.957 5.469
4 Break at the upper clamp 1.720 2.324 76.600 6.730 32.967 6.730
5 Break at the upper clamp 1.850 2.688 85.800 4.148 31.919 4.148
6 Break at the center 0.980 0.754 24.800 6.859 32.878 6.859
7 Break at the upper clamp 1.010 0.801 28.300 5.166 35.323 5.166
8 Break at 10mm above the bottom
clamp
0.840 0.554 17.700 4.957 31.939 4.957
9 abocve clamp 0.610 0.292 5.800 3.065 19.846 3.065
10 cennter 0.710 0.396 16.400 9.061 41.423 9.061
11 center 1.130 1.003 22.300 3.535 22.236 3.535
12 2mm below 0.960 0.724 41.600 7.739 57.473 7.739
13 near the clamp 0.580 0.264 7.100 5.229 26.873 5.229
14 centre 0.640 0.322 9.500 2.045 29.531 2.045
15 centre 0.850 0.567 40.400 9.315 71.196 9.315
16 above clamp 0.860 0.581 25.100 7.661 43.210 7.661
Min 0.580 0.264 5.800 2.045 19.846 2.045
Mean 1.133 1.185 38.575 5.908 34.984 5.908
Max 2.020 3.205 92.800 9.387 71.196 9.387
S.D. 0.490 0.994 29.158 2.288 13.224 2.288
C. of V. 43.212 83.896 75.587 38.725 37.802 38.725
L.C.L. 0.872 0.655 23.038 4.689 27.937 4.689
U.C.L. 1.394 1.715 54.112 7.128 42.030 7.128

168
Appendix C3 Root tensile strength testing results for 10 tree species
Table C3-1 Testing results of tensile strength per diameter for 10 tree species. Results are given in both tables and figures
consecutively
Type of sample : S.sesban [susbania] Test Name : Tensile strength of plant roots
Sample code : P-3299 Test Type: Tensile
Environmental condition : Temp-20, RH-60% Test Date : 25/07/2014 13:03
Tested by : Petros A. Test Speed : 10.000 mm/min
Checked by : Aster M. Pretension : Off
Sample Length : 100.000 mm
Test No Type of
failure
Diameter (mm) Area (mm²) Force @
Peak (N)
Elong. @
Peak (mm)
Stress @
Peak (MPa)
Strain @
Peak (%)
1 centre 0.580 0.264 9.400 10.736 35.578 10.736
2 At grip 0.410 0.132 7.000 14.888 53.020 14.888
3 At grip 0.480 0.181 11.100 18.581 61.341 18.581
4 centre 0.760 0.454 39.500 17.908 87.072 17.908
5 centre 0.490 0.189 13.300 22.797 70.529 22.797
6 centre 0.640 0.322 17.100 22.071 53.155 22.071
7 At grip 0.330 0.086 8.600 12.825 100.550 12.825
8 centre 6.340 31.570 678.900 4.589 21.505 4.589
9 below 5.290 21.979 439.400 12.213 19.992 12.213
10 At grip 3.370 8.920 215.000 7.738 24.104 7.738
11 centre 2.820 6.246 178.600 14.660 28.595 14.660
12 centre 2.760 5.983 265.000 13.795 44.293 13.795
13 centre 1.700 2.270 120.100 16.666 52.912 16.666
14 centre 2.840 6.335 191.400 12.604 30.214 12.604
Min 0.330 0.086 7.000 4.589 19.992 4.589
Mean 2.058 6.066 156.743 14.434 48.776 14.434
Max 6.340 31.570 678.900 22.797 100.550 22.797
S.D. 1.938 9.465 198.415 5.034 24.744 5.034

169
C. of V. 94.195 156.027 126.586 34.879 50.730 34.879
L.C.L. 0.939 0.601 42.180 11.527 34.489 11.527
U.C.L. 3.177 11.531 271.306 17.340 63.063 17.340
Type of sample : C.palmensis [Tree Lucerne] Test Name : Tensile strength of plant roots
Sample code : P-3300 Test Type : Tensile
Environmental condition : Temp-20, RH-60% Test Date : 25/07/2014 14:23
Tested by : Petros A. Test Speed : 10.000 mm/min
Checked by : Aster M. Pretension : Off
Sample Length : 100.000 mm
Comments :
Test No Type of
failure
Diameter
(mm)
Area (mm²) Force @
Peak (N)
Elong. @
Peak (mm)
Stress @
Peak (MPa)
Strain @
Peak (%)
1 centre 2.380 4.449 224.900 13.019 50.553 13.019
2 centre 2.050 3.301 97.900 14.321 29.661 14.321
3 at grip 0.600 0.283 9.200 14.263 32.538 14.263
4 centre 0.876 0.603 13.700 9.830 22.731 9.830
5 centre 0.560 0.246 9.300 16.579 37.759 16.579
6 centre 0.640 0.322 3.600 6.482 11.191 6.482
7 slip 4.010 12.629 274.200 9.615 21.711 9.615
8 centre 1.350 1.431 34.000 13.490 23.753 13.490
Min 0.560 0.246 3.600 6.482 11.191 6.482

170
Mean 1.558 2.908 83.350 12.200 28.737 12.200
Max 4.010 12.629 274.200 16.579 50.553 16.579
S.D. 1.207 4.229 107.770 3.279 11.897 3.279
C. of V. 77.447 145.430 129.298 26.877 41.399 26.877
L.C.L. 0.549 -0.628 -6.747 9.459 18.791 9.459
U.C.L. 2.567 6.443 173.447 14.941 38.683 14.941
Type of sample : A.abssynica [Yeferenj gira] Test Name : Tensile strength of plant roots
Sample code : P-3301 Test Type : Tensile
Environmental condition : Temp-20, RH-60% Test Date : 26/07/2014 07:53
Tested by : Petros A. Test Speed : 10.000 mm/min
Checked by : Aster M. Pretension : Off
Sample Length : 100.000 mm
Comments :

171
Test No Type of
failure
Diameter
(mm)
Area (mm²) Force @
Peak (N)
Elong. @
Peak (mm)
Stress @
Peak (MPa)
Strain @
Peak (%)
1 centre 2.930 6.743 202.500 9.709 30.033 9.709
2 centre 2.700 5.726 172.100 12.112 30.058 12.112
3 centre 2.180 3.733 142.200 11.153 38.098 11.153
4 centre 2.230 3.906 91.500 12.327 23.427 12.327
5 centre 0.340 0.091 1.400 2.169 15.420 2.169
6 centre 0.500 0.196 4.700 13.185 23.937 13.185
7 centre 1.040 0.849 32.600 19.037 38.376 19.037
8 centre 0.760 0.454 28.400 18.950 62.604 18.950
9 centre 0.980 0.754 29.100 10.806 38.579 10.806
10 at grip 0.630 0.312 8.400 16.325 26.947 16.325
11 centre 0.580 0.264 9.400 15.567 35.578 15.567
12 centre 0.330 0.086 5.400 17.689 63.136 17.689
13 centre 0.360 0.102 5.600 16.813 55.017 16.813
14 centre 2.140 3.597 71.700 12.306 19.934 12.306
15 centre 4.760 17.795 779.100 12.103 43.781 12.103
16 centre 1.300 1.327 30.200 13.252 22.753 13.252
17 centre 1.140 1.021 24.100 11.148 23.611 11.148
Min 0.330 0.086 1.400 2.169 15.420 2.169
Mean 1.465 2.762 96.376 13.215 34.782 13.215
Max 4.760 17.795 779.100 19.037 63.136 19.037
S.D. 1.207 4.415 186.733 4.090 14.416 4.090
C. of V. 82.411 159.849 193.753 30.951 41.446 30.951
L.C.L. 0.844 0.492 0.368 11.112 27.370 11.112
U.C.L. 2.085 5.032 192.385 15.318 42.194 15.318
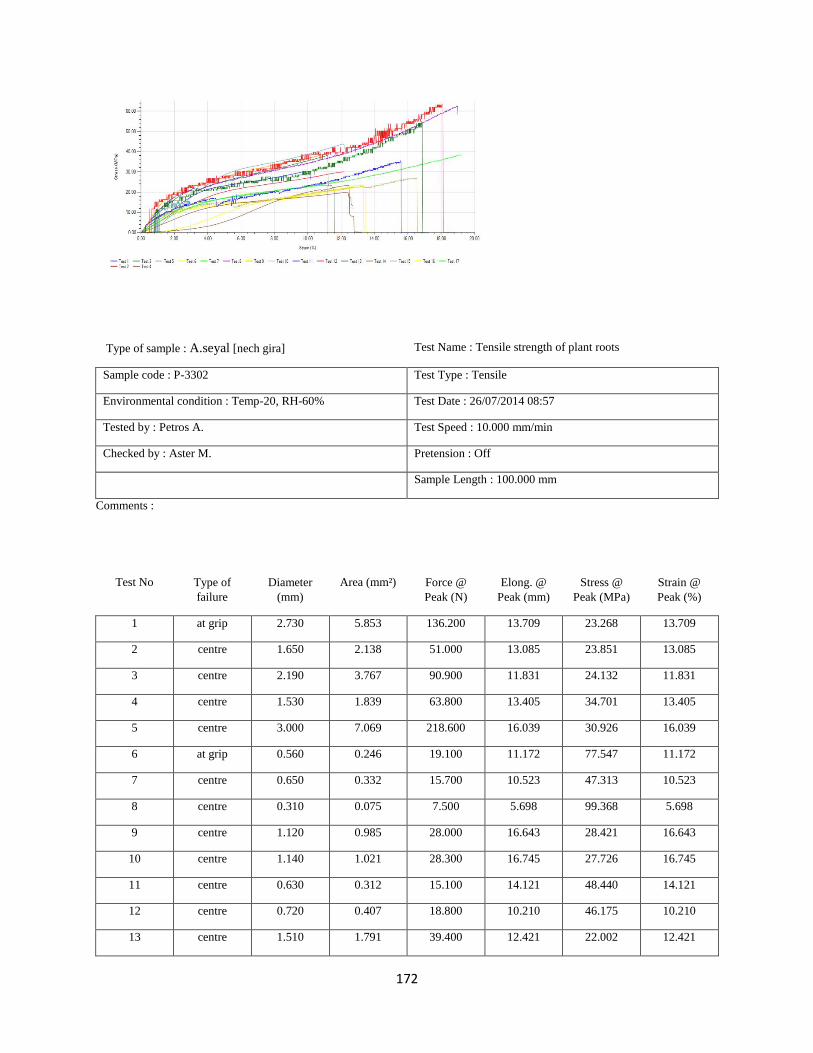
172
Type of sample : A.seyal [nech gira] Test Name : Tensile strength of plant roots
Sample code : P-3302 Test Type : Tensile
Environmental condition : Temp-20, RH-60% Test Date : 26/07/2014 08:57
Tested by : Petros A. Test Speed : 10.000 mm/min
Checked by : Aster M. Pretension : Off
Sample Length : 100.000 mm
Comments :
Test No Type of
failure
Diameter
(mm)
Area (mm²) Force @
Peak (N)
Elong. @
Peak (mm)
Stress @
Peak (MPa)
Strain @
Peak (%)
1 at grip 2.730 5.853 136.200 13.709 23.268 13.709
2 centre 1.650 2.138 51.000 13.085 23.851 13.085
3 centre 2.190 3.767 90.900 11.831 24.132 11.831
4 centre 1.530 1.839 63.800 13.405 34.701 13.405
5 centre 3.000 7.069 218.600 16.039 30.926 16.039
6 at grip 0.560 0.246 19.100 11.172 77.547 11.172
7 centre 0.650 0.332 15.700 10.523 47.313 10.523
8 centre 0.310 0.075 7.500 5.698 99.368 5.698
9 centre 1.120 0.985 28.000 16.643 28.421 16.643
10 centre 1.140 1.021 28.300 16.745 27.726 16.745
11 centre 0.630 0.312 15.100 14.121 48.440 14.121
12 centre 0.720 0.407 18.800 10.210 46.175 10.210
13 centre 1.510 1.791 39.400 12.421 22.002 12.421

173
14 centre 0.840 0.554 13.900 9.396 25.082 9.396
Min 0.310 0.075 7.500 5.698 22.002 5.698
Mean 1.327 1.885 53.307 12.500 39.925 12.500
Max 3.000 7.069 218.600 16.745 99.368 16.745
S.D. 0.829 2.194 59.528 3.041 22.924 3.041
C. of V. 62.490 116.412 111.670 24.329 57.416 24.329
L.C.L. 0.848 0.618 18.936 10.744 26.689 10.744
U.C.L. 1.806 3.152 87.678 14.256 53.161 14.256
Type of sample : A.abssynica [Yabesha gira] Test Name: Tensile strength of plant roots
Sample code : P-3303 Test Type : Tensile
Environmental condition : Temp-20, RH-60% Test Date : 26/07/2014 09:35
Tested by : Petros A. Test Speed : 10.000 mm/min
Checked by : Aster M. Pretension : Off
Sample Length : 100.000 mm
Comments :
Test No Type of
failure
Diameter (mm) Area (mm²) Force @
Peak (N)
Elong. @
Peak (mm)
Stress @
Peak (MPa)
Strain @
Peak (%)
1 centre 3.650 10.463 288.400 23.550 27.563 23.550
2 centre 0.620 0.302 12.800 19.243 42.397 19.243

174
3 centre 0.550 0.238 7.400 15.755 31.147 15.755
4 centre 0.600 0.283 8.400 12.109 29.709 12.109
5 centre 1.320 1.368 34.400 10.168 25.137 10.168
6 centre 0.800 0.503 16.100 18.307 32.030 18.307
7 centre 1.420 1.584 22.200 10.817 14.018 10.817
8 centre 2.560 5.147 140.600 19.277 27.316 19.277
9 centre 2.350 4.337 194.000 18.530 44.728 18.530
10 centre 1.720 2.324 81.200 17.741 34.947 17.741
11 centre 3.450 9.348 183.500 19.573 19.629 19.573
Min 0.550 0.238 7.400 10.168 14.018 10.168
Mean 1.731 3.263 89.909 16.825 29.875 16.825
Max 3.650 10.463 288.400 23.550 44.728 23.550
S.D. 1.129 3.678 97.030 4.176 8.945 4.176
C. of V. 65.232 112.714 107.921 24.820 29.943 24.820
L.C.L. 0.972 0.792 24.724 14.019 23.865 14.019
U.C.L. 2.489 5.734 155.094 19.630 35.884 19.630
Type of sample : G. ronusta [gravilia] Test Name : Tensile strength of plant roots
Sample code : P-3304 Test Type : Tensile
Environmental condition : Temp-20, RH-60% Test Date : 26/07/2014 10:13

175
Tested by : Petros A. Test Speed : 10.000 mm/min
Checked by : Aster M. Pretension : Off
Sample Length : 100.000 mm
Comments :
Test No Type of
failure
Diameter
(mm)
Area (mm²) Force @
Peak (N)
Elong. @
Peak (mm)
Stress @
Peak (MPa)
Strain @
Peak (%)
1 at grip 1.780 2.488 76.100 5.829 30.581 5.829
2 at grip 1.020 0.817 43.400 9.493 53.113 9.493
3 slip 3.950 12.254 80.600 4.427 6.577 4.427
4 centre 0.420 0.139 6.100 4.730 44.029 4.730
5 centre 0.690 0.374 10.200 5.190 27.278 5.190
6 centre 0.630 0.312 14.800 8.465 47.478 8.465
7 centre 0.370 0.108 6.300 25.972 58.593 25.972
8 centre 0.500 0.196 10.500 6.902 53.476 6.902
9 centre 1.370 1.474 69.500 7.449 47.147 7.449
10 centre 0.560 0.246 12.100 8.856 49.127 8.856
11 centre 0.480 0.181 11.100 9.531 61.341 9.531
12 centre 1.400 1.539 19.900 6.684 12.927 6.684
13 centre 2.280 4.083 40.300 7.331 9.871 7.331
Min 0.370 0.108 6.100 4.427 6.577 4.427
Mean 1.188 1.862 30.838 8.528 38.580 8.528
Max 3.950 12.254 80.600 25.972 61.341 25.972
S.D. 1.019 3.336 28.045 5.513 19.025 5.513
C. of V. 85.758 179.121 90.941 64.643 49.313 64.643
L.C.L. 0.573 -0.153 13.891 5.196 27.083 5.196
U.C.L. 1.804 3.878 47.786 11.859 50.076 11.859

176
Type of sample : C.macrostachyus [misanna] Test Name : Tensile strength of plant roots
Sample code : P-3305 Test Type: Tensile
Environmental condition : Temp-20, RH-60% Test Date : 26/07/2014 12:02
Tested by : Petros A. Test Speed : 10.000 mm/min
Checked by : Aster M. Pretension : Off
Sample Length : 100.000 mm
Comments :
Test No Type of
failure
Diameter (mm) Area (mm²) Force @
Peak (N)
Elong. @
Peak (mm)
Stress @
Peak (MPa)
Strain @
Peak (%)
1 at grip 2.710 5.768 99.200 12.104 17.198 12.104
2 at grip 1.900 2.835 41.100 7.792 14.496 7.792
3 centre 0.490 0.189 4.700 12.623 24.924 12.623
4 centre 0.600 0.283 12.000 9.472 42.441 9.472
5 at grip 0.480 0.181 4.900 12.932 27.078 12.932
6 centre 0.720 0.407 4.300 5.382 10.561 5.382
7 centre 1.040 0.849 43.700 15.355 51.443 15.355
8 at grip 1.270 1.267 21.100 13.641 16.657 13.641
9 centre 1.670 2.190 33.700 12.198 15.385 12.198
10 at grip 3.650 10.463 93.300 8.471 8.917 8.471
11 at grip 0.870 0.594 1.200 1.060 2.019 1.060

177
Min 0.480 0.181 1.200 1.060 2.019 1.060
Mean 1.400 2.275 32.655 10.094 21.011 10.094
Max 3.650 10.463 99.200 15.355 51.443 15.355
S.D. 1.015 3.188 34.937 4.187 14.701 4.187
C. of V. 72.512 140.125 106.989 41.482 69.970 41.482
L.C.L. 0.718 0.133 9.184 7.281 11.135 7.281
U.C.L. 2.082 4.417 56.125 12.906 30.887 12.906
Type of sample : E.camaldulensis [Bahir Zaf] Test Name : Tensile strength of plant roots
Sample code : P-3306 Test Type : Tensile
Environmental condition : Temp-20, RH-60% Test Date : 26/07/2014 12:31
Tested by : Petros A. Test Speed : 10.000 mm/min
Checked by : Aster M. Pretension : Off
Sample Length : 100.000 mm
Comments :
Test No Type of
failure
Diameter
(mm)
Area (mm²) Force @
Peak (N)
Elong. @
Peak (mm)
Stress @
Peak (MPa)
Strain @
Peak (%)
1 centre 1.950 2.986 88.600 6.795 29.667 6.795
2 At grip 2.840 6.335 178.300 6.260 28.147 6.260

178
3 centre 1.010 0.801 7.000 4.180 8.737 4.180
4 centre 1.680 2.217 36.100 5.137 16.285 5.137
5 centre 1.160 1.057 8.400 4.675 7.948 4.675
6 centre 0.410 0.132 3.500 4.659 26.510 4.659
7 centre 1.520 1.815 39.300 6.043 21.658 6.043
8 centre 2.070 3.365 46.200 4.656 13.728 4.656
9 centre 3.200 8.042 104.400 5.588 12.981 5.588
10 centre 0.240 0.045 3.100 5.368 68.525 5.368
11 centre 3.610 10.235 285.900 3.284 27.933 3.284
12 error 3.260 8.347 61.000 1.556 7.308 1.556
13 centre 1.980 3.079 115.900 6.130 37.641 6.130
14 centre 1.160 1.057 18.200 7.052 17.221 7.052
Min 0.240 0.045 3.100 1.556 7.308 1.556
Mean 1.864 3.537 71.136 5.099 23.164 5.099
Max 3.610 10.235 285.900 7.052 68.525 7.052
S.D. 1.053 3.339 80.405 1.456 16.022 1.456
C. of V. 56.520 94.416 113.030 28.560 69.167 28.560
L.C.L. 1.255 1.609 24.711 4.258 13.913 4.258
U.C.L. 2.472 5.465 117.561 5.940 32.414 5.940
Type of sample : C.africana [wanza] Test Name : Tensile strength of plant roots
Sample code : P-3307 Test Type : Tensile

179
Environmental condition : Temp-20, RH-60% Test Date: 26/07/2014 12:54
Tested by : Petros A. Test Speed : 10.000 mm/min
Checked by : Aster M. Pretension : Off
Sample Length : 100.000 mm
Comments :
Test No Type of
failure
Diameter (mm) Area (mm²) Force @
Peak (N)
Elong. @
Peak (mm)
Stress @
Peak (MPa)
Strain @
Peak (%)
1 centre 1.670 2.190 53.700 7.827 24.516 7.827
2 at grip 2.390 4.486 101.900 8.612 22.714 8.612
3 centre 0.640 0.322 5.000 6.724 15.542 6.724
4 centre 0.550 0.238 4.700 7.583 19.783 7.583
5 at grip 0.860 0.581 11.700 9.268 20.142 9.268
6 centre 0.850 0.567 11.300 7.154 19.914 7.154
7 at grip 1.740 2.378 44.900 8.195 18.882 8.195
8 centre 2.590 5.269 82.200 8.074 15.602 8.074
9 centre 4.500 15.904 221.600 5.907 13.933 5.907
10 centre 1.860 2.717 63.400 8.000 23.333 8.000
11 centre 6.200 30.191 341.500 8.278 11.311 8.278
12 at grip 2.250 3.976 109.800 13.374 27.615 13.374
13 centre 0.750 0.442 12.700 14.605 28.747 14.605
Min 0.550 0.238 4.700 5.907 11.311 5.907
Mean 2.065 5.328 81.877 8.739 20.157 8.739
Max 6.200 30.191 341.500 14.605 28.747 14.605
S.D. 1.652 8.554 98.813 2.491 5.211 2.491
C. of V. 79.961 160.548 120.685 28.503 25.854 28.503
L.C.L. 1.067 0.159 22.165 7.233 17.007 7.233
U.C.L. 3.063 10.497 141.589 10.244 23.306 10.244
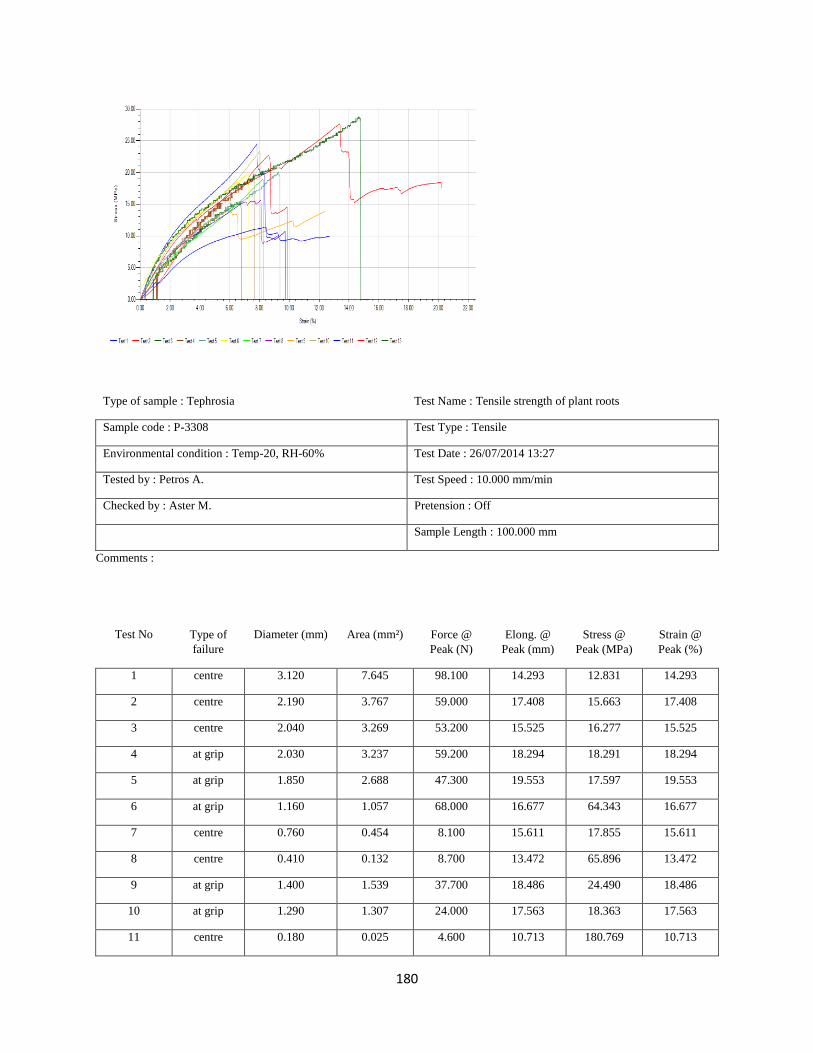
180
Type of sample : Tephrosia Test Name : Tensile strength of plant roots
Sample code : P-3308 Test Type : Tensile
Environmental condition : Temp-20, RH-60% Test Date : 26/07/2014 13:27
Tested by : Petros A. Test Speed : 10.000 mm/min
Checked by : Aster M. Pretension : Off
Sample Length : 100.000 mm
Comments :
Test No Type of
failure
Diameter (mm) Area (mm²) Force @
Peak (N)
Elong. @
Peak (mm)
Stress @
Peak (MPa)
Strain @
Peak (%)
1 centre 3.120 7.645 98.100 14.293 12.831 14.293
2 centre 2.190 3.767 59.000 17.408 15.663 17.408
3 centre 2.040 3.269 53.200 15.525 16.277 15.525
4 at grip 2.030 3.237 59.200 18.294 18.291 18.294
5 at grip 1.850 2.688 47.300 19.553 17.597 19.553
6 at grip 1.160 1.057 68.000 16.677 64.343 16.677
7 centre 0.760 0.454 8.100 15.611 17.855 15.611
8 centre 0.410 0.132 8.700 13.472 65.896 13.472
9 at grip 1.400 1.539 37.700 18.486 24.490 18.486
10 at grip 1.290 1.307 24.000 17.563 18.363 17.563
11 centre 0.180 0.025 4.600 10.713 180.769 10.713

181
12 centre 0.130 0.013 5.100 12.923 384.232 12.923
13 centre 1.160 1.057 26.500 10.217 25.075 10.217
14 at grip 3.540 9.842 148.500 12.082 15.088 12.082
Min 0.130 0.013 4.600 10.217 12.831 10.217
Mean 1.519 2.574 46.286 15.201 62.626 15.201
Max 3.540 9.842 148.500 19.553 384.232 19.553
S.D. 1.023 2.931 40.428 2.986 102.775 2.986
C. of V. 67.335 113.890 87.345 19.643 164.109 19.643
L.C.L. 0.928 0.881 22.943 13.477 3.285 13.477
U.C.L. 2.109 4.266 69.629 16.925 121.968 16.925
Appendix C3 Root tensile strength testing results for 9 shrubs species
Testing results of tensile strength per diameter for 9 shrub species. Results are given in both tables and figures consecutively
Type of sample : S.rhombiflia (Gorjejit] Test Name : Tensile strength of plant roots
Sample code : P-3309 Test Type : Tensile
Environmental condition : Temp-20, RH-60% Test Date : 26/07/2014 14:25
Tested by : Petros A. Test Speed : 10.000 mm/min
Checked by : Aster M. Pretension : Off
Sample Length : 100.000 mm

182
Test No Type of
failure
Diameter
(mm)
Area (mm²) Force @
Peak (N)
Elong. @
Peak (mm)
Stress @
Peak (MPa)
Strain @
Peak (%)
1 error 2.570 5.187 23.200 8.840 4.472 8.840
2 centre 3.000 7.069 117.000 14.536 16.552 14.536
3 centre 0.600 0.283 8.400 13.886 29.709 13.886
4 centre 0.490 0.189 5.300 12.395 28.106 12.395
5 centre 0.410 0.132 7.100 19.408 53.778 19.408
6 centre 2.400 4.524 52.800 14.522 11.671 14.522
7 centre 0.940 0.694 22.100 12.433 31.845 12.433
8 centre 1.790 2.516 23.800 9.575 9.458 9.575
9 centre 1.470 1.697 39.200 9.354 23.097 9.354
10 centre 1.050 0.866 26.200 12.996 30.257 12.996
11 centre 0.640 0.322 13.500 17.295 41.965 17.295
Min 0.410 0.132 5.300 8.840 4.472 8.840
Mean 1.396 2.134 30.782 13.204 25.537 13.204
Max 3.000 7.069 117.000 19.408 53.778 19.408
S.D. 0.919 2.406 31.940 3.279 14.611 3.279
C. of V. 65.814 112.744 103.762 24.836 57.213 24.836
L.C.L. 0.779 0.518 9.325 11.001 15.722 11.001
U.C.L. 2.014 3.751 52.239 15.407 35.353 15.407
Type of sample : R.abbysinica (Qega] Test Name : Tensile strength of plant roots
Sample code : P-3310 Test Type : Tensile

183
Environmental condition : Temp-20, RH-60% Test Date: 26/07/2014 14:57
Tested by : Petros A. Test Speed : 10.000 mm/min
Checked by : Aster M. Pretension : Off
Sample Length : 100.000 mm
Comments :
Test No Type of
failure
Diameter
(mm)
Area (mm²) Force @
Peak (N)
Elong. @
Peak (mm)
Stress @
Peak (MPa)
Strain @
Peak (%)
1 centre 0.550 0.238 15.100 20.005 63.557 20.005
2 centre 0.230 0.042 6.800 9.824 163.668 9.824
3 At grip 1.870 2.746 32.300 7.020 11.761 7.020
4 At grip 1.210 1.150 34.200 23.444 29.742 23.444
5 centre 1.560 1.911 51.700 21.179 27.049 21.179
6 centre 3.780 11.222 130.100 8.727 11.593 8.727
7 centre 3.060 7.354 107.200 17.469 14.577 17.469
8 centre 1.170 1.075 6.900 6.050 6.418 6.050
Min 0.230 0.042 6.800 6.050 6.418 6.050
Mean 1.679 3.217 48.038 14.215 41.045 14.215
Max 3.780 11.222 130.100 23.444 163.668 23.444
S.D. 1.209 3.981 46.544 7.027 52.768 7.027
C. of V. 71.995 123.742 96.892 49.432 128.560 49.432
L.C.L. 0.668 -0.111 9.126 8.340 -3.069 8.340
U.C.L. 2.689 6.546 86.949 20.089 85.160 20.089

184
Type of sample : C.edulis (agam] Test Name : Tensile strength of plant roots
Sample code : P-3311 Test Type : Tensile
Environmental condition : Temp-20, RH-60% Test Date : 27/07/2014 10:08
Tested by : Petros A. Test Speed : 10.000 mm/min
Checked by : Aster M. Pretension : Off
Sample Length : 100.000 mm
Comments :
Test No Type of
failure
Diameter
(mm)
Area (mm²) Force @
Peak (N)
Elong. @
Peak (mm)
Stress @
Peak (MPa)
Strain @
Peak (%)
1 centre 2.190 3.767 82.200 13.409 21.822 13.409
2 centre 3.900 11.946 166.300 12.377 13.921 12.377
3 at the grip 1.490 1.744 39.800 17.703 22.826 17.703
4 at the grip 1.610 2.036 31.700 18.327 15.571 18.327
5 centre 2.750 5.940 98.500 14.849 16.584 14.849
6 centre 0.670 0.353 5.900 11.472 16.734 11.472
7 centre 1.700 2.270 62.600 14.413 27.580 14.413
8 at the grip 1.010 0.801 12.500 9.302 15.602 9.302
9 at the grip 1.080 0.916 24.100 12.134 26.308 12.134

185
10 centre 1.980 3.079 46.000 17.060 14.940 17.060
11 centre 1.200 1.131 28.600 15.478 25.288 15.478
12 centre 0.640 0.322 10.000 12.216 31.085 12.216
13 centre 0.770 0.466 11.800 13.593 25.340 13.593
14 centre 0.730 0.419 9.000 12.995 21.503 12.995
15 centre 0.390 0.119 5.900 10.425 49.389 10.425
Min 0.390 0.119 5.900 9.302 13.921 9.302
Mean 1.474 2.354 42.327 13.717 22.966 13.717
Max 3.900 11.946 166.300 18.327 49.389 18.327
S.D. 0.940 3.097 44.569 2.615 9.047 2.615
C. of V. 63.755 131.575 105.299 19.064 39.391 19.064
L.C.L. 0.954 0.639 17.645 12.269 17.956 12.269
U.C.L. 1.994 4.069 67.009 15.165 27.976 15.165
Type of sample : V.auriculenta (dengorita] Test Name : Tensile strength of plant roots
Sample code : P-3312 Test Type : Tensile
Environmental condition : Temp-20, RH-60% Test Date : 27/07/2014 10:54
Tested by : Petros A. Test Speed : 10.000 mm/min
Checked by : Aster M. Pretension : Off
Sample Length : 100.000 mm
Comments :

186
Test No Type of failure Diameter
(mm)
Area (mm²) Force @
Peak (N)
Elong. @
Peak (mm)
Stress @
Peak (MPa)
Strain @
Peak (%)
1 centre 3.200 8.042 116.000 20.999 14.423 20.999
2 centre 1.550 1.887 40.000 21.282 21.199 21.282
3 at the grip 1.970 3.048 23.300 23.166 7.644 23.166
4 centre 0.140 0.015 1.900 9.389 123.426 9.389
5 centre 0.830 0.541 12.600 21.798 23.288 21.798
6 centre 1.280 1.287 13.700 21.225 10.647 21.225
7 centre 3.270 8.398 117.200 19.546 13.955 19.546
8 centre 0.610 0.292 3.300 10.733 11.292 10.733
9 at the grip 2.000 3.142 51.800 20.495 16.488 20.495
10 centre 0.780 0.478 6.700 17.124 14.022 17.124
11 centre 2.400 4.524 71.100 21.329 15.717 21.329
Min 0.140 0.015 1.900 9.389 7.644 9.389
Mean 1.639 2.878 41.600 18.826 24.736 18.826
Max 3.270 8.398 117.200 23.166 123.426 23.166
S.D. 1.037 2.993 42.945 4.596 33.034 4.596
C. of V. 63.259 104.001 103.234 24.411 133.544 24.411
L.C.L. 0.943 0.867 12.750 15.739 2.544 15.739
U.C.L. 2.336 4.888 70.450 21.913 46.929 21.913
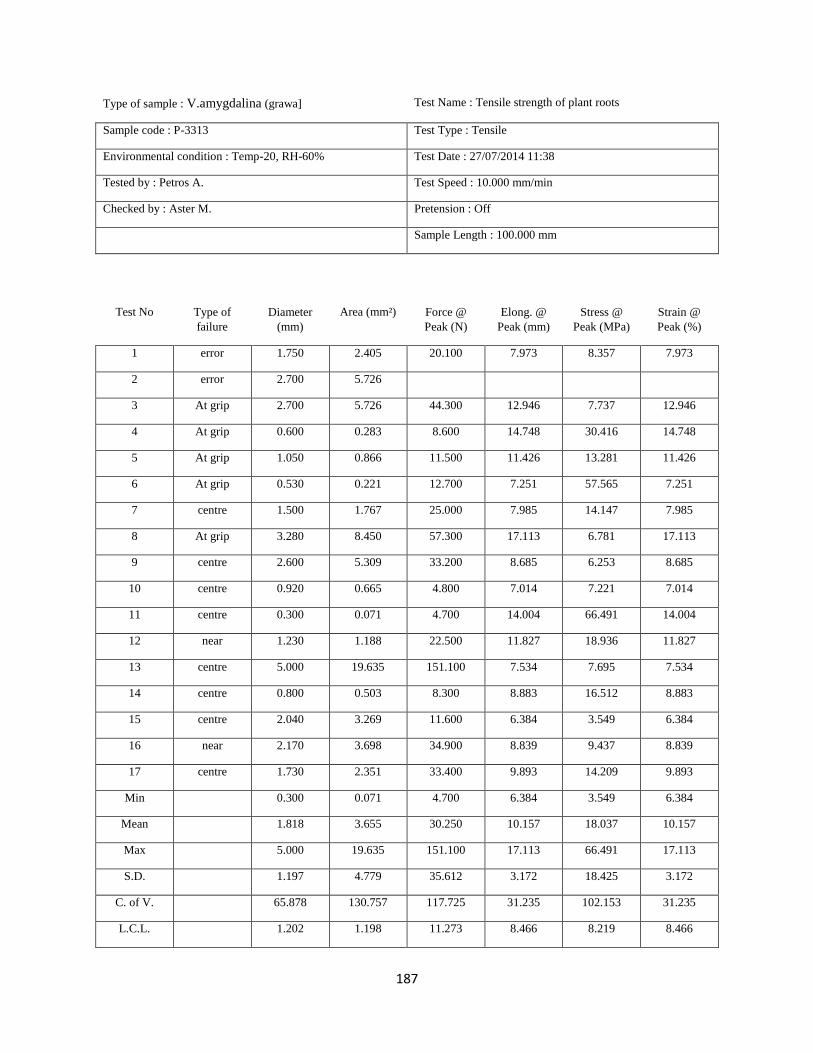
187
Type of sample : V.amygdalina (grawa] Test Name : Tensile strength of plant roots
Sample code : P-3313 Test Type : Tensile
Environmental condition : Temp-20, RH-60% Test Date : 27/07/2014 11:38
Tested by : Petros A. Test Speed : 10.000 mm/min
Checked by : Aster M. Pretension : Off
Sample Length : 100.000 mm
Test No Type of
failure
Diameter
(mm)
Area (mm²) Force @
Peak (N)
Elong. @
Peak (mm)
Stress @
Peak (MPa)
Strain @
Peak (%)
1 error 1.750 2.405 20.100 7.973 8.357 7.973
2 error 2.700 5.726
3 At grip 2.700 5.726 44.300 12.946 7.737 12.946
4 At grip 0.600 0.283 8.600 14.748 30.416 14.748
5 At grip 1.050 0.866 11.500 11.426 13.281 11.426
6 At grip 0.530 0.221 12.700 7.251 57.565 7.251
7 centre 1.500 1.767 25.000 7.985 14.147 7.985
8 At grip 3.280 8.450 57.300 17.113 6.781 17.113
9 centre 2.600 5.309 33.200 8.685 6.253 8.685
10 centre 0.920 0.665 4.800 7.014 7.221 7.014
11 centre 0.300 0.071 4.700 14.004 66.491 14.004
12 near 1.230 1.188 22.500 11.827 18.936 11.827
13 centre 5.000 19.635 151.100 7.534 7.695 7.534
14 centre 0.800 0.503 8.300 8.883 16.512 8.883
15 centre 2.040 3.269 11.600 6.384 3.549 6.384
16 near 2.170 3.698 34.900 8.839 9.437 8.839
17 centre 1.730 2.351 33.400 9.893 14.209 9.893
Min 0.300 0.071 4.700 6.384 3.549 6.384
Mean 1.818 3.655 30.250 10.157 18.037 10.157
Max 5.000 19.635 151.100 17.113 66.491 17.113
S.D. 1.197 4.779 35.612 3.172 18.425 3.172
C. of V. 65.878 130.757 117.725 31.235 102.153 31.235
L.C.L. 1.202 1.198 11.273 8.466 8.219 8.466

188
U.C.L. 2.433 6.112 49.227 11.847 27.855 11.847
Type of sample : C.cajan (Yergib ater) Test Name : Tensile strength of plant roots
Sample code : P-3314 Test Type : Tensile
Environmental condition : Temp-20, RH-60% Test Date : 27/07/2014 12:24
Tested by : Petros A. Test Speed : 10.000 mm/min
Checked by : Aster M. Pretension : Off
Sample Length : 100.000 mm
Comments :
Test No Type of
failure
Diameter
(mm)
Area (mm²) Force @
Peak (N)
Elong. @
Peak (mm)
Stress @
Peak (MPa)
Strain @
Peak (%)
1 At grip 3.260 8.347 208.200 2.714 24.943 2.714
2 At grip 1.840 2.659 99.400 4.200 37.382 4.200
3 centre 2.540 5.067 137.300 5.590 27.097 5.590
4 centre 2.710 5.768 175.100 6.565 30.357 6.565
5 centre 0.870 0.594 25.600 5.898 43.064 5.898
6 centre 0.690 0.374 11.500 5.465 30.755 5.465
7 centre 0.190 0.028 2.800 5.049 98.755 5.049
8 centre 0.620 0.302 16.700 5.636 55.315 5.636
9 At grip 0.450 0.159 6.300 5.948 39.612 5.948
10 centre 3.460 9.402 250.800 6.918 26.674 6.918
11 centre 3.330 8.709 213.700 4.689 24.537 4.689
12 centre 2.690 5.683 60.700 3.457 10.681 3.457

189
Min 0.190 0.028 2.800 2.714 10.681 2.714
Mean 1.888 3.924 100.675 5.177 37.431 5.177
Max 3.460 9.402 250.800 6.918 98.755 6.918
S.D. 1.251 3.668 92.677 1.235 22.304 1.235
C. of V. 66.268 93.477 92.056 23.848 59.586 23.848
L.C.L. 1.093 1.594 41.790 4.393 23.260 4.393
U.C.L. 2.682 6.255 159.560 5.962 51.602 5.962
Type of sample : J.shimperiana (Simiza) Test Name : Tensile strength of plant roots
Sample code : P-3315 Test Type : Tensile
Environmental condition : Temp-20, RH-60% Test Date :27/07/2014 12:53
Tested by : Petros A. Test Speed : 10.000 mm/min
Checked by : Aster M. Pretension : Off
Sample Length : 100.000 mm
Test No Type of
failure
Diameter
(mm)
Area (mm²) Force @
Peak (N)
Elong. @
Peak (mm)
Stress @
Peak (MPa)
Strain @
Peak (%)
1 centre 3.830 11.521 270.800 11.916 23.505 11.916
2 centre 2.460 4.753 66.400 5.879 13.970 5.879
3 At grip 2.620 5.391 107.000 11.205 19.847 11.205
4 At grip 1.780 2.488 39.700 13.670 15.954 13.670

190
5 centre 2.840 6.335 86.900 11.396 13.718 11.396
6 At grip 1.420 1.584 22.100 13.509 13.955 13.509
7 At grip 0.550 0.238 6.000 10.283 25.254 10.283
8 At grip 0.820 0.528 15.200 20.614 28.782 20.614
9 centre 0.650 0.332 9.900 9.433 29.834 9.433
10 At grip 1.220 1.169 13.400 13.885 11.463 13.885
11 centre 0.890 0.622 14.000 17.569 22.504 17.569
12 At grip 1.250 1.227 21.000 14.744 17.112 14.744
13 centre 1.190 1.112 24.800 12.165 22.298 12.165
14 centre 1.260 1.247 23.400 12.695 18.767 12.695
15 centre 0.570 0.255 8.300 8.493 32.527 8.493
16 centre 2.500 4.909 48.500 8.943 9.880 8.943
Min 0.550 0.238 6.000 5.879 9.880 5.879
Mean 1.616 2.732 48.587 12.275 19.961 12.275
Max 3.830 11.521 270.800 20.614 32.527 20.614
S.D. 0.962 3.103 66.232 3.562 6.812 3.562
C. of V. 59.562 113.595 136.315 29.018 34.128 29.018
L.C.L. 1.103 1.078 13.294 10.377 16.331 10.377
U.C.L. 2.128 4.386 83.881 14.173 23.591 14.173
Type of sample : A.elaphroxylon (Ambacho) Test Name : Tensile strength of plant roots
Sample code : P-3316 Test Type : Tensile
Environmental condition : Temp-20, RH-60% Test Date : 27/07/2014 14:18
Tested by : Petros A. Test Speed : 10.000 mm/min

191
Checked by : Aster M. Pretension : Off
Sample Length : 100.000 mm
Comments :
Test No Type of
failure
Diameter
(mm)
Area (mm²) Force @
Peak (N)
Elong. @
Peak (mm)
Stress @
Peak (MPa)
Strain @
Peak (%)
1 At grip 1.020 0.817 9.900 11.121 12.116 11.121
2 centre 2.130 3.563 13.800 4.269 3.873 4.269
3 At grip 1.190 1.112 12.000 6.672 10.789 6.672
4 centre 2.110 3.497 21.800 7.114 6.235 7.114
5 centre 1.690 2.243 22.800 8.619 10.164 8.619
6 centre 1.070 0.899 7.300 7.285 8.118 7.285
7 centre 1.800 2.545 18.500 7.115 7.270 7.115
Min 1.020 0.817 7.300 4.269 3.873 4.269
Mean 1.573 2.097 15.157 7.456 8.366 7.456
Max 2.130 3.563 22.800 11.121 12.116 11.121
S.D. 0.478 1.181 5.985 2.074 2.862 2.074
C. of V. 30.373 56.345 39.484 27.820 34.213 27.820
L.C.L. 1.131 1.004 9.622 5.538 5.719 5.538
U.C.L. 2.015 3.189 20.692 9.375 11.014 9.375

192
Type of sample : R.prinoids (Gesho) Test Name : Tensile strength of plant roots
Sample code : P-3317 Test Type : Tensile
Environmental condition : Temp-20, RH-60% Test Date : 27/07/2014 14:32
Tested by : Petros A. Test Speed : 10.000 mm/min
Checked by : Aster M. Pretension : Off
Sample Length : 100.000 mm
Comments:
Test No Type of
failure
Diameter
(mm)
Area (mm²) Force @
Peak (N)
Elong. @
Peak (mm)
Stress @
Peak (MPa)
Strain @
Peak (%)
1 centre 1.470 1.697 51.900 14.309 30.580 14.309
2 centre 1.450 1.651 52.700 14.882 31.914 14.882
3 error 0.600 0.283 5.000 9.119 17.684 9.119
4 centre 3.630 10.349 133.000 11.064 12.851 11.064
5 centre 2.640 5.474 126.900 8.943 23.183 8.943
6 error 0.970 0.739 9.500 4.981 12.856 4.981
Min 0.600 0.283 5.000 4.981 12.851 4.981
Mean 1.793 3.366 63.167 10.550 21.511 10.550
Max 3.630 10.349 133.000 14.882 31.914 14.882
S.D. 1.133 3.882 55.567 3.710 8.460 3.710
C. of V. 63.159 115.338 87.969 35.163 39.327 35.163
L.C.L. 0.605 -0.708 4.852 6.657 12.633 6.657
U.C.L. 2.982 7.439 121.481 14.443 30.389 14.443

193
Appendix C4: Root fiber pictures
Figure C2-1. Some of microscopic pictures of plant root fibers. (a) S.natalensis, (b) Tephrosia, (c) S.rhombiflia) (d) C.palmensis,
(e) V.amygdalina)