Embed Size (px)
Citation preview
www.elsevier.com/locate/ydbio
Developmental Biology 268 (2004) 111–122
Extracellular matrix dynamics during vertebrate axis formation$
Andras Czirok,a,b Brenda J. Rongish,a and Charles D. Littlea,*
aDepartment of Anatomy and Cell Biology, University of Kansas Medical Center, Kansas City, KS 66160, USAbDepartment of Biological Physics, Eotvos University, Pazmany Stny 1A, Budapest 1117, Hungary
Received for publication 30 April 2003, revised form 29 September 2003, accepted 30 September 2003
The authors dedicate this article to the memory of John Phillip Trinkaus, Ph.D. (1918–2003). Trink helped us, and thousands of other developmental
biologists, understand the ‘‘forces that shape the embryo.’’ While a postdoc, one of us (C.D.L.) had the great fortune to have a desk next to Trink during his
visiting professorship in Jon Singer’s Lab (UCSD, 1981)—it was a glorious experience.
Abstract
The first evidence for the dynamics of in vivo extracellular matrix (ECM) pattern formation during embryogenesis is presented below.
Fibrillin 2 filaments were tracked for 12 h throughout the avian intraembryonic mesoderm using automated light microscopy and algorithms
of our design. The data show that these ECM filaments have a reproducible morphogenic destiny that is characterized by directed transport.
Fibrillin 2 particles initially deposited in the segmental plate mesoderm are translocated along an unexpected trajectory where they eventually
polymerize into an intricate scaffold of cables parallel to the anterior–posterior axis. The cables coalesce near the midline before the
appearance of the next-formed somite. Moreover, the ECM filaments define global tissue movements with high precision because the
filaments act as passive motion tracers. Quantification of individual and collective filament ‘‘behaviors’’ establish fate maps, trajectories, and
velocities. These data reveal a caudally propagating traveling wave pattern in the morphogenetic movements of early axis formation. We
conjecture that within vertebrate embryos, long-range mechanical tension fields are coupled to both large-scale patterning and local
organization of the ECM. Thus, physical forces or stress fields are essential requirements for executing an emergent developmental pattern—
in this case, paraxial fibrillin cable assembly.
D 2004 Elsevier Inc. All rights reserved.
Keywords: Gastrulation; Fate map; Extracellular matrix; Time-lapse; Dynamics; Tissue deformation
Introduction
Gastrulation and vertebral axis formation require exten-
sive changes in the shape of the early vertebrate embryo. In
avians, after developmental stage 4 (Hamburger and Ham-
ilton, 1951), the primitive streak gradually regresses and
Hensen node moves caudally. A concomitant process,
somitogenesis, leads to the parsing of discrete segments of
mesodermal tissue into small packets at regular intervals
along the anterior–posterior axis, thereby establishing the
segmented vertebrate body plan. Neurulation, which in-
cludes formation and extension of the notochord, is another
0012-1606/$ - see front matter D 2004 Elsevier Inc. All rights reserved.
doi:10.1016/j.ydbio.2003.09.040
$ Supplementary data associated with this article can be found, in the
online version, at doi: 10.1016/j.ydbio.2003.09.040.
* Corresponding author. Department of Anatomy and Cell Biology,
University of Kansas Medical Center, 3901 Rainbow Boulevard, Kansas
City, KS, 66160. Fax: +913-588-2710.
E-mail address: [email protected] (C.D. Little).
contemporaneous event in vertebrate development. The
notochord is laid down as a ‘‘rod’’ of mesoderm by
Hensen’s node, and elongates as the primitive streak
regresses. The neural tube develops dorsal to the notochord;
subsequently, the notochord and neural tube derivatives
become encased in the vertebrae.
Large numbers of cells move to new locations during
these changes in embryonic anatomy. Recent cell fate
mapping studies of gastrulation/neurulation–stage avian
embryos established that mesodermal precursor cells first
dislocate medially towards the primitive streak. Their in-
gression at the axis is followed by various degrees of lateral
displacement, targeting the notochord, somites, or the seg-
mental mesoderm depending on the position and time of
ingression (Bortier and Vakaet, 1992; Catala et al., 1996;
Psychoyos and Stern, 1996; Sawada and Aoyama, 1999;
Schoenwolf et al., 1992; Yang et al., 2002). While the
cellular fate map of gastrulation is well established, the
mechanisms underlying the morphogenetic movements are
A. Czirok et al. / Developmental Biology 268 (2004) 111–122112
still far from clear (for recent reviews, see Wallingford et al.
(2002); Keller et al., 2003).
It has been long understood that the extracellular matrix
(ECM), which is known to provide signals to cells and
affect cell behavior, plays an important role in morphogen-
esis. However, the ECM is not simply a static scaffold: cell
motion involves cell traction, a mechanical interaction
between cells and the ECM, which, in turn, results in a
local realignment of the ECM (Oliver et al., 1995; Stoplak
and Harris, 1982; Tranquillo, 1999). ECM fibers can also be
reoriented by long-range (nonlocal) mechanical forces with-
in the tissue (Olsen et al., 1999). Nevertheless, to the best of
our knowledge, in vivo ‘‘fate maps’’ of ECM component
movements have not been determined—nor has it been
established whether ECM molecular complexes, like cells,
‘‘behave’’ in a predictable, developmental stage- and posi-
tion-dependent fashion.
Proteins of the fibrillin family are promising candidates
for ECM tracking studies because they are ubiquitous and
easily recognizable, discrete filamentous structures when
made visible by immunolabeling methods (Burke et al.,
2000; Gallagher et al., 1993; Rongish et al., 1998; Visconti
et al., 2003; Wunsch et al., 1994). Fibrillin 1 and 2 are
constituents of connective tissue microfibrils (Sakai et al.,
1986; Zhang et al., 1994) and are both observed in the avian
embryo before gastrulation in the form of slender filaments
marking the future anterior–posterior axis (Gallagher et al.,
1993; Wunsch et al., 1994). During gastrulation, the fibril-
lins continue to display a remarkable pattern widely distrib-
uted in association with the mesoderm (Burke et al., 2000;
Rongish et al., 1998; Visconti et al., 2003). The importance
of these proteins to the structural and functional properties
of connective tissues has been demonstrated by the finding
that mutations in the human FBN1 and FBN2 genes result in
heritable disorders, with patients manifesting ocular, skele-
tal, and cardiovascular abnormalities (Dietz et al., 1994). In
accord, fibrillin-deficient mouse models demonstrated that
the absence of normal levels of either fibrillin 1 or 2 protein
is incompatible with the proper function of mature elastic
fibers (Artega-Solis et al., 2001; Pereira et al., 1997; Pereira
et al., 1999). Deficiency in one type of fibrillin was found to
be compatible with gastrulation of mouse embryos; never-
theless, exogenous expression of a truncated fibrillin in the
presumptive dorsal mesoderm of gastrulation stage frog
embryos disturbed endogenous fibrillin localization and
blocked gastrulation (Skoglund, 1996).
Motivated by the excellent tracking properties and the
developmental importance of fibrillin fibers, we investigated
the reorganization and assembly of this ECM component
during gastrulation/neurulation. We demonstrate the coales-
cence of an extended, loose meshwork into larger cables.
Our high-resolution map of filament displacements shows
that morphogenesis-associated ECM movements essentially
repeat the same basic pattern at progressively more caudal
positions. These quantitative data open the door to future
studies focusing on the mechanical forces that drive mor-
phogenesis. We conclude with the hypothesis that large-
scale ECM reorganization is primarily driven by changing
mechanical tension fields.
Materials and methods
Microinjection
The location of fibrillin 2-containing ECMwas monitored
with Cy3 (Amersham Pharmacia Biotech Inc., Piscataway,
NJ) fluorochrome-conjugated monoclonal JB3 IgG anti-
bodies (Developmental Studies Hybridoma Bank, University
of Iowa, Iowa City, IA). Delivery of these nonperturbing
(Rongish et al., 1998) marker antibodies was accomplished
by injecting 25-nl volumes, one to four times per embryo,
at 1 ng/nl concentrations (Pico-Injector, Harvard Apparatus
Inc, Holliston, MA, mounted on a micromanipulator,
Narishige Scientific Instrument Lab, Tokyo, Japan).
Embryo culture
As detailed in Little and Drake (2000), quail embryos
(Coturnix coturnix japonica, John Smith Farms, Bucyrus,
KS) at Hamburger and Hamilton (HH) stages 4–5 were
encircled with paper rings that adhere to the embryo’s
vitelline membrane and then excised from the egg. After
removing the adherent yolk by washing with sterile embryo
phosphate-buffered saline (EPBS), the embryos are placed on
a solid agarose bed (5% agarose in EPBS) for microinjection.
After introduction of the antibodies, the embryos are
placed in a custom designed, microscope-attached incuba-
tion chamber (Czirok et al., 2002; Rupp et al., 2003). The
wells of a suitably modified Costar polystyrene 6 well plate
(Corning Inc., Corning, NY) are filled with 3 ml of CO2-
independent culture medium (Leibovitz-L15 medium sup-
plemented with 2 mM L-glutamine, 10% chicken serum, and
1% penicillin–streptomycin, GibcoBrl, Grand Island, NY)
in which a Millicell (Millipore Co., Bedford, MA) tissue
insert is placed. The plastic filter material of the insert was
replaced with a sparse array of polypropylene surgical
suture fibers (7–0 Surgipro, USSC, Norwalk, CT). Embryos
are cultured under sterile conditions, at the medium–air
interface, ventral side-up, with their vitelline membrane in
contact with the suture mesh. Their normal development
was established by the lack of morphological defects as well
as by the timely addition of somites and elongation of the
notochord (Rupp et al., 2003).
Microscopy and image processing
As described in detail in Czirok et al. (2002), an
automated Leica DMR upright microscope is used in DIC
and epifluorescence modes with a long working distance
10 � (0.25 NA) objective. Fields of 875 � 688 Am are
imaged with a cooled Quantix CCD camera (Photometrics,
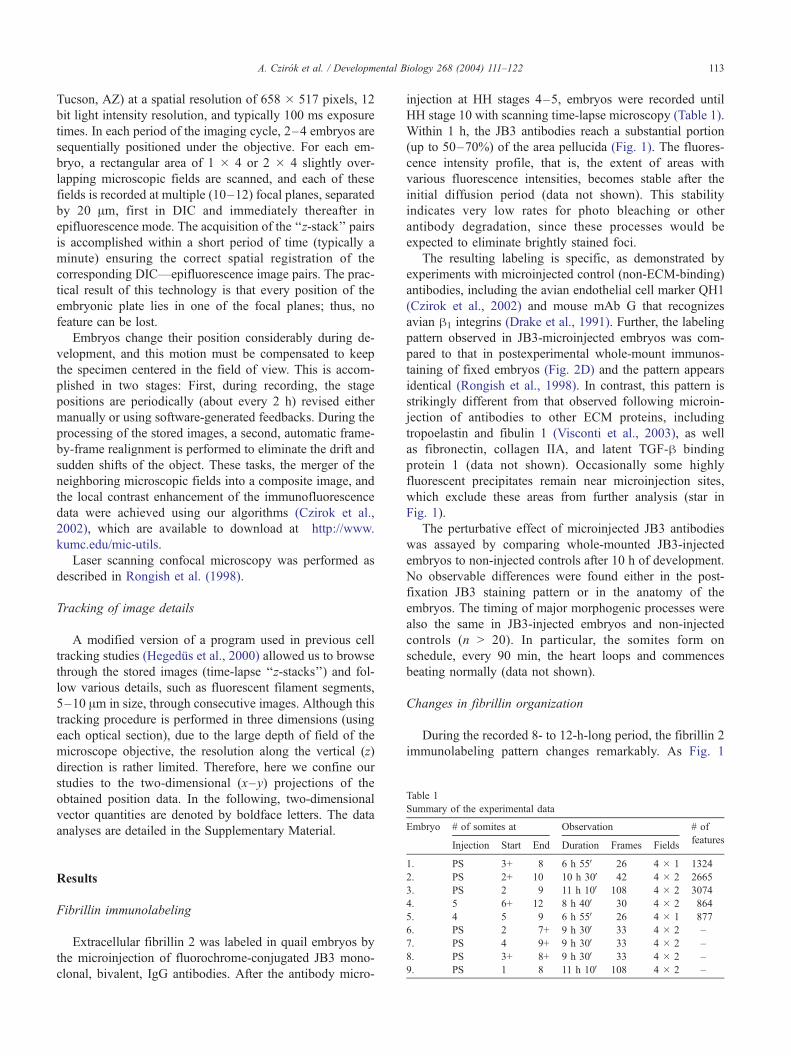
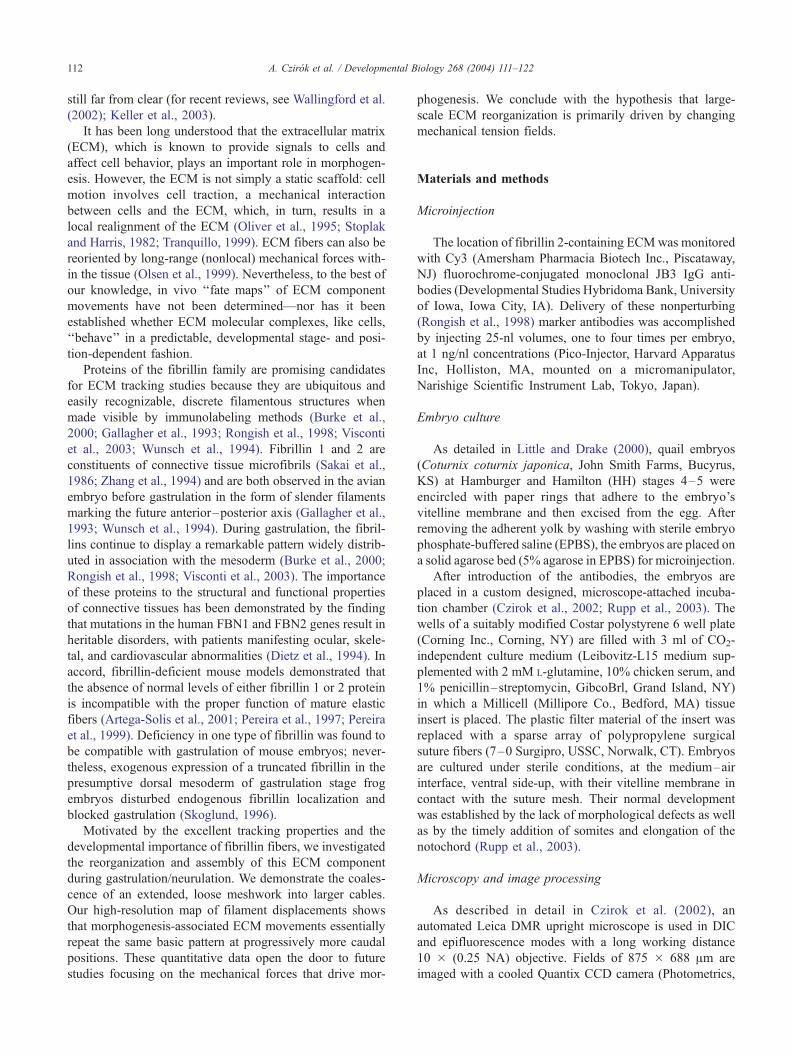
Table 1
Summary of the experimental data
Embryo # of somites at Observation # of
A. Czirok et al. / Developmental Biology 268 (2004) 111–122 113
Tucson, AZ) at a spatial resolution of 658 � 517 pixels, 12
bit light intensity resolution, and typically 100 ms exposure
times. In each period of the imaging cycle, 2–4 embryos are
sequentially positioned under the objective. For each em-
bryo, a rectangular area of 1 � 4 or 2 � 4 slightly over-
lapping microscopic fields are scanned, and each of these
fields is recorded at multiple (10–12) focal planes, separated
by 20 Am, first in DIC and immediately thereafter in
epifluorescence mode. The acquisition of the ‘‘z-stack’’ pairs
is accomplished within a short period of time (typically a
minute) ensuring the correct spatial registration of the
corresponding DIC—epifluorescence image pairs. The prac-
tical result of this technology is that every position of the
embryonic plate lies in one of the focal planes; thus, no
feature can be lost.
Embryos change their position considerably during de-
velopment, and this motion must be compensated to keep
the specimen centered in the field of view. This is accom-
plished in two stages: First, during recording, the stage
positions are periodically (about every 2 h) revised either
manually or using software-generated feedbacks. During the
processing of the stored images, a second, automatic frame-
by-frame realignment is performed to eliminate the drift and
sudden shifts of the object. These tasks, the merger of the
neighboring microscopic fields into a composite image, and
the local contrast enhancement of the immunofluorescence
data were achieved using our algorithms (Czirok et al.,
2002), which are available to download at http://www.
kumc.edu/mic-utils.
Laser scanning confocal microscopy was performed as
described in Rongish et al. (1998).
Tracking of image details
A modified version of a program used in previous cell
tracking studies (Hegedus et al., 2000) allowed us to browse
through the stored images (time-lapse ‘‘z-stacks’’) and fol-
low various details, such as fluorescent filament segments,
5–10 Am in size, through consecutive images. Although this
tracking procedure is performed in three dimensions (using
each optical section), due to the large depth of field of the
microscope objective, the resolution along the vertical (z)
direction is rather limited. Therefore, here we confine our
studies to the two-dimensional (x–y) projections of the
obtained position data. In the following, two-dimensional
vector quantities are denoted by boldface letters. The data
analyses are detailed in the Supplementary Material.
Injection Start End Duration Frames Fieldsfeatures
1. PS 3+ 8 6 h 55V 26 4 � 1 1324
2. PS 2+ 10 10 h 30V 42 4 � 2 2665
3. PS 2 9 11 h 10V 108 4 � 2 3074
4. 5 6+ 12 8 h 40V 30 4 � 2 864
5. 4 5 9 6 h 55V 26 4 � 1 877
6. PS 2 7+ 9 h 30V 33 4 � 2 –
7. PS 4 9+ 9 h 30V 33 4 � 2 –
8. PS 3+ 8+ 9 h 30V 33 4 � 2 –
9. PS 1 8 11 h 10V 108 4 � 2 –
Results
Fibrillin immunolabeling
Extracellular fibrillin 2 was labeled in quail embryos by
the microinjection of fluorochrome-conjugated JB3 mono-
clonal, bivalent, IgG antibodies. After the antibody micro-
injection at HH stages 4–5, embryos were recorded until
HH stage 10 with scanning time-lapse microscopy (Table 1).
Within 1 h, the JB3 antibodies reach a substantial portion
(up to 50–70%) of the area pellucida (Fig. 1). The fluores-
cence intensity profile, that is, the extent of areas with
various fluorescence intensities, becomes stable after the
initial diffusion period (data not shown). This stability
indicates very low rates for photo bleaching or other
antibody degradation, since these processes would be
expected to eliminate brightly stained foci.
The resulting labeling is specific, as demonstrated by
experiments with microinjected control (non-ECM-binding)
antibodies, including the avian endothelial cell marker QH1
(Czirok et al., 2002) and mouse mAb G that recognizes
avian h1 integrins (Drake et al., 1991). Further, the labeling
pattern observed in JB3-microinjected embryos was com-
pared to that in postexperimental whole-mount immunos-
taining of fixed embryos (Fig. 2D) and the pattern appears
identical (Rongish et al., 1998). In contrast, this pattern is
strikingly different from that observed following microin-
jection of antibodies to other ECM proteins, including
tropoelastin and fibulin 1 (Visconti et al., 2003), as well
as fibronectin, collagen IIA, and latent TGF-h binding
protein 1 (data not shown). Occasionally some highly
fluorescent precipitates remain near microinjection sites,
which exclude these areas from further analysis (star in
Fig. 1).
The perturbative effect of microinjected JB3 antibodies
was assayed by comparing whole-mounted JB3-injected
embryos to non-injected controls after 10 h of development.
No observable differences were found either in the post-
fixation JB3 staining pattern or in the anatomy of the
embryos. The timing of major morphogenic processes were
also the same in JB3-injected embryos and non-injected
controls (n > 20). In particular, the somites form on
schedule, every 90 min, the heart loops and commences
beating normally (data not shown).
Changes in fibrillin organization
During the recorded 8- to 12-h-long period, the fibrillin 2
immunolabeling pattern changes remarkably. As Fig. 1
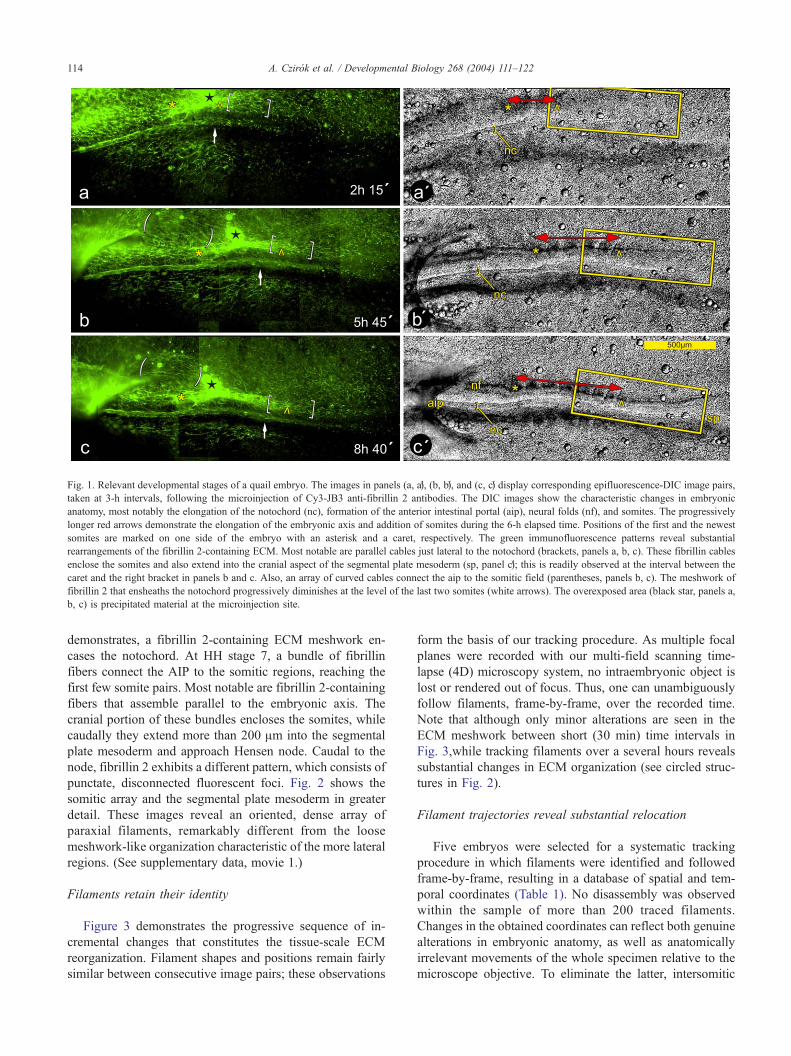
Fig. 1. Relevant developmental stages of a quail embryo. The images in panels (a, aV), (b, bV), and (c, cV) display corresponding epifluorescence-DIC image pairs,
taken at 3-h intervals, following the microinjection of Cy3-JB3 anti-fibrillin 2 antibodies. The DIC images show the characteristic changes in embryonic
anatomy, most notably the elongation of the notochord (nc), formation of the anterior intestinal portal (aip), neural folds (nf), and somites. The progressively
longer red arrows demonstrate the elongation of the embryonic axis and addition of somites during the 6-h elapsed time. Positions of the first and the newest
somites are marked on one side of the embryo with an asterisk and a caret, respectively. The green immunofluorescence patterns reveal substantial
rearrangements of the fibrillin 2-containing ECM. Most notable are parallel cables just lateral to the notochord (brackets, panels a, b, c). These fibrillin cables
enclose the somites and also extend into the cranial aspect of the segmental plate mesoderm (sp, panel cV); this is readily observed at the interval between the
caret and the right bracket in panels b and c. Also, an array of curved cables connect the aip to the somitic field (parentheses, panels b, c). The meshwork of
fibrillin 2 that ensheaths the notochord progressively diminishes at the level of the last two somites (white arrows). The overexposed area (black star, panels a,
b, c) is precipitated material at the microinjection site.
A. Czirok et al. / Developmental Biology 268 (2004) 111–122114
demonstrates, a fibrillin 2-containing ECM meshwork en-
cases the notochord. At HH stage 7, a bundle of fibrillin
fibers connect the AIP to the somitic regions, reaching the
first few somite pairs. Most notable are fibrillin 2-containing
fibers that assemble parallel to the embryonic axis. The
cranial portion of these bundles encloses the somites, while
caudally they extend more than 200 Am into the segmental
plate mesoderm and approach Hensen node. Caudal to the
node, fibrillin 2 exhibits a different pattern, which consists of
punctate, disconnected fluorescent foci. Fig. 2 shows the
somitic array and the segmental plate mesoderm in greater
detail. These images reveal an oriented, dense array of
paraxial filaments, remarkably different from the loose
meshwork-like organization characteristic of the more lateral
regions. (See supplementary data, movie 1.)
Filaments retain their identity
Figure 3 demonstrates the progressive sequence of in-
cremental changes that constitutes the tissue-scale ECM
reorganization. Filament shapes and positions remain fairly
similar between consecutive image pairs; these observations
form the basis of our tracking procedure. As multiple focal
planes were recorded with our multi-field scanning time-
lapse (4D) microscopy system, no intraembryonic object is
lost or rendered out of focus. Thus, one can unambiguously
follow filaments, frame-by-frame, over the recorded time.
Note that although only minor alterations are seen in the
ECM meshwork between short (30 min) time intervals in
Fig. 3,while tracking filaments over a several hours reveals
substantial changes in ECM organization (see circled struc-
tures in Fig. 2).
Filament trajectories reveal substantial relocation
Five embryos were selected for a systematic tracking
procedure in which filaments were identified and followed
frame-by-frame, resulting in a database of spatial and tem-
poral coordinates (Table 1). No disassembly was observed
within the sample of more than 200 traced filaments.
Changes in the obtained coordinates can reflect both genuine
alterations in embryonic anatomy, as well as anatomically
irrelevant movements of the whole specimen relative to the
microscope objective. To eliminate the latter, intersomitic
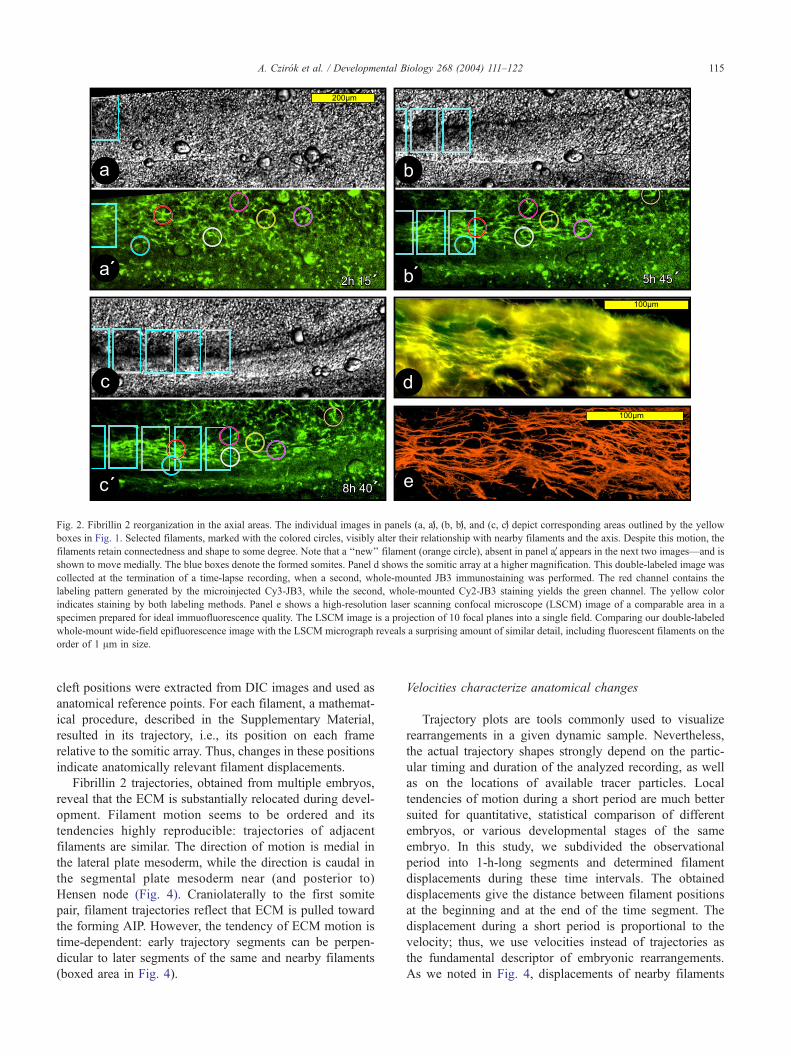
Fig. 2. Fibrillin 2 reorganization in the axial areas. The individual images in panels (a, aV), (b, bV), and (c, cV) depict corresponding areas outlined by the yellow
boxes in Fig. 1. Selected filaments, marked with the colored circles, visibly alter their relationship with nearby filaments and the axis. Despite this motion, the
filaments retain connectedness and shape to some degree. Note that a ‘‘new’’ filament (orange circle), absent in panel aV, appears in the next two images—and is
shown to move medially. The blue boxes denote the formed somites. Panel d shows the somitic array at a higher magnification. This double-labeled image was
collected at the termination of a time-lapse recording, when a second, whole-mounted JB3 immunostaining was performed. The red channel contains the
labeling pattern generated by the microinjected Cy3-JB3, while the second, whole-mounted Cy2-JB3 staining yields the green channel. The yellow color
indicates staining by both labeling methods. Panel e shows a high-resolution laser scanning confocal microscope (LSCM) image of a comparable area in a
specimen prepared for ideal immuofluorescence quality. The LSCM image is a projection of 10 focal planes into a single field. Comparing our double-labeled
whole-mount wide-field epifluorescence image with the LSCM micrograph reveals a surprising amount of similar detail, including fluorescent filaments on the
order of 1 Am in size.
A. Czirok et al. / Developmental Biology 268 (2004) 111–122 115
cleft positions were extracted from DIC images and used as
anatomical reference points. For each filament, a mathemat-
ical procedure, described in the Supplementary Material,
resulted in its trajectory, i.e., its position on each frame
relative to the somitic array. Thus, changes in these positions
indicate anatomically relevant filament displacements.
Fibrillin 2 trajectories, obtained from multiple embryos,
reveal that the ECM is substantially relocated during devel-
opment. Filament motion seems to be ordered and its
tendencies highly reproducible: trajectories of adjacent
filaments are similar. The direction of motion is medial in
the lateral plate mesoderm, while the direction is caudal in
the segmental plate mesoderm near (and posterior to)
Hensen node (Fig. 4). Craniolaterally to the first somite
pair, filament trajectories reflect that ECM is pulled toward
the forming AIP. However, the tendency of ECM motion is
time-dependent: early trajectory segments can be perpen-
dicular to later segments of the same and nearby filaments
(boxed area in Fig. 4).
Velocities characterize anatomical changes
Trajectory plots are tools commonly used to visualize
rearrangements in a given dynamic sample. Nevertheless,
the actual trajectory shapes strongly depend on the partic-
ular timing and duration of the analyzed recording, as well
as on the locations of available tracer particles. Local
tendencies of motion during a short period are much better
suited for quantitative, statistical comparison of different
embryos, or various developmental stages of the same
embryo. In this study, we subdivided the observational
period into 1-h-long segments and determined filament
displacements during these time intervals. The obtained
displacements give the distance between filament positions
at the beginning and at the end of the time segment. The
displacement during a short period is proportional to the
velocity; thus, we use velocities instead of trajectories as
the fundamental descriptor of embryonic rearrangements.
As we noted in Fig. 4, displacements of nearby filaments
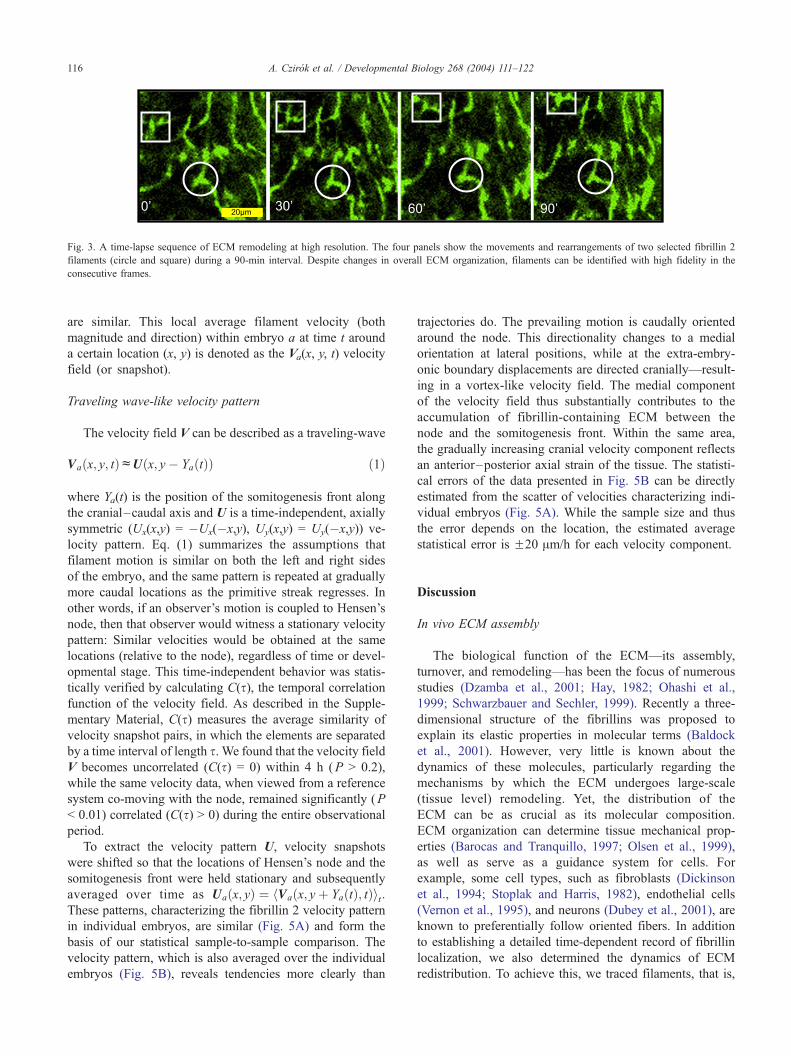
Fig. 3. A time-lapse sequence of ECM remodeling at high resolution. The four panels show the movements and rearrangements of two selected fibrillin 2
filaments (circle and square) during a 90-min interval. Despite changes in overall ECM organization, filaments can be identified with high fidelity in the
consecutive frames.
A. Czirok et al. / Developmental Biology 268 (2004) 111–122116
are similar. This local average filament velocity (both
magnitude and direction) within embryo a at time t around
a certain location (x, y) is denoted as the Va(x, y, t) velocity
field (or snapshot).
Traveling wave-like velocity pattern
The velocity field V can be described as a traveling-wave
Vaðx; y; tÞcUðx; y� YaðtÞÞ ð1Þ
where Ya(t) is the position of the somitogenesis front along
the cranial–caudal axis and U is a time-independent, axially
symmetric (Ux(x,y) = �Ux(�x,y), Uy(x,y) = Uy(�x,y)) ve-
locity pattern. Eq. (1) summarizes the assumptions that
filament motion is similar on both the left and right sides
of the embryo, and the same pattern is repeated at gradually
more caudal locations as the primitive streak regresses. In
other words, if an observer’s motion is coupled to Hensen’s
node, then that observer would witness a stationary velocity
pattern: Similar velocities would be obtained at the same
locations (relative to the node), regardless of time or devel-
opmental stage. This time-independent behavior was statis-
tically verified by calculating C(s), the temporal correlation
function of the velocity field. As described in the Supple-
mentary Material, C(s) measures the average similarity of
velocity snapshot pairs, in which the elements are separated
by a time interval of length s. We found that the velocity field
V becomes uncorrelated (C(s) = 0) within 4 h (P > 0.2),
while the same velocity data, when viewed from a reference
system co-moving with the node, remained significantly (P
< 0.01) correlated (C(s) > 0) during the entire observational
period.
To extract the velocity pattern U, velocity snapshots
were shifted so that the locations of Hensen’s node and the
somitogenesis front were held stationary and subsequently
averaged over time as Uaðx; yÞ ¼ hVaðx; yþ YaðtÞ; tÞit:These patterns, characterizing the fibrillin 2 velocity pattern
in individual embryos, are similar (Fig. 5A) and form the
basis of our statistical sample-to-sample comparison. The
velocity pattern, which is also averaged over the individual
embryos (Fig. 5B), reveals tendencies more clearly than
trajectories do. The prevailing motion is caudally oriented
around the node. This directionality changes to a medial
orientation at lateral positions, while at the extra-embry-
onic boundary displacements are directed cranially—result-
ing in a vortex-like velocity field. The medial component
of the velocity field thus substantially contributes to the
accumulation of fibrillin-containing ECM between the
node and the somitogenesis front. Within the same area,
the gradually increasing cranial velocity component reflects
an anterior–posterior axial strain of the tissue. The statisti-
cal errors of the data presented in Fig. 5B can be directly
estimated from the scatter of velocities characterizing indi-
vidual embryos (Fig. 5A). While the sample size and thus
the error depends on the location, the estimated average
statistical error is F20 Am/h for each velocity component.
Discussion
In vivo ECM assembly
The biological function of the ECM—its assembly,
turnover, and remodeling—has been the focus of numerous
studies (Dzamba et al., 2001; Hay, 1982; Ohashi et al.,
1999; Schwarzbauer and Sechler, 1999). Recently a three-
dimensional structure of the fibrillins was proposed to
explain its elastic properties in molecular terms (Baldock
et al., 2001). However, very little is known about the
dynamics of these molecules, particularly regarding the
mechanisms by which the ECM undergoes large-scale
(tissue level) remodeling. Yet, the distribution of the
ECM can be as crucial as its molecular composition.
ECM organization can determine tissue mechanical prop-
erties (Barocas and Tranquillo, 1997; Olsen et al., 1999),
as well as serve as a guidance system for cells. For
example, some cell types, such as fibroblasts (Dickinson
et al., 1994; Stoplak and Harris, 1982), endothelial cells
(Vernon et al., 1995), and neurons (Dubey et al., 2001), are
known to preferentially follow oriented fibers. In addition
to establishing a detailed time-dependent record of fibrillin
localization, we also determined the dynamics of ECM
redistribution. To achieve this, we traced filaments, that is,

A. Czirok et al. / Developmental Biology 268 (2004) 111–122 117
certain identifiable segments within the immunolabeled
network. Although the ultrastructure of the early ECM is
not yet determined at early developmental stages, it is
highly likely that filaments are composed of multiple ECM
molecules (Visconti et al., 2003). Because filaments retain
their shape between consecutive frames, position changes
were interpreted as physical displacements of intact objects
rather than as a process involving filament disassembly
followed by reassembly and antibody reattachment. If
disassembly–reassembly were occurring, that would be
manifested as the visible, frequent disappearance of entire
filaments; however, this was never observed. Moreover,
the finding that displacements of adjacent filaments are
similar suggests that filaments are embedded in a visco-
elastic continuum (most likely including attached cells),
rather than existing as free-moving or quickly disconnect-
ing and reconnecting polymers.
Fibrillin 2 in somitogenesis
Our data show that the fibrillin-containing ECM is
substantially reorganized during development. Among the
observed processes, the formation of fibrillin bundles in
the somitic and pre-somitic mesoderm is of special interest.
These fibers delineate existing and future somites and may
contribute to the integrity of the somitic array by providing
a suitable anchoring mechanism. Since somites are sur-
rounded by an acellular ECM, such a scaffold is likely to
be required before the physical separation of the cells from
the pre-somatic mesoderm and at the intersomitic clefts.
The spatial and temporal pattern of fibrillin 2 localization
is thus fully compatible with a presumptive scaffolding
role.
The condensation of fibrillin-containing bundles in the
medial segmental plate mesoderm is also an unsuspected
process of pattern formation: The demarcation between the
axial cables and the less organized lateral meshwork is
fuzzy and does not coincide with preexisting anatomical
structures. Moreover, a substantial portion of fiber compo-
nents are not secreted locally, but collected from a large
area (Fig. 2). This is in contrast, for example, with the
ECM ensheathment of the notochord, where the creation of
the notochord boundary clearly precedes the gradual ac-
Fig. 4. Trajectories of fibrillin filaments and reference points. Eighty
filaments were selected randomly in the embryo shown in Fig. 1, and their
respective trajectories plotted with colored lines. Each color represents
positions within 2-h-long time intervals: red denotes the original position of
each filament (at frame 1), followed by orange, green, cyan, and blue
positions, respectively. Concurrent trajectories of the spatial reference
system, the intersomitic clefts, are plotted with cyan lines (e.g., white
circle). The DIC image, upon which the trajectory lines are superimposed,
shows the embryo at an intermediate time point, taken 4 h after the start of
the observation. The motion of the filaments within the lateral plate
mesoderm (bracket) is strongly medialward. In contrast, filament tra-
jectories near Hensen’s node show a caudalward directional bias (asterisk).
Between these two regions, the filament trajectories gradually change from
medialward to caudalward. This is in distinct contrast to the displacements
of the intersomitic clefts or reference points that are typically very small—
an indication that the intersomitic clefts are well suited to serve as an
anatomical reference system. The yellow box encloses an area in which
early (red) fibrillin trajectory segments are perpendicular to later (blue)
trajectory segments. Thus, the prevalent directionality of a fibrillin 2
filament can be highly time-dependent at one region (yellow box), while
very little change in directionality is exhibited at positions caudal to
Hensen’s node (asterisk). These data demonstrate that fibrillin filaments are
not moving in lockstep; rather, the trajectories appear as a part of a swirl-
like pattern (see Fig. 5).

Fig. 5. Experimentally derived velocity patterns of fibrillin 2. Locally averaged velocities of Cy3-labeled fibrillin filaments are plotted at grid-points of a square
mesh. For each grid-point, velocities are represented by scale bars giving the local average displacement in 1 h. The vertical and horizontal yellow lines show
the positions of the embryonic axis and the somitogenesis front, respectively. Small and large red circles indicate the somitic array and Hensen’s node. The
velocity patterns characterizing five individual embryos are superimposed in panel a; thus, at each grid-point, the different scale bars represent velocity data
obtained in different embryos. The green box delineates an area, where most grid-points contain data from at least two embryos. For each grid-point, the
average of the various velocities was calculated and plotted in panel b. The blue arrow depicts the prevailing filament motion lateral to the node.
A. Czirok et al. / Developmental Biology 268 (2004) 111–122118
cumulation of the fibrillin-containing meshwork (see Figs.
1 and 2; supplementary data movies 1 and 2). Thus, in the
latter case, tissue boundaries can direct a local ECM
accumulation. In accord with this assumption, we found
no evidence of fibrillin 2-containing filaments being trans-
ported to the notochord from distant sites.

ntal Biology 268 (2004) 111–122 119
Cranial–caudal developmental gradient is reflected in the
traveling velocity pattern
The similarities between a caudal region of an older
embryo and a corresponding cranial part of a younger
embryo underlies the hypothesis that the velocity field
reiterates a basic pattern at progressively more caudal loca-
tions—following the regression of the primitive streak. Since
the distance between the newest somite and Hensen node is
stable during these developmental stages, we chose to follow
the somitogenesis front as a positional indicator that moves
in concert with this cranial–caudal developmental gradient.
Our observations are confined to the caudal region of the
embryo, between HH stages 5 and 10. Later, or concomitant
but more cranial events of ECM remodeling are further
complicated by additional morphogenetic processes. An
important example of these is vasculogenesis, since fibrillin
fibers incorporate into, and appear to delineate the devel-
A. Czirok et al. / Developme
Fig. 6. The conjectured interdependence of ECM and mesodermal cell motion. In a
relative to the surrounding ECM (including fibrillin 2), while the ECM was also
summarized in Eq. (1). The simulation was two-dimensional; only anterior–po
populations were followed—three groups on each side of the axis (panel a). The d
(yellow arrow) of the involuting mesodermal cells at a position along the anterior
assumed to move laterally with a constant speed of 25 Am/h (yellow arrow). The em
these assumptions and empirical data, the computer simulation yielded a patterned
as black dots. Thus, the combination of lateral cell locomotion and a caudalward p
fates described in Fig. 12 of Schoenwolf et al. (1992) and Fig. 7 of Psychoyos an
node, respectively, while the red lines indicate the notochordal axis.
oping vascular network (not shown). Moreover, as Hensen’s
node approaches the caudal boundary of the area opaca, its
linear motion slowly diminishes (Spratt, 1946, 1947).
Therefore, we do not expect our scheme of an evenly
shifting velocity pattern to hold for later stages (above HH
13). While the scope of the present investigation is limited
to stages and locations in which early axis patterning is
occurring, our method of visualization, tracking, and quan-
tifying the motion of ECM filaments should be useful in
studies of other, perhaps more complex, morphogenic
processes (as evidenced by the data obtained from regions
of AIP regression and bilateral heart tube fusion).
Forces that shape the embryo
Several investigators have drawn attention to the impor-
tance of physical forces in the shaping of an embryo (Oster et
al., 1983; Trinkaus, 1984). This conceptual framework
computer simulation, cells were assumed to engage in autonomous motility
assumed to move—according to the experimentally obtained velocity field
sterior and lateral–medial movements were considered. Six distinct cell
rawing in panel b, modified from Hay (1982), indicates the postulated path
–posterior axis, denoted by the blue line in panel a. In particular, cells were
pirically determined ECM motion is indicated by red arrows. As a result of
array of cells dispersed along the anterior–posterior axis, depicted in panel
assive motion can result in a pattern that bears a striking resemblance to cell
d Stern (1996). The red circles in panel a denote the somites and Hensen’s
A. Czirok et al. / Developmental Biology 268 (2004) 111–122120
asserts that (1) as tissues are physical objects, their deforma-
tion inevitably involves mechanical forces. (2) The relevant
forces are exerted internally within the embryo by cells.
Morphogenetic movements are thus determined by the inter-
play between the spatio-temporal pattern of exerted forces
and the mechanical properties of the responding tissues.
Recently, viscoelastic parameters of embryonic cell aggre-
gates were established (Forgacs et al., 1998) and gastrulation
movements of sea urchin embryos have been analyzed using
viscoelastic models (Davidson et al., 1995, 1999; Drasdo and
Forgacs, 2000). These latter studies also shed light on the
crucial role of the ECM in the mechanics of gastrulation.
Mechanical tension fields within the avian embryo are also
thought to play a significant role during avian gastrulation
and axial morphogenesis. It has been postulated that at very
early stages, the tension generated by epiboly, the expansion
of the embryonic plate (epiblast) on the vitelline membrane,
is partially responsible for the elongation of the primitive
streak (reviewed in Stern and Canning, 1988; Trinkaus,
1984). Although no stress or strain data are available yet
for avian embryo development, such experiments were
carried out in Xenopus embryos (Moore et al., 1995).
Unlike cells, ECM components cannot move themselves;
thus, they are ideal ‘‘passive tracers’’ of tissue movements.
Although cells are known to reorganize matrix molecules on
their surface, displacements exceeding 100 Am clearly
cannot be generated in that manner. Thus, we propose that
(1) the observed displacements reflect—at least partially—
large-scale tissue movements driven by mechanical forces,
(2) an existing ECM structure can be substantially reorgan-
ized by a mechanical tension-driven meshwork-to-cable
transition, and (3) formation of these structures is strongly
dependent not only on local cellular activity, but also on the
global developmental movements of the embryo. Based on
the nonspecificity of mechanically transduced effects, we
expect that fibrillin 2 is not unique and that other ECM
constituents exhibit similar behaviors. Further experiments
are underway to test these conjectures directly.
Although our results conclude with the determination of
a velocity field that characterizes the nodal region of an
avian embryo, we expect that these data will eventually be
used to estimate the distribution and origin of the forces
acting on the embryonic plate. A similar approach was
recently applied to determine the traction forces of cells
embedded in collagen gels (Vanni et al., 2001). In our case,
however, the viscoelastic properties of the tissue are more
complex than those of a collagen gel undergoing small
deformations, and the full determination of the stress field
requires knowledge about all three components of the
velocities (Helmke and Davies, 2002).
Gastrulating cells are conjectured to move relative to the
surrounding ECM
Embryonic cells can be rearranged by at least two
different means. Cells can actively migrate relative to their
local environment, or large-scale tissue movements can
passively transport them. For example, heart looping clearly
involves tissue deformations that move cells—relative to the
somites, but also relative to each other (Voronov and Taber,
2002). These active and passive modes of relocation are not
mutually exclusive; in fact, both are expected to shape the
embryo.
Our data inevitably raise the question about the possible
relation between the studied ECM motion and the reported
features of mesodermal cell migration (Psychoyos and
Stern, 1996; Schoenwolf et al., 1992). Based on the idea
of superimposing the ECM and cell movements, we
employed a computer simulation to model the lateral
spreading of mesodermal cells (Fig. 6). In this hypothetical
model, (a) the traced cell population is ingressing contin-
uously along the primitive streak, (b) the ingression is
followed by a steady, laterally directed active movement
relative to the surrounding ECM, (c) the ECM moves
according to the experimentally obtained pattern, summa-
rized in Eq. (1). In Fig. 6, a subset of the cells is visualized
as being both carried along with and moving relative to the
ECM environment. Although we assumed a uniform
locomotory activity, the combination of the lateral migra-
tion of the cells together with the experimentally deter-
mined nonuniform motion of the ECM results in a pattern
recapitulating the experimental findings of Schoenwolf et
al. (1992) and Psychoyos and Stern (1996). The validity of
this picture needs to be established by comparing time-
resolved experimental data on concurrent cell and ECM
movements.
Systems approach
It has been evident for decades that morphogenesis
involves an interplay of physical forces, cell behavior, and
genetic regulation. Unfortunately, models encompassing
pertinent developmental complexities are difficult to develop
due to the paucity of nongenetic quantitative experimental
data. Recent advances in optical microscopy, image process-
ing, and computing power have extended the scope of time-
lapse investigations into the quantitative realm. One resulting
advantage is the ability to characterize developmental pro-
cesses with higher precision than earlier fate mapping
methods. These precise quantitative data can be used to
construct and test numerical models. Such models, used as
part of a ‘‘systems’’ or integrative approach (Hove et al.,
2003; Noble, 2002), will permit a new level of understanding
of cell, tissue, and ECM dynamics during morphogenesis.
Acknowledgments
We are grateful to Adrienn Gabor, Erica Perryn, and Paul
Rupp for their valuable help in this project. We thank Tom
Skalak (UVa) for critical comments on the manuscript. This
work was supported by awards of NSF (NATO-NSF DGE-

A. Czirok et al. / Developmental Biology 268 (2004) 111–122 121
0075179, to A.C.), the Institutional Biomedical Research
Training Program of KUMC (to A.C.), the Hungarian
Research Fund (OTKA T034995, to A.C.), the Heartland
Affiliate of the American Heart Association (0160369Z, to
B.J.R.), the Mathers Charitable Foundation (to C.D.L.), and
NIH (5P01 HL58213-08, to C.D.L.; 1R01 HL73700 to
B.J.R.). The JB3 antibody was obtained from the devel-
opmental studies Hybridoma Bank at the Univ. of Iowa.
References
Artega-Solis, E., Gayraud, B., Lee, S., Shum, L., Sakai, L., Ramirez, F.,
2001. Regulation of limb patterning by extracellular microfibrils. J. Cell
Biol. 154, 275–281.
Baldock, C., Koster, A., Ziese, U., Rock, M., Sherratt, M., Kadler, K.,
Shuttleworth, C., Kielty, C., 2001. The supramolecular organization
of fibrillin-rich microfibrils. J. Cell Biol. 152 (5), 1045–1056.
Barocas, V., Tranquillo, R., 1997. An anisotropic biphasic theory of tissue-
equivalent mechanics: the interplay among cell traction, fibrillar net-
work deformation, fibril alignment, and cell contact guidance. J. Bio-
mech. Eng. 119 (2), 137–145.
Bortier, H., Vakaet, L., 1992. Fate mapping the neural plate and the intra-
embryonic mesoblast in the upper layer of the chicken blastoderm with
xenografting and time-lapse videography. Development, 93–97
(Suppl.).
Burke, R., Wang, D., Mark, S., Martens, G., 2000. Distribution of fibrillin I
in extracellular matrix and epithelia during early development of avian
embryos. Anat. Embryol. (Berlin) 201, 317–326.
Catala, M., Teillet, M.-A., De-Robertis, E., Le-Douarin, N., 1996. A spinal
cord fate map in the avian embryo: while regressing, Hensen’s node
lays down the notochord and floor plate thus joining the spinal cord
lateral walls. Development 122, 2599–2610.
Czirok, A., Rupp, P., Rongish, B., Little, C., 2002. Multi-field 3D
scanning light microscopy of early embryogenesis. J. Microsc. 206,
209–217.
Davidson, L., Koehl, M., Keller, R., Oster, G., 1995. How do sea urchins
invaginate? Using biomechanics to distinguish between mechanisms of
primary invagination. Development 121, 2005–2018.
Davidson, L., Oster, G., Keller, R., Koehl, M., 1999. Measurements of
mechanical properties of the blastula wall reveal which hypothe-
sized mechanisms of primary invagination are physically plausible
in the sea urchin Strongylocentrotus purpuratus. Dev. Biol. 209,
221–238.
Dickinson, R., Guido, S., Tranquillo, R., 1994. Biased cell migration of
fibroblasts exhibiting contact guidance in oriented collagen gels. Ann.
Biomed. Eng. 22 (4), 342–356.
Dietz, H., Ramirez, F., Sakai, L., 1994. Marfan syndrome and other micro-
fibrillar diseases. Adv. Hum. Genet. 22, 153–186.
Drake, C., Davis, L., Hungerford, J., Little, C., 1991. Perturbation of beta1
integrin-mediated adhesions results in altered somite cell shape and
behavior. Dev. Biol. 149, 327–338.
Drasdo, D., Forgacs, G., 2000. Modeling the interplay of generic and
genetic mechanisms in cleavage, blastulation, and gastrulation. Dev.
Dyn. 219 (2), 182–191.
Dubey, N., Letourneau, P., Tranquillo, R., 2001. Neuronal contact guidance
in magnetically aligned fibrin gels: effect of variation in gel mechano-
structural properties. Biomaterials 22 (10), 1065–1075.
Dzamba, B., Keene, D., Isogai, Z., Charbonneau, N., Karaman-Jurukovska,
N., Simon, M., Sakai, L., 2001. Assembly of epithelial cell fibrillins.
J. Invest. Dermatol. 117, 1612–1620.
Forgacs, G., Foty, R., Shafrir, Y., Steinberg, M., 1998. Viscoelastic
properties of living tissues: a quantitative study. Biophys. J. 74,
2227–2234.
Gallagher, B., Sakai, L., Little, C., 1993. Fibrillin delineates the primary
axis of the early avian embryo. Dev. Dyn. 196, 70–78.
Hamburger, V., Hamilton, H., 1951. A series of normal stages in the devel-
opment of the chick embryo. J. Morphol. 88, 49–92.
Hay, E. (Ed.), 1981. Cell Biology of Extracellular Matrix. Plenum, New
York, pp. 1–417.
Hegedus, B., Czirok, A., Fazekas, I., Babel, T., Madarasz, E., Vicsek, T.,
2000. Locomotion and proliferation of glioblastoma cells in vitro: stat-
istical evaluation of videomicroscopic observations. J. Neurosurg. 92,
428–434.
Helmke, B., Davies, P., 2002. The cytoskeleton under external fluid me-
chanical forces: hemodynamic forces acting on the endothelium. Ann.
Biomed. Eng. 30 (3), 284–296.
Hove, J., Koster, R., Forouhar, A., Acevedo-Bolton, G., Fraser, S., Gharib,
M., 2003. Intracardiac fluid forces are an essential epigenetic factor for
embryonic cardiogenesis. Nature 421, 172–177.
Keller, R., Davidson, L.A., Shook, D.R., 2003. How we are shaped: the
biomechanics of gastrulation. Differentiation 71, 171–205.
Little, C., Drake, C., 2000. Whole-mount immunolabeling of embryos by
microinjection. Methods Mol. Biol. 135, 183–189.
Moore, S., Keller, R., Koehl, M., 1995. The dorsal involuting marginal
zone stiffens anisotropically during its convergent extension in the gas-
trula of xenopus laevis. Development 121, 3131–3140.
Noble, D., 2002. Modeling the heart—from genes to cells to the whole
organ. Science 295, 1678–1682.
Ohashi, T., Kiehart, D., Erickson, H., 1999. Dynamics and elasticity of
the fibronectin matrix in living cell culture visualized by fibronectin-
green fluorescent protein. Proc. Natl. Acad. Sci. U. S. A. 96 (5),
2153–2158.
Oliver, T., Dembo, M., Jacobson, K., 1995. Traction forces in locomoting
cells. Cell Motil. Cytoskeleton 31 (3), 225–240.
Olsen, L., Maini, P., Sherratt, J., Dallon, J., 1999. Mathematical model-
ling of anisotropy in fibrous connective tissue. Math. Biosci. 158,
145–170.
Oster, G., Murray, J., Harris, A., 1983. Mechanical aspects of mesenchymal
morphogenesis. J. Embryol. Exp. Morphol. 78, 83–125.
Pereira, L., Andrikopoulos, K., Tian, J., Lee, S., Keene, D., Ono, R.,
Reinhardt, D., Sakai, L., Biery, N., Bunton, T., Dietz, H., Ramirez,
F., 1997. Targeting of the gene encoding fibrillin-1 recapitulates the
vascular aspect of Marfan syndrome. Nat. Genet. 17, 218–222.
Pereira, L., Lee, S., Gayraud, B., Andrikopoulos, K., Shapiro, S., Bunton,
T., Biery, N., Dietz, H., Sakai, L., Ramirez, F., 1999. Pathogenic se-
quence for aneurysm revealed in mice underexpressing fibrillin-1. Proc.
Natl. Acad. Sci. 96, 3819–3823.
Psychoyos, D., Stern, C., 1996. Fates and migratory routes of prim-
itive streak cells in the chick embryo. Development 122 (5),
1523–1534.
Rongish, B., Drake, C., Argraves, W., Little, C., 1998. Identification of the
developmental marker, JB3-antigen, as fibrillin-2 and its de novo organ-
ization into embryonic microfibrous arrays. Dev. Dyn. 212, 461–471.
Rupp, P., Rongish, B., Czirok, A., Little, C., 2003. Culturing of avian
embryos for time-lapse imaging. Biotechniques 34, 274–278.
Sakai, L., Keene, D., Engvall, E., 1986. Fibrillin, a new 350-kD glycopro-
tein, is a component of extracellular microfibrils. J. Cell Biol. 103,
2499–2509.
Sawada, K., Aoyama, H., 1999. Fate maps of the primitive streak in
chick and quail embryo: ingression timing of progenitor cells of
each rostro-caudal axial level of somites. Int. J. Dev. Biol. 43 (8),
809–815.
Schoenwolf, G., Garcia-Martinez, V., Dias, M., 1992. Mesoderm move-
ment and fate during avian gastrulation and neurulation. Dev. Dyn. 193,
235–248.
Schwarzbauer, J., Sechler, J., 1999. Fibronectin fibrillogenesis: a para-
digm for extracellular matrix assembly. Curr. Opin. Cell Biol. 11 (5),
622–627.
Skoglund, P., 1996. The role of Xenopus fibrillin in the early embryo: clues
from a dominant negative approach. PhD thesis, UCSD, San Diego.

A. Czirok et al. / Developmental Biology 268 (2004) 111–122122
Spratt, N., 1946. Formation of the primitive streak in the explanted chick
blastoderm marked with carbon particles. J. Exp. Zool. 128, 121–163.
Spratt, N., 1947. Regression and shortening of the primitive streak in the
explanted chick blastoderm. J. Exp. Zool. 104, 69–100.
Stern, C., Canning, D., 1988. Gastrulation in birds: a model system for the
study of animal morphogenesis. Experientia 44 (8), 651–657.
Stoplak, D., Harris, A., 1982. Connective tissue morphogenesis by fibro-
blast traction. Dev. Biol. 90, 383–398.
Tranquillo, R., 1999. Self-organization of tissue-equivalents: the nature and
role of contact guidance. Biochem. Soc. Symp. 65, 27–42.
Trinkaus, J., 1984. Cells into Organs. The Forces That Shape the Embryo,
second ed. Prentice-Hall Inc, Englewood Cliffs, NJ.
Vanni, G.S., Lagerholm, B.C., Otey, C., Lanni, F., 2001. Fibroblast con-
tractility and mechanics in a model extracellular matrix. Mol. Biol. Cell
12, 171a.
Vernon, R., Lara, S., Drake, C., Iruela-Arispe, M., Angello, J., Little, C.,
Wight, T., Sage, E., 1995. Organized type I collagen influences endo-
thelial patterns during ‘‘spontaneous angiogenesis in vitro’’: planar cul-
tures as models of vascular development. In Vitro Cell. Dev. Biol.:
Anim. 31 (3), 120–131.
Visconti, R., Barth, J., Keeley, F., Little, C., 2003. Elastin and
related fibrillar proteins in early development. Matrix Biol. 22,
109–121.
Voronov, D., Taber, L., 2002. Cardiac looping in experimental conditions:
effects of extraembryonic forces. Dev. Dyn. 224, 413–421.
Wallingford, J., Fraser, S., Harland, R., 2002. Convergent extension: the
molecular control of polarized cell movement during embryonic devel-
opment. Dev. Cell 2 (6), 695–706.
Wunsch, A., Little, C., Markwald, R., 1994. Cardiac endothelial hetero-
geneity defines valvular development as demonstrated by the diverse
expression of JB3, an antigen of the endocardial cushion tissue. Dev.
Biol. 165, 585–601.
Yang, X., Dormann, D., Munsterberg, A., Weijer, C., 2002. Cell move-
ment patterns during gastrulation in the chick are controlled by positive
and negative chemotaxis mediated by FGF4 and FGF8. Dev. Cell 3,
425–437.
Zhang, H., Apfelroth, S., Hu, W., Davis, E., Sanguineti, C., Bonadio, J.,
Mecham, R., Ramirez, F., 1994. Structure and expression of fibrillin-2,
a novel microfibrillar component preferentially located in elastic
matrices. J. Cell Biol. 124 (5), 855–863.