Embed Size (px)
Citation preview

Democracy at work:
THE ONTARIO CITIZENS’ASSEMBLYONELECTORALREFORM
Extract from
a record of Ontario’sfirst citizens’ assembly processthe Ontario Citizens’
Assembly Secretariat


P A R T I V :DESCRIPTION OF THE ONTARIO CITIZENS’ ASSEMBLY’S MIXED
MEMBER PROPORTIONAL SYSTEM

57 The Ontario legislature currently has 103 seats. Beginning with the next election on October 10, 2007, there will be 107 seats. Please visitElections Ontario’s website for more information on electoral districts: www.electionsontario.on.ca.
Democracy at Work: THE ONTARIO CITIZENS’ ASSEMBLY ON ELECTORAL REFORM 144
PART IV: DESCRIPTION OF THE ONTARIO CITIZENS’ ASSEMBLY’S MIXED MEMBER PROPORTIONAL SYSTEM
[ Learn about the new electoral system theCitizens’ Assembly designed and recommendedfor Ontario. ]
This chapter complements the Assembly’s report, One Ballot, Two Votes: A New Way to Vote in Ontario. It provides a more in-depth description of the Mixed Member Proportional (MMP) electoral system recommended by the Assembly, and comparesthe system with MMP systems used in other jurisdictions.
O V E R V I E W O F T H E A S S E M B L Y ’ S M I X E D M E M B E R P R O P O R T I O N A L S Y S T E M
This section is excerpted from the Assembly’s report, “One Ballot, Two Votes: A New Way to Vote in Ontario.”
Key Features of the System
• Voters get two votes on a single ballot – one for a local candidate and a second one for a party. [See page 152 for a sample ballot.]
• Election results are proportional: The share of seats in the legislature that each party wins is roughly equal to itsshare of the party vote. For example, if a party receives 25% of the vote, it wins about 25% of the seats in the legislature. In Ontario’s current system, Single Member Plurality (also called “First Past the Post”), a party can winmany votes, yet end up having few seats or no seats.
• The new system retains strong local representation through 90 local members. Local members are elected in thesame way they are now. The candidate who wins the most votes represents the electoral district.
• Thirty-nine members (called “list members”) are elected province-wide through the party vote side of the ballot.These members provide all Ontarians with a new kind of representation. For example, list members will complementthe work of local members on issues that may affect a region or the whole province.
• Local members and list members together make up 129 seats in the legislature. By adding a total of 22 seats57, thenew system achieves proportionality and provides more representation for Ontario’s population, which has grown byabout 1.4 million since the 1996 Census of Population was taken. At 129 seats, the legislature will be close to thesize it was from 1987 to 1999, when it had 130 seats. Ontario will still have fewer representatives for its populationthan any other province or territory in Canada.
A record of the process for Ontario’s first citizens’ assembly 145
PART IV: DESCRIPTION OF THE ONTARIO CITIZENS’ ASSEMBLY’S MIXED MEMBER PROPORTIONAL SYSTEM
How the System Works
• Each party nominates its local candidates (as now), as well as a list of candidates for the whole province in the orderthat it wants them to be elected. Before the election, parties must submit their lists, and the details of the processthey used to create them, to Elections Ontario.
Elections Ontario will publish this information widely, so voters will know who is on a list before they vote for aparty. Voters will be able to assess whether a party created its list in a fair and transparent way. Voters will also beable to see whether a party’s list has a good balance of men and women, includes candidates from all of Ontario’sregions, and reflects the diversity of Ontario’s population.
• Voters vote for a local candidate and for a party. The party vote determines the share of seats a party wins in the legislature.
• If a party doesn’t have enough local members elected to match its share of the party vote, it gets a “top-up” of seatsin the legislature. These seats are filled by list members elected by voters across the province through the party sideof the ballot. The list seats are used to compensate for lack of proportionality in the election of local members.
For example, imagine a legislature with 100 seats. If a party receives 25% of the party vote, it is entitled to about 25 seats. If it elects only 20 local members, the top 5 members from its list are elected to bring its total share ofseats in the legislature up to 25%.
• A party must have clear support – at least 3% of the party vote across the province – for candidates from its list to be elected to the legislature.

Democracy at Work: THE ONTARIO CITIZENS’ ASSEMBLY ON ELECTORAL REFORM 146
PART IV: DESCRIPTION OF THE ONTARIO CITIZENS’ ASSEMBLY’S MIXED MEMBER PROPORTIONAL SYSTEM
Table 26 | The Citizens’ Assembly’s Mixed Member Proportional System
M I X E D M E M B E R P R O P O R T I O N A L S Y S T E M S I N O T H E R J U R I S D I C T I O N S
The MMP system originated in 1949, in the former West Germany, and has been used in Germany to elect national and almostall sub-national governments since then. In 1993, New Zealanders voted in a referendum to replace their Single MemberPlurality system with MMP. New Zealand has used MMP to elect representatives to its parliament since 1996.
In the United Kingdom, Scotland and Wales have both used an MMP system since 1999. MMP is also used in a numberof other jurisdictions, including Bolivia and Venezuela.
There is diversity in the MMP systems used around the world. This chapter draws primarily on examples from Germany,New Zealand, Scotland, and Wales. As the first country to adopt MMP, Germany has been studied extensively by electoral systemexperts. The case of New Zealand is of particular relevance to Ontario because the country changed from a Single Member Pluralitysystem to an MMP system. Like Ontario, New Zealand has a Westminster parliamentary system and a unicameral legislature (a legislature consisting of one house). The experiences in Scotland and Wales are also relevant to Ontario because they aresub-national jurisdictions that have recently adopted MMP systems.
B A S I C S T R U C T U R E O F M M P
An MMP system combines local representation with proportionality. It provides local representation through single-member districts, like those in Single Member Plurality systems. It also ensures proportionality through a multi-member list tier, which is used to compensate parties for disproportional results produced by elections in the single-member districts.
Number of Local Districts:90
Number of List Seats:39
Total Number of Seats:129
Local Vote:Plurality
Ratio of Local to List Seats:70:30
Structure of List Tier:Province-wide
Type of List:Closed
List Creation:Transparent process
Number of Votes on Ballot:Two
Dual Candidacy:Optional
Overhangs:Balance seats not permitted
Legal Threshold:3% of party vote
Formula:Hare
Local Seat Vacancies:By-election
List Vacancies:Next on list

58 Federal Electoral Boundaries Commission for Ontario, Commission’s Proposals (Ottawa: Elections Canada, 2003).
A record of the process for Ontario’s first citizens’ assembly 147
PART IV: DESCRIPTION OF THE ONTARIO CITIZENS’ ASSEMBLY’S MIXED MEMBER PROPORTIONAL SYSTEM
MMP systems vary in the number of single-member districts and the number of list or compensatory seats. These numbersdetermine the ratio of local seats to list seats and the total number of seats in the legislature.
The Assembly’s MMP system comprises 90 single-member districts or local seats (70% of the legislature) and 39 province-widelist seats (30% of the legislature), for a total of 129 seats.
Local Seats
Like almost all MMP systems in the world, the Assembly’s system uses the Single Member Plurality system (Ontario’s currentsystem) to fill its 90 local seats. Local candidates are nominated by parties or run as independents. The votes are counted ineach electoral district and the candidate with the most votes is elected. The winner needs more votes than other candidates,but does not need to receive a majority (50% +1) of the votes. The winning candidate represents the district in the legislature.
Electoral District Boundaries
If Ontario adopts an MMP system, the province’s electoral district boundaries would change. An Ontario boundaries commissionwould have to be established to redraw the boundaries for the 90 local districts. A boundaries commission is a non-partisanbody, usually made up of a chairperson and a small number of experts.
In undertaking their work, boundaries commissions are typically instructed to respect the principle of “representation by population.” This is the principle that each vote, in each electoral district, should carry equal weight. In order to achieve this, boundaries commissions establish a “quotient.” A quotient is the average population of an electoral district, calculated by dividing the total population of the province by the number of electoral districts. Once the quotient is established, boundariescommissions attempt to ensure that the population of each district is as close to the quotient as possible.
Using the current population of Ontario, the quotient for the Assembly’s local districts would be about 135,100 people:
12,160,000 Ontarians ÷ 90 = 135,100
It is a recognized principle that exact representation by population is not always appropriate. For example, the most recentFederal Electoral Boundaries Commission for Ontario, established on April 16, 2002, was permitted to make variations from the quotient “where necessary or desirable to:
1. respect the community of interest or community of identity in, or the historical pattern of, an electoral district in theprovince, or
2. ensure a manageable geographic size for electoral districts in sparsely populated, rural or northern regions of the province.”58
Where variations are deemed necessary, for example to reflect differences in population densities, boundaries commissions areusually instructed to stay within 25% of the quotient – above or below. However, in extraordinary circumstances, the populationof districts may be permitted to vary even more than 25%.

59 Rein Taagepera and Matthew Shugart, Seats and Votes: The Effects and Determinants of Electoral Systems (New Haven: Yale University Press, 1989),p. 131. According to the authors, “at least one-quarter of seats should be adjustment [compensatory] seats” to achieve proportionality.
Democracy at Work: THE ONTARIO CITIZENS’ ASSEMBLY ON ELECTORAL REFORM 148
PART IV: DESCRIPTION OF THE ONTARIO CITIZENS’ ASSEMBLY’S MIXED MEMBER PROPORTIONAL SYSTEM
In designing its MMP system, the Assembly was aware that provincial districts vary in population by up to 25% and,in a few cases, more than 25%. The Assembly expressed the view that local districts should not deviate from representation bypopulation any more than under the current system. This means that the share of districts in each region of the province shouldstay approximately the same.
For example, with the boundary lines for the 2007 Ontario election, about 10% of the districts are in the North (11 outof 107). Therefore, under the Assembly’s MMP system, the North would retain about 10% of the local districts (9 out of 90).Any six current districts would likely become about five districts under the MMP system.
Ratio of Local Seats to List Seats
The list tier is designed to compensate for lack of proportionality in the election of local members. The extent to which this canbe achieved depends, in part, on the size of the list tier.59
The Assembly’s MMP system has a list tier that makes up 30% of the total number of seats in the legislature. This isenough to ensure proportionality except where results from the election of local members are highly disproportional.
Table 27 compares the percentage of local seats and list seats in the Assembly’s MMP system with MPP systems used inseveral other jurisdictions, using the base size (that is, not including balance seats) of the legislatures in those jurisdictions as of the most recent elections.

A record of the process for Ontario’s first citizens’ assembly 149
PART IV: DESCRIPTION OF THE ONTARIO CITIZENS’ ASSEMBLY’S MIXED MEMBER PROPORTIONAL SYSTEM
Table 27 | Percentage of Local Seats and List Seats in MMP Systems
Local Seats List Seats Total Seats Local seats (%) List seats (%)
Citizens’ Assembly’s recommendation 90 39 129 69.77 30.23
National Assembly of Wales 40 20 60 66.67 33.33
New Zealand House of Representatives 69 51 120 57.50 42.50
Scottish Parliament 73 56 129 56.59 43.41
German Bundestag 299 299 598 50.00 50.00
German Länder (provinces)
North Rhine-Westphalia 128 53 181 70.72 29.28
Lower Saxony 100 55 155 64.52 35.48
Berlin 78 52 130 60.00 40.00
Schleswig-Holstein 45 30 75 60.00 40.00
Baden-Württemberg 70 50 120 58.33 41.67
Bavaria 92 88 180 51.11 48.89
Mecklenburg-Western Pomerania 36 35 71 50.70 49.30
Rhineland-Palatinate 51 50 101 50.50 49.50
Brandenburg 44 44 88 50.00 50.00
Hessen 55 55 110 50.00 50.00
Saxony 60 60 120 50.00 50.00
Thuringia 44 44 88 50.00 50.00
Saxony-Anhalt 49 50 99 49.49 50.51
Note: Data derived from Louis Massicotte, “To Create or to Copy? Electoral Systems in the German Länder,” German Politics (2003) Vol. 12, No.1:1-22 and government websites.
List Seats
Structure of the List Tier
In MMP systems, list members are either elected from a particular region to represent that region, or they are elected from thecountry (or province) as a whole to represent all citizens. In the Assembly’s MMP system, the 39 list seats are counted and allocatedprovince-wide. The 39 list members are elected through the party side of the ballot and represent all Ontarians.

60 In Germany, seats are allocated regionally on the basis of the national vote.
61 In rare cases in MMP systems, a party has attempted to manipulate the system by splitting into two parties—one party runs local candidates only and the other party runs list candidates only. This is sometimes referred to as a “decoy list.” Decoy lists result in an inflated seat total for the parties because their seat shares are calculated separately, even though they are really one party. It is very unlikely that this would occur in Ontario, given the political culture. Decoy lists have not been attempted in the four jurisdictions examined here (Germany, New Zealand,Scotland, and Wales). If there was a concern that parties might manipulate the system in this way, the practice could be prohibited by law.
Democracy at Work: THE ONTARIO CITIZENS’ ASSEMBLY ON ELECTORAL REFORM 150
PART IV: DESCRIPTION OF THE ONTARIO CITIZENS’ ASSEMBLY’S MIXED MEMBER PROPORTIONAL SYSTEM
The purpose of the province-wide list tier is to provide parties with as much compensation as possible for disproportionalresults in the election of local members, while maintaining a legislature of a reasonable size. All other system design elementsbeing equal, a province-wide list tier achieves proportionality with a comparatively small number of list seats.
In Germany, Scotland, and Wales, list members are elected from regions.60 In New Zealand, list members are electedcountrywide. In nine out of thirteen German Länder (provinces), list members are elected to represent their Land as a whole.
Type of List
In an MMP system, parties nominate candidates to their lists. Those candidates are eligible to be elected through the party vote. 61
The MMP system designed by the Assembly uses a “closed list” – the type of list used in almost every MMP jurisdiction.Parties list their candidates in the order they want them to be elected and voters can’t change this order (unlike “open lists”).This provides a measure of predictability for voters. For example, if a party wins five list seats, the first five eligible candidateson its list, after removing the names of people who won in local elections, will be elected to the legislature.
In a closed list, the names of parties, as opposed to the names of candidates, appear on the party side of the ballot. Inopen list systems where voters are given an opportunity to vote for a party or select a candidate from a party list, the researchshows that a majority of voters prefer to vote for a party and that the candidate-option often has limited effect on who is elected.
A closed list, with the ballot listing only the parties, also makes the ballot simpler for voters. With a provincial tier, anopen list ballot would have to include the names of numerous candidates for each party.
With a closed list, there is a greater likelihood that members elected from the list will come from different regions of theprovince and will include more women and others currently under-represented in the legislature. This is because the list cannotbe re-ordered and because parties will have an incentive to ensure that their list appeals to as many voters as possible. In NewZealand, for example, the representation of women and other under-represented groups in Parliament has increased since theintroduction of its MMP system, which uses a closed list.
Creation of Lists
All electoral systems that use party lists require parties to publish their lists before the election. This way, voters know who willbe elected if a party wins list seats.
The Assembly’s MMP system requires parties to submit their lists, and the details of the process they used to create them, toElections Ontario, a non-partisan body. Elections Ontario will publish this information widely, so voters will be able to assess whethera party created its list in a fair and transparent way. Voters will also be able to see whether a party’s list has a good balance ofmen and women, includes candidates from all of Ontario’s regions, and reflects the diversity of Ontario’s population.
In MMP jurisdictions, parties nominate candidates to their lists in a variety of ways. In New Zealand, there is no legalrequirement for the creation of lists. The Labour Party and the National Party determine their lists at regional conventions. Thelists are then assembled by a special national committee of each party. The New Zealand Green Party creates its list by a vote of all party members.

62 New Zealand Labour Party, 2003, Constitution and Rules, (Wellington, NZ: New Zealand Labour Party). Available online:http://www.labour.org.nz/labour_team/constitution/ASTFIL28018.doc pp. 21-22.
A record of the process for Ontario’s first citizens’ assembly 151
PART IV: DESCRIPTION OF THE ONTARIO CITIZENS’ ASSEMBLY’S MIXED MEMBER PROPORTIONAL SYSTEM
In Germany, the process for creating party lists is mandated by law. Party members vote at a special nomination meeting,by secret ballot, to elect the candidates who will appear on the list.
Developing a list gives parties an opportunity to consider their overall objectives – more so than in the nomination of local candidates. The experience in MMP jurisdictions suggests that parties do take advantage of this opportunity. For example,the New Zealand Labour Party has established that its list should:
• fairly represent Maori people, women, men, ethnic groups such as Pacific Island peoples, age, youth and people with disabilities;
• ensure there is due regard for the geographic spread of the population;
• recognise that many groups of people, previously under-represented in Parliament, have skills which will enhance theParliamentary process; and
• ensure that there is a spread of all these groups across the list.62
The Ballot
In the Assembly’s MMP system, voters get two votes on a single ballot. On one side of the ballot, they vote for the party theyprefer. This vote determines the total share of seats a party wins in the legislature. On the other side, they vote for a candidateto represent their local district. The ballot is “categorical,” which means that voters select a candidate and a party, but do notrank the candidates or parties according to their preferences.
The example below shows what a ballot might look like under the Assembly’s MMP system. Elections Ontario woulddesign the actual ballot, and it might look quite different. In this sample ballot, candidates are ordered alphabetically on theright side, matched to their parties. The district has an independent candidate, Thérèse Turquoise, running for election. Parties Fand D are not running local candidates in the district, but voters can still support these parties.

Democracy at Work: THE ONTARIO CITIZENS’ ASSEMBLY ON ELECTORAL REFORM 152
PART IV: DESCRIPTION OF THE ONTARIO CITIZENS’ ASSEMBLY’S MIXED MEMBER PROPORTIONAL SYSTEM
Figure 5: Sample MMP Ballot
The “double ballot” gives voters several options. It allows voters to
• vote for a candidate and for that candidate’s party
• vote for a candidate and for a different party
• vote for an independent candidate if one is running in the district and for a party
• vote for a party even if that party does not have a candidate running in the district
• cast only one vote – either for a candidate or for a party – without spoiling the ballot
Both Germany and New Zealand use a double ballot. In some MMP systems, such as the one used in the German province ofBaden-Württemberg, voters choose a local candidate only. In this case, the single vote determines which candidate wins andalso each party’s share of the vote.
You have two votes | Vous disposez de deux votes
Party VoteThis vote determines what share of seats eachparty will receive. Vote by putting an X next tothe party of your choice.
Vote de partiCe vote détermine la part des sièges que recevrachaque parti. Votez en inscrivant un X à côté duparti de votre choix.
Local Candidate VoteThis vote determines which candidate will beelected to represent your district. Vote by puttingan X next to the candidate of your choice.
Vote pour le candidat localCe vote détermine quel candidat sera élu pourreprésenter votre circonscription. Votez en met-tant un X à côté du candidat de votre choix.Vote
Here
Votez ici
VoteHere
Votez ici
Vote for only one party
Votez pour un seul parti
Vote for only one candidate
Votez pour un seul candidat
Party/Parti C Olive, Oliver
Party/Parti E Tangerine, Tony
Independent/Candidate indépendante Turquoise, Thérèse
Party/Parti B Violet, Veronica
Party/Parti A Yellow, Yasmin
Party/Parti F No local candidate/Aucun candidat local
Party/Parti D No local candidate/Aucun candidat local

A record of the process for Ontario’s first citizens’ assembly 153
PART IV: DESCRIPTION OF THE ONTARIO CITIZENS’ ASSEMBLY’S MIXED MEMBER PROPORTIONAL SYSTEM
Dual Candidacy
There are two ways to be elected in an MMP system: in a local district or from a party list. The Assembly’s MMP system, likemost other MMP systems, allows for “dual candidacy.” This means that candidates can run locally, be on a party list, or both.If a candidate seeks election in both ways and wins the local race, the candidate must represent that district and is no longereligible for a list seat, regardless of position on the party list. The candidate’s name is crossed off the list, and that position istaken by the next candidate on the list who has not won in a local district.
Dual candidacy allows parties to pursue the electoral strategy they think is best, knowing that the voters will assess thatstrategy through their party votes. In jurisdictions with MMP systems, parties nominate some list candidates who do not seekelection in local districts. These candidates may offer expertise in a specific area (for example, the environment or finance) orotherwise strengthen the party’s list. Alternatively, a party may nominate a candidate to run only in a local district, particularly if that district is seen as a “safe seat” or as easily winnable.
The more common practice in MMP systems is for list candidates to run locally as well. In the 2002 German election, over90% of the elected list members also ran locally. In the 2002 New Zealand election, 84% of list members ran locally. This givesthese candidates more visibility and strong connections to particular areas or regions. Parties that have general support across acountry or province, but little likelihood of winning many local seats, may still want to run candidates in local districts. This givesparties a local presence in the election and allows their candidates to gain political skills and experience by running locally.
Permitting dual candidacy recognizes that there can be only one winner in local ridings under a Single Member Pluralitysystem. Candidates who have strong public support can lose local races. For example, in the 2003 Ontario election, the winningcandidate in one district received 35.87% of the vote. In another district, a losing candidate received 45.16% of the vote. As thisexample shows, candidates who lose can actually have more support than other candidates who win.
Overhangs and Balance Seats
The basic principle of MMP systems is that the share of seats a party wins in the legislature is roughly equal to its share of the party vote. Parties always keep the local seats they win. However, it is possible for a party to win more local seats than itsentitlement based on its share of the party vote. These seats are sometimes referred to as “overhangs.” The number of overhangsproduced in an election is a function of the design of the electoral system and voting behaviour.
In some MMP jurisdictions, seats (sometimes called “balance seats”) are temporarily added to the legislature to adjustfor overhangs. These balance seats allow a party that wins more local seats than its vote share to retain these seats, while ensuringthat other parties still receive their full share of list seats. The balance seats stay in place until the next election. Seat allocationafter the next election uses the original size of the legislature as the starting point.
The Assembly’s MMP system does not allow for the addition of balance seats. This ensures that the size of the Ontariolegislature will remain fixed at 129 seats. If overhangs are produced, local seats are still awarded to the winners in each districtand the list seats are distributed to parties that did not generate overhangs in proportion to their share of the party vote. Thiscan reduce the proportionality of the election results because if one party wins more seats than its vote share, another party orparties win fewer seats.

63 For the Liberal Party this includes seats won by Liberal-Labour, for the Progressive Conservative Party this includes a seat won by a ProgressiveConservative Independent, and for the New Democratic Party this includes seats won by the Cooperative Commonwealth Federation.
Democracy at Work: THE ONTARIO CITIZENS’ ASSEMBLY ON ELECTORAL REFORM 154
PART IV: DESCRIPTION OF THE ONTARIO CITIZENS’ ASSEMBLY’S MIXED MEMBER PROPORTIONAL SYSTEM
It is difficult to predict how Ontarians will vote under an MMP system. However, past voting patterns in Ontario and votingpatterns in MMP jurisdictions suggest that there will be few or no overhangs produced in most elections under the Assembly’sMMP system. A small number of overhangs (1 to 3 seats) would have little impact on proportionality. In a very unusual election,where a large party wins a very large number of local seats but a much lower share of the party vote, the impact on proportionalitywould be greater.
Germany’s and New Zealand’s MMP systems allow balance seats. In practice, the number of balance seats added to theirlegislatures is generally small when compared with the overall size of their legislatures. For example, in the four elections in NewZealand since the adoption of MMP, one election resulted in a single balance seat. In Germany, where overhangs are more common,an election has produced as many as 16 balance seats. However, because the German legislature has 598 seats, this representedan increase of 2.7% in the size of the legislature.
Scotland and Wales do not allow balance seats. Due to voting patterns and the design of their systems, both Scotlandand Wales have so far produced a slightly higher percentage of overhangs than has been typical in Germany and New Zealand.
Threshold
A threshold is a minimum level of support that a party must obtain in order to win seats in the legislature. There are two typesof thresholds: effective thresholds and legal thresholds. All electoral systems have an effective threshold, which is a mathematicalconsequence of the design of the electoral system, the number of parties, and the vote distribution. A legal threshold sets out inlaw the minimum level of support a party requires to win list seats.
Thresholds affect the proportionality of election results and the number of parties represented in the legislature. In general,as the threshold rises, the results become correspondingly less proportional and fewer parties win seats in the legislature.
In the Assembly’s MMP system, one seat is equal to about 0.78% of the total number of seats in the legislature. The system’slegal threshold is set higher – at 3% of the party vote. For example, in the last Ontario election, approximately 4.5 million peoplevoted. To meet the 3% threshold of support, a party would have needed about 135,000 votes.
The 3% threshold strikes a balance between having more parties represented in the legislature and preventing partieswith very little public support from winning seats. The threshold ensures that all parties allocated list seats in the legislature willhave significant support from voters. If a party wins a local seat but does not meet the 3% threshold province-wide, it retainsthe local seat but is not compensated with list seats.
Again, it is not possible to predict with certainty how Ontario voters will vote under the new system. However, based onpast voting patterns in Ontario and the experience in MMP jurisdictions, the Assembly believes that the 3% threshold willensure that the legislature does not become fractured by a proliferation of parties with very little public support.
Since 1955, the Liberal Party, the Progressive Conservative Party, and the New Democratic Party have been the only partiesto win seats in the Ontario legislature.63 Only two other parties have come close to winning 3% of the vote. In 2003 the GreenParty won 2.8% of the vote and in 1990 the Family Coalition Party won 2.7%.
In contrast to the Assembly’s threshold, New Zealand has a “dual threshold”: If a party receives 5% of the party vote orwins at least one local seat but does not obtain 5% of the vote, it is eligible for list seats. A dual threshold can be easier to meetthan a single threshold. In the 2005 New Zealand election, eight parties won seats. Four of those parties did not meet the 5%
64 Jack Nagel, “Stormy Passage to Safe Harbour? Proportional Representation in New Zealand,” in Steps Toward Making Every Vote Count: ElectoralSystem Reform in Canada and its Provinces, ed. Henry Milner, (Peterborough, Ontario: Broadview Press, 2004).
A record of the process for Ontario’s first citizens’ assembly 155
PART IV: DESCRIPTION OF THE ONTARIO CITIZENS’ ASSEMBLY’S MIXED MEMBER PROPORTIONAL SYSTEM
threshold (in fact, none of those four received even 3% of the party vote). In that election, the two major parties received 80%of the party vote between them.
The New Zealand experience offers some evidence that voters will punish a small party that attempts to exert more influencethan its share of seats would justify. After the 1996 election, the small New Zealand First Party (NZF) entered into a coalitiongovernment with the larger National Party. During its time in power, some voters felt that NZF exerted undue influence as partof the governing coalition. In the following election, NZF’s support dropped from 13.5% to 4.2% of the party vote. This drop insupport can be attributed, in part, to voters’ displeasure with NZF’s performance.64
Germany also has a double threshold that gives parties two chances to win a seat. Germany’s threshold is set at 5% ofthe party vote or three local seats. In the 2005 election, five parties won seats. All of them obtained support well above 5% ofthe party vote.
Scotland and Wales do not have legal thresholds, but because the counting of votes and allocation of seats is doneregionally, their effective thresholds are relatively high.
Formula
Every proportional electoral system uses a formula to allocate seats. Because the shares of party votes do not come out aswhole numbers, systems use various mathematical formulas to smooth out the fractions and assign the seats proportionally.
There are a number of different formulas, and the key difference among them is how the last seat is allocated. A moreproportional formula tends to award the last seat to one of the smaller parties. A less proportional formula tends to allocate thelast seat to a larger party. The Assembly’s MMP system uses the “Hare formula.” It is one of the most proportional formulas andis the simplest one.
The Hare formula works as follows:
Step 1: All the party votes cast in the election are counted, excluding those votes cast for parties that do not meet the 3% threshold.
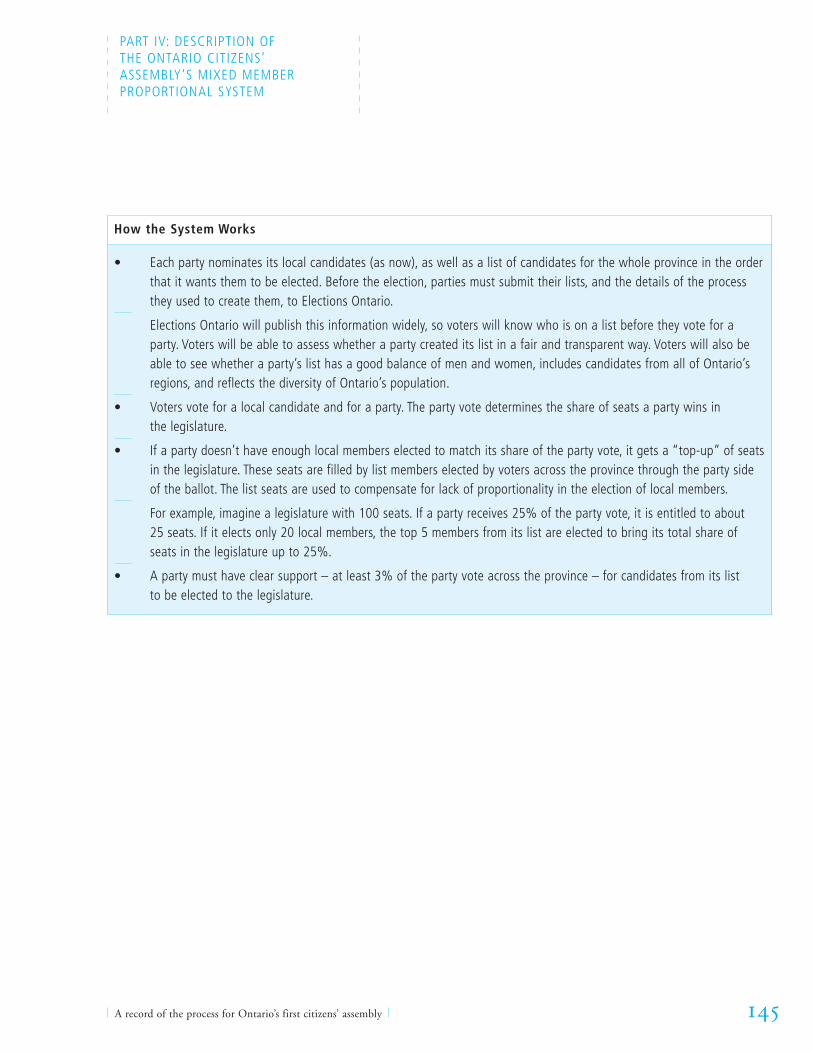
Step 2: The Hare formula is used to determine the “quota.” The quota (Q) is equal to the total number of votes (V) divided by the total number of seats in the legislature (S).
In an MMP system, all seats are distributed proportionally, including seats filled by candidates who win in local districts.Therefore, in the Assembly’s MMP system, the number of votes is divided by 129 – the total number of seats in the legislature –to determine the quota.
V129
= Q
VS
= Q

Democracy at Work: THE ONTARIO CITIZENS’ ASSEMBLY ON ELECTORAL REFORM 156
PART IV: DESCRIPTION OF THE ONTARIO CITIZENS’ ASSEMBLY’S MIXED MEMBER PROPORTIONAL SYSTEM
Step 3: Once the quota has been determined, each party’s vote total is divided by the quota. This establishes the number ofseats a party is entitled to receive. The whole number is the number of “full quota” seats awarded to each party. Forexample, if Party A’s share of seats is 51.77, it is awarded 51 full quota seats. If Party B’s share of seats is 38.70, it isawarded 38 full quota seats.
Step 4: After the full quota seats have been distributed, there will be a small number of seats left to be filled. The Hare formulauses the “largest remainders method” to allocate these final seats. The seats are distributed to parties with the largestremaining fractions of a quota. In the example above, Party A’s remainder (.77) is larger than Party B’s remainder (.70).Therefore, Party A is awarded the next seat. This process continues until all seats are allocated in approximate proportion toeach party’s share of the party vote.
Seat Vacancies
All electoral systems have rules to fill seats that may become vacant between general elections. In the Assembly’s MMP system,if a local seat becomes vacant, a by-election will be held. This is the practice under Ontario’s current system. If a list seat becomesvacant, Elections Ontario will select the next available person on that party’s list as submitted for the previous election.
In New Zealand, until 2005, there was a rule that if a list member decided to leave the party that had been allocated theseat for that member, the member would have to resign and the seat would be awarded to the next person on that party’s list.The Ontario legislature would be free to adopt a similar rule.
H Y P O T H E T I C A L E L E C T I O N S C E N A R I O S U N D E R T H E A S S E M B L Y ’ S M M P S Y S T E M
This section explains the mechanics of the Assembly’s MMP system using two hypothetical election scenarios.In MMP systems, it is possible for a party to win more local seats than its share of the party vote gives it. These seats are
called “overhangs.” In the first hypothetical election scenario, there are no overhangs. The second scenario shows how resultsare calculated when one or more parties win overhang seats.
It is not advisable to rely exclusively on past Ontario elections to determine how the Assembly’s MMP system will operate,because it is impossible to predict voting behaviour under a new system. Nonetheless, it is informative to think about currentvoting patterns and how they might change if the new system is adopted.
The following scenarios are for illustration purposes only. Past voting patterns in Ontario and in existing MMP systems wereused to create reasonable but hypothetical election results based on the following three assumptions:
1. Proportional systems are associated with multiparty systems. In these hypothetical elections, two dominantparties, one medium-sized party, and two small parties win seats in the legislature.
2. Dominant parties will continue to do well at the local level. Under Ontario’s current system, it is commonfor dominant political parties to win 50% or 60% of the seats with approximately 40% of the vote. In Scenario 1, PartyA wins approximately 52% of the local seats. In Scenario 2, Party A wins approximately 61% of the local seats.

A record of the process for Ontario’s first citizens’ assembly 157
PART IV: DESCRIPTION OF THE ONTARIO CITIZENS’ ASSEMBLY’S MIXED MEMBER PROPORTIONAL SYSTEM
3. Some voters will split their votes. Under the Assembly’s MMP system, voters cast two votes on a single ballot –one for a party and one for a local candidate. Vote splitting occurs when voters support candidates from one party at thelocal level and support a different party with their party vote. In New Zealand, roughly one third of all voters split their votes.
In MMP systems, a dominant party’s share of the party vote is typically a few percentage points lower than its share ofthe local vote. The reverse is commonly true of the vote shares of smaller parties. In other words, when voters split theirvotes, they normally support candidates of the dominant parties at the local level and support smaller parties on theparty side of the ballot. The hypothetical results used in both scenarios reflect these patterns.
Scenario 1
In this scenario, there are no overhangs produced: No party wins more local seats than its share of the party vote. Each of thefive parties that wins more than 3% of the party vote (the threshold) is awarded list seats in order to achieve proportional election results.
Table 28, Column A shows the total number of party votes cast for each party in this hypothetical election. Column Bshows the vote share won by each party. Column C shows the number of local seats won by each party. These are hypotheticalresults that reflect historical trends in Ontario. Two dominant parties won most of the local seats and a third party won the rest.The following steps explain how the election results would be calculated, using this data, under the Assembly’s MMP system.
Table 28 | Scenario 1: Hypothetical Election Results Under MMP
A B C D E F G
Party Votes Party Vote (%) Local Seats List Seats Total Seats Total Seats (%) Disproportionality (F – B)
Party A 1,783,567 39.14 47 5 52 40.31 1.17
Party B 1,333,266 29.26 31 8 39 30.23 0.97
Party C 818,498 17.96 12 12 24 18.60 0.64
Party D 325,458 7.14 0 9 9 6.98 -0.16
Party E 183,453 4.03 0 5 5 3.88 -0.15
Others 112,431 2.47 – – – – -2.47
Total 4,556,673 100.00 90 39 129 100.00 5.56
Loosemore-Hanby Index: 5.56/2 = 2.78

Democracy at Work: THE ONTARIO CITIZENS’ ASSEMBLY ON ELECTORAL REFORM 158
PART IV: DESCRIPTION OF THE ONTARIO CITIZENS’ ASSEMBLY’S MIXED MEMBER PROPORTIONAL SYSTEM
Calculating Results
Step 1: Determine the Quota
• Count all the party votes listed in Table 28, Column A. There are approximately 4.5 million votes cast in this hypothetical election.
• Exclude the votes cast for parties that do not meet the 3% threshold. In this example, several parties (see “Others”)together won 2.47% of the party vote. All these parties are excluded from the following calculations.
• Use the Hare formula to calculate the quota:
• Q is the quota, V is the total number of votes cast, and S is the total number of seats in the legislature.
• In this scenario, there are a total of 4,556,673 votes, but 112,431 were cast for parties that did not reach the threshold.This leaves a total of 4,444,242 votes cast for parties that will be awarded seats (4,556,673 - 112,431 = 4,444,242).The quota is therefore calculated as follows:
• In MMP systems, the objective is to achieve proportionality in the legislature as a whole. This means that the total numberof votes must be divided by the total number of seats in the legislature (129), even though 90 seats are from local districtsand 39 seats are from the list tier.
Step 2: Distribute the Seats
• Divide each party’s vote totals by the quota to determine the number of seats each party should be awarded. The resultsare presented in Table 29, Column C. For example, Party A has 51 full quota seats plus a remainder of .77. This is calculatedby dividing Party A’s total vote count (1,783,567) by the quota (34,451). Party D meanwhile has 9 full quota seats plus a remainder of .45 (325,458 total votes ÷ the quota of 34,451).
129= 34,4514,444,242
VS
= Q

A record of the process for Ontario’s first citizens’ assembly 159
PART IV: DESCRIPTION OF THE ONTARIO CITIZENS’ ASSEMBLY’S MIXED MEMBER PROPORTIONAL SYSTEM
Table 29 | Scenario 1: Distributing Seats Under MMP
A B C D E F
Party Votes Party Vote (%) Quota: 34,451 Full Quota Seats L-R Seats* Total Seats
Party A 1,783,567 39.14 51.77 51 1 52
Party B 1,333,266 29.26 38.70 38 1 39
Party C 818,498 17.96 23.76 23 1 24
Party D 325,458 7.14 9.45 9 0 9
Party E 183,453 4.03 5.33 5 0 5
Others 112,431 2.47 – – – –
Total 4,556,673 100.00 126 3 129
*Largest Remainder Seats
• Distribute full quota seats. In this scenario, Party A earned 51 full quota seats, so it is awarded 51 seats. Each party isawarded seats in the legislature according to the number of full quota seats earned. In this scenario, there are 126 fullquota seats (see Table 29, Column D).
• Distribute the largest remainder seats. Once the 126 full quota seats have been distributed, there are still 3 seats left to fill because the legislature has a total of 129 seats. These 3 seats are distributed to the parties that have the largestremainders. Party A has the largest remainder (.77) so it gets the first seat. Party C has the second largest remainder(.76) so it gets the second seat. Party B has the third largest remainder (.70) so it receives the third and last seat.
• Add the full quota seats and largest remainder seats together to determine the total number of seats each party shouldbe awarded.
• Count the local votes and award the 90 local seats. See Table 28, Column C.
• Allocate the 39 list seats. List seats are distributed to make up the difference between the number of seats a partyshould have, given its share of the party vote, and the number of local seats it won. In this scenario, Party A won 47local seats, but it should have 52 seats (see Table 29, Column F). Party A gets 5 list seats to make up the difference.Party D should have 9 seats, but since it did not win any local seats it is compensated with 9 list seats (see Table 28,Column D).
Type of Government
Under the Assembly’s MMP system there are two ways for a party to win a majority of the seats.
1. By winning a majority of the party vote (after excluding votes for parties that do not meet the threshold)

65 The disproportionality index used in these scenarios is called the Loosemore-Hanby Index and it is calculated as follows: 1) Find the differencebetween each party’s share of the party vote and its share of the seats; 2) add the absolute values of these differences together; and 3) divide by 2.The index ranges from 0 to 100 and the results can therefore be interpreted as a percentage. A higher value indicates a more disproportional result.
Democracy at Work: THE ONTARIO CITIZENS’ ASSEMBLY ON ELECTORAL REFORM 160
PART IV: DESCRIPTION OF THE ONTARIO CITIZENS’ ASSEMBLY’S MIXED MEMBER PROPORTIONAL SYSTEM
2. By winning 65 local seats – a majority of the total number of seats in the legislative.
Table 28, Column F shows the final outcome of this hypothetical election. No party won a majority of the seats. Party A won thegreatest share of seats in the legislature (40.31%) and would most likely form the government. Party A would have to decidewhether to form a single-party minority government or a coalition government.
To govern as a single-party minority, Party A would need to obtain the formal or informal support of other parties inorder to pass legislation. To govern as a coalition, Party A would enter into formal partnerships with one or more of the otherparties. With enough support from other parties, Party A could form a coalition majority government. These are governments madeup of two or more parties that together have a majority of seats in the legislature. This is the most common form of governmentin MMP systems. In this election scenario, there are several combinations of parties that could produce a majority coalition government.Alternatively, Party A could form a coalition with a smaller party (e.g., Party D or E) and form a minority coalition government.
Disproportionality
Proportional electoral systems are designed to ensure that each party’s share of seats closely approximates its share of theparty vote. “Disproportionality” is the difference between a party’s share of the seats and its share of the vote. This is shown in Column G in Table 28.
In this scenario, Party A receives a small “seat bonus” – a seat share that is larger than its vote share. Party A receives39.14% of the party vote but receives 40.31% of the total number of seats in the legislature: a difference of 1.17%. Party Dreceives a small “seat deficit” – a seat share that is smaller than its vote share. Party D receives 7.14% of the party vote andreceives 6.98% of the seats: a difference of 0.16%.
Levels of disproportionality are a function of the design of an electoral system and voting patterns. No electoral system isperfectly proportional. A threshold, whether legal or effective, will produce some disproportionality because votes cast for partiesthat do not reach the threshold are not translated into seats. The Hare formula and other formulas are designed to distribute seatsproportionally to parties that meet the threshold, but no formula can produce perfectly proportional results. Some dispropor-tionality can also be produced when one party wins more local seats than its entitlement based on its share of the party vote.
Disproportionality for the election as a whole is calculated by adding up the differences between each party’s share ofthe vote and its share of the seats.65 Table 28, Column G, shows that this election scenario produced approximately 2.78% disproportionality. To put this in perspective, the 2005 election in New Zealand produced 2.18% disproportionality. The 2005election in Germany produced 3.85% disproportionality. The 2003 elections in Scotland and Wales produced 12.40% and14.20% disproportionality respectively. In the 1999 and 2003 elections in Ontario, the results produced 12.25% and 23.55%disproportionality respectively.

A record of the process for Ontario’s first citizens’ assembly 161
PART IV: DESCRIPTION OF THE ONTARIO CITIZENS’ ASSEMBLY’S MIXED MEMBER PROPORTIONAL SYSTEM
Scenario 2
In this scenario, there are overhangs: one party wins more local seats than its share of the party vote would give it. Table 30,Column A, shows the party vote totals and Column B shows each party’s share of the party vote. These numbers are the sameas those used in Scenario 1. The important difference between Scenario 1 and Scenario 2 is the number of local seats eachparty wins.
Table 30 | Scenario 2: Hypothetical Election Results Under MMP
A B C D E F G
Party Votes Party Vote (%) Local Seats List Seats Total Seats Total Seats (%) Disproportionality (F – B)
Party A 1,783,567 39.14 55 0 55 42.64 3.50
Party B 1,333,266 29.26 24 13 37 28.68 -0.58
Party C 818,498 17.96 11 12 23 17.83 -0.13
Party D 325,458 7.14 0 9 9 6.98 -0.16
Party E 183,453 4.03 0 5 5 3.88 -0.15
Others 112,431 2.47 – – – – -2.47
Total 4,556,673 100.00 90 39 129 100.01 6.99
Loosemore-Hanby Index: 6.99/2 = 3.49
In Scenario 2, Party A wins more local seats than its share of the party vote. Party A should have a total of 52 seats (the same number as in Scenario 1) but it wins 55 local seats in this hypothetical election. This produces 3 overhang seats.
MMP systems deal with the issue of overhang seats in different ways. In New Zealand and Germany, balance seats areadded to the legislature to offset the disproportionality created by overhang seats. The MMP systems in Scotland and Wales do not allow for balance seats.
The Assembly’s MMP system does not allow for balance seats. The size of the legislature is fixed at 129 and the numberof local seats (90) and list seats (39) stays the same, even if a party wins more local seats than its share of the party vote.
This means that in order to distribute seats proportionally to the remaining parties, the Hare formula is reapplied using the totalnumber of seats in the legislature minus the seats won by parties with one or more overhangs. In this scenario, Party A wins 55seats (including 3 overhangs) and the Hare formula is therefore reapplied using 74 seats (129 - 55) and the vote totals of theremaining parties. There are a total of 2,660,675 votes cast for parties that met the threshold after Party A is removed from thecalculation. The quota is therefore:
74= 35,9552,660,675

Democracy at Work: THE ONTARIO CITIZENS’ ASSEMBLY ON ELECTORAL REFORM 162
PART IV: DESCRIPTION OF THE ONTARIO CITIZENS’ ASSEMBLY’S MIXED MEMBER PROPORTIONAL SYSTEM
The quota in Scenario 2 (35,955) is larger than the quota in Scenario 1 (34,451). This means that a party needs more votes tobe awarded a seat. For example, in Scenario 1, Party B wins 39 seats. In Scenario 2, Party B wins 37 seats.
No seats are taken away from Party A, even though the size of the legislature is fixed at 129. Instead, Party A is awardeda 3-seat bonus. When the number of seats in the legislature is fixed, a seat bonus for one party will result in a seat deficit forone or more of the other parties. In general, as the number of overhangs increases, disproportionality also increases.
Table 30 shows that Scenario 2 produced approximately 3.49% disproportionality, compared with 2.78% disproportionalityin Scenario 1 where there were no overhangs. Both scenarios produce levels of disproportionality comparable to recent resultsfrom the more proportional MMP systems. The Assembly’s MMP system should produce very proportional results except in atypicalelections that would produce a large number of overhangs.


A Mixed Member Proportional electoral system for Ontario will provide
GREATER VOTER CHOICE | FAIRER ELECTION RESULTS | STRONGER REPRESENTATION
www. c i t i z en sa s s emb l y . g ov. on . ca
ISBN 978-1-4249-4434-7 (Print) ISBN 978-1-4249-4435-4 (PDF) © Queen’s Printer for Ontario, 2007