Embed Size (px)
Citation preview

Extract of the Report of the ICES Advisory Committee
North Atlantic Salmon Stocks
As reported to the North Atlantic Salmon Conserva-tion Organisation (NAFO)

International Council for the Exploration of the Sea Conseil International pour l’Exploration de la Mer
H. C. Andersens Boulevard 44–46 DK‐1553 Copenhagen V Denmark Telephone (+45) 33 38 67 00 Telefax (+45) 33 93 42 15 www.ices.dk [email protected]
Recommended format for purposes of citation:
ICES. 2010. Extract of the Report of the ICES Advisory Committee, North Atlantic Salmon Stocks, As reported to the North Atlantic Salmon Conservation Organisation (NAFO). 116 pp.
For permission to reproduce material from this publication, please apply to the Gen‐eral Secretary.
The document is a report of an Expert Group under the auspices of the International Council for the Exploration of the Sea and does not necessarily represent the views of the Council.
© 2010 International Council for the Exploration of the Sea

Extract ICES WGNAS REPORT 2010 | i
Contents
Executive Summary ............................................................................................................... 1
1 Introduction .................................................................................................................... 2
1.1 Main tasks .............................................................................................................. 2
1.2 Participants ............................................................................................................ 5
1.3 Management framework for salmon in the North Atlantic ............................ 5
1.4 Management objectives ........................................................................................ 6
1.5 Reference points and application of precaution ............................................... 6
2 Atlantic salmon in the North Atlantic area ............................................................... 8
2.1 Catches of North Atlantic salmon ...................................................................... 8 2.1.1 Nominal catches of salmon ..................................................................... 8 2.1.2 Catch and release ..................................................................................... 9 2.1.3 Unreported catches .................................................................................. 9
2.2 Farming and sea ranching of Atlantic salmon ................................................ 10
2.3 NASCO has asked ICES to further develop approaches to forecast pre‐fishery abundance for North American and European stocks with measures of uncertainty ............................................................................ 10 2.3.1 Diagnostics of the Bayesian combined sea age models for
NEAC ...................................................................................................... 10 2.3.2 Performance of the parameter estimation portion of the
model ....................................................................................................... 11 2.3.3 Performance of the forecast portion of the models ........................... 12 2.3.4 Next steps ................................................................................................ 13
2.4 NASCO has asked ICES to report on significant, new or emerging threats to, or opportunities for, salmon conservation and management ........................................................................................................ 13 2.4.1 Update on SALSEA‐Merge ................................................................... 13 2.4.2 Update on SALSEA North America .................................................... 14 2.4.3 Update on SALSEA West Greenland .................................................. 14 2.4.4 Genetic identification of North American fish recovered at
West Greenland to region of origin ..................................................... 15 2.4.5 Atlantic salmon genetics‐new initiatives ............................................ 16 2.4.6 The development of tributary specific conservation limits
in Norway ............................................................................................... 16 2.4.7 Estimating river‐specific conservation limits for Atlantic
salmon stocks in UK (Scotland) ........................................................... 16 2.4.8 Red vent syndrome ................................................................................ 17 2.4.9 Reduced sensitivity and development of resistance towards
treatment in salmon louse (Lepeophtheirus salmonis) ......................... 17 2.4.10 Catches of pink salmon in the NEAC area ......................................... 18 2.4.11 Reintroduction of salmon‐developments on the River Rhine ......... 18 2.4.12 European regulations ............................................................................ 18

ii | Extract ICES WGNAS REPORT 2010
2.5 NASCO has asked ICES to continue work already initiated to investigate associations between changes in biological characteristics of all life stages of Atlantic salmon, environmental changes and variations in marine survival with a view to identifying predictors of abundance ................................................................ 19 2.5.1 Report from the Study Group on the Identification of
Biological Characteristics for use as Predictors of Salmon Abundance [SGBICEPS]........................................................................ 19
2.5.2 Bayesian application of the ratio method for estimating at‐sea survival to repeat spawning adult salmon in the LaHave River, Nova Scotia, Canada ................................................... 23
2.6 NASCO has asked ICES to describe how catch and release mortality and unreported catch are incorporated in national and international stock assessments and indicate how they can best be incorporated in future advice to NASCO ........................................................ 24 2.6.1 Catch and release mortality .................................................................. 24 2.6.2 Unreported catch ................................................................................... 24
2.7 NASCO has asked ICES to provide a compilation of tag releases by country in 2009 and advise on progress with analysing historical tag recovery data from oceanic areas ............................................................... 25 2.7.1 Compilation of tag releases and fin clip data by ICES
Member Countries in 2009 .................................................................... 25 2.7.2 Summary of the Workshop on Learning from Salmon
Tagging records (WKLUSTRE) ............................................................ 25
3 North East Atlantic Commission .............................................................................. 50
3.1 Status of stocks/exploitation .............................................................................. 50
3.2 Management objectives ...................................................................................... 51
3.3 Reference points .................................................................................................. 51 3.3.1 National conservation limits ................................................................ 51 3.3.2 Progress with setting river‐specific conservation limits ................... 52
3.4 Management advice ........................................................................................... 52
3.5 Relevant factors to be considered in management ......................................... 53
3.6 Pre‐fishery abundance forecasts ....................................................................... 54 3.6.1 Pre‐fisheries abundance forecasts ........................................................ 54 3.6.2 Results of the NEAC Bayesian forecast models ................................. 54 3.6.3 Probability of attaining PFA above SER ............................................. 55 3.6.4 Use of the NEAC Bayesian forecast models in catch advice ............ 56
3.7 Comparison with previous assessment ........................................................... 56 3.7.1 National PFA model and national conservation limit model .......... 56
3.8 NASCO has requested ICES to describe the key events of the 2009 fisheries and the status of the stocks ................................................................ 56 3.8.1 Fishing at Faroes in 2008/2009 .............................................................. 56 3.8.2 Significant events in NEAC homewater fisheries in 2009 ................ 56 3.8.3 Gear and effort ....................................................................................... 56 3.8.4 Catches .................................................................................................... 57

Extract ICES WGNAS REPORT 2010 | iii
3.8.5 Catch per unit effort (cpue) .................................................................. 57 3.8.6 Age composition of catches .................................................................. 57 3.8.7 Farmed and ranched salmon in catches .............................................. 57 3.8.8 National origin of catches ..................................................................... 58 3.8.9 Trends in the PFA for NEAC stocks .................................................... 58 3.8.10 Survival indices for NEAC stocks ....................................................... 59
3.9 NASCO has requested ICES to further investigate opportunities to develop a framework of indicators that could be used to identify any significant change in previously provided multi‐annual management advice ............................................................................................ 59
3.10 Development of a risk based framework for the provision of catch advice at the Faroes ............................................................................................ 60 3.10.1 The basis for developing a risk assessment framework ................... 60 3.10.2 Current risk assessment procedure for the West Greenland
fishery ...................................................................................................... 61 3.10.3 Management objectives for the Faroes risk framework .................... 62 3.10.4 Assigning Faroes catches (or catch options) to NEAC
management units ................................................................................. 63 3.10.5 Stock forecasts for NEAC stock units in the Faroes risk
framework ............................................................................................... 63 3.10.6 Sharing arrangement for the Faroes risk framework ........................ 64 3.10.7 Possible assessment procedure for Faroes .......................................... 64
4 North American Commission .................................................................................... 76
4.1 Status of stocks/exploitation .............................................................................. 76
4.2 Management objectives ...................................................................................... 76
4.3 Reference points .................................................................................................. 76
4.4 NASCO has requested ICES to describe the key events of the 2009 fisheries ................................................................................................................ 76 4.4.1 Key events of the 2009 fisheries ........................................................... 76 4.4.2 Harvest of North American salmon, expressed as 2SW
salmon equivalents ................................................................................ 76 4.4.3 Gear and effort ....................................................................................... 77 4.4.4 Catches in 2009 ....................................................................................... 79 4.4.5 Origin and composition of catches ...................................................... 80 4.4.6 Exploitation rates ................................................................................... 81
5 Atlantic salmon in the West Greenland Commission .......................................... 90
5.1 NASCO has requested ICES to describe the key events of the 2009 fishery ................................................................................................................... 90 5.1.1 Catch and effort in 2009 ........................................................................ 90 5.1.2 Biological characteristics of the catches .............................................. 90
5.2 NASCO has requested ICES to provide clarification of the levels of reported and unreported catch in the subsistence fishery since 2002 ....................................................................................................................... 92 5.2.1 Reported catches .................................................................................... 92 5.2.2 Unreported catches ................................................................................ 93

iv | Extract ICES WGNAS REPORT 2010
5.2.3 Summary of sources of uncertainty in the reported catches for the Greenland fishery since 2002 ................................................... 93
6 NASCO has requested ICES to identify relevant data deficiencies, monitoring needs and research requirements ...................................................... 102
Annex 1: Glossary of acronyms used in this report ....................................... 104
Annex 2: References cited .................................................................................. 108
Extract ICES WGNAS REPORT 2010 | 1
Executive Summary
• In the North Atlantic, exploitation remains low and nominal catch of At‐lantic salmon in 2008 was the second lowest in the time‐series.
• Marine survival indices remain low. • The North American Commission 2SW stock complex is suffering reduced
reproductive capacity. Factors other than fisheries (marine mortality, fish passage, water quality) are contributing to continued low adult abun‐dance.
• Northern North‐East Atlantic Commission stock complexes (1SW and MSW) are at full reproductive capacity prior to the commencement of dis‐tant water fisheries.
• Southern North‐East Atlantic Commission stock complexes (1SW and MSW) are at risk of suffering reduced reproductive capacity prior to the commencement of distant water fisheries.
• There are no catch options for the fishery at the West Greenland (2009–2011) that would meet precautionary management objectives.
• Despite management measures aimed at reducing exploitation in recent years there has been little improvement in the status of stocks over time. This is mainly because of continuing poor survival in the marine environ‐ment attributed to climate effects. Efforts continue to improve our under‐standing of causal relationships contributing to marine mortality.

2 | Extract ICES WGNAS REPORT 2010
1 Introduction
1.1 Main tasks
At its 2009 Statutory Meeting, ICES resolved (C. Res. 2009/2/ACOM09) that the Work‐ing Group on North Atlantic Salmon [WGNAS] (chaired by: Gérald Chaput, Can‐ada) will meet at ICES HQ, 22–31 March 2010 to consider questions posed to ICES by the North Atlantic Salmon Conservation Organisation (NASCO). The Terms of Refer‐ence were met and the Sections of the Report which provide the answers are identi‐fied below:
a ) With respect to Atlantic Salmon in the North Atlantic area: Section 2
1 ) provide an overview of salmon catches and landings, including unreported catches by country and catch and re‐lease, and pro‐duction of farmed and ranched Atlantic salmon in 20091;
2.1 and 2.2
2 ) report on significant new or emerging threats to, or opportuni‐ties for, salmon conservation and management2;
2.3 and 2.4
3 ) continue the work already initiated to investigate associations between changes in biological characteristics of all life stages of Atlantic salmon, environmental changes and variations in ma‐rine survival with a view to identifying predictors of abun‐dance3;
2.5
4 ) describe how catch and release mortality and unreported catch are incorporated in national and international stock assessments and indicate how they can best be incorporated in future advice to NASCO;
2.7
5 ) further develop approaches to forecast pre‐fishery abundance for North American and European stocks with measures of un‐certainty;
2.6
6 ) provide a compilation of tag releases by country in 2009 and ad‐vise on progress with analysing historical tag recovery data from oceanic areas;
7 ) identify relevant data deficiencies, monitoring needs and re‐search requirements4.
Sec 6
b ) With respect to Atlantic salmon in the North‐East Atlantic Commission area:
Section 3
1 ) describe the key events of the 2009 fisheries5; 3.8
review and report on the development of age‐specific stock conser‐vation limits;
3.9

Extract ICES WGNAS REPORT 2010 | 3
2 ) describe the status of the stocks and provide annual catch op‐tions or alternative management advice for 2011–2013, with an assessment of risks relative to the objective of exceeding stock conservation limits and advise on the implications of these op‐tions for stock rebuilding6;
� supplementary request from NASCO for an assessment of the issues that would need to be addressed before quantitative catch advice could be provided for the Faroes fishery.
3.3
3 ) further investigate opportunities to develop a framework of in‐dicators or alternative methods that could be used to identify any significant change in previously provided multi‐annual management advice.
3.4, 3.6, and 3.8
c ) With respect to Atlantic salmon in the North American Com‐mission area:
Section 4
1 ) describe the key events of the 2009 fisheries (including the fish‐ery at St Pierre and Miquelon) 5;
4.9
update age‐specific stock conservation limits based on new informa‐tion as available;
4.10
• In the event that NASCO informs ICES8 that the framework of indi‐cators (FWI) indicates that reassessment is required:
4.3
2 ) describe the status of the stocks and provide annual catch op‐tions or alternative management advice for 2010‐2013 with an assessment of risks relative to the objective of exceeding stock conservation limits and advise on the implications of these op‐tions for stock rebuilding6.
4.9
d ) With respect to Atlantic salmon in the West Greenland Commis‐sion area:
Section 5
1 ) describe the key events of the 2009 fisheries5; 5.8
provide clarification of the levels of reported and unreported catch in the subsistence fishery since 2002,
5.10
• In the event that NASCO informs ICES8 that the framework of indi‐cators (FWI) indicates that reassessment is required:
2 ) describe the status of stocks and provide annual catch options or alternative management advice for 2010–2012 with an assess‐ment of risk relative to the objective of exceeding stock conser‐vation limits and advise on the implications of these options for stock rebuilding6,7;
5.4

4 | Extract ICES WGNAS REPORT 2010
Notes:
1. With regard to question a‐1, ICES is asked to ensure that the terminology used in presenting the data on ranching is clearly defined. For the esti‐mates of unreported catch the information provided should, where possi‐ble, indicate the location of the unreported catch in the following categories: in‐river; estuarine; and coastal.
2. With regard to question a‐2, ICES is requested to include information on any new research into the migration and distribution of salmon at sea.
3. With regard to question a‐3, there is interest in determining if declines in marine survival coincide with changes in the biological characteristics of juveniles in freshwater or are modifying characteristics of adult fish (size at‐age, age at maturity, condition, sex ratio, growth rates, etc.) and with environmental changes.
4. NASCO’s International Atlantic Salmon Research Board’s inventory of ongoing research relating to salmon mortality in the sea will be provided to ICES to assist it in this task.
5. In the responses to questions b‐1, c‐1 and d‐1 ICES is asked to provide details of catch, gear, effort, composition and origin of the catch and rates of exploitation. For homewater fisheries, the information provided should indicate the location of the catch in the following categories: in‐river; es‐tuarine; and coastal. Any new information on non‐catch fishing mortality, of the salmon gear used, and on the bycatch of other species in salmon gear, and on the bycatch of salmon in any existing and new fisheries for other species is also requested.
6. In response to questions b‐3, c‐3 and d‐3 provide a detailed explanation and critical examination of any changes to the models used to provide catch advice.
7. In response to question d‐3, ICES is requested to provide a brief summary of the status of North American and North‐East Atlantic salmon stocks. The detailed information on the status of these stocks should be provided in response to questions b‐3 and c‐3.
8 The aim should be for NASCO to inform ICES by 31 January of the out‐come of utilizing the FWI.
At the 2009 Annual Meeting of NASCO, conditional multi‐annual regulatory meas‐ures were agreed to in the West Greenland Commission (2009–2011) and for the Faroe Islands (2009–2011) in the Northeast Atlantic Commission. The measures were conditional on a Framework of Indicators (FWI) being provided by ICES, and the ac‐ceptance of the FWI by the various parties of each commission. At the 2009 annual meeting of NASCO, the FWI for the West Greenland fishery was accepted by parties. Denmark (in respect of the Faroe Islands and Greenland) opted out of the multi‐annual regulatory measures as a FWI was not provided by ICES for the fishery in the Faroes (ICES 2009). In January 2010, NASCO indicated that based on the FWI analy‐sis, no change to the management advice previously provided by ICES was required for the fishery at West Greenland.
In response to the remaining Terms of Reference, the Working Group considered 36 Working Documents submitted by participants (Annex 1); other references cited in

Extract ICES WGNAS REPORT 2010 | 5
the Report are given in Annex 2. A full address list for the participants is provided in Annex 3. A complete list of acronyms used within this document is provided in An‐nex 6.
1.2 Participants
MEMBER COUNTRY
Chaput, G. (Chair) Canada
Degerman, E. Sweden
Dionne, M. Canada
Erkinaro, J. Finland
Euzenat, G. France
Fiske, P. Norway
Gibson, J. A. Canada
Gudbergsson, G. Iceland
Hansen, L. P. Norway
Kennedy, R. UK (N. Ireland)
MacLean, J. C. UK (Scotland)
Ó Maoiléidigh, N. Ireland
Potter, T. UK (England & Wales)
Prusov, S. Russia
Reddin, D. G. Canada
Russell, I. UK (England & Wales)
Schindehutte. K. Germany
Sheehan, T. USA
Smith, G. W. UK (Scotland)
Ustyuzhinskiy, G. Russia
Veinott, G. Canada
Wennevik, V. Norway
White, J. Ireland
1.3 Management framework for salmon in the North Atlantic
The Advice generated by ICES is in response to terms of reference posed by the North Atlantic Salmon Conservation Organisation (NASCO), pursuant to its role in international management of salmon. NASCO was set up in 1984 by international convention (the Convention for the Conservation of Salmon in the North Atlantic Ocean), with a responsibility for the conservation, restoration, enhancement, and rational management of wild salmon in the North Atlantic. Although sovereign states retain their role in the regulation of salmon fisheries for salmon originating in their own rivers, distant water salmon fisheries, such as those at Greenland and Faroes, which take salmon originating in rivers of another Party are regulated by NASCO under the terms of the Convention. NASCO now has seven Parties that are signatories to the Convention, including the EU which represents its Member States.

6 | Extract ICES WGNAS REPORT 2010
NASCO discharges these responsibilities via three Commission areas shown below:
1.4 Management objectives
NASCO has identified the primary management objective of that organization as:
“To contribute through consultation and cooperation to the conservation, restoration, enhancement and rational management of salmon stocks taking into account the best scientific advice available”.
NASCO further stated that “the Agreement on the Adoption of a Precautionary Approach states that an objective for the management of salmon fisheries is to provide the diversity and abundance of salmon stocks” and NASCOs Standing Committee on the Precautionary Approach interpreted this as being “to maintain both the productive capacity and diversity of salmon stocks” (NASCO, 1998).
NASCO’s Action Plan for Application of the Precautionary Approach (NASCO, 1999) provides interpretation of how this is to be achieved, as follows:
• “Management measures should be aimed at maintaining all stocks above their conservation limits by the use of management targets”.
• Socio‐economic factors could be taken into account in applying the Precau‐tionary Approach to fisheries management issues”:
• “The precautionary approach is an integrated approach that requires, inter alia, that stock rebuilding programmes (including as appropriate, habitat improvements, stock enhancement, and fishery management actions) be developed for stocks that are below conservation limits”.
1.5 Reference points and application of precaution
Conservation limits (CLs) for North Atlantic salmon stock complexes have been defined by ICES as the level of stock (number of spawners) that will achieve long‐term average maximum sustainable yield (MSY). In many regions of North America, the CLs are calculated as the number of spawners required to fully seed the wetted area of the river. In some regions of Europe, pseudo stock–recruitment observations

Extract ICES WGNAS REPORT 2010 | 7
are used to calculate a hockey stick relationship, with the inflection point defining the CLs. In the remaining regions, the CLs are calculated as the number of spawners that will achieve long‐term average maximum sustainable yield (MSY), as derived from the adult‐to‐adult stock and recruitment relationship (Ricker, 1975; ICES, 1993). NASCO has adopted the region specific CLs (NASCO, 1998). These CLs are limit ref‐erence points (Slim); having populations fall below these limits should be avoided with high probability.
Management targets have not yet been defined for all North Atlantic salmon stocks. When these have been defined they will play an important role in ICES Advice.
For the assessment of the status of stocks and advice on management of national components and geographical groupings of the stock complexes in the NEAC area, where there are no specific management objectives:
• ICES requires that the lower bound of the 95% confidence interval of the current estimate of spawners is above the CL for the stock to be considered at full reproductive capacity.
• When the lower bound of the confidence limit is below the CL, but the midpoint is above, then ICES considers the stock to be at risk of suffering reduced reproductive capacity.
• Finally, when the midpoint is below the CL, ICES considers the stock to suffer reduced reproductive capacity.
It should be noted that this is equivalent to the ICES precautionary target reference points (Spa). Therefore, stocks are regarded by ICES as being at full reproductive capacity only if they are above the precautionary target reference point. This approach parallels the use of precautionary reference points used for the provision of catch advice for other fish stocks in the ICES Area.
For catch advice on fish exploited at West Greenland (non maturing 1SW fish from North America and non maturing 1SW fish from Southern NEAC), ICES has adopted, a risk level of 75% (ICES, 2003) as part of an agreed management plan. ICES applies the same level of risk aversion for catch advice for homewater fisheries on the North American stock complex.

8 | Extract ICES WGNAS REPORT 2010
2 Atlantic salmon in the North Atlantic area
2.1 Catches of North Atlantic salmon
2.1.1 Nominal catches of salmon
Nominal catches of salmon reported for countries in the North Atlantic for 1960–2009 are given in Table 2.1.1.1. Catch statistics in the North Atlantic include fish‐farm es‐capees and in some Northeast Atlantic countries also include ranched fish.
Icelandic catches have traditionally been split into two separate categories, wild and ranched, reflecting the fact that Iceland has been the only North Atlantic country where large‐scale ranching has been undertaken with the specific intention of har‐vesting all returns at the release site. The release of smolts for commercial ranching purposes ceased in Iceland in 1998, but ranching for rod fisheries in two Icelandic rivers continued into 2009 (Table 2.1.1.1). While ranching does occur in some other countries, this is on a much smaller scale. Some of these operations are experimental and at others harvesting does not occur solely at the release site. The ranched compo‐nent in these countries has therefore been included in the nominal catch.
Reported catches in tonnes for the three NASCO Commission Areas for 2000 to 2009 are provided below.
AREA 2000 2001 2002 2003 2004 2005 2006 2007 2008 2009
NEAC 2736 2876 2495 2304 1978 1998 1867 1407 1532 1151
NAC 155 150 150 144 164 142 140 114 162 122
WGC 21 43 9 9 15 15 22 25 26 26
Total 2912 3069 2654 2457 2157 2155 2029 1546 1720 1300
The provisional total nominal catch for 2009 was 1300 tonnes, 420 t below the up‐dated catch for 2008 (1720 t) and the lowest in the time‐series. The 2009 catch was over 620 t below the average of the last five years (1921 t), and almost 1000 t below the average of the last 10 years (2295 t). Catches were well below the previous five‐ and ten‐year averages in all southern NEAC countries and slightly below the aver‐ages in the majority of northern NEAC countries.
ICES recognizes that mixed‐stock fisheries present particular threats to stock status. These fisheries predominantly operate in coastal areas and NASCO specifically re‐quests that the nominal catches in homewater fisheries be partitioned according to whether the catch is taken in coastal, estuarine or riverine areas. The 2009 nominal catch (in tonnes) was partitioned accordingly and is shown below for the NEAC and NAC Commission Areas. Figure 2.1.1.1 presents these data on a country‐by‐country basis. There is considerable variability in the distribution of the catch among indi‐vidual countries. In most countries the majority of the catch is now taken in freshwa‐ter; the coastal catch has declined markedly.
Coastal, estuarine and riverine catch data aggregated by region are presented in Fig‐ure 2.1.1.2. In northern Europe, about half the catch has typically been taken in rivers and half in coastal waters (although there are no coastal fisheries in Iceland and Finland), with estuarine catches representing a negligible component of the catch in
AREA COAST ESTUARY RIVER TOTAL
Weight % Weight % Weight % Weight
NEAC 358 31 47 4 745 65 1150
NAC 11 9 40 32 73 59 122
Extract ICES WGNAS REPORT 2010 | 9
this area. There has been a reduction in the proportion of the catch taken in coastal waters over the last five years. In southern Europe, catches in all fishery areas have declined dramatically over the period. While coastal fisheries have historically made up the largest component of the catch, these fisheries have declined the most, reflect‐ing widespread measures to reduce exploitation in a number of countries. In the last three years, the majority of the catch in this area has been taken in freshwater.
In North America, the total catch over the period 2000 to 2009 has been relatively constant. The majority of the catch in this area has been taken in riverine fisheries; the catch in coastal fisheries has been relatively small in any year (13 t or less), but has increased as a proportion of the total catch over the period.
2.1.2 Catch and release
The practice of catch and release (C&R) in rod fisheries has become increasingly common as a salmon management/conservation measure in light of the widespread decline in salmon abundance in the North Atlantic. In some areas of Canada and USA, C&R has been practiced since 1984, and in more recent years it has also been widely used in many European countries both as a result of statutory regulation and through voluntary practice.
The nominal catches presented in Section 2.1.1 do not include salmon that have been caught and released. Table 2.1.2.1 presents C&R information from 1991 to 2009 for countries that have records; C&R may also be practiced in other countries while not being formally recorded. There are large differences in the percentage of the total rod catch that is released: in 2009 this ranged from 6% in Norway (this is a minimum fig‐ure) and 24% in Iceland to 60% in Canada and 68% in UK (Scotland) reflecting vary‐ing management practices and angler attitudes among these countries. Catch and release rates have typically been highest in Russia (average of 84% in the 5 years 2004 to 2008) and are believed to have remained at this level. However, there were no ob‐ligations to report caught‐and‐released fish in Russia in 2009. Within countries, the percentage of fish released has tended to increase over time. Overall, over 143 000 salmon were reported to have been released around the North Atlantic in 2009. This is fewer than that reported in 2008 due to the absence of any data for fish released in Russia.
Summary information on how catch and release levels are incorporated into national assessments is provided in Section 2.6.
2.1.3 Unreported catches
The total unreported catch in NASCO areas in 2009 was estimated to be 327 t; how‐ever there were no estimates for Canada and Russia. The unreported catch in the North East Atlantic Commission Area in 2009 was estimated at 317 t and that for the West Greenland Commission Area at 10 t. There was no estimate for the North American Commission Area. The 2009 unreported catch by country is provided in Table 2.1.3.1. Over recent years efforts have been made to reduce the level of unre‐ported catch in a number of countries (e.g. through improved reporting procedures and the introduction of carcass tagging and logbook schemes).
AREA 2000 2001 2002 2003 2004 2005 2006 2007 2008 2009
NEAC 1135 1089 946 719 575 605 604 465 433 317
NAC 124 81 83 118 101 85 56 ‐ ‐ ‐
WGC 10 10 10 10 10 10 10 10 10 10
Int’l. waters

10 | Extract ICES WGNAS REPORT 2010
2.2 Farming and sea ranching of Atlantic salmon
The total harvest of ranched Atlantic salmon in countries bordering the North Atlan‐tic in 2009 was 43 t, the majority of which (42 t) was taken by the Icelandic ranched rod fisheries (Figure 2.2.2). Small catches of ranched fish from experimental projects were also recorded in two of the three other countries that typically report such fish (Ireland and UK (N. Ireland)); these data include catches in net, trap and rod fisher‐ies.
The provisional estimate of farmed Atlantic salmon production in the North Atlantic area for 2009 is 1076 kt and in excess of one million tonnes for the first time. This represents a 13% increase on 2008 and a 23% increase on the previous 5‐year mean due to increased production in Norway (up 16% on 2008). Norway and UK (Scotland) continue to produce the majority of the farmed salmon in the North Atlantic (80% and 12% respectively). Farmed salmon production in 2009 was below the previous five‐year average in Canada, Ireland, Iceland and Russia. In the absence of produc‐tion figures for 2009 for some countries, values from 2008 were assumed as provi‐sional values for 2009.
World‐wide production of farmed Atlantic salmon has been in excess of one million tonnes since 2002. It is difficult to source reliable production figures for all countries outside the North Atlantic area and it has been necessary to use 2008 estimates for some countries in deriving a worldwide estimate for 2009. Noting this caveat, total production in 2009 is provisionally estimated at around 1385 kt (Figure 2.2.1), a 5% decrease on 2008 and the first drop in production since the beginning of the time‐series. This reflects a fall in production outside the North Atlantic in 2009. Production in this area is estimated to have accounted for 22% of the total in 2009 (down from 34% in 2008). Production outside the North Atlantic is still dominated by Chile de‐spite a 49% decrease in farmed salmon production in this country compared with 2008 due to an outbreak of infectious salmon anaemia (ISA) virus. The ISA outbreak is reported to have had a catastrophic impact on the Chilean salmon industry, where a further reduction in production is expected.
The worldwide production of farmed Atlantic salmon in 2009 was over 1000 times the reported nominal catch of Atlantic salmon in the North Atlantic.
2.3 NASCO has asked ICES to further develop approaches to forecast pre-fishery abundance for North American and European stocks with measures of uncertainty
ICES noted that new Bayesian modelling approaches for both the NAC and NEAC areas had been presented to the Group at its previous meeting (ICES 2009a). The new models were run alongside the existing forecast models and it was agreed that these were an improvement and should replace the previous models in developing catch advice at future meetings. The Study Group on Salmon Stock Assessment and Fore‐casting (SGSAFE) did not meet in the past year and no further developments to the forecast models were reported to ICES in 2010. However, the performance of the models has been further assessed.
2.3.1 Diagnostics of the Bayesian combined sea age models for NEAC
As described in ICES (2009), the Bayesian predictive models for the northern NEAC and the southern NEAC complexes are constructed to account simultaneously for the dynamics of the recruitment to 1SW maturing and 1SW non‐maturing (or MSW) salmon. For each year t, a proportional relationship is assumed between lagged eggs (LEt) and the expected means of the maturing PFAt, with a recruitment rate factor amt

Extract ICES WGNAS REPORT 2010 | 11
(in the log‐scale). The recruitment rate is considered to be random with independent and identically distributed lognormal errors.
²).,.( PFAmPFAmLogNPFAm tt σμ=
tit amLEPFAm += )log(.μ
Similarly, for each year t, a proportional relationship is assumed between LEt and the expected means of the non‐maturing PFA, with a productivity factor anmt (i.i.d. multiplicative lognormal random errors).
²).,.( PFAnmPFAnmLogNPFAnm tt σμ=
tit anmLEPFAnm += )log(.μ
As indicated in ICES (2009a), the recruitment rate for the non‐maturing PFA is mod‐elled dependently on the recruitment rate for the maturing PFA as:
).
.1log(t
ttt PFAmp
PFAmpmnm −+= αα
The expected rate of maturing PFAvs.total PFA recruitment rate is tPFAmp. .
Therefore, the hypothesis underlying this model is that the time variability of the re‐cruitment rate for maturing and non‐maturing PFA will be closely related. A high recruitment rate for maturing PFA will correspond to a high productivity of non‐maturing PFA. However, time variations of the parameter p.PFAmt introduce some flexibility in the synchrony of the maturing and non‐maturing recruitment rates.
2.3.2 Performance of the parameter estimation portion of the model
As indicated above, the recruitment rates were modelled as a first order time varying parameter following a simple random walk over the time‐series:
t = 1,…,n‐1 )²,0(~..
1 ασωω Nwithamamdii
tttt +=+
The independence of the annual deviates of the successive recruitment rates is as‐sessed based on the first order difference in the error term (wt), calculated as:
Dif.wt = amt+1 ‐ amt
Under this assumption the differences in the successive annual rates should generally be normally distributed with a mean of zero.
Secondly, the predicted PFA values for maturing and non‐maturing age groups con‐ditional on only the LE and productivity parameters (termed ElogPFA) relative to the PFA estimates which are conditioned by the preceding parameters as well as the ob‐servations on returns, catches and assumptions on M (PFA) was also considered.
Res.PFAmt = log(PFAmt – ElogPFAmt)
where: ElogPFAmt = log(LEt + amt)
Res.PFAnmt = log(PFAnmt – ElogPFAnmt)
where: ElogPFAnmt = log(LEt + anmt)
The performance of the parameter estimation portion of the model relative to these diagnostics was examined for the southern NEAC complex model with the updated

12 | Extract ICES WGNAS REPORT 2010
data for maturing 1SW salmon to 2009 (see Section 3.6.2) and the results are pre‐sented below.
Annual deviates of successive recruitment rates
The annual differences in the productivity parameter (am) in most years were distrib‐uted around zero, and for many of the year comparisons, zero was contained within the interquartile range of the posterior distributions (Figure 2.3.2.1). The obvious ex‐ception to this was the 1988 and 1989 productivity years for which the differences from one year to the next were mostly negative, indicating that for those years, the change in productivity over the years was strongly negative. This corresponds to the years in which a large decline in productivity was noted in the time‐series of matur‐ing salmon from the Southern NEAC complex. The distribution of the differences for this diagnostic indicates that the assumptions of the first order dynamic model were mostly consistent with the observations and the assumed dynamics. There remains a pattern of successive positive and negative deviates that could potentially be cor‐rected using a higher order autoregressive process in the model. This is a subject for further evaluation.
Partially conditioned predicted PFA to fully conditioned PFA
The predicted PFA of maturing and non‐maturing components based on only the lagged eggs and the corresponding productivity parameters demonstrate deviations from the predicted PFA based on the full model (using lagged eggs, catches, mortal‐ity assumptions and returns) (Figure 2.3.2.2). Over the 31 years of observations, dif‐ferences in the PFA predicted values for which zero was not contained within the 95% Bayesian Credibility Intervals (B.C.I.) were noted in only four years: 1981, 1991, 1998 and 2000 (Figure 2.3.2.2). There were no large deviations observed for the PFA non‐maturing component, the 95% B.C.I. of the residual differences in the log of the PFA’s all contained zero (Figure 2.3.2.2).
2.3.3 Performance of the forecast portion of the models
A retrospective comparison of model forecasts was undertaken to investigate the model’s ability to predict PFAs for maturing and non‐maturing recruits in both Northern and Southern NEAC stock complexes. Run‐reconstructed PFAs for 2008 were compared with the model predictions. Data in the forecast model were succes‐sively truncated to allow forecasts to be run simulating the viewpoints for the years 2005 to 2009 (Figures 2.3.3.1 and 2.3.3.2); 2005 is the earliest year for which lagged spawner estimates, derived from the run‐reconstruction model, allow prediction of the 2008 PFA values. The 2009 forecast is necessary to predict PFAs for non‐maturing stocks in 2008 as the MSW spawners for that cohort do not return until 2009 and abundance estimates are not available until 2010.
For all four stock complexes, the uncertainties associated with the forecasts decrease as the interval between reconstructed estimate and forecast year decreases. This is most apparent in the upper bounds of the uncertainty estimates. In all cases, median forecast values approach the run‐reconstructed estimates as the forecast year interval decreases. In the cases of the Northern non‐maturing and Southern maturing stocks, run‐reconstructed estimates are within the interquartile range of the forecasts for at least the 2006 year run onwards.
Model forecasts generally overestimated run‐reconstructed values for the 2008 PFA, particularly as the interval between run and forecast year increases. For the Northern maturing and Southern non‐maturing stocks, however, the model forecasts one year forward still produced estimates which were notably optimistic compared with the
Extract ICES WGNAS REPORT 2010 | 13
run‐reconstructed values. This overestimation is consistent with the recent pattern in the productivity parameter deviate shown in Figure 2.3.2.1. During a time period when the productivity parameter is increasing the model would underestimate abundance. This forecast performance could potentially be improved using a higher order autoregressive process in the model.
2.3.4 Next steps
The Bayesian model developed in ICES (2009) has been employed to provide stock forecasts for maturing and non‐maturing 1SW salmon in the Southern and Northern NEAC areas for the years 2011 to 2013. In addition, the following points have been highlighted for consideration in the coming year:
• The proportion of maturing 1SW fish in the Southern NEAC area is mark‐edly lower in the forecast years relative to the most recent historic years re‐flecting the fact that the productivity parameters are derived for the total time‐series. Consideration should be given to using an alternative ap‐proach such as deriving the maturation parameter over a shorter time pe‐riod (from more recent years) or modelling this process through time.
• The uncertainty in the returns is not currently accounted for in the model, due to difficulties in model fitting.
• The influence of environmental variables on productivity should be inves‐tigated for incorporation into the model and/or to further inform time‐scales for the autoregressive components of the model.
ICES has suggested (Section 3.10) that future catch advice could be based around a management framework which addresses the probability of national stocks exceed‐ing their CLs. If this approach is implemented, it will be more appropriate to consider forecasts of PFA at the national (or regional) level.
2.4 NASCO has asked ICES to report on significant, new or emerging threats to, or opportunities for, salmon conservation and management
2.4.1 Update on SALSEA-Merge
The overall objective of SALSEA‐Merge is, by merging genetic and ecological investi‐gations, to advance understanding of stock specific migration and distribution pat‐terns and overall ecology of the marine life of Atlantic salmon and gain an insight into the factors responsible for recent significant increases in marine mortality. ICES noted recent progress relating to various work packages within the overall pro‐gramme.
Work Package 1: the development of a genetic tool for identifying the region/river of origin of marine samples of Atlantic salmon. An operational molecular genetic tool to determine the region or river of origin of European Atlantic salmon captured at sea, using both historical and newly collected tissues has been developed. The final database will encompass approximately 500 rivers.
Work package 2: the collection and assembly of marine samples for analysis along with associated ecological data. Tissue samples from 1800 post‐smolts from surveys undertaken prior to the SALSEA‐Merge project have been identified for genetic stock identification and a scale reading workshop was held to harmonize methods. During marine surveys conducted by the Irish, Faroes and Norwegian partners over 1700 post‐smolts and 37 adult salmon have been captured.

14 | Extract ICES WGNAS REPORT 2010
Work package 3: application of the genetic tool to identify the region/river of origin of marine samples of salmon. Preliminary analyses were completed to identify the origin of collected samples; these will be refined as new material is added to the genetic baseline.
Work package 4: the biological analysis of marine samples. Training of researchers from partner laboratories was completed in the use of digital scale reading techniques and new imaging equipment. Historical scale samples of salmon from selected rivers are under investigation and a digital scale library, including image files, established. Stomach samples from salmon and other pelagic species (mainly mackerel) from the 2008 expeditions have been analysed.
Work package 5: the integration of genetic, biological and oceanographic information to generate ecological insights. Development of a migration model is progressing and a fundamental particle drift model has been completed and tested.
Work Package 6: dissemination of information. A website has been established with web pages providing a description of the scientific work completed and planned under the relevant SALSEA work packages.
2.4.2 Update on SALSEA North America
A research cruise was completed in the Labrador Sea between 55 0 N and 58 0 N in September 2009. The broad scale objectives were to:
1 ) Sample the ecosystem components within the upper 20 m of the water col‐umn by fishing a pelagic trawl;
2 ) Assess size‐selective catchability of the pelagic trawl to validate trawl catchability by fishing surface set gillnets;
3 ) Relate salmon geographic distribution (latitude, longitude) and oceano‐graphic (fronts, temperature, salinity) characteristics from the salmon catches;
4 ) Provide information from catches and relative abundance of other species, including macroplankton aggregations on the role of salmon within this larger pelagic ecosystem; and,
5 ) Collect oceanographic data to define the habitat of the salmon post‐smolts and other species.
In spite of poor weather, the survey objectives of sampling the ecosystem compo‐nents within the upper 20 m of the water column were achieved. The salmon that were intensively sampled (85 fish), when analysed, will define the characteristics, origin, age, health, and diet of the salmon population in the northern Labrador Sea. Stable isotope analysis will define the salmon’s place trophically in the ecosystem. Other observations included demonstrating that salmon could be caught in the sur‐face trawl at night and the high productivity and species diversity of the upper por‐tion of the water column in the Labrador Sea. No salmon were caught in sets on the shelf area influenced by the Labrador Current vs. fishing sets in the mid‐Labrador Sea where salmon were commonly caught.
2.4.3 Update on SALSEA West Greenland
SALSEA West Greenland is designed to enhance the current Baseline Sampling Pro‐gramme (Section 5.1) and integrate with the coordinated marine surveys in other oce‐anic areas to provide data for investigating hypotheses on the causal mechanisms driving stock‐specific performance in the ocean (i.e. marine survival).

Extract ICES WGNAS REPORT 2010 | 15
In 2009, the SALSEA West Greenland Enhanced Sampling Programme resulted in detailed examination of 412 fresh whole salmon, which were purchased directly from individual fishers. Fresh whole fish were needed, as the protocols for many of the samples require the collection of fresh internal tissues. The following provides the samples collected in 2009 and their purpose:
• adipose tissue samples preserved in RNALater for origin determination; • scales samples for age and growth studies; • stomach samples preserved in formalin for diet studies; • sea lice collections preserved in both RNALater and EtOH for Slice® resis‐
tance and population genetics studies; • muscle fillet sections frozen for lipid analysis; • otolith and water samples for oxygen isotope analysis; • heart and kidney samples preserved in both RNALater and formalin for
parasite (Ichthyophonus) investigations; • pyloric caeca, gill arch, liver, spleen, kidney, and heart samples preserved
in formalin for miscellaneous parasite investigations; • intestines preserved in formalin for parasite analysis; • ovary samples preserved in Bouins solution for sea age‐at‐maturity analy‐
sis; • adipose and caudal fin clip, dorsal muscle and liver frozen samples and
scale samples for stable isotopes analysis; • gillrakers, pyloric caeca, spleen, and kidney frozen samples for miscellane‐
ous disease investigations.
ICES recommends that SALSEA West Greenland be conducted in 2010 and that ef‐forts continue to integrate the results from this sampling programme with results ob‐tained from both SALSEA‐Merge and SALSEA North America.
2.4.4 Genetic identification of North American fish recovered at West Greenland to region of origin
A recent genetic microsatellite investigation was carried out to identify the region of origin of salmon of North American origin captured at three different localities in the Greenland mixed‐stock fishery (Gauthier‐Ouellet et al., 2009). This study revealed it is possible to identify the region of origin of Atlantic salmon in the Greenland fishery with high precision. It is also possible to evaluate river origin for regions where mod‐erate to high genetic differentiation between rivers is evident. The contribution of each group ranged from <1% (Maine) to 40% (Southern Quebec). The estimated re‐gional contribution to the Greenland fishery was significantly correlated to the num‐ber of MSW salmon produced in each region in the two years examined (2002 and 2004). As such, no regional group was overrepresented in landings compared with their respective productivity according to these results. Decreasing annual contribu‐tions were observed for Southern Quebec (‐22.0%) and New Brunswick (‐17.4%), while an increasing contribution was observed for Labrador (+14.9%) over the course of the study.

16 | Extract ICES WGNAS REPORT 2010
2.4.5 Atlantic salmon genetics-new initiatives
Steps towards an integrated and standardized genetic database
Building on a SALSEA initiative to develop a compatible genetic database over the entire salmon distribution area, a North American project supported by the Natural Sciences and Engineering Research Council of Canada (NSERC) has just started. A Canadian genetic database will first be constructed by expanding the river coverage for each province and standardizing genetic data from rivers already sampled. Com‐bining, calibrating and integrating databases of salmon populations from both sides of the Atlantic will provide a valuable tool for identifying the origin of salmon from the Greenland fishery, as well as other high seas catches where salmon from the whole distribution range might occur.
Mixed stock coastal fisheries in northern Norway
SALSEA‐Merge, and other projects, have contributed to the establishment of a com‐prehensive genetic baseline for salmon populations in northern Europe. This has faci‐litated a pilot project to look into the composition of catches in the coastal salmon fishery in Finnmark County, North Norway. Tagging studies conducted in the late 1960s and early 1970s demonstrated that these fisheries exploited populations from a wide geographic range, including from Russia as far east as the Pechora River (ICES 2009). Preliminary data from Finnmark rivers indicate that the genetic differentiation between rivers in this region is on a scale that may allow for assignment of individu‐als to rivers, and not only regions.
Further initiatives to extend the genetic baseline of these northern populations are underway. A co‐operative project between Finland, Russia and Norway is currently being developed with the objective of developing a model for coastal migration of returning spawners to these northern salmon rivers and providing a more informed basis for the management of the coastal fisheries.
2.4.6 The development of tributary specific conservation limits in Norway
Conservation limits have been established for a number of Norwegian tributaries of the River Tana (Teno in Finnish) and for the river system as a whole (Hindar et al., 2007). The assessments suggest that spawning populations have been very low in five Norwegian tributaries of the River Tana in recent years.
Over 90% of the catch in the Tana River system is estimated to take place in the main stem, whereas most of the total conservation limit is derived from the tributaries. The stocks in the River Tana system are genetically differentiated (Vähä et al., 2007), and management should therefore take account of the fact that multiple populations con‐tribute to the fisheries in the main stem of the river. Furthermore, the salmon from the River Tana are also exploited in sea fisheries in the Tana fjord and along the coast of Northern Norway. Heavy exploitation reducing the number of salmon reaching the tributaries is thus the most likely cause for the deficiency of spawners in the Norwegian tributaries of the River Tana.
2.4.7 Estimating river-specific conservation limits for Atlantic salmon stocks in UK (Scotland)
NASCO has asked that age specific conservation limits be developed for individual river stocks of salmon. Progress with setting such limits has varied among countries; within the NEAC area, river‐specific CLs have so far been developed for salmon stocks in UK (England and Wales), France and Ireland (ICES 2009a). ICES noted that

Extract ICES WGNAS REPORT 2010 | 17
progress with setting river‐specific CLs has also been made in Norway and UK (Scot‐land).
The CL (maximum sustainable yield) for the North Esk has been estimated as 18.14 million eggs using stock and recruitment data. A transport model based on wetted area has been developed to allow river‐specific CLs to be estimated for salmon stocks in UK (Scotland). CLs for other areas are estimated by scaling the North Esk CL ac‐cording to the ratio of North Esk and recipient wetted areas. Wetted areas are esti‐mated from digital mapping information. This has resulted in a range of values for the North Esk CL of 6.75 to 6.95 eggs/m2. Estimating the all Scotland wetted area on a similar basis resulted in a CL which was 23% lower than the current estimate pro‐vided by the ICES run reconstruction model.
The methods for estimating CLs for Scottish stocks, the transport model and the re‐sulting CL estimates are under development. Continued efforts to develop river‐specific CLs will include further evaluation of the data and methods in collaboration with local biologists and stakeholders.
2.4.8 Red vent syndrome
Over recent years, there have been reports from a number of countries in the NEAC and NAC areas of salmon returning to rivers with swollen and/or bleeding vents. The condition, known as red vent syndrome (RVS), has been noted since 2005, and has been linked to the presence of a nematode worm, Anisakis simplex (Beck et al., 2008). A number of regions within the NEAC stock complex observed a notable increase in the incidence of salmon with RVS during 2007 (ICES 2008a), but levels were typically lower in NEAC countries during 2008 (ICES 2009a) and 2009. However, levels of RVS on monitored rivers in UK (England and Wales) typically remained high (30–40%) and above those noted in previous years. Trapping records for these rivers for the last 5 years indicate that RVS has generally been less prevalent in early and late running fish than mid‐season fish. Early running fish comprise mainly MSW salmon whereas late running fish are predominantly 1SW fish. There is also some evidence of a higher infes‐tation rate in female fish than in males. Within the NAC stock complex, RVS has been detected in the Scotia‐Fundy (2008 and 2009) and Quebec regions.
2.4.9 Reduced sensitivity and development of resistance towards treatment in salmon louse (Lepeophtheirus salmonis)
The Working Group previously highlighted concerns arising from Norway regarding the development of reduced sensitivity of the salmon louse (Lepeophtheirus salmonis) to oral treatment (ICES 2009a). In the past year, reduced sensitivity to treatment has been observed over much larger areas, and while the problem in 2008 was mainly restricted to west and central Norway, cases have now been registered along much of the coast, including the northern part of the country (http://www.mattilsynet.no/smittevern_og_bekjempelse/fisk/lakselus).
The monthly sea lice reports from fish farmers demonstrate that the number of adult lice on salmon in January and February 2010 continued to increase in several areas compared with earlier years (www.lusedata.no). This, together with the increase in geographic spread of incidences of treatment failure and resistance, gives cause for concern. If the level of infestation in fish farms is not reduced before the smolt migra‐tion in 2010, increased salmon lice infestations on wild smolts might lead to increased mortality and/or reduced growth at sea (Finstad and Jonsson, 2001; Skilbrei and Wennevik, 2006; Hvidsten et al., 2007). With an increasing number of salmon pro‐duced in aquaculture (see Section 2.2), the number of lice per farmed fish needs to be

18 | Extract ICES WGNAS REPORT 2010
reduced simply to maintain the infection pressure at a constant level (Heuch and Mo, 2001).
2.4.10 Catches of pink salmon in the NEAC area
Pink salmon were introduced to Atlantic salmon rivers in the White Sea region of Russia between the 1950s and 1990s. Eggs from the Sakhalin Island and Magadan regions in the far east of Russia were transferred to hatcheries in the Murmansk and Archangelsk regions and juveniles released annually to White Sea rivers during spring. No juvenile releases have taken place since 2003, but pink salmon now spawn naturally in a number of salmon rivers in Russia and possibly in some other NEAC countries (Norway, Iceland and UK (Scotland)).
There is now a fishery for pink salmon in coastal areas of the White Sea using the same gears, and over the same period, as the fishery for Atlantic salmon. Pink salmon run in relatively large numbers only in odd years; in even years the abundance of pink salmon is very low. Fishing for pink salmon in Russia is only allowed in licensed fisheries, and the total declared catch in 2009 was 139 t, the second highest in the time‐series and double the declared catch of Atlantic salmon. The potential interac‐tions between pink salmon and Atlantic salmon in freshwater and the sea are un‐known, and fisheries targeting pink salmon also catch Atlantic salmon.
2.4.11 Reintroduction of salmon-developments on the River Rhine
The programme of reintroducing Atlantic salmon to the River Rhine started 20 years ago and the first adult salmon was recorded in the River Sieg, a tributary of the Rhine, in 1990, more than 30 years after the extirpation of salmon from the Rhine catchment. Naturally produced juvenile salmon were first observed in 1994 and since the start of the programme more than 5600 adult salmon, mainly from stocking, have now been recorded in the Rhine and its tributaries. Stocking of juveniles is planned to continue.
The downstream migration of Atlantic salmon smolts was again monitored in the River Rhine in 2009. The study aims to investigate the success of downstream migra‐tion and to assess the migration routes in relation to the obstructions within the Rhine Delta, particularly the Haringvliet sluices. Overall, 120 tagged fish were released into two tributaries of the River Rhine about 330 km from the sea. By the end of the migra‐tion period (end of April), 73 of the 120 tagged fish (61%) had been detected leaving the tributaries, but only 15 (13%) were recorded reaching the sea after passage through the delta. In addition to the 47 tagged fish (39%) lost in the tributaries where the fish were released, another 20 fish (17%) were lost in the German part of the Rhine and a further 38 smolts (32%) failed to migrate successfully through the delta (the Netherlands) to the sea. Losses in 2009 and 2008 were significantly higher than in 2007 when 46% of the smolts were recorded reaching the sea; this may reflect higher discharge in 2007.
The Study will be repeated after the planned reopening of the Haringvliet dam. This is scheduled to occur by the end of 2010 and is aimed specifically at improving condi‐tions for migratory fish species during their passage from freshwater to the sea and vice versa.
2.4.12 European regulations
ICES has previously noted that European regulations such as the Habitats Directive and Water Framework Directive have implications for management of salmon and are consistent with NASCO objectives (ICES 2009a). In addition, the EU data collec‐
Extract ICES WGNAS REPORT 2010 | 19
tion regulation was expanded in 2009 to include both salmon and eels and for these species into inland waters (ICES 2009a).
2.5 NASCO has asked ICES to continue work already initiated to investigate associations between changes in biological characteristics of all life stages of Atlantic salmon, environmental changes and variations in marine sur-vival with a view to identifying predictors of abundance
ICES considered a preliminary report from the second meeting of the Study Group on the Identification of Biological Characteristics for Use as Predictors of Salmon Abun‐dance [SGBICEPS] and a new approach for estimating at‐sea survival of repeat spawning adult salmon, applied to data from the LaHave River, Canada.
2.5.1 Report from the Study Group on the Identification of Biological Character-istics for use as Predictors of Salmon Abundance [SGBICEPS]
The Study Group on the Identification of Biological Characteristics for Use as Predic‐tors of Salmon Abundance [SGBICEPS] was established by ICES with the following terms of reference:
a ) identify data sources and compile time‐series of data on marine mortality of salmon, salmon abundance, biological characteristics of salmon and re‐lated environmental information;
b ) consider hypotheses relating mortality (freshwater and marine) and/or abundance trends for Atlantic salmon stocks with changes in biological characteristics of all life stages and environmental changes;
c ) conduct preliminary analyses to explore the available datasets and test the hypotheses.
At its first meeting, the Study Group completed a review of the information on the life‐history strategies of salmon and changes in the biological characteristics of the fish in relation to key environmental variables as a foundation for addressing the ToR (ICES 2009b).
Data sources on Biological characteristics
The Study Group continued the work to compile a suite of standard biological meas‐ures over time‐series (>15 years) sufficient to account for natural variability and to facilitate trend analysis. Additional datasets were made available at the second meet‐ing for seven rivers in Norway and three rivers in the Baltic and a number of gaps were filled and time‐series extended in other, existing datasets. Thus, data on average annual values for various biological characteristics were available for North Atlantic stocks from Canada, USA, Iceland, Russia, Finland, Norway, Sweden, UK (Scotland), UK (England and Wales), UK (N. Ireland) and France, as well as for three stocks in the Baltic Sea (Table 2.5.1.1).
Data quality issues
At its first meeting, the Study Group noted a number of potential constraints and ca‐veats, mostly relating to sampling programmes and methodological differences, which might affect analysis of available datasets. Descriptions of the data sources and the methodology used to collect the data were therefore collected from the various tagging agencies.

20 | Extract ICES WGNAS REPORT 2010
Condition Factor investigations
The Study Group completed initial investigations of changes in condition factor (CF) at its first meeting, building on the analyses (1993 to 2006) described by Todd et al. (2008) of CF variation in 1SW fish from two fisheries in UK(Scotland) in relation to ocean climate change. Work is ongoing to further analyse CF in both 1SW and 2SW fish for a number of rivers in UK (Scotland) (Tweed, Tay, Spey, North Esk), Wales (Dee) and three rivers from Norway (located in southern, central and northern areas); some of these time‐series date back to the early 1960s. With the availability of data on 2SW fish, SST analyses have been extended to the NW Atlantic and investigations have included consideration of the most appropriate SST databases to utilize.
Exploratory data analyses
Investigations at the first meeting highlighted significant trends over time for many of the variables explored. The results of some of the new analyses completed during the second meeting of the Study Group are summarized below.
Mean length of returning adult 1SW salmon
The extended biological characteristics dataset was used to investigate changes in the size of returning 1SW salmon. Standardised z‐scores were generated for twelve rivers in the N NEAC area and six rivers in the S NEAC area over the time period 1989 to 2008; this period was chosen to maximize the number of available datasets, a number of which only extended back to 1989. The mean lengths of N NEAC and S NEAC fish were found to be significantly correlated (r = 0.60, n = 20, p = 0.006) (Figure 2.5.1.1), suggesting that 1SW salmon over a large area of the NE Atlantic experience similar growth conditions during their first year at sea.
Further investigation indicated that the z‐scores of 1SW length were also significantly correlated with the PFA of maturing 1SW salmon for both the N and S NEAC areas (N NEAC: r = 0.70, n = 20, p = 0.001, Figure 2.5.1.2; S NEAC: r = 0.49, n = 20, p = 0.027, Figure 2.5.1.3). This suggests that reduced growth in the first year at sea leads to re‐duced survival or delayed maturation, and/or that better growth leads to increased survival or earlier maturation.
Wider geographical patterns-Meta analysis
The Study Group repeated earlier analyses on the extended datasets to explore pat‐terns in the changes in biological characteristics over broader spatial scales. For these purposes the individual river stocks were allocated to the five different stock complex groupings as indicated in Table 2.5.1.1. Meta‐analysis (ICES 2009b) was used to exam‐ine spatial patterns in these groups for most of the biological characteristics available over the period since 1989. Example plots are provided at Figure 2.5.1.4 and the re‐sults summarized in Table 2.5.1.2. These analyses indicated a number of significant changes over time at the stock complex level. For example, significant differences from the mean were noted for:
• N NEAC and S NEAC Regions‐reduction in river age; • N NAC and S NAC Regions‐earlier adult return date; • N NEAC and S NEAC Regions‐reduced size of 1SW and 2SW fish; • N NEAC region and Baltic‐decrease in proportion of 1SW fish and increase
in proportion of 2SW.

Extract ICES WGNAS REPORT 2010 | 21
Life-history modelling
A life‐history model (LHM) developed by Aprahamian et al. (2008) was used to esti‐mate overall egg‐to‐adult mortality. The model was validated by comparing outputs (estimated numbers of spawning adults by sea age) with observed values for five southern NEAC indicator rivers: the Welsh Dee, Bush, Burrishoole, Frome and North Esk for various 5‐year periods. The overall lifetime mortality estimates revealed no consistent systematic increase for the various stocks and no major change in overall lifetime mortality was apparent since the late 1970s/early 1980s suggesting that any increases in natural mortality had been largely offset by declines in fishing mortality and/or other anthropogenic factors.
Lifetime fecundity (eggs/female surviving to spawn) is suggested to provide the most suitable measure of fitness for stable populations (e.g. Roff, 1992; Stearns, 1992). The model was re‐run to predict the optimal sea age‐at‐maturity which maximized the number of eggs per female for the five rivers for the various 5‐year periods (the Op‐timal Age Model‐OAM). There was no significant difference between the observed proportions of salmon maturing at different sea ages and that estimated from the OAM for the: Bush, Burrishoole, North Esk and Frome; differences for the Dee were relatively small, but significant. The results therefore suggest that lifetime fecundity is being maximized for most of these rivers.
The Study Group noted that both the LHM and OAM would benefit from estimat‐ing/using life‐stage specific values of mortality; to explore their effects on age‐at‐maturity. It seemed unlikely that changes in sea age‐at‐maturity (or other biological characteristics) could be used to predict mortality. Changes in such characteristics reflect changes in mortality, and/or growth and fecundity, so are likely to be manifest retrospectively after an unknown number of generations.
Case studies
The Study Group reviewed information from a number of river or area‐specific inves‐tigations.
River Burrishoole (Ireland)
The smolt run on the River Burrishoole has been monitored since 1970; since this time there has been a significant trend towards earlier commencement of the run (meas‐ured as 5% of the fish migrating), with the run now starting around 10 days earlier than at the start of the period. Survival of wild salmon ova to smolt has varied be‐tween 0.32% and 1.22% over the time period with no significant trend.
River Bush (N. Ireland)
The smolt run on the river has been monitored for 30 years. Over this time, the run has occurred progressively earlier, by around 3.6 to 4.8 days every 10 years. The onset of the run (measured as the date on which 25% of total annual emigration has oc‐curred) is now 10 to 11 days earlier than at the start of the period. The change is be‐lieved to be linked to changes in the ambient river temperature.
The survival of 1SW salmon returning to the Bush has been strongly influenced by smolt run timing, with later emigrating cohorts having better survival (Figure 2.5.1.5). It has been suggested that this might be explained by a thermal mismatch mecha‐nism, because there has been a marked divergence in spring river and sea tempera‐tures over recent years (Kennedy and Crozier, in press). It is unclear whether this mis‐match mechanism might apply more widely or is peculiar to the Bush. The Bush is unusual in discharging to the sea over a beach and does not have a typical estuary to
22 | Extract ICES WGNAS REPORT 2010
provide a transition zone for migrating smolts. Preliminary investigation of river and inshore sea temperatures for a number of rivers in UK (England and Wales) did not provide any evidence of a potential spring thermal mis‐match.
Later age-at-maturity in Norwegian salmon stocks in recent years
There is a significant positive relationship between the PFA of 1SW Norwegian salmon stocks in one year and the PFA of 2SW salmon in the following year. How‐ever, in recent years evidence of three regions in Norway indicates that more salmon return as 2SW fish than expected from this relationship. The change in proportion at‐age could be explained by later maturation, and/or by an increase in survival in the second year at sea relative to the first year. If the first is true one might expect an in‐crease in the proportion of male salmon among the returning 2SW fish (because grilse are traditionally male dominated), whereas the sex ratio among 2SW fish is likely to be unchanged if the second explanation is more valid. These competing hypotheses are still under investigation.
Analysis of North Esk (UK (Scotland)) smolt age data
Time‐series of age data for four major salmon rivers in Scotland were investigated. It was noted that at least some of the observed variability in river ages could be ex‐plained by changes in the scale sampling procedures on returning adult fish (e.g. changes in the sampling periods due to altered netting seasons). This highlighted the importance of ensuring a consistent approach in the selection of the data which may require truncation of the time‐series.
The smolt run on River North Esk has been monitored since the early 1960s and con‐sistent sampling of returning adults provided an opportunity for comparing the age‐structure of the annual emigrant smolt population with the river age‐structure of re‐turning adults for the period 1975 to1999 (the period over which consistent methods have been used for sampling both smolts and adults). Since 1964, there has been a slight, but significant, increase in the proportion of S1 smolts (P = 0.037) on the North Esk; no change in the S2s (P = 0.068), but a significant decrease in both the S3s (P = 0.004) & S4s (P = 0.001). Overall, there is a downward trend in the mean river age of emigrant smolts, probably reflecting recent warming of the freshwater environment.
Comparison of the river‐age structure of emigrant smolts with that in returning adults indicates close concordance ‐ the overall river age‐structure of returning adult fish reflects that of the emigrant population 1 or 2 years previous, as appropriate. In returning 1SW fish, S2 smolts are slightly over‐represented and S1s and S3s slightly underrepresented (Figure 2.5.1.6(a)), whereas for 2SW salmon, smolts that emigrated as S3s are slightly over‐represented (Figure 2.5.1.6(b)). However, when 1SW and 2SW fish from consecutive years are pooled, the data converge on the line of unity (Figure 2.5.1.6(c)).
These results suggest that S1 to S4 smolts have an equal probability of returning to reproduce. Early mortality‐at‐sea, generally perceived to be critical to recruitment, does not appear to be dependent on river‐age.
It was noted that if these findings were generally applicable, then monitoring of the river‐age structure of emigrant smolts could have predictive value for subsequent returning adults. Similarly, there would be potential to use river age‐distribution from adult scale archives to assess earlier changes in age at smoltification.

Extract ICES WGNAS REPORT 2010 | 23
Baltic salmon
The Study Group noted that WGBAST were also addressing concerns related to at‐sea survival of salmon. Further progress was made at the last meeting (ICES 2009c):
Post‐smolt survival in the Baltic Sea has decreased in recent years, both for wild and hatchery‐reared smolts. This decline started in the mid 1990s, though the reasons are not entirely clear. There have been pronounced changes in the Baltic in the last two decades and a number of hypotheses have been proposed to explain the reduction in post‐smolt survival:
• competition hypothesis‐intraspecific competition; • food availability hypothesis‐juvenile herring are important prey for young
salmon; • seal predation hypothesis; • smolt quality hypothesis.
Initial analyses of predictor variables have indicated that survival of wild post‐smolts is negatively correlated with seal abundance, negatively correlated with total smolt production in the Gulf of Bothnia and positively correlated with herring recruitment in both Bothnian Bay and Bothnian Sea. Results from modelling investigations (31 models were fitted to post‐smolt survival estimates) suggest that herring recruitment in the Gulf of Bothnia is able to explain a large proportion of the annual variation in post‐smolt survival, but not the negative trend in survival over the last decade. The addition of seal abundance to the models captures this decline. The levels of seal pre‐dation required to explain the estimated reduction in post‐smolt survival is within realistic levels. However, available information on seal diet is limited and more work is needed on this and in relation to the spatial distribution of seals in spring and summer, and on post‐smolt migration routes.
Next steps
The second Study Group report is in progress. The Report will address the Terms of Reference as fully as possible in terms of summarizing evidence of linking abundance trends for Atlantic salmon stocks with changes in biological characteristics. However, in the absence of oceanographic expertise or representation from the NW Atlantic at the second meeting, the Study Group’s ability to explore changes in biological charac‐teristics of salmon across the entire range of the species and relate these to environ‐mental variables was somewhat constrained. In completing the report, the Study Group will therefore aim to highlight hypotheses that might be explored further and seek to recommend ways in which this work might best be developed in support of wider ICES objectives. The Study Group is also continuing to liaise in developing a number of proposed peer reviewed papers.
ICES recognized the value of the work completed by SGBICEPS and that the Study Group had been constrained by the lack of wider representation and the difficulties of involving oceanographers. ICES noted the ongoing efforts of the Study Group with regard to developing peer‐reviewed outputs and recommended that the datasets col‐lated by the Study Group should be fully utilized and made available to ICES in sup‐port of further analyses as appropriate.
2.5.2 Bayesian application of the ratio method for estimating at-sea survival to repeat spawning adult salmon in the LaHave River, Nova Scotia, Canada
To further our understanding of the causes of declines in salmon abundance and population viability, a model was developed for estimation of the survival of repeat

24 | Extract ICES WGNAS REPORT 2010
spawning kelts. The model is a statistical, Bayesian extension of the ratio model that has been used to calculate survival of post‐smolts (Chaput et al., 2003). The model produces annual estimates of the probability of consecutive spawning, as well as an‐nual estimates of mortality in the 1st (Z1) and 2nd (Z2) years. When fitted to adult count data, the Z1 parameter includes mortality associated with spawning, recondi‐tioning, overwintering and a brief period at sea, whereas the vast majority of the mor‐tality modelled using the Z2 parameter occurs at sea.
The model was fitted to adult repeat‐spawning Atlantic salmon data from the La‐Have River (above Morgans Falls), Nova Scotia, Canada, for the period 1978 to 2008. The resulting estimates of Z1 reveal an increasing trend throughout the time‐series, whereas Z2 also increased but tended to oscillate (Figure 2.5.2.1). Decadal compari‐sons of parameter estimates (Table 2.5.2.1) indicate that Z1 has continued to trend upward, potentially indicating increasing mortality in freshwater or marine nearfield regions, whereas average Z2 values increased from the 1980s to the 1990s, consistent with a regime shift in the oceanic (far‐field) environments. The probability of con‐secutive spawning varied during the time period without any obvious trend. A pre‐liminary comparison of the Z2 parameter indicated that from 1978 to 2000, fluctuations in the Z2 parameter matched fluctuations in the North Atlantic Oscilla‐tion Index (Figure 2.5.2.2), although this relationship was not apparent after 2000, potentially indicative of a change in regulatory mechanism in the later time period (low abundance effects cannot be ruled out as a confounding factor at this time).
2.6 NASCO has asked ICES to describe how catch and release mortality and unreported catch are incorporated in national and international stock as-sessments and indicate how they can best be incorporated in future advice to NASCO
ICES reviewed information on how catch and release mortality and unreported catches are incorporated in national and international stock assessments.
2.6.1 Catch and release mortality
ICES previously reviewed information on the levels of prespawning mortality of salmon and the implications for stock assessments at its meeting in 2009 (ICES 2009a). Table 2.6.1 outlines the procedures currently used to incorporate C&R mortality in regional and national assessments and provides suggestions for possible future im‐provements.
ICES also noted that there were new projects aimed at estimating the impact of C&R on the reproductive success of Atlantic salmon, which had started in Canada in 2009. Results are expected to be available in 2011.
2.6.2 Unreported catch
ICES noted that descriptions of the national approaches used for evaluating unre‐ported catches have previously been reported at various meetings (e.g. ICES, 1996; ICES, 2000; ICES 2002). In addition, detailed reports describing national procedures for evaluating unreported catch, and efforts to minimize this, were submitted by par‐ties to NASCO in 2007 in support of a special theme session on this issue.
Table 2.6.2 outlines the procedures currently used to incorporate unreported catches into regional, national and international assessments and provides suggestions for possible future improvements.
Extract ICES WGNAS REPORT 2010 | 25
2.7 NASCO has asked ICES to provide a compilation of tag releases by country in 2009 and advise on progress with analysing historical tag recovery data from oceanic areas
2.7.1 Compilation of tag releases and fin clip data by ICES Member Countries in 2009
Data on releases of tagged, finclipped, and otherwise marked salmon in 2009 were provided by ICES and are compiled as a separate report (ICES 2010). A summary of tag releases is provided in Table 2.7.1.1.
2.7.2 Summary of the Workshop on Learning from Salmon Tagging records (WKLUSTRE)
This Workshop on Learning from Salmon Tagging Records (WKLUSTRE) (ICES 2009d) was the third of a series of three such workshops aimed to record and analyse data from old tagging experiments. The first was the Workshop on the Development and Use of Historical Salmon Tagging Information from Oceanic Areas (WKDUHSTI) (ICES 2007a) and the second was the Workshop on Salmon Historical Information‐New Investigations from Old Tagging Data (WKSHINI) (ICES 2008b).
The objectives of the WKLUSTRE Workshop were to: (a) further develop the interna‐tional database of marine tagging and tag recovery information for Atlantic salmon; (b) use the database to investigate the distribution of salmon for differences in time and space, and assess changes in the distribution over time; (c) investigate the use of the database to verify outputs from migration models and (d) recommend future salmon tagging studies and investigations of salmon mortality‐at‐sea.
The Workshop described and updated the NE and NW Atlantic tag databases and suggested how the Faroese data could be analysed further in relation to information from the fisheries. Analysis of the proportion of recoveries from East Greenland sug‐gested that MSW salmon from northern Europe have a more easterly distribution that those from southern Europe. Temporal variation in size at capture and spatial differ‐ences in patterns of recovery were also reported.
ICES endorsed the recommendations made by WKLUSTRE, which include: long‐term storage of the tag databases so that the data are not lost; the reports of the three Workshops on salmon tagging data (WKDHUSTI, WKSHINI, WKLUSTRE) should be combined into a single ICES Co‐operative Research Report; and the peer‐reviewed publication of these results. Permission is being sought from the owners of the tag data to store the data centrally, and the ICES Data Centre has indicated they would be willing to act as the central repository.

26 | Extract ICES WGNAS REPORT 2010
Table 2.1.1.1 Reported total nominal catch of salmon by country (in tonnes round fresh weight), 1960 to 2009. (2009 figures include provisional data).
TotalSweden UK UK UK East West Reported
Year Canada USA St. P&M Norway Russia Iceland (West) Denmark Finland Ireland (E & W) (N.Irl.) (Scotl.) France Spain Faroes Grld. Grld. Other Nominal(1) (2) (3) Wild Ranch (4) (5,6) (6,7) (8) (9) (10) (11) (12) Catch
1960 1636 1 - 1659 1100 100 - 40 - - 743 283 139 1443 - 33 - - 60 - 72371961 1583 1 - 1533 790 127 - 27 - - 707 232 132 1185 - 20 - - 127 - 64641962 1719 1 - 1935 710 125 - 45 - - 1459 318 356 1738 - 23 - - 244 - 86731963 1861 1 - 1786 480 145 - 23 - - 1458 325 306 1725 - 28 - - 466 - 86041964 2069 1 - 2147 590 135 - 36 - - 1617 307 377 1907 - 34 - - 1539 - 107591965 2116 1 - 2000 590 133 - 40 - - 1457 320 281 1593 - 42 - - 861 - 94341966 2369 1 - 1791 570 104 2 36 - - 1238 387 287 1595 - 42 - - 1370 - 97921967 2863 1 - 1980 883 144 2 25 - - 1463 420 449 2117 - 43 - - 1601 - 119911968 2111 1 - 1514 827 161 1 20 - - 1413 282 312 1578 - 38 5 - 1127 403 97931969 2202 1 - 1383 360 131 2 22 - - 1730 377 267 1955 - 54 7 - 2210 893 115941970 2323 1 - 1171 448 182 13 20 - - 1787 527 297 1392 - 45 12 - 2146 922 112861971 1992 1 - 1207 417 196 8 18 - - 1639 426 234 1421 - 16 - - 2689 471 107351972 1759 1 - 1578 462 245 5 18 - 32 1804 442 210 1727 34 40 9 - 2113 486 109651973 2434 3 - 1726 772 148 8 23 - 50 1930 450 182 2006 12 24 28 - 2341 533 126701974 2539 1 - 1633 709 215 10 32 - 76 2128 383 184 1628 13 16 20 - 1917 373 118771975 2485 2 - 1537 811 145 21 26 - 76 2216 447 164 1621 25 27 28 - 2030 475 121361976 2506 1 3 1530 542 216 9 20 - 66 1561 208 113 1019 9 21 40 <1 1175 289 93271977 2545 2 - 1488 497 123 7 10 - 59 1372 345 110 1160 19 19 40 6 1420 192 94141978 1545 4 - 1050 476 285 6 10 - 37 1230 349 148 1323 20 32 37 8 984 138 76821979 1287 3 - 1831 455 219 6 12 - 26 1097 261 99 1076 10 29 119 <0.5 1395 193 81181980 2680 6 - 1830 664 241 8 17 - 34 947 360 122 1134 30 47 536 <0.5 1194 277 101271981 2437 6 - 1656 463 147 16 26 - 44 685 493 101 1233 20 25 1025 <0.5 1264 313 99541982 1798 6 - 1348 364 130 17 25 - 54 993 286 132 1092 20 10 606 <0.5 1077 437 83951983 1424 1 3 1550 507 166 32 28 - 58 1656 429 187 1221 16 23 678 <0.5 310 466 87551984 1112 2 3 1623 593 139 20 40 - 46 829 345 78 1013 25 18 628 <0.5 297 101 69121985 1133 2 3 1561 659 162 55 45 - 49 1595 361 98 913 22 13 566 7 864 - 81081986 1559 2 3 1598 608 232 59 54 - 37 1730 430 109 1271 28 27 530 19 960 - 92551987 1784 1 2 1385 564 181 40 47 - 49 1239 302 56 922 27 18 576 <0,5 966 - 81591988 1310 1 2 1076 420 217 180 40 - 36 1874 395 114 882 32 18 243 4 893 - 77371989 1139 2 2 905 364 141 136 29 - 52 1079 296 142 895 14 7 364 - 337 - 59041990 911 2 2 930 313 141 285 33 13 60 567 338 94 624 15 7 315 - 274 - 4925
NAC Area NEAC (N. Area) NEAC (S. Area) Faroes & Greenland

Extract ICES WGNAS REPORT 2010 | 27
Table 2.1.1.1 continued.
Total Sweden UK UK UK East West Reported
Year Canada USA St. P&M Norway Russia Iceland (West) Denmark Finland Ireland (E & W) (N.Irl.) (Scotl.) France Spain Faroes Grld. Grld. Other Nominal(1) (2) (3) Wild Ranch (4) (5,6) (6,7) (8) (9) (10) (11) (12) Catch
1991 711 1 1 876 215 129 346 38 3 70 404 200 55 462 13 11 95 4 472 - 4,1061992 522 1 2 867 167 174 462 49 10 77 630 171 91 600 20 11 23 5 237 - 4,1191993 373 1 3 923 139 157 499 56 9 70 541 248 83 547 16 8 23 - - - 3,6961994 355 0 3 996 141 136 313 44 6 49 804 324 91 649 18 10 6 - - - 3,9451995 260 0 1 839 128 146 303 37 3 48 790 295 83 588 10 9 5 2 83 - 3,6291996 292 0 2 787 131 118 243 33 2 44 685 183 77 427 13 7 - 0 92 - 3,1361997 229 0 2 630 111 97 59 19 1 45 570 142 93 296 8 4 - 1 58 - 2,3641998 157 0 2 740 131 119 46 15 1 48 624 123 78 283 8 4 6 0 11 - 2,3951999 152 0 2 811 103 111 35 16 1 62 515 150 53 199 11 6 0 0 19 - 2,2472000 153 0 2 1,176 124 73 11 33 5 95 621 219 78 274 11 7 8 0 21 - 2,9122001 148 0 2 1,267 114 74 14 33 6 126 730 184 53 251 11 13 0 0 43 - 3,0692002 148 0 2 1,019 118 90 7 28 5 93 682 161 81 191 11 9 0 0 9 - 2,6542003 141 0 3 1,071 107 99 11 25 4 78 551 89 56 192 13 9 0 0 9 - 2,4572004 161 0 3 784 82 111 18 20 4 39 489 111 48 245 19 7 0 0 15 - 2,1572005 139 0 3 888 82 129 21 15 8 47 422 97 52 215 11 13 0 0 15 - 2,1562006 137 0 3 932 91 93 17 14 2 67 326 80 29 192 13 11 0 0 22 - 2,0292007 112 0 2 767 63 93 36 16 3 58 85 67 30 169 11 9 0 0 25 - 1,5462008 158 0 4 807 73 132 69 18 9 71 89 64 21 160 12 9 0 0 26 - 1,7202009 119 0 3 595 71 121 42 17 8 36 68 51 17 120 4 2 0 1 26 - 1,300
Average2004-2008 141 0 3 836 78 112 32 17 5 56 282 84 36 196 13 10 0 0 21 - 1,9211999-2008 145 0 3 952 96 101 24 22 5 74 451 122 50 209 12 9 1 0 20 - 2,295Key:
1. Includes estimates of some local sales, and, prior to 1984, by-catch. 9. Weights estimated from mean weight of fish caught in Asturias (80-90% of Spanish catch).
2. Before 1966, sea trout and sea charr included (5% of total). 10. Between 1991 & 1999, there was only a research fishery at Faroes. In 1997 & 1999 no fishery took place;
3. Figures from 1991 to 2000 do not include catches taken the commercial fishery resumed in 2000, but has not operated since 2001.
in the recreational (rod) fishery. 11. Includes catches made in the West Greenland area by Norway, Faroes,
4 From 1990, catch includes fish ranched for both commercial and angling purposes. Sweden and Denmark in 1965-1975.
5. Improved reporting of rod catches in 1994 and data derived from carcase tagging 12. Includes catches in Norwegian Sea by vessels from Denmark, Sweden, Germany, Norway and Finland.
and log books from 2002. 13. No unreported catch estimate for Canada since 2007 and for Russia since 2008.
6. Catch on River Foyle allocated 50% Ireland and 50% N. Ireland. 14. Estimates refer to season ending in given year.
7. Angling catch (derived from carcase tagging and log books) first included in 2002.
8. Data for France include some unreported catches.
NAC Area NEAC (N. Area) NEAC (S. Area) Faroes & Greenland

28 | Extract ICES WGNAS REPORT 2010
Table 2.1.2.1 Numbers of fish caught and released in rod fisheries along with the % of the total rod catch (released + retained) for countries in the North Atlantic where records are available, 1991–2008. Figures for 2008 are provisional.
YearTotal % of total Total % of total Total % of total Total % of total Total % of total Total % of total Total % of total Total % of total Total % o
rod rod rod rod rod rod rod rod rcatch catch catch catch catch catch catch catch ca
1991 28,497 33 239 50 3,211 511992 46,450 34 407 67 10,120 731993 53,849 41 507 77 11,246 82 1,448 101994 61,830 39 249 95 12,056 83 3,227 13 6,595 81995 47,679 36 370 100 11,904 84 3,189 20 12,151 141996 52,166 33 542 100 669 2 10,745 73 3,428 20 10,413 151997 57,252 49 333 100 1,558 5 14,823 87 3,132 24 10,965 181998 62,895 53 273 100 2,826 7 12,776 81 5,365 31 13,464 181999 55,331 50 211 100 3,055 10 11,450 77 5,447 44 14,846 282000 64,482 55 0 - 2,918 11 12,914 74 7,470 42 21,072 322001 59,387 55 0 - 3,611 12 16,945 76 6,143 43 27,724 382002 50,924 52 0 - 5,985 18 25,248 80 7,658 50 24,058 422003 53,645 55 0 - 5,361 16 33,862 81 6,425 56 29,160 552004 62,316 55 0 - 7,362 16 24,679 76 13,211 48 46,279 50 255 12005 63,005 62 0 - 9,224 17 23,592 87 11,983 56 46,069 55 2,553 12 606 22006 60,486 62 1 100 8,735 19 33,380 82 10,959 56 47,556 55 5,409 22 302 18 794 62007 44,423 59 3 100 9,691 18 44,341 90 10,917 55 55,515 61 13,125 40 470 16 959 52008 67,643 58 61 100 17,178 20 41,881 86 13,035 55 53,139 62 13,312 37 648 20 2,033 72009 47,862 60 0 - 17,619 24 - - 8,828 58 49,557 68 10,265 37 847 21 1,709 5
5-yr mean 2004-2008 59,575 59 10,438 18 33,575 84 12,021 54 49,712 56 1,059 4% change on 5-year mean
-20 +1 +69 +33 -27 +7 0 +20 +61 +
Key: 1 No data for 2009 was provided by the authorities. However, catch and release has remained at similar high levels.2 Data for the DCAL area only3 The statistics were collected on a voluntary basis, the numbers reported should be regarded as a minimum
DenmarkCanada UK (Scotland)UK (E&W)Russia 1IcelandUSA Ireland UK (N Ireland) 2

Extract ICES WGNAS REPORT 2010 | 29
Table 2.1.3.1 Estimates of unreported catches (tonnes round fresh weight) by various methods by country within national EEZs in the North East Atlantic, North American and West Greenland Commissions of NASCO, 2009.
2009 Unreported as % of Total Unreported as % of TotalUnreported Reported National Catch North Atlantic Catch
Country catch (t) catch (t) (Unreported + Reported) (Unreported + Reported)
NEAC Denmark 4 8 33.9% 0.3%NEAC Finland 7 36 16.3% 0.4%NEAC Iceland 12 163 6.8% 0.7%NEAC Ireland 7 68 9.1% 0.4%NEAC Norway 255 595 30.0% 15.7%NEAC Russia na 71 na naNEAC Sweden 2 17 10.5% 0.1%NEAC France 1 4 21.7% 0.1%NEAC UK (E & W) 12 51 19.1% 0.7%NEAC UK (N. Ireland) 0 17 0.0% 0.0%NEAC UK (Scotland) 17 120 12.4% 1.0%NEAC Spain na 2 na naNAC Canada na 119 na naNAC St. P&M na 3 na naNAC USA 0 0WGC West Greenland 10 26 27.5% 0.6%
Total 327 1300 20.1% 20.1%
Commission Area

30 | Extract ICES WGNAS REPORT 2010
Table 2.5.1.1 Biological characteristics datasets made available to the second meeting of SGBI‐CEPS (Y denotes data available for all or part of the time‐series).
Stock complex
Coun
try
Stock
Hatchery/Wild
Time series
Latitud
e
Stock status
Median run date
Mean run date
River age mean
Sea age mean
Prop
. Run
by sea‐age
Mean fork length
Mean who
le weight
Cond
ition
Factor
Prop
. fem
ale by
sea‐age
Prop
. maiden spaw
ners
by sea‐age class
NAC (N) Canada Western Arm Brook W 1971‐06 51.2 Y Y Y Y Y Y Y Y Y Y YCanada Middle Brook W 1975‐05 48.8 Y Y Y Y Y Y Y Y Y Y YCanada Conne River W 1986‐06 47.9 Y Y Y Y Y Y Y Y Y Y YCanada Miramichi W 1971‐07 47.0 Y Y Y Y Y Y Y Y Y
NAC (S) Canada Nashwaak W 1972‐08 46.0 Y Y Y Y Y Y Y Y YCanada St John (Mactaquac) W 1978‐08 45.3 Y Y Y Y Y Y Y Y Y Y YCanada St John (Mactaquac) H 1978‐08 45.3 Y Y Y Y Y Y Y Y Y Y YCanada La Have W 1970‐08 44.4 Y Y Y Y Y Y Y Y Y Y YCanada La Have H 1972‐08 44.4 Y Y Y Y Y Y Y Y Y Y YUSA Penobscot H 1978‐08 44.5 Y Y Y Y Y Y Y Y Y Y Y
N NEAC Finland/Norway Teno W 1972‐07 70.8 Y Y Y Y Y Y Y YFinland/Norway Näätämöjoki W 1975‐06 69.7 Y Y Y Y Y Y Y YRussia Tuloma W 1983‐08 68.9 Y Y Y Y Y Y Y Y Y Y YNorway Vestre Jakobselv W 1989‐08 70.1 Y Y Y Y Y Y YNorway Årgårdsvassdraget W 1992‐08 64.3 Y Y Y Y Y Y YNorway Nausta W 1989‐08 61.3 Y Y Y Y Y Y YNorway Gaula Sogn og Fjordane W 1989‐08 61.2 Y Y Y Y Y Y YNorway Etneelva W 1989‐08 59.4 Y Y Y Y Y Y YNorway Skienselva W 1989‐08 59.1 Y Y Y Y Y Y YNorway Numedalslågen W 1989‐08 59.1 Y Y Y Y Y Y YNorway Enningdalselva W 1990‐08 58.6 Y Y Y Y Y Y YNorway Gaula W 1989‐08 63.3 Y Y Y Y Y Y YIceland (N&E) Laxa I Adaldalur W 1974‐08 65.6 Y Y Y Y YIceland (N&E) Hofsa W 1971‐08 65.4 Y Y Y Y Y
S NEAC Iceland (S&W) Nordura W 1968‐08 64.6 Y Y Y Y YIceland (S&W) Ellidaar W 1949‐08 64.1 Y Y Y Y YUK (Scot) N. Esk W 1981‐08 56.7 Y Y Y Y YUK (NI) Bush W 1973‐07 55.1 Y Y Y Y Y Y Y Y Y Y YUK (E&W) Lune W 1987‐08 54.0 Y Y Y Y Y Y YUK (E&W) Dee W 1937‐08 53.4 Y Y Y Y Y Y Y YUK (E&W) Wye W 1910‐07 51.6 Y Y Y Y Y Y Y YUK (E&W) Frome W 1968‐08 50.7 Y Y Y YFrance Bresle W 1984‐08 50.1 Y Y Y
Baltic Sweden Kalix W 1980‐08 65.8 Y YFinland/Sweden Tornionjoki W 1980‐09 65.5 Y Y Y Y Y YSweden Ume/Vindel W 1987‐08 63.8 Y Y Y YSweden Ume/Vindel H 1974‐08 63.8 Y Y Y Y Y Y Y Y

Extract ICES WGNAS REPORT 2010 | 31
Table 2.5.1.2 Results of meta analysis at the stock complex level ‐ indicating significant increase (+) or decrease (‐) relative to the mean (o denotes non‐significant relationship). Stock complex
H/W
Time series
Latitude
Stock size ‐ 1SW
Stock size ‐ 2SW
Mean river age
Mean sea age
Mean total age
Med
ian run da
te
Mean run da
te
Prop
. 1SW
in run
Prop
. 2SW
in run
Prop
. PS in run
Mean leng
th ‐ 1SW
Mean weigh
t ‐ 1
SW
Cond
ition ‐ 1
SW
Mean leng
th ‐ 2SW
Mean weigh
t ‐ 2
SW
Cond
ition ‐ 2
SW
Mean leng
th ‐ PS
Mean weigh
t ‐ P
S
Cond
ition ‐ P
S
Prop
. fem
ale in 1SW
All 1989‐08 ‐ o ‐ o o ‐ ‐ o o + ‐ ‐ o ‐ ‐ o o o + oNAC (N) W 1989‐08 47.0 ‐ 51.2 o ‐ o o + ‐ ‐ o o o + o o o o o o + o ‐NAC (S) H/W 1989‐08 44.4 ‐ 46.0 ‐ ‐ o o o ‐ ‐ o o ‐ ‐ o o o o o o o o oN NEAC W 1989‐08 65.4 ‐ 70.8 o + ‐ + o ‐ + + ‐ ‐ ‐ ‐ ‐ o o o o oS NEAC W 1989‐08 50.1 ‐ 64.6 o o ‐ ‐ ‐ + o o o ‐ ‐ o ‐ ‐ o o ‐ o oBaltic H/W 1989‐08 63.8 ‐ 65.8 o + o o ‐ + o

32 Extract ICES WGNAS REPORT 2010
Table 2.5.2.1 Decadal comparison of the average survivals in the first and second year and the prob‐abilities of consecutive spawning for adult salmon from the LaHave River, Nova Scotia, Canada. The parameters are S1: survival in the first year (including during spawning, overwintering, recondition‐ing and a brief period at sea); S2: mortality in the second year (mostly at sea); and p: the probability of being a consecutive repeat spawner. The subscripts are: M – male, F – female, G – grilse, S – 2SW salmon.
PERIOD
Parameter 1979 to 1988 1989 to 1998 1999 to 2008
S1MG 0.12 0.08 0.05
S1MS 0.49 0.41 0.36
S1F 0.25 0.19 0.14
S2 0.40 0.27 0.26
pMG 0.058 0.055 0.062
pMS 0.022 0.026 0.022
pFG 0.028 0.033 0.020
pFS 0.033 0.071 0.043

Extract ICES WGNAS REPORT 2010 33
Table 2.6.1 Description of how catch‐and‐release mortality is incorporated in regional and national stock assessments.
Commission Area Country/Region How it is used in regional and national assessments Future developments / improvementsNAC Canada‐Quebec C&R has become more popular in the region and C&R
only angling licenses are sold. C&R data are incomplete as there is no requirement to report C&R numbers. Generally, C&R mortality is considered in the assessment but the majority of the assessments are conducted as spawner counts after the fisheries so any losses due to C&R mortality are accounted for in the spawner estimates but not in the returns (which are the sum of known losses and spawning escapement).
New studies of the contribution of C&R fish to spawning success have been initiated. C&R monitoring is become more complete. Consideration will be given in the future to incorporating these losses in the returns and in the assessments based on angling catches, especially as reporting improves.
Canada‐Newfoundland & Labrador
Catch and release mortality is included in estimates of spawners. Spawning escapement is reduced by 5‐15% (mean 10%) of the released catch.
No plans for further development.
Canada ‐ Gulf Assessments of spawners are adjusted by mortality rates of 3% to 6% of the total C&R estimates of small and large salmon. The rates vary by river according to angling seasons, and the occurence of other factors such as disease which can affect survival of salmon.
Catch and release mortality is known to be affected by the water temperatures when fish are angled. In some cases, angling fisheries are closed when water temperatures are high in the summer to reduce the losses of fish from C&R. Methods to determine catch and release numbers vary by river and in some cases, the number of released fish is estimated from returns and historical creel survey data. As the practice of C&R becomes more popular, estimation methods for C&R values will have to be revisited.
Canada – Scotia/Fundy
Assessments are currently adjusted by 4% of the C&R fish to correct for C&R mortality.
Numbers of C&R fish are currently low (retention fisheries are closed). If C&R catches increase, further research on the correction factor would be warranted.
USA No correction for mortality due to C&R used in estimating spawner numbers. However, all fisheries have been closed and the number of fish caught relative to stock size is very small.
NEAC Russia
Norway
Sweden
Iceland
UK(Scotland)
Ireland No correction for mortality due to C&R used in estimating spawner numbers or in the national run‐reconstruction model.
Incorporation of formal method for estimating the effect of C&R on number of returning fish. Incorporation of C&R mortality in estimates of spawning escapement
UK(England & Wales)
With increasing C&R the retained catch for similar effort is reduced. Therefore the exploitation rate for retained fish is lower. The increase in C&R in recent years is incorporated into the national run‐reconstruction model by reducing the exploitation rate value used in the model input. This is assessed qualitatively. 20% mortality of C&R fish used in assessing compliance with river‐specific conservation
If C&R information is incorporated into formal assessments then multiple recaptures should be taken into account.
UK(N. Ireland) Returns are estimated by raising the reported net catch by exploitation rate. No correction for increased C&R mortality is applied when estimating the spawning escapement.
If C&R information is incorporated into formal assessments then multiple recaptures should be taken into account. C&R mortality should be incorporated into estimates of spawning escapement.
Denmark C&R rates recorded, but no national run‐reconstruction assessment applied.
Finland No record of C&R
France No record of C&R
NEAC Faroes
W. Greenland W. Greenland
Not applicable
Not applicable
If C&R information is collected, it should be incorporated into formal assessments and multiple recaptures should be taken into account. C&R mortality should be incorporated into estimates of spawning escapement.
With increasing C&R the retained catch for similar effort is reduced. Therefore the exploitation rate for retained fish is lower. The increase in C&R in recent years is incorporated into the national run‐reconstruction model by reducing the exploitation rate value used in the model input. This is assessed qualitatively. No correction for increased C&R mortality is applied when estimating the spawning escapement.
If C&R information is incorporated into formal assessments then muliple recaptures should be taken into account. C&R mortality should be incorporated into estimates of spawning escapement.

34 Extract ICES WGNAS REPORT 2010
Table 2.6.2 Description of how unreported catch is incorporated in regional, national and interna‐tional stock assessments.
Commission Area Country/Region How it is used in regional and national assessments How used in international assessments Future developments / improvementsNAC Canada‐Quebec Unreported catches are based on historical estimates
relative to stock size or are provided by field conservation and protection staff. Unreported catches when available are included in the regional assessment of returns and spawners.
Canada‐Newfoundland & Labrador
Catch statistics include estimates of harvests by log book non‐respondents. Therefore they are included in the regional assessments and the PFA estimate. No account is taken of illegal fisheries.
Canada ‐ Gulf Unreported catches are sometimes provided by Conservation and Protection Personnel and are estimates of illegal fishing removals within specific regions. Unreported catches have not been used in the assessments of returns or spawners.
Canada – Scotia/Fundy
No adjustment made, with the exception of the Saint John River where returns/spawners are adjusted for estimated bycatch and poaching. In other rivers where assessments directly quantify spawners, returns would be underestimated if catch is under reported.
USA Unreported catch is estimated to be zero and therefore has no effect on national assessments.
NEAC RussiaFinlandNorwaySwedenIcelandIrelandUK(Scotland)UK(England & Wales)UK(N. Ireland)FranceDenmark No national assessment
NEAC Faroes Not applicable Assumed to be negligible unreported catch. Estimate of discard mortality for 1SW fish is incorporated in stock assessments.
Sampling programme if fishery resumes.
W. Greenland W. Greenland Not applicable Unreported catch at West Greenland is incorporated in assessments for both the NAC and NEAC areas. Since 1993, this has been provided by the Greenlandic authorities. Prior to this time, no unreported catch component is included in the models.
Annual variation in unreported catch estimates would be incorporated into the model.
National estimates (which incorporate unreported ctaches) are aggregated to provide PFA, return and spawner estimates for stock complexes.
Incorporate revised estimates of minimum and maximum estimates of unreporting rate as national estimates are improved.
Minimum and maximum estimates of the unreporting rate are used in deriving national PFA estimates from the catch of 1SW & MSW salmon.
Unreported catches which occur in marine waters outside the jurisdiction of the regions are not included in the run reconstruction models.
If unreported catch estimates were provided they could be incorporated in the regional assessments and in the continent estimates of abundance and spawners. Unreported catch may be accounted for in either the returns or the spawners, depending upon when and where the illegal activity occurs relative to the location and time of the assessment model.

Extract ICES WGNAS REPORT 2010 35
Table 2.7.1.1 Summary of Atlantic salmon tagged and marked in 2009‐‘Hatchery’ and ‘Wild’ refer to smolts and parr; ‘Adults’ relates to both wild and hatchery‐origin fish.

36 Extract ICES WGNAS REPORT 2010
Country Origin Microtag External mark Adipose clip Other Internal1 Total
Canada Hatchery Adult 982 332 440 1,754Hatchery Juvenile 2,798 684,213 106 687,117
Wild Adult 3,693 0 539 4,232Wild Juvenile 6,867 21,921 16,614 338 45,740
Total 6,867 29,394 701,159 1,423 738,843France Hatchery Adult 8 8
Hatchery Juvenile 2,202 2,384 257,050 261,636Wild Adult 20 20
Wild Juvenile 302 302Total 2,524 2,392 257,050 0 261,966
Germany Hatchery Adult 0Hatchery Juvenile 21,444 83,096 104,540
Wild Adult 0Wild Juvenile 0
Total 21,444 0 83,096 0 104,540
Iceland Hatchery Adult 22 22Hatchery Juvenile 47,258 47,258
Wild Adult 455 455Wild Juvenile 2,021 12 2,033
Total 49,279 489 0 0 49,768
Ireland Hatchery Adult 0Hatchery Juvenile 241,002 241,002
Wild Adult 0Wild Juvenile 5,850 5,850
Total 246,852 0 0 0 246,852
Norway Hatchery Adult 0Hatchery Juvenile 77,076 12,938 90,014
Wild Adult 1,273 1,273Wild Juvenile 1,299 1,299
Total 77,076 15,510 0 0 92,586
Russia Hatchery Adult 0Hatchery Juvenile 950,678 950,678
Wild Adult 3,221 3,221Wild Juvenile 0
Total 0 3,221 950,678 0 953,899
Sweden Hatchery Adult 0Hatchery Juvenile 3000 192,024 195,024
Wild Adult 0Wild Juvenile
Total 0 3,000 192,024 0 195,024UK (England & Hatchery Adult 0Wales) Hatchery Juvenile 13,788 88,675 102,463
Wild Adult 924 11,607 12,531Wild Juvenile 14,882 14,882
Total 28,670 924 100,282 0 129,876
UK (N. Ireland) Hatchery Adult 0Hatchery Juvenile 19,531 29,245 48,776
Wild Adult 0Wild Juvenile 1357 1,357
Total 20,888 0 29,245 0 50,133
UK (Scotland) Hatchery Adult 0Hatchery Juvenile 10,007 3,000 13,007
Wild Adult 732 732Wild Juvenile 3491 942 3,856 8,289
Total 13,498 1,674 0 6,856 22,028USA Hatchery Adult 524 2,108 833 3,465
Hatchery Juvenile 172,235 381,424 43,988 597,647
Wild Adult 647 647
Wild Juvenile
Total 0 172,759 383,532 45,468 601,759
All Countries Hatchery Adult 0 1,536 2,440 1,273 5,249
Hatchery Juvenile 432,308 193,355 2,666,405 47,094 3,339,162Wild Adult 20 10,298 11,607 1,186 23,111
Wild Juvenile 34,770 24,174 16,614 4,194 79,752Total 467,098 229,363 2,697,066 53,747 3,447,274
1 Includes other internal tags ( VIE, PIT, ultrasonic, radio, DST, etc.)
Primary Tag or Mark

Extract ICES WGNAS REPORT 2010 37
Figure 2.1.1.1 Reported total nominal catch of salmon (tonnes round fresh weight) in four North At‐lantic regions, 1960 to 2009.
NAC
0
50
100
150
1998
1999
2000
2001
2002
2003
2004
2005
2006
2007
2008
2009
Cat
ch (t
)
coast estuary river
S NEAC
0
200
400
600
800
1000
1200
1400
1998
1999
2000
2001
2002
2003
2004
2005
2006
2007
2008
2009
Cat
ch (t
)
coast estuary river
N NEAC
0
200
400
600
800
1000
1200
1400
1600
1800
1998
1999
2000
2001
2002
2003
2004
2005
2006
2007
2008
2009
Cat
ch (t
)
coast estuary river

38 Extract ICES WGNAS REPORT 2010
Figure 2.1.1.2 Nominal catch taken in coastal, estuarine and riverine fisheries for the NAC area, and for the northern and southern NEAC areas. Note that y‐axes scales vary.
Figure 2.2.1 World‐wide production of farmed Atlantic salmon, 1980 to 2009.
Figure 2.2.2 Production of ranched Atlantic salmon (tonnes round fresh weight) in the North Atlantic, 1980 to 2009.

Extract ICES WGNAS REPORT 2010 39
-0.80
-0.60
-0.40
-0.20
0.00
0.20
0.40
0.60
0.80
1978
1980
1982
1984
1986
1988
1990
1992
1994
1996
1998
2000
2002
2004
2006
2008
Dif.
wt
Figure 2.3.2.1 Annual deviates of successive recruitment rates (amt+1 – amt). Boxplots show the 95% Bayesian Credibility Interval (B.C.I.) as the vertical line, the interquartile range as the shaded rectan‐gle and the median as the horizontal dash.

40 Extract ICES WGNAS REPORT 2010
-0.80
-0.60
-0.40
-0.20
0.00
0.20
0.40
0.60
0.80
1978
1980
1982
1984
1986
1988
1990
1992
1994
1996
1998
2000
2002
2004
2006
2008
Res
.log(
PFA
m)
-0.60
-0.40
-0.20
0.00
0.20
0.40
0.60
0.80
1978
1980
1982
1984
1986
1988
1990
1992
1994
1996
1998
2000
2002
2004
2006
2008
Res
.log(
PFA
nm)
Figure 2.3.2.2 Partially conditioned predicted PFA to fully conditioned PFA; maturing PFA in upper panel and non‐maturing PFA in lower panel. Box plots are interpreted as in Figure 2.3.3.1.
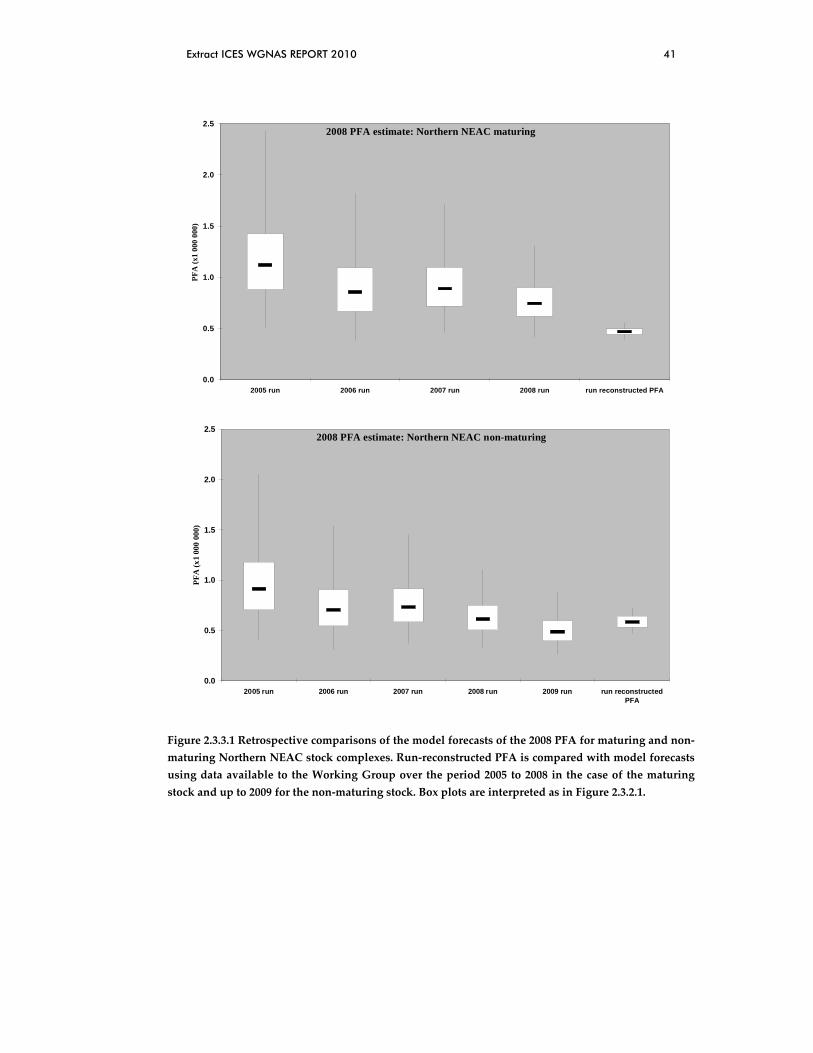
Extract ICES WGNAS REPORT 2010 41
2008 PFA estimate: Northern NEAC maturing
0.0
0.5
1.0
1.5
2.0
2.5
2005 run 2006 run 2007 run 2008 run run reconstructed PFA
PFA
(x1
000
000)
2008 PFA estimate: Northern NEAC non-maturing
0.0
0.5
1.0
1.5
2.0
2.5
2005 run 2006 run 2007 run 2008 run 2009 run run reconstructedPFA
PFA
(x1
000
000)
Figure 2.3.3.1 Retrospective comparisons of the model forecasts of the 2008 PFA for maturing and non‐maturing Northern NEAC stock complexes. Run‐reconstructed PFA is compared with model forecasts using data available to the Working Group over the period 2005 to 2008 in the case of the maturing stock and up to 2009 for the non‐maturing stock. Box plots are interpreted as in Figure 2.3.2.1.

42 Extract ICES WGNAS REPORT 2010
2008 PFA estimate: Southern NEAC maturing
0.0
0.5
1.0
1.5
2.0
2.5
3.0
3.5
2005 run 2006 run 2007 run 2008 run Run Reconstruction PFA2008
PFA
(x1
000
000)
2008 PFA estimate: Southern NEAC non-maturing
0.0
0.5
1.0
1.5
2.0
2.5
2005 run 2006 run 2007 run 2008 run 2009 run Run ReconstructionPFA 2008
PFA
(x1
000
000)
Figure 2.3.3.2 Retrospective comparisons of the model forecasts of the 2008 PFA for maturing and non‐maturing Southern NEAC stock complexes. Run‐reconstructed PFA is compared with model forecasts using data available to the Working Group over the period 2005 to 2008 in the case of the maturing stock and up to 2009 for the non‐maturing stock. Box plots are interpreted as in Figure 2.3.2.1.

Extract ICES WGNAS REPORT 2010 43
Figure 2.5.1.1 Z‐scores of 1SW salmon length for N NEAC v S NEAC areas for the period 1989–2008.
Figure 2.5.1.2 PFA of maturing 1SW salmon for N NEAC plotted against the z‐score of 1SW length for N NEAC populations.

44 Extract ICES WGNAS REPORT 2010
Figure 2.5.1.3 PFA of maturing 1SW salmon for S NEAC plotted against the z‐score of 1SW length for S NEAC populations.
Mean river age Mean sea age Mean length‐1SW
-0.8 -0.6 -0.4 -0.2 0.0 0.2 0.4 0.6
S NEAC
N NEAC
S NAC
N NAC
Baltic
Total
Rosenthal's=551.9
Decreasingriver age
Increasingriver age
-0.8 -0.4 0.0 0.4 0.8
S NEAC
N NEAC
S NAC
N NAC
Baltic
Total
Rosenthal's=0
Decreasingsea age
Increasingsea age
-0.8 -0.4 0.0 0.4 0.8
S NEAC
N NEAC
S NAC
N NAC
Baltic
Total
Rosenthal's=58.4
Decreasingmean length
Increasingmean length
Mean length‐2SW Prop. 1SW in run Prop. 2SW in run

Extract ICES WGNAS REPORT 2010 45
-0.8 -0.4 0.0 0.4 0.8 1.2
S NEAC
N NEAC
S NAC
N NAC
Baltic
Total
Rosenthal's=245.8
Decreasingmean length
Increasingmean length
-0.8 -0.4 0.0 0.4 0.8
S NEAC
N NEAC
S NAC
N NAC
Baltic
Total
Rosenthal's=0
Decreasingproportion
Increasingproportion
-0.8 -0.4 0.0 0.4 0.8
S NEAC
N NEAC
S NAC
N NAC
Baltic
Total
Rosenthal's=0
Decreasingproportion
Increasingproportion
Figure 2.5.1.4 Example meta‐analysis plots for selected biological characteristics‐for stock groupings see text.
0
5
10
15
20
25
30
35
40
23-A
pr
25-A
pr
27-A
pr
29-A
pr
01-M
ay
03-M
ay
05-M
ay
07-M
ay
09-M
ay
Date of 25% smolt emig ra tion
Marine Survival (%)
Figure 2.5.1.5 Relationship between the date of the onset of the smolt run (denoted by the data on which 25% of smolt emigration had occurred) and subsequent marine survival of 1SW River Bush salmon.

46 Extract ICES WGNAS REPORT 2010

Extract ICES WGNAS REPORT 2010 47
a)
NORTH ESK, 1SW return adults, 1976-1999
00.1
0.20.3
0.40.50.6
0.70.8
0.91
0 0.2 0.4 0.6 0.8 1
Proportion in emigrant smolt run (year - 1)
Pro
porti
on in
retu
rn a
dult
1SW
S1S2S3S4
b)
NORTH ESK, 1SW + 2SW return adults, 1977-1999
00.1
0.20.3
0.40.50.6
0.70.8
0.91
0 0.2 0.4 0.6 0.8 1
Proportion in emigrant smolt run
Prop
ortio
n in
retu
rn a
dult
1SW
+
2SW
S1S2S3S4
c)
NORTH ESK, 2SW return adults, 1977-1999
00.1
0.20.3
0.40.50.6
0.70.8
0.91
0 0.2 0.4 0.6 0.8 1
Proportion in emigrant smolt run (year - 2)
Prop
ortio
n in
ret
urn
adul
t 2S
W
S1S2S3S4
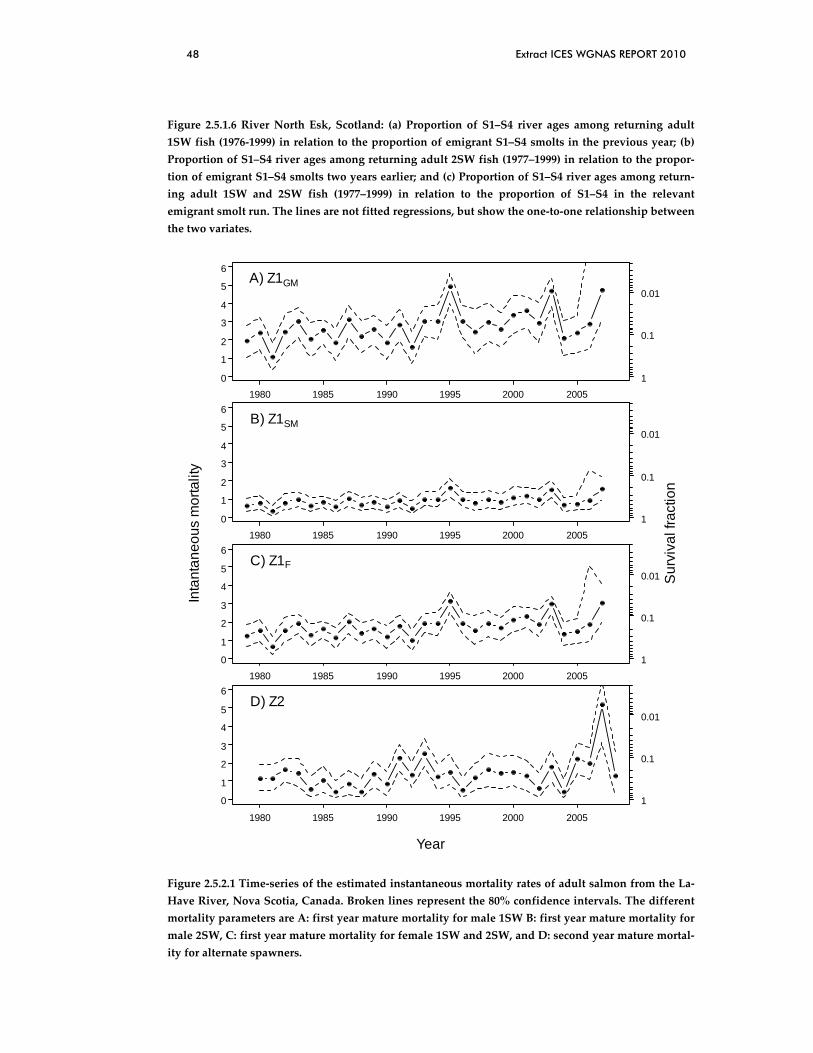
48 Extract ICES WGNAS REPORT 2010
Figure 2.5.1.6 River North Esk, Scotland: (a) Proportion of S1–S4 river ages among returning adult 1SW fish (1976‐1999) in relation to the proportion of emigrant S1–S4 smolts in the previous year; (b) Proportion of S1–S4 river ages among returning adult 2SW fish (1977–1999) in relation to the propor‐tion of emigrant S1–S4 smolts two years earlier; and (c) Proportion of S1–S4 river ages among return‐ing adult 1SW and 2SW fish (1977–1999) in relation to the proportion of S1–S4 in the relevant emigrant smolt run. The lines are not fitted regressions, but show the one‐to‐one relationship between the two variates.
1980 1985 1990 1995 2000 20050
1
2
3
4
5
6
1
0.1
0.01A) Z1GM
1980 1985 1990 1995 2000 20050
1
2
3
4
5
6
1
0.1
0.01B) Z1SM
1980 1985 1990 1995 2000 20050
1
2
3
4
5
6
1
0.1
0.01C) Z1F
1980 1985 1990 1995 2000 2005
0
1
2
3
4
5
6
1
0.1
0.01D) Z2
Inta
ntan
eous
mor
talit
y
Sur
viva
l fra
ctio
n
Year
Figure 2.5.2.1 Time‐series of the estimated instantaneous mortality rates of adult salmon from the La‐Have River, Nova Scotia, Canada. Broken lines represent the 80% confidence intervals. The different mortality parameters are A: first year mature mortality for male 1SW B: first year mature mortality for male 2SW, C: first year mature mortality for female 1SW and 2SW, and D: second year mature mortal‐ity for alternate spawners.

Extract ICES WGNAS REPORT 2010 49
1980 1985 1990 1995 2000 2005
0.0
0.2
0.4
0.6
0.8
1.0
-4
-2
0
2
4
Year
Mor
talit
y fra
ctio
n
NA
OI
marine mortalityNAOI
Figure 2.5.2.2 Relationship between the second year annual mortality fraction (the proportion of salmon destined to be alternate‐year spawners that die in the second year at sea) of adult salmon from the LaHave River, Nova Scotia, Canada, and the annual North Atlantic Oscillation Index (NAOI) for the corresponding year at sea.

50 Extract ICES WGNAS REPORT 2010
3 North East Atlantic Commission
Conservation limits (CLs) have been defined by ICES as the level of stock that will achieve long‐term average maximum sustainable yield (MSY). NASCO has adopted this definition of CLs (NASCO, 1998). The CL is a limit reference point; having populations fall below these limits should be avoided with high probability. However, management targets have not yet been defined for all Atlantic salmon stocks.
Therefore:
• ICES considers homewater stocks in the NEAC Commission to be at full re‐productive capacity only if the lower boundary of the confidence interval of the most recent spawner estimate is above the CL. In a similar manner, the status of stocks prior to the commencement of distant water fisheries has been interpreted to be at full reproductive capacity only if the lower boundary of the confidence interval of the most recent PFA estimate is above the Spawner Escapement Reserve (SER).
• ICES considers a stock to be at risk of suffering reduced reproductive capacity when the lower boundary of the confidence limit is below the CL/SER, but the midpoint is above.
• ICES considers a stock to be suffering reduced reproductive capacity when the midpoint is below the CL/SER.
For catch advice on fish exploited at West Greenland (non‐maturing 1SW fish from North America and non‐maturing 1SW fish from Southern NEAC), ICES has used the risk level of 75% that is part of the agreed management plan (ICES, 2003).
For stock assessment purposes, ICES groups NEAC stocks into two stock groupings: Northern and Southern NEAC stocks. The composition of these groups is shown below:
SOUTHERN EUROPEAN COUNTRIES: NORTHERN EUROPEAN COUNTRIES:
Ireland Finland
France Norway
UK (England and Wales) Russia
UK (Northern Ireland) Sweden
UK (Scotland) Iceland (north/east regions) 1
Iceland (south/west regions)1
3.1 Status of stocks/exploitation
The status of stocks is shown in Figure 3.1.1.
1 The Iceland stock complex was split into two separate complexes for stock assessment purposes in 2005. Prior to 2005, all regions of Iceland were considered to contribute to the Northern European stock complex.

Extract ICES WGNAS REPORT 2010 51
ICES classifies the status of stock complexes prior to the commencement of distant water fisheries with respect to the SER requirements as follows:
• Northern European 1SW stock complex is considered to be at full reproductive capacity.
• Northern European MSW stock complex is considered to be at full reproduc‐tive capacity.
• Southern European 1SW stock complex is considered to be suffering reduced reproductive capacity.
• Southern European MSW stock complex is considered to be at risk of suffering reduced reproductive capacity.
Estimated exploitation rates have generally been decreasing over the time period for both 1SW and MSW stocks in Northern and Southern NEAC areas (Figure 3.1.2 and Figure 3.1.3). Exploitation on Northern 1SW stocks is higher than on Southern 1SW and consid‐erably higher for MSW stocks. The current estimates for both stock complexes are amongst the lowest in the time‐series.
Despite management measures aimed at reducing exploitation in recent years there has been little improvement in the status of stocks over time. This is mainly as a consequence of continuing poor survival in the marine environment attributed to climate effects. Ef‐forts continue to improve our understanding of causal relationships contributing to ma‐rine mortality.
3.2 Management objectives
This Commission area is subject to the general NASCO management objectives as out‐lined in Section 1.3.
3.3 Reference points
Section 1.4 describes the derivation of reference points for these stocks and stock com‐plexes.
3.3.1 National conservation limits
The national model has been run for all countries that do not have river‐specific CLs (i.e. all countries except France, Ireland, and UK (England and Wales)).
Iceland, Russia, Norway, UK (N. Ireland), and UK (Scotland) have provided regional in‐put data for the PFA analysis (1971–2009). For these countries the lagged spawner analy‐sis has been conducted by region. The regional results were combined to estimate CLs based on a pseudo stock–recruitment relationship for the country. Outputs from the na‐tional model are only designed to provide a provisional guide to the status of stocks in the NEAC area.
To provide catch options to NASCO, CLs are required for stock complexes. These have been derived either by summing of individual river CLs to national level, or by taking overall national CLs, as provided by the national model and then summing to the level of the 4 NEAC stock complexes. For the NEAC area, the CLs have been calculated by ICES as:

52 Extract ICES WGNAS REPORT 2010
• Northern NEAC 1SW spawners–218 842 • Northern NEAC MSW spawners–131 152 • Southern NEAC 1SW spawners–625 652 • Southern NEAC MSW spawners–268 920
3.3.2 Progress with setting river-specific conservation limits
In Norway, CLs have been set for 439 rivers since 2007. The CLs are based on stock re‐cruitment relationships in nine rivers. Productivity is mostly based on catch statistics, and scale samples are used to assess the river age and sea age structure in a sub set of the populations. To derive the CLs, wetted areas have been computed from digital maps and analysis of river length accessible to adult fish. CLs for salmon populations are grouped into four categories of egg densities, approximately 1, 2, 4 and 6 eggs/m² wetted area. Most of the rivers fall into the 2 and 4 eggs/m² wetted area categories.
Based on data from 1993 to 2008 the attainment of CLs was evaluated in 180 Norwegian rivers, and advice on exploitation was given for 153 of them. Of the 153 populations, 56 populations were given advice 1 (harvest rates appear sustainable), 34 were given advice 2 (harvest rates should be moderately reduced), 34 were given advice 3 (harvest rates should be considerably reduced) and 29 were given advice 4 (harvest rates should be substantially reduced). For 97 of 153 populations, corresponding to 63%, the advice given was for reduced harvest rates.
3.4 Management advice
ICES has been asked to provide catch advice, if possible based on a forecast of PFA, with an assessment of risks relative to the objective of exceeding stock CLs in the NEAC area.
ICES emphasized that the national stock CLs discussed above are not appropriate to the management of homewater fisheries, particularly where these exploit separate river stocks. This is because of the relative imprecision of the national CLs and because they will not take account of differences in the status of different river stocks or sub‐river populations. Nevertheless, ICES agreed that the combined CLs for the main stock groups (national stocks) exploited by the distant water fisheries could be used to provide general management advice to the distant water fisheries.
Given the current (from the NEAC run reconstruction model) and forecasted (from the Bayesian forecast models), ICES provides the following advice on management:
• Northern European 1SW stocks: ICES considers that in the absence of specific management objectives for this stock complex the precautionary approach is to fish only on maturing 1SW salmon from rivers where stocks have been re‐vealed to be at full reproductive capacity. Furthermore, due to the different status of individual stocks within the stock complex, mixed‐stock fisheries pre‐sent particular threats to stock status. The newly developed Bayesian forecast model demonstrates that the lower bounds of the forecasted PFA for 2010 to 2013 are below SER indicating that the stock may be at risk of suffering re‐duced reproductive capacity prior to the commencement of distant water fish‐eries.

Extract ICES WGNAS REPORT 2010 53
• Northern European MSW stocks: ICES considers that in the absence of spe‐cific management objectives for this stock complex the precautionary approach is to fish only on non‐maturing 1SW salmon from rivers where stocks have been revealed to be at full reproductive capacity. Furthermore, due to the dif‐ferent status of individual stocks within the stock complex, mixed‐stock fisher‐ies present particular threats to stock status. The newly developed Bayesian forecast model demonstrates that the lower bounds of the forecasted PFA for 2010 to 2013 are below SER indicating that the stock may be at risk of suffering reduced reproductive capacity prior to the commencement of distant water fisheries.
• Southern European 1SW stocks: ICES considers that in the absence of specific management objectives for this stock complex the precautionary approach is to fish only on maturing 1SW salmon from rivers where stocks have been re‐vealed to be at full reproductive capacity. Furthermore, due to the different status of individual stocks within the stock complex, mixed‐stock fisheries pre‐sent particular threats to stock status. The newly developed Bayesian forecast model demonstrates that the lower bounds of the forecasted PFA for 2010 to 2013 are below SER indicating that the stock may be at risk of suffering re‐duced reproductive capacity prior to the commencement of distant water fish‐eries.
• Southern European MSW stocks: ICES considers that in the absence of spe‐cific management objectives for this stock complex, with the exception of the West Greenland fishery, the precautionary approach is to fish only on non‐maturing 1SW salmon from rivers where stocks have been revealed to be at full reproductive capacity. Furthermore, due to the different status of individ‐ual stocks within the stock complex, mixed‐stock fisheries present particular threats to stock status. There are no catch options at West Greenland that would allow the management objectives to be met for this stock complex. The newly developed Bayesian forecast model demonstrates that the lower bounds of the forecasted PFA for 2009 to 2012 are below SER indicating that the stock may be at risk of suffering reduced reproductive capacity prior to the com‐mencement of distant water fisheries.
3.5 Relevant factors to be considered in management
Fisheries on mixed‐stocks pose particular difficulties for management, when they cannot target only stocks that are at full reproductive capacity. The management of a fishery should ideally be based upon the status of all stocks exploited in the fishery. Conserva‐tion would be best achieved if fisheries target stocks that have been revealed to be at full reproductive capacity. Fisheries in estuaries and especially rivers are more likely to meet this requirement.
ICES also emphasized that the national stock CLs discussed above are not appropriate to the management of homewater fisheries. This is because of the relative imprecision of the national CLs which do not take account of differences in the status of different river stocks or sub‐river populations, and because of the capacity of homewater fisheries to target specific stocks. Nevertheless, ICES agreed that the combined CLs for national

54 Extract ICES WGNAS REPORT 2010
stocks exploited by the distant water fisheries could be used to provide general manage‐ment advice at the level of the stock complexes.
It should also be noted that the inclusion of farmed fish in the Norwegian data could re‐sult in the stock status being overestimated.
3.6 Pre-fishery abundance forecasts
ICES previously used a regression model to forecast PFA of non‐maturing (potential MSW) salmon from the Southern European stock group (ICES 2002; 2003; 2009a). In 2009 this was superseded by a new forecast model developed in a Bayesian framework which produced forecasts for all four NEAC stock complexes.
3.6.1 Pre-fisheries abundance forecasts
In 2010, ICES ran the new Bayesian forecast models for the Southern NEAC and North‐ern NEAC complexes. The two models have the same structure and are run independ‐ently (ICES 2009a).
For both Southern and Northern NEAC complexes, forecasts for maturing stocks were derived for 4 years of lagged spawners starting from 2010 to 2013 and for non‐maturing stocks for 5 years, from 2009 to 2013. Risks were defined each year as the posterior prob‐ability that the PFA would be below the age and stock specific SER levels. For illustrative purposes, risk analyses were derived based on the probability that the PFA abundance would be greater than or equal to the SER under the scenario of no exploitation
3.6.2 Results of the NEAC Bayesian forecast models
The trends in the posterior estimates of PFA for both the Southern NEAC and Northern NEAC complexes closely match the PFA estimates derived from the run reconstruction model.
For the Southern NEAC stock complex, the productivity parameters for the maturing and non‐maturing components peaked in 1985 and 1986, and reached the lowest values in 1997 (Figure 3.6.2.1). There was a sharp drop in the productivity parameter during 1989 to 1991 and the median values post‐1991 are all lower than during the previous time pe‐riod.
Over the entire time‐series, the maturing proportions averaged about 0.6 with the small‐est proportion in 1980 and the largest proportion in 1998 (Figure 3.6.2.2). There is an in‐creasing trend in the proportion maturing (8 of 13 values below the average during 1978 to 1990 compared with 4 of 17 values between 1991 and 2007). The total PFA (maturing and non‐maturing 1SW salmon at January 1st of the first winter at sea) for the Southern NEAC complex ranged from 3 to 4 million fish between 1978 and 1989, declined rapidly to just over 2 million fish in 1990, and fell to its lowest level of just over one million fish in 2008 (Figure 3.6.2.3).
For the Northern NEAC complex, peak PFA abundance was estimated at about 2 million fish in year 2000 with the lowest value of the series in 2008 at over 1 million fish (Figure 3.6.2.4). The proportion maturing has varied around 0.55 over the time‐series but in 2007 there was an abrupt drop in the proportion maturing to below 0.35. This displayed some recovery in 2008 to around 0.44, though still below the 1991 to 2006 level (Figure 3.6.2.2).

Extract ICES WGNAS REPORT 2010 55
The productivity parameter is higher for maturing 1SW salmon than for the non‐maturing component in both stock complexes, with the separation being larger in the Southern NEAC complex (Figure 3.6.2.1).
Forecasts from these models into 2009 to 2013 for the non‐maturing age group and for 2010 to 2013 for the maturing age group were developed within the Bayesian model framework. Variations in the median abundance over the forecasts are related to varia‐tions in lagged eggs (Figure 3.6.2.3) as the productivity parameters are set at the level of the last year with available data (Figures 3.6.2.1). The variability in the productivity pa‐rameters increased sequentially over the forecasts.
For the Southern NEAC stock complex, the 25th percentiles of the posterior distributions of the forecasts are below the SER for both the maturing and non‐maturing age compo‐nents (Figures 3.6.2.4). The abundances of the Northern NEAC age components have de‐clined over the 1983 to 2009 time period. The lower bound of the 95% Bayesian credible interval has fallen below the age‐specific SERs for 2010 to 2013 but the expectation is for the 2009 abundance of maturing and non‐maturing salmon to remain above the SER (Figures 3.6.2.5).
3.6.3 Probability of attaining PFA above SER
The structure of the previously used regression forecast model generally led to a forecast of declining PFA with time, a pattern not apparent in the Bayesian model output (ICES 2009a).
Probabilities that the PFAs will be above or equal to SERs in 2009 to 2013 from the Bayes‐ian model are given in the Table below. Probabilities are lower for the Southern complex, ranging from 0.62 to 0.78. In the Northern complex probabilities range from 0.821 to 0.975.
PROBABILITY THAT PFAS WILL BE GREATER THAN OR EQUAL TO THE COMPLEX AND AGE SPECIFIC SERS
Southern complex Maturing Non‐maturing
SER 795 360 454 753
Year p p
2009 0.735 0.780
2010 0.641 0.689
2011 0.699 0.741
2012 0.668 0.710
2013 0.602 0.648
Northern complex Maturing Non‐maturing
SER 276 140 221 590
Year p p
2009 0.964 0.975
2010 0.856 0.900
2011 0.842 0.886
2012 0.821 0.868
2013 0.840 0.881

56 Extract ICES WGNAS REPORT 2010
3.6.4 Use of the NEAC Bayesian forecast models in catch advice
In the absence of specific management objectives for the Faroes fishery, ICES requires that the lower bound of the 95% confidence interval of the PFA estimate be above the SER for the stock to be considered at full reproductive capacity. ICES noted that for both the northern and Southern NEAC stock complexes the Bayesian models predicts the 97.5 percentile (equivalent to the lower 95% confidence interval) as being below the respective SER in all forecast years, except for non‐maturing 2009 Northern NEAC complex which is barely above the SER (at 221 590) by 410. It is also noteworthy that for the Southern NEAC the 25th percentiles, in all but the non‐maturing 2009 instance, fall below the re‐spective SER. For the West Greenland Commission area, the probability of achieving management objectives has been set to 75% (see Section 5.2). Results of the NEAC Bayes‐ian forecast models
3.7 Comparison with previous assessment
3.7.1 National PFA model and national conservation limit model
Provisional catch data for 2008 were updated where appropriate and provisional data for 2009 were incorporated into the assessment. A correction was made to the way that the catch of Scottish salmon in the English NE coast fishery is added into the Scottish as‐sessment; this has resulted in a decrease in the estimates of returns and PFA for Scotland or 3–19%; this has also affected the conservation limit estimate. Exploitation rates for UK (England and Wales for the period 1998 to 2009 were recalculated on the basis of utilized fishing effort (days or tides fished) rather than the licence numbers used previously; this has resulted in a small decrease in the exploitation rate values used for more recent years, thereby increasing the estimates of returns and PFA.
3.8 NASCO has requested ICES to describe the key events of the 2009 fisheries and the status of the stocks
3.8.1 Fishing at Faroes in 2008/2009
No fishery for salmon has been prosecuted since 2000.
3.8.2 Significant events in NEAC homewater fisheries in 2009
In several countries, measures aimed at reducing exploitation were implemented or ex‐tended in 2009. These include a reduction of net fisheries in UK (England and Wales) and the introduction of a carcass tagging scheme for net caught fish, a reduction in the extent of mixed‐stock fisheries in Norway and the introduction of regulations in Russia aimed at controlling exploitation.
3.8.3 Gear and effort
No significant changes in the types of gear used for salmon fishing were reported in the NEAC area in 2009. The number of licensed gear units has, in most cases, continued to fall although there are no such consistent trends for the rod fishing effort in NEAC coun‐tries over this period.

Extract ICES WGNAS REPORT 2010 57
3.8.4 Catches
The NEAC area has seen a general reduction in catches since the 1980s (Section 2.1.1). This reflects the decline in fishing effort as a consequence of management measures as well as a reduction in the size of stocks. The provisional reported catch in the NEAC area in 2009 was 1151 tonnes, 25% lower than the 2008 value (1533 t) and 34% lower than the previous 5‐year mean (1757 t). The catch in the Southern area has declined over the pe‐riod from about 4500 t in 1972–1975 to below 1000 t since 2003 and is now well below 300 t. The catch displayed marked declines in 1976, 1989–1991. The catch in the Northern area also indicated an overall decline over the time‐series, although this decrease was less dis‐tinct than the reductions noted in the Southern area. The catch in the Northern area var‐ied between 2000 and 2800 t from 1971 to 1988; fell to a low of 962 t in 1997 and then increased to over 1600 t in 2001 although it has exhibited a downward trend since this time. Thus, the catch in the Southern area, which comprised around two‐thirds of the total NEAC catch in the early 1970s, has been lower than that in the Northern area since 1999.
3.8.5 Catch per unit effort (cpue)
Cpue can be influenced by various factors, and it is assumed that the cpue of net fisheries is a more stable indicator of the general status of salmon stocks than rod cpue because the latter may be more affected by varying local factors.
An overview of the cpue data for the NEAC area was undertaken. In the Southern NEAC area, cpue reveal a general decrease in UK (Scotland) and UK (England and Wales) net fisheries. Cpue for the net fishery revealed mostly lower values compared with 2008 and the previous 5‐year averages. In the Northern NEAC area, there has been an increasing trend in cpue figures for the Russian rod fisheries in both the Barents and White Sea riv‐ers. A decreasing trend was noted for rod fisheries in Finland (River Teno) and for the Norwegian net fisheries.
3.8.6 Age composition of catches
1SW salmon comprised 58% of the total catch in the Northern area in 2009 which was the same as the previous 5‐year mean (58%) and below the previous 10‐year mean (60%). In general, there has been greater variability in the proportion of 1SW fish between coun‐tries in recent years (since 1994) than prior to this time. For the Southern European coun‐tries, the overall percentage of 1SW fish in the catch (54%) is below the 5‐ and 10‐year means (both 59%).
3.8.7 Farmed and ranched salmon in catches
The contribution of farmed and ranched salmon to national catches in the NEAC area in 2009 was again generally low in most countries, with the exceptions of Norway, Iceland and Sweden, and is similar to the values that have been reported in previous years (e.g. ICES 2009a). Thus, the occurrence of such fish is usually ignored in assessments of the status of national stocks. However, in Norway farmed salmon continue to form a large proportion of the catch in those fisheries which have been sampled (29% in coastal fisher‐ies, 36% in fjordic fisheries and 8% in rod fisheries). The number of coastal and fjordic fisheries sampled in 2009 was lower than in previous years and incidence of framed fish in these fisheries is thought to be an overestimate of the overall picture. An assessment of

58 Extract ICES WGNAS REPORT 2010
the likely effect of these fish on the output data from the PFA model has been reported previously (ICES 2001).
The release of smolts for commercial ranching purposes ceased in Iceland in 1998, but ranching for rod fisheries in two Icelandic rivers continued into 2009. In 2009 42 t were reported as ranched salmon in contrast to 121 t harvested as wild.
Ranching occurs on a much smaller scale in other countries and the ranched component of the catch in these countries has therefore been included in the nominal catch.
3.8.8 National origin of catches
Evidence of Russian origin salmon being caught in coastal mixed‐stock fisheries in nor‐thernmost Norway have been reported in previous years (e.g. ICES 2009a). Norway has recently decreased fishing effort in coastal areas and available information demonstrates a decline in the number of fishing days and in the number of fishers operating in marine waters of Finnmark County. However, there are still extensive salmon fisheries operating in this coastal area which are very likely to exploit Russian salmon. In 2009, a joint Rus‐sian and Norwegian project began, the aims of which included establishing a baseline genetic characterization of salmon populations which could be used for estimating the composition of mixed‐stock fisheries in the area. (see Section 2.4.5). This work will con‐tinue under the Joint Russian‐Norwegian Scientific Research Programme on Living Ma‐rine Resources in 2010 (Appendix 10 of the 38th Joint Russian‐Norwegian Fishery Commission).
Data on catches of salmon originating in other countries in Ireland have been reported in previous years (e.g. ICES 2007c). In 2007, following the closure of the mixed‐stock fishery only a single tag from UK (N. Ireland) was recovered and one tag of Irish origin was tak‐en in Scottish waters. In 2008, no tags of foreign origin were recovered in the Irish tag scanning programme most likely due to the closer proximity of the existing fisheries to estuaries or rivers. In 2009, one tag was recovered from a River Bush (UK (N. Ireland)) origin fish.
3.8.9 Trends in the PFA for NEAC stocks
In the evaluation of the status of stocks in Figure 3.1.1, estimated recruitment (PFA) val‐ues should be assessed against the SER values, while the estimated spawning escapement values should be compared with the CL.
Northern European 1SW and MSW stocks: Recruitment patterns of maturing 1SW salmon and of non‐maturing 1SW recruits for Northern Europe (Figure 3.1.1) show broadly similar patterns. The general decline over the time period is interrupted by a short period of increased recruitment from 1998 to 2003. Both stock complexes have been at full reproductive capacity prior to the commencement of distant water fisheries throughout the time‐series. Trends in spawner number for the Northern stock complexes for both 1SW and MSW are similar. Throughout most of the time‐series, both 1SW and MSW spawners have been either at full reproductive capacity or at risk of reduced re‐productive capacity. However, over the recent period 2007 to 2009, the 1SW spawner es‐timate indicated that the stock complex was suffering reduced reproductive capacity. These patterns are broadly consistent with the general pattern of decline in marine sur‐vival of 1SW and 2SW returns in most monitored stocks in the area (Section 3.8.10).

Extract ICES WGNAS REPORT 2010 59
Southern European 1SW and MSW stocks: Recruitment patterns of maturing 1SW salmon and of non‐maturing 1SW recruits for Southern Europe (Figure 3.1.1) show broadly similar declining trends over the time period. The maturing 1SW stock complex has been at full reproductive capacity over most of the time period with the exception of 2008, when it was at risk of suffering reduced reproductive capacity, and in 2009, when it was suffering reduced reproductive capacity, prior to the commencement of distant wa‐ter fisheries. The non‐maturing 1SW stock has been at full reproductive capacity over most of the time period but has been at risk of suffering reduced reproductive capacity before any fisheries took place in ten of the thirteen years between 1996 and 2009. Declin‐ing trends in spawner number are evident in the Southern stock complexes for both 1SW and MSW. The 1SW stock has been at risk of reduced reproductive capacity or suffering reduced reproductive capacity for most of the time‐series. In contrast, the MSW stock has been at full reproductive capacity for most of the time‐series until 1996 from when the stock was either at risk of reduced reproductive capacity or suffering reduced reproduc‐tive capacity. This is broadly consistent with the general pattern of decline in marine sur‐vival of 1SW and 2SW returns in most monitored stocks in the area (Section 3.8.10).
3.8.10 Survival indices for NEAC stocks
An overview of the trends of marine survival for wild and hatchery‐reared smolts return‐ing to homewaters (i.e. before homewater exploitation) is presented in Figure 3.8.10.1. The survival indices presented are the percent change in return rate between five year averages for the periods 1999 to 2003 and 2004 to 2008 for 1SW salmon, and 1998 to 2002 and 2003 to 2007 for 2SW salmon.
The overall trend in for Northern and Southern NEAC areas, in both wild and hatchery smolts, is indicative of a decline in marine survival. The percentage change between the means of the five year periods varied from a 97% decline to a 212% increase in one river (Figure 3.8.10.1). However, the scale of change in some rivers is influenced by low total return numbers, where a few fish more or less returning may have a significant impact on the percent change. Most of the survival indices for wild and reared smolts were be‐low the previous 5‐ and 10‐year averages although some increases in survival were de‐tected.
Results from these analyses are consistent with the information on estimated returns and spawners as derived from the PFA model, and suggest that returns are strongly influ‐enced by factors in the marine environment.
3.9 NASCO has requested ICES to further investigate opportunities to develop a framework of indicators that could be used to identify any significant change in previously provided multi-annual management advice
In 2006, ICES provided multi‐annual management advice for all three NASCO Commis‐sion Areas and presented a preliminary framework (Framework of Indicators‐FWI) which would indicate if any significant change in the status of stocks used to inform the previously provided multi‐annual management advice had occurred. This FWI was sub‐sequently developed further at the Study Group on Establishing a Framework of Indica‐tors of Salmon Stock Abundance [SGEFISSA] in November 2006 (ICES 2007b).
ICES (2007c) adopted a FWI for the Greenland fishery based on the seven contributing regions/stock complex with direct links to the three management objectives established

60 Extract ICES WGNAS REPORT 2010
by NASCO for that fishery. However, SGEFISSA was unable to develop a FWI for the Faroese fishery for a number of different reasons. Among these were the lack of quanti‐tative catch advice, the absence of specific management objectives and a sharing agree‐ment for this fishery and the fact that none of the available indicator datasets met the criteria for inclusion in the FWI. ICES (2007c) endorsed the SGEFISSA report of applying the FWI in respect of the West Greenland and North American Commissions. However, in the absence of a FWI for the Faroese fishery, it was recommended that annual assess‐ments be conducted to verify the multiyear catch advice.
In 2009, ICES (2009a) updated the NEAC datasets previously examined in the FWI. How‐ever, these still did not satisfy the criteria for inclusion in the FWI as being informative of a significant change, because over the time‐series the PFA estimates have predominately remained above the SER. ICES decided that these datasets would need to be re‐evaluated for use in future, should PFA estimates decline to levels consistently below the limit ref‐erence points for each stock complex. Alternatively different approaches to that applied in respect of the Greenland fishery should be explored.
ICES concluded that, as NEAC stocks remained close to their respective SERs, none of the available indicator datasets would meet the criteria for inclusion in the FWI and, addi‐tionally, as no alternative approaches had been proposed, the only indication of a change in the status of stocks would be provided by a full assessment of the NEAC stock com‐plexes.
3.10 Development of a risk based framework for the provision of catch advice at the Faroes
3.10.1 The basis for developing a risk assessment framework
ICES has previously developed a risk framework for the provision of catch advice for the West Greenland fishery (WGF) which involves estimating the uncertainty in meeting de‐fined management objectives at different levels of catch (catch options) (ICES 2009a). The procedure has been accepted by NASCO and employed by ICES in providing catch ad‐vice for a number of years (e.g. ICES 2009a); it could therefore provide the basis for estab‐lishing a parallel risk framework for the Faroes fishery.
The analysis of risk involves four steps (ICES 2009a):
a ) identifying the sources of uncertainty; b ) describing the precision of the assessment; c ) defining management objectives; and d ) evaluating the probability of an event (either desirable or undesirable) result‐
ing from the fishery action.
The uncertainties have been identified and quantified in the assessment of PFA for salmon stocks in both the NAC and NEAC areas. NASCO’s strategy for the management of salmon fisheries is based upon the principle of ensuring that stocks are above CLs (de‐fined in terms of spawner escapement or egg deposition) with a high probability. The undesirable event to be avoided is that the spawning escapement after the fisheries will be below the CL.

Extract ICES WGNAS REPORT 2010 61
For the WGF, the risk assessment is based upon management units within two stock complexes (NAC 2SW salmon and NEAC non‐maturing 1SW salmon) which are evalu‐ated in parallel and then combined at the end of the process into a single catch options table. The primary inputs to the risk analysis for the WGF are the catch options, PFA forecasts for the years of the fishery and conservation limits for agreed management units. The estimation procedures for PFA in the NAC and NEAC areas have been de‐scribed in ICES (2009a) and take account of the uncertainty in most (but not all) of the input variables, thereby providing a measure of the uncertainty for the final estimates. The number of fish of NAC and NEAC origin in a given catch is derived from biological sampling data.
3.10.2 Current risk assessment procedure for the West Greenland fishery
The following procedure is used to estimate the probability of meeting the management objectives for each catch option (weight of catch) considered for the WGF:
i ) PFA is estimated for NAC 1SW non‐maturing salmon and Southern NEAC non‐maturing 1SW salmon using the continental run‐reconstruction models and forecasts for three years in advance.
ii ) The weight of the (potential) catch for a particular catch option is converted to numbers of NAC and NEAC fish.
iii ) These numbers are subtracted from the forecast values of the NAC and NEAC stock complexes respectively.
iv ) The North American ‘share’ which matches the West Greenland catch option is then deducted from the fish that are forecast to escape the Greenland fish‐ery. NASCO has agreed a sharing allocation of 40% to West Greenland to 60% to North America (NASCO‐WGC 1994), which means that the number of fish deducted at this stage equals the catch option multiplied by 60/40. NASCO has not agreed a sharing allocation for the Southern NEAC stocks exploited at West Greenland, and so ICES has assumed the same sharing al‐location as for NAC (See Section 3.10.4).
v ) The number of fish forecast to return to home waters after the fishery is then reduced to take account of natural mortality from the time of the WGF to the time they return to rivers in the NAC and NEAC areas.
vi ) The fish forecast to survive to North American homewaters are then distrib‐uted among the six regions based on the regional proportions of 2SW returns of the previous five years.
vii ) For each forecast year, the number of fish forecast to escape to each NAC re‐gion and to the Southern NEAC area is assessed against the management ob‐jective for that region/area.
A risk framework for the development of catch options for the Faroes fishery could be based on similar principles to the WGF framework, but there will be a need for both management and scientific decisions on the principles to be adopted. The following sec‐tions discuss a number of factors that will need to be addressed if a risk framework is established following the general principles developed for the WGF.

62 Extract ICES WGNAS REPORT 2010
3.10.3 Management objectives for the Faroes risk framework
The primary objective of the risk framework will be to meet predetermined management objectives, which will need to be agreed between Parties in NASCO; the following dis‐cussion is designed to inform that decision‐making process.
West Greenland fishery
For management advice for the WGF, NASCO has adopted a pre‐cautionary manage‐ment plan requiring at least a 75% probability of achieving three management objectives:
a ) Meeting the CLs simultaneously in the four northern regions of the NAC stock complex: Labrador, Newfoundland, Quebec, and Gulf.
b ) Achieving more than a 25% increase in returns relative to a baseline period (1992–1996) for the two southern regions in the NAC stock complex: Sco‐tia‐Fundy and USA.
c ) Meeting the SER for the Southern NEAC MSW complex.
Faroes fishery
Establishing parallel management objectives for the Faroes fishery will require agreement on:
a ) The management units to be employed; and b ) The management objectives for each of those units.
ICES currently provides advice on the status of four NEAC stock complexes, based on two age groups (maturing and non‐maturing 1SW salmon) within two geographic re‐gions (Northern NEAC and Southern NEAC). The total conservations limits for these stock complexes are:
Northern NEAC 1SW conservation limit 218 842
Northern NEAC MSW conservation limit 131 152
Southern NEAC 1SW conservation limit 625 652
Southern NEAC MSW conservation limit 268 920
These CLs for the NEAC stock complexes are considerably larger than the total CL for North American 2SW salmon (152 458). The large size of the NEAC complexes is likely to increase the risks to regional and river stocks in these stock complexes, particularly where these are already in a more depleted state than the average. It is also notable that the overall status of the stocks in each stock complex tends to be dominated by the stocks in one region or country. Thus for example, the PFA of non‐maturing 1SW salmon in the Southern NEAC area is dominated by stocks in UK (Scotland), with the mean PFA for several Southern NEAC countries being significantly less than the average year‐to‐year variation observed for Scotland.
Reducing the average size of the management units to the same as that for NAC (i.e. units with CLs of ~25 000) would result in about 50 units. However, ICES is unlikely to be able to provide reliable assessments at this scale (in the short term at least).

Extract ICES WGNAS REPORT 2010 63
ICES currently undertakes the assessment of NEAC stocks at the country/region level, and these might reasonably be defined as the management units for the development of the Faroes risk framework.
A similar management decision to that of WGF could be applied to the Faroes fishery; achieve the CLs simultaneously at a probability level of greater than 75%. This would mirror the approach for the WGF and would be in line with the general principles agreed by NASCO.
3.10.4 Assigning Faroes catches (or catch options) to NEAC management units
The assessment requires the catch in the fishery (i.e. the catch option) to be converted to numbers of fish from the contributing management units.
West Greenland fishery
Allocation of the WGF catch to continent of origin is based upon data collected in the West Greenland sampling programme which has been running (in various forms) almost every year for over three decades (ICES 2009a). The allocation requires estimates of the following parameters for future years (the years of the fishery):
• proportion of the catch originating in NAC and NEAC (propNA and propE); • Mean weight of NAC and NEAC 1SW salmon caught (Wt1SWNA, Wt1SWE); • A correction factor by weight for the other age groups in the fishery (AFC).
In Step (i) of the WGF risk assessment, it is assumed that these parameters could vary uniformly within the values observed in the past five years.
In Step (v) of the WGF risk assessment the fish forecast to survive to North American homewaters are also distributed among the regions based on the regional proportions of 2SW returns of the previous five years.
Faroes fishery
Biological data on the catches in the Faroes fishery (age composition and mean weights by sea age) were collected while the commercial fishery operated in the 1980s and for the small research fishery in subsequent years, but no data have been collected since that time. The NEAC PFA assessment currently uses an estimate of the national composition of the stock at Faroes based on historical tagging data; the most recent data employed are at least 15 years old and no account has been taken of any changes in stock abundance among regions.
Initially it will be necessary to base any risk assessment on the best available data derived from historical surveys, sampling and tagging studies. If the Faroes fishery was re‐opened, it might be possible to initiate new sampling programmes and thereby derive more up‐to‐date parameter values for the assessment.
3.10.5 Stock forecasts for NEAC stock units in the Faroes risk framework
Forecasts must clearly be developed for the stock complexes/units on which the man‐agement objectives are based, or for components of these if this allows greater accuracy and/or precision in the forecasts.

64 Extract ICES WGNAS REPORT 2010
The NEAC forecast is currently based on the two stock complexes (northern and South‐ern NEAC), but because of the wide geographic spread of the rivers in these areas, it may be more appropriate to forecast the stocks for smaller regions (e.g. countries or national regions). Furthermore, if there is a desire to include environmental parameters into the forecast models they may be more appropriately applied at a more regional level, par‐ticularly if the post‐smolt stage is considered to be a critical phase in the life cycle. The same modelling approach (e.g. Bayesian model) can be provided to the national or re‐gional datasets.
3.10.6 Sharing arrangement for the Faroes risk framework
Determination of the sharing arrangement is a management decision which will require input from NASCO. The following discussion is designed to inform that decision‐making process.
NASCO has determined that the allocation of a harvestable surplus of salmon at West Greenland should be based on the average for the period 1986 to 1990 of the harvest share of the potential 2SW salmon of North American origin caught at west Greenland (40%), although the agreement also allows for an alternative proportion to be agreed be‐tween the Parties (NASCO 1994). To date the value of 40% has been used. The baseline period was based on a recent 5 year period, although not the 5 years immediately prior to the agreement; the basis for this choice is not known.
A sharing allocation could be determined in a similar manner for the Faroes fishery on the basis of historical catches (weights) and a similar baseline period. Figure 3.10.6.1 shows the proportions of historical catches (5yr averages for the same cohort) of NAC (2SW), Southern NEAC (all ages) and Northern NEAC (all ages) in the West Greenland, Faroes and homewater fisheries. These data might be considered by managers when de‐termining the sharing allocations for the NEAC stock complexes.
Southern‐NEAC non‐maturing 1SW stocks are potentially exploited at both Faroes and West Greenland as well as in homewaters and so a three‐way sharing allocations should ideally be agreed for this stock complex (Figure 3.10.6.1c). Any decision about a sharing allocation for the Southern NEAC stock complex should also be applied when assessing the West Greenland catch options.
3.10.7 Possible assessment procedure for Faroes
Based on the foregoing discussions, and assuming the various scientific and management decisions have been made, the procedure for the assessment of catch options based on a risk framework could take the following form (Figure 3.10.7.1):
i ) PFA is estimated for each of the agreed management units; ii ) the weight of the potential catch (i.e. a particular catch option) is converted to
numbers of fish from each of the stock complexes/units; iii ) these numbers are subtracted from the forecast values of the corresponding
stock complexes/units; iv ) the fish that are forecast to escape the Faroes fishery are discounted by the
fixed sharing fractions for each of the stock complexes (to be agreed by man‐agers) (NB: the sharing fraction does not need to be the same for all of the stock complexes/units);

Extract ICES WGNAS REPORT 2010 65
v ) fish forecast to return to home waters after the fishery are discounted for natural mortality from the midpoint of the Faroes fishery to the midpoint of returns to rivers;
vi ) for each forecast year, the number of fish forecast to escape to each region is assessed against the management objective for that region.

66 Extract ICES WGNAS REPORT 2010
Northern Europe
Southern Europe
0.0
0.5
1.0
1.5
2.0
1970 1980 1990 2000 2010
PFA
(mill
ions
)
Maturing 1SW
0.0
0.5
1.0
1.5
2.0
1970 1980 1990 2000 2010
PFA
(mill
ions
)
Non -maturing 1SW
0.0
1.0
2.0
3.0
4.0
1970 1980 1990 2000 2010
PFA
(mill
ions
)
Maturing 1SW
0.0
1.0
2.0
3.0
1970 1980 1990 2000 2010
PFA
(mill
ions
)
Non -maturing 1SW
0.0
0.1
0.2
0.3
0.4
0.5
0.6
1970 1980 1990 2000 2010
Spaw
ners
(mill
ions
)
1SW spawners
0.0
0.1
0.2
0.3
0.4
1970 1980 1990 2000 2010Sp
awne
rs (m
illio
ns)
0.0
0.5
1.0
1.5
1970 1980 1990 2000 2010
Spaw
ners
(mill
ions
)
1SW spawners
0.0
0.2
0.4
0.6
0.8
1.0
1970 1980 1990 2000 2010
Sapw
ners
(mill
ions
)
MSW spawners
MSW spawners
Figure 3.1.1 Estimated PFA (recruits) (left panels) and spawning escapement (right panels), with 95% confidence limits, for maturing 1SW and non‐maturing 1SW salmon in Northern and Southern Europe.

Extract ICES WGNAS REPORT 2010 67
20
25
30
35
40
45
50
55
60
65
70
1971
1974
1977
1980
1983
1986
1989
1992
1995
1998
2001
2004
2007
Fishery Year
% E
xplo
itatio
n
1SW MSW
Figure 3.1.2 Exploitation rates of wild 1SW and MSW salmon by commercial and recreational fisheries in the Northern NEAC area from 1971 to 2009.
0
10
20
30
40
50
60
1971
1974
1977
1980
1983
1986
1989
1992
1995
1998
2001
2004
2007
Fishery Year
% E
xplo
itatio
n
1SW MSW
Figure 3.1.3 Exploitation rates of wild 1SW and MSW salmon by commercial and recreational fisheries in the Southern NEAC area from 1971 to 2009.

68 Extract ICES WGNAS REPORT 2010
-2.50
-2.00
-1.50
-1.00
-0.50
0.00
1975 1980 1985 1990 1995 2000 2005 2010 2015
maturingnon-maturing
Northern NEAC
-2.50
-2.00
-1.50
-1.00
-0.50
0.00
1975 1980 1985 1990 1995 2000 2005 2010 2015
maturingnon-maturing
Southern NEAC
Figure 3.6.2.1 Productivity parameters (log‐scale, median) by year for the maturing and non‐maturing Northern and Southern NEAC forecast models. Error bars are 2.5 and 97.5 BCI. Model forecasts are enclosed within the boxed areas.

Extract ICES WGNAS REPORT 2010 69
0.20
0.30
0.40
0.50
0.60
0.70
0.80
1975 1980 1985 1990 1995 2000 2005 2010 2015
Northern NEAC
0.20
0.30
0.40
0.50
0.60
0.70
0.80
1975 1980 1985 1990 1995 2000 2005 2010 2015
Southern NEAC
Figure 3.6.2.2 Proportion of maturing 1SW parameter (median) by year from the Northern and South‐ern NEAC forecast models. Error bars are 2.5 and 97.5 BCI. Model forecasts are enclosed within the boxed areas.

70 Extract ICES WGNAS REPORT 2010
a)
0
250
500
750
1000
1250
1500
1750
2000
1990 1995 2000 2005 2010 2015
Lagg
ed e
ggs
(x 1
000)
Northern NEAC
b)
0
500
1000
1500
2000
2500
3000
3500
4000
1975 1980 1985 1990 1995 2000 2005 2010 2015
Lagg
ed e
ggs
(x10
00)
Southern NEAC
Figure 3.6.2.3 Estimates of the lagged egg depositions used in the PFA forecast model for the Northern and Southern NEAC areas. (a) Northern NEAC area for 1991 to 2013 forecast years. (b) Southern NEAC area for 1978 to 2013 forecast years. Symbols are: solid diamonds = MSW salmon, open circles = 1SW salmon.
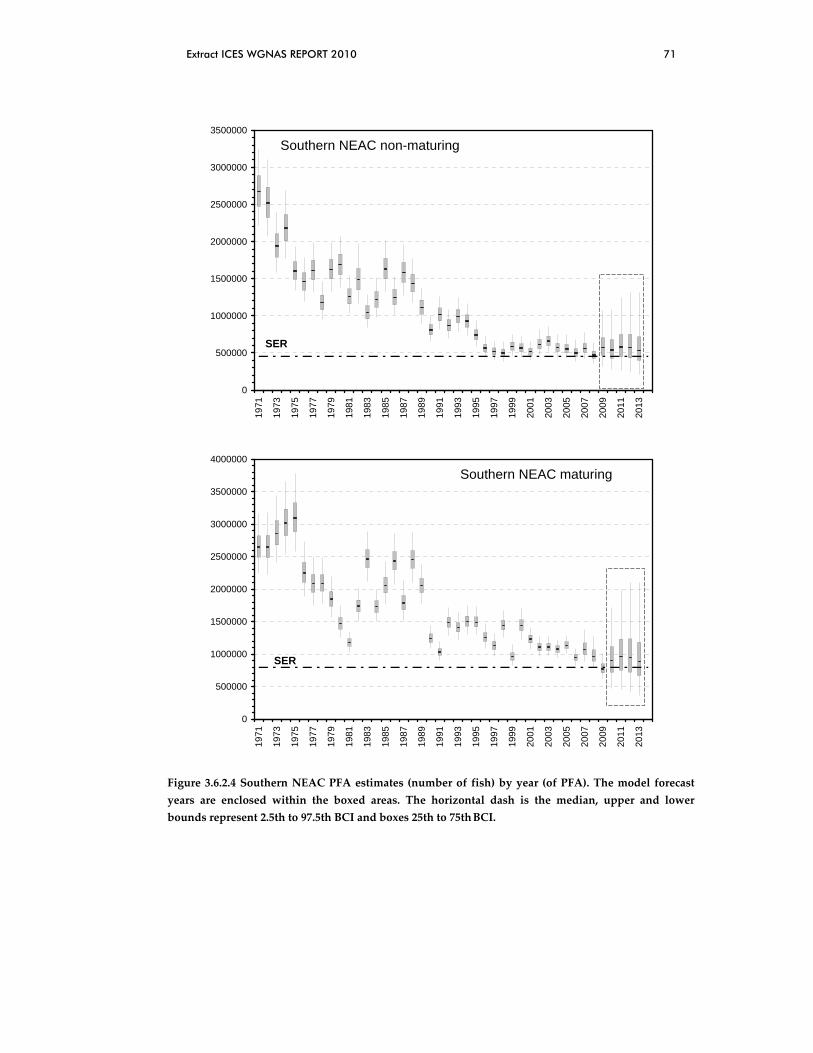
Extract ICES WGNAS REPORT 2010 71
0
500000
1000000
1500000
2000000
2500000
3000000
3500000
1971
1973
1975
1977
1979
1981
1983
1985
1987
1989
1991
1993
1995
1997
1999
2001
2003
2005
2007
2009
2011
2013
Southern NEAC non-maturing
SER
0
500000
1000000
1500000
2000000
2500000
3000000
3500000
4000000
1971
1973
1975
1977
1979
1981
1983
1985
1987
1989
1991
1993
1995
1997
1999
2001
2003
2005
2007
2009
2011
2013
SER
Southern NEAC maturing
Figure 3.6.2.4 Southern NEAC PFA estimates (number of fish) by year (of PFA). The model forecast years are enclosed within the boxed areas. The horizontal dash is the median, upper and lower bounds represent 2.5th to 97.5th BCI and boxes 25th to 75th BCI.

72 Extract ICES WGNAS REPORT 2010
0
250000
500000
750000
1000000
1250000
1500000
1750000
1971
1973
1975
1977
1979
1981
1983
1985
1987
1989
1991
1993
1995
1997
1999
2001
2003
2005
2007
2009
2011
2013
Northern NEAC non-maturing
SER
0
250000
500000
750000
1000000
1250000
1500000
1750000
1971
1973
1975
1977
1979
1981
1983
1985
1987
1989
1991
1993
1995
1997
1999
2001
2003
2005
2007
2009
2011
2013
Northern NEAC maturing
SER
Figure 3.6.2.5 Northern NEAC PFA estimates (number of fish) by year (of PFA). The model forecast years are enclosed within the boxed areas. The horizontal dash is the median, upper and lower bounds represent 2.5th to 97.5th BCI and boxes 25th to 75th BCI.

Extract ICES WGNAS REPORT 2010 73
‐100 ‐50 0 50 100
Halselva
Imsa
Vesturdalsa
Northern NEAC area
‐100 ‐50 0 50 100
Ellidar
Bush
N. Esk
Corrib
Dee
Scorff
Bresle
Nivelle
Southern NEAC area
‐100 ‐50 0 50 100 150 200 250
Halselva
Drammen
Imsa
Northern NEAC area
‐100 ‐50 0 50 100 150 200 250
Ranga
Bush 1+
Bush 2+
LeeCorrib C
Corrib G
Erne
ScreeBurrishoole
DelphiBunowen
Shannon
Southern NEAC area
Figure 3.8.10.1 Comparison of the percent change in the five‐year mean return rates for 1SW and 2SW salmon by wild (top) and hatchery (lower) salmon smolts to rivers of Northern and Southern NEAC areas for the 1999–2003 and 2004–2008 smolt years (1998–2002 and 2003–2007 for 2SW salmon). Filled circles are for 1SW and open circles are for 2SW dataseries. Populations with at least 3 data points in each of the two time periods are included in the analysis. The scale of change in some rivers is influ‐enced by low return numbers, where a few fish more or less returning may have a significant impact on the percent change.

74 Extract ICES WGNAS REPORT 2010
0
10
20
30
40
50
1980 1982 1984 1986 1988 1990 1992 1994 1996 1998 2000
Sha
re o
f cat
ch (%
)
West Greenland sharing allocation
agreed for NAC 2SW stock complex
a)
0
2
4
6
8
10
12
1980 1982 1984 1986 1988 1990 1992 1994 1996 1998 2000
Sha
re o
f cat
ch (%
)
b)
0
2
4
6
8
10
12
14
16
18
20
1980 1982 1984 1986 1988 1990 1992 1994 1996 1998 2000
Sha
re o
f cat
ch (%
)
West GreenlandFaroes
c)
Figure 3.10.6.1 Allocation of catches between West Greenland, Faroes and homewater fisheries, (a) proportion of total catch (weight) of NAC 2SW salmon taken at West Greenland, (b) proportion of total catch (weight) of Northern NEAC salmon (all ages) taken at Faroes and (c) proportion of total catch (weight) of Southern NEAC salmon (all ages) taken at West Greenland and Faroes. In each case the proportions are based on running means of the previous 5 years for the corresponding PFA co‐horts.

Extract ICES WGNAS REPORT 2010 75
Estimate historic PFA of NEAC fish by ‘management region’
Deduct catch from NEAC forecastby ‘management region’ and year
Estimate probability that management objectives will be achieved
Catch Option(s) (Wt)
Convert Catch Option(s) to numbers
Est. numbers of NEAC fishby ‘management region’
Deduct NEAC sharing allocation
Forecast historic PFA of NEAC fish by ‘management region’
Discount by M for time from fishery to HWs
Address WGFinteraction
Figure 3.10.7.1 Diagrammatic representation of possible assessment procedure for provision of catch advice for the Faroes fishery within a risk framework.

76 Extract ICES WGNAS REPORT 2010
4 North American Commission
4.1 Status of stocks/exploitation
In 2009, 2SW spawner estimates for the six geographic areas indicated that all areas were below their conservation limit (CL, Figure 4.5.2.3) and are suffering reduced reproductive capacity.
The estimated exploitation rate of North American origin salmon in North American fisheries has declined (Figure 4.4.6.1) from approximately 79% to 14% for 2SW salmon and from approximately 69% to 14% for 1SW salmon. In 2009, exploitation rates on 1SW and 2SW salmon remained among the lowest in the time‐series.
4.2 Management objectives
Management objectives are included in Section 1.4.
4.3 Reference points
There are no changes recommended in the 2SW salmon CLs from those identified previ‐ously. CLs for 2SW salmon for Canada total 123 349 and for the USA, 29 199, for a com‐bined total of 152 548 2SW salmon.
COUNTRY AND COMISSION AREA
STOCK AREA 2SW SPAWNER REQUIREMENT
Labrador 34 746
Newfoundland 4022
Gulf of St Lawrence 30 430
Québec 29 446
Scotia‐Fundy 24 705
Canada Total 123 349
USA 29 199
North American Total 152 548
4.4 NASCO has requested ICES to describe the key events of the 2009 fisheries
4.4.1 Key events of the 2009 fisheries
• The majority of harvest fisheries were directed to small salmon. • 2009 harvest was 38 656 small salmon and 11 316 large salmon, 34% less small
salmon and 3.6% less large salmon compared with 2008. • Catches remain very low relative to pre 1990 values.
4.4.2 Harvest of North American salmon, expressed as 2SW salmon equivalents
Harvest histories (1972 to 2009) of salmon, expressed as 2SW salmon equivalents are pro‐vided in Table 4.4.2.1. The Newfoundland‐Labrador commercial fishery historically was a mixed‐stock fishery and harvested both maturing and non‐maturing 1SW salmon as well as 2SW maturing salmon. The harvest in these fisheries of repeat spawners and older sea ages was not considered in the run reconstructions.

Extract ICES WGNAS REPORT 2010 77
Harvests of 1SW non‐maturing salmon in Newfoundland‐Labrador commercial fisheries have been adjusted by natural mortalities of 3% per month for 13 months, and 2SW har‐vests in these same fisheries have been adjusted by one month to express all harvests as 2SW equivalents in the year and time they would reach rivers of origin. The Labrador commercial fishery has been closed since 1998. Harvests from the Aboriginal Peoples’ fisheries in Labrador (since 1998) and the residents’ food fishery in Labrador (since 2000) are both included. Mortalities in mixed‐stock and terminal fisheries areas in Canada were summed with those of USA to estimate total 2SW equivalent mortalities in North Amer‐ica. The terminal fisheries included coastal, estuarine and river catches of all areas, except Newfoundland and Labrador where only river catches were included. Harvest equiva‐lents within North America peaked at about 363 000 fish in 1976 and are now about 11 100 2SW salmon equivalents (Table 4.4.2.1).
In the most recent year, the harvest of cohorts destined to be 2SW salmon in terminal fisheries of North America was 72% of the total catch. Harvest values ranged from 20 to 30% during 1972 to 1982 and 68 to 91% during 1996 to 2009 (Table 4.4.2.1). Percentages increased significantly since 1992 with the reduction and closures of the Newfoundland and Labrador commercial mixed‐stock fisheries. The number of 2SW salmon equivalents taken in the food fisheries in Labrador was 3137 fish in 2009.
4.4.3 Gear and effort
Canada
The 23 areas for which the Department of Fisheries and Oceans (DFO) manages the salmon fisheries are called Salmon Fishing Areas (SFAs); for Québec, the management is delegated to the Ministère des Ressources naturelles et de la Faune and the fishing areas are designated by Q1 through Q11 (Figure 4.4.3.1). Harvest (fish which are retained) and catches (including harvests and fish caught‐and‐released in recreational fisheries) are categorized in two size groups: small and large. Small salmon, generally 1SW, in the rec‐reational fisheries refer to salmon less than 63 cm fork length, whereas in commercial fisheries, it refers to salmon less than 2.7 kg whole weight. Large salmon, generally MSW, in recreational fisheries are greater than or equal to 63 cm fork length and in commercial fisheries refer to salmon greater than or equal to 2.7 kg whole weight.
Three groups exploited salmon in Canada in 2009; Aboriginal peoples, residents fishing for food in Labrador, and recreational fishers. There were no commercial fisheries in Canada in 2009.
In 2009, four subsistence fisheries harvested salmonids in Labrador: 1) Nunatsiavut Gov‐ernment (NG) members fishing in the northern Labrador communities of Rigolet, Makkovik, Hopedale, Postville, and Nain and in Lake Melville; 2) Innu Nation members fishing in Natuashish and in Lake Melville from the community of Sheshatshiu; 3) LMN (Labrador Métis Nation) members fishing in southern Labrador from Fish Cove Point to Cape St Charles and, 4) Labrador residents fishing in Lake Melville and coastal commu‐nities in southern Labrador from Cartwright to Cape St Charles. The NG, Innu, and LMN fisheries were regulated by Aboriginal Fishery Guardians jointly administered by the aboriginal groups and the Department of Fisheries and Oceans (DFO) as well as by DFO Fishery Officers and Guardian staff. The Nunatsiavut Government is directly responsible through the Torngat Fisheries Board for regulating its fishery through its Conservation Officers. The fishing gear is multifilament gillnets of 15 fathoms in length of a stretched

78 Extract ICES WGNAS REPORT 2010
mesh size ranging from 3 to 4 inches. Although nets are mainly set in estuarine waters some nets are also set in coastal areas usually within bays. Catch statistics are based on logbook reports.
Most catches (95%, Figure 2.1.1.3) in North America now take place in rivers or in estuar‐ies. Fisheries are principally managed on a river‐by‐river basis and, in areas where reten‐tion of large salmon is allowed, it is closely controlled. The commercial fisheries are now closed and the remaining coastal food fisheries in Labrador are mainly located close to river mouths and likely harvest few salmon from other than local rivers.
The following management measures were in effect in 2009.
Aboriginal peoples’ food fisheries
In Québec, Aboriginal peoples’ food fisheries took place subject to agreements or through permits issued to the bands. There are 10 bands with subsistence fisheries in addition to the fishing activities of the Inuit in Ungava (Q11), who fished in estuaries or within riv‐ers. The permits generally stipulate gear, season, and catch limits. Catches in food fisher‐ies have to be reported collectively by each Aboriginal user group. However, if reports are not available, the catches are estimated. In the Maritimes (SFAs 15 to 23), food fishery harvest agreements were signed with several Aboriginal peoples groups (mostly First Nations) in 2009. The signed agreements often included allocations of small and large salmon and the area of fishing was usually in‐river or estuaries. Harvests that occurred both within and outside agreements were obtained directly from the Aboriginal peoples. In Labrador (SFAs 1 and 2), food fishery arrangements with the Nunatsiavut Govern‐ment, the Innu First Nation, and the LMN, resulted in fisheries in estuaries and coastal areas. By agreement with First Nations, there were no food fisheries for salmon on the island of Newfoundland in 2009. Harvest by Aboriginal peoples with recreational li‐censes is reported under the recreational harvest categories.
Resident food fisheries in Labrador
In 2009, a licensed food fishery for local residents took place, using gillnets, in Lake Mel‐ville (SFA 1) and in estuary and coastal areas of southern Labrador (SFA 2). Residents who requested a license were permitted to retain a maximum of four salmon of any size while fishing for trout and charr; four salmon tags accompanied each license. All licen‐sees were requested to complete logbooks. DFO is responsible for regulating the Resident Fishery.
Recreational fisheries
Licenses are required for all persons fishing recreationally for Atlantic salmon. Gear is restricted to fly fishing and there are daily/seasonal bag limits. Recreational fisheries management in 2009 varied by area and large portions of the southern areas remained closed to all directed salmon fisheries. Except in Québec and Labrador (SFA 1 and some rivers of SFA 2), only small salmon could be retained in the recreational fisheries.
USA
There were no recreational or commercial fisheries for Atlantic salmon in the USA in 2009.
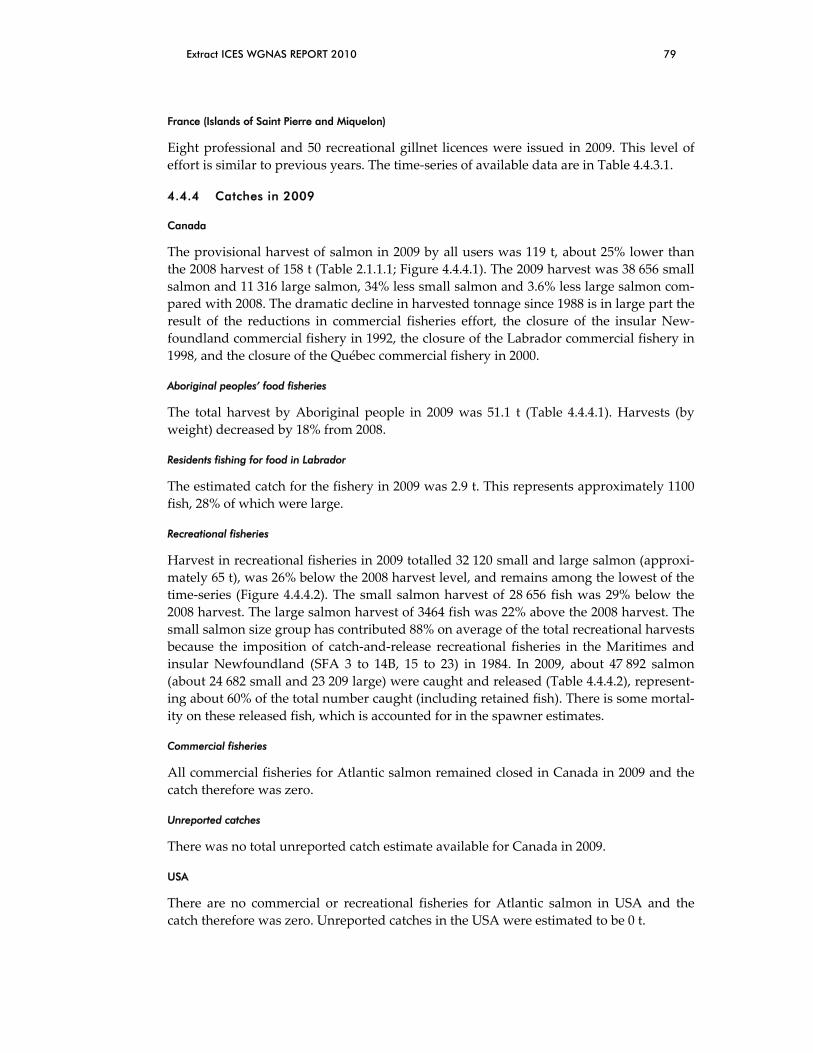
Extract ICES WGNAS REPORT 2010 79
France (Islands of Saint Pierre and Miquelon)
Eight professional and 50 recreational gillnet licences were issued in 2009. This level of effort is similar to previous years. The time‐series of available data are in Table 4.4.3.1.
4.4.4 Catches in 2009
Canada
The provisional harvest of salmon in 2009 by all users was 119 t, about 25% lower than the 2008 harvest of 158 t (Table 2.1.1.1; Figure 4.4.4.1). The 2009 harvest was 38 656 small salmon and 11 316 large salmon, 34% less small salmon and 3.6% less large salmon com‐pared with 2008. The dramatic decline in harvested tonnage since 1988 is in large part the result of the reductions in commercial fisheries effort, the closure of the insular New‐foundland commercial fishery in 1992, the closure of the Labrador commercial fishery in 1998, and the closure of the Québec commercial fishery in 2000.
Aboriginal peoples’ food fisheries
The total harvest by Aboriginal people in 2009 was 51.1 t (Table 4.4.4.1). Harvests (by weight) decreased by 18% from 2008.
Residents fishing for food in Labrador
The estimated catch for the fishery in 2009 was 2.9 t. This represents approximately 1100 fish, 28% of which were large.
Recreational fisheries
Harvest in recreational fisheries in 2009 totalled 32 120 small and large salmon (approxi‐mately 65 t), was 26% below the 2008 harvest level, and remains among the lowest of the time‐series (Figure 4.4.4.2). The small salmon harvest of 28 656 fish was 29% below the 2008 harvest. The large salmon harvest of 3464 fish was 22% above the 2008 harvest. The small salmon size group has contributed 88% on average of the total recreational harvests because the imposition of catch‐and‐release recreational fisheries in the Maritimes and insular Newfoundland (SFA 3 to 14B, 15 to 23) in 1984. In 2009, about 47 892 salmon (about 24 682 small and 23 209 large) were caught and released (Table 4.4.4.2), represent‐ing about 60% of the total number caught (including retained fish). There is some mortal‐ity on these released fish, which is accounted for in the spawner estimates.
Commercial fisheries
All commercial fisheries for Atlantic salmon remained closed in Canada in 2009 and the catch therefore was zero.
Unreported catches
There was no total unreported catch estimate available for Canada in 2009.
USA
There are no commercial or recreational fisheries for Atlantic salmon in USA and the catch therefore was zero. Unreported catches in the USA were estimated to be 0 t.

80 Extract ICES WGNAS REPORT 2010
France (Islands of Saint-Pierre and Miquelon) harvests
A total harvest of 3.4 t was reported in the professional and recreational fisheries in 2009. This is similar to the 2008 harvest which was one of the highest in the available time‐series (Table 4.4.3.1).
There are no unreported catch estimates.
4.4.5 Origin and composition of catches
In the past, salmon from both Canada and the USA were taken in the commercial fisher‐ies of eastern Canada. The Aboriginal Peoples’ and resident food fisheries that exist in Labrador may intercept some salmon from other areas of North America; however, in 2009, there were no salmon tagged in other areas and reported from the food fisheries. Also none of the salmon sampled during the Food Fishery Sampling Programme were tagged or marked. There were no tagged salmon of USA origin reported in Canadian fisheries in 2009.
Results of sampling programme for Labrador subsistence fisheries
As in previous years a sampling programme was in place for the 2009 subsistence fisher‐ies in Labrador. Landed fish were sampled opportunistically. Fish were measured (fork length), weighed (gutted weight or whole weight if available) and if possible the sex was determined. Scales were taken for subsequent age analysis. Fish were also examined for the presence of external tags, brands or elastomer marks, and adipose fin clips. In south‐ern Labrador, two people were hired by the Labrador Metis Nation to conduct sampling and aboriginal Guardians were asked to sample salmon when possible. In northern Lab‐rador, Conservation Officers of the Nunatsiavut Government conducted the sampling.
In total, 583 samples were collected from the subsistence fisheries. Scale reading indi‐cated that the sample consisted of 76% 1SW, 18% 2SW and 6% previously spawned salmon. Small and large salmon based on a 2.7 kg cut off, similar to that used in the Abo‐riginal fishery, indicated small salmon were 96% 1SW, 2% 2SW and 2% previously spawned salmon and large salmon were 19% 1SW, 63% SW and 17% previously spawned salmon. This is similar to the distribution observed in 2008. The river ages (Figure 4.4.5.1) of samples collected from the subsistence fisheries (for food social and ceremonial pur‐poses (FSC)) were compared with ages from scales (1946 samples from north Labrador and 975 in south Labrador) obtained from assessment facilities in 2000–2005.
There was a difference in river age distribution of adults from subsistence fisheries com‐pared with returns to rivers in northern Labrador (Chi square=21.5, P=<0.0015), but not in southern Labrador (Chi square=9.1, P=0.1). The significant difference in river age in the samples from northern Labrador is likely owing to a larger than expected number of river age 3 fish in the upper Lake Melville sample (Figure 4.4.5.2). The absence of age 1 and rarity of age 2 smolts in the catches in 2009 suggests that these fisheries did not ex‐ploit southern North America stocks to any great extent. The presence of river age 5 to 7 years in the samples provides evidence that the fisheries are exploiting northern area (predominantly Labrador) stocks.
The Working Group noted that the sampling programme conducted in 2009 provided biological characteristics of the harvest and that the information may be useful for updat‐ing parameters used in the Run Reconstruction Model for North America. As well it pro‐

Extract ICES WGNAS REPORT 2010 81
vides material to assess the origin of salmon in this fishery. The Working Group recom‐mends that sampling be continued and expanded in 2010 and future years.
4.4.6 Exploitation rates
Canada
In the Newfoundland recreational fishery, exploitation rates for retained small salmon ranged from a high of 13% on Torrent River to a low of 5% on Terra Nova River. Overall, exploitation of small salmon in these rivers declined from 30% in 1986 to approximately 10% in 2009 which is one of the lowest rates of the past 25 years. In Labrador, at Sand Hill River, exploitation on small salmon was 4.6% and 0.41% on large salmon.
In Quebec, the 2009 total fishing exploitation rate was around 18%; about the average of the five previous years. Native peoples’ fishing exploitation rate was 7% of the total re‐turn. Recreational fishing exploitation rate was 11% on the total run, 15% for the small and 8% for the large salmon, representing a decrease from the previous five year average of 18% for small salmon and 9% for large salmon.
USA
There was no exploitation of USA salmon in home waters.
Exploitation trends for North American salmon fisheries
Annual exploitation rates of 1SW and 2SW salmon in North America for the 1970 to 2009 time period were calculated by dividing annual harvests in all North American fisheries by annual estimates of the returns to all six regions of North America. The fisheries in‐cluded coastal, estuarine and river fisheries in all areas, as well as the commercial fisher‐ies of Newfoundland and Labrador which harvested salmon from all regions in North America.
Exploitation rates of both 1SW and 2SW salmon fluctuated annually but remained rela‐tively steady until 1984 when exploitation of 2SW salmon declined considerably with the introduction of the non‐retention of large salmon in angling fisheries and reductions in commercial fisheries (Figure 4.4.6.1). Exploitation of 1SW salmon declined substantially in North America after 1991 with the closure of the Newfoundland commercial fishery in 1992. Declines continued in the 1990s with continuing management controls in all fisher‐ies to reduce exploitation. In the last few years, exploitation rates on 1SW and 2SW salmon have remained at the lowest in the time‐series. However, exploitation rates across regions within North America are highly variable.

82 Extract ICES WGNAS REPORT 2010
Table 4.4.2.1 Harvests expressed as 2SW salmon equivalents in North American salmon fisheries, 1972–2009. Only midpoints of the estimated values have been used.
CANADAMIXED STOCK TERMINAL FISHERIES IN YEAR i USA
Exploitation ratesYear i in North America
1SW 2SW
1972 20,576 9 153,767 174,343 314 593 27,417 22,389 4,819 229,875 346 230,221 24 197,704 427,925 54 0.493 0.6291973 17,752 6 219,175 236,928 719 776 32,751 17,914 5,144 294,232 327 294,559 20 148,098 442,657 67 0.564 0.8441974 24,235 7 235,915 260,151 593 503 47,631 21,430 11,628 341,936 247 342,183 24 186,201 528,384 65 0.500 0.6901975 23,890 7 237,565 261,455 241 496 41,097 15,677 11,556 330,521 389 330,910 21 154,712 485,623 68 0.479 0.8451976 35,437 10 256,586 292,023 618 377 42,139 18,090 10,147 363,394 191 363,585 20 194,613 558,198 65 0.428 0.6721977 27,194 8 241,204 268,398 954 780 42,301 33,433 12,202 358,068 1,355 359,424 25 112,871 472,295 76 0.445 0.7801978 27,489 11 157,309 184,798 580 534 37,421 23,806 8,414 255,551 894 256,445 28 142,778 399,224 64 0.369 0.6801979 13,873 10 92,076 105,949 469 124 25,234 6,300 3,155 141,231 433 141,664 25 103,885 245,549 58 0.398 0.9821980 20,721 6 217,186 237,907 646 636 53,567 29,832 15,370 337,957 1,533 339,490 30 141,916 481,406 71 0.451 0.6991981 34,134 11 201,319 235,453 384 437 44,375 16,329 11,089 308,066 1,267 309,333 24 120,995 430,328 72 0.373 0.8751982 33,992 14 134,407 168,398 473 395 35,204 25,709 8,345 238,524 1,413 239,937 30 161,183 401,119 60 0.375 0.7141983 25,457 12 111,553 137,010 313 421 34,472 27,097 11,595 210,908 386 211,294 35 145,798 357,092 59 0.420 0.5591984 19,239 14 82,798 102,037 379 185 24,408 5,997 3,628 136,634 675 137,309 26 26,830 164,139 84 0.320 0.6391985 14,503 11 78,757 93,259 219 14 27,483 2,707 4,930 128,613 645 129,258 28 32,423 161,681 80 0.369 0.8011986 19,679 12 104,891 124,569 340 35 33,846 4,541 2,824 166,156 606 166,762 25 99,140 265,901 63 0.358 0.6331987 24,953 13 132,175 157,128 457 18 33,807 3,756 1,370 196,536 300 196,836 20 123,367 320,203 61 0.431 0.6901988 31,805 21 81,129 112,934 514 23 34,262 3,853 1,373 152,959 248 153,207 26 123,871 277,077 55 0.303 0.5311989 22,008 16 81,352 103,360 337 7 28,901 3,443 265 136,313 397 136,710 24 84,977 221,687 62 0.373 0.5251990 19,411 18 57,358 76,769 261 19 27,986 2,715 593 108,344 696 109,040 30 43,631 152,671 71 0.258 0.5781991 11,933 14 40,434 52,367 66 12 29,277 1,796 1,331 84,850 231 85,080 38 52,244 137,325 62 0.301 0.6291992 9,896 14 25,105 35,001 581 54 30,016 2,694 1,114 69,461 167 69,628 50 79,585 149,213 47 0.045 0.3351993 3,184 7 13,271 16,455 378 0 23,153 1,210 1,110 42,306 166 42,472 61 29,828 72,300 59 0.032 0.2741994 2,113 5 11,936 14,050 455 0 24,052 2,219 756 41,533 1 41,534 66 1,892 43,426 96 0.030 0.3711995 1,222 3 8,675 9,897 408 0 23,331 2,019 330 35,984 0 35,984 72 1,892 37,877 95 0.023 0.2981996 1,060 3 5,646 6,706 334 0 22,413 2,412 766 32,631 0 32,631 79 19,181 51,811 63 0.014 0.2781997 958 3 5,390 6,348 158 0 18,574 1,849 581 27,509 0 27,509 77 19,339 46,848 59 0.029 0.2841998 1,143 7 1,762 2,905 231 0 11,256 2,238 322 16,952 0 16,952 83 13,056 30,008 56 0.007 0.2281999 176 1 842 1,018 320 0 9,032 1,127 450 11,947 0 11,947 91 4,321 16,268 73 0.006 0.1822000 151 1 1,050 1,200 262 0 9,425 1,714 193 12,794 0 12,794 91 6,443 19,237 67 0.010 0.1832001 285 2 1,298 1,583 338 0 10,104 1,400 255 13,680 0 13,680 88 5,930 19,609 70 0.012 0.1762002 261 3 1,116 1,377 207 0 7,297 927 179 9,986 0 9,986 86 8,606 18,592 54 0.015 0.1772003 310 2 1,688 1,998 222 0 8,870 1,193 189 12,472 0 12,472 84 3,222 15,695 79 0.015 0.1632004 352 2 2,870 3,222 259 0 8,756 3,328 105 15,670 0 15,670 79 3,475 19,145 82 0.019 0.2132005 466 4 2,187 2,653 291 0 7,803 637 91 11,475 0 11,475 77 4,339 15,814 73 0.019 0.1512006 560 5 2,398 2,958 227 0 7,147 587 137 11,056 0 11,056 73 4,178 15,234 73 0.019 0.1552007 560 5 2,059 2,619 235 0 6,932 650 95 10,531 0 10,531 75 4,933 15,464 68 0.019 0.1572008 496 4 3,034 3,529 200 0 6,816 492 0 11,037 0 11,037 68 6,616 17,654 63 0.016 0.1442009 542 5 2,595 3,137 218 0 6,953 801 0 11,109 0 11,109 72 7,542 18,651 60
NF-Lab as 1SW = NC1(mid-pt) * 0.677057 (M of 0.03 per month for 13 months to July for Canadian terminal fisheries) NF-Lab as 2SW = NC2 (mid-pt) * 0.970446 (M of 0.03 per month for 1 month to July of Canadian terminal fisheries)Terminal fisheries = 2SW returns (mid-pt) - 2SW spawners (mid-pt)a - starting in 1998, there was no commercial fishery in Labrador; numbers reflect size of aboriginal fish harvest in 1998-2009 and resident food fishery harvest in 2000-2009
Labrador rivers
Terminal Fisheries as a % of NA Total
Canadian total
Scotia - Fundy Region
Gulf Region
Quebec Region
Nfld rivers
NF-LAB 1SW (Year
i-1) (a)
Year i% 1SW of total 2SW
equivalents
Year iNF-LAB 2SW (a)
Year iNF-Lab
total
Harvest in homewaters as % of total NW Atlantic
NW Atlantic
TotalGreenland
Total
North American
Total

Extract ICES WGNAS REPORT 2010 83
Table 4.4.3.1 The number of professional and recreational gillnet licenses issued at St Pierre and Mi‐quelon and landings, 1995 to 2009.
NUMBER OF LICENCES REPORTED LANDINGS (TONNES)
Year Professional Recreational Professional Recreational Total
1990 1.146 0.734 1.880
1991 0.632 0.530 1.162
1992 1.295 1.024 2.319
1993 1.902 1.041 2.943
1994 2.633 0.790 3.423
1995 12 42 0.392 0.445 0.837
1996 12 42 0.951 0.617 1.568
1997 6 36 0.762 0.729 1.491
1998 9 42 1.039 1.268 2.307
1999 7 40 1.182 1.140 2.322
2000 8 35 1.134 1.133 2.267
2001 10 42 1.544 0.611 2.155
2002 12 42 1.223 0.729 1.952
2003 12 42 1.620 1.272 2.892
2004 13 42 1.499 1.285 2.784
2005 14 52 2.243 1.044 3.287
2006 14 48 1.730 1.825 3.555
2007 13 53 0.970 0.977 1.947
2008 na na na na 3.540
2009 8 50 1.8 1.6 3.4

84 Extract ICES WGNAS REPORT 2010
Table 4.4.4.1 Harvests in 2009 (by weight) and the percent large by weight and number in the Aborigi‐nal Peoples’ Food Fisheries in Canada.
ABORIGINAL PEOPLES’ FOOD FISHERIES
Year Harvest (t) % large
by weight by number
1990 31.9 78
1991 29.1 87
1992 34.2 83
1993 42.6 83
1994 41.7 83 58
1995 32.8 82 56
1996 47.9 87 65
1997 39.4 91 74
1998 47.9 83 63
1999 45.9 73 49
2000 45.7 68 41
2001 42.1 72 47
2002 46.3 68 43
2003 44.3 72 49
2004 60.8 66 44
2005 56.7 57 34
2006 61.4 60 39
2007 48.0 62 40
2008 62.4 66 44
2009 51.1 65 45

Extract ICES WGNAS REPORT 2010 85
Table 4.4.4.2 Numbers of salmon hooked and‐released in Eastern Canadian salmon angling fisheries. Data for years prior to 1997 are incomplete.
Newfoundland Nova Scotia New Brunswick Prince Edward Island Quebec CANADA
Year Small Large Total Small Large TotalSmall Kelt
Small Bright
Large Kelt
Large Bright Total Small Large Total Small Large Total SMALL LARGE TOTAL
1984 939 1,655 2,594 661 851 1,020 14,479 17,011 2,451 17,154 19,6051985 315 315 1,323 6,346 7,669 1,098 3,963 3,809 17,815 26,685 67 6,384 28,285 34,6691986 798 798 1,463 10,750 12,213 5,217 9,333 6,941 25,316 46,807 16,013 43,805 59,8181987 410 410 1,311 6,339 7,650 7,269 10,597 5,723 20,295 43,884 19,177 32,767 51,9441988 600 600 1,146 6,795 7,941 6,703 10,503 7,182 19,442 43,830 767 256 1,023 19,119 34,275 53,3941989 183 183 1,562 6,960 8,522 9,566 8,518 7,756 22,127 47,967 19,646 37,026 56,6721990 503 503 1,782 5,504 7,286 4,435 7,346 6,067 16,231 34,079 1,066 13,563 28,305 41,8681991 336 336 908 5,482 6,390 3,161 3,501 3,169 10,650 20,481 1,103 187 1,290 8,673 19,824 28,4971992 5,893 1,423 7,316 737 5,093 5,830 2,966 8,349 5,681 16,308 33,304 1,250 17,945 28,505 46,4501993 18,196 1,731 19,927 1,076 3,998 5,074 4,422 7,276 4,624 12,526 28,848 30,970 22,879 53,8491994 24,442 5,032 29,474 796 2,894 3,690 4,153 7,443 4,790 11,556 27,942 577 147 724 37,411 24,419 61,8301995 26,273 5,166 31,439 979 2,861 3,840 770 4,260 880 5,220 11,130 209 139 348 922 922 32,491 15,188 47,6791996 34,342 6,209 40,551 3,526 5,661 9,187 472 238 710 1,718 1,718 38,340 13,826 52,1661997 25,316 4,720 30,036 713 3,363 4,076 3,457 4,870 3,786 8,874 20,987 210 118 328 182 1,643 1,825 34,748 22,504 57,2521998 31,368 4,375 35,743 688 2,476 3,164 3,154 5,760 3,452 8,298 20,664 233 114 347 297 2,680 2,977 41,500 21,395 62,8951999 24,567 4,153 28,720 562 2,186 2,748 3,155 5,631 3,456 8,281 20,523 192 157 349 298 2,693 2,991 34,405 20,926 55,3312000 29,705 6,479 36,184 407 1,303 1,710 3,154 6,689 3,455 8,690 21,988 101 46 147 445 4,008 4,453 40,501 23,981 64,4822001 22,348 5,184 27,532 527 1,199 1,726 3,094 6,166 3,829 11,252 24,341 202 103 305 809 4,674 5,483 33,146 26,241 59,3872002 23,071 3,992 27,063 829 1,100 1,929 1,034 7,351 2,190 5,349 15,924 207 31 238 852 4,918 5,770 33,344 17,580 50,9242003 21,379 4,965 26,344 626 2,106 2,732 1,555 5,375 1,042 7,981 15,953 240 123 363 1,238 7,015 8,253 30,413 23,232 53,6452004 23,430 5,168 28,598 828 2,339 3,167 1,050 7,517 4,935 8,100 21,602 135 68 203 1,291 7,455 8,746 34,251 28,065 62,3162005 33,129 6,598 39,727 933 2,617 3,550 1,520 2,695 2,202 5,584 12,001 83 83 166 1,116 6,445 7,561 39,476 23,529 63,0052006 30,491 5,694 36,185 1,014 2,408 3,422 1,071 4,186 2,638 5,538 13,433 128 42 170 1,091 6,185 7,276 37,981 22,505 60,4862007 17,719 4,607 22,326 896 1,520 2,416 1,164 2,963 2,067 7,040 13,234 63 41 104 951 5,392 6,343 23,756 20,667 44,4232008 25,226 5,007 30,233 1,016 2,061 3,077 1,146 6,361 1,971 6,130 15,608 3 9 12 1,361 7,713 9,074 35,113 22,891 58,0042009 19,192 4,484 23,676 670 2,665 3,335 1,338 2,387 1,689 8,174 13,588 6 25 31 1,089 6,173 7,262 24,682 23,209 47,892

86 | Extract ICES WGNAS REPORT 2010
Figure 4.4.3.1 Map of Salmon Fishing Areas (SFAs) and Québec Management Zones (Qs) in Can‐ada.
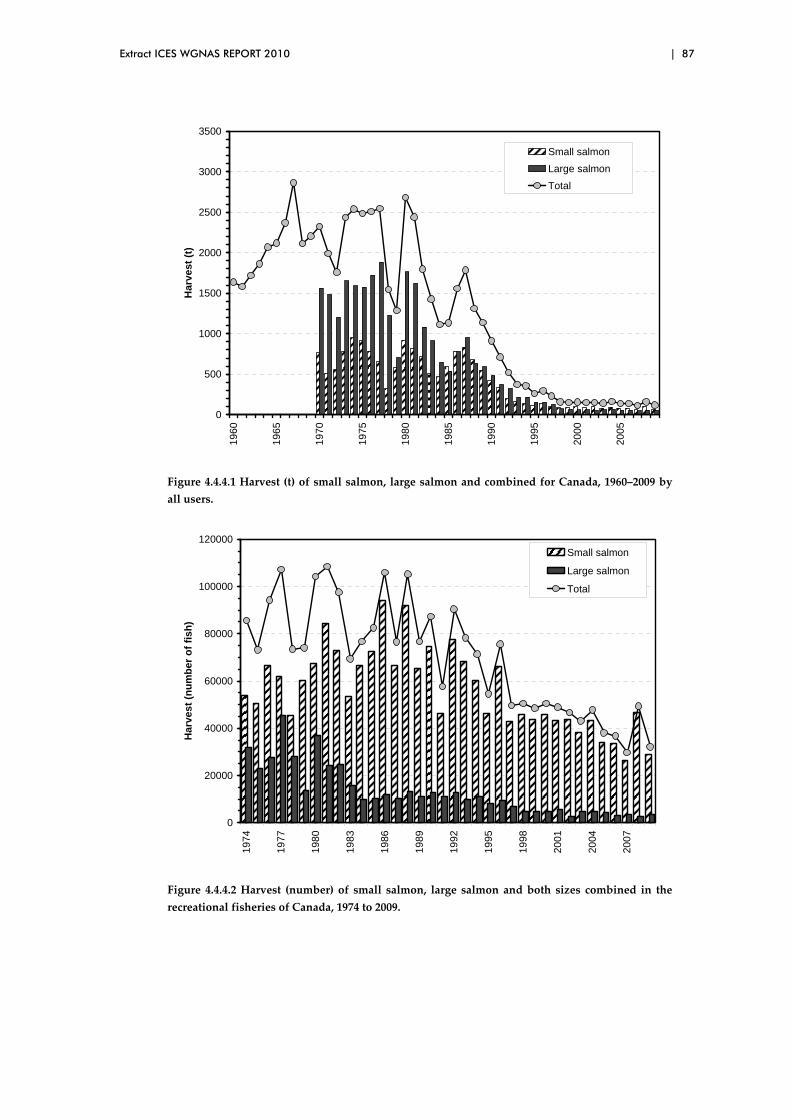
Extract ICES WGNAS REPORT 2010 | 87
0
500
1000
1500
2000
2500
3000
3500
1960
1965
1970
1975
1980
1985
1990
1995
2000
2005
Har
vest
(t)
Small salmonLarge salmonTotal
Figure 4.4.4.1 Harvest (t) of small salmon, large salmon and combined for Canada, 1960–2009 by all users.
0
20000
40000
60000
80000
100000
120000
1974
1977
1980
1983
1986
1989
1992
1995
1998
2001
2004
2007
Har
vest
(num
ber o
f fis
h)
Small salmon
Large salmon
Total
Figure 4.4.4.2 Harvest (number) of small salmon, large salmon and both sizes combined in the recreational fisheries of Canada, 1974 to 2009.

88 | Extract ICES WGNAS REPORT 2010
1 2 3 4 5 6 70
10
20
30
40
50
60
70
80
Per
cent
River age in years
FSC Freshwater
South Labrador0
10
20
30
40
50
60
70 FSC Freshwater
North Labrador
Figure 4.4.5.1 River age distribution of salmon from FSC (food social and ceremonial purposes) fisheries in North and South Labrador in 2009 compared with those at corresponding assessment facilities (freshwater) for 2000 to 2005.

Extract ICES WGNAS REPORT 2010 | 89
1 2 3 4 5 6 70
10
20
30
40
50
60
Perc
ent
River age, years
ULM FSC North Freshwater
Figure 4.4.5.2 River age distribution of salmon from FSC (food social and ceremonial purposes) fishery in upper Lake Melville (ULM FSC) in 2009 compared with river age distribution from freshwater monitoring facilities in North Labrador for 2000 to 2005.
1970 1975 1980 1985 1990 1995 2000 2005 20100.0
0.1
0.2
0.3
0.4
0.5
0.6
0.7
0.8
0.9
1.0
Exp
loita
tion
rate
s
1SW 2SW
Figure 4.4.6.1 Exploitation rates in North America on the North American stock complex of 1SW and 2SW salmon.

90 | Extract ICES WGNAS REPORT 2010
5 Atlantic salmon in the West Greenland Commission
5.1 NASCO has requested ICES to describe the key events of the 2009 fishery
5.1.1 Catch and effort in 2009
A total catch of 25.5 t of salmon was reported during the 2009 fishery (Table 5.1.1.1). Catches were distributed among the six NAFO divisions on the west coast of Greenland. In 2009, a catch of 0.8 t was also reported from East Greenland (Figure 5.1.1.1), accounting for approximately 3% of the combined reported catch (26 t). Catches coming from Divisions 1B–1E (Table 5.1.1.2) represented approximately 78% of the total catch. In NAFO Division 1A, the fishery experienced much lower catches in 2009 than in 2008. Only 195 kg were reported by 19 different people and of these nine reported zero catch. This contrasts with the 4.9 t reported in this area by 44 peo‐ple in 2008.
There is currently no quantitative approach for estimating the unreported catch but the 2009 value is likely to have been at the same level proposed in recent years (10 t).
The Greenland Authorities received 238 reports of salmon catches in 2009 compared with 259 in 2008. In total, 145 people provided reports to the Greenland Home Rule License Office in 2009 which was similar to the previous year (143). Twenty three of these people reported zero catch compared with four people in 2008.
The number of fishers reporting catches has steadily increased up to 2008 from a low of 41 in 2002 to its current level. These levels remain well below the 400 to 600 people reporting landings in the commercial fishery from 1987 to 1991. Since October 2006, the Greenland Home Rule License Office has broadcast TV requests that catch reports be submitted for the season. Thus, it is possible that the increase in the number of people reporting catches, and hence the increased reported landings, reflect changes in reporting practices rather than increased harvest.
5.1.2 Biological characteristics of the catches
International Sampling Programme
The international sampling programme for landings at West Greenland, initiated by NASCO in 2001, was continued in 2009. The sampling was undertaken by teams from Canada, Ireland, UK (Scotland), UK (England and Wales), and USA. Sampling began in August and continued through October. Additionally, staff from the Greenland Institute of Natural Resources assisted with the overall coordination of the pro‐gramme and sampling in Nuuk.
Samplers were stationed in three different communities representing three different NAFO Divisions. No sampling occurred in the fishery in East Greenland in 2009. One sample collected in Nuuk was identified as having originated from the waters of Di‐vision 1C. Nuuk is close to the border between Divisions 1C and 1D and a single fisher harvested fish from Division 1C, but sold his catch at the market in Nuuk (1D). As has been done in the past, that specific catch has been allocated to Division 1C and therefore, division‐specific statistics are presented from four divisions.
In the Baseline Sampling Programme, tissue and biological samples were collected from three landing sites: Sisimiut (NAFO Div. 1B), Nuuk (NAFO Div. 1D), and Qaqortoq (NAFO Division 1F, Figure 5.1.1.1). In total 1738 salmon were inspected for the presence of tags, representing 29% by weight of the reported landings. Of these, 1662 were measured for fork length, 1324 for gutted weight and 668 for whole weight (Table 5.1.2.1). Scales samples were taken from 1683 salmon for age and origin de‐
Extract ICES WGNAS REPORT 2010 | 91
termination and tissue was removed from 1671 for DNA analysis and subsequently used for assignment of continent of origin. In addition the sex of 426 fish was identi‐fied from gonadal examination. Of the 23 adipose finclipped fish recovered four of these had either external or internal tags. In addition, nine tags were submitted to the Nature Institute by local fishers from unsampled fish. The overall breakdown there‐fore was four coded wire tags and nine streamer/Carlin tags (STATE where the tags came from) 3 from Norway (2 from East Greenland), 1 from the US and the 5 remain‐ing tags were from Canada.
Non‐reporting of harvest becomes evident when reported landings are compared with the sample data. Since 2002 the sampling team has seen more fish than were re‐ported as being landed onwards, in at least one of the divisions where international samplers were present. When there is this type of weight discrepancy, the reported landings are adjusted according to the weight of sampled fish and these adjusted landings are used for all subsequent assessments. In 2009 this occurred only at Nuuk. The total discrepancy equalled 2479 kg and the adjusted catch used in the assessment for West Greenland was 28.0 t (Table 5.1.2.2).
The average weight and length of fish from the 2009 catch was 3.5 kg across all ages and 66 cm fork length, with North American 1SW fish averaging 64.9 cm and 3.28 kg whole weight and European 1SW salmon averaging 65.5 cm and 3.40 kg (Table 5.1.2.3). The mean lengths and mean weights for the 2009 samples are larger than the 2007 and 2008 values, but remain close to the previous 10 year mean. It should be noted that the size data is not adjusted for standard week and may not represent a true increase.
North American salmon up to river age six were caught at West Greenland in 2009, with over 93% of the fish being of river‐ages 2 to 4, river‐age 3 fish were 47.3% of the total (Table 5.1.2.3). The river ages of European salmon ranged from 1 to 4 years. About 60% of the European fish in the catch were river‐age 2 and 23.8% were river‐age 3 (Table 5.1.2.3). The percentage of the European origin river age 1 salmon (14.3%) was higher than in 2008 (7.0%).
In 2009, the North American samples were 93.4% 1SW salmon, 2.8% 2SW (the highest value in 12 years) and 3.8% previous spawners (Table 5.1.2.3). The European samples were 89.4% 1SW salmon, 7.6% 2SW (the highest in the time‐series) and 3.0% previous spawners (Table 5.1.2.3).
As part of the sampling, a total of 417 individuals were sexed by gonadal examina‐tion. The sex ratio was 14.1% males (n=59) to 85.9% females (n=358) and 9 individuals were classified as unknown sex.
Enhanced Sampling Programme (SALSEA Greenland)
In addition to the Baseline Sampling Programme described above, an Enhanced Sampling Programme (SALSEA Greenland) was developed to conduct broader and more detailed sampling on a fixed number of fish harvested from the waters off West Greenland. The Enhanced Sampling was designed to be integrated within the Inter‐national Sampling Programme’s infrastructure. Fresh whole fish were purchased di‐rectly from individual fishers and these were used in both the International Sampling Programme as well as a more detailed and enhanced sampling programme.
A total of 412 fresh whole fish were purchased directly from individual fishers. These fish underwent the Enhanced Sampling process and all carcasses were returned to the local community where sampling took place. These fish were part of the nominal catch and not an additional catch from the fishery.

92 | Extract ICES WGNAS REPORT 2010
Origin of the catches
Of the 1671 samples collected for genetic characterization, 1621 were genotyped at between seven and ten microsatellites and assigned to a continent of origin. Apart from 17 samples which could not be genotyped, there were 33 samples collected late in the season which were not available at the time for genotyping but will be in‐cluded in an update of the database in 2010. In total, 91.5% of the salmon sampled from the 2009 fishery were of North American origin and 8.5% fish were of European origin.
The division‐specific and overall continent of origin assignments for the samples col‐lected in 2009 are listed below. Applying the continental percentages for the NAFO division catches (excluding the reported harvest from East Greenland) resulted in estimates of 23 t of North American origin and 2.6 t of European origin fish (7000 and 800 rounded to the nearest 100 fish, respectively) landed in West Greenland in 2009.
CONTINENTAL PERCENTAGES BY NAFO DIVISION OF CATCHES AT WEST GREENLAND NA = NORTH AMERICA, E = EUROPE
2009 Numbers Percentages
NAFO Div Sample dates NA E Totals NA E
1B Aug 27–Oct 10 601 44 645 93.2 6.8
1C Sept 21–Sept 23 35 6 41 85.4 14.6
1D Aug 17–Oct 15 619 33 652 94.9 5.1
1F Aug 13–Sept 10 228 55 283 80.6 19.4
Total 1483 138 1621 91.5 8.5
The Working Group again recommends a continuation and expansion of the broad geographic sampling programme (multiple NAFO divisions) to more accurately es‐timate continent of origin in the mixed‐stock fishery.
5.2 NASCO has requested ICES to provide clarification of the levels of reported and unreported catch in the subsistence fishery since 2002
The salmon fishery is currently regulated according to The Government of Greenland Executive Order no. 21 of August 10, 2002. Landings to fish plants, purchase of salmon to shops, and any export of salmon from Greenland were forbidden. How‐ever, licensed fishers were allowed to sell salmon at the open markets, to hotels, res‐taurants and institutions and unlicensed fishers could fish for their own consumption. Only hook, gillnet, and driftnet are allowed and minimum mesh size is 140 mm stretched. People participating in the salmon fishery are required to report all catches of salmon to, the Greenland Fisheries Licence Office (GFLK) immediately after the fishery has taken place.
5.2.1 Reported catches
There are two types of catch reports. One report is for fish caught for personal use and is must contain information the identity of the fisher, number of salmon caught, gutted weight (including the head) and community of the individual. The other re‐port covers situations where the catch is sold, and requests information on identity of the fisher, number of salmon caught, gutted weight (including the head), community,

Extract ICES WGNAS REPORT 2010 | 93
landing site, vessel number and vessel size. Both reports also request a date and sig‐nature although the date may not necessarily be the date when the fishery took place. None of the reports requires reporting the effort (number of nets and hours fishing), where the fishery took place, or where the catch was sold.
The data provided by GFLK are screened for data errors and missing values have been filled in whenever possible based on available information. Catches have been assigned to NAFO/ICES area by community, and also the number of licenses per community has been estimated from addresses from the license list. Some reports only contain either a number or a weight of the salmon caught, and these missing data have been adjusted by a standard gutted weight of 2.75 kg.
The statistics obtained are limited due to the current reporting system. Also, a large proportion of the fishers may not be inclined to report every time they have had their nets in the water and instead they only report once at the end of the season. The prob‐lem is partially caused by the fact that only reporting date is requested on the report form, and not the catch date.
The WG supports the proposal from the Greenlandic authorities for the establishment of a logbook programme which is a condition of the licensing system for the salmon fishery at west Greenland. Such a logbook or equivalent reporting form, should also request effort information such as, catch site (field code, GPS or fjord), catch date, number of nets, net length, mesh size and number of hours the gillnet has been fish‐ing, so that a more accurate cpue index can be developed.
5.2.2 Unreported catches
An unreported catch will always occur and this may be due to the scattered nature of this fishery. Information campaigns have been launched to encourage people to ap‐ply for a license and report their catches. The present increase in reported catches, issued licenses and number of people reporting their catches, may therefore reflect an increased awareness in the population and the success of these campaigns. It is there‐fore impossible to say whether the observed increase in salmon catches is a true in‐crease or the result of decreasing in unreported catch.
The unreported catch has previously been estimated as 10 t. A large proportion of the catches reported as being for private consumption are however reported by licensed fishers. Of the 26 t reported in 2009, 22 t (83.5%) were reported by licensed fishers as either sold or private. Furthermore, a large proportion of the remaining 4.3 t salmon reported as being for private consumption by unlicensed fishers may still be caught by professional hunters and fishers who forgot to apply for a license or were unaware that a license is required. This suggests that the vast majority of reported harvest caught in Greenland is taken by professional hunters and fishers.
5.2.3 Summary of sources of uncertainty in the reported catches for the Greenland fishery since 2002
There are distinct groups allowed to partake in a fishery at Greenland.
Commercial fishers
This group of fishers require a licence if they wish to sell their catch and they are re‐quired to report this catch.
• While the number of commercial fishers who obtain a licence is known, their reported catches may only be partial. Although they are obliged to

94 | Extract ICES WGNAS REPORT 2010
report all of the catch which they sell, it is unclear to what level this sector is reporting.
• Commercial fishers are obliged to report any catch they take for personal consumption. It is unclear as to the level of unreported catch from this source.
• The commercial fishers are supposed to obtain a licence to fish but not all commercial fishers do so. Again, the level of unreporting in this situation is unclear.
Private fishers
Anybody in Greenland can fish for salmon if it is for private consumption and they are required to report this catch.
• The number of individuals who fish privately for salmon is not known. • The accuracy of the reporting by the private fishers is uncertain. • The catch by private fishers sector is largely unknown.
Adding to the uncertainty in estimating the catch is the situation whereby reports received by the authorities are not always correctly filled in and this may lead to a loss of catch information.
Thus, there are several sources of unreported landings that remain unquantified but which might be estimated provided that basic catch returns are provided to authori‐ties by all fishers both commercial and private. It is also essential that the total num‐ber of commercial and private fishers is known. Similarly, in order to verify the returns, a follow up mechanism where some or all of the data can be verified would be required to ensure that the data being received are accurate.

Extract ICES WGNAS REPORT 2010 | 95
Table 5.1.1.1 Nominal catches of salmon, West Greenland 1971 to 2009 (metric tons round fresh weight).
YEAR TOTAL QUOTA COMMENTS
1971 2689 ‐
1972 2113 1100
1973 2341 1100
1974 1917 1191
1975 2030 1191
1976 1175 1191
1977 1420 1191
1978 984 1191
1979 1395 1191
1980 1194 1191
1981 1264 1265 Quota set to a specific opening date for the fishery
1982 1077 1253 Quota set to a specific opening date for the fishery
1983 310 1191
1984 297 870
1985 864 852
1986 960 909
1987 966 935
1988 893 840 Quota for 1988–1990 was 2520 t with an opening date of August 1. Annual catches were not to exceed an annual average (840 t) by more than 10%. Quota adjusted to 900 t in 1989 and 924 t in 1990 for later opening dates.
1989 337 900
1990 274 924
1991 472 840
1992 237 258 Quota set by Greenland authorities
1993 895 The fishery was suspended
1994 137 The fishery was suspended and the quotas were bought out
1995 83 77
1996 92 174 Quota set by Greenland authorities
1997 58 57
1998 11 206
1999 19 206
2000 21 206
2001 43 114 Final quota calculated according to the ad hoc management system
2002 9 55
Quota bought out, quota represented the maximum allowable catch (no factory landing allowed), and higher catch figures based on sampling programme information are used for the assessments
2003 9
Quota set to nil (no factory landing allowed), fishery restricted to catches used for internal consumption in Greenland, and higher catch figures based on sampling programme information are used for the assessments
2004 15 same as previous year

96 | Extract ICES WGNAS REPORT 2010
Table 5.1.1.1 cont’d Nominal catches of salmon, West Greenland 1971 to 2009 (metric tons round fresh weight).
YEAR TOTAL QUOTA COMMENTS
2005 15 same as previous year
2006 22 Quota set to nil (no factory landing allowed) and fishery restricted to catches used for internal consumption in Greenland
2007 25
Quota set to nil (no factory landing allowed), fishery restricted to catches used for internal consumption in Greenland, and higher catch figures based on sampling programme information are used for the assessments
2008 26 same as 2007
2009 26 same as 2007
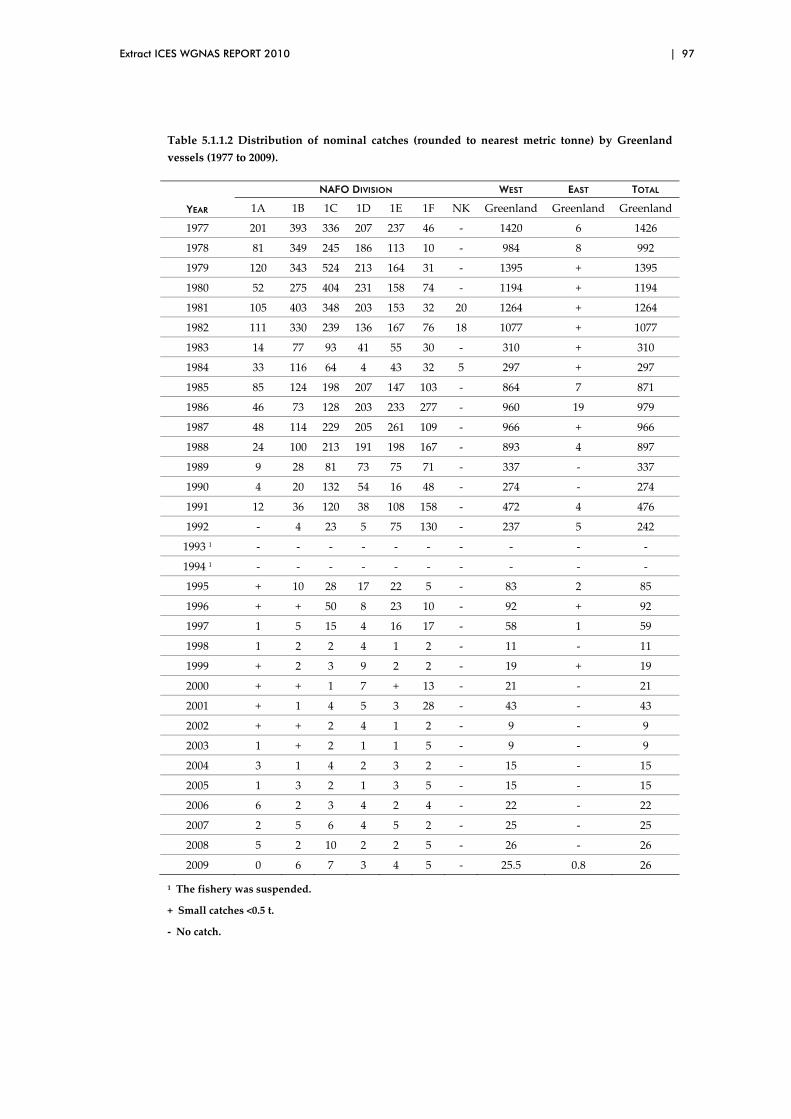
Extract ICES WGNAS REPORT 2010 | 97
Table 5.1.1.2 Distribution of nominal catches (rounded to nearest metric tonne) by Greenland vessels (1977 to 2009).
YEAR
NAFO DIVISION WEST EAST TOTAL
1A 1B 1C 1D 1E 1F NK Greenland Greenland Greenland
1977 201 393 336 207 237 46 ‐ 1420 6 1426
1978 81 349 245 186 113 10 ‐ 984 8 992
1979 120 343 524 213 164 31 ‐ 1395 + 1395
1980 52 275 404 231 158 74 ‐ 1194 + 1194
1981 105 403 348 203 153 32 20 1264 + 1264
1982 111 330 239 136 167 76 18 1077 + 1077
1983 14 77 93 41 55 30 ‐ 310 + 310
1984 33 116 64 4 43 32 5 297 + 297
1985 85 124 198 207 147 103 ‐ 864 7 871
1986 46 73 128 203 233 277 ‐ 960 19 979
1987 48 114 229 205 261 109 ‐ 966 + 966
1988 24 100 213 191 198 167 ‐ 893 4 897
1989 9 28 81 73 75 71 ‐ 337 ‐ 337
1990 4 20 132 54 16 48 ‐ 274 ‐ 274
1991 12 36 120 38 108 158 ‐ 472 4 476
1992 ‐ 4 23 5 75 130 ‐ 237 5 242
1993 1 ‐ ‐ ‐ ‐ ‐ ‐ ‐ ‐ ‐ ‐
1994 1 ‐ ‐ ‐ ‐ ‐ ‐ ‐ ‐ ‐ ‐
1995 + 10 28 17 22 5 ‐ 83 2 85
1996 + + 50 8 23 10 ‐ 92 + 92
1997 1 5 15 4 16 17 ‐ 58 1 59
1998 1 2 2 4 1 2 ‐ 11 ‐ 11
1999 + 2 3 9 2 2 ‐ 19 + 19
2000 + + 1 7 + 13 ‐ 21 ‐ 21
2001 + 1 4 5 3 28 ‐ 43 ‐ 43
2002 + + 2 4 1 2 ‐ 9 ‐ 9
2003 1 + 2 1 1 5 ‐ 9 ‐ 9
2004 3 1 4 2 3 2 ‐ 15 ‐ 15
2005 1 3 2 1 3 5 ‐ 15 ‐ 15
2006 6 2 3 4 2 4 ‐ 22 ‐ 22
2007 2 5 6 4 5 2 ‐ 25 ‐ 25
2008 5 2 10 2 2 5 ‐ 26 ‐ 26
2009 0 6 7 3 4 5 ‐ 25.5 0.8 26
1 The fishery was suspended.
+ Small catches <0.5 t.
‐ No catch.

98 | Extract ICES WGNAS REPORT 2010
Table 5.1.2.1 Size of biological samples and percentage (by number) of North American and European salmon in research vessel catches at West Greenland (1969 to 1982) from commercial samples (1978 to 1992, 1995 to 1997 and 2001) and from local consumption samples (1998 to 2000 and 2002 to 2009).
Sample Size Continent of origin (%)Source Length Scales Genetics NA (95%CI)¹ E (95%CI)¹
Research 1969 212 212 51 (57,44) 49 (56,43)1970 127 127 35 (43,26) 65 (75,57)1971 247 247 34 (40,28) 66 (72,50)1972 3488 3488 36 (37,34) 64 (66,63)1973 102 102 49 (59,39) 51 (61,41)1974 834 834 43 (46,39) 57 (61,54)1975 528 528 44 (48,40) 56 (60,52)1976 420 420 43 (48,38) 57 (62,52)
1978² 606 606 38 (41,34) 62 (66,59) 1978³ 49 49 55 (69,41) 45 (59,31)1979 328 328 47 (52,41) 53 (59,48)1980 617 617 58 (62,54) 42 (46,38)1982 443 443 47 (52,43) 53 (58,48)
Commercial 1978 392 392 52 (57,47) 48 (53,43)1979 1653 1653 50 (52,48) 50 (52,48)1980 978 978 48 (51,45) 52 (55,49)1981 4570 1930 59 (61,58) 41 (42,39)1982 1949 414 62 (64,60) 38 (40,36)
1983 4896 1815 40 (41,38) 60 (62,59)1984 7282 2720 50 (53,47) 50 (53,47)1985 13272 2917 50 (53,46) 50 (54,47)1986 20394 3509 57 (66,48) 43 (52,34)1987 13425 2960 59 (63,54) 41 (46,37)1988 11047 2562 43 (49,38) 57 (62,51)1989 9366 2227 56 (60,52) 44 (48,40)1990 4897 1208 75 (79,70) 25 (30,21)1991 5005 1347 65 (69,61) 35 (39,31)1992 6348 1648 54 (57,50) 46 (50,43)1995 2045 2045 68 (72,65) 32 (35,28)1996 3341 1297 73 (76,71) 27 (29,24)1997 794 282 80 (84,75) 20 (25,16)
Local consumption 1998 540 406 79 (84,73) 21 (27,16)1999 532 532 90 (97,84) 10 (16,3)2000 491 491 70 30
Commercial 2001 4721 2655 69 (71,67) 31 (33,29)
Local consumption 2002 501 501 501 68 322003 1743 1743 1779 68 322004 1639 1639 1688 73 272005 767 767 767 76 242006 1209 1209 1193 72 282007 1116 1110 1123 82 182008 1854 1866 1853 86 142009 1,662 1,683 1,671 91 9
1 CI - confidence interval calculated by method of Pella and Robertson (1979) for 1984 -86 and binomial distribution for the others.2 During 1978 Fishery3 Research samples after 1978 fishery closed

Extract ICES WGNAS REPORT 2010 | 99
Table 5.1.2.2 Reported landings by NAFO Division of Atlantic salmon provided by the Home Rule Government for the fisheries at West Greenland, 2002 to 2009. Adjusted landings are calcu‐lated for divisions where the sampling teams observed more fish landed than were reported.
YEAR
NAFO DIVISION
1A 1B 1C 1D 1E 1F Total
2002 Reported 14 78 2100 3752 1417 1661 9022
Adjusted 2408 9769
2003 Reported 619 17 1621 648 1274 4516 8694
Adjusted 1782 2709 5912 12 312
2004 Reported 3476 611 3516 2433 2609 2068 14 712
Adjusted 4929 17 209
2005 Reported 1294 3120 2240 756 2937 4956 15 303
Adjusted 2730 17 276
2006 Reported 5427 2611 3424 4731 2636 4192 23 021
Adjusted
2007 Reported 2019 5089 6148 4470 4828 2093 24 647
Adjusted 2252 24 806
2008 Reported 4882 2210 10024 1595 2457 4979 26 147
Adjusted 3577 5478 28 627
2009 Reported 195 6151 7090 2988 4296 4777 25 497
Adjusted 5466 27 975

100 | Extract ICES WGNAS REPORT 2010
Table 5.1.2.3 Biological characteristics of Atlantic salmon sampled during the 2009 West Greenland Atlantic salmon fishery. NA = North America, E = Europe.
RIVER AGE DISTRIBUTION (%) BY CONTINENT OF ORIGIN
1 2 3 4 5 6 7 8
NA 2.6 30.7 47.3 15.4 3.7 0.4 0 0
E 14.3 59.5 23.8 2.4 0.0 0 0 0
LENGTH AND WEIGHT BY ORIGIN AND SEA AGE
1SW 2SW Previous spawners All sea ages
Fork length (cm)
Whole weight (kg)
Fork length (cm)
Whole weight (kg)
Fork length (cm)
Whole weight (kg)
Fork length (cm)
Whole weight (kg)
NA 64.9 3.28 84.6 7.59 75.9 5.25 64.7 3.67
E 65.5 3.40 81.7 6.54 73.5 4.28 64.1 3.50
SEA AGE COMPOSITION (%) BY CONTINENT OF ORIGIN
1SW 2SW Previous Spawners
NA 93.4 2.8 3.8
E 89.4 7.6 3

Extract ICES WGNAS REPORT 2010 | 101
1A
0A
0B
2G
1D
1C
1E
Sarfannguaq
Qeqertarsuaq
1B
Kangaamiut
Atammik
Qassimiut
1F
Qeqertarsuatsiaat
Narsaq
Arsuk - Kangilinnguit
Qaqortoq
Paamiut
Nuuk
Ilulissat
Sisimiut
1
Maniitsoq
Figure 5.1.1.1 Location of NAFO divisions along the coast of West Greenland.

102 | Extract ICES WGNAS REPORT 2010
6 NASCO has requested ICES to identify relevant data deficiencies, monitoring needs and research requirements
ICES recommends that The Working Group meet in 2011 to address questions posed by ICES, including those posed by NASCO. The Working Group intends to convene in the headquarters of the ICES in Copenhagen, Denmark from 29 March to 7 April 2011.
List of recommendations
1 ) ICES recommends that the Study Group on Salmon Stock Assessment and Forecasting (SGSSAFE) meet to continue the efforts to develop the models formulated for the NAC and NEAC areas, particularly with regard to combining sea age classes and in the spatial disaggregation below the stock complex level. The Study Group should report back to ICES in April 2011.
2 ) ICES recognized the value of the work completed by SGBICEPS and that the Study Group had been constrained by the lack of wider representation and the difficulties of involving oceanographers. ICES noted the ongoing efforts of the Study Group with regard to developing peer‐reviewed out‐puts and recommended that the datasets collated by the Study Group should be fully utilized and made available to the Working Group in sup‐port of further analyses as appropriate.
3 ) ICES endorsed the recommendations made by WKLUSTRE, which in‐clude: long‐term storage of the tag databases so that the data are not lost; the reports of the three Workshops on salmon tagging data (WKDHUSTI, WKSHINI, WKLUSTRE) should be combined into a single ICES Co‐operative Research Report; and the peer‐reviewed publication of these re‐sults.
4 ) ICES recommends that efforts be initiated to transfer and archive in the ICES Data Centre the numerous datasets on Atlantic salmon biological characteristics which have been assembled over the over 30 years of sam‐pling the fisheries at West Greenland, tagging dataset from international waters and any other international databases which would be of interest to the Working Group and others in the scientific community.
5 ) ICES supports the proposal from the Greenlandic authorities for the estab‐lishment of a logbook programme for commercial and private fishers in the salmon fishery at West Greenland. Additional data to help characterize the nature and extent of the fishery should include catch location, catch date, numbers of nets, net dimensions, and numbers of hours the nets were fished.
6 ) ICES recommends the continuation of the broad geographic sampling pro‐gramme (multiple NAFO divisions) to more accurately estimate continent of origin in the mixed‐stock fishery at West Greenland. The Enhanced Sampling Programme undertaken in 2009 should be repeated in 2010.
7 ) ICES recommends that the sampling programme conducted in the Labra‐dor subsistence fishery during recent years and which provided biological characteristics of the harvest material to assess the origin of salmon be con‐tinued and expanded in 2010 and future years.

Extract ICES WGNAS REPORT 2010 | 103
8 ) ICES recognizes that river‐specific, regional and international management requires extensive monitoring and recommends expanded monitoring programmes across all stock complexes.
9 ) ICES notes that factors other than fishing are currently constraining and, in some areas, threatening with extirpation populations of Atlantic salmon throughout the North Atlantic. Factors acting in both the freshwater and marine environment are of concern. A review of successes and failures in wild salmon restoration could lead to a classification of activities which could be recommended under various conditions or threats to the persis‐tence of populations. Such a classification would be of benefit to manage‐ment tasked with rebuilding and restoration actions. Such a review could be undertaken by a Study Group.

104 | Extract ICES WGNAS REPORT 2010
Annex 1: Glossary of acronyms used in this report
1SW (One‐Sea‐Winter) Maiden adult salmon that has spent one winter at sea.
2SW (Two‐Sea‐Winter) Maiden adult salmon that has spent two winters at sea.
BCI (Bayesian Credible Interval) The Bayesian equivalent of a confidence interval. If the 90% BCI for a parameter A is 10 to 20, there is a 90% probability that A falls between 10 and 20.
BHSRA (Bayesian Hierarchical Stock and Recruitment Approach) Models for the analysis of a group of related stock–recruit datasets. Hierarchical modelling is a statistical technique that allows the modelling of the dependence among parameters that are related or connected through the use of a hierarchical model structure. Hierarchical models can be used to combine data from several independent sources.
C&R (Catch and Release) Catch and release is a practice within recreational fishing intended as a technique of conservation. After capture, the fish are unhooked and returned to the water before experiencing serious exhaustion or injury. Using bar‐bless hooks, it is often possible to release the fish without removing it from the water (a slack line is frequently sufficient).
CL, i.e. Slim (Conservation Limit) Demarcation of undesirable stock levels or levels of fishing activity; the ultimate objective when managing stocks and regulating fisheries will be to ensure that there is a high probability that undesirable levels are avoided.
Cpue (Catch Per Unit Effort) A derived quantity obtained from the independent val‐ues of catch and effort.
CWT (Coded Wire Tag) The CWT is a length of magnetized stainless steel wire 0.25 mm in diameter. The tag is marked with rows of numbers denoting specific batch or individual codes. Tags are cut from rolls of wire by an injector that hypodermically implants them into suitable tissue. The standard length of a tag is 1.1 mm.
DFO (Department of Fisheries and Oceans) DFO and its Special Operating Agency, the Canadian Coast Guard, deliver programmes and services that support sustainable use and development of Canada’s waterways and aquatic resources.
DST (Data Storage Tag) A miniature data logger with sensors including salinity, tem‐perature, and depth that is attached to fish and other marine animals.
EU DCR (The EU Data Collection Regulation) DCR established a community frame‐work for the collection, management and use of data in the fisheries sector and sup‐port for scientific advice regarding the common fisheries policy.
FV (Fishing Vessel) A vessel that undertakes cruise for commercial fishing purposes.
GIS (Geographic Information Systems) A computer technology that uses a geographic information system as an analytic framework for managing and integrating data.
GSI (Genetic Stock Identification) Methods used to ʹgenetically typeʹ salmon from par‐ticular regions and rivers across Atlantic.
ICPR (The International Commission for the Protection of the River Rhine) ICPR coordi‐nates the ecological rehabilitation programme involving all countries bordering the river Rhine. This programme was initiated in response to catastrophic river pollution in Switzerland in 1986 which killed hundreds of thousands of fish. The programme

Extract ICES WGNAS REPORT 2010 | 105
aims to bring about significant ecological improvement of the Rhine and its tributar‐ies allowing the re‐establishment of migratory fish species such as salmon.
ISAV (Infectious Salmon Anemia Virus) ISA is a highly infectious disease of Atlantic salmon caused by an enveloped virus.
MHC (The Major Histocompatibility Complex) MHC is a large genomic region or gene family found in most vertebrates. It is the most polymorphic region of the mamma‐lian genome and plays an important role in the immune system, autoimmunity, and reproductive success. The proteins encoded by the MHC are expressed on the surface of cells in all jawed vertebrates, and display both self antigens (peptide fragments from the cell itself) and nonself antigens (e.g. fragments of invading micro‐organisms) to a type of white blood cell called a T cell that has the capacity to kill or coordinate the killing of pathogens and infected or malfunctioning cells.
MSY (Maximum Sustainable Yield) The largest average annual catch that may be taken
from a stock continuously without affecting the catch of future years; a constant long‐term MSY is not a reality in most fisheries, where stock sizes vary with the strength of year classes moving through the fishery.
MSW (Multi‐Sea‐Winter) An adult salmon which has spent two or more winters at sea or a repeat spawner.
NLO (Net Limitation Order) NLO came into force in UK (England and Wales) to re‐duce netting effort and phase out various net fisheries.
PFA (Pre‐Fishery Abundance) The numbers of salmon estimated to be alive in the ocean from a particular stock at a specified time.
PGA (The Probabilistic‐based Genetic Assignment model) An approach to partition the harvest of mixed‐stock fisheries into their finer origin parts. PGA uses Monte Carlo sampling to partition the reported and unreported catch estimates to continent, coun‐try and within country levels.
PIT (Passive Integrated Transponder) PIT tags use radio frequency identification tech‐nology. PIT tags lack an internal power source. They are energized on encountering an electromagnetic field emitted from a transceiver. The tagʹs unique identity code is programmed into the microchipʹs nonvolatile memory.
Q Areas for which the Ministère des Ressources naturelles et de la Faune manages the salmon fisheries in Québec.
RT‐PCR (Reverse Transcription‐Polymerase Chain Reaction) is the most sensitive tech‐nique for mRNA detection and quantitation currently available. Compared with the two other commonly used techniques for quantifying mRNA levels, Northern blot analysis and RNase protection assay, RT‐PCR can be used to quantify mRNA levels from much smaller samples.
RV (Research Vessel) A vessel that undertakes cruises to conduct scientific research.
RVS (Red Vent Syndrome) The condition, known as RVS, has been noted since 2005, and has been linked to the presence of a nematode worm, Anisakis simplex. This is a common parasite of marine fish and is also found in migratory species. The larval nematode stages in fish are usually found spirally coiled on the mesenteries, internal organs and less frequently in the somatic muscle of host fish.
RW (The Random Walk) In the RW hypothesis, the recruitment rates are modelled as a first order time varying parameter following a simple random walk with a flat prior

106 | Extract ICES WGNAS REPORT 2010
on the first value of the time‐series. The model can be used both for retrospective analysis and forecasts.
SAC (Special Areas of Conservation) To comply with the EU Habitats Directive (92/43/EEC) on Conservation of Natural Habitat and of Wild Fauna and Flora, which stipulates that member states maintain or restore habitats and species to favourable conservation status, a number of rivers in the NEAC area that support important populations of vulnerable qualifying species have been designated SACs. Where sal‐mon is a “qualifying species”, additional protection measures specifically for salmon are required.
SER (Spawning Escapement Reserve) The CL increased to take account of natural mor‐tality between the recruitment date (1st January) and return to home waters.
SL (The Shifting Level) The shifting level model supposes that the recruitment rate re‐mains constant for periods of time, with abrupt shifts in the levels between periods. By contrast to the RW model, it is highly flexible because the number of periods, their duration and the corresponding levels of recruitment rates do not need to be speci‐fied a priori.
SFA (Salmon Fishing Areas) Areas for which the Department of Fisheries and Oceans (DFO) Canada manages the salmon fisheries.
SGBICEPS (The Study Group on the Identification of Biological Characteristics for Use as Predictors of Salmon Abundance) The ICES Study Group established to complete a re‐view of the available information on the life‐history strategies of salmon and changes in the biological characteristics of the fish in relation to key environmental variables.
SGBYSAL (Study Group on the Bycatch of Salmon in Pelagic Trawl Fisheries). The ICES Study Group that was established in 2005 to study Atlantic salmon distribution at sea and fisheries for other species with a potential for intercepting salmon.
SGEFISSA (Study Group on Establishing a Framework of Indicators of Salmon Stock Abundance) A Study Group established by ICES and met in November 2006.
SGSSAFE (Study Group on Salmon Stock Assessment and Forecasting). The Study Group established to work on the development of new and alternative models for forecast‐ing Atlantic salmon abundance and for the provision of catch advice.
Slim, i.e. CL (Conservation Limit) Demarcation of undesirable stock levels or levels of fishing activity; the ultimate objective when managing stocks and regulating fisheries will be to ensure that there is a high probability that the undesirable levels are avoided.
TAC (Total Allowable Catch) The quantity of fish that can be taken from each stock each year.
VHSV (Viral Haemorrhagic Septicaemia Virus) VHS is a highly infectious virus disease caused by the virus family Rhabdoviridae, genus Novirhabdovirus.
VIE (Visual Implant Elastomer) The VIE tags consist of fluorescent elastomer material which is subcutaneously injected as a liquid into transparent or translucent tissue via a hand‐held injector.
WFD (Water Framework Directive) Directive 2000/60/EC (WFD) aims to protect and enhance the water environment, updates all existing relevant European legislation, and promotes a new approach to water management through river‐based planning. The Directive requires the development of River Basin Management Plans (RBMP)
Extract ICES WGNAS REPORT 2010 | 107
and Programmes of Measures (PoM) with the aim of achieving Good Ecological Status or, for artificial or more modified waters, Good Ecological Potential.
WKDUHSTI (Workshop on the Development and Use of Historical Salmon Tagging Information from Oceanic Areas) The Workshop established by ICES was held in February 2007.
WKSHINI (Workshop on Salmon historical information‐new investigations from old tagging data) The Workshop is set to meet from 18–20 September 2008 in Halifax, Canada.
WKLUSTRE (Workshop on Learning from Salmon Tagging Records) The ICES Workshop established to complete compilation of available data and analyses of the resulting distributions of salmon at sea. WKLUSTRE will report by 30 November 2009 for the attention of the WGNAS.
This glossary has been extracted from various sources, but chiefly the EU SALMO‐DEL Report (Crozier et al., 2003).

108 | Extract ICES WGNAS REPORT 2010
Annex 2: References cited
Aprahamian M.W., Davidson I.C., and Cove R.J. 2008. Life history changes in Atlantic salmon from the River Dee, Wales. Hydrobiologia, 602: 61–78.
Beck M., Evans R., Feist S.W., Stebbing P., Longshaw M., and Harris E. 2008. Anisakis simplex sensu lato associated with red vent syndrome in wild Atlantic salmon Salmo salar in Eng‐land and Wales. Diseases of Aquatic Organisms 82: 61–65.
Breukelaar A.W., bij de Vaate A., and Fockens K.T.W. 1998. Inland migration study of sea trout (Salmo trutta) into the rivers Rhine and Meuse (The Netherlands), based on inductive cou‐pling radio telemetry. Hydrobiologia 371/372: 29–33.
Chaput G., Caron F., and Marshall L. 2003. Estimates of Survival of Atlantic salmon (Salmo salar L.) in the first and second years at sea. In Marine mortality of Atlantic salmon, Salmo salar L: methods and measures. Edited by E. C. E. Potter, N. O. Maoileidigh and G. Chaput. Ca‐nadian Science Advisory Secretariat Research Document, 2003/101. pp. 83–109.
Chaput G., Legault C. M., Reddin D. G., Caron F., and Amiro P.G. 2005. Provision of catch ad‐vice taking account of non‐stationarity in productivity of Atlantic salmon (Salmo salar L.) in the Northwest Atlantic. ICES Journal of Marine Science 62: 131–143.
Decisioneering. 1996. Crystal Ball‐Forecasting and risk analysis for spreadsheet users (Version 4.0). 286 pp.
DFO and MNRF. 2008. Conservation Status Report, Atlantic Salmon in Atlantic Canada and Quebec: PART I – Species Information. Can. MS Rep. Fish. Aquat. Sci. No. 2861, 208 p.
Elson, P.F. 1967. Effects on wild young salmon of spraying DDT over New Brunswick forests. J. Fish. Res. Board Can. 24: 731–767.
Finstad B. and Jonsson N. 2001. Factors influencing the yield of smolt releases in Norway. Nor‐dic J. Freshw. Res. 75:37–55.
Gauthier‐Ouellet M., Dionne M., Caron F., King T.L., and Bernatchez L. 2009. Spatiotemporal dynamics of the Atlantic salmon (Salmo salar) Greenland fishery inferred from mixed‐stock analysis. Canadian Journal of Fisheries and Aquatic Sciences 66: 2040–2051.
Heuch P. A. and Mo T.A. 2001. A model of salmon louse production in Norway: effects of in‐creasing salmon production and public management measures. Diseases of Aquatic Organ‐isms 45: 145–152.
Hindar K., Diserud O., Fiske P., Forseth T., Jensen A. J., Ugedal O., Jonsson N., Sloreid S.‐E., Saltveit S. J., Sægrov H., and Sættem L.M. 2007. Gytebestandsmål for laksebestander i Norge. NINA Rapport 226: 1–78.
Hughes S.L., Holliday N.P., Colbourne N.E., Ozhigin V., Valdimarsson H., Østerhus S., and Wiltshire K. 2009. Comparison of in situ time‐series of temperature with gridded sea sur‐face temperature datasets in the North Atlantic. ICES Journal of Marine Science 66: 1467–1479.
Hvidsten N. A., Finstad B., Kroglund F., Johnsen B. O., Strand R., Arnekleiv J. V., and Bjorn P.A. 2007. Does increased abundance of sea lice influence survival of wild Atlantic salmon post‐smolt? Journal of Fish Biology 71:1639–1648.
ICES. 1993. Report of the North Atlantic Salmon Working Group. Copenhagen, 5–12 March 1993. ICES, Doc. CM 1993/Assess: 10.
ICES. 1994. Report of the North Atlantic Salmon Working Group. Reykjavik, 6–15 April 1994. ICES, Doc. CM 1994/Assess:16, Ref. M.

Extract ICES WGNAS REPORT 2010 | 109
ICES. 1996. Report of the North Atlantic Salmon Working Group. ICES Headquarters, Copen‐hagen, April 14–23, ICES CM 1996/ACFM:15. 293pp.
ICES. 2000. Report of the Working Group on the North Atlantic Salmon. ICES Headquarters, Copenhagen, April 3–13, ICES CM 2000/ACFM: 13. 301pp.
ICES. 2001. Report of the Working Group on North Atlantic Salmon. Aberdeen, 2–11 April 2001. ICES CM 2001/ACFM: 15. 290 pp.
ICES. 2002. Report of the Working Group on North Atlantic Salmon. ICES Headquarters, Co‐penhagen, 3–13 April 2002. ICES CM 2002/ACFM: 14. 299 pp.
ICES. 2003. Report of the Working Group on North Atlantic Salmon. ICES Headquarters, Co‐penhagen, 31 March–10 April 2003. ICES CM 2003/ACFM: 19. 297 pp.
ICES. 2005. Report of the Working Group on North Atlantic Salmon. Nuuk, Greenland 4 April–14 April. ICES CM 2005/ACFM:17. 290 pp.
ICES. 2006a. Report of the Working Group on North Atlantic Salmon. ICES Headquarters, Co‐penhagen, 4 April–13 April. ICES CM 2006/ACFM: 23. 254 pp.
ICES. 2007a. Report of the Workshop on the Development and Use of Historical Salmon Tag‐ging Information from Oceanic Areas (WKDUHSTI). ICES CM 2007/DFC:02. 60p.
ICES. 2007b. Study Group on Establishing a Framework of Indicators of Salmon Stock Abun‐dance (SGEFISSA). ICES CM 2007/DFC:01. 71pp.
ICES. 2007c. Report of the Working Group on North Atlantic Salmon. ICES Headquarters, Co‐penhagen, 11 April–20 April. ICES CM 2007/ACFM: 13. 253 pp.
ICES. 2008a. Report of the Working Group on North Atlantic Salmon. Galway, Ireland 1–10 April. ICES CM 2008/ACOM: 18. 235 pp.
ICES. 2008b. Report on the Workshop on Salmon Historical Information – New Investigations from old Tagging Data (WKSHINI). ICES CM 2008/DFC: 02. 51p.
ICES. 2009a. Report of the Working Group on North Atlantic Salmon. ICES Headquarters, Co‐penhagen, 22 March–31 March. ICES CM 2009/ACFM: 06. 283 pp.
ICES. 2009b. Report of the Study Group on Biological Characteristics as Predictors of Salmon Abundance. ICES CM 2009/DFC:02., 119pp.
ICES. 2009c. Report of the Baltic Salmon and Trout Assessment Working Group 2009 (WGBAST), 24–31 March 2009, Oulu, Finland. ICES CM 2009/ACOM:05., 280 pp.
ICES. 2009d. Report of the Workshop on Learning from Salmon Tagging Records (WKLUS‐TRE). ICES CM 2009/DFC:05., 39 pp.
ICES. 2009e. ICES Compilation of Microtag, Finclip and External Tag Releases 2008. ICES CM 2009/ACFM:13 Addendum.
ICES. 2010. ICES compilation of microtag, finclip and external tag releases 2009 by the Working Group on North Atlantic Salmon. ICES CM 2010/ACOM:09 Addendum.
Kennedy R.J. and Crozier W.W. (in press). Evidence of changing migratory patterns of wild Atlantic salmon (Salmo salar L.) smolts in the River Bush, Northern Ireland, and possible associations with climate change. Journal of Fish Biology.
NASCO. 1994. Explanatory note on the 1994 West Greenland Quota Calculation. NASCO‐WGC(94). 4 pp.
NASCO. 1998. North Atlantic Salmon Conservation Organisation. Agreement on the adoption of a precautionary approach. Report of the 15th annual meeting of the Council. CNL(98)46. 4 pp.

110 | Extract ICES WGNAS REPORT 2010
Potter E.C.E., Crozier W.W., Schön P.‐J., Nicholson M.D., Prévost E., Erkinaro J., Gudbergsson G., Karlsson L., Hansen L.P., MacLean J.C., Ó Maoiléidigh N., and Prusov S. 2004. Estimat‐ing and forecasting pre‐fishery abundance of Atlantic salmon (Salmo salar L.) in the North‐east Atlantic for the management of mixed‐stock fisheries. ICES Journal of Marine Science 61: 1359–1369.
Potter E.C.E., Ó Maoiléidigh N. and G. Chaput. 2003. Marine mortality of Atlantic salmon, Salmo salar L: methods and measures. DFO Can. Sci. Adv. Secr. Res. Doc. 2003/101.
R Development Core Team. 2007. R: A language and environment for statistical computing. R Foundation for Statistical Computing, Vienna, Austria. ISBN 3‐900051‐07‐0, URL http://www.R‐project.org.
Rago P.J., Reddin D.G., Porter T.R., Meerburg D.J., Friedland K.D., and Potter E.C.E. 1993. A continental run reconstruction model for the non‐maturing component of North American Atlantic salmon: analysis of fisheries in Greenland and Newfoundland Labrador, 1974–1991. ICE CM 1993/M: 25.
Roff D.A. 1992. The evolution of life history. Chapman, and Hall, New York, and London.SAS Institute. 1996. GLM Procedure of SAS. SAS Institute, Cry, NC, USA.
Skilbrei O.T. and Wennevik V. 2006. Survival and growth of sea‐ranched Atlantic salmon, Salmo salar L., treated against sea lice before release. ICES Journal of Marine Science 63: 1317–1325.
Stearns S.C. 1992. The evolution of life histories. Oxford, Oxford University Press.
Todd C.D., Hughes S.L., Marshall C.T., MacLean J.C., Lonergan M.E., and Biuw E.M. 2008. Detrimental effects of recent ocean surface warming on growth condition of Atlantic salmon. Global Change Biology 14: 958–970.
Vähä J. P., Erkinaro J., Niemelä E., and Primmer C.R. 2007. Life‐history and habitat features influence the within‐river genetic structure of Atlantic salmon. Molecular Ecology 16: 2638‐2654.