Embed Size (px)
Citation preview

Extreme Heat and Societal Vulnerability in a Changing Climate
Olga WilhelmiNCAR / Research Applications [email protected]
NCAR Colloquium on Statistical Assessment of Extreme Weather Phenomena under Climate Change, Boulder, CO June 9 2011

Defining “extreme” heat
Weather that has significant impacts is usually climatologically rare
Climatological perspective Absolute threshold (e.g., daily minimum temperature exceeds 25 °C) Tails of the climatological distribution for a location (e.g., temperature
above the 97th percentile).
Societal perspective High impact events that produce significant losses
Integrated perspective Societal impacts of extreme weather help determine climatological
measures of extremes (empirical models or time series)

Extreme heat and climate change are public health concerns Health impacts of extreme temperatures
Heat waves can be deadly, especially in cities Urban heat island
Impacts (health outcomes) are distributed unevenly Societal vulnerability (including adaptive capacity)
Heat-related deaths are preventable Ability to prepare, cope and adapt
Relationship between human health and extreme heat is a complex medical, social and environmental issue
Outline

Climate change, heat and health

Health outcomes from heat
Due to effort but inability of the human body to regulate its normal internal temperature over a period of time.
Direct outcomes: heat-related edema, rash, cramps, exhaustion, and stroke. Stroke (core body temperature above 41oC) is medical emergency. “classic” and “exertional” or “exercise-induced”
Indirect outcomes: respiratory, cardiovascular and diabetes-related conditions may be exacerbated by heat stress.

Patients being treated during the French heat wave of 2003. Photo: Martin Bureau/AFP
From U. Bickis, Health Canada
Russian heat wave” of 2010 (photo: Moscow Times) - “black swan” event
Extreme heat events

Extreme heat in hot climates
People are waiting for the bus in Phoenix, AZ. Photo: O. Wilhelmi

Thresholds
“The challenge lies in determining at which point the weather conditions become sufficiently hazardous to human health in a given population to warrant intervention.” (Kovats & Hajat, 2008)
Physical thresholds Epidemiological studies help identify “minimum mortality
temperature” T min, T man, T mean, Heat Indices, Air masses Population: all ages, over 55, 64-75, etc.
Physical thresholds vary among geographic locations and population groups Heat health outcomes depend on societal vulnerability and
adaptation to heat

Societal vulnerability
Vulnerability is the susceptibility of people or systems to damage or harm
Health outcomes are a product of extreme weather conditions and vulnerability.
Function of exposure - conditions of the natural and built environment that
position a system to be affected by extreme heat sensitivity - the degree to which a system is affected by extreme
heat adaptive capacity - the ability or potential of a system to modify its
features and behaviors to better cope with or adapt to extreme heat
Vulnerability is complex, dynamic, and spatially and temporally variable.

Scale of assessments Assessments help identify regions and
populations at risk and develop targeted interventions
National and regional assessments can mask communities living in marginal conditions
Hazard mitigation and climate change adaptation measures have to be adjusted for local ecology and appropriate level of decision making
Local-level assessment ensures more targeted intervention, response, adaptation. Community participation and buy in is critical.
Top down/bottom up approach is essential
Borden et al. 2007
O’Brien et al. 2004

Extreme heat vulnerability
Wilhelmi and Hayden (ERL, 2010)

Drivers
Climate change: Changes in extremes Uncertainty
Urbanization UHI, population density
Demographic changes Ageing Changing family structure
Ganguly et al. 2010

Ageing
Region Percent Population
Europe 27.4 189,118
Northern America 22.0 98,493
Latin America and the Caribbean 19.5 142,078
Oceania 18.7 9,581
Asia 17.3 906,053
Africa 7.1 141,538
Percent and Total Population Over Age 65, 2050
Source: Population Division of the UN Department of Economic and Social Affairs 2008

Urban heat island Urban heat island
“Urban” climate Paved surfaces and built
structures absorb shortwave radiation during the day and release long-wave radiation with increasing intensity in the afternoon and evening
Heat exposure The urban canyons reduce air
flow and trap heat near the surface
Land surface characteristics affect heat distribution within cities (e.g., parks vs parking lots)

Sensitivity
Demographic and socioeconomic characteristics Elderly Very young Obese Poor Mentally ill Socially isolated Pre-existing health conditions Lack air conditioning Work outdoors

Adaptive capacity
Adaptive capacity reflects a population’s potential to reduce harm in a changing environment, from current and future extreme weather.
Adaptive capacity is context-specific and dynamic
Influenced by availability of information and technology access to material, economic, and human resources institutional capabilities and knowledge, attitudes, practices, and beliefs. social capital, including social networks that connect individuals to
community resources
Measuring adaptive capacity is challenging adaptive capacity is often nuanced and best examined qualitatively or at the
household level

Adaptation and response Extreme heat preparedness and climate
adaptation plans
Coordinated Heat Watch/Warning systems
Programs that improve access to services/resources
Social and behavioral changes
Changes to physical environment

The Phoenix case study
Study objective: Understand adaptive capacity of the
vulnerable population Examine heat risk awareness and
responses in neighborhoods with variable degrees of vulnerability
The greater Phoenix, AZ area has an average of 26 deaths (1992-2009) every summer season from exposure to excessive heat (AZ Dept. of Health Services 2009).
In 2009, Maricopa County reported 71 heat-related deaths (V. Berisha, pers. communication, 2010).

Demographics of Heat Mortality in Phoenix/Maricopa County
Younger population at risk
Indoors / Outdoors mortality cases correlate with Older/ Younger population groups respectively
Combination of socio-economic and behavioral risk factors
Homeless population
Year 2005 n (%) 2000-2005 n (%)
N 49 146
Sex
Male 40 (82) 103 (76)
Female 9 (18) 33 (24)
Race
White 35 (71) 115 (85)
Black 7 (14) 10 (7)
Other 7 (14) 11 (8)
Ethnicity
Non-Hispanic 37 (76) 58 (62)
Hispanic 11 (22) 32 (34)
Other 1 (2) 3 (3)
Homeless 16 (33) 34 (25)
Place of death
Indoors 14 (38) 32 (34)
Outdoors 23 (62) 62 (66)
Age (years)
Mean (range) 59.8 (25-92) 56.4 (7-92)
Median 54 55
Source: Yip et al. 2008 Int J Biometeorolology
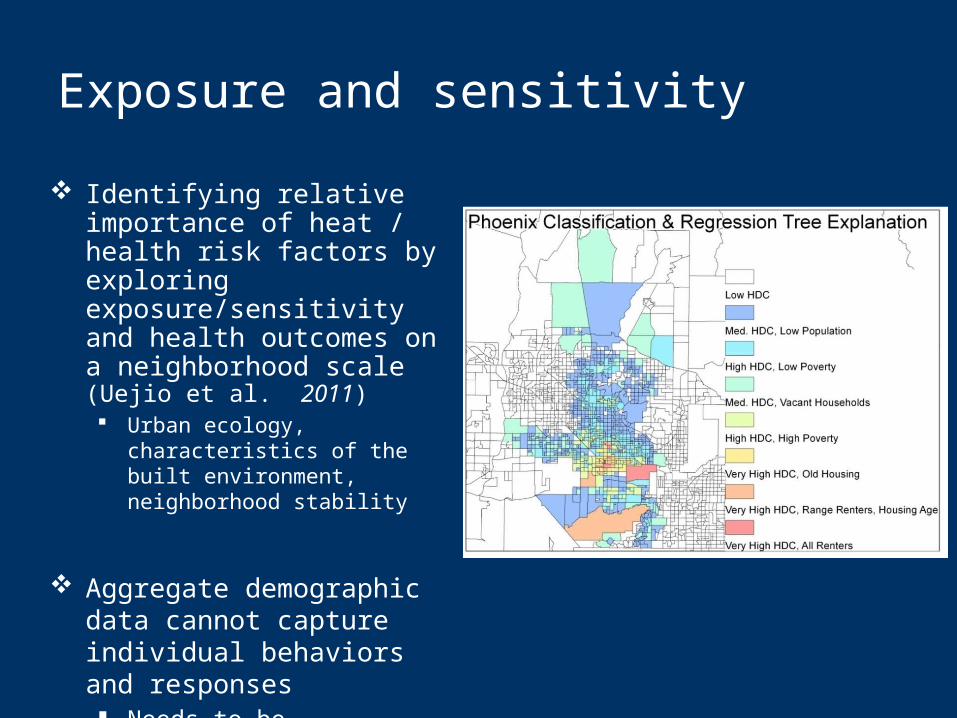
Exposure and sensitivity
Identifying relative importance of heat / health risk factors by exploring exposure/sensitivity and health outcomes on a neighborhood scale (Uejio et al. 2011) Urban ecology, characteristics of
the built environment, neighborhood stability
Aggregate demographic data cannot capture individual behaviors and responses Needs to be contextualized by
household-level data on adaptive capacity

Adaptive capacity: 2009 survey Questionnaire focused on indicators of adaptive capacity (e.g.,
KAP; social capital, household and community resources)
Three vulnerable neighborhoods• Diverse poverty levels (11%, 22%, 44%)• Ethnic and racial diversity• Previous cases of mortality and heat distress calls
359 semi-structured surveys at the randomly selected households
Neighborhoods demographics: Mean age: 40.9 Education: 32.8%- less than high school; 3.9 % - college graduate Race / Ethnicity: 67.7% Hispanic /Latino; 17.1% African American / Black;
11.6% Caucasian ; 3.9 % American Indian
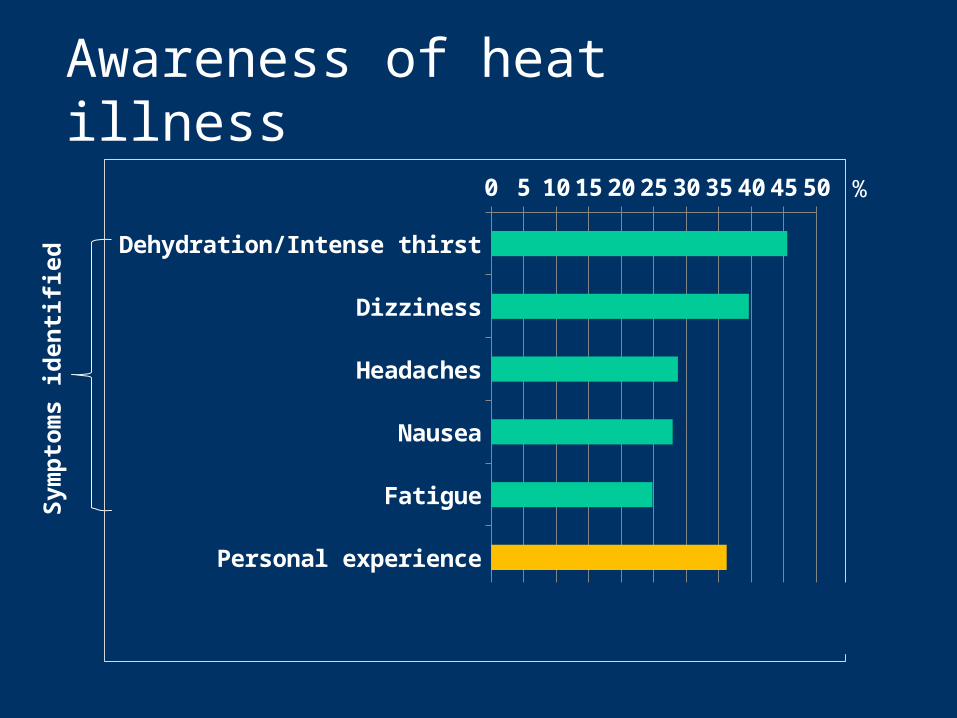
Awareness of heat illness
%
Sym
pto
ms
iden
tifi
ed Dehydration/Intense thirst
Dizziness
Headaches
Nausea
Fatigue
Personal experience
Use of sunscreen
0 5 10 15 20 25 30 35 40 45 50

Awareness about extreme heat
Heard heat warnings
Local TV
Cable TV
Radio
0 10 20 30 40 50 60 70 80 90S
ou
rce
of
hea
t w
arn
ing
s
Sheridan (2007): Phoenix survey of elderly showed 90% were aware of heat warningsPhillips and Morrow (2007); Morss and Hayden (2010): television a trustworthy and expert source of hazard information and recommendations
%

Awareness of available resources for coping with heat
Respondents were unaware of the resources available to them through city programs to repair air conditioners and assist with payment of electric bills.
In 2009 Phoenix had 51 hydration stations and 42 heat refuge stations (cooling shelters).
Know about heat refuge station
Know where heat refuge stations are
Used heat refuge stations
0 5 101520253035%

Coping with extreme heat
%
Altering daily outdoor activi-ties
Staying indoors
Drinking water
0 10 20 30 40 50 60 70 80 90

Indoor and outdoor heat risk
Feel most at risk outdoors
Use bus daily
Cars without A/C
Feel too hot at home
Have A/C at home
Cost of electricity prevents from using A/C at home
Broken or non-functional A/C
0 10 20 30 40 50 60 70 80 90 100%

0
10
20
30
40
50
60
70
80
90
100
Too hot inside home
A Neighborhood
B Neighborhood
C Neighborhood
Chi-square = 29.87P = .000
Differential coping capacity
Chi-square = 19.85P = .000

Social capital and community networks
0
10
20
30
40
50
60
70
80
90
100
Safe in Neighborhood
A Neighborhood
B Neighborhood
C Neighborhood

Improving outcomes Access to information
All of the neighborhoods could benefit from improved access to information about available city-wide resources to reduce risk from extreme heat.
Weather – Public Health partnerships Dissemination of critical information about resources for coping along with heat
warnings. Potential role for local TV broadcast meteorologist.
Social capital Multi-service centers could provide a cooling shelter coupled with community
outreach programs. Community-wide efforts to ensure that neighbors, social workers and home
health care providers check on socially isolated residents.
Surveys can provide more up-to-date information on vulnerability Impact of unemployment (38%) and limited household resources contributed to
higher vulnerability in neighborhoods with higher SES
Need better understanding of social and behavioral aspects of vulnerability to ensure more targeted interventions and adaptation strategies.

Current and future impacts of extreme heat
How does extreme heat in present and future climate affect human health in environmentally, socially and economically diverse urban settings?
Need to understand the relationships among global climate change local meteorology and extreme events urban land use local environmental characteristics previous health outcomes social vulnerability heat mitigation responses and climate adaptation strategies

System for Integrated Modeling of Metropolitan Extreme heat Risk (SIMMER)
NASA ROSES (09-IDS09-34)2010-2013
RAL
CGD
IMAGe

SIMMER project goals
Inform climate change adaptation and public health interventions in order to reduce current and future vulnerability to extreme urban heat
Advance methodology for assessing current and future urban vulnerability from heat waves through integration of physical and social science models, research results, and remote sensing data;
Develop a system (SIMMER) for building local capacity for heat hazard mitigation and climate change adaptation in the public health sector.

Filling the gaps
Determining the combined impact of extreme heat and the characteristics of urban environmental and social systems on human health
Characterizing societal vulnerability and the responses (i.e., mitigation and adaptation strategies)
Improving representation of urban land cover and its accompanying radiative and thermal characteristics at local and regional scales
Characterizing and modeling present and future extreme heat events at regional and local scales
Quantifying uncertainty

Summary Empirical studies and model simulations suggest increasing
health risks associated with climate change and extreme heat events
Relationship between human health and extreme heat is a complex medical, social and environmental issue
Research challenges: Thresholds for warnings and advisories Measuring adaptive capacity Changing patterns of extreme events Dynamic social vulnerability and adaptive capacity Predictive heat health models
Preparedness and adaptation: Reducing vulnerability Engagement of stakeholders from both the top-down and the
bottom-up allows the opportunity to better characterize health risks and develop policies for public health climate adaptation

Thank you!
For more information: Wilhelmi OV, Hayden MH. 2010. Connecting people and place: a new
framework for reducing urban vulnerability to extreme heat. Environmental Research Letters. 5:014021
Hayden MH, H Brenkert-Smith, OV Wilhelmi. Differential Adaptive Capacity to Extreme Heat: A Phoenix, AZ Case Study. Submitted to Weather, Climate and Society
Morss, RE, OV Wilhelmi, G. Meehl, L. Dilling. 2011. Improving Societal Outcomes of Extreme Weather in a Changing Climate: An Integrated Perspective. Annual Review of Environment and Resources