Embed Size (px)
Citation preview

EY ITEM Club Summer forecast
Will we see a more business-friendly Brexit?
July 2017

EY 1
Contents Foreword 2
Highlights 4
Introduction 5
Forecast in detail 12
1. Fiscal policy 12
2. Monetary policy 12
3. Prices and wages 13
4. Activity 14
5. Consumer demand 15
6. Housing market 16
7. Company sector 17
8. Labour market 18
9. Trade and the balance of payments 19
EY is the sole sponsor of the ITEM Club, which is the only non-governmental economic forecasting group to use the HM Treasury model of the UK economy. Its forecasts are independent of any political, economic or
business bias.
Foreword
EY 2
Mark Gregory
EY Chief Economist UKI @MarkGregoryEY
Softer Brexit
Changes everywhere…
The summer 2017 EY ITEM Club forecast is the last one to be overseen by Peter Spencer as the Professor is retiring after almost two decades as our Chief Economic Advisor. We are extremely pleased that Howard Archer has agreed to take on the considerable challenge of replacing Peter and I would like to take this opportunity to thank Peter for all his wisdom, humour and advice over the last few years — he will be sorely missed.
However, the changes in the EY ITEM Club pale into insignificance when compared to the changes in the political and economic landscape since the last forecast. If a week is a long time in politics, a quarter is clearly a lifetime in the economic policy context. Since the last forecast, we have seen the Conservative Party lose its majority in the House of Commons, the negotiations around Article 50 commence, Bank of England Monetary Policy Committee members hinting at earlier rate rises than previously assumed and challenges to austerity emerging from across the political spectrum.
…leading to a shift in the outlook…
These changes are reflected in the 2017 forecast, with revisions to the headline forecasts for GDP for each year. While the outlook for 2017 has worsened from growth of 1.8% to 1.5%, 2018 is expected to be slightly better than was forecast in April. However, the real changes are in the medium term as the prospect of a softer Brexit than EY ITEM Club previously assumed leads to an upward revision in growth for 2020 and 2021.
Beneath the headline figures, the outlook for consumer spending and business investment remains challenging as confidence appears to have weakened since the spring and this is expected to lead to lower growth in both areas. Trade is expected to provide support to growth, even though the pound is now forecast to strengthen relative to the spring forecast.
…especially around Brexit…
As EY ITEM Club notes, the election has made the shape of Brexit a matter of debate — for the first time. Clearly, many voters were worried about the prospect of a hard Brexit. It does appear that to get any deal through Parliament, support from other political parties — almost all of whom have advocated maintaining closer ties with the EU than the Conservative Party — will be required. EY ITEM Club are assuming that this makes a transition arrangement more likely, during which the UK’s relationship with the EU continues much as it does at present. At least the new electoral timetable allows time for that. The latest forecast is based on the assumption of a transition arrangement which leads to the stronger forecast for 2020 and 2021.
Fore
word
Foreword
EY 3
…and possibly around austerity…
The election also revealed that the public is becoming very weary of austerity, and are ready to listen to almost anyone who says that enough is enough. The Prime Minister’s former chief of staff and his replacement both agree that this has been a major factor in Labour’s surging popularity. EY ITEM Club now believe that attempts to curb the growth of spending will need to be handled very deftly in future. Nevertheless, the outlook is very uncertain as there is no sign of the Chancellor changing tack. Philip Hammond’s Mansion House speech stuck to the familiar line that higher borrowing to finance current spending would be “asking the next generation to pay”. However, EY ITEM Club wonders if Mr Hammond’s emphasis on current spending leaves open the possibility that he may be open to borrowing more for investment in the autumn Budget.
…but the short term remains challenging…
Despite the changes, and the potential for support for growth from a softer Brexit and reduced austerity, the message for businesses remains similar to the last forecast — the UK economy is slowing with the consumer sector most exposed, and businesses must ensure their plans are realistic in this environment. Beyond the slowdown in the consumer sector, other challenges could include:
► Changes to the UK labour market, as the uncertainty over the post-Brexit arrangements for freedom of movement potentially reduces immigration and creates skill shortages. I have come across a significant amount of anecdotal evidence that this is already an issue.
► Uncertainty over the level and rate of change in interest rates — businesses need to be sure their financing is in place and that they are able to cope with a faster rate-rise scenario.
► Exchange rate uncertainty. The prospect of a softer Brexit has provided some support to sterling but there could be bumps in the road ahead as the Article 50 negotiations develop.
…and the future cannot be ignored…
There is a difficult balancing act to try and pull off between managing through the short term while creating the basis to grow if the medium-term outlook does improve as forecast. Business investment has been weak in recent quarters and productivity continues to disappoint. Businesses that want to capture the benefits of improving export markets and a more competitive pound need to invest ahead of the recovery in the economy after 2018. This requires careful and detailed analysis of the likely scenarios and options for investing in a sensible and managed way.
Highlights
EY 4
Highlights
► The general election has increased political uncertainty and thrown a spanner into the works of the Article 50 EU exit negotiations. However, the silver lining is that it could lead to a more business-friendly Brexit, resulting in a transition agreement leading eventually to a comprehensive free trade agreement.
► Meanwhile, the surge in inflation has finally slowed the consumer; and with investment and exports failing to offset this, GDP growth fell back to 0.2% quarter-on-quarter in the first quarter. The outlook for the rest of the year remains poor and our April forecast of 1.8% for GDP growth in 2017 has been revised down to 1.5%. Growth of 1.2% for next year has been revised up marginally to 1.3%.
► With household savings already very stretched, wage growth remaining in the doldrums and inflation picking up faster than expected, consumer spending grew by just 0.4% q/q in Q1 after 0.7% in Q4 of last year and 0.8% in each of the previous quarters. Meanwhile, the household saving ratio fell to another record low of 1.7% in Q1, from 3.3% in Q4 of last year.
► Paradoxically, when wages fail to respond to higher prices, inflation saps the strength of consumption and is demand-deflationary, just as we saw in the early years of this decade. With the economy slowing it seems unlikely that falling unemployment could now trigger a significant increase in wage inflation. We expect CPI inflation to move above 3% by July and reach 3.2-3.3% in the autumn, maintaining the pressure on households for the rest of this year.
► However, sterling has rallied over the last three months despite the uncertain outcome of the election, partly on hopes of a softer Brexit. Oil and some other commodity prices have also moved down from the peaks seen in Q1. These developments have already eased the pressure on industrial costs and if sustained will reduce the pressure on the CPI this winter. Domestic cost pressures remain subdued and we expect CPI inflation to be back in line with the Bank of England’s 2% target by the end of next year.
► Nevertheless, the pickup in inflation has increased tensions within the Monetary Policy Committee (MPC). Several of its members have said that their vote will depend upon whether investment and overseas trade can offset the slowdown in consumer spending. The Financial Policy Committee (FPC) is reversing the stimulus it injected post-referendum, notably the cut in the banks’ countercyclical capital buffer. Arguably that is the best way to target household borrowing and eases the pressure on the MPC to reverse the cut in base rate.
► This leaves the outlook for base rates very uncertain; but with the economy slowing and inflation coming back down to the target, we think the Bank of England will be on hold until the autumn of next year. We should also see greater clarity on the outcome of the Article 50 talks by then, deal or no deal. That is because any deal would need to be near to agreement, leaving time for ratification by national parliaments.
► The general election is also likely to result in a modestly looser fiscal stance. Ministers are now openly debating the future of the cap on public sector pay and the Chancellor will surely have to respond to this. The surge in inflation is making the cap harsher than envisaged and provides leeway for a token relaxation by pushing up nominal tax revenues.
► Assuming we see a transition agreement, with talks on an FTA under way, this should stimulate investment - especially in sectors like the motor industry where it has been held back by Brexit uncertainty. Our medium-term forecasts have been revised up accordingly. April’s GDP growth forecast of 1.5% for 2019 is lifted to 1.8%, while expected growth rates of 1.8% for 2020 and 2021 have moved up to 2.0% and 2.2% respectively.
Introduction
EY 5
Introduction
The forecast sees GDP growth of 1.5% this year, down from the projection of 1.8% made in April. Growth of 1.2% for next year has been revised up marginally to 1.3%. However, we believe that the election is likely to result in a more business-friendly Brexit than the one we had envisaged previously, as well as a modestly looser fiscal stance. Our medium-term forecasts have been revised up accordingly. GDP growth of 1.5% previously forecast for 2019 is lifted to 1.8%, with the growth rates of 1.8% for both 2020 and 2021 revised up to 2.0% and 2.2% respectively.
The election paves the way for a more business-friendly Brexit…
A week may or may not be a long time in politics, but the political climate has certainly changed dramatically over the last three months. Before the election, we were fairly confident in assuming a ‘clean’ Brexit, as set out in the Prime Minister’s Lancaster House speech in January. The referendum result seemed to suggest that a majority wanted to regain control of UK borders even if it meant a difficult economic adjustment. Theresa May clearly thought so. Now, it looks like a much more jobs-friendly Brexit. Indeed, if the Chancellor has his way it will be a business-friendly Brexit.
It has always seemed unlikely to us that a new trade deal could be negotiated and agreed in a two-yeartime frame. It also seemed unlikely before the election that talks could be extended over a transition period that effectively preserved the status quo. Would Theresa May really want to face the electorate in May 2020, with the UK still subject to the European Court of Justice and with immigration still in the hundreds of thousands? It seemed entirely possible given the positions being adopted by both sides that the Article 50 negotiations would break down, leaving the UK trading under World Trade Organization (WTO) rules.
The election has made the shape of Brexit a matter of debate - for the first time. Clearly, many voters were worried about the prospect of a hard Brexit. It would be difficult for the Government to get a majority in Parliament or in the country for that sort of outcome as things now stand. To get any deal through Parliament, support from other political parties - almost all of whom have advocated maintaining closer ties with the EU than the Conservatives – will be required. Indeed, it could be difficult to put together any deal that could command a majority of MPs or voters. We think that points to a transition arrangement, or more euphemistically an implementation period during which the UK’s relationship with the EU continues much as it does at present. At least the new electoral timetable allows time for that.
Meanwhile, the Cabinet has reaffirmed the objective of withdrawing from the European Single Market and Customs Union, while seeking a new free trade agreement with the EU. Both the Prime Minister and the Chancellor appear to be agreed on this objective. This does seem to us to be a reasonable objective on a four- or five-year view, covered by a transition agreement. There is clearly a lot of support in Parliament and elsewhere for remaining - like Norway - within the Single Market, but that would mean that the UK would remain subject to the European Court of Justice and would have to accept freedom of movement. This might not be the case if the UK stayed in the Customs Union, which would resolve the thorny problem of the border between Northern Ireland and the Irish Republic at a stroke. That would also allow the UK to escape the EU regimes for agriculture and fish. However, it would prevent the UK conducting separate trade treaties with third party countries. It is hard to see how any of these options, and certainly the WTO option, could get through parliament as it is presently constituted. So, this forecast is based on the assumption of a transition arrangement, hopefully leading to a bespoke deal before the next general election is due.
…and showed that voters were fed up with talk of austerity
The election also revealed that the public is becoming very weary of austerity, and are ready to listen to almost anyone who says that enough is enough. The Prime Minister’s former chief of staff and his replacement both agree that this has been a major factor in Labour’s surging popularity. The cap on
Introduction
EY 6
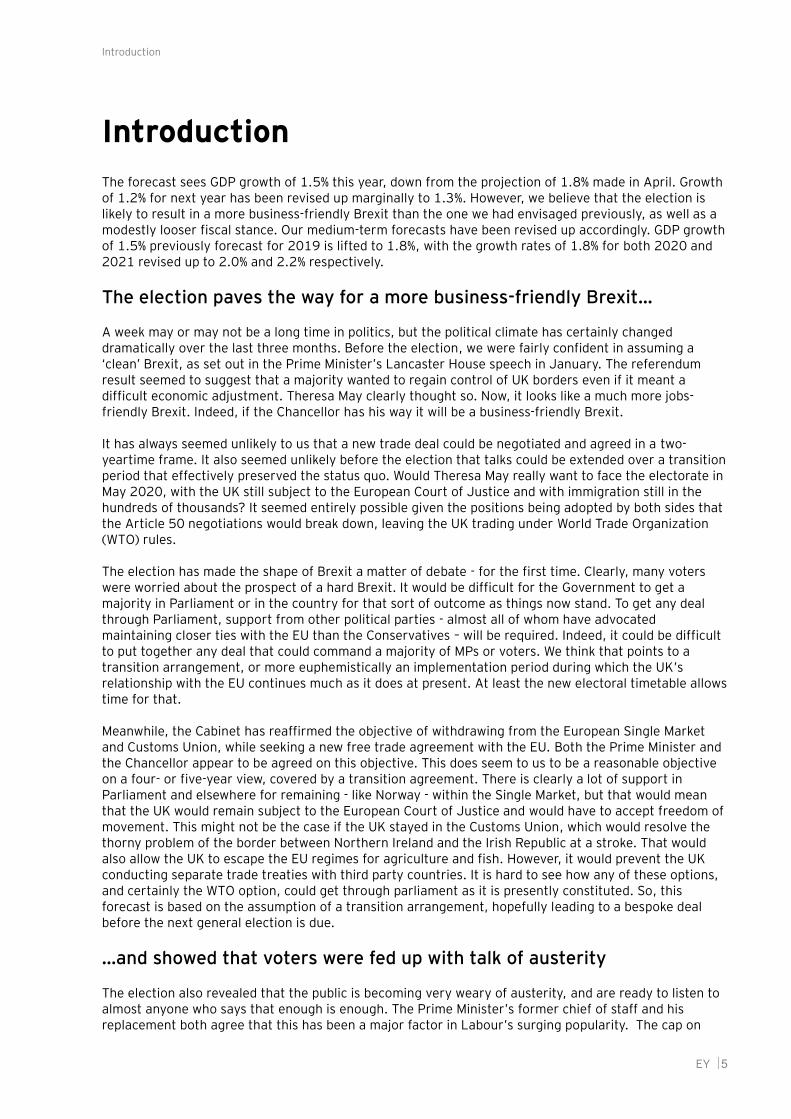
public sector pay has also helped Labour. It is clear that attempts to curb the growth of spending on pensions and social care will need to be handled very deftly in future.
At the moment however, there is no sign of the Chancellor changing tack. Philip Hammond’s Mansion House speech stuck to the familiar line that higher borrowing to finance current spending would be “asking the next generation to pay”. However, Mr Hammond’s emphasis on current spending leaves open the possibility that he may be open to borrowing more for investment in the autumn Budget. Negative long-term real interest rates greatly ease the burden on future generations.
We are assuming that the cap on public sector pay will be lifted. Public sector wages moved well ahead of those in the private sector during the recession, but have now moved back into line. The surge in inflation will mean that the 1% cap is far more restrictive than seemed likely when it was introduced in 2012 (following a two-year pay freeze). Moreover, the surge in inflation will have the effect of pushing up the growth in money GDP and government revenue, offsetting the effect on government borrowing.
Recent fiscal and economic developments also suggest that it would be appropriate to relax fiscal policy in the Budget this autumn. The latest public finance figures put borrowing in June at £6.7billion, down 5% on a year earlier. The estimate of last year’s deficit was revised down again. Net borrowing of £46.6 billion in 2016-17 is now well below the £52.7 billion predicted by the Office for Budget Responsibility (OBR) in its March Budget forecast. At 2.5% of GDP, this was the smallest annual deficit since the financial crisis. The deficit is likely to rise this year for technical reasons to do with the timing of dividend tax payments over the year-end. But the Chancellor certainly has more leeway than seemed likely at the time of the March Budget.
The surge in inflation has kiboshed the consumer…
The economy also looks a good deal weaker than it did then. With savings already very stretched, wage growth remaining in the doldrums and inflation picking up faster than expected, it is perhaps not surprising that consumer spending has faltered. It posted growth of just 0.4% in Q1 2017 after 0.7% expansion in Q4 2016 and 0.8% in each of the previous quarters. Real household disposable income fell by 1.4% in Q1 2017 after falling in the previous two quarters. The household saving ratio fell to another a record low of 1.7% in Q1, from 3.3% in Q4 of last year, although the bunching of dividend and other tax payments is partly responsible for this.
-8
-6
-4
-2
0
2
4
6
8
10
2002 2004 2006 2008 2010 2012 2014 2016
Source: Haver Analytics
% year
Public sector
Private sector
UK: Headline average earnings growth
250
300
350
400
450
500
550
2002 2004 2006 2008 2010 2012 2014 2016
Source: Haver Analytics
Public Sector
Private Sector
UK: Public & private sector earnings£ per week
Introduction
EY 7
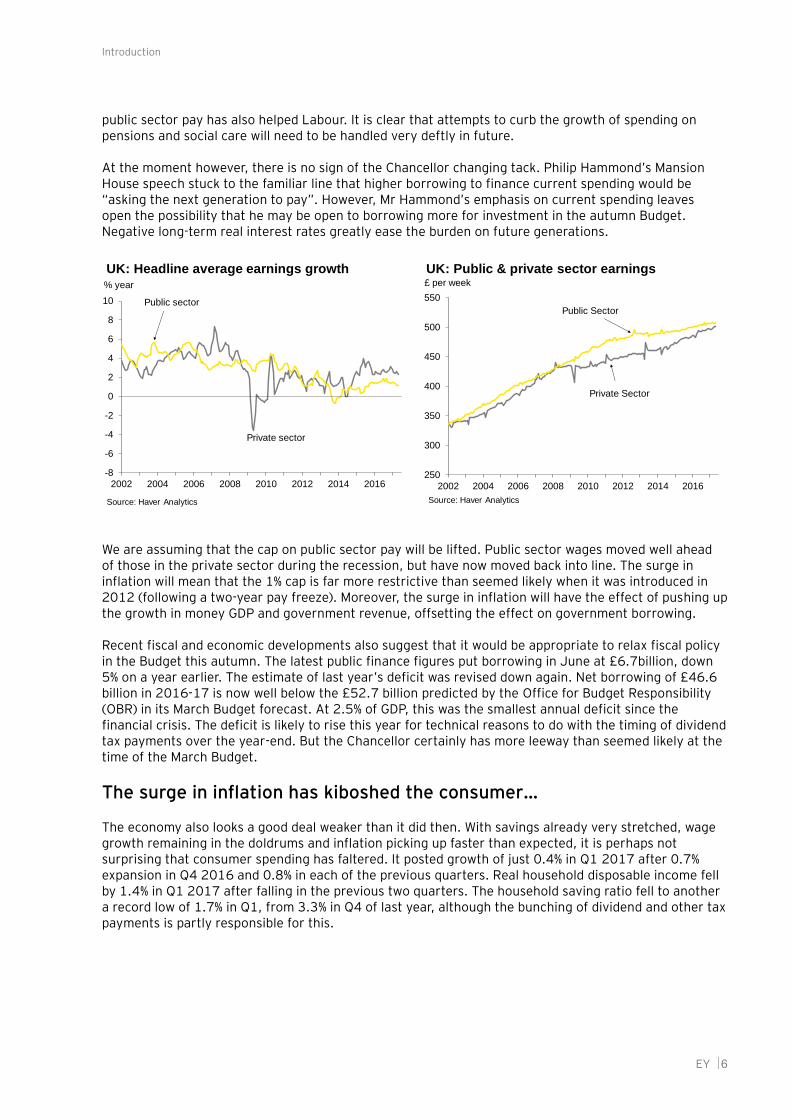
Retail sales appeared to recover in April, but suffered a relapse in May and the outlook for the rest of the year is far from encouraging. The YouGov consumer confidence index dropped sharply in June, to (-) 10 from (-) 5 in May. Annual earnings growth fell from 2.3% in the three months to March to 2.1% in the three months to April, the lowest since February 2016, while excluding bonuses earnings growth eased back further from a low of 1.8% to 1.7%.
With sterling’s sharp drop in the wake of last June’s Brexit vote still to fully feed through the CPI index, we expect to see inflation move above the 3% mark by July and reach 3.2-3.3% in the autumn. Having said that, sterling has moved up from the lows of around $1.22 seen three months ago to nearly $1.30, while oil prices have moved down from around $55 to around $48 at the time of writing. We expect oil prices to remain close to this level for another 18 months given the high level of inventories. These movements have already eased the pressure on industrial costs and if sustained will reduce the pressure on the CPI index this winter. Moreover, domestic cost pressures remain subdued and we expect CPI inflation to fall back to the 2% target next year.
…and has worried the MPC
Nevertheless, the recent pickup in inflation has certainly worried the Monetary Policy Committee (MPC). Three members voted for a rate increase at the June meeting, making this the closest vote since the crisis. Recent speeches by the Governor and the Chief Economist of the Bank of England clearly reveal the tensions emerging within the Committee. Much will depend upon whether investment and overseas trade can offset the slowdown in consumer spending. Recent data has been distorted by imports of non-monetary gold which inflate both investment and imports, adding to the uncertainty hanging over these items of expenditure. But there are a few grounds for optimism.
The strength of the economy in the second half of last year and, in particular, the surge in consumer borrowing that accompanied it, provides a justification for reversing some of the post-referendum relaxation of monetary policy. Indeed, the Bank of England’s Financial Policy Committee (FPC) has reversed the cut in the banks’ countercyclical capital buffer (from 0.5% to zero) it previously announced last July. The buffer increases the capital that banks have to hold against their loan portfolio and it will increase further to 1% in November, providing there is no change in the economic outlook.
-40
-30
-20
-10
0
10
2004 2006 2008 2010 2012 2014 2016
Source: Haver Analytics
GfK NOP Index
UK: Consumer confidence
-12
-9
-6
-3
0
3
6
9
12
15
1996 1998 2000 2002 2004 2006 2008 2010 2012 2014 2016
Source: Haver Analytics
Householdgoods
UK: Volume of retail sales
Total sales
% 3m/year
Introduction
EY 8
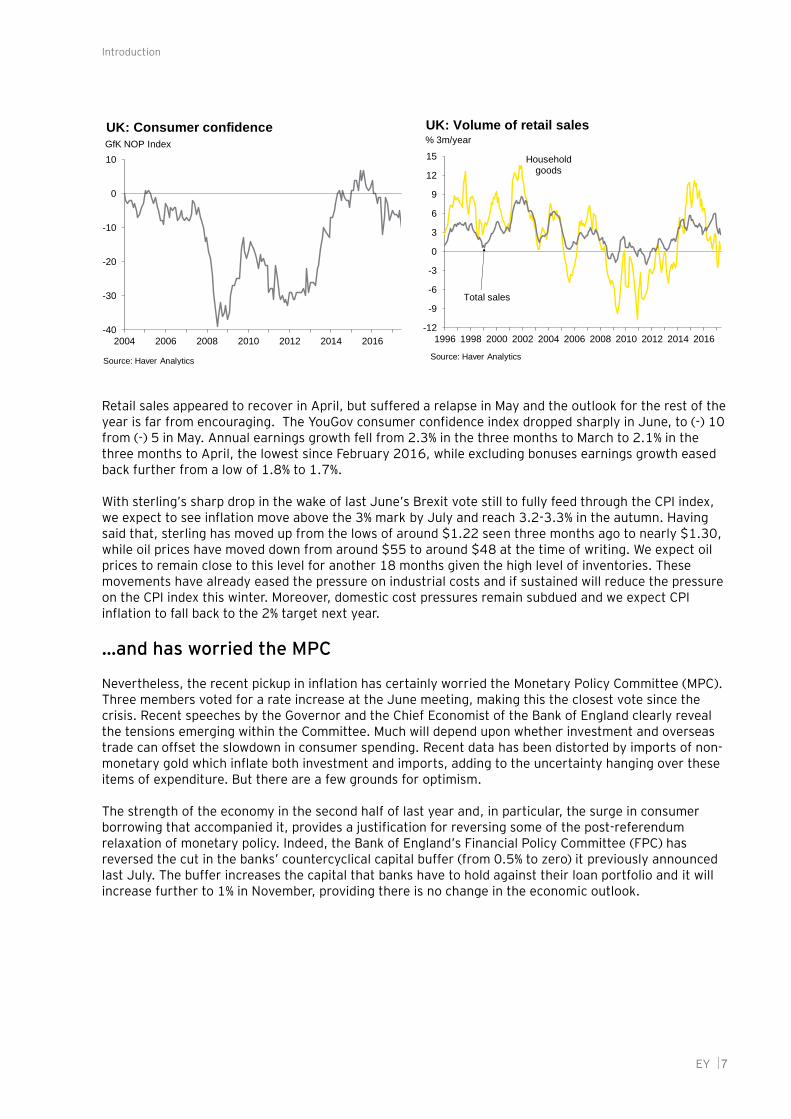
The Bank is also bringing forward - from November to September - its test of the banks’ ability to cope with major losses on their consumer loans. The FPC and the Prudential Regulation Authority have taken another look at the banks’ lending criteria, and have demanded that lenders provide evidence that they are addressing the risks that the Bank of England has identified – rapidly rising consumer credit, easier mortgage lending conditions and lender complacency. Arguably, by helping to curtail the growth in lending, these macroprudential moves weaken the case for reversing last August’s cut in base rate. Moreover, the renewed weakness in the economy surely provides grounds for caution.
… but we see rates increasing in August 2018 not 2017
Despite the tensions within the MPC, we continue to think that the restrained behaviour of wages in the face of these inflationary pressures will mean that base rates will remain on hold well into next year. This view is now reinforced by the easing of import cost pressure and indeed the renewed weakness in the economy. The Governor of the Bank of England has also indicated that he wants to see how the economy is reacting to Brexit before voting for an increase. Fiscal policy remains tight, and although we are expecting some relaxation this autumn (and in the later years of the forecast) we doubt that this would be sufficient to warrant an early increase in base rates.
Sterling has clearly reflected these developments. Having stabilised in the first quarter of the year, the pound moved up against the US dollar in the first half of the second quarter, partly as a result of a reassessment of the prospects for US fiscal expansion. Sterling held up reasonably well after the general election and recently reached $1.30 on hopes of an early increase in base rates, ending up 3.9% against the dollar on the quarter. However, with activity in the euro area improving steadily, in stark contrast to the deterioration seen in the UK, sterling fell by 2.8% against the euro in the second quarter.
The forecast sees a higher exchange rate…
The forecast sees GDP growth of 1.5% this year, down from the forecast of 1.8% made in April. With activity remaining weak during the first half of next year and inflation easing back nicely, we think that the MPC will wait until August 2018 before reversing the 0.25 basis point cut in base rates that it made last August. We also think that it will then wait until the spring of 2019 to see how the economy reacts to the first interest rate hike since 2007 and how the Brexit talks shape up before announcing a further increase.
As we have argued, the election is likely to result in a more business-friendly (or at least a less business-unfriendly) Brexit than the one we had envisaged previously. The fiscal stance is also seen modestly looser. Our exchange rate forecast reflects this prospect. As noted, sterling has touched $1.30 recently on expectations of an early increase in base rates, but we see it easing back to $1.25 this winter as these hopes are dashed. It then rallies to $1.29 as base rates are finally increased in August next year,
-5
0
5
10
15
20
1996 1998 2000 2002 2004 2006 2008 2010 2012 2014 2016
Source: Haver Analytics
% year
UK: Lending to individuals
Secured Lending
Total Lending
Consumer Credit
90
100
110
120
130
140
150
160
170
1990 1993 1996 1999 2002 2005 2008 2011 2014 2017
UK: Household debt-to-income ratio% of household disposable income
Source : Haver Analytics
Introduction
EY 9
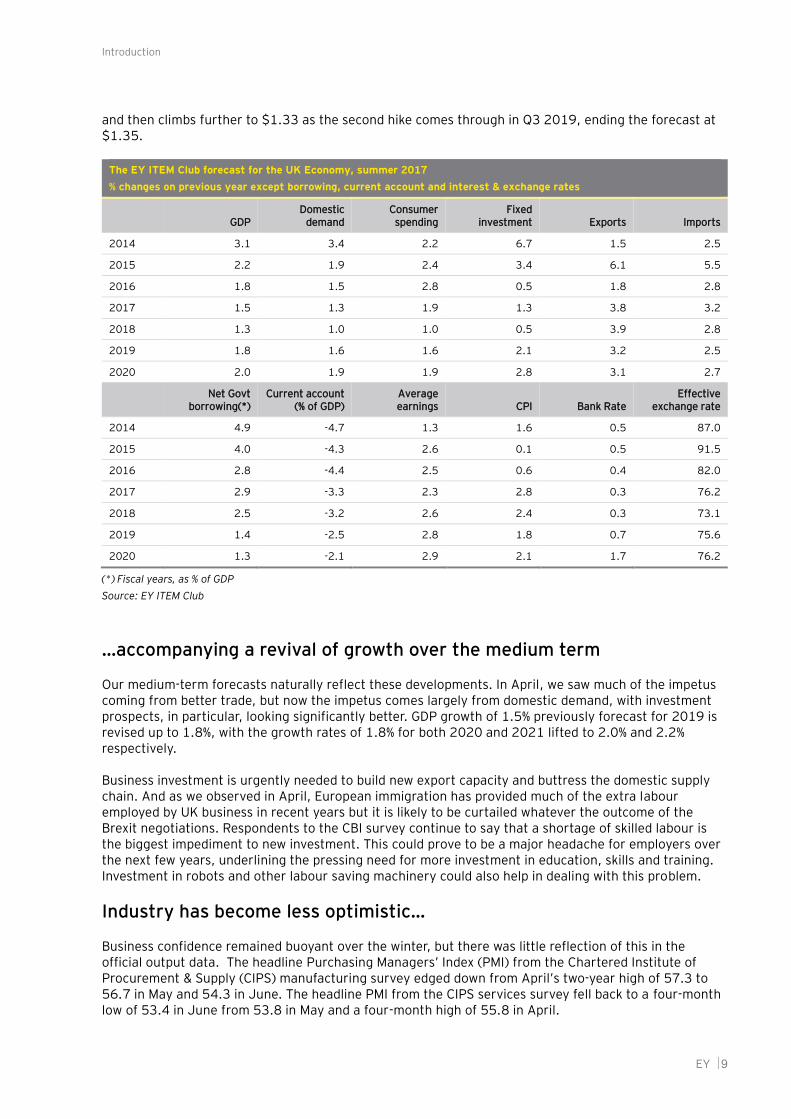
and then climbs further to $1.33 as the second hike comes through in Q3 2019, ending the forecast at $1.35.
The EY ITEM Club forecast for the UK Economy, summer 2017
% changes on previous year except borrowing, current account and interest & exchange rates
GDP Domestic
demand Consumer
spending Fixed
investment Exports Imports
2014 3.1 3.4 2.2 6.7 1.5 2.5
2015 2.2 1.9 2.4 3.4 6.1 5.5
2016 1.8 1.5 2.8 0.5 1.8 2.8
2017 1.5 1.3 1.9 1.3 3.8 3.2
2018 1.3 1.0 1.0 0.5 3.9 2.8
2019 1.8 1.6 1.6 2.1 3.2 2.5
2020 2.0 1.9 1.9 2.8 3.1 2.7
Net Govt
borrowing(*) Current account
(% of GDP) Average earnings CPI Bank Rate
Effective exchange rate
2014 4.9 -4.7 1.3 1.6 0.5 87.0
2015 4.0 -4.3 2.6 0.1 0.5 91.5
2016 2.8 -4.4 2.5 0.6 0.4 82.0
2017 2.9 -3.3 2.3 2.8 0.3 76.2
2018 2.5 -3.2 2.6 2.4 0.3 73.1
2019 1.4 -2.5 2.8 1.8 0.7 75.6
2020 1.3 -2.1 2.9 2.1 1.7 76.2
(*) Fiscal years, as % of GDP
Source: EY ITEM Club
…accompanying a revival of growth over the medium term
Our medium-term forecasts naturally reflect these developments. In April, we saw much of the impetus coming from better trade, but now the impetus comes largely from domestic demand, with investment prospects, in particular, looking significantly better. GDP growth of 1.5% previously forecast for 2019 is revised up to 1.8%, with the growth rates of 1.8% for both 2020 and 2021 lifted to 2.0% and 2.2% respectively.
Business investment is urgently needed to build new export capacity and buttress the domestic supply chain. And as we observed in April, European immigration has provided much of the extra labour employed by UK business in recent years but it is likely to be curtailed whatever the outcome of the Brexit negotiations. Respondents to the CBI survey continue to say that a shortage of skilled labour is the biggest impediment to new investment. This could prove to be a major headache for employers over the next few years, underlining the pressing need for more investment in education, skills and training. Investment in robots and other labour saving machinery could also help in dealing with this problem.
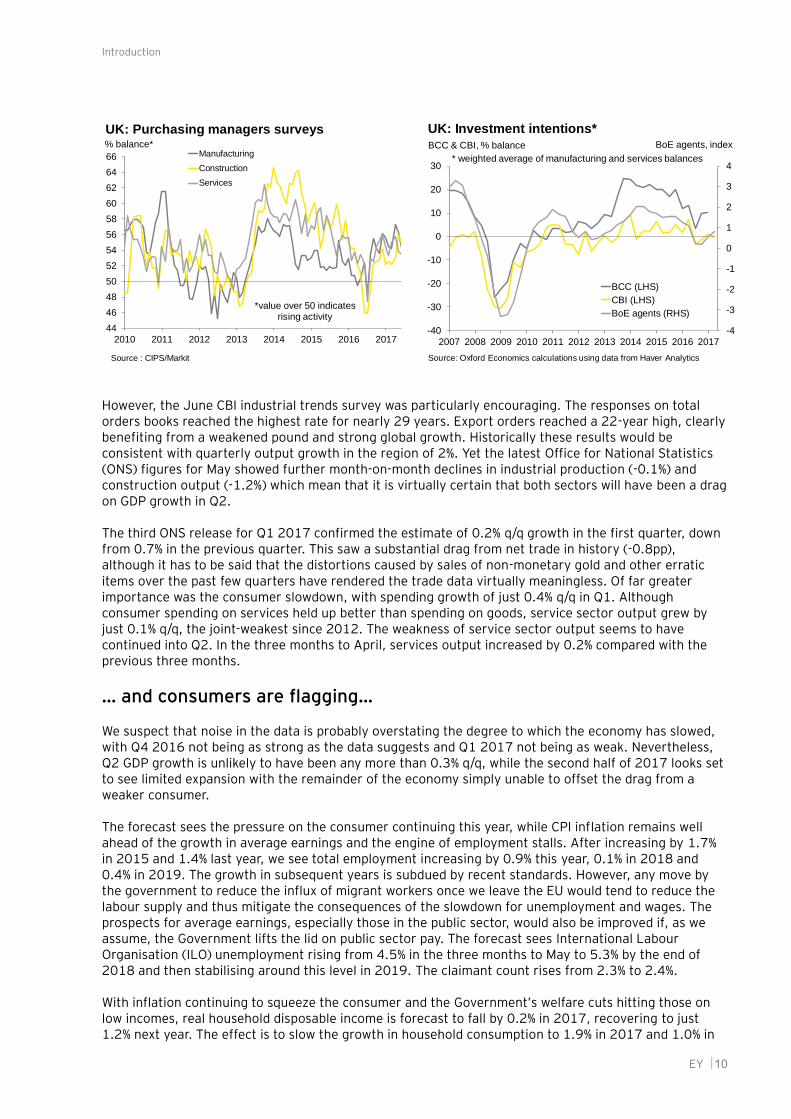
Industry has become less optimistic…
Business confidence remained buoyant over the winter, but there was little reflection of this in the official output data. The headline Purchasing Managers’ Index (PMI) from the Chartered Institute of Procurement & Supply (CIPS) manufacturing survey edged down from April’s two-year high of 57.3 to 56.7 in May and 54.3 in June. The headline PMI from the CIPS services survey fell back to a four-month low of 53.4 in June from 53.8 in May and a four-month high of 55.8 in April.
Introduction
EY 10
However, the June CBI industrial trends survey was particularly encouraging. The responses on total orders books reached the highest rate for nearly 29 years. Export orders reached a 22-year high, clearly benefiting from a weakened pound and strong global growth. Historically these results would be consistent with quarterly output growth in the region of 2%. Yet the latest Office for National Statistics (ONS) figures for May showed further month-on-month declines in industrial production (-0.1%) and construction output (-1.2%) which mean that it is virtually certain that both sectors will have been a drag on GDP growth in Q2.
The third ONS release for Q1 2017 confirmed the estimate of 0.2% q/q growth in the first quarter, down from 0.7% in the previous quarter. This saw a substantial drag from net trade in history (-0.8pp), although it has to be said that the distortions caused by sales of non-monetary gold and other erratic items over the past few quarters have rendered the trade data virtually meaningless. Of far greater importance was the consumer slowdown, with spending growth of just 0.4% q/q in Q1. Although consumer spending on services held up better than spending on goods, service sector output grew by just 0.1% q/q, the joint-weakest since 2012. The weakness of service sector output seems to have continued into Q2. In the three months to April, services output increased by 0.2% compared with the previous three months.
… and consumers are flagging…
We suspect that noise in the data is probably overstating the degree to which the economy has slowed, with Q4 2016 not being as strong as the data suggests and Q1 2017 not being as weak. Nevertheless, Q2 GDP growth is unlikely to have been any more than 0.3% q/q, while the second half of 2017 looks set to see limited expansion with the remainder of the economy simply unable to offset the drag from a weaker consumer.
The forecast sees the pressure on the consumer continuing this year, while CPI inflation remains well ahead of the growth in average earnings and the engine of employment stalls. After increasing by 1.7% in 2015 and 1.4% last year, we see total employment increasing by 0.9% this year, 0.1% in 2018 and 0.4% in 2019. The growth in subsequent years is subdued by recent standards. However, any move by the government to reduce the influx of migrant workers once we leave the EU would tend to reduce the labour supply and thus mitigate the consequences of the slowdown for unemployment and wages. The prospects for average earnings, especially those in the public sector, would also be improved if, as we assume, the Government lifts the lid on public sector pay. The forecast sees International Labour Organisation (ILO) unemployment rising from 4.5% in the three months to May to 5.3% by the end of 2018 and then stabilising around this level in 2019. The claimant count rises from 2.3% to 2.4%.
With inflation continuing to squeeze the consumer and the Government’s welfare cuts hitting those on low incomes, real household disposable income is forecast to fall by 0.2% in 2017, recovering to just 1.2% next year. The effect is to slow the growth in household consumption to 1.9% in 2017 and 1.0% in
-4
-3
-2
-1
0
1
2
3
4
-40
-30
-20
-10
0
10
20
30
2007 2008 2009 2010 2011 2012 2013 2014 2015 2016 2017
BCC (LHS)
CBI (LHS)
BoE agents (RHS)
UK: Investment intentions*
BCC & CBI, % balance
Source: Oxford Economics calculations using data from Haver Analytics
* weighted average of manufacturing and services balances
BoE agents, index
44
46
48
50
52
54
56
58
60
62
64
66
2010 2011 2012 2013 2014 2015 2016 2017
Manufacturing
Construction
Services
UK: Purchasing managers surveys% balance*
Source : CIPS/Markit
*value over 50 indicates rising activity
Introduction
EY 11
2018. The growth in real incomes and spending then recovers slowly over the rest of the forecast period.
The housing market has slowed considerably over the last year, while the buy-to-let landlord has retired, leaving space for the young first-time buyer. After stamp-duty related distortions in the first half of last year, the second half of 2016 saw activity settle at a similar level to that seen in 2014 and 2015. Mortgage approvals and net mortgage lending have eased back, as have housing transactions and price inflation. Nevertheless, housing investment and housebuilding have remained buoyant, reflecting the profit margins left by the recent strength in house prices. Housing investment reached £16.5 billion in the first quarter, up 4% on a year earlier, the strongest figure in a decade. However, in view of the squeeze on real incomes this year, it is difficult to envisage any meaningful pickup in mortgage activity and we expect the next 18 months to be pretty flat in terms of both transactions and prices, with housing investment flattening off.
...leaving growth heavily dependent upon investment and trade performance
Business confidence was, as we have noted, buoyant over the winter; but it has begun to fade as uncertainty has increased following the election. Moreover, distortions apart, business investment remains weak and is vulnerable to disappointing news on the Brexit front. It seems unlikely that the more competitive position of sterling will provide enough support to prevent business investment easing back over the rest of this year following the strong showing in the first quarter. The forecast sees business investment flat this year and increasing by just 0.1% in 2018, before picking up progressively over the remaining years of the forecast as the uncertainty about the UK’s immigration and trading arrangements begins to abate.
The balance of payments outlook has brightened considerably since sterling’s devaluation. As highlighted in previous reports, the currency translation effect is clearly apparent in an improvement in the UK’s net overseas earnings. The forecast sees the deficit on primary investment income falling from £21.7 billion last year to £8.5 billion in 2017. This, together with the associated increase in export earnings, will provide much needed support for UK output and incomes. International transfers will be affected by the UK’s exit from the EU and are now a major area of uncertainty. The UK’s contributions to the EU budget are likely to rise in the near term as it settles its accounts, although the final bill will be subject to negotiation. Then, assuming the UK contributions are slashed back once we leave, we should see a marked improvement in the balance of international transfers.
The trade balance continues to disappoint, despite the devaluation of sterling and the strong pickup in our European and other markets highlighted in our April report. There are signs that the devaluation is boosting export volumes, but so far, exporters have in the main taken advantage of the lower pound to increase their sterling export prices and profits. Nevertheless, with European and other export markets moving ahead and imports held back by the loss of momentum in the consumer sector, export volumes are forecast to increase by 3.8% this year and 3.9% in 2018, while import volumes increase by 3.2% and 2.8% respectively. Net exports add 0.1% to GDP this year and another 0.3% in 2018. Overall, the forecast shows the current account deficit narrowing from £84.5 billion in 2016 to £65.8 billion this year, £66.7 billion in 2018 and £53.5 billion in 2019.
Risks and uncertainties
It goes without saying that trade performance and output growth in 2019 and beyond will depend critically upon the exit terms that can be agreed with the EU27 and other countries. Although the next 15 months should bring greater clarity here, this remains the number one uncertainty, compounded by the political uncertainty precipitated by the result of the general election.
Forecast in detail
EY 12
Forecast in detail
1. Fiscal policy
The Conservatives’ weaker-than-expected performance in June’s general election has certainly given them a lot to think about on the fiscal policy front, with the loss of their majority being significantly attributed in many quarters to increased public dissatisfaction with austerity. There has also been high profile public disquiet over the 1% cap on public sector pay.
The Conservative Government has ruled out a summer Budget following the shock election result, and has responded by indicating that it has taken on board the electorate’s views and will consider them when formulating November’s Budget.
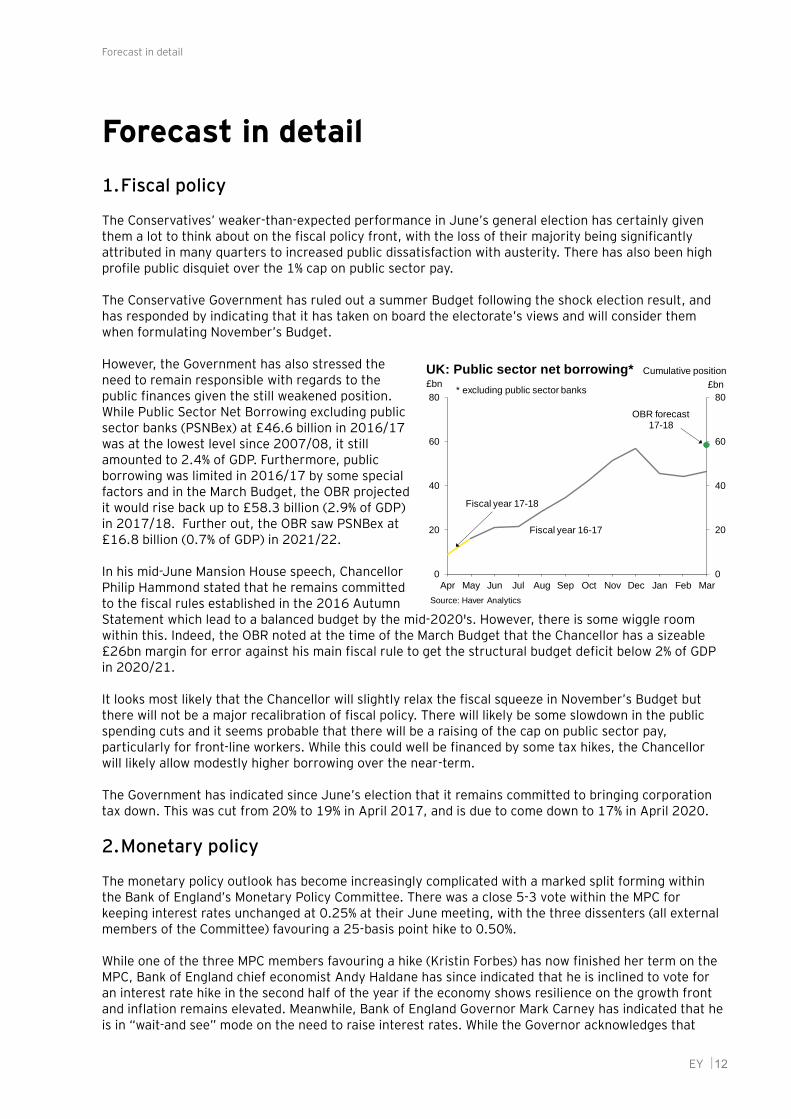
However, the Government has also stressed the need to remain responsible with regards to the public finances given the still weakened position. While Public Sector Net Borrowing excluding public sector banks (PSNBex) at £46.6 billion in 2016/17 was at the lowest level since 2007/08, it still amounted to 2.4% of GDP. Furthermore, public borrowing was limited in 2016/17 by some special factors and in the March Budget, the OBR projected it would rise back up to £58.3 billion (2.9% of GDP) in 2017/18. Further out, the OBR saw PSNBex at £16.8 billion (0.7% of GDP) in 2021/22.
In his mid-June Mansion House speech, Chancellor Philip Hammond stated that he remains committed to the fiscal rules established in the 2016 Autumn Statement which lead to a balanced budget by the mid-2020's. However, there is some wiggle room within this. Indeed, the OBR noted at the time of the March Budget that the Chancellor has a sizeable £26bn margin for error against his main fiscal rule to get the structural budget deficit below 2% of GDP in 2020/21.
It looks most likely that the Chancellor will slightly relax the fiscal squeeze in November’s Budget but there will not be a major recalibration of fiscal policy. There will likely be some slowdown in the public spending cuts and it seems probable that there will be a raising of the cap on public sector pay, particularly for front-line workers. While this could well be financed by some tax hikes, the Chancellor will likely allow modestly higher borrowing over the near-term.
The Government has indicated since June’s election that it remains committed to bringing corporation tax down. This was cut from 20% to 19% in April 2017, and is due to come down to 17% in April 2020.
2. Monetary policy
The monetary policy outlook has become increasingly complicated with a marked split forming within the Bank of England’s Monetary Policy Committee. There was a close 5-3 vote within the MPC for keeping interest rates unchanged at 0.25% at their June meeting, with the three dissenters (all external members of the Committee) favouring a 25-basis point hike to 0.50%.
While one of the three MPC members favouring a hike (Kristin Forbes) has now finished her term on the MPC, Bank of England chief economist Andy Haldane has since indicated that he is inclined to vote for an interest rate hike in the second half of the year if the economy shows resilience on the growth front and inflation remains elevated. Meanwhile, Bank of England Governor Mark Carney has indicated that he is in “wait-and see” mode on the need to raise interest rates. While the Governor acknowledges that
0
20
40
60
80
0
20
40
60
80
Apr May Jun Jul Aug Sep Oct Nov Dec Jan Feb Mar
Source: Haver Analytics
£bn
UK: Public sector net borrowing*
Fiscal year 16-17
Fiscal year 17-18
Cumulative position
£bn
OBR forecast17-18
* excluding public sector banks
Forecast in detail
EY 13
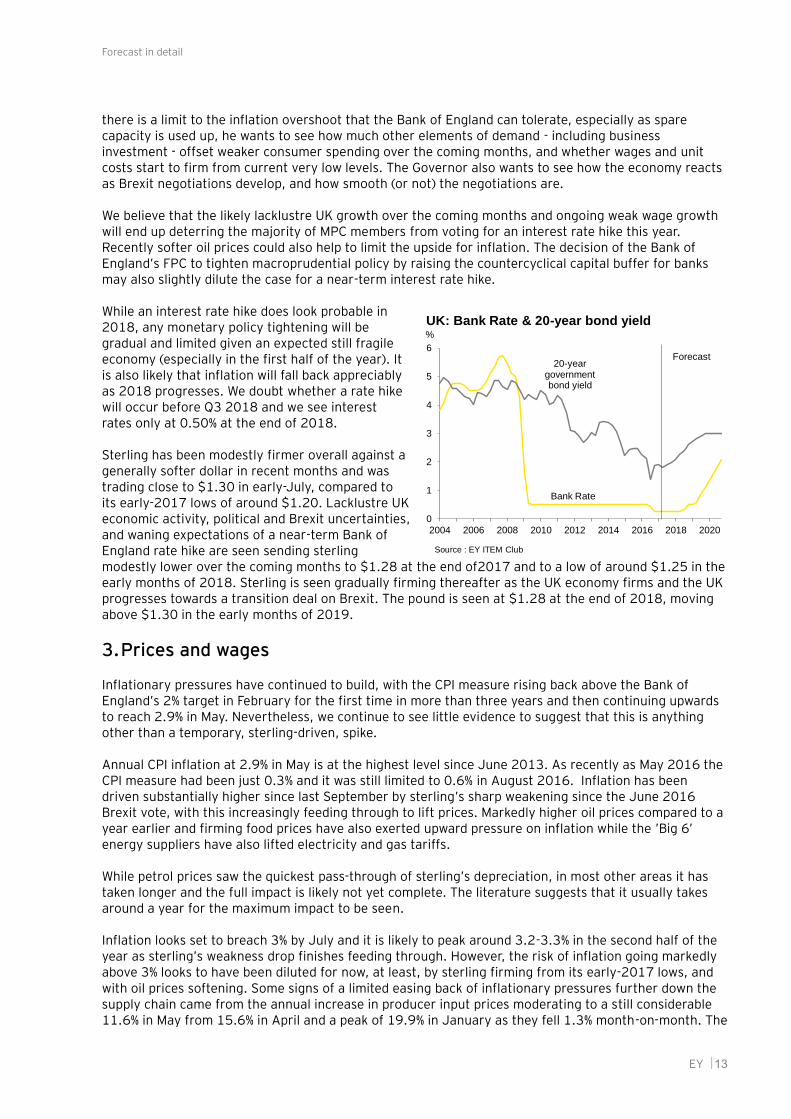
there is a limit to the inflation overshoot that the Bank of England can tolerate, especially as spare capacity is used up, he wants to see how much other elements of demand - including business investment - offset weaker consumer spending over the coming months, and whether wages and unit costs start to firm from current very low levels. The Governor also wants to see how the economy reacts as Brexit negotiations develop, and how smooth (or not) the negotiations are.
We believe that the likely lacklustre UK growth over the coming months and ongoing weak wage growth will end up deterring the majority of MPC members from voting for an interest rate hike this year. Recently softer oil prices could also help to limit the upside for inflation. The decision of the Bank of England’s FPC to tighten macroprudential policy by raising the countercyclical capital buffer for banks may also slightly dilute the case for a near-term interest rate hike.
While an interest rate hike does look probable in 2018, any monetary policy tightening will be gradual and limited given an expected still fragile economy (especially in the first half of the year). It is also likely that inflation will fall back appreciably as 2018 progresses. We doubt whether a rate hike will occur before Q3 2018 and we see interest rates only at 0.50% at the end of 2018.
Sterling has been modestly firmer overall against a generally softer dollar in recent months and was trading close to $1.30 in early-July, compared to its early-2017 lows of around $1.20. Lacklustre UK economic activity, political and Brexit uncertainties, and waning expectations of a near-term Bank of England rate hike are seen sending sterling modestly lower over the coming months to $1.28 at the end of2017 and to a low of around $1.25 in the early months of 2018. Sterling is seen gradually firming thereafter as the UK economy firms and the UK progresses towards a transition deal on Brexit. The pound is seen at $1.28 at the end of 2018, moving above $1.30 in the early months of 2019.
3. Prices and wages
Inflationary pressures have continued to build, with the CPI measure rising back above the Bank of England’s 2% target in February for the first time in more than three years and then continuing upwards to reach 2.9% in May. Nevertheless, we continue to see little evidence to suggest that this is anything other than a temporary, sterling-driven, spike.
Annual CPI inflation at 2.9% in May is at the highest level since June 2013. As recently as May 2016 the CPI measure had been just 0.3% and it was still limited to 0.6% in August 2016. Inflation has been driven substantially higher since last September by sterling’s sharp weakening since the June 2016 Brexit vote, with this increasingly feeding through to lift prices. Markedly higher oil prices compared to a year earlier and firming food prices have also exerted upward pressure on inflation while the ’Big 6’ energy suppliers have also lifted electricity and gas tariffs.
While petrol prices saw the quickest pass-through of sterling’s depreciation, in most other areas it has taken longer and the full impact is likely not yet complete. The literature suggests that it usually takes around a year for the maximum impact to be seen.
Inflation looks set to breach 3% by July and it is likely to peak around 3.2-3.3% in the second half of the year as sterling’s weakness drop finishes feeding through. However, the risk of inflation going markedly above 3% looks to have been diluted for now, at least, by sterling firming from its early-2017 lows, and with oil prices softening. Some signs of a limited easing back of inflationary pressures further down the supply chain came from the annual increase in producer input prices moderating to a still considerable 11.6% in May from 15.6% in April and a peak of 19.9% in January as they fell 1.3% month-on-month. The
0
1
2
3
4
5
6
2004 2006 2008 2010 2012 2014 2016 2018 2020
UK: Bank Rate & 20-year bond yield%
Source : EY ITEM Club
Bank Rate
20-year government bond yield
Forecast
Forecast in detail
EY 14
annual increase in producer output prices stabilised at 3.6% as they rose a modest 0.1% month-on-month.
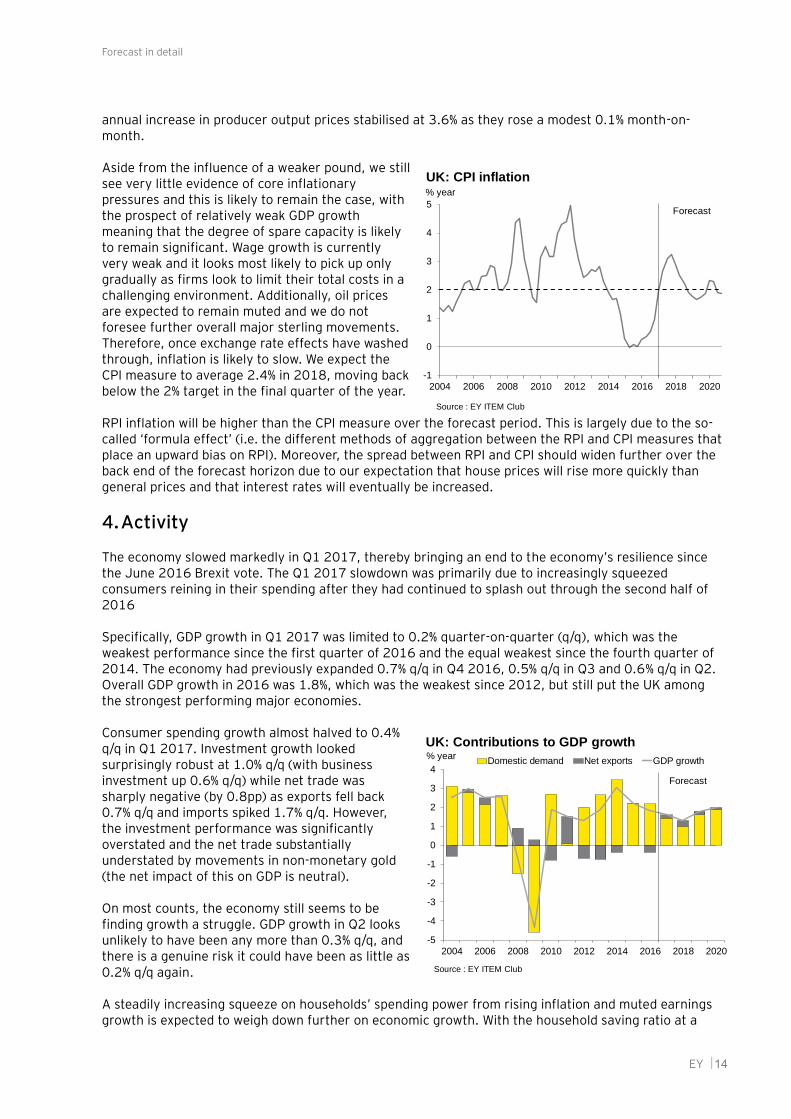
Aside from the influence of a weaker pound, we still see very little evidence of core inflationary pressures and this is likely to remain the case, with the prospect of relatively weak GDP growth meaning that the degree of spare capacity is likely to remain significant. Wage growth is currently very weak and it looks most likely to pick up only gradually as firms look to limit their total costs in a challenging environment. Additionally, oil prices are expected to remain muted and we do not foresee further overall major sterling movements. Therefore, once exchange rate effects have washed through, inflation is likely to slow. We expect the CPI measure to average 2.4% in 2018, moving back below the 2% target in the final quarter of the year.
RPI inflation will be higher than the CPI measure over the forecast period. This is largely due to the so-called ‘formula effect’ (i.e. the different methods of aggregation between the RPI and CPI measures that place an upward bias on RPI). Moreover, the spread between RPI and CPI should widen further over the back end of the forecast horizon due to our expectation that house prices will rise more quickly than general prices and that interest rates will eventually be increased.
4. Activity
The economy slowed markedly in Q1 2017, thereby bringing an end to the economy’s resilience since the June 2016 Brexit vote. The Q1 2017 slowdown was primarily due to increasingly squeezed consumers reining in their spending after they had continued to splash out through the second half of 2016
Specifically, GDP growth in Q1 2017 was limited to 0.2% quarter-on-quarter (q/q), which was the weakest performance since the first quarter of 2016 and the equal weakest since the fourth quarter of 2014. The economy had previously expanded 0.7% q/q in Q4 2016, 0.5% q/q in Q3 and 0.6% q/q in Q2. Overall GDP growth in 2016 was 1.8%, which was the weakest since 2012, but still put the UK among the strongest performing major economies.
Consumer spending growth almost halved to 0.4% q/q in Q1 2017. Investment growth looked surprisingly robust at 1.0% q/q (with business investment up 0.6% q/q) while net trade was sharply negative (by 0.8pp) as exports fell back 0.7% q/q and imports spiked 1.7% q/q. However, the investment performance was significantly overstated and the net trade substantially understated by movements in non-monetary gold (the net impact of this on GDP is neutral).
On most counts, the economy still seems to be finding growth a struggle. GDP growth in Q2 looks unlikely to have been any more than 0.3% q/q, and there is a genuine risk it could have been as little as 0.2% q/q again.
A steadily increasing squeeze on households’ spending power from rising inflation and muted earnings growth is expected to weigh down further on economic growth. With the household saving ratio at a
-1
0
1
2
3
4
5
2004 2006 2008 2010 2012 2014 2016 2018 2020
UK: CPI inflation% year
Source : EY ITEM Club
Forecast
-5
-4
-3
-2
-1
0
1
2
3
4
2004 2006 2008 2010 2012 2014 2016 2018 2020
Domestic demand Net exports GDP growth
UK: Contributions to GDP growth% year
Source : EY ITEM Club
Forecast
Forecast in detail
EY 15
record low of 1.7% in Q1 2017, the scope for households to mitigate lower real income growth by dissaving is decidedly limited. Strong growth in household wealth last year and current record high low employment are supportive, but an eventual relapse in employment looks probable. Consumer spending growth is forecast to slow from a nine-year high of 2.8% in 2016 to 1.9% this year and 1.0% in 2018.
Meanwhile, although corporate profitability currently remains at historically high levels, companies appear reluctant to spend. Business investment fell in 2016 for the first time since 2009. A softer consumer outlook, along with uncertainty around the UK’s future trading relations with the EU will put a cap on investment growth this year.
On the positive side, net trade should prove some help to growth, with the depressed level of sterling supporting export growth and helping domestic UK firms in competing with imports. Healthy global growth (with improvement in the Eurozone) is also helpful. We expect net trade to add 0.1 pp to GDP this year followed by another 0.3pp in 2018.
Overall GDP growth is seen easing from 1.8% in 2016 to 1.5% in 2017 and 1.3% in 2018. However, the economy is expected to see some pick-up in growth during the second half of 2018 as the squeeze on consumers eases and businesses are increasingly encouraged by the expected movement of the UK towards a transitional deal with the EU over Brexit.
5. Consumer demand
Annual growth in consumer spending reached a nine-year high of 2.8% in 2016. Although wage growth remained subdued, households’ appetite to spend was buoyed by falls in foods and energy prices and continued growth in employment.
However, 2017 is turning out to be a very different story for consumers, which looks set to continue into 2018. Consumer spending growth almost halved to 0.4% q/q in Q1 2017 from 0.7% q/q in Q4 2016 (it was 0.7-0.8% q/q through 2016). This was the equal weakest performance since the fourth quarter of 2014.
There may well have been some pick-up in consumer spending in Q2 as retail sales volumes surged 2.5% month on month (m/m) in April as they were lifted by the later Easter and warm weather. However, a 1.2% m/m relapse in retail sales in May indicated that the underlying performance remained very weak. It is also notable that private car sales fell 7.8% year-on-year (y/y) in June and were down 4.8% y/y over the first six months of 2017.
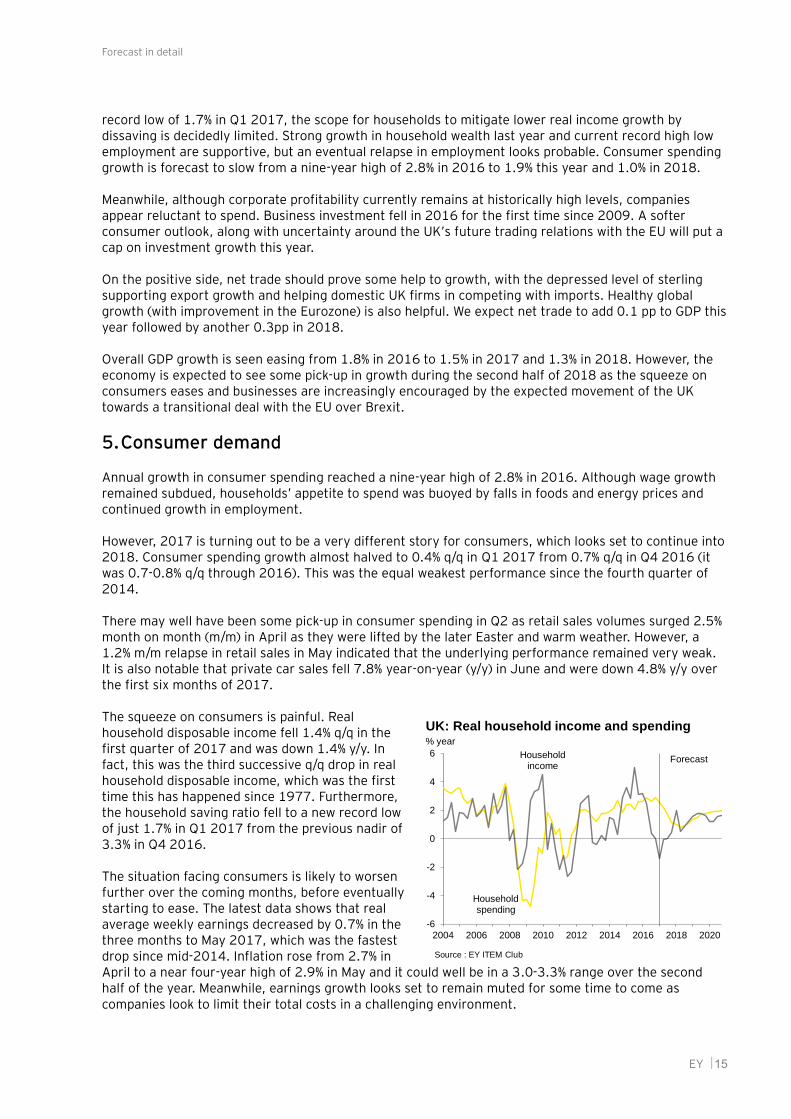
The squeeze on consumers is painful. Real household disposable income fell 1.4% q/q in the first quarter of 2017 and was down 1.4% y/y. In fact, this was the third successive q/q drop in real household disposable income, which was the first time this has happened since 1977. Furthermore, the household saving ratio fell to a new record low of just 1.7% in Q1 2017 from the previous nadir of 3.3% in Q4 2016.
The situation facing consumers is likely to worsen further over the coming months, before eventually starting to ease. The latest data shows that real average weekly earnings decreased by 0.7% in the three months to May 2017, which was the fastest drop since mid-2014. Inflation rose from 2.7% in April to a near four-year high of 2.9% in May and it could well be in a 3.0-3.3% range over the second half of the year. Meanwhile, earnings growth looks set to remain muted for some time to come as companies look to limit their total costs in a challenging environment.
-6
-4
-2
0
2
4
6
2004 2006 2008 2010 2012 2014 2016 2018 2020
UK: Real household income and spending% year
Source : EY ITEM Club
Household spending
Household income
Forecast
Forecast in detail
EY 16
Furthermore, already brittle consumer confidence and caution over making major purchases could well be magnified by heightened economic and political uncertainties following the general election and with Brexit negotiations now underway. Indeed, GfK reported consumer confidence fell sharply in June to be at its lowest level since July 2016 (when it plunged in the immediate aftermath of the Brexit vote).
There is some support for consumer spending coming from current decent employment growth, but it is questionable whether this can continue in the face of weakened UK economic activity, increasing business uncertainty and concerns over the UK’s economic and political outlook. Meanwhile, the Government has remained committed to cuts in the welfare budget, hitting the incomes of 11.5 million households.
Consumers have been taking on additional borrowing to help finance spending, no doubt encouraged by very low interest rates limiting debt-servicing costs. Indeed, annual growth in net unsecured consumer credit growth of 10.3% y/y in May marked a 13th successive double-digit increase. However, the Bank of England is becoming increasingly wary about consumer borrowing and is putting pressure on banks to rein it in.
While the squeeze on consumers’ purchasing power will likely be particularly marked at the start of 2018, it should ease as the year progresses, largely due to inflation retreating. Additionally, some pick-up in private sector earnings growth looks likely, which could well be backed up by a limited increase in the cap on public sector pay. However, employment is expected to be essentially flat over the year.
Overall, we forecast consumer spending growth to slow to 1.9% this year and to be limited to 1.0% in 2018. However, consumer spending is expected to pick up in q/q terms in the second half of 2018.
6. Housing market
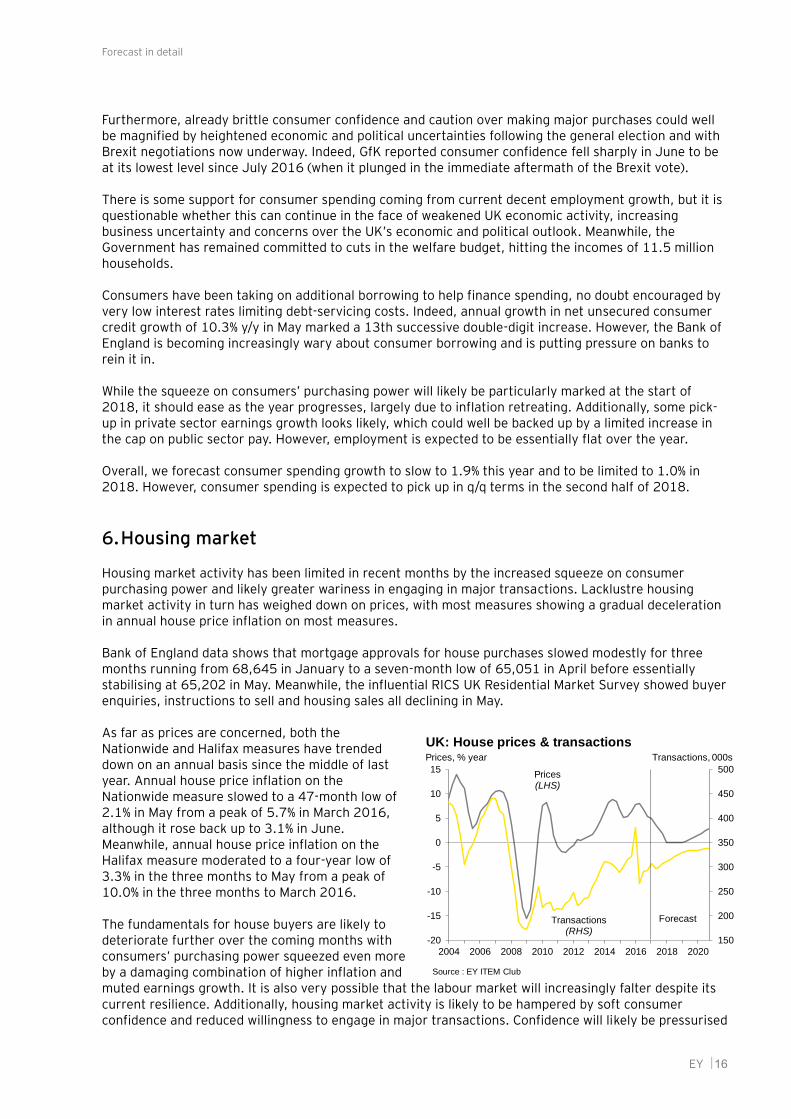
Housing market activity has been limited in recent months by the increased squeeze on consumer purchasing power and likely greater wariness in engaging in major transactions. Lacklustre housing market activity in turn has weighed down on prices, with most measures showing a gradual deceleration in annual house price inflation on most measures.
Bank of England data shows that mortgage approvals for house purchases slowed modestly for three months running from 68,645 in January to a seven-month low of 65,051 in April before essentially stabilising at 65,202 in May. Meanwhile, the influential RICS UK Residential Market Survey showed buyer enquiries, instructions to sell and housing sales all declining in May.
As far as prices are concerned, both the Nationwide and Halifax measures have trended down on an annual basis since the middle of last year. Annual house price inflation on the Nationwide measure slowed to a 47-month low of 2.1% in May from a peak of 5.7% in March 2016, although it rose back up to 3.1% in June. Meanwhile, annual house price inflation on the Halifax measure moderated to a four-year low of 3.3% in the three months to May from a peak of 10.0% in the three months to March 2016.
The fundamentals for house buyers are likely to deteriorate further over the coming months with consumers’ purchasing power squeezed even more by a damaging combination of higher inflation and muted earnings growth. It is also very possible that the labour market will increasingly falter despite its current resilience. Additionally, housing market activity is likely to be hampered by soft consumer confidence and reduced willingness to engage in major transactions. Confidence will likely be pressurised
150
200
250
300
350
400
450
500
-20
-15
-10
-5
0
5
10
15
2004 2006 2008 2010 2012 2014 2016 2018 2020
UK: House prices & transactionsPrices, % year
Source : EY ITEM Club
Forecast
Transactions, 000s
Prices(LHS)
Transactions(RHS)
Forecast in detail
EY 17
not only by weakened purchasing power but also by heightened uncertainty among economic and political difficulties.
Potential house buyers may also be concerned by signs that the Bank of England could be near to hiking interest rates. While any increase in interest rates would be small and mortgage rates would still be at historically very low levels, the fact that it would be the first rise in interest rates since mid-2007 could have a significant effect on housing market psychology by focusing housebuyers’ minds on the fact that sooner or later they will have to deal with higher mortgage rates.
Housing market activity and prices are also likely to be pressurised by stretched house prices to earnings ratios and tight checking of prospective mortgage borrowers by lenders. Halifax data shows the house price to earnings ratio reached 5.81 in December (the highest level since August 2007) and was still as high as 5.75 in May. This is well above the long-term (1983-2017) average of 4.19. Furthermore, mortgage lenders are under pressure from the Bank of England to tighten their lending standards.
The downside for house prices should be limited markedly by the shortage of houses for sale. High employment and very low mortgage rates are currently still supportive.
We expect house price growth to be limited to around 2% year-on-year at the end of2017, averaging 3.3% over the year. House prices are seen as essentially flat over 2018.
7. Company sector
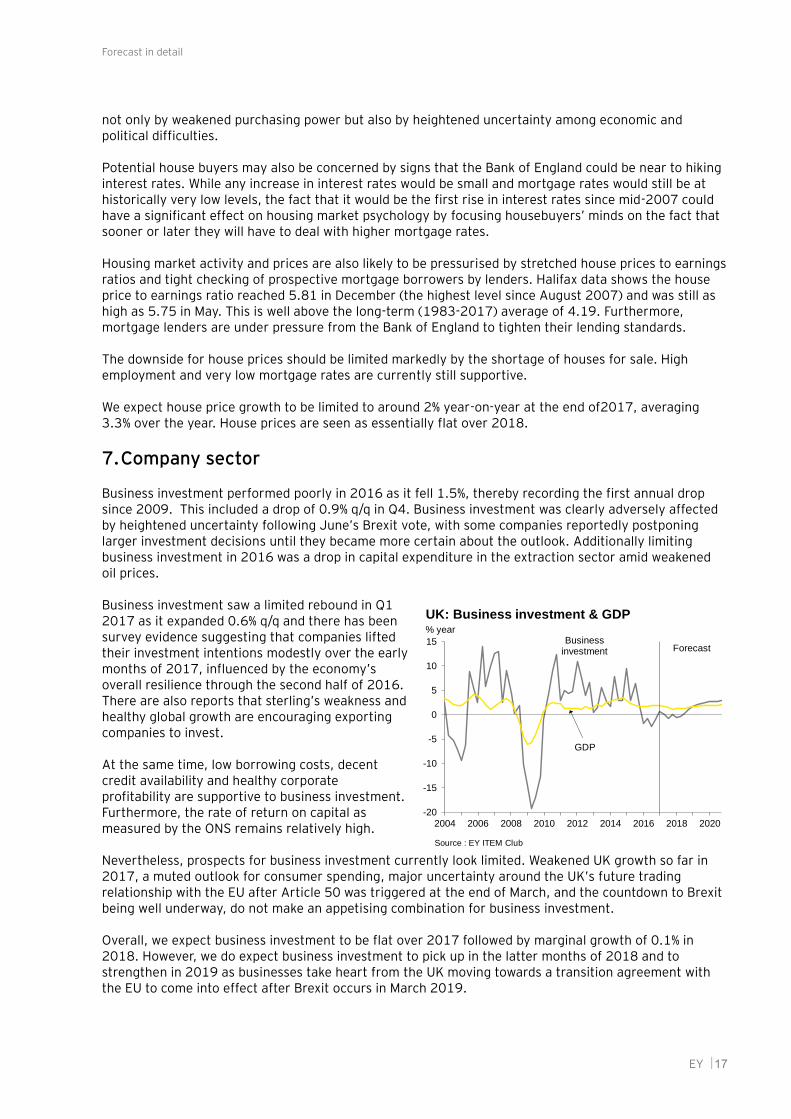
Business investment performed poorly in 2016 as it fell 1.5%, thereby recording the first annual drop since 2009. This included a drop of 0.9% q/q in Q4. Business investment was clearly adversely affected by heightened uncertainty following June’s Brexit vote, with some companies reportedly postponing larger investment decisions until they became more certain about the outlook. Additionally limiting business investment in 2016 was a drop in capital expenditure in the extraction sector amid weakened oil prices.
Business investment saw a limited rebound in Q1 2017 as it expanded 0.6% q/q and there has been survey evidence suggesting that companies lifted their investment intentions modestly over the early months of 2017, influenced by the economy’s overall resilience through the second half of 2016. There are also reports that sterling’s weakness and healthy global growth are encouraging exporting companies to invest.
At the same time, low borrowing costs, decent credit availability and healthy corporate profitability are supportive to business investment. Furthermore, the rate of return on capital as measured by the ONS remains relatively high.
Nevertheless, prospects for business investment currently look limited. Weakened UK growth so far in 2017, a muted outlook for consumer spending, major uncertainty around the UK’s future trading relationship with the EU after Article 50 was triggered at the end of March, and the countdown to Brexit being well underway, do not make an appetising combination for business investment.
Overall, we expect business investment to be flat over 2017 followed by marginal growth of 0.1% in 2018. However, we do expect business investment to pick up in the latter months of 2018 and to strengthen in 2019 as businesses take heart from the UK moving towards a transition agreement with the EU to come into effect after Brexit occurs in March 2019.
-20
-15
-10
-5
0
5
10
15
2004 2006 2008 2010 2012 2014 2016 2018 2020
UK: Business investment & GDP% year
Source : EY ITEM Club
GDP
Business investment Forecast
Forecast in detail
EY 18
8. Labour market
The labour market has shown ongoing decent improvement during 2017 so far despite weaker economic growth. However, this is still not translating into higher earnings growth. Indeed, earnings growth has been largely softer which has added to the squeeze on consumers’ purchasing power, along with higher inflation.
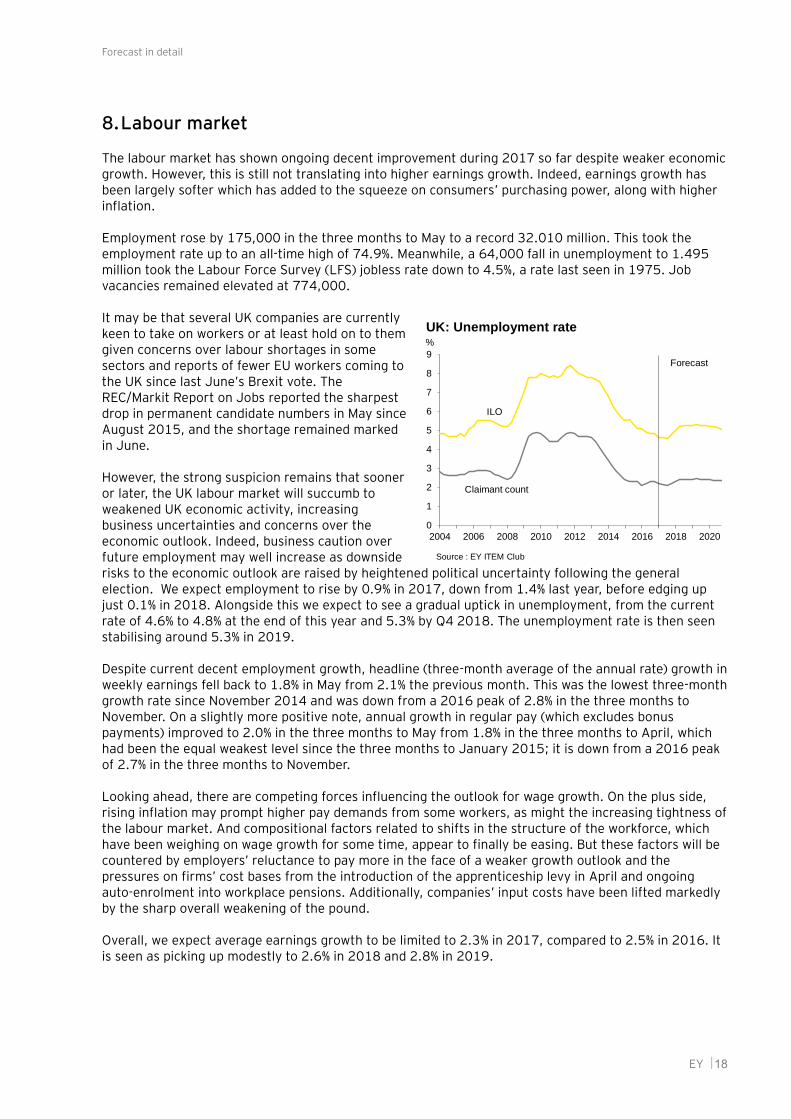
Employment rose by 175,000 in the three months to May to a record 32.010 million. This took the employment rate up to an all-time high of 74.9%. Meanwhile, a 64,000 fall in unemployment to 1.495 million took the Labour Force Survey (LFS) jobless rate down to 4.5%, a rate last seen in 1975. Job vacancies remained elevated at 774,000.
It may be that several UK companies are currently keen to take on workers or at least hold on to them given concerns over labour shortages in some sectors and reports of fewer EU workers coming to the UK since last June’s Brexit vote. The REC/Markit Report on Jobs reported the sharpest drop in permanent candidate numbers in May since August 2015, and the shortage remained marked in June.
However, the strong suspicion remains that sooner or later, the UK labour market will succumb to weakened UK economic activity, increasing business uncertainties and concerns over the economic outlook. Indeed, business caution over future employment may well increase as downside risks to the economic outlook are raised by heightened political uncertainty following the general election. We expect employment to rise by 0.9% in 2017, down from 1.4% last year, before edging up just 0.1% in 2018. Alongside this we expect to see a gradual uptick in unemployment, from the current rate of 4.6% to 4.8% at the end of this year and 5.3% by Q4 2018. The unemployment rate is then seen stabilising around 5.3% in 2019.
Despite current decent employment growth, headline (three-month average of the annual rate) growth in weekly earnings fell back to 1.8% in May from 2.1% the previous month. This was the lowest three-month growth rate since November 2014 and was down from a 2016 peak of 2.8% in the three months to November. On a slightly more positive note, annual growth in regular pay (which excludes bonus payments) improved to 2.0% in the three months to May from 1.8% in the three months to April, which had been the equal weakest level since the three months to January 2015; it is down from a 2016 peak of 2.7% in the three months to November.
Looking ahead, there are competing forces influencing the outlook for wage growth. On the plus side, rising inflation may prompt higher pay demands from some workers, as might the increasing tightness of the labour market. And compositional factors related to shifts in the structure of the workforce, which have been weighing on wage growth for some time, appear to finally be easing. But these factors will be countered by employers’ reluctance to pay more in the face of a weaker growth outlook and the pressures on firms’ cost bases from the introduction of the apprenticeship levy in April and ongoing auto-enrolment into workplace pensions. Additionally, companies’ input costs have been lifted markedly by the sharp overall weakening of the pound.
Overall, we expect average earnings growth to be limited to 2.3% in 2017, compared to 2.5% in 2016. It is seen as picking up modestly to 2.6% in 2018 and 2.8% in 2019.
0
1
2
3
4
5
6
7
8
9
2004 2006 2008 2010 2012 2014 2016 2018 2020
UK: Unemployment rate%
Source : EY ITEM Club
Claimant count
ILO
Forecast
Forecast in detail
EY 19
9. Trade and the balance of payments
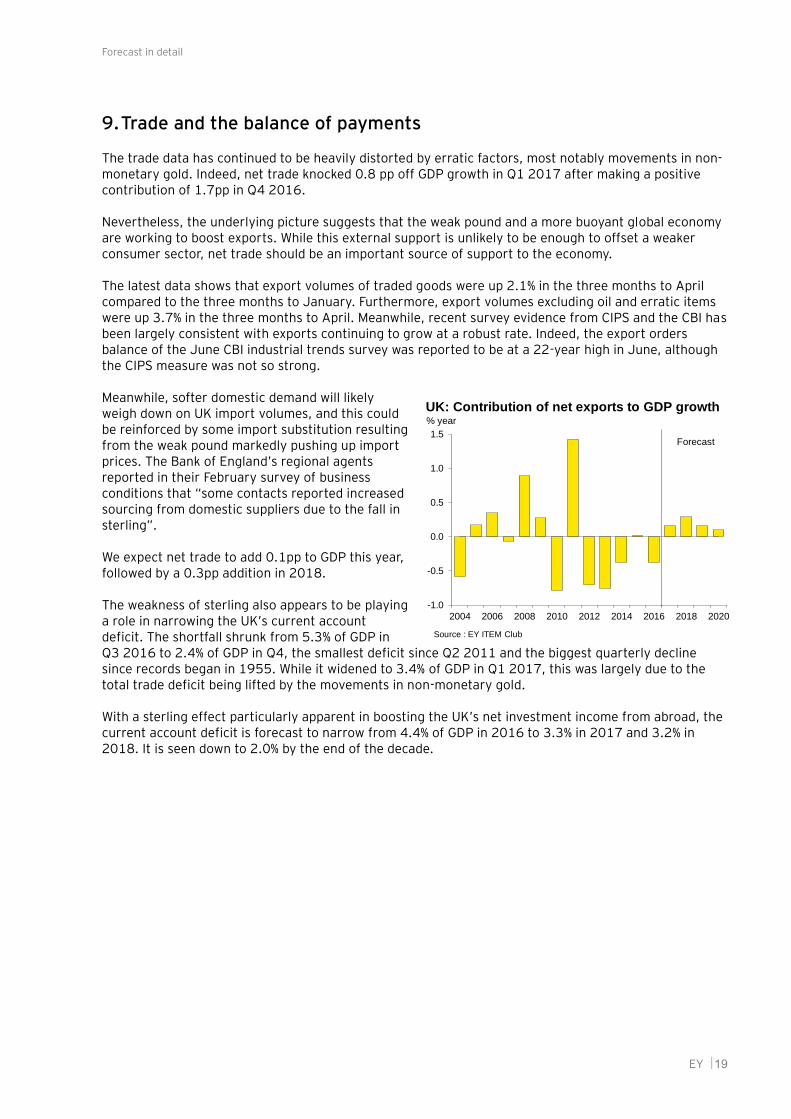
The trade data has continued to be heavily distorted by erratic factors, most notably movements in non-monetary gold. Indeed, net trade knocked 0.8 pp off GDP growth in Q1 2017 after making a positive contribution of 1.7pp in Q4 2016.
Nevertheless, the underlying picture suggests that the weak pound and a more buoyant global economy are working to boost exports. While this external support is unlikely to be enough to offset a weaker consumer sector, net trade should be an important source of support to the economy.
The latest data shows that export volumes of traded goods were up 2.1% in the three months to April compared to the three months to January. Furthermore, export volumes excluding oil and erratic items were up 3.7% in the three months to April. Meanwhile, recent survey evidence from CIPS and the CBI has been largely consistent with exports continuing to grow at a robust rate. Indeed, the export orders balance of the June CBI industrial trends survey was reported to be at a 22-year high in June, although the CIPS measure was not so strong.
Meanwhile, softer domestic demand will likely weigh down on UK import volumes, and this could be reinforced by some import substitution resulting from the weak pound markedly pushing up import prices. The Bank of England’s regional agents reported in their February survey of business conditions that “some contacts reported increased sourcing from domestic suppliers due to the fall in sterling”.
We expect net trade to add 0.1pp to GDP this year, followed by a 0.3pp addition in 2018.
The weakness of sterling also appears to be playing a role in narrowing the UK’s current account deficit. The shortfall shrunk from 5.3% of GDP in Q3 2016 to 2.4% of GDP in Q4, the smallest deficit since Q2 2011 and the biggest quarterly decline since records began in 1955. While it widened to 3.4% of GDP in Q1 2017, this was largely due to the total trade deficit being lifted by the movements in non-monetary gold.
With a sterling effect particularly apparent in boosting the UK’s net investment income from abroad, the current account deficit is forecast to narrow from 4.4% of GDP in 2016 to 3.3% in 2017 and 3.2% in 2018. It is seen down to 2.0% by the end of the decade.
-1.0
-0.5
0.0
0.5
1.0
1.5
2004 2006 2008 2010 2012 2014 2016 2018 2020
UK: Contribution of net exports to GDP growth% year
Source : EY ITEM Club
Forecast
EY | Assurance | Tax | Transactions | Advisory
Ernst & Young LLP
ey.com/uk/item
About EY
EY is a global leader in assurance, tax, transaction and advisory services. The insights and quality services we deliver help build trust and confidence in the capital markets and in economies the world over. We develop outstanding leaders who team to deliver on our promises to all of our stakeholders. In so doing, we play a critical role in building a better working world for our people, for our clients and for our communities. EY refers to the global organization, and may refer to one or more, of the member firms of Ernst & Young Global Limited, each of which is a separate legal entity. Ernst & Young Global Limited, a UK company limited by guarantee, does not provide services to clients. For more information about our organization, please visit ey.com.
About EY ITEM Club
EY ITEM Club is the only non-governmental economic forecasting group to use the HM Treasury’s model of the UK economy. ITEM stands for Independent Treasury Economic Model. HM Treasury uses the UK Treasury model for its UK policy analysis and Industry Act forecasts for the Budget. ITEM’s use of the model enables it to explore the implications and unpublished assumptions behind Government forecasts and policy measures.
Uniquely, ITEM can test whether Government claims are consistent and can assess which forecasts are credible and which are not. Its forecasts are independent of any political, economic or business bias.
The UK firm Ernst & Young is a limited liability partnership registered in England and Wales with Registered number OC300001 and is a member firm of Ernst & Young Global Limited
Ernst & Young LLP, 1 More London Place, London, SE1 2AF.
© ITEM Club Limited. 2017. Published in the UK. All Rights Reserved.
All views expressed in the EY ITEM Club Summer 2017 forecast are those of ITEM Club Limited and may or may not be those of Ernst & Young LLP. Information in this publication is intended to provide only a general outline of the subjects covered. It should neither be regarded as comprehensive or sufficient for making decisions, nor should it be used in place of professional advice. Neither the ITEM Club Limited, Ernst & Young LLP nor the Ernst & Young ITEM Club accepts any responsibility for any loss arising from any action taken or not taken by anyone using this material. If you wish to discuss any aspect of the content of this newsletter, please talk to your usual Ernst & Young contact.
This document may not be disclosed to any third party without Ernst & Young’s prior written consent.
Reproduced with permission from ITEM Club Limited