Embed Size (px)
Citation preview

© 2000 S. KargerAG, Basel
Fax + 41 61 306 12 34E-Mail [email protected] Accessible online at:www.karger.com www.karger.com/journals/bbe
Eye Design and Color Signalingin a Stomatopod CrustaceanGonodactylus smithii
Chuan-Chin Chiaoa Thomas W. Cronina N. Justin Marshallb
aDepartment of Biological Sciences, University of Maryland, Baltimore County, Baltimore, Md., USA;bVision Touch and Hearing Research Center, University of Queensland, St. Lucia, Queensland, Australia
Original Paper
Brain Behav Evol 2000;56:107–122
Chuan-Chin ChiaoDepartment of Biological Sciences, University of Maryland, Baltimore County1000 Hilltop Circle, Baltimore, MD 21250 (USA)Tel. +1 410-455-3449, Fax +1 410-455-3875E-Mail [email protected]
Key WordsEye design • Color signaling • Color vision •
Stomatopod • Gonodactylus smithii
AbstractMany species of stomatopod crustaceans have multiplespectral classes of photoreceptors in their retinas. Behav-ioral evidence also indicates that stomatopods are capa-ble of discriminating objects by their spectral differencesalone. Most animals use only two to four different typesof photoreceptors in their color vision systems, typicallywith broad sensitivity functions, but the stomatopodsapparently include eight or more narrowband photore-ceptor classes for color recognition. It is also known thatstomatopods use several colored body regions in socialinteractions. To examine why stomatopods may be so‘concerned’ with color, we measured the absorptionspectra of visual pigments and intrarhabdomal filters,and the reflectance spectra from different parts of thebodies of several individuals of the gonodactyloid stom-atopod species, Gonodactylus smithii. We then applied amodel of multiple dichromatic channels for color encod-ing to examine whether the finely tuned color vision wasspecifically co-evolved with their complex color signals.Although the eye design of stomatopods seems suitablefor detecting color signals of their own, the detection ofcolor signals from other animals, such as reef fishes, canbe enhanced as well. Color vision in G. smithii is there-
fore not exclusively adapted to detect its own color sig-nals, but the spectral tuning of some photoreceptors(e.g. midband Rows 2 and 3) enhances the contrast ofcertain color signals to a large enough degree to makeco-evolution between color vision and these rather spe-cific color signals likely.
Copyright © 2000 S. Karger AG, Basel
Introduction
The color vision systems of animals vary in the numberof distinct spectral classes of photoreceptors that are used toextract chromatic information from the outside world. Obvi-ously, two different spectral types of photoreceptor cells area minimum requirement for color vision. Beyond this mini-mum, one might ask how much information can be gainedby acquiring additional photoreceptor classes in the retina,and what limits the number of classes. Based on Barlow’s[1982] consideration of photoreceptor spectral bandwidth,trichromacy extracts almost all possible spectral informa-tion in the range 400 to 700 nm. Indeed, most animals (bothvertebrates and invertebrates) known to have color visionhave 2 to 4 different types of photoreceptors. For example,typical mammals have two [Jacobs, 1993], most primatesand honeybees have three [Menzel and Backhaus, 1991;Jacobs, 1991], and most birds, reptiles and many fisheshave four; the fourth photoreceptor often accompanying anexpansion of the color vision system to include UV [Gold-

smith, 1990; Neumeyer, 1991; Vorobyev et al., 1998]. How-ever, stomatopods (mantis shrimps) have been found tohave as many as sixteen different types of photoreceptors,and at least eight of these are involved in color vision[Cronin and Marshall, 1989a, b; Marshall et al., 1991a, b,1994; Cronin et al., 1994c]. Behavioral studies [Marshall etal., 1996] have also shown, unsurprisingly, that stomatopodshave true color vision – objects can be distinguished bystomatopods using only chromatic information. These resultsimmediately raise the following question: Why do theseanimals have so many different types of photoreceptors, i.e.what advantages might this visual system have?
Osorio et al. [1997] have postulated that these eight nar-row-band spectral classes may help stomatopods to achievecolor constancy in environments where illuminants are spa-tially and temporally variable. Based on theoretical calcula-tions of modeled spectra, Osorio et al. [1997] showed that aphotoreceptor pair with narrow-band spectral sensitivities,like that found in each row of the midband, can detect colorsignals more reliably than a photoreceptor pair that has typ-ically broad-band spectral sensitivities. This reliability ofdetecting color signals is especially crucial for animals suchas stomatopods that use color for their intraspecific commu-nication under various conditions of illumination [Caldwelland Dingle, 1975, 1976]. In this study, we consider in detailthe possibility that stomatopod color vision systems mayalso function to enhance the detection of color signalsreflected from the bodies of the animals themselves.
Gonodactylus smithiiis a brightly colored species, livingin the shallow, clear, tropical waters of the Indo-Pacific.During intraspecific communication, individuals of this spe-cies display brightly colored spots on their raptorial limbsand telsons [Caldwell and Dingle, 1975, 1976; Hazlett,1979]. The perception of color signals may play a major rolein determining the status of stomatopods during agonisticinteractions and in recognizing conspecifics during male-female interactions [Caldwell and Dingle, 1975; Hazlett,1979]. It has long been speculated that color signals of ani-mals co-evolve with their sensory systems [Endler, 1992,1993]. However, there is no conclusive evidence to supportthat speculation anywhere except in bioluminescent signal-ing [Partridge and Douglas, 1995; Cronin et al., 2000]. Inthis study, we examined potential color signals from severalindividual mantis shrimps, as well as from various reeffishes that G. smithiimay encounter in its natural habitats,to investigate whether vision in this species is specialized toenhance its own color signals above other color signals fromneighboring animals such as reef fishes.
To study color detection in G. smithii,we first computedthe spectral sensitivity functions of all different photoreceptor
classes involved in color vision, namely those in main rhab-doms of Rows 1–4 in the midband (see fig. 1 for a diagram ofthe retina of G. smithii). The reflectance spectra and multi-spectral images of various body parts from several indi-viduals were also measured, as well as various reflectancespectra of reef fish colors [Marshall, 2000]. Using a modelof multiple dichromatic channels for color encoding in sto-matopods proposed by Marshall et al. [1996], we estimatedthe chromaticities in four ommatidial rows (Rows 1 to 4)of the midband of G. smithiito test the following hypothesis:The color vision system of G. smithii enhances the detec-tion (i.e. the chromaticity) of intraspecific color signals.Note that we use color signals strictly to represent the spec-tral variation of body colors throughout this study, and chro-maticity is used to denote color information encoded in thechromatic channel. The possibility of co-evolution of bodycoloration and the eye designs in stomatopods will be dis-cussed in the context of animal communication.
Materials and Methods
Animals and Experimental PreparationIndividuals of Gonodactylus smithiiof both sexes were collected
from Coconut Reef flat, near Lizard Island Research Station (Queens-land, Australia), in August of 1997 and 1998. All animals are low inter-tidal animals that probably never experienced ambient light at depthsexceeding 3 m. Animals were generally maintained in the laboratoryfor brief periods before examination and measurement. In the labora-tory, animals were kept in marine aquaria at ≈25°C illuminated bydaylight fluorescent lamps and fed fresh and frozen shrimp.
MicrospectrophotometryAbsorption spectra of visual pigments and intrarhabdomal filters
were obtained using techniques described previously by Cronin andForward [1988], Cronin and Marshall [1989a] and Cronin et al.[1994a, b]. In brief, eyes were removed from animals dark-adaptedovernight or longer, and were immediately flash-frozen using cryo-genic spray. Frozen eyes were mounted in a cryostat at ≈ –30 °C andsectioned at a thickness of 14 µm. Individual retinal sections weremounted in pH 7.5 marine crustacean Ringer’s solution containing2.5% glutaraldehyde (visual pigments) or in mineral oil (intrarhabdo-mal filters) within a ring of silicone grease between coverslips formicrospectrophotometry.
The microspectrophotometer (MSP) is of single-beam design,scanning from 400 to 700 nm. A small circular, linearly polarized spot(1.5 µm or 5 µm in diameter) was placed in the material to be scanned.Retinal location was ascertained using the characteristic structure ofstomatopod retinas [Marshall et al., 1991a]. A reference scan was firsttaken in a clear region of the specimen, followed by a measurementscan in the material of interest. Intrarhabdomal filters were identifiedand positioned under white light and the spectrum was obtaineddirectly. To measure absorbance spectra of visual pigments, rhabdomswere positioned under dim red illumination (Corning CS 2-61 filter;50% transmission at 619 nm), and two initial scans were made of thedark-adapted rhabdom (to check for physical and photochemical sta-
108 Brain Behav Evol 2000;56:107–122 Chiao/Cronin/Marshall
bility). The rhabdom was then exposed to a photobleaching exposureof bright white light for 2–5 min, using the substage illuminator of thephotometric microscope, and another scan was taken. The differencebetween last two scans was considered to be the absorption spectrumof the photobleachable visual pigment in the rhabdom.
For the best estimate of the spectral position of each type of photo-pigment, all photobleach data from each rhabdom were averaged. Eachresulting curve was tested for fit against rhodopsin template functionsderived by Palacios et al. [1996]. The best fit was defined as thatproducing the least sum of squares of deviations, from 25 nm belowthe wavelength of the maximum absorbance to 75 nm above. For max-
ima below 425 nm, the sum of squares was computed from 400 nm, to75 nm beyond the maximum, and corrected for the reduced number ofsquared deviations. See Cronin and Marshall [1989a] for details.
Computation of Spectral Sensitivity Functions ofRows 1–4 of the MidbandIt has been shown previously that photoreceptors in Rows 1–4 of
the midband of stomatopods are specialized for color vision [Croninand Marshall, 1989b; Marshall et al., 1991b]. For the purpose ofmodeling chromaticities in this study, only the spectral sensitivityfunctions from both tiers of main rhabdoms in Rows 1–4 of the mid-band were considered. The computation of spectral sensitivity func-tions was based on the absorbance spectra of the intrarhabdomal filtersand visual pigments derived above, retinal dimensions of the appropri-ate photoreceptors and filters, and optical data from a closely relatedspecies (Gonodactylus chiragra)in Marshall et al. [1991a]. See Croninet al. [1994c] for details.
Hypothetical Spectral Sensitivity Functions ofRows 1–4 of the MidbandTo test whether color signals can be enhanced by visual systems of
G. smithii, we also generated two sets of hypothetical spectral sensitiv-ity functions of Rows 1–4 of the midband. These hypothetical spectralsensitivity functions represent possible primitive forms of spectralsensitivity functions in stomatopods. Because the tiering and filteringeffects are the main factors that shape spectral sensitivities of Rows1–4 of the midband, our hypothetical spectral sensitivity functionswere computed based on the absorption spectra of the actual visualpigments of G. smithiiand the consideration of (1) no intrarhabdomalfiltering effects for Rows 2 and 3, (2) neither tiering nor filtering effectsfor all Rows 1–4. In the first case, therefore, only filtering by overlyingphotoreceptors acts to tune spectral sensitivity functions in Rows 2 and3 (as is normal in Rows 1 and 4). In the second case, the retina is con-sidered to contain a set of 8 typical, untiered, photoreceptor classes. Bycomparing chromaticities provided by real spectral sensitivity func-tions with those of hypothetical functions, we examine how the spec-tral sensitivities of multiple photoreceptor classes in the midband ofthe eyes of G. smithiiaffect the detection of color signals.
Measurements of Reflectance Spectra and Multispectral Imagesof G. smithiiAll spot measurements of reflectance spectra from various body
parts were made with ‘Sub-Spec’, a custom-built spectroradiometer(Andor Technology/Oriel), and were referenced to a 99% diffuse whitereflection standard [see Marshall et al., 1996, for details]. The reflect-ance spectra reported in this study were obtained from 5 individuals,and include samples from raptorial appendages (both blue and pinkareas, meral spots), maxillipeds, and the orange spots on the last seg-ment of the abdomen.
Multispectral images were recorded from 6 individuals using acustom-made device composed of a CCD camera (Electrim, EDC-1000TE camera, 191× 164 elements, 8 bits resolution) and a variableinterference filter (OCLI semicircular). Typically, we captured 43frames of images at 7 to 8 nm intervals from 405 to 718 nm. Thereflectance spectrum of each pixel in the images was determinedby comparison with white (Spectralon, Labsphere) and black (3% dif-fuse reflector, MacBeth) standards [see Chiao et al., 2000, for details].Comparisons among images collected at different wavelengthsshowed no evidence of systematic magnification or registration errorswithin the resolution of the system [see Osorio et al., 1998]. Multi-
109Eye Design and Color Signaling inStomatopods
Brain Behav Evol 2000;56:107–122
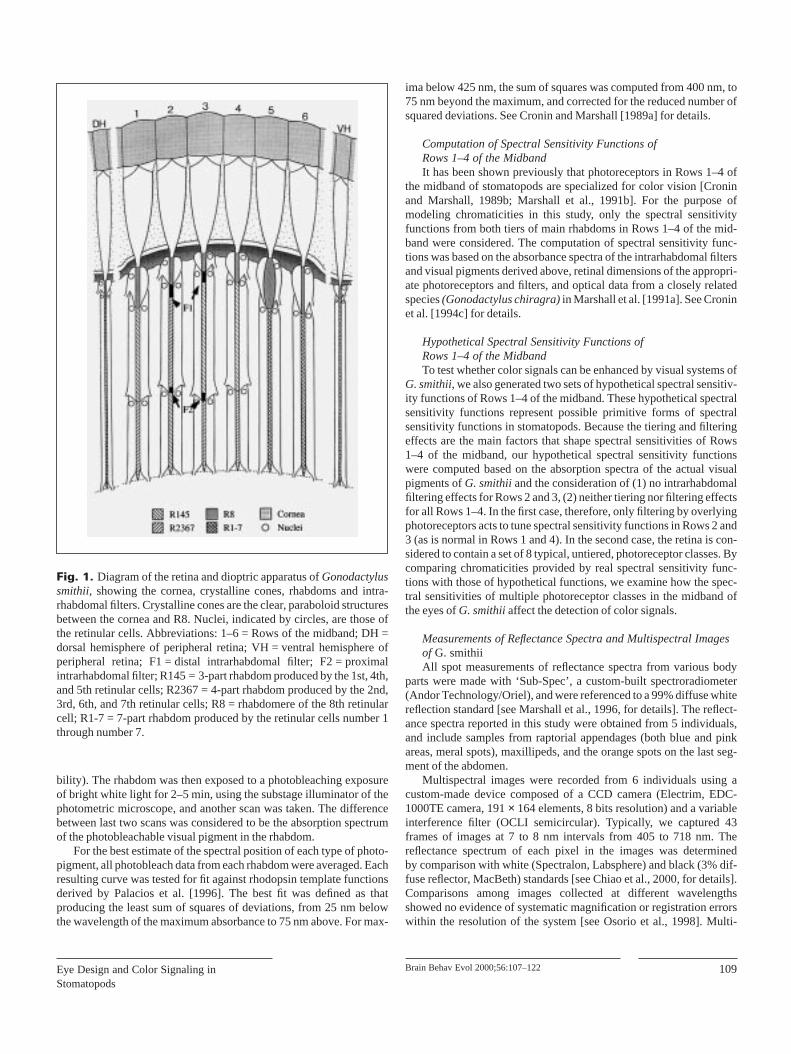
Fig. 1. Diagram of the retina and dioptric apparatus of Gonodactylussmithii, showing the cornea, crystalline cones, rhabdoms and intra-rhabdomal filters. Crystalline cones are the clear, paraboloid structuresbetween the cornea and R8. Nuclei, indicated by circles, are those ofthe retinular cells. Abbreviations: 1–6 = Rows of the midband; DH =dorsal hemisphere of peripheral retina; VH = ventral hemisphere ofperipheral retina; F1 = distal intrarhabdomal filter; F2 = proximalintrarhabdomal filter; R145 = 3-part rhabdom produced by the 1st, 4th,and 5th retinular cells; R2367 = 4-part rhabdom produced by the 2nd,3rd, 6th, and 7th retinular cells; R8 = rhabdomere of the 8th retinularcell; R1-7 = 7-part rhabdom produced by the retinular cells number 1through number 7.

spectral images collected in this study include views of the cephalo-thorax (showing raptorial appendage, maxillipeds, and meral spots),the abdomen, and the tail region (telsons and uropods) of stomatopods.
Calculations of Stomatopod Color Signals inRows 1–4 of the MidbandBased on the observation that axons of both distal and proximal
tiers of each row in the midband project to the same laminar cartridge(the first interneurons in the visual systems of crustaceans), Marshall etal. [1996] suggested that color signals may be processed independentlyin each row of Rows 1–4 at the laminar level. Following this sugges-tion, we predicted the chromaticities that would be given by each row.We first calculated the quantum catch, Qt, of each tier viewing a bodypart of a conspecific animal (Eq. 1),
Qt = ∑I(λ)Rt(λ)S(λ) (1)
where I(λ) is the illuminant spectrum [a CIE standard daylight illu-minant, D65, was used in this analysis to represent the combinationof light from sun and sky; Wyszecki and Stiles, 1982], Rt(λ) is thereflectance spectrum of a particular body part, and S(λ) is the spectralsensitivity function of each tier of Rows 1–4 of the midband. Thesummation is over the range of 400–750 nm for the Sub-Spec data, and405–718 nm for the multispectral imaging data.
To restrict responses to the middle part of each receptor’s operatingrange, all photoreceptors were considered to be adapted to the back-ground. The quantum catch for a tier viewing the background, Qb, isgiven by Eq. 2
Qb = ∑I(λ)Rb(λ)S(λ) (2)
Here we define the spectrum of the background Rb(λ) as thatreflected from a 10% neutral density reflector for the Sub-Spec data, oras the average of all reflectance spectra in the image for the multispec-tral imaging data.
Thus, the adapted neural response, P, of each tier can be computedby dividing Qt by Qb (Eq. 3).
P = Qt/Qb (3)
By dividing by the quantum catch of the background, we are able toaccess the responses without regard to an overall illumination level.This is analogous to a von Kries adaptation mechanism [von Kries,1905], where the response of each photoreceptor class is normalizedindependently.
The chromaticity, C, in each row (of Rows 1–4) of the midband isdefined as the difference between the responses of distal, Pdist, andproximal tiers, Pprox.
C = log Pdist – log Pprox (4)
Note that the use of a logarithmic scale of response in each tier issimply to give a biologically realistic dynamic range for chromaticityestimation, and that the logarithmic subtraction is equivalent to divi-sion of the two responses. In the computation of chromaticities fromthe Sub-Spec data, the signs of chromaticities were made positive tosimplify comparison (see fig. 6, 9). In the calculation of chromaticitiesfrom the multispectral imaging data, the signs of chromaticities wereleft intact for adjusting suitable dynamic ranges (see fig. 7).
Calculations of Reef Fish Color Signals inRows 1–4 of the MidbandOver 1,000 reflectance spectra (including 200 species from 36 fam-
ilies) of reef fishes collected from Great Barrier Reef were used in
this study [see Marshall, 2000, for detail]. Chromaticities in Rows 1–4of the midband viewing 26 subjective categories of reef fish colorswere computed individually using the same formula described above(Eqs. 1–4). Both real and hypothetical sensitivity spectra of G. smithiiwere used in the computation of chromaticities. Results were com-pared to examine whether the vision systems of stomatopods can alsoenhance the detection of color signals from reef fishes.
Results
Our primary objective was to examine the relationshipbetween the color signals and the color vision system of thegonodactyloid stomatopod species, Gonodactylus smithii.To do this, we required objective assessments both of colorsignals and of the color vision system [see Endler, 1990].We characterized the visual system of G. smithiiand mea-sured potential color signals from conspecific individualsand reef fishes. Thus, the chromaticities which stomatopodsmight obtain using their visual systems can be objectivelyevaluated.
Absorption Spectra of Visual Pigments andIntrarhabdomal FiltersThe retinas of Gonodactylus smithiiinclude 11 classes of
photoreceptors below the level of the 8th retinular cell: twotiered classes in each midband row from Row 1 to Row 4plus the main rhabdoms of midband Row 5 and 6 and of theperipheral retina (see fig. 1). We examined each class ofphotoreceptor in retinas of this species, and identified a totalof 10 different visual pigments (fig. 2a–f). The distributionof visual pigments throughout the retina was qualitativelysimilar to what is observed in other stomatopods with 6-rowmidbands [Cronin and Marshall, 1989a; Cronin et al., 1993,1994a, 1996].
Stomatopod crustaceans in the superfamily Gonodacty-loidea generally have 4 classes of intrarhabdomal filters intheir retinas: distal Row 2, proximal Row 2, distal Row 3and proximal Row 3 [Marshall, 1988; Marshall et al., l991b;Cronin et al., 1994b]. G. smithiihas all 4 types (fig. 2g, h).These 4 classes of intrarhabdomal filters can significantlyshift and narrow the spectral sensitivity functions of photo-receptors in Rows 2 and 3 [Cronin et al., 1993, 1994c].
Spectral Sensitivity Functions ofRows 1–4 of the MidbandWith knowledge of the visual pigments, filter absorption
spectra, dimensions of the various photoreceptor classes,and optical data from a closely related species [Gonodacty-lus chiragra;see Marshall et al., 1991a], the spectral sensi-tivity functions of Rows 1–4 of the midband can be com-
110 Brain Behav Evol 2000;56:107–122 Chiao/Cronin/Marshall

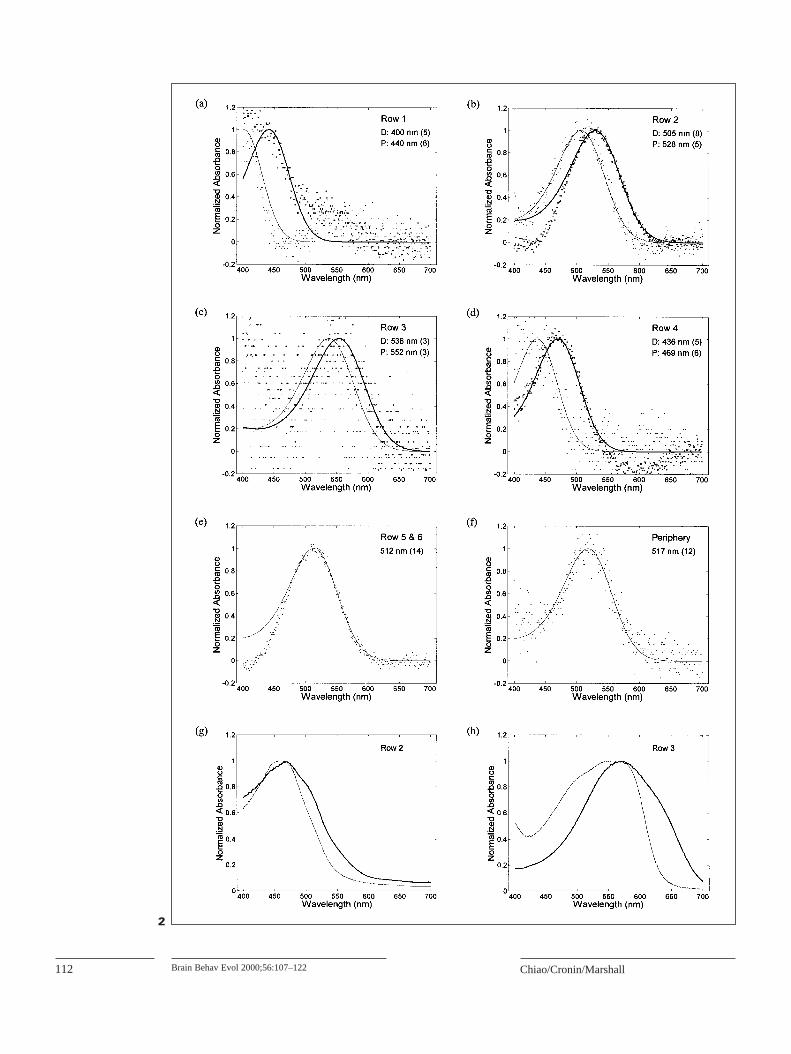
puted (fig. 3a). The distribution of spectral sensitivitiesthroughout the Rows 1–4 has the typical gonodactyloid pat-tern [see Cronin et al., 1994c]. Each ommatidium of mid-band Rows 1–4 has a pair of spectrally narrow classes sepa-rated by 30 to 60 nm at their peaks; the proximal tier issensitive at longer wavelengths than the distal tier (fig. 3a).
For modeling, we sharpened the spectral sensitivity func-tions of Rows 1 and 4 distal main rhabdoms (R1D and R4D;fig. 3a) of G. smithiion the short wavelength side. As Mar-shall et al. [1996] pointed out, all midband sensitivities ofstomatopods are now believed to have approximately thesame shape due to distal filtering. Note that the wavelengthrange of the spectral sensitivity functions of Rows 1–4(fig. 3) are provided from 400–750 nm. The spectral rangeof our MSP data only extended to 700 nm, so the longwavelength limb of the spectral sensitivity function of R3P(fig. 3a) was generated by symmetric flip-over of the shortwavelength limb.
Two sets of hypothetical spectral sensitivity functionswere generated by removing the absorption spectra of intra-rhabdomal filters in Rows 2 and 3 from computation, and byremoving all tiering and filtering effects from modeling,respectively (fig. 3b, c). Due to the lack of intrarhabdomalfiltering in Rows 2 and 3, the spectral sensitivity functionsof distal tiers of these 2 rows now become broader, and shiftto shorter wavelengths than actual functions (fig. 3a, b). Thebandwidths of spectral sensitivity functions of proximaltiers of Rows 2 and 3 remain narrow (due to the tieringeffect), but their values of λmax also shift to shorter wave-lengths compared to actual functions (fig. 3a, b). In the con-dition where all effects of tiering and filtering are excluded(fig. 3c), all spectral sensitivity functions resemble theabsorption spectra of rhodopsin-based visual pigments,which have relatively broad bandwidths.
Reflectance Spectra and Multispectral Images ofG. smithiiReflectance spectra of 5 different locations on the bodies
of G. smithiiare illustrated in figure 4. These measurementsinclude meral spots, maxillipeds, raptorial appendages, andthe orange spots on the last segment of the abdomen, all ofwhich are thought to be used possibly in intraspecific sig-naling. Reflectance spectra at the same location were mea-sured from 1 to 5 different individuals, and vary slightly(fig. 4). Note that reflectance spectra of meral spots havebeen separated into two categories due to the large differ-ences measured among individuals. Also note that mostreflectance spectra of G. smithiihave sharp increases in thespectral range above 700 nm, quite unlike the spectra ofmost reef fish colors described below (fig. 8).
Multispectral images we recorded include the cephalo-thorax (showing the raptorial appendage, maxillipeds, andmeral spots), the abdomen, and the tail region (telsons anduropods) of G. smithii (fig. 5). Each pixel in these multi-spectral images represents a full reflectance spectrum from405 to 718 nm. Thus, a total of 31,324 (191× 164) reflec-tance spectra (including the animal body and background)can be simultaneously recorded. Reflectance spectra mea-sured using Sub-Spec or the multispectral imaging deviceare similar or identical. Images in figure 5 are compositecolor images of 3 single frames of multispectral images(452, 548, and 649 nm), and are included to illustrate theappearance of these areas to the human visual system.
Color Signals of Stomatopods Viewed byRows 1–4 of the MidbandWe computed the chromaticities in Rows 1–4 of the mid-
band when viewing certain body parts of conspecific ani-mals (see Eqs. 1–4 in Methods). The largest chromaticities(fig. 6; black bars) calculated when using ‘real’ sensitivityspectra (fig. 3a) in each location vary among Rows 1–4 ofthe midband. For example, Row 2 produces the largest chro-maticities for maxillipeds, the orange spot on the last seg-ment of the abdomen and the pink area on the raptorial limb.Row 3 can generate the largest chromaticities for meral spot(I), whereas Rows 1 and 4 may produce chromaticitiesslightly better than Rows 2 and 3 in meral spot (II) and theblue area on the raptorial limb. The color processing ofstomatopods has not yet been studied, but these results indi-cate that different color signals may be emphasized by dif-ferent rows.
To test the hypothesis that the narrow band spectralsensitivity functions of G. smithii enhance the detectionof color signals from conspecific animals, we comparedthe chromaticities of Rows 1–4 of the midband using real(fig. 3a) and two hypothetical (fig. 3b, c) sets of spectralsensitivity functions that vary in a number of ways. Chro-maticities produced by receptor pairs with real, narrow-bandspectral sensitivity functions (fig. 3a) are greater than thoseproduced by receptors with untiered and unfiltered spectralsensitivity functions (fig. 3c, 6, black vs. white bars). On theother hand, chromaticities in Row 2 of the midband areincreased by intrarhabdomal filtering when viewing allareas (Row 2 in fig. 6, black vs. gray bars), but chromatici-ties in Row 3 of the midband are actually decreased byintrarhabdomal filtering when viewing the pink area of theraptorial limbs and the orange spots on the last segment ofthe abdomen, although they are increased by intrarhabdomalfiltering when viewing meral spot (I) (Row 3 in fig. 6, blackvs. gray bars). It is worthwhile to note that intrarhabdomal
111Eye Design and Color Signaling inStomatopods
Brain Behav Evol 2000;56:107–122
112 Brain Behav Evol 2000;56:107–122 Chiao/Cronin/Marshall
2

filtering in Row 3 greatly increases the chromaticities frommeral spots (I), producing the largest signals of any row atthat location. Note that meral spots are considered to beamong the most important features for signaling in stomato-pod communication.
To demonstrate how the patterns of color-contrast thatG. smithii displays might appear when viewed by conspe-cific animals, we took advantage of multispectral imaging,that includes both spectral and spatial information. Based onthe same computation of chromaticities for Rows 1–4 of themidband described above (see also Eqs. 1–4 in Methods),we calculated chromaticities of all pixels in the images, rep-resenting them by the intensity value at that pixel in eachimage. To facilitate the interpretation of these images, theintensity values in the images are scaled according to themaximum and minimum values of chromaticities in theimages of all rows and then expanded to a 0–255 gray scale
113Eye Design and Color Signaling inStomatopods
Brain Behav Evol 2000;56:107–122
Fig. 2. Absorption spectra of visual pigments and intrarhabdomal fil-ters of Gonodactylus smithii.a–f Normalized average spectra for pho-tobleaching of visual pigments in all retinal regions below the level ofthe rhabdomere of the 8th retinular cell. Mean absorbance change from651 to 700 nm is set to 0 in each curve. Retinal location and number ofphotobleaches included in the curve are indicated in the upper rightpart of each panel. The smooth curves represent the best-fit templatespectrum (see text), with the λmax for each curve given on the panel. Inthe 4 dorsal tiered ommatidial rows of the midband (Rows 1–4), data ofboth tiers are given; the proximal tier is represented by the small pointsand thin curve, whereas the distal tier is represented by the large pointsand thick curve. Data from ventral 2 rows of the midband (Rows 5–6)are combined, as these ommatidia contain identical visual pigments.D = Distal tier; P = proximal tier. g–h Normalized average absorptionspectra for the intrarhabdomal filters of Rows 2 and 3 in the midband.Distal filters are plotted with thin lines and proximal filters with thicklines. Maximum absorbances for these filters are as follows: Row 2 dis-tal, 1.68; Row 2 proximal, 6.64; Row 3 distal 0.88; Row 3 proximal,6.67.Fig. 3. Spectral sensitivities of photoreceptors of Gonodactylussmithii.a Normalized spectral sensitivities of both distal tiers (D) andproximal tiers (P) of Rows 1 to 4 of the midband of G. smithii. Thesespectral sensitivities were computed based on the microspectrophoto-metric measurements of visual pigments and filters, and optical data(see text for details). Distal tiers are plotted with thin curves or markers,and proximal tiers with thick curves or markers. b Hypothetical spec-tral sensitivities of both tiers of Rows 1–4 of the midband of G. smithii,without the effect of intrarhabdomal filtering in Rows 2 and 3. Notethat the spectral sensitivities of Rows 1 and 4 remain intact as in a.Spectral sensitivities of Rows 2 and 3 become broader (especially thedistal tiers), and λmax shifts to shorter wavelengths. c Hypotheticalspectral sensitivities of both tiers of Rows 1–4 of the midband ofG. smithii, without both the filtering (intrarhabdomal filters and R8cells) and tiering effects. Spectral sensitivities of all tiers becomebroader, and λmaxalso shifts to shorter wavelengths in most classes. 3

display (fig. 7). The lighter areas in the images indicate thatthe responses of distal tiers are larger than those of proximaltiers, and the darker areas in the images represent responsesof proximal tiers that are larger than those of distal tiers (thesigns chosen here are arbitrary). Backgrounds in the imagesare generally gray, showing little or no difference betweenthe responses of distal and proximal tiers (this is a naturalconsequence of the fact that the receptors are adapted to theoverall intensity of the image, as in Eq. 3).
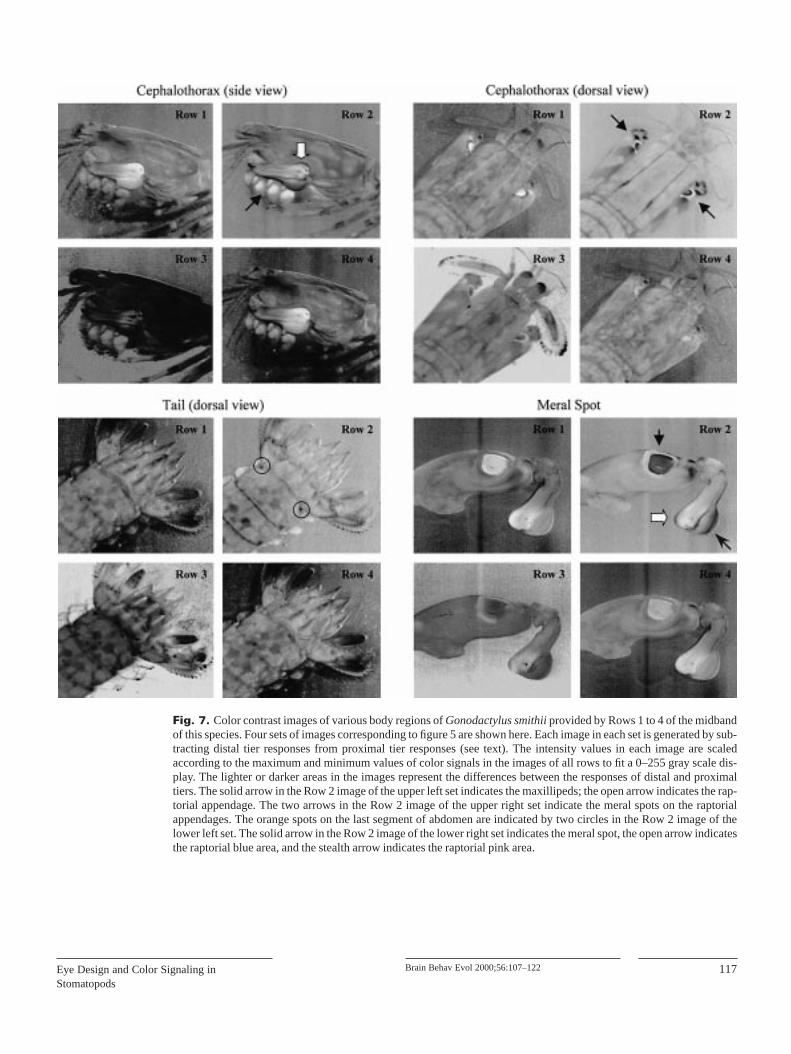
In the multispectral images, color signals from many dif-ferent locations can be compared simultaneously. WhenG. smithiiviews the cephalothorax of a conspecific animalfrom the side (fig. 7, the upper left set), the chromaticitiesin Rows 1 and 4 obviously enhance regions of the raptorialappendages, whereas those in Row 2 significantly highlight
parts of the maxillipeds (solid arrow in the Row 2 image ofthe upper left set of fig. 7). Although the chromaticities inRow 3 also slightly emphasize the maxillipeds, the enhance-ment is far less dramatic than that available in the Row 2signals. When G. smithiiviews the cephalothorax of a con-specific animal from above (fig. 7, the upper right set), theimages produced by Rows 1 and 2 have higher contrasts formeral spots (two solid arrows in the Row 2 image of theupper right set of fig. 7) than those produced by Rows 3 and4. In our multispectral imaging system, reflectance spectraof stomatopods can be collected only up to 718 nm. Notethat meral spot (I) reflects strongly above 718 nm (seefig. 4). As a result, the chromaticities in Row 3 may beunderestimated in multispectral images. When G. smithiiviews the tail fan (telsons and uropods) of a conspecific ani-
114 Brain Behav Evol 2000;56:107–122 Chiao/Cronin/Marshall
Fig. 4. Reflectance spectra measured fromvarious locations on the bodies of Gonodacty-lus smithii.Location names are indicated onthe top of each panel. Each curve in the panelrepresents one reflectance measurement froma single animal. Number of animals measuredfor different locations varies from 2 (meralspot II and raptorial blue) to 5 (orange spot).

mal (fig. 7, the lower left set), the appearance of orangespots (circled in the Row 2 image of the lower left set offig. 7) is enhanced primarily in the chromaticities in Rows 2(especially) and 3; they are essentially invisible in the chro-maticities in Rows 1 and 4. Finally, when G. smithiiviewsthe medial portion of the raptorial appendage of a conspe-cific animal (fig. 7, the lower right set), the meral spot isstrongly enhanced by chromaticities produced in all rows.Again, the spectral limitation of our imaging device mightcause an underestimation of chromaticities in Row 3. Inaddition, the chromaticities in Rows 1 and 4 also emphasizethe blue areas of the raptorial appendages (open arrow in theRow 2 image of the lower right set of fig. 7), which are notapparent in the chromaticities in Rows 2 and 3.
Color Signals of Reef Fishes Estimated fromRows 1–4 of the MidbandSix out of 26 subjective categories of reef fish colors
[Marshall, 2000] are shown in figure 8. In each category,only 5 reflectance spectra are plotted. Note that the reflect-ance spectra of most fish colors, unlike stomatopod colors,
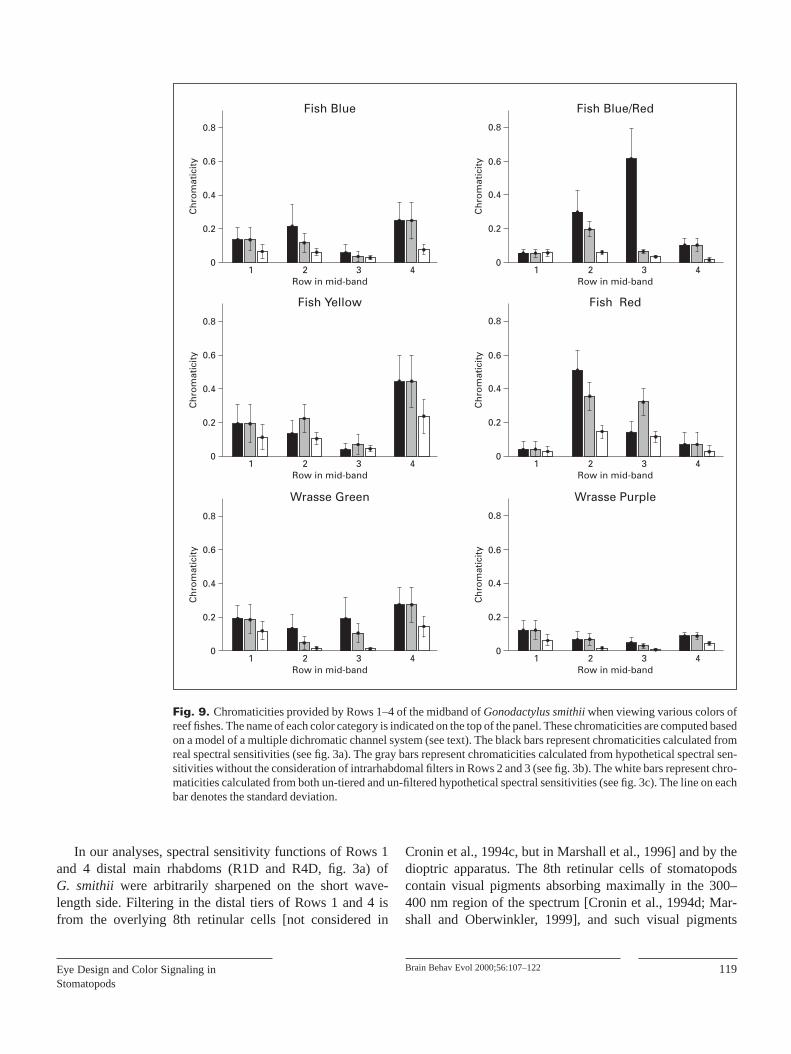
are flat above 700 nm, except for ‘wrasse purple’ and some‘wrasse green’ (fig. 8). Furthermore, the color vision systemof G. smithiienhances color contrast not only of its own sig-nals (fig. 6), but those of reef fishes as well (fig. 9, black vs.white bars), to degrees that vary among the midband rows.However, intrarhabdomal filtering in Rows 2 and 3 does notalways increase the total chromaticities of reef fish colors(fig. 9, black vs. gray bars).
Discussion
Color Vision Systems of StomatopodsIn stomatopods, the color vision system involves at least
eight different classes of photoreceptors in the midbandregion of the retina operating in the visible spectral range[Cronin and Marshall, 1989a; Marshall et al., 1991a]. Inaddition to these, there are multiple UV-sensitive receptorclasses present in the 8th retinular cells [see Cronin et al.,1994d; Marshall and Oberwinkler, 1999]. Comparisons be-tween spectral sensitivity functions of Rows 1–4 (fig. 3a)
115Eye Design and Color Signaling inStomatopods
Brain Behav Evol 2000;56:107–122
Fig. 5. Color images of Gonodactylussmithiiselected from 4 different individuals inour data sets of multispectral images. Eachimage shows various colorful parts of theirbodies (e.g. raptorial appendages, maxil-lipeds, orange spots, uropods, and meralspots). These images were generated by com-bining 3 single frames of multispectralimages (452, 548, and 649 nm). The white barin the lower corner of each panel represents5 mm.

and two hypothetical (possibly primitive) spectral sensitiv-ity functions of Rows 1–4 (fig. 3b, c) show that the span inλmax of the 8 different spectral sensitivities is considerablyincreased by filtering and tiering. In the absence of bothfiltering and tiering, the λmax range is the same as that of the
visual pigments themselves, about 400–550 nm (fig. 3c).However, with filtering and tiering, the values of λmax
extend from 436 to 695 nm (fig. 3a). The filtering and tier-ing effects not only shift the λmax of spectral sensitivities,but also significantly reduce the bandwidths of spectral sen-
116 Brain Behav Evol 2000;56:107–122 Chiao/Cronin/Marshall
Fig. 6. Chromaticities provided by Rows 1–4 of the midband of Gonodactylus smithiiwhen viewing various spots ofthe bodies of conspecifics. Location name of each spot is indicated on the top of the panel. These chromaticities are com-puted based on a model of a multiple dichromatic channel system (see text). The black bars represent chromaticities cal-culated from real spectral sensitivities (see fig. 3a). The gray bars represent chromaticities calculated from hypotheticalspectral sensitivities without the consideration of intrarhabdomal filters in Rows 2 and 3 (see fig. 3b). The white barsrepresent chromaticities calculated from both un-tiered and un-filtered hypothetical spectral sensitivities (see fig. 3c).The line on each bar denotes the standard deviation.
117Eye Design and Color Signaling inStomatopods
Brain Behav Evol 2000;56:107–122
Fig. 7. Color contrast images of various body regions of Gonodactylus smithiiprovided by Rows 1 to 4 of the midbandof this species. Four sets of images corresponding to figure 5 are shown here. Each image in each set is generated by sub-tracting distal tier responses from proximal tier responses (see text). The intensity values in each image are scaledaccording to the maximum and minimum values of color signals in the images of all rows to fit a 0–255 gray scale dis-play. The lighter or darker areas in the images represent the differences between the responses of distal and proximaltiers. The solid arrow in the Row 2 image of the upper left set indicates the maxillipeds; the open arrow indicates the rap-torial appendage. The two arrows in the Row 2 image of the upper right set indicate the meral spots on the raptorialappendages. The orange spots on the last segment of abdomen are indicated by two circles in the Row 2 image of thelower left set. The solid arrow in the Row 2 image of the lower right set indicates the meral spot, the open arrow indicatesthe raptorial blue area, and the stealth arrow indicates the raptorial pink area.

sitivity functions, and additionally, decrease the photoncatches of receptors. Thus, the color vision systems of sto-matopods trade photon catch for spectral coverage and nar-row tuning.
There is some speculation that these eight different,narrow-band, spectral sensitivity systems in the retinas ofstomatopods may function as spectral frequency detectors,analogous to hair cells in auditory systems [Marshall et al.,1989; Neumeyer, 1991; Marshall and Oberwinkler, 1999].Despite its attractiveness, there is no physiological evidenceto support this hypothesis directly, as we know very littleabout post-receptor visual processing in stomatopods. Analternative idea is that the spectral information that stomato-pods encounter in their natural environments might include
an unusually high content of high spectral frequency compo-nents [Marshall et al., 1991b, 1996; van Hateren, 1993]. If so,a large number of narrowly tuned spectral classes would berequired to detect this high spectral frequency information.However, analyses of the spectral power distributions of nat-urally occurring spectra [Osorio et al., 1997] show that thecolor signals that stomatopods encounter have typical naturalspectra, with only low-frequency components [Buchsbaumand Gottschalk, 1984; Lythgoe and Partridge, 1989]. Thus,the significance of having so many different color classes ofphotoreceptors in stomatopods seems unclear. Our resultsdemonstrate that besides the improvement of color constancy[Osorio et al., 1997], this multiple receptor system canenhance the detection of intraspecific color signals.
118 Brain Behav Evol 2000;56:107–122 Chiao/Cronin/Marshall
Fig. 8. Reflectance spectra of various reeffish colors. The name of each subjective colorcategory is indicated at the top of each panel[see Marshall, 2000, for details]. Only 5reflectance spectra are plotted for each colorcategory. The number on the top of each panelindicates the actual number of reflectancespectra used in the analyses.
In our analyses, spectral sensitivity functions of Rows 1and 4 distal main rhabdoms (R1D and R4D, fig. 3a) ofG. smithii were arbitrarily sharpened on the short wave-length side. Filtering in the distal tiers of Rows 1 and 4 isfrom the overlying 8th retinular cells [not considered in
Cronin et al., 1994c, but in Marshall et al., 1996] and by thedioptric apparatus. The 8th retinular cells of stomatopodscontain visual pigments absorbing maximally in the 300–400 nm region of the spectrum [Cronin et al., 1994d; Mar-shall and Oberwinkler, 1999], and such visual pigments
119Eye Design and Color Signaling inStomatopods
Brain Behav Evol 2000;56:107–122
Fig. 9. Chromaticities provided by Rows 1–4 of the midband of Gonodactylus smithiiwhen viewing various colors ofreef fishes. The name of each color category is indicated on the top of the panel. These chromaticities are computed basedon a model of a multiple dichromatic channel system (see text). The black bars represent chromaticities calculated fromreal spectral sensitivities (see fig. 3a). The gray bars represent chromaticities calculated from hypothetical spectral sen-sitivities without the consideration of intrarhabdomal filters in Rows 2 and 3 (see fig. 3b). The white bars represent chro-maticities calculated from both un-tiered and un-filtered hypothetical spectral sensitivities (see fig. 3c). The line on eachbar denotes the standard deviation.
could potentially act as filters of the short wavelength limbsof the relatively short wavelength R1D and R4D visual pig-ments. The long wavelength limb of the spectral sensitivityfunction of Row 3 proximal main rhabdom of G. smithii(R3P, fig. 3a) was also generated by symmetric flip-over ofthe short wavelength limb to extend the spectral range up to750 nm. Comparison between the shape of spectral sensitiv-ity functions of R3P generated here and measured electro-physiologically from a closely related species (Neogono-dactylus oerstedii)showed that this approach is justified.
In the lamina ganglionaris (the first layer of interneuronsbeneath the retina) of another gonodactyloid stomatopodspecies, Odontodactylus scyllarus,the axons of the twomain rhabdomal tiers of each ommatidium in Rows 1–4 ofthe midband are projected onto the same lamina cartridge[Marshall and Horwood, unpubl. results]. This organizationsuggests that chromatic signal comparison in stomatopodsmay begin at the level of the lamina. Although there is nodirect electrophysiological evidence to support such chro-matic processing, other lines of evidence from crayfishesand stomatopods indicate the possibility of polarized lightopponent processing in the lamina [Sabra and Glantz, 1985;Marshall et al., 1991a]. It might be that the neural wiringthat is responsible for the opponent processing of polarizedlight signals is similarly used for opponent processing ofcolor in Rows 1–4 of stomatopods [Marshall et al., 1996].Based on the assumption of chromatic opponent processing,a model of multiple dichromatic channels for color visionof stomatopods was proposed by Marshall et al. [1996].Although further investigation is necessary to validate thismodel, it is a reasonable first step to assume that chromaticsignals are initially processed in four parallel dichromaticchannels. Thus, this model allows us to estimate chromatic-ities that visual channels arising from Rows 1–4 of the mid-band might produce when viewing conspecific animals.
Marshall and Oberwinkler [1999] have found recentlythat there are multiple UV photoreceptors in the eye ofOdontodactylus scyllarus(a closely related species), but theinvolvement of these UV sensitive 8th retinular cells incolor vision of stomatopods is not clear. Neuroanatomicalevidence also indicates that the axons of the 8th retinularcells bypass the lamina cartridge and project directly ontothe medulla layer [Marshall and Horwood, unpubl. results].Furthermore, our multispectral imaging measurement iscurrently limited to the visible range. Thus, color vision ofG. smithii in the UV range is not considered in this study.
The simple algorithm of estimating chromaticities usedin this study (Eqs. 1–4) is widely used in studies of animalcolor vision systems. It includes the considerations of vonKries adaptation (Eq. 3) and opponent interaction of recep-
tor inputs (Eq. 4). Although the weighting functions of chro-matic coding for an interaction between responses of twotiers in each dichromatic channel are not known, reasonablevariations in these numbers affect our results only slightly.Furthermore, although we use a logarithmic scale in com-puting color signals (Eq. 4) to approximate the physiologi-cal responses, a simple linear estimation gives similarresults. In general, the approach used here provides a robustway to estimate chromaticities in the color vision system ofstomatopods.
Eye Design and Color SignalingColor signals seem to be very important in the communi-
cation systems of stomatopods [Caldwell and Dingle, 1975,1976; Hazlett, 1979]. Thus, one function of the unusualeye design of stomatopods might be to perceive reliablecolor signals or to increase fine color discrimination ofconspecifics (or heterospecifics) under various illuminationconditions underwater [Osorio et al., 1997; Marshall andOberwinkler, 1999]. Stomatopods are not closely related todecapod crustaceans and they appear to have branched offfrom the leptostracan stock some 400 million years ago.Their visual systems have evidently evolved in uniquedirections since that time, trading photon catch and overallsensitivity for increased spectral range and color constancy[Marshall et al., 1996; Osorio et al., 1997; Marshall andOberwinkler, 1999].
In animal communication systems, receiving mecha-nisms can evolve in directions that improve the detectabilityof information [Endler, 1993]. This implies that biologicalsignals affect the evolution of sensory systems. Good exam-ples include the calling signals of cricket frogs [Wilczynskiet al., 1992], the electrical signals of electric fishes [Hop-kins, 1999], and the bioluminescent signals of deep-seafishes [Partridge and Douglas, 1995; Douglas et al., 1998]and fireflies [Lall et al., l988; Cronin et al., 2000], whereconspecific sensory systems are well tuned to improve thedetectability of biological signals. It is interesting that thereare very few potential examples of coevolution of colorvision and color signals aside from bioluminescence. Colorvision is very probably too general a task for it to becomeover specialized. There are possible examples of co-evolu-tion of color vision and color signals in the wavelength-spe-cific behaviors of butterflies, such as oviposition [Kelber,1999]; however, these are hard to assign to specific photo-receptors. Good evidence that other color vision systems areadapted for a general sense of color rather than specificcolor signals comes from bees [Chittka and Menzel, 1992].Based on the comparative studies of spectral sensitivities ofmany different species of bees, Chittka [1996] suggested
120 Brain Behav Evol 2000;56:107–122 Chiao/Cronin/Marshall
that color vision systems of honeybees predate the evolutionof flower colors. Many species of stomatopods, regardlessof their variations in body coloration (some of them haveonly dull colors), all show eight rather similar narrow-bandspectral sensitivity functions in Rows 1–4 of the midband[Cronin and Marshall, 1989a; Cronin et al., 1993, 1994c].Thus, it is unlikely that color vision systems of stomatopodsare designed exclusively to maximize the color signals ofconspecific animals. The examination of color signals ofreef fishes encoded in Rows 1–4 of G. smithii(fig. 9) indi-cates that the narrow spectral sensitivities of G. smithiienhance not only the color signals of conspecific animals,but also the color signals of other animals as well. There-fore, we conclude that the stomatopod eye is designed for avariety of tasks that utilize color vision.
We did find one clear case in which a stomatopod colorsignal is strongly enhanced by a stomatopod visual system.As shown in figures 4 and 6, there are two different varietiesof meral spots (although some intermediate colors of meralspots can occur), one of which gives higher chromaticity inRow 3 than does the other. Because meral spots have beenspeculated to play an important role in agonistic behavior[Caldwell and Dingle, 1975, 1976; Hazlett, 1979], it is pos-sible that the meral spot signals might exploit color visionsystems of G. smithii, and Row 3 may give the best colordiscrimination of various meral spots. Body coloration ofG. smithii can vary significantly depending on the depthsof their habitats [Cronin, Marshall, and Caldwell, unpubl.observ.]. The reflectance spectra of meral spots might alsovary depending on the aggressiveness of different speciesin agonistic behaviors [Caldwell and Dingle, 1975, 1976].
Thus, more measurements of reflectance spectra from vari-ous meral spots in different depths, as well as appropriateethological experiments, are needed in order to clarify therelationship between color signals of meral spots and spec-tral tuning of receptors in Rows 2 and 3.
In conclusion, we measured reflectance spectra andrecorded spectral images from various parts of the bodyof the stomatopod, Gonodactylus smithii.Using a multipledichromatic channel model first suggested by Marshall et al.[1996], we estimated chromaticities in Rows 1–4 of themidband from many body parts of G. smithii. Our resultsindicate that the narrow-band spectral sensitivities of photo-receptors of stomatopods can enhance the contrast of theircolor signals. Similarly, color signals of other reef animals,such as teleosts, can be enhanced by G. smithii’s visual sys-tem as well. Although the stomatopod eye does not exclu-sively enhance conspecific color signals, the specific spec-tral tuning of some photoreceptors (i.e. Rows 2 and 3 in themidband) via filtering might increase the discriminability ofsome behaviorally relevant color signals (e.g. meral spots).Therefore, the color signals of stomatopods might adapt totheir color vision system for maximizing the reliability ofsignal detection in animal communication.
Acknowledgments
We thank Lizard Island Research Station, Australia for assistancewith animal collection, and Daniel Osorio, Misha Vorobyev, and RoyCaldwell for helpful comments on the manuscript. This material isbased on research supported by the National Science Foundation undergrant No. IBN-9724028 (to TWC).
121Eye Design and Color Signaling inStomatopods
Brain Behav Evol 2000;56:107–122
Barlow, H.B. (1982) What causes trichromacy? Atheoretical analysis using combfiltered spectra.Vision Res., 22: 635–643.
Buchsbaum, G., and A. Gottschalk (1984) Chro-maticity coordinates of frequency-limited func-tions. J. Opt. Soc. Am. A, 1: 885–887.
Caldwell, R.L., and H. Dingle (1975) Ecology andevolution of agonistic behavior in stomatopods.Naturwissenschaften, 62: 214–222.
Caldwell, R.L., and H. Dingle (1976) Stomatopods.Sci. Am., 234:80–89.
Chiao, C.-C., T.W. Cronin, and D. Osorio (2000)Color signals in natural scenes: characteristicsof reflectance spectra and effects of natural illu-minants. J. Opt. Soc. Am. A, 17: 218–224.
Chittka, L. (1996) Does bee color vision predate theevolution of flower color? Naturwissenschaf-ten, 83: 136–138.
Chittka, L., and R. Menzel (1992) The evolutionaryadaptation of flower colors and the insect polli-nators’ color vision systems. J. Comp. Physiol.A, 171:171–l8l.
Cronin, T.W., and R.B.J. Forward (1988) The visualpigments of crabs. I. Spectral properties. J.Comp. Physiol. A, 162:463–478.
Cronin, T.W., and N.J. Marshall (1989a) Multiplespectral classes of photoreceptors in the retinasof gonodactyloid stomatopod crustaceans. J.Comp. Physiol. A, 166:261–275.
Cronin, T.W., and N.J. Marshall (1989b) A retinawith at least ten spectral types of photorecep-tors in a mantis shrimp. Nature, 339:137–140.
Cronin, T.W., M. Järvilehto, M. Weckström, andA.B. Lall (2000) Tuning of photoreceptor spec-tral sensitivity in fireflies. J. Comp. Physiol. A,186:1–12.
Cronin, T.W., N.J. Marshall, and R.L. Caldwell(1993) Photoreceptor spectral diversity in theretinas of squilloid and lysiosquilloid stoma-topod crustaceans. J. Comp. Physiol. A, 172:339–350.
Cronin, T.W., N.J. Marshall, and R. Caldwell(1994a) The retinas of mantis shrimps from lowlight environments (Crustacea; Stomatopoda;Gonodactylidae). J. Comp. Physiol. A, 174:607–619.
Cronin, T.W., N.J. Marshall, and R.L. Caldwell(1994b) The intrarhabdomal filters in the reti-nas of mantis shrimps. Vision Res., 34: 279–291.
Cronin, T.W., N.J. Marshall, and R.L. Caldwell(1996) Visual pigment diversity in two generaof mantis shrimps implies rapid evolution(Crustacea; Stomatopoda). J. Comp. Physiol.A, 179:371–384.
References

Cronin, T.W., N.J. Marshall, R.L. Caldwell, andN. Shashar (1994c) Specialisation of retinalfunction in the compound eyes of mantisshrimps. Vision Res., 34: 2639–2656.
Cronin, T.W., N.J. Marshall, C.A. Quinn, and C.A.King (1994d) Ultraviolet photoreception inmantis shrimp. Vision Res., 34: 1443–1452.
Douglas, R.H., J.C. Partridge, and N.J. Marshall(1998) The eyes of deep-sea fish. I. Lens pig-mentation, tapeta and visual pigments. Prog.Retin. Eye Res., 17: 597–636.
Endler, J.A. (1990) On the measurement and clas-sification of colour in studies of animal colourpatterns. Biol. J. Linnean Soc., 41: 315–352.
Endler, J.A. ( 1992) Signals, signal conditions, andthe direction of evolution. Am. Nat., 139:125–153.
Endler, J.A. (1993) Some general comments on theevolution and design of animal communicationsystems. Phil. Trans. R. Soc. Lond. B, 340:215–225.
Goldsmith, T.H. (1990) Optimization, constraint,and history in the evolution of eyes. Q. Rev.Biol., 65: 281–322.
Hazlett, B.A. (1979) The meral spot of Gonodacty-lus oerstediiHansen as a visual stimulus (Sto-matopoda, Gonodactylidae). Crustaceana, 36:196–198.
Hopkins, C.D. (1999) Design features for electriccommunication. J. Exp. Biol., 202:1217–1228.
Jacobs, G.H. (1991) Variations in colour visionin non-human primates. In Inherited and Ac-quired Colour Vision Deficiencies (ed. by D.H.Foster), CRC Press, Inc., Boca Raton, Fla.,pp. 199–214.
Jacobs, G.H. (1993) The distribution and nature ofcolour vision among the mammals. Biol. Rev.,68: 413–471.
Kelber, A. (1999) Ovipositing butterflies use a redreceptor to see green. J. Exp. Biol., 202:2619–2630.
Lall, A.B., G.K. Strother, T.W. Cronin, and H.H.Seliger (1988) Modification of spectral sensi-tivities by screening pigments in the compoundeyes of twilight-active fireflies (Coleoptera:Lampyridae). J. Comp. Physiol. A, 162:23–33.
Lythgoe, J.N., and J.C. Partridge (1989) Visual pig-ments and the acquisition of visual information.J. Exp. Biol., 146:1–20.
Marshall, N.J. (1988) A unique colour and polarisa-tion vision system in mantis shrimps. Nature,333:557–560.
Marshall, N.J. (2000) The visual ecology of reeffish colours. In Animal Signals: Adaptive Sig-nificance of Signaling and Signal Design inAnimal Communication (ed. by Y. Espmark,T. Amundsen, and G. Rosenqvist), Tapir Pub-lishers, Trondheim, Norway, in press.
Marshall, N.J., and J. Oberwinkler (1999) MultipleUV photoreceptors in the eye of a marine crus-tacean: colour space examined like an ear?Nature, 401:873–874.
Marshall, N.J., J.P. Jones, and T.W. Cronin (1996)Behavioural evidence for colour vision in sto-matopods crustaceans. J. Comp. Physiol. A,179:473–481.
Marshall, N.J., M.F. Land, and T.W. Cronin (1989)The structure and function of the mid-band instomatopod crustaceans. J. Mar. Biol. Ass. UK,69: 719.
Marshall, N.J., M.F. Land, C.A. King, and T.W.Cronin (1991a) The compound eyes of mantisshrimps (Crustacea, Hoplocarida, Stomato-poda). I. Compound eye structure: the detectionof polarized light. Phil. Trans. R. Soc. Lond. B,334:33–56.
Marshall, N.J., M.F. Land, C.A. King, and T.W.Cronin (1991b) The compound eyes of mantisshrimps (Crustacea, Hoplocarida, Stomato-poda). II. Colour pigments in the eyes of sto-matopod crustaceans: polychromatic vision byserial and lateral filtering. Phil. Trans. R. Soc.Lond. B, 334:57–84.
Marshall, N.J., M.F. Land, J. Oberwinkler, J. Jones,J. Horwood, and T.W. Cronin (1994) Mantisshrimps – sixteen visual pigments in one eye.Why? In the conference proceedings of TheEcology of Vision, Oristano, Italy (abstr.).
Menzel, R., and W. Backhaus (1991) Colour visionin insects. In The Perception of Colour (ed.by P. Gouras), CRC Press, Boca Raton, Fla.,pp. 262–288.
Neumeyer, C. (1991) Evolution of colour vision. InEvolution of the Eye and Visual System (ed. byR. Gregory and J. Cronly-Dillon), CRC Press,Boca Raton, Fla., pp. 284–305.
Osorio, D., N.J. Marshall, and T.W. Cronin (1997)Stomatopod photoreceptor spectral tuning asan adaptation for colour constancy in water.Vision Res., 37: 3299–3309.
Osorio, D., D.L. Ruderman, and T.W. Cronin(1998) Estimation of errors in luminance sig-nals encoded by primate retina resulting fromsampling of natural images with red and greencones. J. Opt. Soc. Am. A, 15: 16–22.
Palacios, A.G., T.H. Goldsmith, and G.D. Bernard(1996) Sensitivity of cones from a cyprinid fish(Danio aequipinnatus)to ultraviolet and visiblelight. Vis. Neurosci., 13: 411–421.
Partridge, J.C., and R.H. Douglas (1995) Far-redsensitivity of dragon fish. Nature, 375:21–22.
Sabra, R., and R.M. Glantz (1985) Polarisation sen-sitivity of crayfish photoreceptors is correlatedwith their termination sites in the lamina gan-glionaris. J. Comp. Physiol. A, 156: 315– 318.
van Hateren, J.H. (1993) Spatial, temporal, andspectral pre-processing for colour vision. Proc.R. Soc. Lond. B, 251:61–68.
von Kries, J. (1905) Die Gesichtsempfindungen. InPhysiologie der Sinne, Handbuch der Physio-logie des Menschen, Vol. 3 (ed. by W. Nagel),Vieweg and Sohn, Braunschweig, pp. 109–282.
Vorobyev, M., D. Osorio, A.T. Bennett, N.J. Mar-shall, and I.C. Cuthill (1998) Tetrachromacy,oil droplets and bird plumage colours. J. Comp.Physiol. A, 183:621–633.
Wilczynski, W., A.C. Keddy-Hector, and M.J.Ryan (1992) Call patterns and basilar papillatuning in cricket frogs. I. Differences amongpopulations and between sexes. Brain Behav.Evol., 39: 229–237.
Wyszecki, G., and W.S. Stiles (1982) Color Sci-ences: Concepts and Methods, QuantitativeData and Formulae (ed. 2). John Wiley & Sons,New York, N.Y.
122 Brain Behav Evol 2000;56:107–122 Chiao/Cronin/Marshall