Embed Size (px)
Citation preview
Research Article Open Access
Parab and Tomar, J Nanomedic Nanotechnol 2012, 3:2 DOI: 10.4172/2157-7439.1000131
Volume 3 • Issue 2 • 1000131J Nanomedic NanotechnolISSN:2157-7439 JNMNT an open access journal
Keywords: Raman spectroscopy; Algae; Biomolecule; Bio-analysis;Identification
IntroductionRaman spectroscopy has proven to be a powerful and versatile
characterization tool used for determining chemical composition of material systems such as nanoscale semiconductor devices or biological systems. Raman spectroscopy is based on the concept of the Raman effect [1]. The principle behind the Raman Effect is based on the inelastic scattering of incident photons by atoms and molecules in a sample. The incident photons enter a virtual energy state when they interact with sample. The eventual return of photons to ground state results in the inelastic scattering. The wavelength of scattered photons can be determined by calculating the induced dipole moments in molecules due to vibrational displacements. If the final ground state has more energy than initial state, then emitted photon will be shifted to lower frequency. This scattering is called as Stokes scattering. If the final state is more energetic than initial, the emitted photon will be shifted to higher frequency, resulting in anti-Stokes scattering. Depending on the amount of scattered photons, Raman spectrum shows various peaks which undergo changes with changes in the characteristics of a sample. These characteristic peaks can be used to identify the structural components or chemical composition of the sample.
One major advantage of Raman spectroscopy in the case of biological molecules is that water gives very weak, uncomplicated Raman signal [2]. Biological systems are essentially wet systems hence Raman spectrum of a biological system can be easily obtained by filtering the water’s Raman signal. Another advantage of Raman spectroscopy in the case of biological molecules is the ability of Raman spectroscopy to analyze in-vivo samples [3]. Raman spectroscopy generally does not require sample preparation for obtaining the response from varied biological samples such as algae cells [3].This aspect gives this technique an edge over other methods such as Infra-Red (IR) spectroscopy which requires elaborate signal preparation for excitation and complex instrumentation for signal processing after the excitation [3]. Raman spectroscopy is fast emerging as an important characterization tool for biological systems4. With this view, the present review focuses on presenting information on advancements made regarding the Raman spectroscopy of Algae.
Algae are eukaryotic microorganisms which contain chlorophyll and are capable of photosynthesis. Algae are a rich source of carbohydrates and other nutrients [5]. Some of the important algal extracts are used in food, cosmetics, and pharmaceutical industry [5]. Algae are known to show changes in composition or the structure
depending on the changes in environmental conditions [3]. Based on such attributes, algae have led to new development in applications such as sensing elements in biosensors [6-15]. Algae cells have also been used as an aid in controlling water pollution and heavy metal pollution [10,12,13,15]. One of the most important and visible uses of algae has been in the domain of biofuel development due to superior lipid content in algae cells compared to other plant cells [16,17].
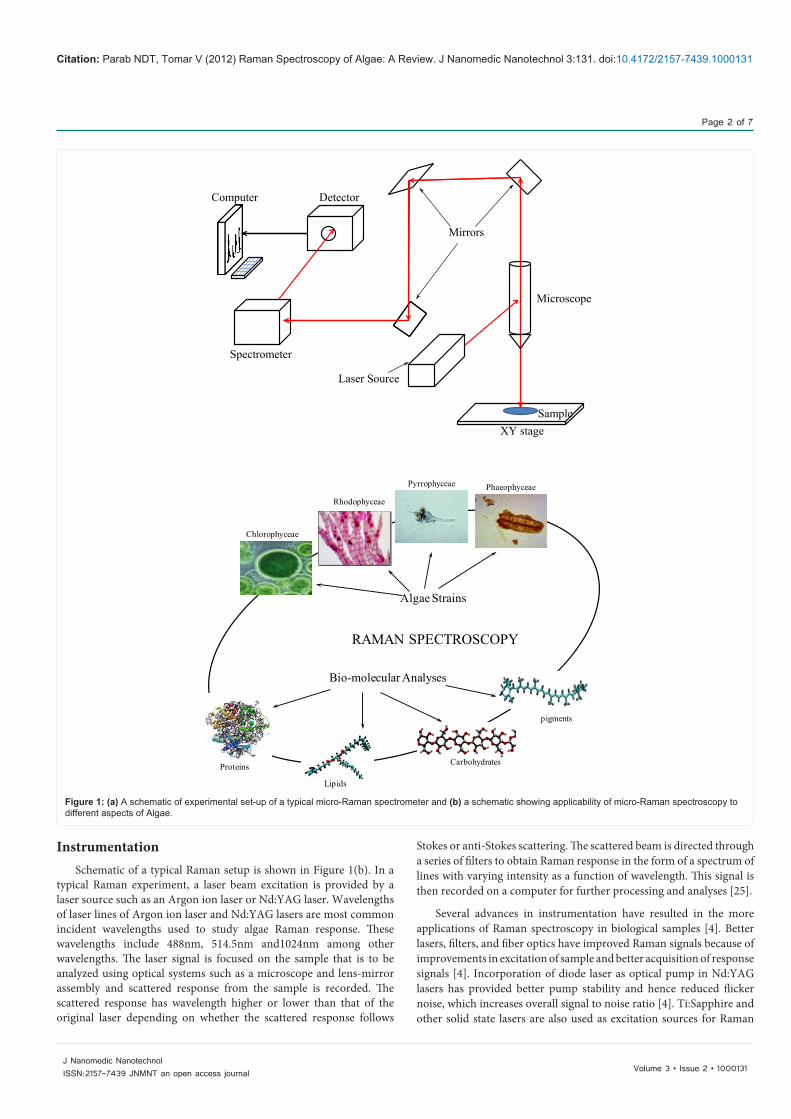
Algae cells contains mainly five types of biomolecules: proteins, carbohydrates, lipids, nucleic acids, and pigments [18]. Each type of biomolecules has been shown to have its own characteristic signature Raman spectrum. Characteristic peaks of each biomolecule can be used to identify them from Raman spectrum of algae cell. Raman spectrum of an algae cell will be the sum of Raman spectra of its constituent biomolecules [16]. In various studies, Raman spectra have been used to identify a particular type of algae species in a group of different types of algae or in different environmental conditions [19-22]. Raman spectra of individual biomolecules can be used to determine the molecular structure and various properties of the biomolecules and hence have also been studied extensively. Figure 1(a) shows the overview of applications of Raman spectroscopy in study of algae. There have been several reviews of applications of Raman spectroscopy in bioanalysis [4,23-24], however none of the available review deals with Raman spectroscopy of algae cells.
This present review is divided in 5 parts. Introduction is provided in section 1. In section 2, the basic instrumentation required for performing Raman spectroscopy is presented along with recent development of advanced methods such as Surface Enhanced Raman Spectroscopy (SERS). In section 3, various studies pertaining to identification of algae species using Raman spectroscopy are reviewed. In section 4, studies of component biomolecules of algae using Raman spectroscopy are presented. Conclusion and future prospects are presented in section 5.
*Corresponding author: Vikas Tomar, School of Aeronautics and Astronautics, Purdue University, West Lafayette, USA, Tel: 574 6317 826, E-mail: [email protected]
Received February 07, 2012; Accepted March 05, 2012; Published March 07, 2012
Citation: Parab NDT, Tomar V (2012) Raman Spectroscopy of Algae: A Review. J Nanomedic Nanotechnol 3:131. doi:10.4172/2157-7439.1000131
Copyright: © 2012 Parab NDT, et al. This is an open-access article distributed under the terms of the Creative Commons Attribution License, which permits unrestricted use, distribution, and reproduction in any medium, provided the original author and source are credited.
Raman Spectroscopy of Algae: A ReviewNiranjan D T Parab and Vikas Tomar*
School of Aeronautics and Astronautics, Purdue University, West Lafayette, USA
AbstractAlgae are eukaryotic microorganisms which contain chlorophyll and are capable of photosynthesis. In various studies, Raman spectra have been used to identify a particular genus in a group of different types of algae. Each biomolecule has its own signature Raman spectrum. This characteristic signal can be used to identify and characterize the biomolecules in algae. Raman spectrum can be used to identify the components, determine the molecular structure and various properties of biomolecules in algae. With this view, this work presents a comprehensive review of current practices and advancements in Raman spectroscopy of Algae as well as in Raman spectroscopy of component biomolecules of different genus of Algae.
Journal ofNanomedicine & NanotechnologyJo
urna
l of N
anomedicine & Nanotechnology
ISSN: 2157-7439
Citation: Parab NDT, Tomar V (2012) Raman Spectroscopy of Algae: A Review. J Nanomedic Nanotechnol 3:131. doi:10.4172/2157-7439.1000131
Page 2 of 7
Volume 3 • Issue 2 • 1000131J Nanomedic NanotechnolISSN:2157-7439 JNMNT an open access journal
InstrumentationSchematic of a typical Raman setup is shown in Figure 1(b). In a
typical Raman experiment, a laser beam excitation is provided by a laser source such as an Argon ion laser or Nd:YAG laser. Wavelengths of laser lines of Argon ion laser and Nd:YAG lasers are most common incident wavelengths used to study algae Raman response. These wavelengths include 488nm, 514.5nm and1024nm among other wavelengths. The laser signal is focused on the sample that is to be analyzed using optical systems such as a microscope and lens-mirror assembly and scattered response from the sample is recorded. The scattered response has wavelength higher or lower than that of the original laser depending on whether the scattered response follows
Stokes or anti-Stokes scattering. The scattered beam is directed through a series of filters to obtain Raman response in the form of a spectrum of lines with varying intensity as a function of wavelength. This signal is then recorded on a computer for further processing and analyses [25].
Several advances in instrumentation have resulted in the more applications of Raman spectroscopy in biological samples [4]. Better lasers, filters, and fiber optics have improved Raman signals because of improvements in excitation of sample and better acquisition of response signals [4]. Incorporation of diode laser as optical pump in Nd:YAG lasers has provided better pump stability and hence reduced flicker noise, which increases overall signal to noise ratio [4]. Ti:Sapphire and other solid state lasers are also used as excitation sources for Raman
Laser Source
XY stageSample
Microscope
Spectrometer
DetectorComputer
Mirrors
Proteins
Lipids
Carbohydrates
pigments
Algae Strains
Bio-molecular Analyses
RAMAN SPECTROSCOPY
Chlorophyceae
Rhodophyceae
PhaeophyceaePyrrophyceae
Figure 1: (a) A schematic of experimental set-up of a typical micro-Raman spectrometer and (b) a schematic showing applicability of micro-Raman spectroscopy to different aspects of Algae.

Citation: Parab NDT, Tomar V (2012) Raman Spectroscopy of Algae: A Review. J Nanomedic Nanotechnol 3:131. doi:10.4172/2157-7439.1000131
Page 3 of 7
Volume 3 • Issue 2 • 1000131J Nanomedic NanotechnolISSN:2157-7439 JNMNT an open access journal
spectroscopy because of their high harmonic conversion efficiencies and ability to tune them to different wavelengths [4]. Along with advances in laser systems, tunable filters such as liquid crystal and acousto-optic filters have introduced electronically controlled, fixed optical element which produces 2-D images without surface or beam rastering [4]. Liquid crystals have high throughput, large spectral range, and fast scan times making them ideal for use in the spectroscopy of biological samples. Incorporation of fiber optics for delivering the optical excitation and collection of response signal have decreased the size and increased the flexibility of the Raman systems [4]. Improved hardware gives better spatial resolution and portability to the Raman system hence making in-vivo analyses easier.
Several new discoveries in the physics of Raman Effect have
resulted in the advances in the Raman spectroscopic technique for bioanalysis. Resonance Raman spectroscopy uses the lasers which have their energy adjusted such that the energy of the laser or the that of the scattered signal coincides with electronic transition energy of a particular molecule or crystal [26]. This technique has become more prevalent with the advances in tunable lasers [4]. In biological samples, the advantage of resonance Raman spectroscopy is that the only modes associated with specific chromophoric group of molecules are enhanced due to resonance effect [26]. Resonance Raman spectroscopy makes it possible to study particular molecule in the algae cell thus enabling analysis of individual component from cell. Recently, there have been some major advances in Raman spectroscopy techniques to analyze the biological samples. These include Surface Enhanced Raman Spectroscopy (SERS), Tip Enhanced Raman Spectroscopy (TERS), Coherent Anti-Stokes Raman Spectroscopy (CARS) and Laser Tweezers Raman Spectroscopy (LTRS).
SERS has become important Raman spectroscopic analysis tool because it offers 103 to 107 enhancement in the intensity of the Raman response signal of an analyte when the analyte is adsorbed on the surface of some noble metals with nanoscale features [23]. Surface enhancement permits a single molecule detection as large intensity enhancement in response signal makes the response signal detectable even when response is obtained from a single molecule [23] and improves the spatial resolution to lateral resolutions better than 10 nm [27]. Information about the surface-interface processes can also be obtained using the extent of increase in intensity of each Raman mode [27]. The enhancement in intensity of the response is not observed for any other metal colloids or surfaces having large features [28]. The enhancement in response signal intensity is because of two different mechanisms. First, increase in the intensity due to electromagnetic enhancement correlated with the excitation of surface plasmons in metal structures and second, intensity increase due to chemical enhancement related to the adsorbate-substrate complexes providing different orbitals for excitation of the Raman processes [28]. Surface Enhanced Resonance Raman Spectroscopy (SERRS) combines the advantages offered by Resonance Raman spectroscopy and surface enhancement. SERRS can be used for higher specificity in excitation
800 1000 1200 1400 1600 1800
(d)
(c)
(b)
(a)
Inte
nsity
/a.
u.
Raman shift /cm-1
Glycosidicring
breathing
1098
1413
16251300
1243
1433
1625
1300
13971388
15711492
1610
15
151397
1385
1266933
812831
870
810876
933
9881132
1200
128113371374
1243
1088
959888816
807888
954
ν(c-c),ν(c-o),δ(C-C-H),δ(C-C-O),
symmν (COO ) νasymm(coo )
÷
÷
Figure 2: (a) Raman spectrum of Na alginate (b) Raman spectrum of Ca alginate (c) Raman spectrum of Na alginate mixed with silver colloid (d) Raman spectrum of Ca alginate mixed with silver colloid [46].
Raman Shift (cm-1)
Stearic acid (18:0, 70 C)
Palmitic acid (16:0, 63 C)
Myristic acid ( 14:0, 59 C)
Dodecanoic acid (12:0, 41 C)
Decanoic acid (10:0, 31 C)
Octanoic acid (8:0, 16 C)
Oleic acid (18:1, 13 C)
Palmitoleic acid (16:1, 1.5 C)
Linoleic acid (18:2, -4.5 C)
Linolenic acid (18:3, -11 C)
Arachidonic acid (20:4, -50 C)
500 1000 1500 2000 2500 3000
Figure 3: Raman spectra of various lipid molecules [17].
1700 1500 500 300 100 1700 1500 500 300 100Raman Shift (cm-1)
1
2
3
4
5
1
3
4
5
s
s
s
Figure 4: Raman spectra for chl a (left) and chl b (right) in different solvents (1)acetone (2) hexaneacetone, 90: 1Ov/v (3) Chl a: dry hexane (3) Chl b: dry cyclohexane (4) dry carbon tetrachloride (5) water aggregates in Nujol oil [35].
Citation: Parab NDT, Tomar V (2012) Raman Spectroscopy of Algae: A Review. J Nanomedic Nanotechnol 3:131. doi:10.4172/2157-7439.1000131
Page 4 of 7
Volume 3 • Issue 2 • 1000131J Nanomedic NanotechnolISSN:2157-7439 JNMNT an open access journal
thus opening interesting opportunities for studying specific parts of large biomolecules [27]. SERS and SERRS make it possible to analyze single cell of the algae. It is also possible to study individual molecules in algae cells using SERS.
The concept of TERS is based on the concept of “hot spots” in surface Raman spectroscopy [28]. This concept states that the surface enhancement is produced by a small Raman active areas called as “hot spots” on the surface and rest of the surface is inactive [28]. In TERS, single such hot spot is created by keeping a sharp protrusion or a tip made of gold or silver at a small distance from the sample [28]. The enhancement in intensity in TERS is because of localized
enhanced electromagnetic field near the tip apex [28]. The enhanced electromagnetic field provides the enhancement in the intensity of Raman spectrum like in SERS. Currently, TERS provides two to four orders of magnitude increase in response signal intensity. The response intensity enhancement is expected to increase further on improvements in excitation and radiation efficiency in surface plasmons [28]. TERS provides better spatial resolution compared to traditional Raman spectroscopy due to local enhancement provided by hot spots thus making the single cell analysis possible.
In CARS, two high powered (generally pulsed) laser beams are focused together on the sample. Due to the mixing of two lasers, a coherent beam resembling low intensity laser beam is generated [29]. Due to the coherence of the beam, the spectrum obtained using CARS is orders of magnitude stronger than Raman spectrum obtained using traditional Raman spectroscopy [29]. Two interacting beams give high 3D sectioning capability [23]. CARS signals can also be easily picked in fluorescent background due to blue shift of the response signals [23].
LTRS utilizes laser tweezers to immobilize a single cell of algae or any other organism [17]. LTRS can be used to obtain the Raman spectrum of single cell or even a particular part of an immobilized algae cell [17].
Advances in the spectroscopic techniques have opened a new frontier of very high resolution Raman spectroscopy, even of the specific parts inside the cell. They also enable the monitoring of real time changes in algae cells using Raman spectroscopy thus improving the ability to detect the changes in algae cells in different environments. In the next section, a summary of the studies done on the identification of algae species using Raman spectroscopy is provided.
Identification of Algae Species using Raman Spectroscopy
Several studies focusing on the identification of algae using Raman spectroscopy have been reported in literature [19-22]. The technique of identification of algae uses the characteristic peaks in the Raman spectra to identify unique biomolecules in the cells which are correlated to the specific species of algae [19,20].
Identification process often involves analysis of Raman spectra from multiple components of cells. Analysis of multi-component systems is performed using statistical multivariate analysis. Most of the times,
1500 1000 500 cm-1
(c)
(b)
(a)
C C C
C
C
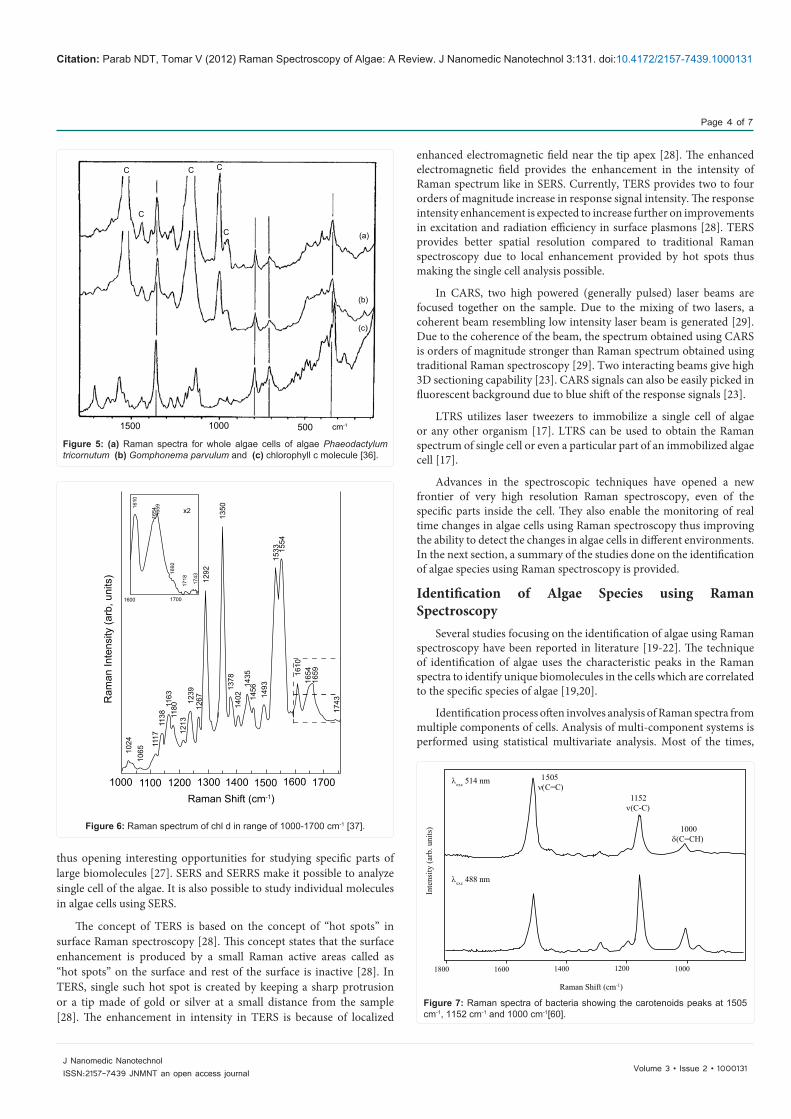
Figure 5: (a) Raman spectra for whole algae cells of algae Phaeodactylum tricornutum (b) Gomphonema parvulum and (c) chlorophyll c molecule [36].
Raman Shift (cm-1)1000 1100 1200 1300 1400 1500 1600 1700
Ram
an In
tens
ity (a
rb, u
nits
)
1024
1065
1117
1138
1163
1180
1213
1239
1267
1378
1402
1435
1456
1493
1610
1654
1659
1743
1292
1350
1533 15
54
1600 1700
1743
1718
1692
1610
1654 16
59 x2
Figure 6: Raman spectrum of chl d in range of 1000-1700 cm-1 [37].
Raman Shift (cm-1)
1800 1600 1400 1200 1000
Inte
nsity
(arb
. uni
ts)
λexc 514 nm
λexc 488 nm
1000δ(C=CH)
1152ν(C-C)
ν(C=C)
Figure 7: Raman spectra of bacteria showing the carotenoids peaks at 1505 cm-1, 1152 cm-1 and 1000 cm-1[60].
Citation: Parab NDT, Tomar V (2012) Raman Spectroscopy of Algae: A Review. J Nanomedic Nanotechnol 3:131. doi:10.4172/2157-7439.1000131
Page 5 of 7
Volume 3 • Issue 2 • 1000131J Nanomedic NanotechnolISSN:2157-7439 JNMNT an open access journal
linear analysis is used [30]. Two basic assumptions are made in linear analysis. First, Raman spectrum of mixture of biomolecules is assumed to be linear superposition of component spectra of biomolecules in mixture [30]. It is also assumed that signal intensity and concentration of biomolecule in mixture has linear relationship [30]. For finding major components, either explicit or implicit methods are applied. In explicit methods, such as ordinary least squares or classical least squares, Raman spectra of all component biomolecules are previously known [31]. Most of the times, Raman spectra for components are not known beforehand and hence implicit analysis is performed to analyze the components. Principal component analysis [32] and partial least squares [31] method are some of the most common implicit analyses methods. Statistical analyses help in extracting the information from Raman spectrum and analyze the component mixtures effectively.
In reference [22], Raman spectroscopy is applied to differentiate between non-toxic and toxic algal strains. Four different species of algae including Pseudo-nitzschia, some of which are capable of producing toxin domoic acid, are studied by the means of resonance Raman spectra excited at 457.9 and 488 nm. It was observed that Raman spectra for all algae species contain major peaks near 1000 cm-
1, 1153 cm-1, and 1523 cm-1, all of which are strongly enhanced due to carotenoids [22]. Features between 920-980 and 1170-1230 cm-1 are relatively weaker and are more characteristic of algae species [22]. It was observed that all Pseudo-nitzschia species produce a Raman response signal which is different from other species [22]. In the study by Brahma et al.[19], various Marine algae species were identified from the medium containing different algae species using resonance Raman spectroscopy. In reference [20], different types of seaweeds
Biomolecule Algae species studied Observations Conclusions RefProteinsAdhesion proteins Coccomyxa sp. and
Glaphyrella trebouziodesAmide III band peaks at 1224 cm-1 and 1260 cm-1 Consistent with generic amyloid structure with strong
hydrophobic core55
Hemoglobin C. Eugametos Fe-CN ferric derivative peak at 440cm-1
1502 cm-1 and 1374 cm-1 peaksFe-C-N moiety adopts highly bent structure due to H bondingSix coordinated low spin heme iron with distal ligant tyrosinate
38
CarbohydratesPolysaccharides Peaks in the range 350-600 cm-1 Skeletal pyranose ring modes
Glycosidic stretching modesCH2 and C-OH deformations
56,44
β-D-glucosides 377 cm-1 characteristic peak 56,44α-D-glucosides Strong peaks from 479 to 483 cm-1
Peak at 543cm-1Peaks from Amylopectin and amylaseDextran peak
56,44
Alginates Peaks at <1300 cm-1
Peaks at >1300 cm-1
(Figure 2)
Vibration of polymer backboneStretching vibrations of carboxylate groups
46
Calcium Alginate Change of band position from alginatesMost prominent: 1413 cm-1 to 1433 cm-1
Symmetric COO- stretching peak 46
κ-carrageenan and ι-carrageenan
Eucheuma cottoniiEucheuma spinosa
Various peaks from 700 to 1200 cm-1 Peaks are assigned to respective molecular structure of carrageenans
48
LipidsHydrocarbons(Figure 3)
Botryococcus braunii 1650-1670 cm-1 and 2800-3000 cm-1 peaks Double bond stretching peak in long chain unsaturated hydrocarbons
57
Chlorella sorokinianaNeochloris oleoabundans
1650 cm-1 peak2800-3000 cm-1 peak
C=C stretching peakC=C-H vibration peak
16
Botryococcus sedeticusChlamydomonas sp.Trachydiscus minutes
1656 cm-1 peak1445 cm-1 peak
cis C=C stretching mode proportional to no. of unsaturated bondsCH2 scissoring mode proportional to no. of saturated bondsTrachydiscus minutus has significantly higher content of unsaturated fatty acids
56
Pigments: ChlorophyllsChl a(Figure 4)
Peaks in the range 1100-1600 cm-1
Peaks in the range 700-950 cm-1
Peaks <700 cm-1 and from 900-1000 cm-1
Strong 306 cm-1 peak and absence of 317 cm-1 peak
Stretching motions of C-C and C-N bondsPlanar deformations of tetrapyrrol macrocycleMg related vibrationsMg atoms in hexacoordinated state
35
Chl b Peaks similar to Chl a Chl a and Chl b have very similar structure 35Chl c(Figure 5)
1361 cm-1 peak C-N ring breathing mode 58
Chl d(Figure 6)
Acaryochloris marina Very different Raman response as compared to Chl a and Chl b
Presence of formyl group at C-3 position 37
Pigments: Carotenesβ-carotene(Figure 7)
Chlorella sorokinianaNeochloris oleoabundansEuglena, Chlamydomonas
Peak at 1520 cm-1
Peak at 1157 cm-1
Peak at 1000 cm-1
Strong peak in the eyespot region
C=C stretching modeC-C stretching modeC-CH3 stretching modeHigh content of carotenoids in eyespot region
59, 16, 51-52, 60
Nucleic acidsDNA and RNA Peaks between 600 cm-1 and 800 cm-1
Intense peak at 1671 cm-1
Peak at 1100 cm-1
Ring breathing modes of DNA and RNA basesC=O stretch vibrationsSymmetric PO-
2 stretching vibration
53
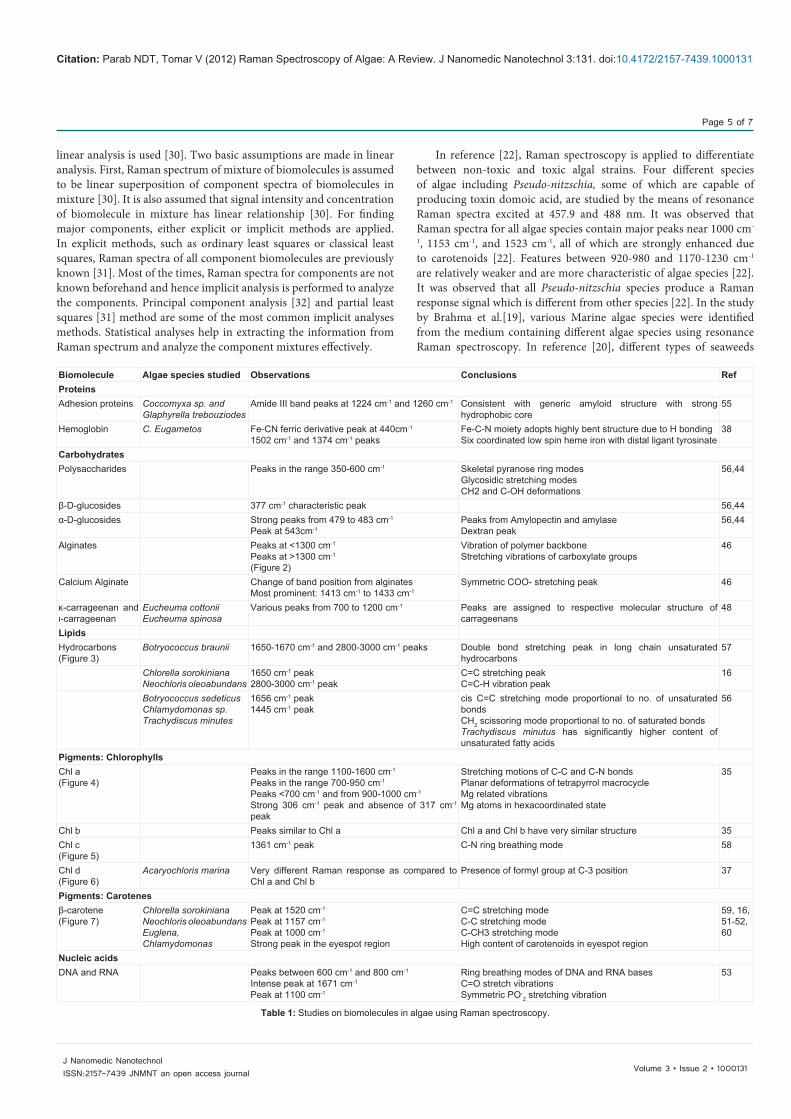
Table 1: Studies on biomolecules in algae using Raman spectroscopy.
Citation: Parab NDT, Tomar V (2012) Raman Spectroscopy of Algae: A Review. J Nanomedic Nanotechnol 3:131. doi:10.4172/2157-7439.1000131
Page 6 of 7
Volume 3 • Issue 2 • 1000131J Nanomedic NanotechnolISSN:2157-7439 JNMNT an open access journal
were identified using Fourier Transform based Raman spectroscopy (FT-Raman). It was observed that FT-Raman spectra have higher resolution than FTIR spectra hence it was concluded that FT-Raman spectroscopy is better for identification of different species from a medium containing different species of algae. In reference [21], Algae and bacteria deposits on Ti sheets are detected using Surface enhanced Raman spectroscopy. Spatial distribution of algae on the surface was also identified.
Raman spectroscopy provides a high resolution method with high accuracy for identification and detection of algae species. It can be used to detect the algae species from the biomass coatings or in algal blooms. With smaller and portable equipments, it is possible to detect the algae species in their natural habitat [33] .Recent developments in instrumentation and spectroscopic techniques such as SERS will further help in identification of algae. The identification of algae using Raman spectroscopy is based on the identification of component biomolecules. Hence it is important to study the individual biomolecules using Raman spectroscopy. These studies are summarized in the next section.
Study of Component BiomoleculesAlgae cell contains mainly five types of biomolecules: proteins,
carbohydrates, lipids, nucleic acids and pigments [18]. Raman spectroscopy has been used to find the molecular structure of the biomolecules [34-43] and to analyze other properties such as the location of biomolecules in the cell [16,44-52]. Various methods are used to predict the molecular structure of biomolecules using Raman spectroscopy. In isotope labeling, certain atoms in molecule are replaced by their isotopes and changes in the Raman spectra are observed for the new isotope labeled molecules. The bands which show differences from original spectra are assigned to the labeled parts of the molecule. In site-directed mutagenesis, specific sites of cells are modified using mutation. The changes in Raman spectra can then be assigned to the mutated parts of cells and hence the biomolecules that are present in mutated parts or to the changes in biomolecules due to mutations. In normal coordinate analysis, the vibrational modes are analyzed theoretically using quantum mechanics of coupled harmonic oscillators [54] and each mode is assigned to a peak in Raman spectrum. Now, because of advances in high performance computing, it is possible to find the vibrational modes associated with each peak in Raman spectrum of each biomolecule using molecular simulations such as density functional theory.
The reference Raman spectra for important biomolecules are collected in [53]. The reviews on the use of Raman spectroscopy in the analysis of biomolecules are presented in various references [4,23,24]. The summary of Raman spectroscopic studies of each type of biomolecule in algae is presented in table 1.
ConclusionsRaman spectroscopy is an important tool in the analyses of
algae cells and component biomolecules. It is an ideal experimental measurement system for the characterization of “wet” biosystems on the account of weak Raman signal of water. It also provides high spatial and temporal resolution required for the characterization of biological samples at cellular level. Raman spectrum also has a lot of information focusing on vibration states of the molecules. Any single Raman spectrum can be used to extract large amount of data about the systems including components of system and temperature of system. Using the information contained in the spectrum, various algae species can be identified and analyzed for various properties such as locations of particular biomolecule in cell.
With advances in spectroscopic techniques in the form of SERS, TERS, CARS and LTRS, it is now possible to obtain Raman spectra of specific parts of a cell. This will enable better understanding of particular parts of cells and hence the constituent biomolecules. Use of pulsed lasers has enabled monitoring of the changes in system with respect to time. In future, Raman spectroscopy can be used to map the real time changes in the biological systems with very high spatial resolution and also very high accuracy.
Raman spectroscopy can expand its application base in future including clinical diagnosis because of various advantages. The most important applications of Raman spectroscopy in the study of algae in future could well be for studying in-vivo samples and for the analysis of algae cell metabolism in real time.
References
1. Raman CV, Krishnan KS (1928) Nature 121: 501.
2. Parker FS (1983) Applications of infrared, raman, and resonance raman spectroscopy in biochemistry. Springer, New York.
3. Heraud P, Wood BR, Beardall J, McNaughton D (2007) New Approaches in Biomedical Spectroscopy. American Chemical Society, Washington DC.
4. Pappas D, Smith BW, Winefordner JD (2000) Raman spectroscopy in bioanalysis. Talanta 51: 131-144.
5. Cardozo KH, Guaratini T, Barros MP, Falcao VR, Tonon AP, et al. (2007) Metabolites from algae with economical impact. Comp Biochem Physiol C Toxicol Pharmacol 146: 60-78.
6. Podola B, Nowack ECM, Melkonian M (2004) The use of multiple-strain algal sensor chips for the detection and identification of volatile organic compounds. Biosens bioelectron 19: 1253-1260.
7. Mayer P, Cuhel R, Nyholm N (1997) A simple in vitro fluorescence method for biomass measurements in algal growth inhibition tests. Water Research 31: 2525-2531.
8. Smith RG, Souza ND, Nicklin S (2008) A review of biosensors and biologically-inspired systems for explosives detection. Analyst 133: 571-584.
9. Campas M, Carpentier R, Rouillon R (2008) Plant tissue-and photosynthesis-based biosensors. Biotechnol adv 26: 370-378.
10. Durrieu C, Tran Minh C (2002) Optical algal biosensor using alkaline phosphatase for determination of heavy metals. Ecotoxicol Environ Saf 51: 206-209.
11. Naessens M, Leclerc JC, Tran-Minh C (2000) Fiber optic biosensor using Chlorella vulgaris for determination of toxic compounds. Ecotoxicol Environ Saf 46: 181-185.
12. Franse D, Muller A, D Beckmann (1998) Sensors and Actuators B. 51: 256.
13. Scardino A, Musumeci F, Gulino M, Lanzano L, Tudisco S, et al. (2008) Journal of Physics D: Applied Physics 41: 1555071.
14. Tanaka Y, Sato K, Shimizu T, Yamato M, Okano T, et al. (2007) Biological cells on microchips: new technologies and applications. Biosens bioelectron 23: 449-458.
15. Campanella L, Cubadda F, Sammartino MP, Saoncella A (2000) An algal biosensor for the monitoring of water toxicity in estuarine environments. Water Res 35: 69-76.
16. Huang YY, Beal CM, Cai WW, Ruoff RS, Terentjev EM (2010) Micro-Raman spectroscopy of algae: composition analysis and fluorescence background behavior. Biotechnol Bioeng 105: 889-898.
17. Wu H, Volponi JV, Oliver AE, Parikh AN, Simmons BA, et al. (2011) In vivo lipidomics using single-cell Raman spectroscopy. PNAS 108: 3809-3814.
18. Alberts B, Bray D, Johnson A, Lewis J, Raff M, et al. (1998) Essential cell biology. Garland Publishing Inc, New York.
19. Brahma SK, Hargraves PE, Howard WF, Nelson WH (1983) A Resonance Raman Method for the Rapid Detection and Identification of Algae in Water. Appl Spectrosc 37: 55-58.
20. Pereira L, Sousa A, Coelho H, Amado AM, Ribeiro-Claro PJA (2003) Use
Citation: Parab NDT, Tomar V (2012) Raman Spectroscopy of Algae: A Review. J Nanomedic Nanotechnol 3:131. doi:10.4172/2157-7439.1000131
Page 7 of 7
Volume 3 • Issue 2 • 1000131J Nanomedic NanotechnolISSN:2157-7439 JNMNT an open access journal
of FTIR, FT-Raman and 13C-NMR spectroscopy for identification of some seaweed phycocolloids. Biomol Eng 20: 223-228.
21. Ramya S, George RP, Subba Rao RV, Dayal RK (2010) Detection of algae and bacterial biofilms formed on titanium surfaces using micro-Raman analysis. Applied Surface Science 256: 5108-5115.
22. Wu Q, Nelson WH, Hargraves PE, Zhang J, Brown CW et al. (1998) Differentiation of algae clones on the basis of resonance Raman spectra excited by visible light. Anal Chem 70: 1782-1787.
23. Baena JR, Lendl B (2004) Raman spectroscopy in chemical bioanalysis. Curr Opin Chem Biol 8: 534-539.
24. Fabian H, Abzenbacher P (1993) New developments in Raman spectroscopy of biological systems. Vib S ctrosc 4: 125-148.
25. De Wolf I (1996) Micro-Raman spectroscopy to study local mechanical stress in silicon integrated circuits. Semicond Sci Technol 11: 139.
26. Strommen DP, Nakamoto K (1977) Resonance raman spectroscopy. J Chem Educ 54: 474.
27. Kneipp K, Kneipp H, Itzkan I, Dasari RR, Feld MS (2002) Surface-enhanced Raman scattering and biophysics. J Phys Condens matter 14: R 597.
28. Pettinger B (2006) Topics in Applied Physics: Surface-Enhanced Raman Scattering-Physics and Applications. Springer-Verlag, Berlin 103: 217.
29. Tolles WM, Nibler JW, McDonald JR, Harvey AB (1977) A Review of the Theory and Application of Coherent Anti-Stokes Raman Spectroscopy (CARS). Appl Spectrosc 31: 253-271.
30. Hanlon EB, Manoharan R, Koo TW, Shafer KE, Motz JT, et al. (2000) Prospects for in vivo Raman spectroscopy. Phys Med Biol 45 R1.
31. Haaland DM, Thomas EV (1988) Partial least-squares methods for spectral analyses. 1. Relation to other quantitative calibration methods and the extraction of qualitative information. Anal Chem 60: 1193-1202.
32. Wold S, Esbensen K, Geladi P (1987) Principal component analysis. Chemometrics and Intelligent Laboratory Systems 2: 37-52.
33. Heraud P, Wood BR, Beardall J, Naughton Don, et al. (2005) Effects of pre-processing of Raman spectra on in vivo classification of nutrient status of microalgal cells. J Chemom 20: 193-197.
34. Lutz M (1977) Antenna chlorophyll in photosynthetic membranes. A study by resonance Raman spectroscopy. Biochimica et Biophysica Acta 460: 408-430.
35. Lutz M (1974) Resonance Raman spectra of chlorophyll in solution. J Raman Spectrosc 2: 497-516.
36. Wagner WD, Waidelich W (1986) Selective Observation of Chlorophyll c in Whole Cells of Diatoms by Resonant Raman Spectroscopy. Appl Spectrosc 40: 191-196.
37. Chen M, Zeng H, Larkum AWD, Cai ZL (2004) Raman properties of chlorophyll d, the major pigment of Acaryochloris marina: studies using both Raman spectroscopy and density functional theory. Spectochimica Acta Part A 60: 527-534.
38. Egawa T, Yeh SR (2005) Structural and functional properties of hemoglobins from unicellular organisms as revealed by resonance Raman spectroscopy. J Inorg Biochem 99: 72-96.
39. Vasko PD, Blackwell J, Koenig JL (1971) Infrared and raman spectroscopy of carbohydrates : Part I: Identification of OH and CH-related vibrational modes for D-glucose, maltose, cellobiose, and dextran by deuterium-substitution methods. Carbohydr res 19: 297-310.
40. Vasko PD, Blackwell J, Koenig JL (1972) Infrared and raman spectroscopy of carbohydrates. : Part II: Normal coordinate analysis of α-D-glucose. Carbohydr res 23: 407-416.
41. Cael JJ, Koenig JL, Blackwell J (1973) Infrared and raman spectroscopy of carbohydrates. 3. Raman spectra of the polymorphic forms of amylose. Carbohydr res 29: 123-134.
42. Cael JJ, Koenig JL, Blackwell J (1975) Infrared and Raman spectroscopy of carbohydrates. Part VI: Normal coordinate analysis of V-amylose. Biopolymers 14: 1885-1903.
43. Cael JJ, Gardner KH, Koenig JL, Blackwell J (1975) Infrared and Raman spectroscopy of carbohydrates. Paper V. Normal coordinate analysis of cellulose I. J Chem Phys 62: 1145.
44. Yang L, Zhang LM (2009) Chemical structural and chain conformational characterization of some bioactive polysaccharides isolated from natural sources. Carbohydr Polym 76: 349-361.
45. Atalla RH, Hackney JM (1992) Structural Polysaccharides In Molecular Architecture of Plant Cell Wallsfrom Algae to Hardwoods. MRS Proceedings 255: 387.
46. Schmid T, Messmer A, Yeo BS, Zhang W, Zenobi R (2008) Towards chemical analysis of nanostructures in biofilms II: tip-enhanced Raman spectroscopy of alginates. Anal Bioanal Chem 391: 1907-1916.
47. Pudney PDA, Hancewicz TM, Cunnigham DG, Brown MC (2004) Quantifying the microstructures of soft solid materials by confocal Raman spectroscopy. Vib Spectrosc 34: 123-135.
48. Malfait T, Van Dael H, Van Cauwelaert F (1989) Molecular structure of carrageenans and kappa oligomers: a Raman spectroscopic study. Int J Biol Macromol 11: 259-264.
49. Yu S, Blennow A, Bojko M, Madsen F, Olsen CE, et al. (2002) Starch 54: 66.
50. Enejder A, Brackmann C, Svedberg F (2010) Coherent Anti-Stokes Raman Scattering Microscopy of Cellular Lipid Storage. IEEE J Sel Top Quantum Electron 16: 506-515.
51. Robert B, Frank HA, Young AJ, Britton G, Cogdell RJ (1999) The Photochemistry of Carotenoids. Kluwer Academic Publishers, Netherlands 189.
52. Kubo Y, Ikeda T, Yang SY, Tsuboi M (2000) Orientation of Carotenoid Molecules in the Eyespot of Alga: In Situ Polarized Resonance Raman Spectroscopy. Appl Spectrosc 54: 1114-1119.
53. De Gelder J, De Gussem K, Vandenabeele P, Moens L (2007) Reference database of Raman spectra of biological molecules. J Raman Spectrosc 38: 1133-1147.
54. Groner P (2006) in Handbook of Vibrational Spectroscopy, Wiley and sons.
55. Mostaert AS, Giordani C, Crockett R, Karsten U, Schumann R, et al. (2009) The Journal of Adhesion 85: 465.
56. Samek O, Jonas A, Pilat Z, Zemanek P, Nedbal L, et al. (2010) Raman Microspectroscopy of Individual Algal Cells: Sensing Unsaturation of Storage Lipids in vivo. Sensors 10: 8635-8651.
57. Largeau C, Casadevall E, Berkaloff C, Dhamelincourt P (1980) Sites of accumulation and composition of hydrocarbons in Botryococcus braunii. Phytochemistry 19: 1043-1051.
58. Wagner M (2009) Single-cell ecophysiology of microbes as revealed by Raman microspectroscopy or secondary ion mass spectrometry imaging. Annu Rev Microbiol 63: 411-429.
59. Merlin JC (1985) Pure and Applied Chemistry 57: 785.
60. Marshall CP, Leuko S, Coyle CM, Walter MR, Burns BP, et al. (2007) Carotenoid analysis of halophilic archaea by resonance Raman spectroscopy.Astrobiology 7: 631-643.