Embed Size (px)
Citation preview

FFMCOrigi
C Corporate Pnal Submissio
F
Plan FY2013/1on: February
Freshw
14 ‐ FY2017/12013
water
Five‐
Corpor
Origi
18
Fish M
‐Year CSum
ate Plan FYCapital
Operatin
inal Submi
Market
Corpormmary
Y2013/14Budget 13
ng Budget 1
ission: Feb
ting Co
rate Ply
to FY20173/14 13/14
bruary 201
Summary Re
orpora
lan
7/18
13
1/27 vised: April 3
ation
30, 2014
FFMC Corporate Plan FY2013/14 ‐ FY2017/18 2/27 Original Submission: February 2013 Summary Revised: April 30, 2014
ExecutiveSummary Freshwater Fish Marketing Corporation (Freshwater) has provided effective market access and a reliable source of income to the commercial fishers of its mandated region in western and northern Canada for more than 40 years. Freshwater Fish was created in 1969 in response to the recommendations of the McIvor Commission, which found that ‘the uncertainties and risks [of the freshwater fishery] are especially extensive in exporting … due to (1) the perishable nature of the product (2) the absence of effective quality control and (3) the lack of coordination between the demand and supply coming to the market’. In its 1966 report the McIvor Commission described a business environment in which too many exporters were selling to just a few buyers giving the buyers total control over prices. Buying prices changed (usually downward) during the season and in many cases fishers found themselves still owing money to their local agent for gear and fuel at the end of the season. Freshwater was created as a single desk to level the playing field between sellers and buyers by giving fishers the leverage required to negotiate economically viable prices with their customers. Freshwater’s primary objective has been to increase returns, not just to the strongest fishers but to all fishers. The effectiveness of this approach can be found in the trend of fish prices relative to those for hogs and beef cattle. Fish prices were well below hog and cattle prices in the early 1980’s but had surpassed hogs by the end of that decade and cattle by the early 2000’s. Since its start‐up in 1969, Freshwater has returned over $1.1 billion to the mostly remote northern communities it serves and has contributed an additional benefit of approximately $0.8 billion through the operation of its plant and collection infrastructure. This result has been achieved while operating in a self‐sustaining manner, as required by its mandate. In fulfilling its mandate, Freshwater provides four key benefits to the inland fishery as well as domestic and global food markets:
1. Orderly market/price maintenance ‐ Freshwater buys all fish offered for sale and carries out market‐making activities such as holding frozen inventory to match supply with demand.
2. Global markets ‐ Freshwater gives Canadian inland fishers access to global markets while reducing the business risk for fishers inherent in the export of food products: • foreign exchange risk ‐ by hedging currencies • market risk ‐ by setting buying prices for a season and as much as possible for a year at a time • cash flow risk ‐ by paying fishers within a week of delivery and managing customer receivables
3. Food safety and security ‐ Freshwater works closely with the Canadian Food Inspection Agency (CFIA) and its customers to ensure its supply chain and processing plant meet federal and customer requirements for food safety and security. Freshwater was one of the first foreign fish plants certified for export to Russia.
4. Economic development ‐ In many communities where Freshwater operates delivery points, the fishery is the only commercial avenue of economic development. A majority of these communities (42 of 53) are predominantly Aboriginal (First Nations and Métis). The fishery fosters independent business owners, increases employment in rural and remote regions and reduces the need for social assistance. In FY2011/12, 75% of the $28 million that FFMC paid out in returns to fishers and agency fees went to predominantly Aboriginal

FFMC Corporate Plan FY2013/14 ‐ FY2017/18 3/27 Original Submission: February 2013 Summary Revised: April 30, 2014
communities. If 53° north and above is considered north, then approximately 40% of deliveries by value and 50% by volume came from northern communities in FY2011/12. This income remains in the community in the form of wages for hired labour (fishers hire an average of four crew members) and money spent at local businesses.
Freshwater, like every other Canadian food processor and exporter, has had to contend with a number of fast‐paced changes to its environment over the past decade: the weak US dollar / strong Canadian dollar, increasingly complex food safety and security regulations, more stringent workplace safety requirements, increasing access to international markets and increasing international competition in domestic markets, to name just a few of the most significant. The FY2013/14 plan will continue to implement the long‐term strategy focused on improving Freshwater’s financial strength, global competitiveness and profitability in a US dollar/Canadian dollar at par environment. As markets, exchange rates and as Freshwater’s own financial strength allows, prices to fishers will be increased. With more than forty years of data and experience Freshwater understands that at current price levels fishers are making decisions on whether to fish or not to fish based on their individual assessment of how they will maximize income over the next year, by fishing, by working outside of their community or a combination of both. These individual decisions multiplied by 2000 fishers have a critical impact on Freshwater’s own viability. The Corporation’s strategy includes projects that will continue to improve efficiencies, supply volumes and market prices. In keeping with the cost containment measures of Budget 2010 and the spirit and intent of the Strategic and Operational Review, cost reductions have been made and cost reduction projects are ongoing in several areas of this plan: most significantly, working capital, ERP / business processes, supply chain management, plant management and plant renovation. Where possible, third‐party contractors have been used rather than hire additional staff. Internal audit, public relations and payroll will all be handled by third parties in FY2013/14. Cost reductions on a per unit basis can also be achieved by increasing volume through the plant. Initiatives on supply development and market development address the two sides of this volume equation. The loss of Saskatchewan as a signatory to the FFMA does add some risk to volume projections; however, this risk is diminishing. At the time of writing, fisher co‐ops representing 99.5% of previous deliveries to Freshwater have signed contracts to continue supplying Freshwater. Saskatchewan fishers will be paid at the same rate as fishers in the mandated region. However, the Corporation will no longer provide payroll services (Record of Employment, EI deductions, royalty deductions, loan deductions) or freight allowance administration. Nor will Saskatchewan fishers participate in any final payments (distribution of surpluses). Historically, Saskatchewan has delivered approximately 10% of Freshwater’s fish by value and 17% by volume. Fishers of the Northwest Territories Fishermen’s Federation reconfirmed their commitment to the FFMA in 2011 and Freshwater is now working with the Fishermen’s Federation and the NWT government to revitalize the fishery on Great Slave Lake. There is an opportunity to significantly increase deliveries of lake whitefish and lake trout from this region. In the marketing side of the business, the addition of a Business Development Manager to the Sales and Marketing team has proven very effective, adding a cumulative $8.5 million in new business over the past three years. In the plan year, marketing will continue to focus development on the contribution made by new markets (Russia, Romania, Belgium),

FFMC Corporate Plan FY2013/14 ‐ FY2017/18 4/27 Original Submission: February 2013 Summary Revised: April 30, 2014
replacing commodity business with branded (perch) and finding new opportunities for value‐added products (mullet roe, pin‐bone‐out lake whitefish, smoked trout, battered walleye). To help address the difficulties experienced by fishers who rely on lower value species such as mullet and tullibee, Freshwater will continue to work with stakeholders and partners to find ways to add value to these species. Research and development is the long‐term solution but this will require partners who are willing to commit for the longer term. In 2010 Freshwater engaged Genivar, consulting engineers, to provide a plant condition assessment for the 40 year old Winnipeg processing facility that included mechanical, electrical and structural engineering, building life‐cycle analysis and capital asset planning. The focus of the study was to guide a major renovation project, the objective of which is to extend the operational life of the plant to 2035, meet health and food safety standards and gain cost savings through processing efficiencies. The phased investment plan to improve the plant condition to modern standards is:
Major Plant Renovation Project
Of the $35 million in capital investment originally estimated to be required for the major plant renovation, $11.7 million was spent as of April 30, 2013. The remaining $23.3 million of investment will be spent if and when necessary over the next 9 years with $1.715 million planned in FY2013/14. While some risk inherently exists with operating and maintaining a 40 year old processing facility, nearly one‐third of the capital identified in the plant condition assessment has already been invested, and this has addressed the areas of highest risk. In 2010, Freshwater Fish underwent its regular Special Examination by the Office of the Auditor General of Canada. Freshwater was given an adverse opinion due to a number of governance, strategic, risk management and operational issues. As of April 30, 2013 all but one of the recommendations will have been implemented. Following is a detailed status of work undertaken:
Implementation schedule $'000Actual Spent FY 2008/09 - FY 2012/13 11,702$
FY 2013/14 1,715$ Phase II FY 2014/15 - FY 2021/22 18,171$ Phase III FY 2022/23 3,412$
35,000$
Planned spending
Total capital investment
Phase I

FFMC Corporate Plan FY2013/14 ‐ FY2017/18 5/27 Original Submission: February 2013 Summary Revised: April 30, 2014
REPORT ITEM STATUS / ACTION Board profile • A financial person now sits on the Audit and Risk Committee as an advisor
• The Board has submitted to the Minister a revised Board profile policy and is following this policy for all new appointment recommendations
Audit and Risk Committee
• Restructured and now in compliance
Internal audits • The Audit and Risk Committee and management have now approved a contract with KPMG to conduct internal audits
• A multi‐year audit plan has been approved and is in progress Long‐term strategic plan approval by shareholder
• The FY2012/13 plan was approved in April 2013 for a period of 2 years
Risk management • Management has created an Integrated Risk Management Plan which has been approved by the full Board and is now reviewed quarterly by the Audit and Risk Committee
Retained earnings
• A Long Term Debt and Retained Earnings Policy has been developed and approved by the Board in February 2011. It became effective May 1, 2011.
Human resources strategy
• A strategic plan for the HR department is in place
Contracting and procurement policy
• Contracting and procurement policy is now in place
The Corporate Plan presented here details how Freshwater Fish will continue to maximize returns to fishers in a self‐sustaining manner in its mandated region, provide economic opportunities for rural and remote communities, open global markets for Canadian freshwater fish and meet the most stringent requirements for food safety and sustainability.
Borrowingauthorityrequirements:Projected peak borrowing requirements will be as follows:
Management will need to balance the requirement for improving retained earnings with the economic realities of the fishery. In this manner Freshwater and the fishery it serves are not separate entities; they are an integral part of each other’s economic viability. The Corporation must remain mindful of this when setting buying prices and balance the multiple priorities of debt reduction, plant renovation and a fishery that needs price stability. A study was commissioned by Freshwater in 2008 to review financial policies, profit payout and retention, and levels of capitalization. Recommendations were provided on how Freshwater should finance its operations and pay Fishers in comparison to similar entities and industries. The study reviewed similar enterprises and concluded that Freshwater’s
FY 2013/14 FY 2014/15 FY 2015/16 FY 2016/17 FY 2017/18Operating debt $22,292 $21,602 $19,440 $17,158 $15,642Long-term debt $15,300 $16,887 $18,668 $20,336 $20,994Total Borrowing requirement (thousands) $37,592 $38,489 $38,108 $37,494 $36,636

FFMC Corporate Plan FY2013/14 ‐ FY2017/18 6/27 Original Submission: February 2013 Summary Revised: April 30, 2014
targeted retained earnings level should be at 20% of its annual net sales. Freshwater’s Long‐Term Debt and Retained Earnings Policy came into effect in the FY2011/12 plan year. Since the implementation of the Long‐Term Debt and Retained Earnings Policy, Freshwater has demonstrated progress in positioning the Corporation on a more solid financial footing. The following table shows the progress Freshwater has made, the forecasted commitment to improving retained earnings with the targeted 20% ratio of retained earnings to net sales being achieved by FY2017/18.
FY 2007/08 FY 2008-09 FY 2009/10 FY 2010-11 FY 2011/12 FY 2012/13 FY 2103/14 FY 2014/15 FY 2015/16 FY 2016/17 FY 2017/18Sales revenue 58,241$ 62,495$ 63,595$ 66,825$ 66,881$ 63,177$ 61,542$ 62,563$ 63,704$ 64,716$ 65,876$ Retained earnings 3,555$ 2,760$ 2,908$ 3,041$ 4,240$ 6,880$ 7,769$ 9,111$ 10,600$ 12,217$ 13,984$
R/E as a % of sales 6.10% 4.42% 4.57% 4.55% 6.34% 10.89% 12.62% 14.56% 16.64% 18.88% 21.23%
F O R E C A S T A C T U A L
Retained earnings policy in effect

FFMC Corporate Plan FY2013/14 ‐ FY2017/18 7/27 Original Submission: February 2013 Summary Revised: April 30, 2014
OverviewofFreshwaterFish
StatutoryAuthority
Freshwater Fish Marketing Act R.S.C. c.F‐13
Mandate
The Corporation's mandate is “to purchase all fish lawfully fished and offered for sale; to create an orderly market; to promote international markets; to increase fish trade; and to increase returns to fishers.”
Governance
Freshwater Fish Marketing Corporation (FFMC) is a federal Crown Corporation created in 1969 under the Freshwater Fish Marketing Act to regulate and promote interprovincial and export trade in freshwater fish. Its Board of Directors is composed of a Chairperson, a President and Chief Executive Officer, one Director for each participating province/territory, and four other Directors. All Board positions are federal Order‐in‐Council appointments, currently with three appointed on recommendation of the lieutenant governor‐in‐council of each participating province/territory. The Chairperson of the Board is a key link between the Corporation and the federal government, through the Minister of Fisheries and Oceans Canada and through other senior government officials. The Directors are accountable through the Chairperson to the Minister of Fisheries and Oceans. It is the Minister of Fisheries and Oceans who represents the Corporation in Cabinet and Parliament.
The Board acts as the trustee on behalf of the government by holding management accountable for the Corporation’s performance, its long‐term viability, and the achievement of its objectives. The Board is responsible for ensuring the Corporation is managing its assets, its human and financial resources in accordance with professional best business practices and standards.
In keeping with the requirements of the Financial Administration Act, there is currently one Committee reporting to the Board: the Audit and Risk Committee. Audit and Risk Committee members are appointed by the Board and the three (3) members are drawn from the Board. The Audit and Risk Committee may also appoint an individual who holds a professional accounting designation and is experienced in corporate finance to assist the Audit and Risk Committee as an advisor.
In addition, a temporary Selection Committee is formed whenever the Corporation is recruiting a new President and CEO. The Selection Committee is composed of the Board Chairperson and a minimum of three (3) Directors.

FFMC Corporate Plan FY2013/14 ‐ FY2017/18 8/27 Original Submission: February 2013 Summary Revised: April 30, 2014
CorporateBusinessProfile Freshwater operates as a self‐supporting business receiving no government appropriations, with a complex supply chain of delivery points, agents, temperature‐controlled transport, processing and inventory management to match the fish harvest of approximately 2,000 commercial fishers with market demand. It purchases approximately 15 million kgs of freshwater fish each year, which is packed whole or processed into fillets, minced and caviar products in the Winnipeg plant. The plant is federally‐inspected, kosher‐certified, and compliant with international standards for product safety and quality. Annual sales of approximately $66 million go to important niche markets in the USA (60%), Canada (18%), Europe (20%), and other markets (2%). A ‘final payment’ from any year‐end surpluses is distributed to fishers annually subject to the Long Term Debt and Retained Earnings Policy.
Vision,MissionandGoalsVisionFreshwater Fish Marketing Corporation maximizes returns to the fishers of Western Canada through effective marketing, efficient supply chain management and the value‐added processing of quality freshwater fish products.
MissionFreshwater will provide the core activities of its legislated mandate which are to:
• Purchase all fish offered for sale • Create an orderly market • Promote international markets • Increase trade in fish • Maximize returns to commercial fishers
To do this, Freshwater will support the orderly management of the freshwater fishery through planned harvesting, processing and marketing strategies to maximize returns to commercial fishers.
Goals• To generate market value and leadership • To manage an effective and efficient supply chain • To assure continued stakeholder confidence • To maintain corporate viability and sustainability

FFMC Corporate Plan FY2013/14 ‐ FY2017/18 9/27 Original Submission: February 2013 Summary Revised: April 30, 2014
StrategicInitiatives Use of corporate resources is guided by the seven strategies described in 3.5. The strategies drive ten strategic initiatives. Initiatives are designed to put strategies in motion by creating a structure from which strategic projects can be generated. Initiatives are usually three to five years in length. The following chart shows how initiatives address strategies.
Strategy/InitiativeMatrix
STRATEGIES
1‐Expand & diversify the
business
2‐Manage the business
with a m
arket orientation
3‐Promote sustainable
development &
com
mercial viability of
fishery
4‐Develop processing infrastructure to m
eet fishery &
market needs
5‐Ensure long‐term
financial viability of Corporation
6‐Promote environm
ent of total quality, lake to plate
7‐Stakeholder com
munications
I N I T I A V E S
1 Balance Sheet
2 Plant Renovation
3 Culture of Excellence
4 Lake‐to‐plate Quality Assurance
5 Supply Chain Management
6 Cost Management
7 Supply Development
8 Market & Product Development
9 Stakeholder Communication
10 Enterprise Resource Planning

FFMC Corporate Plan FY2013/14 ‐ FY2017/18 10/27 Original Submission: February 2013 Summary Revised: April 30, 2014
DescriptionofInitiatives 1. Balance sheet Freshwater Fish’s balance sheet was weak and as a result, the Corporation undertook a number of initiatives to address this. A retained earnings and long‐term debt policy was implemented, repayment of principal on long‐term capital debt is now occurring and working capital levels are managed more effectively. Improvement of the balance sheet must be managed against the need to avoid further reducing prices to fishers, many of whom are already operating at marginal economic levels. 2. Plant renovation In 2010 Freshwater engaged Genivar, consulting engineers, to provide a plant condition assessment for the 40 year old Winnipeg processing facility that included mechanical, electrical and structural engineering, building life‐cycle analysis and capital asset replacement planning. The study was designed to guide a major renovation of the plant, the objective of which is to extend the operational life of the plant to 2035, meet health and food safety standards and gain cost savings through processing efficiencies. The phased investment plan to improve the plant condition and to meet current food processing standards is provided in Appendix 2; highlights are: Major Plant Renovation Project
Of the $35 million in capital investment required for the major plant renovation, $11.7 million will have been spent as of April 30, 2013. The remaining $23.3 million of investment will be spent over the next 9 years with $1.715 million planned in FY 2013/14 and $2.4 million to be spent in each of the successive 9 years.
These figures do not include the capital impact of regular maintenance and replacement requirements in the plant nor the capital requirements of field operations.
3. Culture of excellence Missing skill sets have been resourced and performance development and pay‐at‐risk systems implemented. Now the focus will be implementation of a culture change that will see priority given to quality and excellence in all of the Corporation’s processes. 4. Lake to plate quality assurance Related to the Culture of Excellence initiative, there is an opportunity to increase value to fishers and customers by improving processes and work habits to provide a more consistent product with fewer errors in specifications, documentation and timing.
Implementation schedule $'000Actual Spent FY 2008/09 - FY 2012/13 11,702$
FY 2013/14 1,715$ Phase II FY 2014/15 - FY 2021/22 18,171$ Phase III FY 2022/23 3,412$
35,000$
Planned spending
Total capital investment
Phase I

FFMC Corporate Plan FY2013/14 ‐ FY2017/18 11/27 Original Submission: February 2013 Summary Revised: April 30, 2014
5. Supply chain management Until 2008 Freshwater had no formal supply chain management system. Since then a Supply Chain Manager has been hired and certain basic processes implemented. Going forward Freshwater will focus on streamlining logistics to reduce costs. 6. Cost management A number of systems, processes and reporting structures have been established to manage Freshwater’s costs. These include installing a Process Operating System, hiring a Cost Accountant and implementing standard costing systems. Basic yield management processes are in place in the most yield‐sensitive operations. The next priority will be real‐time continuous collection and analysis of yield data. 7. Supply development Food processing is a low‐margin, capital intensive business that requires high volumes to achieve profitability; with this in mind, building deliveries to meet the supply needs of growing markets is a priority. The focus will be on lake whitefish as the species with the most potential for growth both from a supply side and markets perspective. 8. Market and product development To grow volume and reduce risk while increasing prices over the long term the business must expand beyond its traditional markets and products. Freshwater Fish is investing where it has an opportunity to build new markets and working with partners to add new products. 9. Stakeholder communications Freshwater Fish has communications strategies for each of its stakeholder groups (fishers, customers, employees, government, public) and a communications company has been retained to help implement these strategies. The goal is to improve the understanding of and support for Freshwater among its stakeholders with a current focus on fishers and employees. Customer communication is addressed in the marketing plan. 10. Enterprise Resource Planning As part of its strategy to improve efficiency and reduce cost, Freshwater is migrating more of its business processes to its J.D. Edwards system. This migration will continue.

FFMC Corporate Plan FY2013/14 ‐ FY2017/18 12/27 Original Submission: February 2013 Summary Revised: April 30, 2014
OneYearActionPlan(FY2013/14) The Action Plan is separated into two parts: the first describes major corporate projects to be undertaken through the year; the second is a chart of the Key Performance Indicators (KPIs) by department.
CorporateProjects
Corporate projects are the vehicles that achieve progress against initiatives and therefore progress against strategies. It is at the project level that budgets, resources and outcomes are determined.
Corporate projects are often inter‐departmental or cross‐functional, and have an executive committee member as champion and a project leader. The executive committee champion updates the executive committee on progress, issues and resourcing requirements. The project leader looks after the day‐to‐day activities of the project and reports to the executive committee champion. All corporate projects have a project outline approved by the strategic planning team.
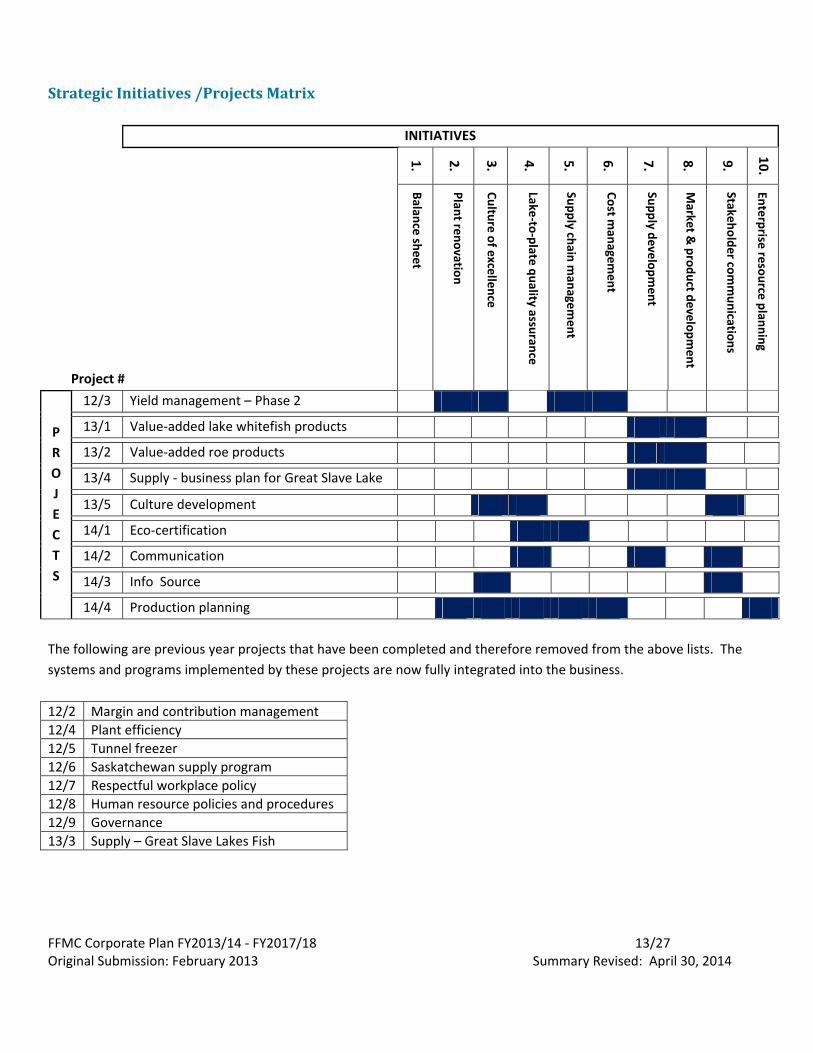
The following chart shows how corporate projects address initiatives. Each corporate project is described in detail.
FFMC Corporate Plan FY2013/14 ‐ FY2017/18 13/27 Original Submission: February 2013 Summary Revised: April 30, 2014
StrategicInitiatives/ProjectsMatrix
INITIATIVES
1.
2.
3.
4.
5.
6.
7.
8.
9.
10.
Project #
Balance sheet
Plant renovation
Culture of excellence
Lake‐to‐plate quality assurance
Supply chain managem
ent
Cost managem
ent
Supply development
Market &
product development
Stakeholder communications
Enterprise resource planning
P R O J E C T S
12/3 Yield management – Phase 2
13/1 Value‐added lake whitefish products
13/2 Value‐added roe products
13/4 Supply ‐ business plan for Great Slave Lake
13/5 Culture development
14/1 Eco‐certification
14/2 Communication
14/3 Info Source
14/4 Production planning The following are previous year projects that have been completed and therefore removed from the above lists. The systems and programs implemented by these projects are now fully integrated into the business. 12/2 Margin and contribution management 12/4 Plant efficiency 12/5 Tunnel freezer 12/6 Saskatchewan supply program 12/7 Respectful workplace policy 12/8 Human resource policies and procedures 12/9 Governance 13/3 Supply – Great Slave Lakes Fish

FFMC Corporate Plan FY2013/14 ‐ FY2017/18 14/27 Original Submission: February 2013 Summary Revised: April 30, 2014
KeyPerformanceIndicatorsbyDepartment Achievement of the Plan requires each department to operate within its expense budget and meet certain operational goals summarized in the Key Performance Indicators given below.
Department Metric Performance Target Corporate Net Income $1.89 million
Total Returns to Fishers (includes Saskatchewan)
$29.3 million
Finance Working Capital Management All capital asset purchases financed by long‐term debt as incurred Improve spare parts area inventory accuracy by January 31, 2014
Improve key performance indicator (KPI) reporting for operational areas of the Corporation
Plant operations by December 31, 2013 Sales & Marketing by December 31, 2013
Procurement and accounts payable process and cycle time improvement
Fully functional JD Edwards‐based system implemented by April 30, 2014
Sales and Marketing Gross and net sales $66.9 million/$61.5 million Northern pike market penetration Pin‐bone out portion sales: incremental
$365K revenue (North America, Germany, Finland)
Lake whitefish pin‐bone out expansion $490K in pin‐bone out portions and fillets Launch “made in Canada” fillets for fresh markets
New business $1.5 million Processing
Improve direct labour efficiency by 1.6% Move Kgs/Hour Process from 36.4 to 37.0 Improve Operational costs per KG by 6% Improve Operational cost per KG from
$1.50 to $1.41 Increase yield on walleye by 1% $600,000
Field Operations Delivery volume Total deliveries 10.7 million kilograms Great Slave Lake lake whitefish deliveries
Work with NWTFF to act as local agent and complete business plans for new plant construction in 2014
Communication with fishers 15 fisher meetings, 4 newsletters Quality Assurance and Technical Services
Compliance ‐ customers Pass all customer audits Compliance ‐ CFIA Plant quality compliant with CFIA Eco‐certification Complete MSC eco‐certification project on
Waterhen area Achieve minimum 90% pass rate on fillet inspection scores
90% pass rate on fillet inspection scores by Quality Control
Improve sanitation performance to minimum 80% pass rate
80% pass rate on pre‐op testing by Quality Control
Human Resources and Plant Safety ‐ Reduce accident frequency Reduce from 15.6 to 13.0

FFMC Corporate Plan FY2013/14 ‐ FY2017/18 15/27 Original Submission: February 2013 Summary Revised: April 30, 2014
Government Services per 100 employees Reduce % of employee plant absenteeism
Reduce from 15% in FY2013 to 13% in FY2014
Supply Chain
Cold storage cost reduction Improve cold storage cost per delivered KG from $0.086 to $0.077
Production planning & JD Edwards System
Develop training and planning modules for integration by September 1, 2013
President’s Office Communication: Quarterly meetings with staff and fisher newsletters
One each quarter
Produce new strategic plan document Complete by April 30, 2014
Communication: Major elements of the strategic plan to be communicated to employees
Complete by April 30, 2014
Disaster and business recovery plan Draft to Audit and Risk Committee by April 30, 2014

FFMC Corporate Plan FY2013/14 ‐ FY2017/18 16/27 Original Submission: February 2013 Summary Revised: April 30, 2014
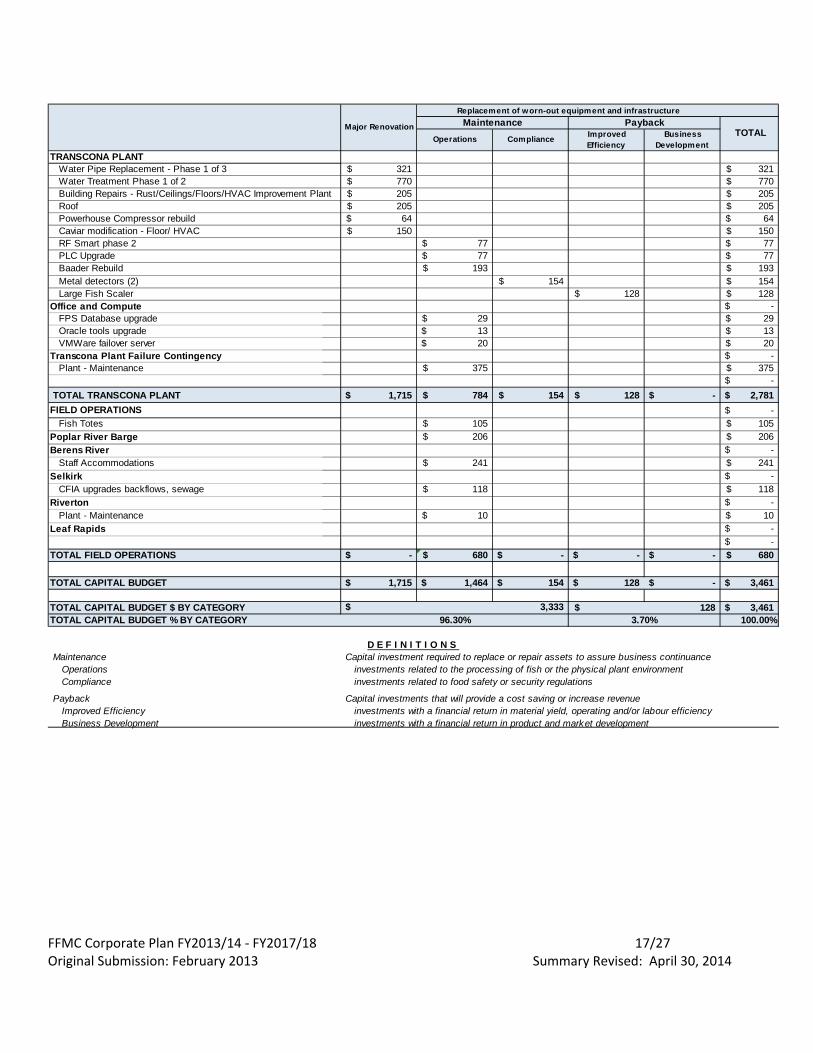
CapitalBudget In developing the capital plan for the planning period, Freshwater has taken into account all aspects of the challenges of a 40 year old processing infrastructure and designed a capital plan that is affordable within its borrowing limits while meeting the commitment of paying down debt. Investments as per Schedule A below are made in categories such as maintenance or replacement of aging plant infrastructure and information technology. Schedule A
The accompanying schedule on the next page provides a detailed breakdown by spending category. Investment in the plant since its original opening in 1971 was minimal until FY2006/07, running at or below the annual depreciation rate. After more than 40 years of operation, equipment and infrastructure are nearing the end of their useful life creating three sets of issues for the Corporation.
• Maintenance: Aging equipment and infrastructure are expensive to maintain and are increasingly prone to break‐down during periods of heavy use.
• Food safety regulations and customer quality assurance standards: Well‐publicized food safety problems have increased public sensitivity to safety in food processing, reinforcing an existing trend toward more rigid enforcement of regulations and more demanding standards applied by customers. The difficulty and additional cost of complying with regulations and the quality assurance standards of customers have become a factor in the industry and for the Corporation.
• Efficiency: Old technology and worn‐out equipment reduce efficiencies and yields, increasing costs and adding to the difficulties of competing in a strong dollar environment.
In 2010 Freshwater engaged Genivar, consulting engineers, in response to this situation to provide a plant condition assessment for the 40 year old Winnipeg processing facility that included mechanical, electrical and structural engineering, building life‐cycle analysis and capital asset planning. The objective of the study was to extend the operational life of the plant to 2035, meet health and food safety standards and gain cost savings through processing efficiencies.
FY 2013/14 FY 2014/15 FY 2015/16 FY 2016/17 FY 2017/18Major Renovation 1,715,000$ 1,700,000$ 1,700,000$ 1,700,000$ 1,700,000$ Maintenance 1,066,000$ 1,050,000$ 1,050,000$ 1,050,000$ 1,050,000$
Total Plant 2,781,000$ 2,750,000$ 2,750,000$ 2,750,000$ 2,750,000$
Total Field Operations 680,000$ 250,000$ 250,000$ 250,000$ 250,000$
Total Capital Investment 3,461,000$ 3,000,000$ 3,000,000$ 3,000,000$ 3,000,000$
FFMC Corporate Plan FY2013/14 ‐ FY2017/18 17/27 Original Submission: February 2013 Summary Revised: April 30, 2014
Operations Compliance Improved Efficiency
Business Development
TRANSCONA PLANTWater Pipe Replacement - Phase 1 of 3 321$ 321$ Water Treatment Phase 1 of 2 770$ 770$ Building Repairs - Rust/Ceilings/Floors/HVAC Improvement Plant 205$ 205$ Roof 205$ 205$ Powerhouse Compressor rebuild 64$ 64$ Caviar modification - Floor/ HVAC 150$ 150$ RF Smart phase 2 77$ 77$ PLC Upgrade 77$ 77$ Baader Rebuild 193$ 193$ Metal detectors (2) 154$ 154$ Large Fish Scaler 128$ 128$
Office and Compute -$ FPS Database upgrade 29$ 29$ Oracle tools upgrade 13$ 13$ VMWare failover server 20$ 20$
Transcona Plant Failure Contingency -$ Plant - Maintenance 375$ 375$
-$ TOTAL TRANSCONA PLANT 1,715$ 784$ 154$ 128$ -$ 2,781$
FIELD OPERATIONS -$ Fish Totes 105$ 105$
Poplar River Barge 206$ 206$ Berens River -$
Staff Accommodations 241$ 241$ Selkirk -$
CFIA upgrades backflows, sewage 118$ 118$ Riverton -$
Plant - Maintenance 10$ 10$ Leaf Rapids -$
-$ TOTAL FIELD OPERATIONS -$ 680$ -$ -$ -$ 680$
TOTAL CAPITAL BUDGET 1,715$ 1,464$ 154$ 128$ -$ 3,461$
TOTAL CAPITAL BUDGET $ BY CATEGORY 3,461$ TOTAL CAPITAL BUDGET % BY CATEGORY 100.00%
Maintenance Capital investment required to replace or repair assets to assure business continuanceOperations investments related to the processing of fish or the physical plant environmentCompliance investments related to food safety or security regulations
Payback Capital investments that will provide a cost saving or increase revenueImproved Efficiency investments with a financial return in material yield, operating and/or labour efficiencyBusiness Development investments with a financial return in product and market development
D E F I N I T I O N S
96.30%
TOTAL Payback
128$ 3.70%
3,333$
Replacement of worn-out equipment and infrastructureMaintenanceMajor Renovation
FFMC Corporate Plan FY2013/14 ‐ FY2017/18 18/27 Original Submission: February 2013 Summary Revised: April 30, 2014
OperatingBudget Freshwater Fish is committed to running a high quality and effective organization by providing commercial and economic development, assuring food security and safety and encouraging and shaping markets for Canadian freshwater fish exports throughout the world. Freshwater Fish’s projected operating budget for FY2013/14 is $52.9 million based on net sales revenue of $61.5 million. The attached projected financial statements reveal the fiscal realities of these commitments and the financial outcome of supporting the strategies discussed in this plan.
FishDeliveriesFreshwater has developed a comprehensive lake‐by‐lake supply development plan that has been incorporated into the financial projections. This plan is updated throughout the year as local weather, lake and stock conditions change.
RevenuesFreshwater Fish’s revenues consider the growth expectations consistent with the objectives of the market, product development initiatives and forecast supply volumes.
ExpenseManagementFreshwater has a cost management initiative described within the plan that includes a mix of annual savings from operating and labour efficiencies, material yield and process improvements. These improvements have been incorporated into the financial statements.
PaymentstoFishers
InitialPaymentFreshwater continues to face challenges in its business that include the need to increase fish deliveries, weak financial viability for fisheries, the appreciation of the Canadian dollar, high costs to fishers of fishing in today’s economy, and global market competition for protein foods that include freshwater fish. In addressing these challenges, Freshwater has achieved and is forecasting reductions in overhead expenses, improvements in operating efficiencies, increases in retained earnings and repayment of long‐term debt from FY2013/14 through FY2017/18. These measures will continue to place the Corporation on a more solid financial footing. As Freshwater continues to attain a more solid financial footing through the initiatives described above, the % of total payment paid to fishers as initial payments which is used by Freshwater to purchase fish and encourage deliveries will remain essentially constant with minor adjustment to certain species to address volume issues. Of all the challenges Freshwater faces, the largest is the low volume of fish deliveries. Without fish, Freshwater does not have a business. Through Freshwater’s mandate and its commitment to balance fish supply from fishers with the market demand, it is paramount that Freshwater continue to

FFMC Corporate Plan FY2013/14 ‐ FY2017/18 19/27 Original Submission: February 2013 Summary Revised: April 30, 2014
encourage deliveries through its initial pricing strategies to obtain operating efficiencies and economies of scale in its operations. Although there is some risk that Freshwater may overpay for fish since prices are established at the beginning of the season, Freshwater has safeguards to mitigate its risk in overpaying fishers through the initial payment:
1. Prices are set seasonally – summer and winter to encourage fishing in periods that match the market demand for the particular species of fish.
2. Prices are set by species, form and size. 3. Quality standards are set to ensure that purchases are of sellable quality. 4. Significant market fluctuations during the year can be reacted to by changing the price paid to
fishers. 5. 80% of Freshwater’s foreign currency revenue is protected against currency fluctuations through
hedging contracts. This is reflected in the initial price to fishers. 6. Payments are only made to fishers when fish is delivered and have passed quality inspection
that it is received in good quality.
FinalPaymentandRetainedEarningsFFMC’s targeted retained earnings level will be 20% of annual sales revenue per the 2008 Grant Thornton analysis (attached as Appendix 7). The Corporation has increased its retained earnings over the last four years from 2.8 million in FY2009/10 to 6.9 million in FY2012/13. Cumulative net income before final payment over that 4 year period was $13.1 million with only $7.5 million or 57% paid out to fishers as final payment. The remaining 43% was reinvested in the Corporation. The 2013/14 to 2017/18 Corporate Plan demonstrates progress towards the required retained earnings level by FY2017/18. The Corporation’s goal is to meet the 20% retained earnings target by FY2019/20.
DebtFreshwater’s legislated borrowing limit is $50 million and currently is authorized at $39.5 million. The Corporation currently utilizes a revolving demand credit facility providing access to funds up to the amount of $29.5 million in short term borrowings and $10 million in long‐term borrowings. The funds are advanced through loans, overdrafts, promissory notes and bankers’ acceptances. The bankers’ acceptances are renewed weekly and are projected in FY2013/14 to bear a weighted average interest rate of 2.05%. The U.S. dollar denominated promissory note is renewed for 3 or 6 month terms and is projected to bear a weighted average interest rate of 2.38% in FY2013/14. Financial projections over the planning period demonstrate that debt will be restructured and paid down based on the following assumptions.
FFMC Corporate Plan FY2013/14 ‐ FY2017/18 20/27 Original Submission: February 2013 Summary Revised: April 30, 2014
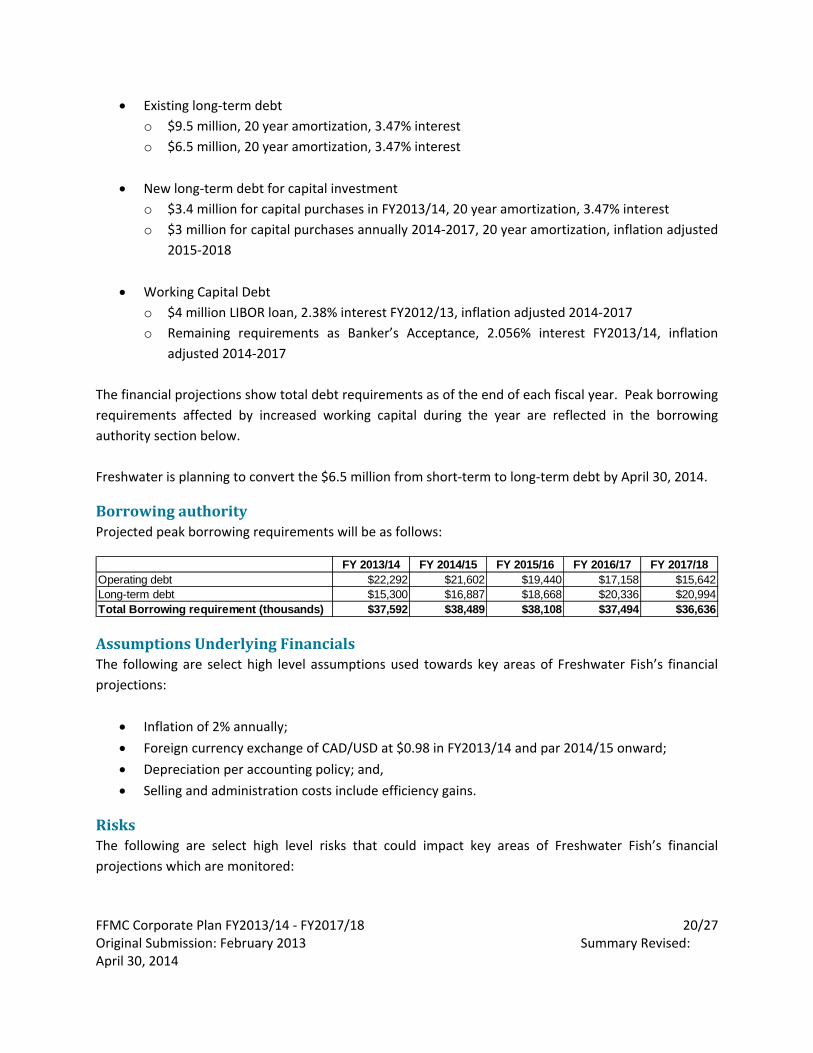
• Existing long‐term debt o $9.5 million, 20 year amortization, 3.47% interest o $6.5 million, 20 year amortization, 3.47% interest
• New long‐term debt for capital investment
o $3.4 million for capital purchases in FY2013/14, 20 year amortization, 3.47% interest o $3 million for capital purchases annually 2014‐2017, 20 year amortization, inflation adjusted
2015‐2018
• Working Capital Debt o $4 million LIBOR loan, 2.38% interest FY2012/13, inflation adjusted 2014‐2017 o Remaining requirements as Banker’s Acceptance, 2.056% interest FY2013/14, inflation
adjusted 2014‐2017 The financial projections show total debt requirements as of the end of each fiscal year. Peak borrowing requirements affected by increased working capital during the year are reflected in the borrowing authority section below. Freshwater is planning to convert the $6.5 million from short‐term to long‐term debt by April 30, 2014.
BorrowingauthorityProjected peak borrowing requirements will be as follows:
AssumptionsUnderlyingFinancialsThe following are select high level assumptions used towards key areas of Freshwater Fish’s financial projections:
• Inflation of 2% annually; • Foreign currency exchange of CAD/USD at $0.98 in FY2013/14 and par 2014/15 onward; • Depreciation per accounting policy; and, • Selling and administration costs include efficiency gains.
Risks The following are select high level risks that could impact key areas of Freshwater Fish’s financial projections which are monitored:
FY 2013/14 FY 2014/15 FY 2015/16 FY 2016/17 FY 2017/18Operating debt $22,292 $21,602 $19,440 $17,158 $15,642Long-term debt $15,300 $16,887 $18,668 $20,336 $20,994Total Borrowing requirement (thousands) $37,592 $38,489 $38,108 $37,494 $36,636
FFMC Corporate Plan FY2013/14 ‐ FY2017/18 21/27 Original Submission: February 2013 Summary Revised: April 30, 2014
• Continued global economic challenges could further strengthen the Canadian dollar, reducing sales revenue;
• Increasing interest rates; • Declining marketability of fish due to lack of eco‐certification; and, • Buying price affects delivered volume. Although walleye deliveries are stable at current prices
lake whitefish and northern pike, both essential to the business, are at a point on the price/supply curve that is very elastic. With more than forty years of data and experience Freshwater understands that at current price levels fishers are making decisions on whether to fish or not to fish based on their individual assessment of how they will maximize income over the next year, by fishing, by working outside of their community or a combination of both. These individual decisions multiplied by 2000 fishers have a critical impact on Freshwater’s own viability.

FFMC Corporate Plan FY2013/14 ‐ FY2017/18 22/27 Original Submission: February 2013 Summary Revised: April 30, 2014
StatementofOperations,ComprehensiveIncomeandRetainedEarnings2014
Freshwater Fish Marketing Corporation Pro-Forma Financial StatementsS7 - Quarterly Income Statement Annual Quarterly Quarterly Quarterly Quarterly Annual
Actual Plan Plan Plan Plan PlanFiscal 2013 Fiscal 2014 Fiscal 2014 Fiscal 2014 Fiscal 2014 Fiscal 2014
Start Date 1-May-2012 1-May-2013 1-Aug-2013 1-Nov-2013 1-Feb-2014End Date 30-Apr-2013 31-Jul-2013 31-Oct-2013 31-Jan-2014 30-Apr-2014
Quarterly income statement - consolidated
($'000, unless otherw ise stated)Sales and gross marginNet delivered w eight to customers (kg) 7,706,982 1,817,776 2,386,240 1,902,957 2,153,983 8,260,956Total gross sales at customer location - 15,444 17,926 14,356 19,194 66,919Plus (less): Fx gain/(loss) - (199) (234) (184) (258) (875)Less: discounts and allow ances - (1,033) (1,239) (976) (1,255) (4,503)Total net sales 63,475 14,212 16,453 13,195 17,681 61,542
Cost of salesOpening inventory of f inished f ish products 9,618 12,744 16,183 18,630 17,108 12,744Plus: f ish purchases and processing expenses
Fish purchases - mandated area 25,449 8,614 9,458 3,623 3,751 25,445Fish purchases - Saskatchew an 1,988 865 175 537 180 1,757Processing and operating costs 26,336 5,595 6,644 5,304 7,023 24,567Plant salaries, w ages and benefits 11,728 2,492 2,959 2,362 3,128 10,940Processing and operating costs 4,196 892 1,059 845 1,119 3,914Packaging and storage 3,943 838 995 794 1,051 3,678Freight 3,260 693 822 657 869 3,041Repair and maintenance 1,835 390 463 370 489 1,712Utilities and property taxes 1,374 292 347 277 366 1,282Depreciation and amortization of production assets 1,401 472 476 480 483 1,911Contingency - - - - - -
Sub-total 64,792 28,291 32,936 28,574 28,545 66,424Less: ending inventory of processed f ish products (12,744) (16,183) (18,630) (17,108) (13,432) (13,432)Total cost of sales 52,048 12,108 14,306 11,465 15,113 52,992
Gross profit on operations 11,427 2,105 2,147 1,730 2,567 8,549$ per kg $1.48 $1.16 $0.90 $0.91 $1.19 $1.03% of net sales 18.0% 14.8% 13.1% 13.1% 14.5% 13.9%
Marketing and administrative expensesSalaries and benefits 3,360 547 547 547 547 2,186Commissions 1,253 187 246 196 222 851Data processing, off ice and professional services 1,113 161 161 161 161 644Interest expense, net 699 205 208 225 220 858Advertising and promotion 368 72 72 72 72 288Meeting fees and expenses 97 22 22 22 22 88Other marketing and administrative expenses 540 102 102 102 102 408Depreciation and amortization of administration assets 39 23 23 23 23 90Total marketing and administrative expenses 7,469 1,318 1,380 1,347 1,368 5,414
Other income and expenses 564 (312) (312) (312) (312) (1,247)
Profit before provision for final payments to fishers 4,522 475 455 72 887 1,889Provision for f inal payments to fishers (2,050) - - - (1,000) (1,000)Income tax expense (recovery) (168) - - - - -
Total comprehensive income 2,640 475 455 72 (113) 889Retained earnings, beginning of period 4,240 6,880 7,355 7,810 7,882 6,880Retained earnings, end of period 6,880 7,355 7,810 7,882 7,769 7,769
Provision for f inal payments to fishers (2,050) (1,000)Payment %* 73.2% 84.0%
Payment % = [Provision for f inal payments to fishers + f ish purchases - mandated area] ÷ [Fish purchases - mandated area + f ish purchases - non-mandated area +profit before provision for f inal payments to f ishers]

FFMC Corporate Plan FY2013/14 ‐ FY2017/18 23/27 Original Submission: February 2013 Summary Revised: April 30, 2014
BalanceSheet2014
Freshwater Fish Marketing Corporation Pro-Forma Financial StatementsS8 - Quarterly Balance Sheet Annual Quarterly Quarterly Quarterly Quarterly
Actual Plan Plan Plan PlanFiscal 2013 Fiscal 2014 Fiscal 2014 Fiscal 2014 Fiscal 2014
Start Date 1-May-2012 1-May-2013 1-Aug-2013 1-Nov-2013 1-Feb-2014End Date 30-Apr-2013 31-Jul-2013 31-Oct-2013 31-Jan-2014 30-Apr-2014
Quarterly balance sheet - consolidated
($'000)AssetsCurrent assets
Cash 10 50 50 50 50Trade receivables 6,396 6,397 6,765 6,830 4,932Prepaid expenses 64 348 380 379 273Income taxes receivable 516 516 516 516 516Inventories
Processed f ish products, net of w rite-dow nsWalleye (Pickerel) 7,988 11,162 13,051 11,760 7,988Lake Whitef ish 697 915 1,266 760 697Northern Pike 3,658 3,366 3,305 3,526 3,658Sauger 318 307 364 333 307Mullet 36 111 164 268 374Perch 19 52 360 431 379Lake Trout 17 258 110 20 17Other 10 10 10 10 10
Total processed f ish products, net of w rite-dow ns 12,744 16,183 18,630 17,108 13,432Raw materials and supplies 1,106 1,106 1,106 1,106 1,106
Total inventories 13,850 17,289 19,736 18,214 14,538Derivative-related assets 115 115 115 115 115
Total current assets 20,951 24,715 27,562 26,104 20,424Property, plant and equipment 21,172 21,550 21,924 22,295 22,662Intangible assets 29 29 29 29 29Total assets 42,152 46,294 49,515 48,427 43,115LiabilitiesCurrent liabilities
Trade and other payables and accrued liabilities 3,695 4,277 4,671 4,657 3,361Current portion of accrued obligation for employee benefits 683 683 683 683 683Provision for f inal payments to f ishers 2,050 2,050 2,050 - 1,000Operating line (LIBOR) 4,030 4,030 4,030 4,030 4,030Operating line (BA Short Term) 7,200 10,519 13,124 14,262 6,191Current portion of long-term debt 933 933 933 933 1,053Derivative-related liabilities 606 606 606 606 606
Total current liabilities 19,197 23,098 26,097 25,171 16,924Operating line (BA LT) #1 15,067 14,833 14,600 14,367 17,414Deferred tax liabilities 649 649 649 649 649Accrued obligation for employee benefits 309 309 309 309 309Asset retirement obligation 50 50 50 50 50Total liabilities 35,272 38,939 41,705 40,546 35,346EquityRetained earnings 6,880 7,355 7,810 7,882 7,769Total liabilities and equity 42,152 46,294 49,515 48,427 43,115
Quarterly peak borrowing requirementOperating line (LIBOR) 4,030 4,030 4,030 4,030Operating line (BA Short Term) 11,799 13,124 14,262 13,773Current portion of long-term debt 933 933 933 933Long-term debt 14,911 14,600 14,367 14,289Total peak borrowing requirement 31,674 32,687 33,592 33,025Contingency 4,000 4,000 4,000 4,000Adjusted peak borrowing requirement 35,674 36,687 37,592 37,025

FFMC Corporate Plan FY2013/14 ‐ FY2017/18 24/27 Original Submission: February 2013 Summary Revised: April 30, 2014
StatementofCashFlows2014
Freshwater Fish Marketing Corporation Pro-Forma Financial StatementsS9 - Quarterly Cash Flow Statement Annual Quarterly Quarterly Quarterly Quarterly Annual
Actual Plan Plan Plan Plan PlanFiscal 2013 Fiscal 2014 Fiscal 2014 Fiscal 2014 Fiscal 2014 Fiscal 2014
Start Date 1-May-2012 1-May-2013 1-Aug-2013 1-Nov-2013 1-Feb-2014End Date 30-Apr-2013 31-Jul-2013 31-Oct-2013 31-Jan-2014 30-Apr-2014
Quarterly cash flow statement - consolidated
($'000)Operating activitiesComprehensive income for the period 2,640 475 455 72 (113) 889Plus: future tax expense 336 - - - - -Plus: depreciation and amortization of production assets 1,572 472 476 480 483 1,911Plus: depreciation and amortization of administration assets - - - - - -Loss on disposal of property, plant and equipment 13 - - - - -Plus (less): changes in non-cash operating w orking capital
Trade receivables (4) (1) (367) (65) 1,897 1,464Inventories
Total processed f ish products, net of w rite-dow ns (3,359) (3,439) (2,447) 1,522 3,677 (688)Raw materials and supplies - - - - - -
Total inventories (3,359) (3,439) (2,447) 1,522 3,677 (688)Prepaid expenses 630 (284) (32) 1 105 (209)Income taxes receivable (401) - - - - -Derivative-related assets 24 - - - - -Trade and other payables and accrued liabilities (1,618) 582 394 (15) (1,295) (334)Derivative-related liabilities 212 - - - - -Provision for f inal payments to f ishers (900) - - (2,050) 1,000 (1,050)Accrued obligation for employee benefits (584) - - - - -Asset retirement obligation - - - - - -Sub-total (6,000) (3,143) (2,452) (606) 5,384 (817)
Cash from operating activities (1,439) (2,195) (1,521) (55) 5,754 1,983
Investing activitiesAdditions to property, plant and equipment (5,166) (850) (850) (850) (850) (3,401)Investment tax credits received for PP&E 115 - - - - -Proceeds on disposal of property, plant and equipment 2 - - - - -Cash from investing activities (5,049) (850) (850) (850) (850) (3,401)
Financing activitiesPlus (less): changes in debt
Operating line (LIBOR) 78 - - - - -Operating line (BA Short Term) - 3,319 2,605 1,139 (8,071) (1,009)Current portion of long-term debt - - - - 120 120Long-term debt 6,000 (233) (233) (233) 3,048 2,348Sub-total 6,078 3,086 2,371 905 (4,904) 1,458
Cash from f inancing activities 6,078 3,086 2,371 905 (4,904) 1,458
Net increase (decrease) in cash and cash equivalents (410) 40 - (0) - 40Plus: cash and cash equivalents, beginning of period 420 10 50 50 50 10Cash and cash equivalents, end of period 10 50 50 50 50 50

FFMC Corporate Plan FY2013/14 ‐ FY2017/18 25/27 Original Submission: February 2013 Summary Revised: April 30, 2014
StatementofOperations,ComprehensiveIncomeandRetainedEarnings2014‐2018
Freshw ater Fish Marketing Corporation Pro-Forma Financial StatementsS1 - Annual Income Statement Annual Annual Annual Annual Annual Annual
Actual Plan Plan Plan Plan PlanFiscal 2013 Fiscal 2014 Fiscal 2015 Fiscal 2016 Fiscal 2017 Fiscal 2018
Start Date 1-May-2012 1-May-2013 1-May-2014 1-May-2015 1-May-2016 1-May-2017End Date 30-Apr-2013 30-Apr-2014 30-Apr-2015 30-Apr-2016 30-Apr-2017 30-Apr-2018
Annual income statement - consolidated
($'000, unless otherwise stated)Sales and gross marginNet delivered w eight to customers (kg) 7,706,982 8,260,956 7,907,160 8,060,295 8,215,521 8,372,872Total gross sales at customer location - 66,919 67,009 68,235 69,334 70,582Plus (less): Fx gain/(loss) - (875) - - - -Less: discounts and allow ances - (4,503) (4,446) (4,532) (4,618) (4,706)Total net sales 63,475 61,542 62,563 63,704 64,716 65,876
Cost of salesOpening inventory of f inished fish products 9,618 12,744 13,432 13,432 13,432 13,432Plus: f ish purchases and processing expenses
Fish purchases - mandated area 25,449 25,445 25,708 26,253 26,524 26,798Fish purchases - Saskatchew an 1,988 1,757 1,540 1,340 1,419 1,500Plant salaries, w ages and benefits 11,728 10,940 10,752 10,945 11,093 11,305Processing and operating costs 4,196 3,914 3,847 3,916 3,969 4,045Packaging and storage 3,943 3,678 3,615 3,680 3,729 3,801Freight 3,260 3,041 2,989 3,042 3,083 3,142Repair and maintenance 1,835 1,712 1,682 1,713 1,736 1,769Utilities and property taxes 1,374 1,282 1,260 1,282 1,300 1,324Depreciation and amortization of production assets 1,401 1,911 1,991 2,092 2,183 2,265Contingency - - - - - -
Sub-total 64,792 66,424 66,816 67,695 68,466 69,379Less: ending inventory of processed f ish products (12,744) (13,432) (13,432) (13,432) (13,432) (13,432)Total cost of sales 52,048 52,992 53,385 54,264 55,035 55,947
Gross profit on operations 11,427 8,549 9,179 9,440 9,681 9,928$ per kg $1.48 $1.03 $1.16 $1.17 $1.18 $1.19% of net sales 18.0% 13.9% 14.7% 14.8% 15.0% 15.1%
Marketing and administrative expensesSalaries and benefits 3,360 2,186 2,274 2,320 2,366 2,414Commissions 1,253 851 814 830 846 862Data processing, off ice and professional services 1,113 644 670 684 698 712Interest expense, net 699 858 921 943 961 962Advertising and promotion 368 288 300 306 312 318Meeting fees and expenses 97 88 92 94 95 97Other marketing and administrative expenses 540 408 424 433 441 450Depreciation and amortization of administration assets 39 90 94 96 98 100Total marketing and administrative expenses 7,469 5,414 5,590 5,705 5,817 5,914
Other income and expenses 564 (1,247) (1,247) (1,247) (1,247) (1,247)
Profit before provision for final payments to fishers 4,522 1,889 2,342 2,489 2,617 2,767Provision for f inal payments to f ishers (2,050) (1,000) (1,000) (1,000) (1,000) (1,000)Income tax expense (recovery) (168) - - - - -
Total comprehensive income 2,640 889 1,342 1,489 1,617 1,767Retained earnings, beginning of period 4,240 6,880 7,769 9,111 10,600 12,218Retained earnings, end of period 6,880 7,769 9,111 10,600 12,218 13,985
Provision for f inal payments to f ishers (2,050) (1,000) (1,000) (1,000) (1,000) (1,000)Payment %* 73.2% 84.0% 83.5% 83.9% 83.5% 83.0%
Payment % = [Provision for f inal payments to f ishers + f ish purchases - mandated area] ÷ [Fish purchases - mandated area + f ish purchases - non-mandated area +profit before provision for f inal payments to f ishers]

FFMC Corporate Plan FY2013/14 ‐ FY2017/18 26/27 Original Submission: February 2013 Summary Revised: April 30, 2014
BalanceSheet2014‐2018
Freshw ater Fish Marketing Corporation Pro-Forma Financial StatementsS2 - Annual Balance Sheet Annual Annual Annual Annual Annual Annual
Actual Plan Plan Plan Plan PlanFiscal 2013 Fiscal 2014 Fiscal 2015 Fiscal 2016 Fiscal 2017 Fiscal 2018
Start Date 1-May-2012 1-May-2013 1-May-2014 1-May-2015 1-May-2016 1-May-2017End Date 30-Apr-2013 30-Apr-2014 30-Apr-2015 30-Apr-2016 30-Apr-2017 30-Apr-2018
Annual balance sheet - consolidated
($'000)AssetsCurrent assets
Cash 10 50 50 50 50 50Trade receivables 6,396 4,932 4,981 4,995 4,998 4,986Prepaid expenses 64 273 267 267 267 266Income taxes receivable 516 516 516 516 516 516Inventories
Processed fish products, net of w rite-dow nsWalleye (Pickerel) 7,988 7,988 7,988 7,988 7,988 7,988Lake Whitef ish 697 697 697 697 697 697Northern Pike 3,658 3,658 3,658 3,658 3,658 3,658Sauger 318 307 307 307 307 307Mullet 36 374 374 374 374 374Perch 19 379 379 379 379 379Lake Trout 17 17 17 17 17 17Other 10 10 10 10 10 10
Total processed fish products, net of w rite-dow ns 12,744 13,432 13,432 13,432 13,432 13,432Raw materials and supplies 1,106 1,106 1,106 1,106 1,106 1,106
Total inventories 13,850 14,538 14,538 14,538 14,538 14,538Derivative-related assets 115 115 115 115 115 115
Total current assets 20,951 20,424 20,466 20,481 20,483 20,471Property, plant and equipment 21,172 22,662 23,671 24,580 25,397 26,132Intangible assets 29 29 29 29 29 29Total assets 42,152 43,115 44,167 45,090 45,909 46,633LiabilitiesCurrent liabilities
Trade and other payables and accrued liabilities 3,695 3,361 3,281 3,288 3,280 3,275Current portion of accrued obligation for employee benefits 683 683 683 683 683 683Provision for f inal payments to f ishers 2,050 1,000 1,000 1,000 1,000 1,000Operating line (LIBOR) 4,030 4,030 4,030 4,030 4,030 4,030Operating line (BA Short Term) 7,200 6,191 4,033 1,622 - -Current portion of long-term debt 933 1,053 1,162 1,275 1,390 1,509Derivative-related liabilities 606 606 606 606 606 606
Total current liabilities 19,197 16,924 14,795 12,504 10,989 11,104Long-term debt 15,067 17,414 19,252 20,978 21,695 20,536Deferred tax liabilities 649 649 649 649 649 649Accrued obligation for employee benefits 309 309 309 309 309 309Asset retirement obligation 50 50 50 50 50 50Total liabilities 35,272 35,346 35,055 34,490 33,692 32,648EquityRetained earnings 6,880 7,769 9,111 10,600 12,218 13,985Total liabilities and equity 42,152 43,115 44,167 45,090 45,909 46,633
Annual peak borrowing requirementOperating line (LIBOR) 4,030 4,030 4,030 4,030 4,030Operating line (BA Short Term) 14,262 12,517 10,244 7,847 6,214Current portion of long-term debt 933 1,055 1,166 1,281 1,398Long-term debt 14,367 16,886 18,668 20,336 20,994Total peak borrowing requirement before undernoted 33,592 34,489 34,108 33,494 32,636Contingency 4,000 4,000 4,000 4,000 4,000Adjusted peak borrowing requirement 37,592 38,489 38,108 37,494 36,636
FFMC Corporate Plan FY2013/14 ‐ FY2017/18 27/27 Original Submission: February 2013 Summary Revised: April 30, 2014
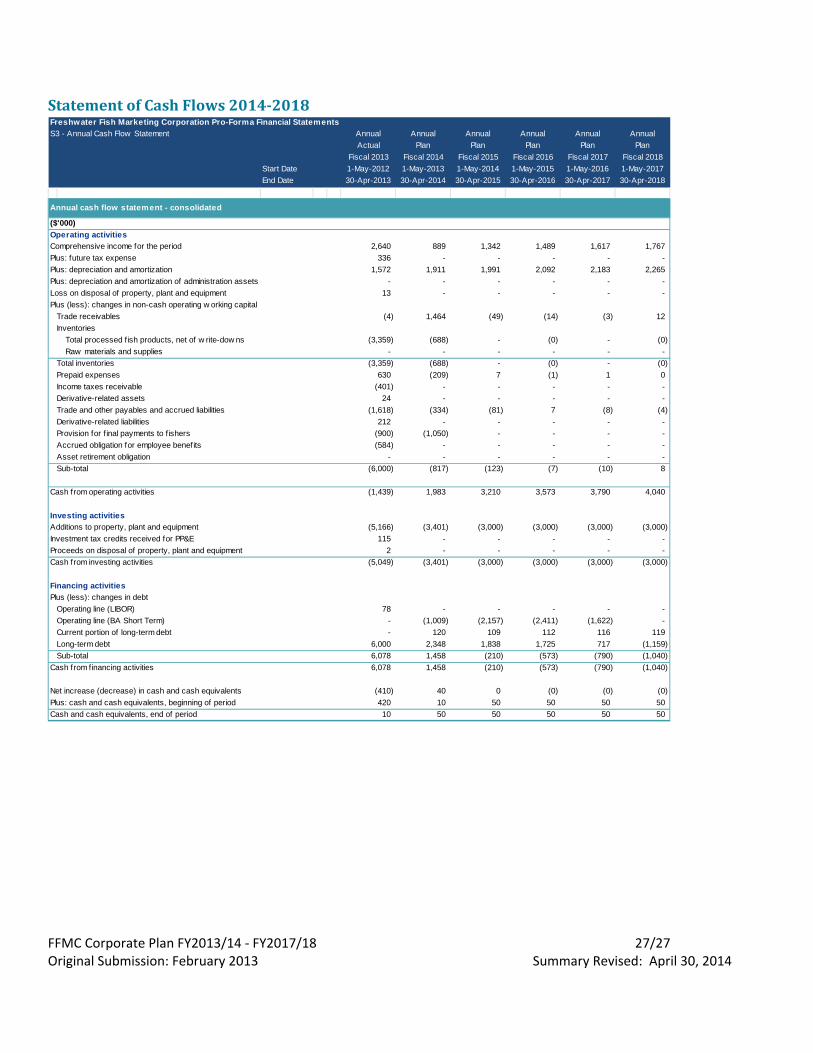
StatementofCashFlows2014‐2018
Freshwater Fish Marketing Corporation Pro-Forma Financial StatementsS3 - Annual Cash Flow Statement Annual Annual Annual Annual Annual Annual
Actual Plan Plan Plan Plan PlanFiscal 2013 Fiscal 2014 Fiscal 2015 Fiscal 2016 Fiscal 2017 Fiscal 2018
Start Date 1-May-2012 1-May-2013 1-May-2014 1-May-2015 1-May-2016 1-May-2017End Date 30-Apr-2013 30-Apr-2014 30-Apr-2015 30-Apr-2016 30-Apr-2017 30-Apr-2018
Annual cash flow statement - consolidated
($'000)Operating activitiesComprehensive income for the period 2,640 889 1,342 1,489 1,617 1,767Plus: future tax expense 336 - - - - -Plus: depreciation and amortization 1,572 1,911 1,991 2,092 2,183 2,265Plus: depreciation and amortization of administration assets - - - - - -Loss on disposal of property, plant and equipment 13 - - - - -Plus (less): changes in non-cash operating w orking capital
Trade receivables (4) 1,464 (49) (14) (3) 12Inventories
Total processed f ish products, net of w rite-dow ns (3,359) (688) - (0) - (0)Raw materials and supplies - - - - - -
Total inventories (3,359) (688) - (0) - (0)Prepaid expenses 630 (209) 7 (1) 1 0Income taxes receivable (401) - - - - -Derivative-related assets 24 - - - - -Trade and other payables and accrued liabilities (1,618) (334) (81) 7 (8) (4)Derivative-related liabilities 212 - - - - -Provision for f inal payments to fishers (900) (1,050) - - - -Accrued obligation for employee benefits (584) - - - - -Asset retirement obligation - - - - - -Sub-total (6,000) (817) (123) (7) (10) 8
Cash from operating activities (1,439) 1,983 3,210 3,573 3,790 4,040
Investing activitiesAdditions to property, plant and equipment (5,166) (3,401) (3,000) (3,000) (3,000) (3,000)Investment tax credits received for PP&E 115 - - - - -Proceeds on disposal of property, plant and equipment 2 - - - - -Cash from investing activities (5,049) (3,401) (3,000) (3,000) (3,000) (3,000)
Financing activitiesPlus (less): changes in debt
Operating line (LIBOR) 78 - - - - -Operating line (BA Short Term) - (1,009) (2,157) (2,411) (1,622) -Current portion of long-term debt - 120 109 112 116 119Long-term debt 6,000 2,348 1,838 1,725 717 (1,159)Sub-total 6,078 1,458 (210) (573) (790) (1,040)
Cash from f inancing activities 6,078 1,458 (210) (573) (790) (1,040)
Net increase (decrease) in cash and cash equivalents (410) 40 0 (0) (0) (0)Plus: cash and cash equivalents, beginning of period 420 10 50 50 50 50Cash and cash equivalents, end of period 10 50 50 50 50 50