Embed Size (px)
Citation preview

Facebook Q2 2016 Results
investor.fb.com

Non-GAAP Measures
In addition to U.S. GAAP financials, this presentation includes certain non-GAAP financial measures. These
non-GAAP measures are in addition to, not a substitute for or superior to, measures of financial performance
prepared in accordance with U.S. GAAP. A reconciliation of GAAP to non-GAAP results is provided in the
appendix to this presentation.
2

Daily Active Users (DAUs)In Millions
Rest of World
Asia-Pacific
Europe
US & Canada
DAUs / MAUs
Q2'14 Q3'14 Q4'14 Q1'15 Q2'15 Q3'15 Q4'15 Q1'16 Q2'16
63% 64% 64% 65% 65% 65% 65% 66% 66%
Please see Facebook's most recent quarterly report filed with the SEC for definitions of user activity used to determine the number of our DAUs, mobile
DAUs, MAUs, and mobile MAUs. The number of DAUs, mobile DAUs, MAUs, and mobile MAUs do not include Instagram, WhatsApp, or Oculus users
unless they would otherwise qualify as such users, respectively, based on their other activities on Facebook.
3

Mobile Daily Active Users (Mobile DAUs)In Millions
4
Please see Facebook's most recent quarterly report filed with the SEC for definitions of user activity used to determine the number of our DAUs, mobile
DAUs, MAUs, and mobile MAUs. The number of DAUs, mobile DAUs, MAUs, and mobile MAUs do not include Instagram, WhatsApp, or Oculus users
unless they would otherwise qualify as such users, respectively, based on their other activities on Facebook.

Monthly Active Users (MAUs)In Millions
5
Rest of World
Asia-Pacific
Europe
US & Canada
Please see Facebook's most recent quarterly report filed with the SEC for definitions of user activity used to determine the number of our DAUs, mobile
DAUs, MAUs, and mobile MAUs. The number of DAUs, mobile DAUs, MAUs, and mobile MAUs do not include Instagram, WhatsApp, or Oculus users
unless they would otherwise qualify as such users, respectively, based on their other activities on Facebook.

Mobile Monthly Active Users (Mobile MAUs)In Millions
6
Please see Facebook's most recent quarterly report filed with the SEC for definitions of user activity used to determine the number of our DAUs, mobile
DAUs, MAUs, and mobile MAUs. The number of DAUs, mobile DAUs, MAUs, and mobile MAUs do not include Instagram, WhatsApp, or Oculus users
unless they would otherwise qualify as such users, respectively, based on their other activities on Facebook.

Mobile-only MAUs are defined as users who accessed Facebook solely through mobile apps or mobile versions of our website, or used our Messenger
mobile app (and is also a registered Facebook user) during the period of measurement. The number of mobile-only MAUs do not include Instagram,
WhatsApp, or Oculus users unless they would otherwise qualify as such users based on their other activities on Facebook.
Mobile-Only Monthly Active Users (Mobile-Only MAUs)In Millions
7

RevenueIn Millions
Payments and Other Fees
Advertising
8
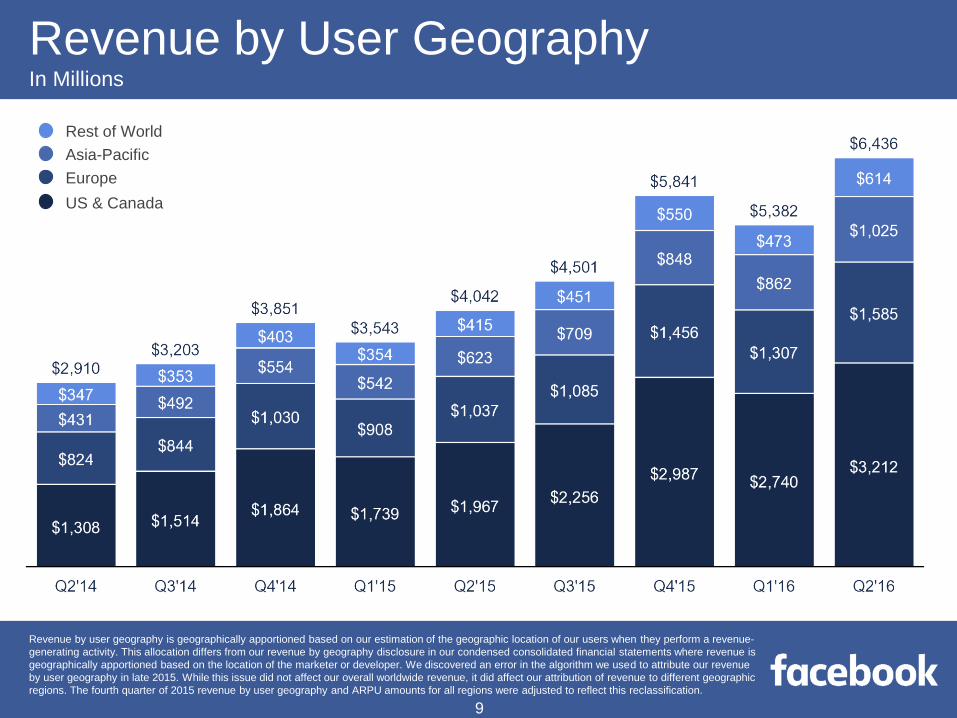
Revenue by User GeographyIn Millions
Rest of World
Asia-Pacific
Europe
US & Canada
Revenue by user geography is geographically apportioned based on our estimation of the geographic location of our users when they perform a revenue-
generating activity. This allocation differs from our revenue by geography disclosure in our condensed consolidated financial statements where revenue is
geographically apportioned based on the location of the marketer or developer. We discovered an error in the algorithm we used to attribute our revenue
by user geography in late 2015. While this issue did not affect our overall worldwide revenue, it did affect our attribution of revenue to different geographic
regions. The fourth quarter of 2015 revenue by user geography and ARPU amounts for all regions were adjusted to reflect this reclassification.
9

Advertising Revenue by User GeographyIn Millions
Rest of World
Asia-Pacific
Europe
US & Canada
10
Revenue by user geography is geographically apportioned based on our estimation of the geographic location of our users when they perform a revenue-
generating activity. This allocation differs from our revenue by geography disclosure in our condensed consolidated financial statements where revenue is
geographically apportioned based on the location of the marketer or developer. We discovered an error in the algorithm we used to attribute our revenue
by user geography in late 2015. While this issue did not affect our overall worldwide revenue, it did affect our attribution of revenue to different geographic
regions. The fourth quarter of 2015 revenue by user geography and ARPU amounts for all regions were adjusted to reflect this reclassification.

Payments & Other Fees Revenue by User GeographyIn Millions
Rest of World
Asia-Pacific
Europe
US & Canada
11
Revenue by user geography is geographically apportioned based on our estimation of the geographic location of our users when they perform a revenue-
generating activity. This allocation differs from our revenue by geography disclosure in our condensed consolidated financial statements where revenue is
geographically apportioned based on the location of the marketer or developer. We discovered an error in the algorithm we used to attribute our revenue
by user geography in late 2015. While this issue did not affect our overall worldwide revenue, it did affect our attribution of revenue to different geographic
regions. The fourth quarter of 2015 revenue by user geography and ARPU amounts for all regions were adjusted to reflect this reclassification.

Average Revenue per User (ARPU)
Worldwide US & Canada
Europe Asia-Pacific Rest of World
Payments and Other Fees
Advertising
12
Revenue by user geography is geographically apportioned based on our estimation of the geographic location of our users when they perform a revenue-
generating activity. This allocation differs from our revenue by geography disclosure in our condensed consolidated financial statements where revenue is
geographically apportioned based on the location of the marketer or developer. Please see Facebook’s most recent quarterly report filed with the SEC for
the definition of ARPU. We discovered an error in the algorithm we used to attribute our revenue by user geography in late 2015. While this issue did not
affect our overall worldwide revenue, it did affect our attribution of revenue to different geographic regions. The fourth quarter of 2015 revenue by user
geography and ARPU amounts for all regions were adjusted to reflect this reclassification.

Expenses as a % of Revenue
Cost of Revenue Research & Development
Marketing & Sales General & Administrative
29%17% 16%
16%14% 14%
28%
22%25% 23%
15% 16%13%
15%14%
Amortization of intangibles
Share-based compensation + payroll tax expenses related to share-based compensation
All other expenses
13
8% 8%
6% 7% 6%

Non-GAAP income from operations excludes share-based compensation expense, payroll tax expenses related to share-based compensation, and
amortization of intangibles-see the Appendix for a reconciliation of GAAP to Non-GAAP results.
Income from OperationsIn Millions
GAAP Income from Operations
Non-GAAP Income from Operations
14

Operating Margin
GAAP Operating Margin
Non-GAAP Operating Margin
Non-GAAP operating margin excludes share-based compensation expense, payroll tax expenses related to share-based compensation, and
amortization of intangibles-see the Appendix for a reconciliation of GAAP to Non-GAAP results.
15

GAAP Effective Tax Rate
($ in millions) Q2'14 Q3'14 Q4'14 Q1'15 Q2'15 Q3'15 Q4'15 Q1'16 Q2'16
GAAP income before provision for income taxes $ 1,386 $ 1,336 $ 1,114 $ 932 $ 1,273 $ 1,432 $ 2,557 $ 2,065 $ 2,766
GAAP provision for income taxes 595 530 413 420 554 536 995 555 711
GAAP Effective Tax Rate 43% 40% 37% 45% 44% 37% 39% 27% 26%
Non-GAAP Effective Tax Rate
($ in millions) Q2'14 Q3'14 Q4'14 Q1'15 Q2'15 Q3'15 Q4'15 Q1'16 Q2'16
Non-GAAP income before provision for income taxes $ 1,749 $ 1,759 $ 2,200 $ 1,839 $ 2,228 $ 2,383 $ 3,520 $ 3,033 $ 3,784
Non-GAAP provision for income taxes 627 610 682 650 791 755 1,255 804 963
Non-GAAP Effective Tax Rate 36% 35% 31% 35% 36% 32% 36% 27% 25%
Effective Tax Rate
16
Non-GAAP effective tax rate excludes share-based compensation expense, payroll tax expenses related to share-based compensation, amortization of
intangibles, and related income tax adjustments-see the Appendix for a reconciliation of GAAP to Non-GAAP results.

Non-GAAP net income excludes share-based compensation expense, payroll tax expenses related to share-based compensation, amortization of
intangibles, and related income tax adjustments-see the Appendix for a reconciliation of GAAP to Non-GAAP results.
Net IncomeIn Millions
GAAP Net Income
Non-GAAP Net Income
17
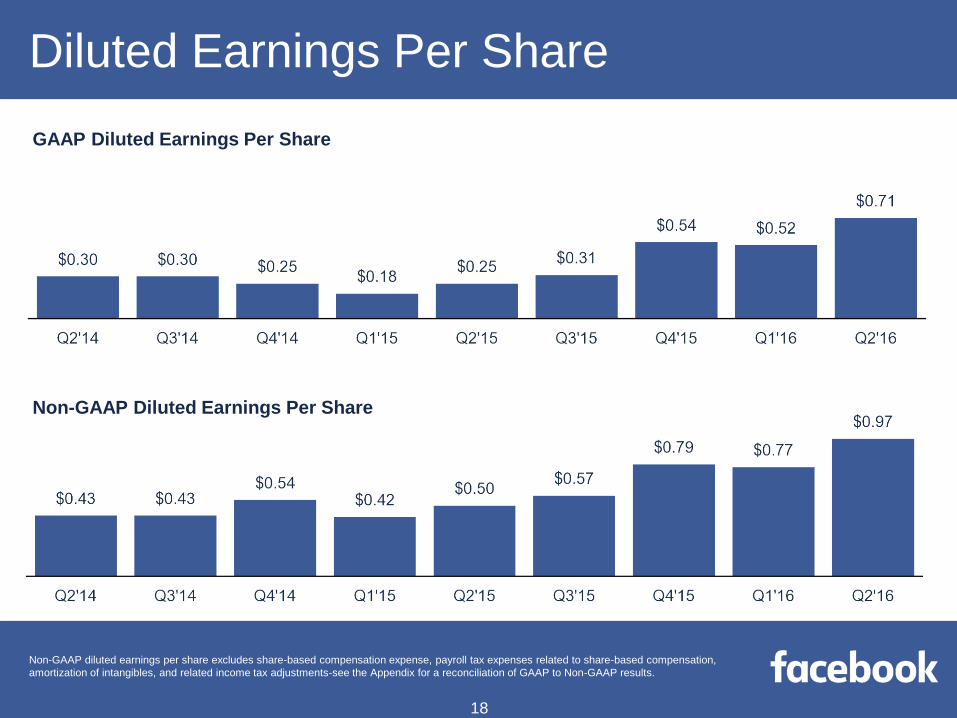
Non-GAAP Diluted Earnings Per Share
Diluted Earnings Per Share
GAAP Diluted Earnings Per Share
Non-GAAP diluted earnings per share excludes share-based compensation expense, payroll tax expenses related to share-based compensation,
amortization of intangibles, and related income tax adjustments-see the Appendix for a reconciliation of GAAP to Non-GAAP results.
18

Capital InvestmentsIn Millions
Quarterly Annual
Purchases of property and equipment
19

Appendix

Reconciliations
Income from Operations ($ in millions) Q2'14 Q3'14 Q4'14 Q1'15 Q2'15 Q3'15 Q4'15 Q1'16 Q2'16
GAAP income from operations $ 1,390 $ 1,397 $ 1,133 $ 933 $ 1,273 $ 1,459 $ 2,560 $ 2,009 $ 2,746
Share-based compensation expense 314 353 896 703 763 757 746 747 805
Payroll tax expenses related to share-based compensation 8 11 13 25 12 14 26 41 20
Amortization of intangible assets 41 59 177 179 180 180 191 180 193
Non-GAAP income from operations $ 1,753 $ 1,820 $ 2,219 $ 1,840 $ 2,228 $ 2,410 $ 3,523 $ 2,977 $ 3,764
Operating Margin Q2'14 Q3'14 Q4'14 Q1'15 Q2'15 Q3'15 Q4'15 Q1'16 Q2'16
GAAP operating margin 48% 44% 29% 26% 31% 32% 44% 37% 43%
Share-based compensation expense 11% 11% 23% 20% 19% 17% 13% 14% 13%
Payroll tax expenses related to share-based compensation —% —% —% 1% —% —% —% 1% —%
Amortization of intangible assets 1% 2% 5% 5% 4% 4% 3% 3% 3%
Non-GAAP operating margin 60% 57% 58% 52% 55% 54% 60% 55% 58%
Net Income ($ in millions) Q2'14 Q3'14 Q4'14 Q1'15 Q2'15 Q3'15 Q4'15 Q1'16 Q2'16
GAAP net income $ 791 $ 806 $ 701 $ 512 $ 719 $ 896 $ 1,562 $ 1,510 $ 2,055
Share-based compensation expense 314 353 896 703 763 757 746 747 805
Payroll tax expenses related to share-based compensation 8 11 13 25 12 14 26 41 20
Amortization of intangible assets 41 59 177 179 180 180 191 180 193
Income tax adjustments (32) (80) (269) (230) (237) (219) (260) (249) (252)
Non-GAAP net income $ 1,122 $ 1,149 $ 1,518 $ 1,189 $ 1,437 $ 1,628 $ 2,265 $ 2,229 $ 2,821
Diluted Earnings Per Share Q2'14 Q3'14 Q4'14 Q1'15 Q2'15 Q3'15 Q4'15 Q1'16 Q2'16
GAAP diluted earnings per share $ 0.30 $ 0.30 $ 0.25 $ 0.18 $ 0.25 $ 0.31 $ 0.54 $ 0.52 $ 0.71
Non-GAAP adjustments to net income 0.13 0.13 0.29 0.24 0.25 0.26 0.25 0.25 0.26
Non-GAAP diluted earnings per share $ 0.43 $ 0.43 $ 0.54 $ 0.42 $ 0.50 $ 0.57 $ 0.79 $ 0.77 $ 0.97
21

Reconciliations (continued)
GAAP Tax ($ in millions) Q2'14 Q3'14 Q4'14 Q1'15 Q2'15 Q3'15 Q4'15 Q1'16 Q2'16
GAAP income before provision for income taxes $ 1,386 $ 1,336 $ 1,114 $ 932 $ 1,273 $ 1,432 $ 2,557 $ 2,065 $ 2,766
GAAP provision for income taxes 595 530 413 420 554 536 995 555 711
GAAP Effective Tax Rate 43% 40% 37% 45% 44% 37% 39% 27% 26%
Non-GAAP Tax ($ in millions) Q2'14 Q3'14 Q4'14 Q1'15 Q2'15 Q3'15 Q4'15 Q1'16 Q2'16
GAAP income before provision for income taxes $ 1,386 $ 1,336 $ 1,114 $ 932 $ 1,273 $ 1,432 $ 2,557 $ 2,065 $ 2,766
Share-based compensation and related payroll tax expenses 322 364 909 728 775 771 772 788 825
Amortization of intangible assets 41 59 177 179 180 180 191 180 193
Non-GAAP income before provision for income taxes $ 1,749 $ 1,759 $ 2,200 $ 1,839 $ 2,228 $ 2,383 $ 3,520 $ 3,033 $ 3,784
Non-GAAP provision for income taxes 627 610 682 650 791 755 1,255 804 963
Non-GAAP Effective Tax Rate 36% 35% 31% 35% 36% 32% 36% 27% 25%
22

Free Cash Flow ($ in millions) Q2'14 Q3'14 Q4'14 Q1'15 Q2'15 Q3'15 Q4'15 Q1'16 Q2'16
Net cash provided by operating activities $ 1,341 $ 1,248 $ 1,583 $ 1,700 $ 1,880 $ 2,192 $ 2,827 $ 2,983 $ 3,198
Purchases of property and equipment 469 482 517 502 549 780 692 1,132 995
Free Cash Flow $ 872 $ 766 $ 1,066 $ 1,198 $ 1,331 $ 1,412 $ 2,135 $ 1,851 $ 2,203
Reconciliations (continued)
23

Limitations of Key Metrics and Other Data
The numbers for our key metrics, which include our daily active users (DAUs), mobile DAUs, monthly active users (MAUs), mobile MAUs, and average
revenue per user (ARPU), as well as certain other metrics such as mobile-only DAUs and mobile-only MAUs, are calculated using internal company data
based on the activity of user accounts. While these numbers are based on what we believe to be reasonable estimates of our user base for the applicable
period of measurement, there are inherent challenges in measuring usage of our products across large online and mobile populations around the world.
For example, there may be individuals who maintain one or more Facebook accounts in violation of our terms of service. We estimate, for example, that
"duplicate" accounts (an account that a user maintains in addition to his or her principal account) may have represented less than 5% of our worldwide MAUs
in 2015. We also seek to identify "false" accounts, which we divide into two categories: (1) user-misclassified accounts, where users have created personal
profiles for a business, organization, or non-human entity such as a pet (such entities are permitted on Facebook using a Page rather than a personal profile
under our terms of service); and (2) undesirable accounts, which represent user profiles that we determine are intended to be used for purposes that violate
our terms of service, such as spamming. In 2015, for example, we estimate user-misclassified and undesirable accounts may have represented less than 2%
of our worldwide MAUs. We believe the percentage of accounts that are duplicate or false is meaningfully lower in developed markets such as the United
States or United Kingdom and higher in developing markets such as India and Turkey. However, these estimates are based on an internal review of a limited
sample of accounts and we apply significant judgment in making this determination, such as identifying names that appear to be fake or other behavior that
appears inauthentic to the reviewers. As such, our estimation of duplicate or false accounts may not accurately represent the actual number of such accounts.
We are continually seeking to improve our ability to identify duplicate or false accounts and estimate the total number of such accounts, and such estimates
may change due to improvements or changes in our methodology.
24

Our data limitations may affect our understanding of certain details of our business. For example, while user-provided data indicates a decline in usage
among younger users, this age data is unreliable because a disproportionate number of our younger users register with an inaccurate age. Accordingly, our
understanding of usage by age group may not be complete.
Some of our metrics have also been affected by applications on certain mobile devices that automatically contact our servers for regular updates with no user
action involved, and this activity can cause our system to count the user associated with such a device as an active user on the day such contact occurs. The
impact of this automatic activity on our metrics varies by geography because mobile usage varies in different regions of the world. In addition, our data
regarding the geographic location of our users is estimated based on a number of factors, such as the user's IP address and self-disclosed location. These
factors may not always accurately reflect the user's actual location. For example, a mobile-only user may appear to be accessing Facebook from the location
of the proxy server that the user connects to rather than from the user's actual location. The methodologies used to measure user metrics may also be
susceptible to algorithm or other technical errors. Our estimates for revenue by user location and revenue by user device are also affected by these factors.
For example, we discovered an error in the algorithm we used to attribute our revenue by user geography in late 2015. While this issue did not affect our
overall worldwide revenue, it did affect our attribution of revenue to different geographic regions. The fourth quarter of 2015 revenue by user geography and
ARPU amounts were adjusted to reflect this reclassification. We regularly review our processes for calculating these metrics, and from time to time we may
discover inaccuracies in our metrics or make adjustments to improve their accuracy, including adjustments that may result in the recalculation of our historical
metrics. We believe that any such inaccuracies or adjustments are immaterial unless otherwise stated. In addition, our DAU and MAU estimates will differ
from estimates published by third parties due to differences in methodology. For example, some third parties are not able to accurately measure mobile users
or do not count mobile users for certain user groups or at all in their analyses.
The numbers of DAUs, mobile DAUs, MAUs, mobile MAUs, and mobile-only MAUs discussed in this presentation, as well as ARPU, do not include
Instagram, WhatsApp, or Oculus users unless they would otherwise qualify as such users, respectively, based on their other activities on Facebook.
Limitations of Key Metrics and Other Data (continued)
25

Facebook Q2 2016 Results
investor.fb.com


![Announces Q2 results [Result]](https://img.pdfslide.net/doc/110x75/577ca7391a28abea748c4b21/announces-q2-results-result.jpg)