Embed Size (px)
Citation preview
Facility Planning: An approach to optimise a
distribution network at Clover SA
by
ILSE GRASSIE
26033942
Submitted in partial fulfillment of the requirements for
the degree of
BACHELORS OF INDUSTRIAL ENGINEERING
in the
FACULTY OF ENGINEERING, BUILT ENVIRONMENT AND
INFORMATION TECHNOLOGY
UNIVERSITY OF PRETORIA
October 2009
Executive summary
Clover is the largest dairy company in South Africa with approximately 6500
employees. According to Clover’s chief executive, Clover stands for: Stability
and their people and producers are ‘dairy men’ that have milk running through
their veins.
The project at hand focuses mainly on facility layout planning and design at
Clover’s Clayville branch. It involves the building of a chilled warehouse that can
meet the company’s requirements.
This report systematically explains the aim of the project as well as the extent of
it in terms of what will be included and excluded. It includes a study on different
approaches that can be followed to design the layout of a facility and contains
research on aspects related to facilities planning namely materials handling and
materials handling equipment.
The design phase of this project follows Muther’s Systematic Layout Planning
(SLP) procedure, a methodology that is often used when developing alternative
facility layouts. The new proposed facility aims to resolve the distribution network
problem which is currently experienced.
Table of Contents: Page
1. Introduction and background ............................................................. 1
Contents
2. Project aim ........................................................................................ 3
3. Project scope .................................................................................... 4
4. Literature review ................................................................................ 6
4.1. Facilities planning defined ..................................................... 6
4.2. Significance of facilities planning .......................................... 7
4.3. Basic layout types ................................................................. 8
4.4. Layout procedures ................................................................ 9
4.4.1. The engineering design process ................................ 9
4.4.2. Immer’s Basic Layout Planning Steps ........................ 10
4.4.3. Nadler’s Ideal Systems Approach .............................. 11
4.4.4. Systematic layout planning by Muther ....................... 12
4.4.5. Apple’s Plant Layout Procedure ................................. 14
4.4.6. Reed’s Plant Layout ................................................... 15
4.5. Strategic facility planning ...................................................... 16
4.6. Related aspects .................................................................... 17
4.6.1. Materials handling ...................................................... 17
4.6.2. Materials handling equipment .................................... 18
5. Conceptual design ............................................................................. 20
5.1. Data analysis ........................................................................ 20
5.2. Facility layout design ............................................................. 20
5.3. Materials handling and equipment ........................................ 20
6. Data and information gathering and analysis..................................... 21
6.1. Available product data .......................................................... 22
7. Layout design .................................................................................... 23
7.1. Layout design of storage area .............................................. 24
7.1.1. Building strategy for storage area .............................. 25
7.1.2. Alternative layouts for storage area ........................... 30
7.2. Layout design of receiving area ............................................ 34
7.2.1. Available data relevant to receiving area ................... 34
7.2.1.1. On-site production i.e. internal receiving ......... 35
7.2.1.2. Off-site production i.e. external receiving ........ 36
7.2.2. Basic space requirements for receiving areas ........... 39
7.2.2.1. Internal receiving area .................................... 39
7.2.2.2. External receiving area ................................... 40
7.3. Layout design of dispatching area ........................................ 41
7.3.1. Basic space requirements for dispatching area ......... 43
7.3.1.1. Basic space requirements for stage area ........ 44
7.3.1.2. Basic space requirements for dock cubicles ... 45
7.4. Layout design of offices ........................................................ 46
7.4.1. Basic space requirements for offices ......................... 46
7.5. Layout design of battery room .............................................. 46
7.5.1. Equipment requirements ............................................ 47
7.5.1.1. Verification of building strategy for storage
area ................................................................ 50
7.5.2. Personnel requirements ............................................. 51
7.5.3. Warehouse management system equipment
requirements ............................................................. 53
7.6. Layout design of plant room .................................................. 54
8. Facility planning procedure: Design and Problem Solving ................. 54
8.1. Measuring Flow..................................................................... 55
8.1.1. Quantitative Flow Measurement ................................ 55
8.1.2. Qualitative Flow Measurement .................................. 57
8.2. Space requirements .............................................................. 59
8.3. Space available .................................................................... 60
8.4. Space relationship diagram .................................................. 61
8.5. Develop Layout Alternatives ................................................. 63

8.5.1. Evaluate Facility Layout Alternatives ......................... 67
9. Materials handling ............................................................................. 69
9.1. Materials handling equipment ............................................... 70
10. Conclusion ....................................................................................... 71
Bibliography ................................................................................................. 72
Appendix A .................................................................................................. 73
List of figures Page
Figure 1: Clover’s organisational structure .................................................. 1
Figure 2: Facilities planning hierarchy ......................................................... 6
Figure 3: The facilities life cycle .................................................................. 9
Figure 4: The hierarchical ideal systems approach ..................................... 11
Figure 5: Systematic layout planning (SLP) procedure ............................... 13
Figure 6: Electric pallet truck ....................................................................... 19
Figure 7: Forklift ......................................................................................... 19
Figure 8: Hand pallet truck .......................................................................... 19
Figure 9: Reach truck .................................................................................. 19
Figure 10: 1m and 1.2m entry of pallets illustrated ..................................... 25
Figure 11: 1m entry of pallets using arbitrary dimensions ........................... 27
Figure 12: 1.2m entry of pallets using arbitrary dimensions ........................ 28
Figure 13: Second alternative for the layout of the storage area ................ 31
Figure 14: Third alternative for the layout of the storage area .................... 32
Figure 15: Space required by internal receiving area .................................. 39
Figure 16: Space required by external receiving area ................................. 40
Figure 17: Space required by one stage area ............................................. 44
Figure 18: Space required by battery room ................................................. 50
Figure 19: Explanation of the Activity Relationship Chart ........................... 58
Figure 20: Activity Relationship Chart – Qualitative Flow Measurement ..... 59
Figure 21: Space available to build warehouse .......................................... 61
Figure 22: Space Relationship Diagram ..................................................... 62
Figure 23: Layout alternative 1 ................................................................... 64
Figure 24: Layout alternative 2 ................................................................... 65
Figure 25: Layout alternative 3 ................................................................... 66
List of tables Page
Table 1: Warehouse building cost per square meter ................................... 24
Table 2: Reach Truck cost differences ........................................................ 25
Table 3: Summary of building strategies and associated cost per pallet ..... 30
Table 4: Summary of layout alternatives and associated cost per pallet ..... 33
Table 5: Summary of equipment requirements ........................................... 48
Table 6: Verification of building strategy for storage area ........................... 51
Table 7: Summary of personnel requirements ............................................ 53
Table 8: Space requirements for chilled departments ................................. 54
Table 9: From-To chart: Quantitative Flow Measurement ........................... 56
Table 10: Closeness rating ......................................................................... 57
Table 11: Reasons behind the “Closeness” value....................................... 58
Table 12: Space requirements for different departments ............................ 60
Table 13: Outcome of the weighted-factor-comparison-method ................. 68
1
1. Introduction and background
Clover is a market leader in the dairy industry. According to the company’s
website, their vision for Clover is: “to be a leading and competitive company in
South Africa and selected African countries, reaching every consumer on a daily
basis with its most admired branded and trusted products, delivering improved
and sustainable shareholder value by being a responsible corporate citizen and
preferred employer.”
Clover is the largest dairy company in South Africa. They offer various job
opportunities to approximately 6500 employees. They inspire their employees to
reach their full potential and establish a healthy and ethical work environment.
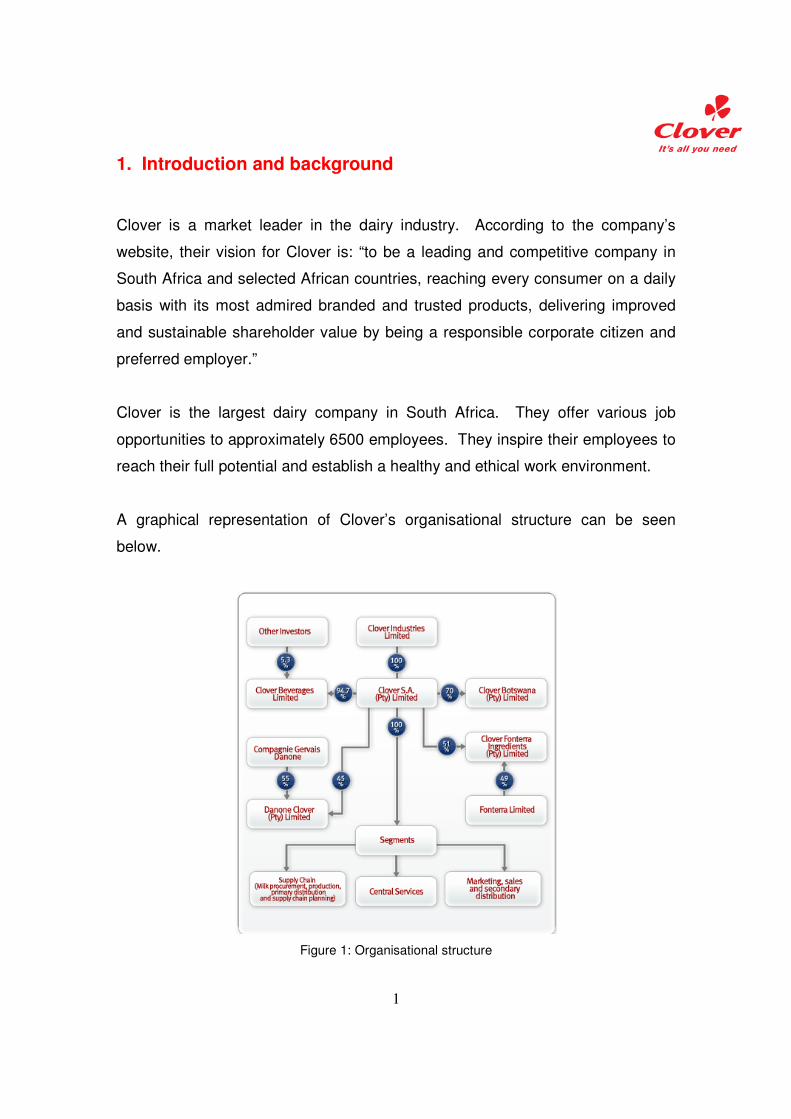
A graphical representation of Clover’s organisational structure can be seen
below.
Figure 1: Organisational structure
2
Clover is a Fast Moving Consumer Goods (FMCG) company and has about 400
of their own branded products available on the market that is produced and
packaged at one of their factories. They also carry inventory and distribute
approximately 200 products for other principals. This means that, effectively,
they manage 600 different types of products on a daily basis.
Clover’s larger branches are situated in City Deep, Cape Town, Queensburgh,
Clayville, Boksburg and Port Elizabeth. Some of their other, smaller branches
include areas such as: East London, Kimberley, Welkom, Bloemfontein,
Potchefstroom, Nelspruit, George, Polokwane, Upington, Port Shepstone,
Kokstad and Newcastle. This project will focus on the Clayville branch.
Production of fresh milk and UHT (Ultra High Temperature) milk takes place at
the two factories that are situated at the Clayville site. The existing warehouses
at Clayville are small and can not pick and store the required volumes of the
products that are produced on site for the 16 warehouses all around the country
and because of this all the products that are produced have to be distributed to
other warehouses in Gauteng where it is stored and picked for the remaining
warehouses. The problem with this operating method is that it places the current
distribution network under pressure, creates more double handling and increased
distribution cost.
The lack of picking space at Clayville also results in them only being able to pick
full pallets of products and not all products manufactured over a 24 hour period,
this results in over-stocking of branches with stock they do not necessarily
require. This causes the problem that the other warehouses, that are sometimes
already struggling to manage their existing volumes, do not have storage room
available for the new stock. As a result, warehouse and stock management
requires more attention.
3
It also happens that products are distributed to the wrong warehouses by
mistake. Most of Clover’s other sites do not have room for expansion.
If this distribution network problem can be solved it will have multiple benefits for
the company that includes reduced distribution cost, reduced inventory, reduced
double handling and room to grow.
According to the third edition of Facilities Planning by Tompkins, White, Bozer
and Tanchoco, facilities planning is no longer just a science, but a strategy for
navigating a competitive global economy.
2. Project Aim
The aim of the project is to reduce the strain on Clover’s current distribution
network by planning and building a chilled warehouse at the Clayville site that will
be able to handle the future required volumes.
By achieving the objectives listed below the aim of the project will be realised.
• Reduced inventory.
• Reducing capacity constraints at the other warehouses.
• Reducing pressure on the warehouse and stock planners.
• Reduced distribution costs.
4
3. Project Scope
The project will be based on the following:
• Building a new chilled warehouse next door to the current fresh milk
factory.
The scope of the project will include a high-level planning of:
• Inventory storage requirements.
• The layout of the new chilled warehouse that will be built.
• The personnel requirements.
• The equipment requirements.
• The warehouse management system equipment requirements.
Lots of attention will be focused on the layout planning, which will include:
• Analysing future volumes that the facility must handle
• Aisle widths
• The amount of dispatch cages
• The receiving areas
• Picking areas / storage area
• Allocation of space for the battery and plant rooms
• Offices
The equipment requirements will include determining the amount of forklifts,
reach trucks and power pallet trucks that the facility will need, according to the
workload of the required facility.
5
The equipment requirements will influence the personnel requirements since
each forklift, reach truck and power pallet truck will need a driver. The amount of
checkers, pickers and supervisors will also have to be determined.
The warehouse management system equipment includes the scanners, that tell
the above equipment drivers and other warehouse staff what to do, as well as the
computers needed to manage the warehouse.
Data analysis will have to be done in depth before the layout or any other
requirements can be determined. Data analysis will thus be a critical part of the
project.
The following will not be included in the project scope:
• The detail of the battery and plant rooms
• Chilling requirements
• Fire protection
• Electrical requirements
• A parking area for the delivery trucks
• Ablution blocks
• A canteen for employees
6
4. Literature review
4.1 Facilities planning defined
Even though facilities planning is a popular topic that has been taught and
studied for more than 50 years, it is still challenging and in some ways
mysterious. The subject of facilities planning is very wide-ranging and intricate.
According to Tompkins (Tompkins et al, 1984), facilities planning is, in spite if its
heritage, still one of the most well-liked subjects of seminars, publications and
research.
According to Tompkins (Tompkins et al, 1984): “Facilities planning determines
how an activity’s tangible fixed assets best support achieving the activity’s
objectives.”
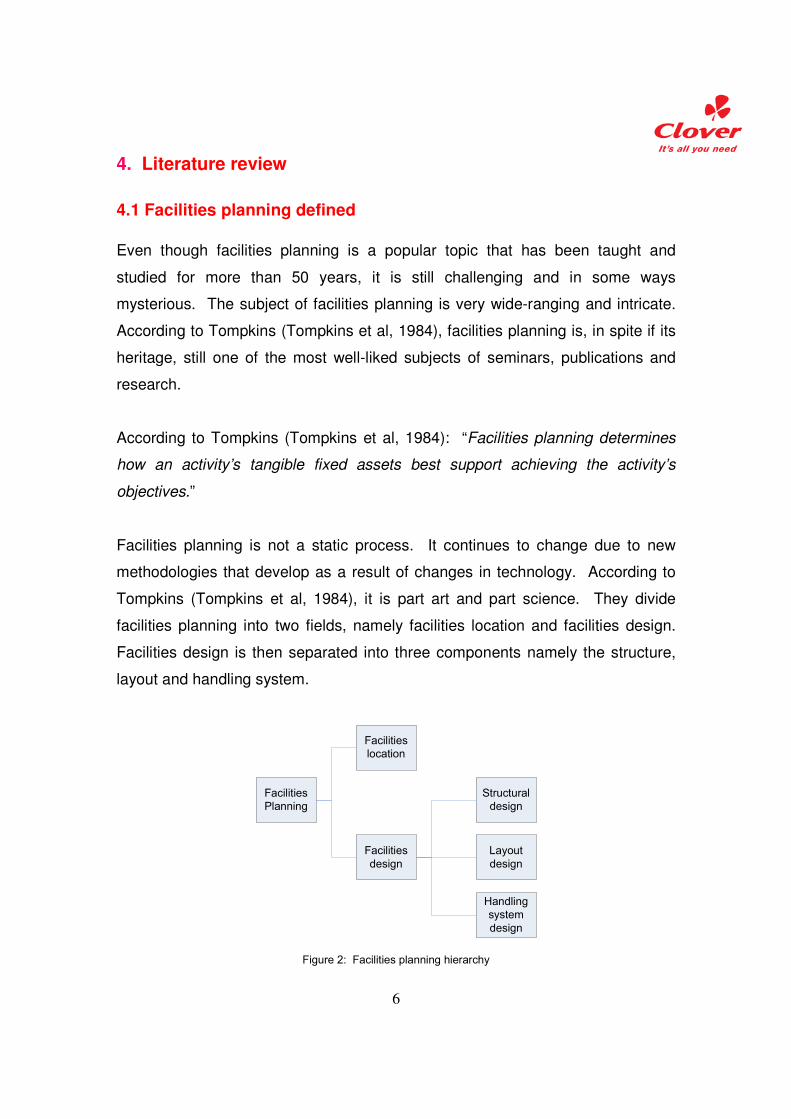
Facilities planning is not a static process. It continues to change due to new
methodologies that develop as a result of changes in technology. According to
Tompkins (Tompkins et al, 1984), it is part art and part science. They divide
facilities planning into two fields, namely facilities location and facilities design.
Facilities design is then separated into three components namely the structure,
layout and handling system.
Facilities
Planning
Facilities
location
Facilities
design
Structural
design
Layout
design
Handling
system
design
Figure 2: Facilities planning hierarchy

7
According to Tompkins (Tompkins et al, 2003), the following are common triggers
or reasons that might urge a company to redesign the layout of a facility:
• Changes in legal requirements, for example environmental requirements,
by the state
• Changes in their operating methods, processes or equipment
• Changes in the volume or mix of the outputs of products that is required
• Changes in the design of the company’s product(s) or services
• Introduction of new products or services
• High operating costs, occurrence of bottlenecks in the system or
unnecessary excessive handling of products
• Safety hazards or increase in the amount of accidents reported
• Morale problems amongst staff, that influence teamwork, or between staff
and customers (lack of face-to-face contact)
4.2 Significance of Facilities Planning
Facilities planning and design forms part of a company’s strategic planning. The
strategic importance thereof lies largely in the fact that substantial investments
have to be made in the facility planning field in order to upgrade existing facilities
and build new facilities, to maintain a certain standard.
The design and layout of a facility have a major impact on aspects such as
operating costs, material handling costs, maintenance, management and control
of the facility, adaptability and flexibility of processes and employees, employee
morale and productivity according to Tompkins (Tompkins et al, 2003).
Facility planning creates opportunities for cost reduction and productivity
improvement. Continuous layout changes and rearrangement of activities is
necessary in order to comply with regulations such as employee health and
8
safety and disability. It is also required due to changes in technology,
environmental impact and conservation of energy and other resources.
4.3 Basic layout types
Tompkins (Tompkins et al, 1984) identified four types of planning departments
namely:
• Fixed material location departments
• Production line departments
• Product family departments
• Process departments
A journal, “Facilities design using a split departmental layout configuration”
published by Professor B. Gopalakrishnan and two graduate students of West
Virginia University, classifies factory layouts as the following:
• Fixed position layout
• Process oriented layout (also known as a job shop)
• Group or cellular layout
• Product oriented layout (also known as a flow shop)
The type of layout chosen by a company is dependent on the kind of activities
that the facility will be used for, as well as the volume and variety of products.
9
4.4 Layout Procedures
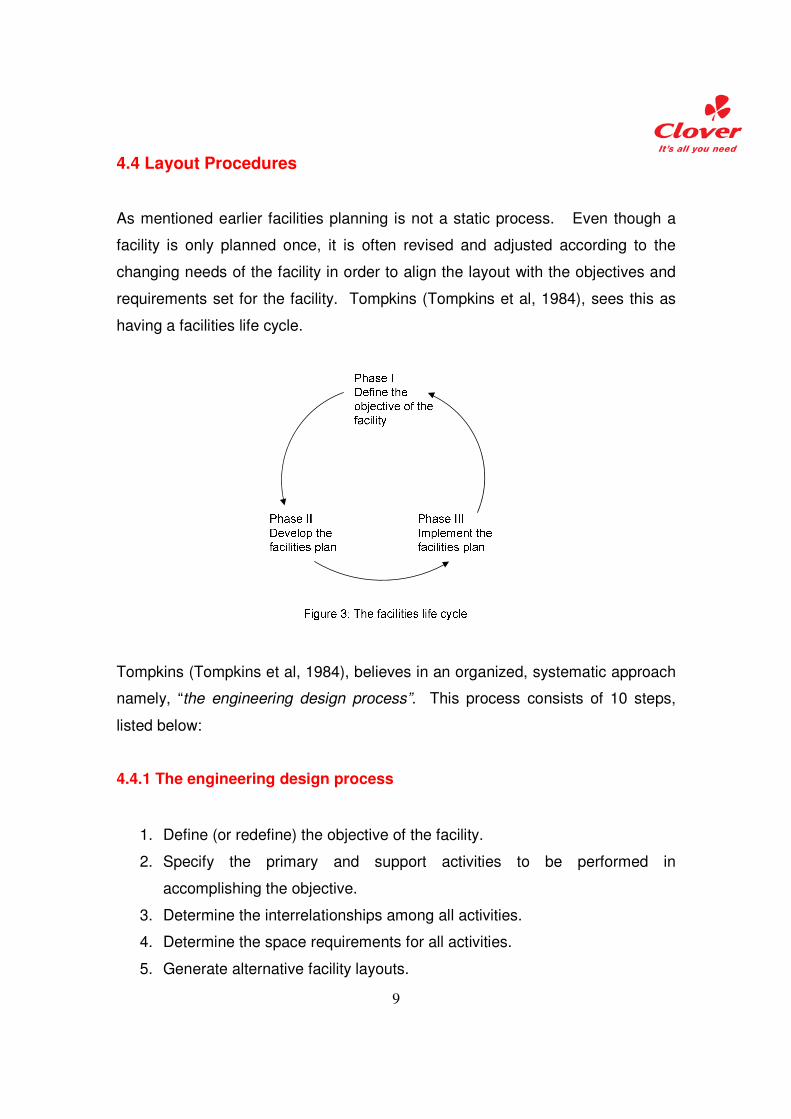
As mentioned earlier facilities planning is not a static process. Even though a
facility is only planned once, it is often revised and adjusted according to the
changing needs of the facility in order to align the layout with the objectives and
requirements set for the facility. Tompkins (Tompkins et al, 1984), sees this as
having a facilities life cycle.
Tompkins (Tompkins et al, 1984), believes in an organized, systematic approach
namely, “the engineering design process”. This process consists of 10 steps,
listed below:
4.4.1 The engineering design process
1. Define (or redefine) the objective of the facility.
2. Specify the primary and support activities to be performed in
accomplishing the objective.
3. Determine the interrelationships among all activities.
4. Determine the space requirements for all activities.
5. Generate alternative facility layouts.
10
6. Evaluate alternative facility layouts.
7. Select a facility layout.
8. Implement the facility layout.
9. Maintain and adapt the facility layout.
10. Redefine the objective of the facility (in the case where changes have to
be implemented).
A variety of alternative procedures exist that can be used to develop the layout of
a facility. The following are a few examples that Tompkins (Tompkins et al,
1984), has reviewed and that will be discussed in this document:
• Immer’s basic layout planning steps
• Nadler’s ideal systems approach
• Systematic layout planning by Muther
• Apple’s plant layout procedure
• Reed’s plant layout procedure
4.4.2 Immer’s Basic Layout Planning Steps
This approach, entailing the basic steps in the analysis of a layout, was published
by Immer in one of the first books that was dedicated to the subject of facility
layout planning. Immer stated that, “This analysis should be composed of three
simple steps, which can be applied to any type of layout problem.” The 3 steps
are:
1. Put the problem on paper.
2. Show lines of flow.
3. Convert flow lines to machine lines.
11
This approach by Immer focuses on and thus works best, when you have an
existing layout that needs to be improved or adjusted to meet new objectives and
requirements. It does not make provision for the planning of new facilities.
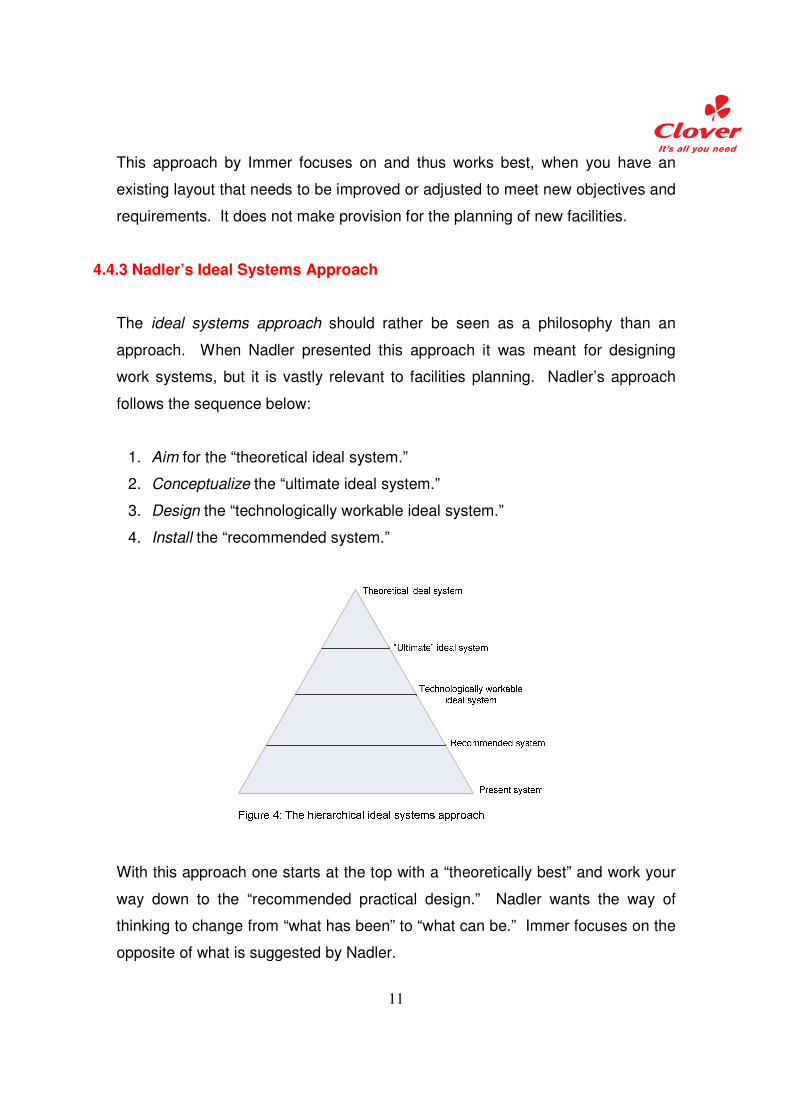
4.4.3 Nadler’s Ideal Systems Approach
The ideal systems approach should rather be seen as a philosophy than an
approach. When Nadler presented this approach it was meant for designing
work systems, but it is vastly relevant to facilities planning. Nadler’s approach
follows the sequence below:
1. Aim for the “theoretical ideal system.”
2. Conceptualize the “ultimate ideal system.”
3. Design the “technologically workable ideal system.”
4. Install the “recommended system.”
With this approach one starts at the top with a “theoretically best” and work your
way down to the “recommended practical design.” Nadler wants the way of
thinking to change from “what has been” to “what can be.” Immer focuses on the
opposite of what is suggested by Nadler.
12
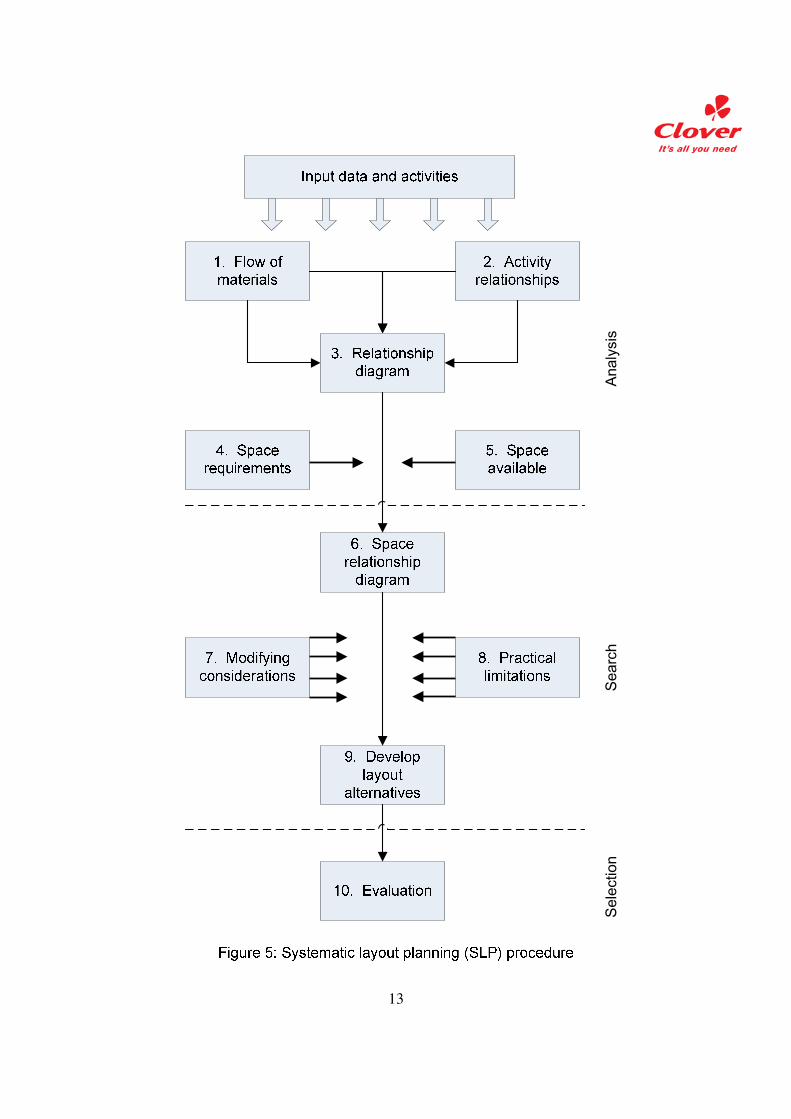
4.4.4 Systematic layout planning by Muther
This layout procedure that was developed by Muther in 1973 is very popular and
is frequently used. It is also in short referred to as SLP. A framework for SLP
can be seen on the following page.
According to Tompkins (Tompkins et al, 2003), the process involved in executing
SLP is fairly uncomplicated. This does not necessarily mean that no
complexities will occur in the application of SLP.
When using the SLP approach a block layout is first developed before there can
be continued to a detailed layout for each department.
This process requires the facility planner to develop many different charts and
diagrams. This can be seen as an advantage of this process since people tend
to understand a process more easily if they can visualize it. The charts and
diagrams that are constructed during this procedure, as well as the function of
each, are listed below:
• From-to chart: used to quantitatively measure flows in terms of the amount
moved between departments.
• Activity relationship chart: determine the relationship between
departments and the importance thereof.
• Relationship diagram: positions activities where they are actually located
in a two-dimensional space.
• Space relationship diagram: same as relationship diagram, only with the
space of each department included.
13
Selection
Search
Analysis
14
According to Tompkins (Tompkins et al, 1984), the activity relationship chart is
used as the basis of SLP. A material flow analysis (in the form of the from-to
chart) and an activity relationship analysis (in the form of an activity relationship
chart) can be done once an understanding have been reached of the input data
and the roles and relationships between activities. From there a relationship
diagram can be constructed and later on the space relationship diagram.
4.4.5 Apple’s Plant Layout Procedure
Apple developed a sequence of 20 steps which he recommended be used when
aiming to construct a plant layout. According to Apple the steps do not
necessarily have to be performed in the order that it is given, since the design of
every layout project is unique. The steps are as follows:
1. Procure the basic data.
2. Analyse the basic data.
3. Design the productive process.
4. Plan the material flow pattern.
5. Consider the general material handling plan.
6. Calculate equipment requirements.
7. Plan individual workstations.
8. Select specific material handling equipment.
9. Coordinate groups of related operations.
10. Design activity interrelationships.
11. Determine storage requirements.
12. Plan service and auxiliary activities.
13. Determine space requirements.
14. Allocate activities to total space.
15. Consider building types.
16. Construct master layout.
15
17. Evaluate, adjust and check the layout with the appropriate persons.
18. Obtain approvals.
19. Install the layout.
20. Follow up on implementation of the layout.
4.4.6 Reed’s Plant Layout
According to Tompkins (Tompkins et al, 1984), Reed developed steps, which he
referred to as a “systematic plan of attack”, to be used for the planning and
preparation of a facility’s layout. The ten steps are listed below:
1. Analyse the product or products to be produced.
2. Determine the process required to manufacture the product.
3. Prepare layout planning charts.
4. Determine workstations.
5. Analyse storage area requirements.
6. Establish minimum aisle widths.
7. Establish office requirements.
8. Consider personnel facilities and services.
9. Survey plant services.
10. Provide for future expansion.
Reed considers step 3, the layout planning chart, as the most crucial part of the
total layout process. The layout planning chart integrates five important factors
namely:
1. The flow process, including operations, transportations, storage and
inspections.
2. Standard times for each operation.
3. Machine selection and balance.
4. Manpower selection and balance.
5. Material handling requirements.
16
4.5 Strategic facility planning
As mentioned previously, facilities planning and design forms part of a
company’s strategic planning. According to the journal “Strategic facility planning
(SFP)” by Frank Kerns, a company’s facilities are believed to be part of their
most valuable and noticeable assets. He believes that the following are
elements that should be considered when designing a future facility:
• custom designed to meet customer needs;
• designed to facilitate time compression;
• flexible to allow adjustments to meet rapid market changes;
• ability to accommodate fast to market new products;
• focused for a small range of products;
• designed for a flat organization;
• planned at the lowest possible level;
• linking suppliers, manufacturing and customers;
• managed by a few “managers” facilitating decision making;
• training to adapt to change.
According to Frank Kerns, strategic facility planning uses a seven-step approach
when used in its most uncomplicated form. The seven steps are similar to
Muther’s systematic layout planning approach and are listed below:
1. Identify space planning identifiers (SPI’s)
2. Chart the affinities/relationships
3. Determine space requirements
4. Develop layout primitive
5. Generate macro layouts
6. Evaluate layouts
7. Populate layout
17
The strategic facility planning approach looks at facility planning and design with
customer value in mind. It encourages a company to effectively use their
resources to gain a competitive advantage by satisfying the customer’s
requirements.
4.6 Related aspects
Facility planning is closely related to several of a company’s operational
activities. These activities have to be taken in to account when deciding on a
facility designing approach and is thus included as part of the literature review.
4.6.1 Materials handling
Materials handling is one activity that goes hand in hand with facility planning. A
company’s materials handling method has to be compatible with the layout of the
facility.
Materials handling can be defined as both an art and a science. It entails not
only the moving of material but also the storing, controlling and protecting thereof
(Tompkins, Tompkins et al, 2003).
Material handling can also be described by the nine R’s namely, providing the:
1. Right amount of the
2. Right material in the
3. Right condition at the
4. Right place in the
5. Right position at the
6. Right time in the
7. Right sequence and for the
18
8. Right cost by the
9. Right method(s)
Tompkins (Tompkins et al, 2003) classifies the following as the objectives of
material handling:
• Improving the utilisation of the facility.
• Increasing productivity.
• Improving working conditions and safety of workers.
• Increasing the efficiency of the flow of materials through the facility.
• Reducing the cost of material handling.
• Facilitating the manufacturing process.
Material handling is expensive and accordingly requires a large amount of
planning and attention. According to Tompkins (Tompkins et al, 1984) it is
difficult to measure the precise cost of material handling but in general it usually
accounts for 8% up to 10% of the total cost of a business depending on the type
of facility.
4.6.2 Materials handling equipment
Material handling equipment in turn goes hand in hand with material handling.
The type of activities that the facility will be used for determines the type of
equipment required. Certain material handling methods require certain
equipment. This project involves the development of a chilled warehouse, thus
there will be focused on warehouse materials handling equipment.
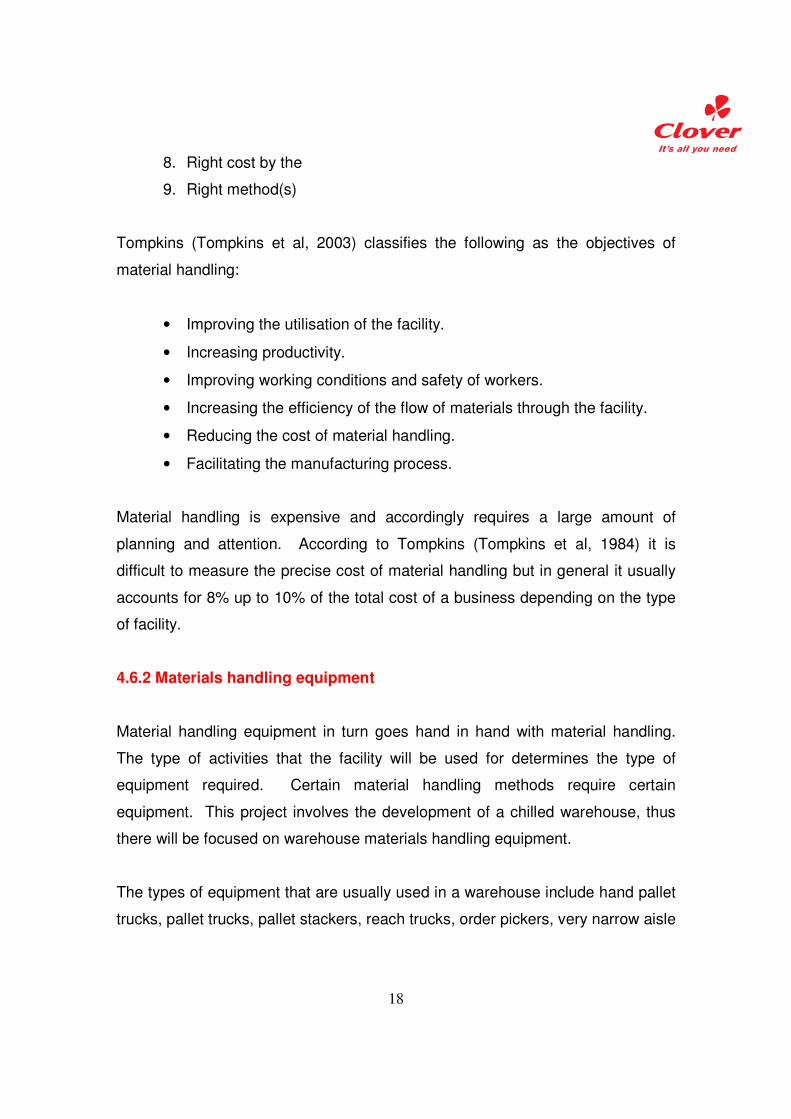
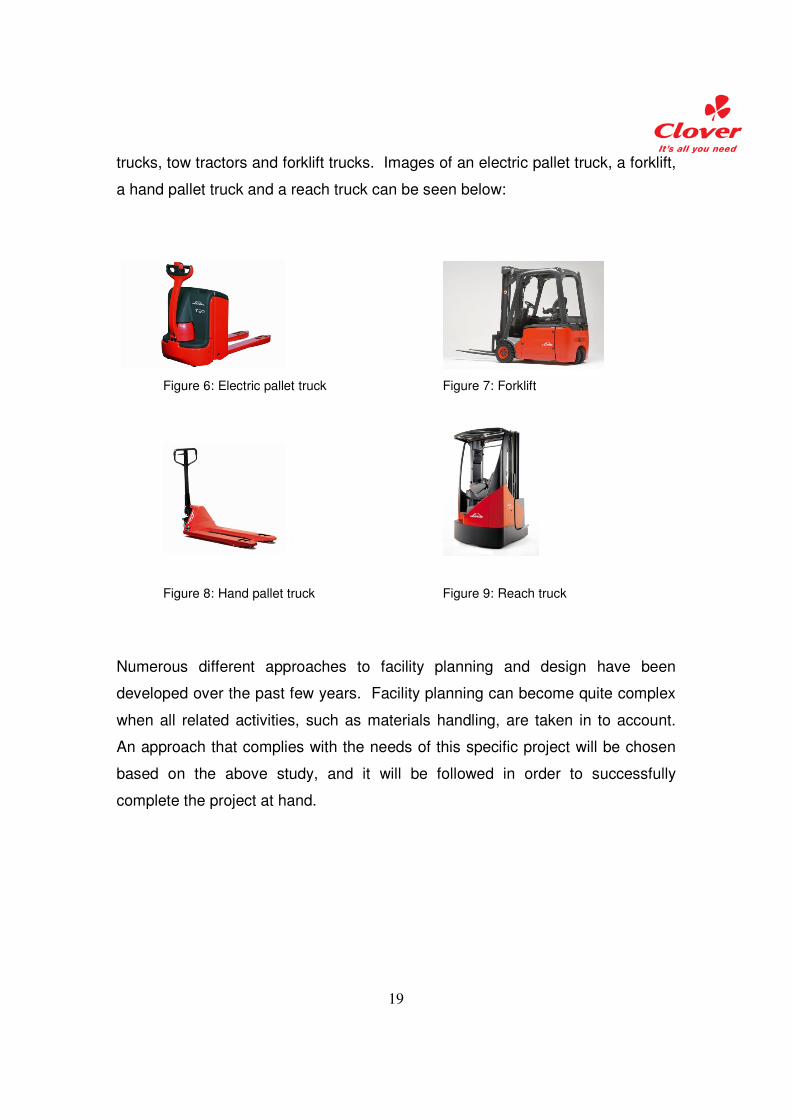
The types of equipment that are usually used in a warehouse include hand pallet
trucks, pallet trucks, pallet stackers, reach trucks, order pickers, very narrow aisle
19
trucks, tow tractors and forklift trucks. Images of an electric pallet truck, a forklift,
a hand pallet truck and a reach truck can be seen below:
Figure 6: Electric pallet truck Figure 7: Forklift
Figure 8: Hand pallet truck Figure 9: Reach truck
Numerous different approaches to facility planning and design have been
developed over the past few years. Facility planning can become quite complex
when all related activities, such as materials handling, are taken in to account.
An approach that complies with the needs of this specific project will be chosen
based on the above study, and it will be followed in order to successfully
complete the project at hand.
20
5. Conceptual design
The concept and plan that will be followed in order to successfully carry out the
project and meet the specified aim and objectives are as follows:
5.1 Data Analysis
In order to achieve the aim and objectives of the project the available data has to
be studied in depth. The data has to be analysed and a clear understanding
must be reached of the requirements that exist as a result of the available data.
The data analysis will require that certain calculations be done and answers will
need to be round up or down depending on what is being calculated. If the data
is not clearly understood the project aim and objectives might become elusive.
5.2 Facility layout design
Based on the literature review that was done, the systematic layout planning
approach by Muther could be used to develop several alternatives for the layout
of the new chilled warehouse. Muther’s SLP approach is well known and very
popular and has been proven to work effectively in the designing of facility
layouts. All the diagrams required by SLP will be constructed based on Clover’s
needs at their Clayville branch. This part of the project is seen as the most
important phase.
5.3 Material handling and equipment
Once the designing of the layout of the facility is done, material handling and
material handling equipment will be given some attention since it is related to
facility planning and will be influenced by the layout of the facility. The material
21
handling system of the warehouse is not included as part of the scope of the
project and thus will not be discussed in detail.
The abovementioned phases give a high-level idea of the concept and plan that
will be followed throughout the project. Each phase requires various inputs to get
a certain required outputs. The phases have several sub phases that will have to
be completed before there can be continued to the next phase.
6. Data and information gathering and analysis
As mentioned earlier, based on the literature review that was done, the
systematic layout planning approach by Muther will be used to develop several
alternatives for the layout of the new chilled warehouse.
The departments that were identified to be used in the SLP process are the
following:
• Receiving area
• Storage/picking area
• Stage area
• Dock cubicles
• Offices
• Battery room
• Plant room
The requirements for each of the abovementioned departments are dependant
on the throughput of the facility. The necessary available product data that will
determine the throughput thus have to be collected before attending to the
individual departments.
22
It is clear that lots of information need to be obtained before starting with the
steps of Muther’s systematic layout planning approach.
6.1 Available product data
The data that were available for each product that will be stored and dispatched
from the facility are listed below and can be seen in Appendix A of this document.
• The SKU number of the product
• The temperature zone of the product (i.e. whether the product is chilled or
ambient)
• The amount of kilograms of the specific product that fits on to a pallet
• The volume, in kilograms, that will be handled by the facility every month
• The amount of days’ stock of each product that they usually keep in their
warehouses. Since Clover is a fast moving consumer goods company
(FMCG) and their products are perishable they are not able to keep great
amounts of inventory.
• Whether the product is stored in a case or crate
• Whether the product is produced in the factory on the Clayville site
(internally) or is delivered from one of Clover’s other factories (externally).
Please note that the assumption was made that there are 24 working days in a
month. This in effect means that the required volume per month is also the
required volume for 24 days.
By using this available data, the storage requirements (in amount of pallets) for
the chilled warehouse could be calculated as follows:
(Volume (kg) ÷ kg per pallet) x (Days Stock / 24)
= Number of pallets stored per product
23
As can be seen in Appendix A, the above calculation showed that the facility will
need to provide storage space for a total of 5995 pallets. The facility will thus be
designed to store a minimum of 6000 pallets.
The company requires that future expansion should be kept in mind at all times.
The availability of land is in short supply in the vicinity of the Clayville site.
Another requirement is that every department should be designed in six meter
modules. This eases the positioning of columns inside the warehouse and it
accommodates aisle widths which facilitates the movement of equipment around
the warehouse.
7. Layout design
The layout design of each of the individual departments will result in the design of
the facility as a whole. The layout of the storage area, also referred to as the
picking area, plays a very important role in the facility since the main function of
the warehouse is after all to store the products. Because of this, the layout of the
storage area will be given attention first.
24
7.1 Layout design of storage area
The warehouse can be designed from block stacking (one high) up to six pallets
high. It can not be designed to store seven pallets on top of each other within
racking, since the necessary warehouse equipment is not capable of reaching
such a height for these types of products. The height of the warehouse will not
only influence the building cost but also the type of equipment needed as well as
the floor space left for future expansion.
If the warehouse is built for four pallets high, floor space will have to be provided
for 1500 pallets in order to have storage space for a total of 6000 pallets (1500 x
4). In the case of five and six pallets high provision has to be made for 1200 and
1000 pallets respectively to get to the full amount of 6000.
Please take note that doors have to be at least 2.56m wide and aisles 3.2m
where reach trucks will be operating and 3.6m where forklifts will be operating, in
order to ensure that these equipment can freely move between aisles and
different rooms. Forklifts will only be used in the receiving and loading areas to
unload and load delivery trucks since the height of a reach truck makes this task
impossible.
Also note that back-to-back racking will be used, meaning that every two rows
will be built back to back with each other so that all pallets are only accessible
from one side. In effect this means that you can access a specific pallet from
one and only one aisle.
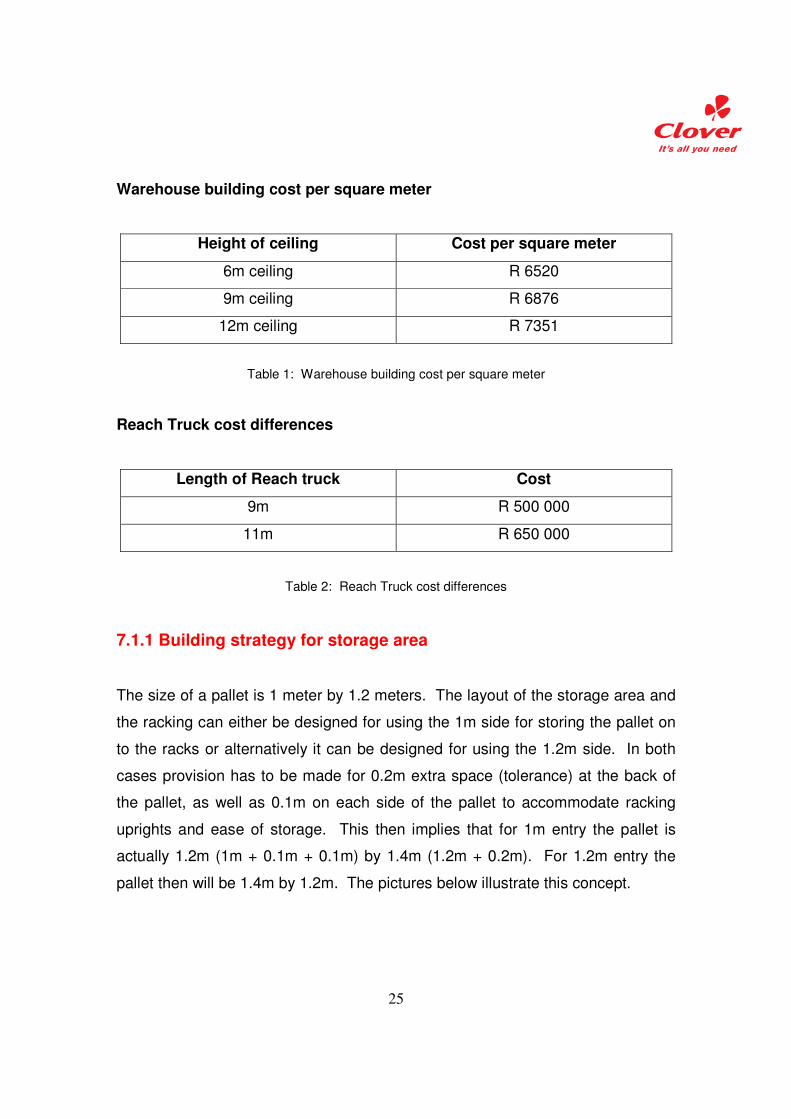
The tables below show the cost per square meter for different ceiling heights as
well as the costs for different reach trucks, the one type of warehouse equipment
that will be needed to move pallets from the receiving area to the storage area
and then from the storage area to the dispatching area.
25
Warehouse building cost per square meter
Height of ceiling Cost per square meter
6m ceiling R 6520
9m ceiling R 6876
12m ceiling R 7351
Table 1: Warehouse building cost per square meter
Reach Truck cost differences
Length of Reach truck Cost
9m R 500 000
11m R 650 000
Table 2: Reach Truck cost differences
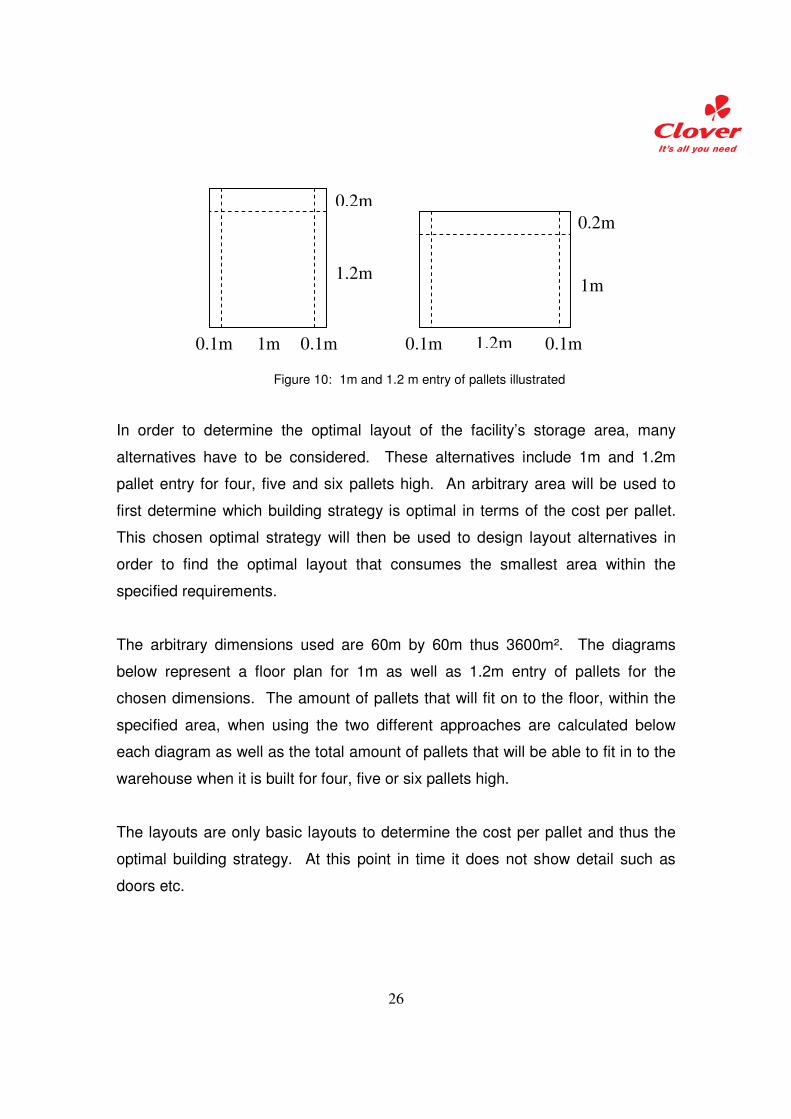
7.1.1 Building strategy for storage area
The size of a pallet is 1 meter by 1.2 meters. The layout of the storage area and
the racking can either be designed for using the 1m side for storing the pallet on
to the racks or alternatively it can be designed for using the 1.2m side. In both
cases provision has to be made for 0.2m extra space (tolerance) at the back of
the pallet, as well as 0.1m on each side of the pallet to accommodate racking
uprights and ease of storage. This then implies that for 1m entry the pallet is
actually 1.2m (1m + 0.1m + 0.1m) by 1.4m (1.2m + 0.2m). For 1.2m entry the
pallet then will be 1.4m by 1.2m. The pictures below illustrate this concept.
26
Figure 10: 1m and 1.2 m entry of pallets illustrated
In order to determine the optimal layout of the facility’s storage area, many
alternatives have to be considered. These alternatives include 1m and 1.2m
pallet entry for four, five and six pallets high. An arbitrary area will be used to
first determine which building strategy is optimal in terms of the cost per pallet.
This chosen optimal strategy will then be used to design layout alternatives in
order to find the optimal layout that consumes the smallest area within the
specified requirements.
The arbitrary dimensions used are 60m by 60m thus 3600m². The diagrams
below represent a floor plan for 1m as well as 1.2m entry of pallets for the
chosen dimensions. The amount of pallets that will fit on to the floor, within the
specified area, when using the two different approaches are calculated below
each diagram as well as the total amount of pallets that will be able to fit in to the
warehouse when it is built for four, five or six pallets high.
The layouts are only basic layouts to determine the cost per pallet and thus the
optimal building strategy. At this point in time it does not show detail such as
doors etc.
1m
1m
0.2m
0.2m
1.2m
1.2m 0.1m 0.1m 0.1m 0.1m
27
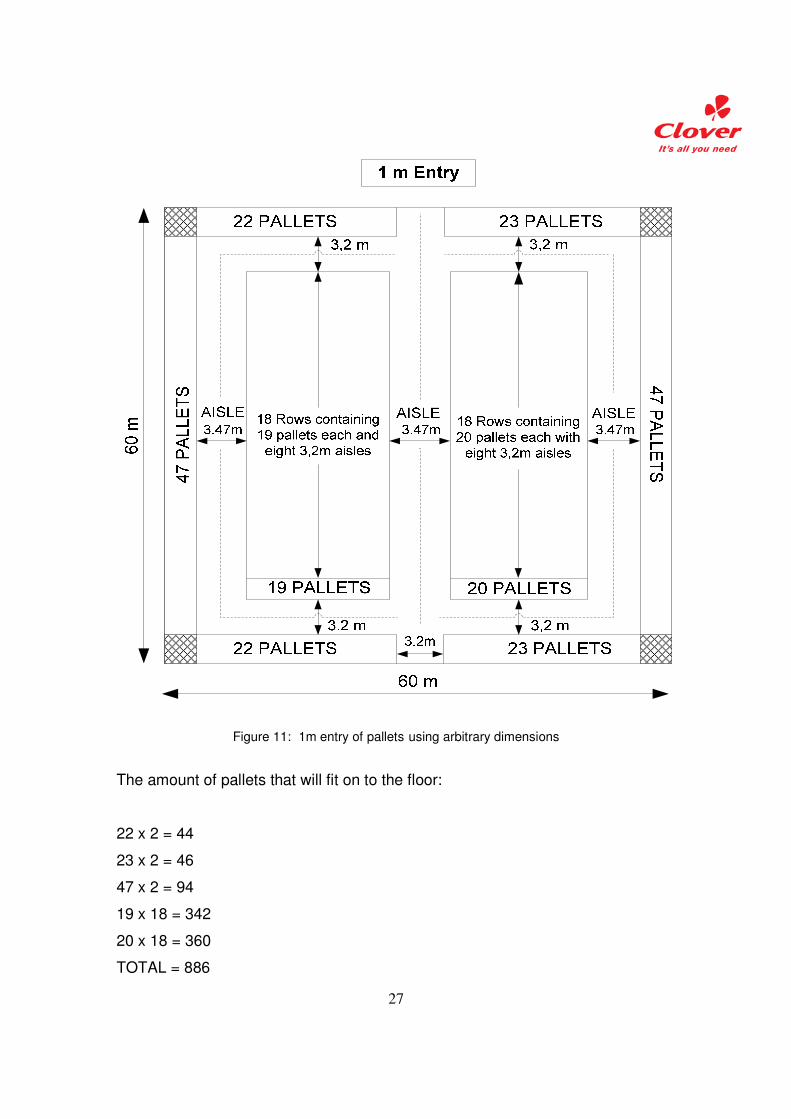
Figure 11: 1m entry of pallets using arbitrary dimensions
The amount of pallets that will fit on to the floor:
22 x 2 = 44
23 x 2 = 46
47 x 2 = 94
19 x 18 = 342
20 x 18 = 360
TOTAL = 886
28
The total amount of pallets that will fit in to the warehouse when it is built for:
• Four pallets high: 4 x 886 = 3544
• Five pallets high: 5 x 886 = 4330
• Six pallets high: 6 x 866 = 5196
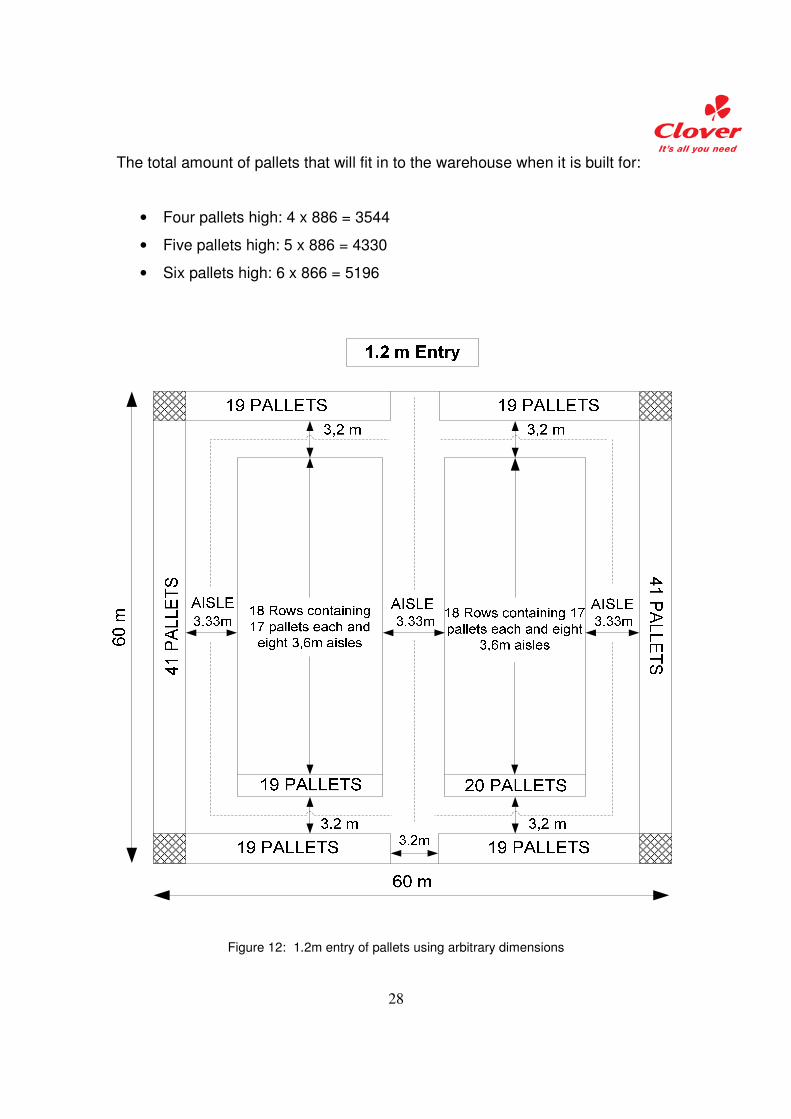
Figure 12: 1.2m entry of pallets using arbitrary dimensions
29
The amount of pallets that will fit on to the floor:
19 x 4 = 76
41 x 2 = 82
17 x 18 x 2 = 612
TOTAL = 770
The total amount of pallets that will fit in to the warehouse when it is built for:
• Four pallets high: 4 x 770 = 3080
• Five pallets high: 5 x 770 = 3850
• Six pallets high: 6 x 770 = 4620
The table below summarizes the above options and shows the total building cost
as well as the associated cost per pallet for each building strategy.
The comparison shows that option five will result in the lowest cost per pallet.
This then implies that the best building strategy is 1m entry of pallets and six
pallets high.
The cost of warehouse equipment has not yet been taken in to account but will
be considered once the warehouse equipment requirements have been
determined.
30
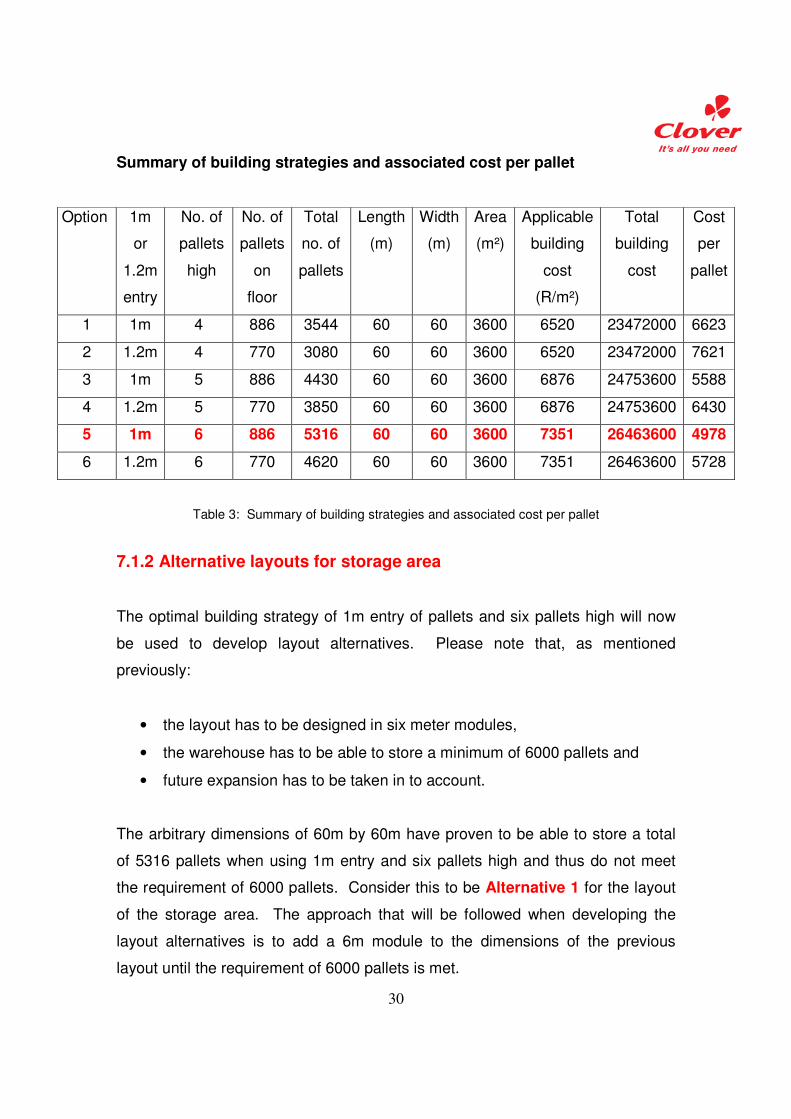
Summary of building strategies and associated cost per pallet
Option 1m
or
1.2m
entry
No. of
pallets
high
No. of
pallets
on
floor
Total
no. of
pallets
Length
(m)
Width
(m)
Area
(m²)
Applicable
building
cost
(R/m²)
Total
building
cost
Cost
per
pallet
1 1m 4 886 3544 60 60 3600 6520 23472000 6623
2 1.2m 4 770 3080 60 60 3600 6520 23472000 7621
3 1m 5 886 4430 60 60 3600 6876 24753600 5588
4 1.2m 5 770 3850 60 60 3600 6876 24753600 6430
5 1m 6 886 5316 60 60 3600 7351 26463600 4978
6 1.2m 6 770 4620 60 60 3600 7351 26463600 5728
Table 3: Summary of building strategies and associated cost per pallet
7.1.2 Alternative layouts for storage area
The optimal building strategy of 1m entry of pallets and six pallets high will now
be used to develop layout alternatives. Please note that, as mentioned
previously:
• the layout has to be designed in six meter modules,
• the warehouse has to be able to store a minimum of 6000 pallets and
• future expansion has to be taken in to account.
The arbitrary dimensions of 60m by 60m have proven to be able to store a total
of 5316 pallets when using 1m entry and six pallets high and thus do not meet
the requirement of 6000 pallets. Consider this to be Alternative 1 for the layout
of the storage area. The approach that will be followed when developing the
layout alternatives is to add a 6m module to the dimensions of the previous
layout until the requirement of 6000 pallets is met.
31
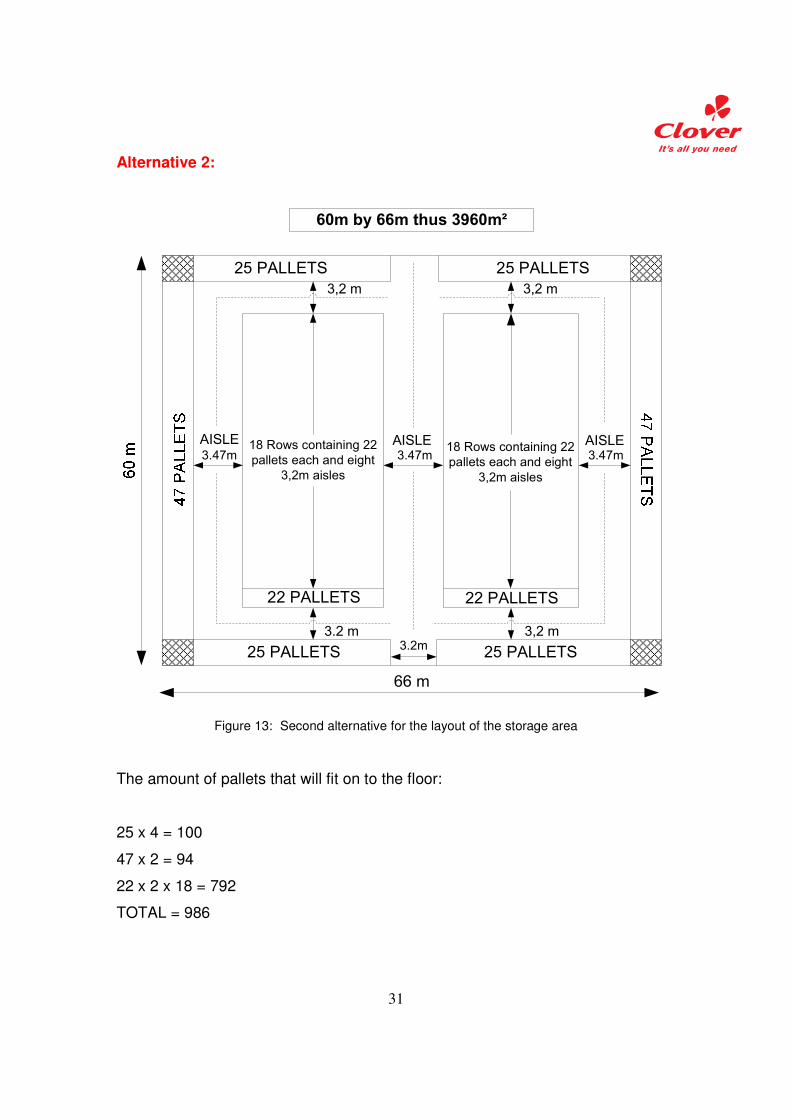
Alternative 2:
25 PALLETS
25 PALLETS
25 PALLETS
25 PALLETS
AISLE
22 PALLETS 22 PALLETS
18 Rows containing 22
pallets each and eight
3,2m aisles
18 Rows containing 22
pallets each and eight
3,2m aisles
3.47m 3.47m 3.47mAISLEAISLE
3,2 m 3,2 m
3,2 m3.2 m
66 m
60m by 66m thus 3960m²
3.2m
Figure 13: Second alternative for the layout of the storage area
The amount of pallets that will fit on to the floor:
25 x 4 = 100
47 x 2 = 94
22 x 2 x 18 = 792
TOTAL = 986
32
The total amount of pallets that will fit in to the warehouse is thus 6 x 986 = 5916.
This fails to meet the set requirement of 6000 pallets by 1.4% which is quite
minimal but is still unacceptable.
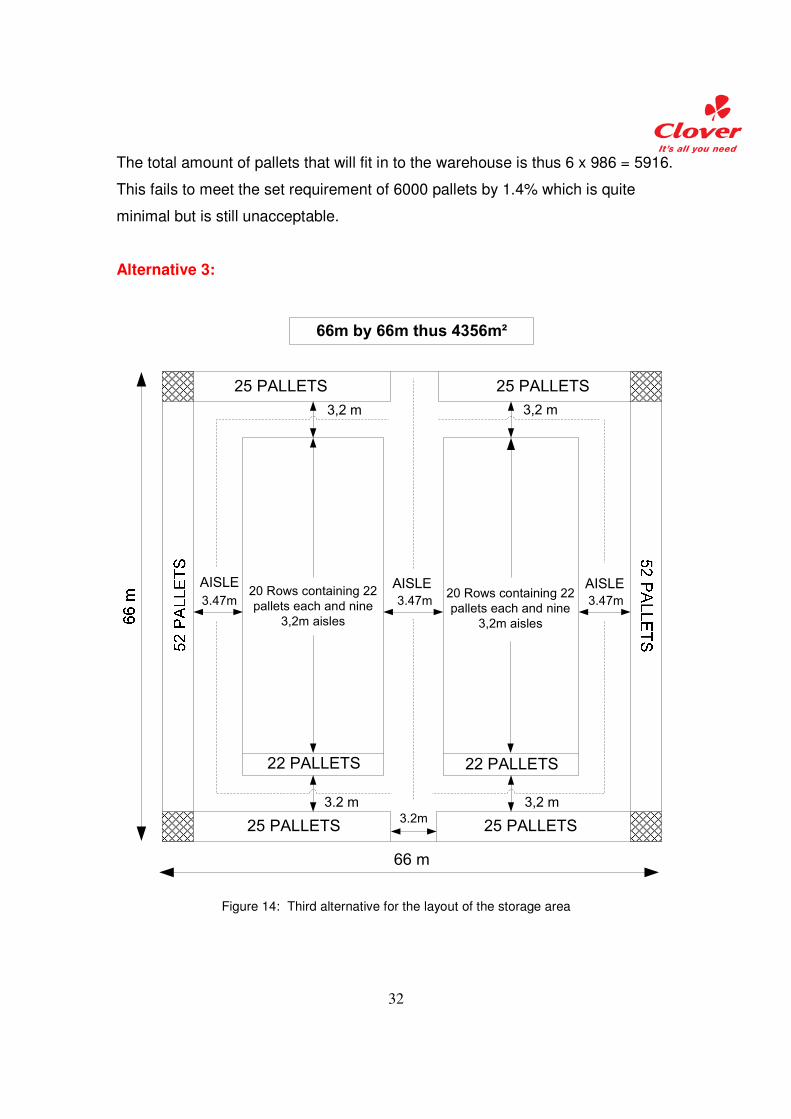
Alternative 3:
25 PALLETS
25 PALLETS
25 PALLETS
25 PALLETS
AISLE
22 PALLETS 22 PALLETS
20 Rows containing 22
pallets each and nine
3,2m aisles
20 Rows containing 22
pallets each and nine
3,2m aisles
3.47m 3.47m 3.47m
AISLEAISLE
3,2 m 3,2 m
3,2 m3.2 m
66 m
66m by 66m thus 4356m²
3.2m
Figure 14: Third alternative for the layout of the storage area
33
The amount of pallets that will fit on to the floor:
25 x 4 = 100
52 x 2 = 104
22 x 2 x 20 = 880
TOTAL = 1084
The total amount of pallets that will fit in to the warehouse is thus 6 x 1084 =
6504. This exceeds the set requirement of 6000 pallets with 8.4%.
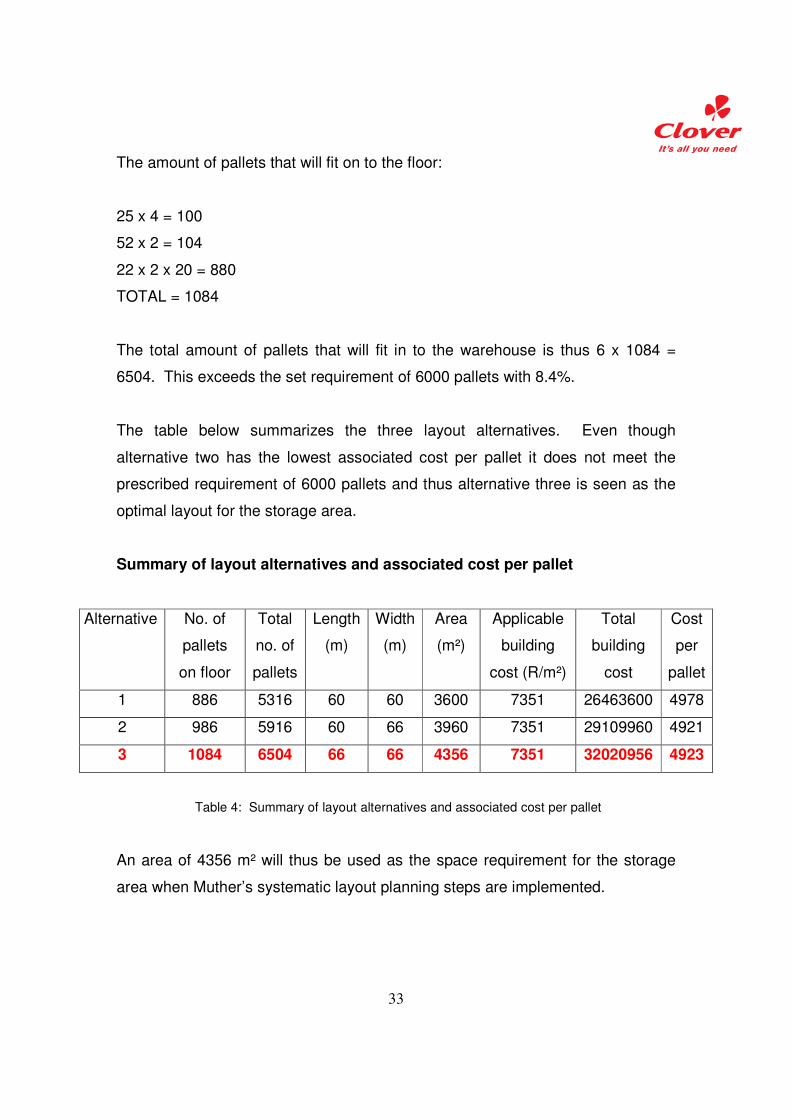
The table below summarizes the three layout alternatives. Even though
alternative two has the lowest associated cost per pallet it does not meet the
prescribed requirement of 6000 pallets and thus alternative three is seen as the
optimal layout for the storage area.
Summary of layout alternatives and associated cost per pallet
Alternative No. of
pallets
on floor
Total
no. of
pallets
Length
(m)
Width
(m)
Area
(m²)
Applicable
building
cost (R/m²)
Total
building
cost
Cost
per
pallet
1 886 5316 60 60 3600 7351 26463600 4978
2 986 5916 60 66 3960 7351 29109960 4921
3 1084 6504 66 66 4356 7351 32020956 4923
Table 4: Summary of layout alternatives and associated cost per pallet
An area of 4356 m² will thus be used as the space requirement for the storage
area when Muther’s systematic layout planning steps are implemented.
34
7.2 Layout design of receiving area
As mentioned previously, products will be received from the factory on the
Clayville site as well as from Clover’s other factories. The products that will be
received through the wall of the factory in to the warehouse are referred to as
internal receiving, while products that are delivered with delivery trucks from
other factories around the country are referred to as external receiving.
In order to keep the administration inside the warehouse as simple as possible, it
would be more sensible to receive the internal and external products separately.
This means that provision would be made for two receiving areas.
7.2.1 Available data relevant to receiving area
Please note that, as mentioned previously, Clover is a fast moving consumer
goods company (FMCG) and their products are perishable so they are not able
to keep great amounts of inventory, thus only 5995 pallets will be stored in the
warehouse.
The amount of pallets that are received and dispatched, thus the throughput of
the warehouse will be much higher. The data that summarizes the amount of
pallets that will be received internally as well as externally can be seen in
Appendix A of this document.
A total of 32304 pallets will be received through the factory wall into the
warehouse per month, while 8964 pallets will be received from other facilities.
35
7.2.1.1 On-site production i.e. internal receiving
The data below is relevant to the internal receiving area that will be designed.
Please note that answers to all calculations will be round up or down to the
nearest whole number, depending on what is being calculated, in order to work
with full pallets etc.
• Products will be received over a period of 16 hours per day.
• The department will be active for 24 days in a month.
• The total number of working hours per month can thus be calculated as
follows: 16 hours x 24 days = 384 hours per month.
• 32304 pallets will be received internally per month.
• 32304 pallets per month / 24 days = 1346 pallets per day.
• 32304 pallets per month / 384 hours per month = 84.125 thus 85 pallets
per hour.
• It takes 3.5 minutes to receive one pallet, thus 17 pallets (60 / 3.5 = 17.14
thus only 17 pallets effectively) can be received by one person every hour.
This means that five people will be needed at the internal receiving area
(85 pallets per hour / 17 pallets per person per hour = 5 people).
• Scanners are part of the warehouse equipment that will be needed to scan
barcodes to put the new products that are received into the warehouse
management system. Since five people will be needed in the internal
receiving area, five scanners will be needed as well.
• A reach truck takes 5 minutes to transfer a pallet from the receiving area
to the storage area, meaning it can move 12 pallets per hour (60 / 5 = 12).
• Since 85 pallets are received per hour, eight reach trucks will be needed
at the internal receiving area (85 pallets per hour / 12 pallets per hour per
reach truck = 7.08, thus eight reach trucks).
• There will be assumed that floor space will have to be provided for 45
minutes worth of production of pallets in the receiving area. This means
36
that if 85 pallets are received per hour, 64 pallets (85 x 45 / 60 = 63.75
thus 64) will be received in 45 minutes. These 64 pallets will take up
space in the receiving area while it is being checked and a barcode placed
on the products before it is taken to the storage area by a reach truck.
• Please take note that only full pallets of products will be received from the
factory through the wall in to the warehouse.
7.2.1.2 Off-site production i.e. external receiving
The data below is relevant to the external receiving area that will be designed.
• Products will be received over a period of 24 hours per day.
• There will be three shifts of eight hours each in the 24 hour period.
• The department will be active for 24 days in a month.
• 8964 pallets will be received externally per month (refer to Appendix A).
• The amount of pallets that will be received in a day can be calculated as
follows: 8964 pallets per month / 24 days per month = 373.5 thus 374
pallets per day.
• 50% of the amount of pallets received in a day will be received during the
first eight hour shift, thus 50% of 374 pallets results in 187 pallets. This
then means that 24 pallets are received per hour during the first shift
which is equal to one primary delivery truck per hour. The other 50% will
be received during the second and third shift. This in effect means that
the first shift creates the constraint for the external receiving department.
• A forklift takes 1.5 minutes to unload a pallet from a primary delivery truck.
One forklift can thus unload 40 pallets per hour (60 / 1.5 = 40). One forklift
is thus required to offload trucks at external receiving (No scanners is
required during offloading).
37
• It is assumed that 75% of the 24 pallets delivered by a truck will be full
pallets i.e. pallets that is fully stacked by one type of product. This results
in 18 full pallets (24 x 75 / 100 = 18).
• The other 25% or 6 pallets contain more than one product (an average of
three products per pallet) and will need to be separated, by the workers in
the receiving area, on to different pallets. This means 36 pallets (18 + 18
pallets) effectively goes in to the warehouse.
• Similar to the internal receiving department, it takes 3.5 minutes to receive
one pallet, thus 17 pallets (60 / 3.5 = 17.14, thus only 17 pallets
effectively) can be received by one person every hour. This then means
that three people will be needed at the external receiving area to receive
36 pallets per hour. If three people are needed at the external receiving
area two scanners are needed as well.
• Just as with the internal receiving of products, a reach truck takes 5
minutes to transfer (put away) a pallet from the receiving area to the
storage area (storage location), meaning it can move 12 pallets per hour
(60 / 5 = 12). Three reach trucks will be required to put away the 36
pallets within an hour. If three reach trucks are needed at the external
receiving area then three scanners are needed as well.
• As with the internal receiving of products, floor space will have to be
provided in the receiving area for pallets, while it is being checked and a
barcode placed on the products before it is taken to the storage area by a
reach truck. 36 pallets will be received, by the 3 workers in the receiving
area, taking 3.5 minutes per pallet thus (36 x 3.5) / 3 = 42 minutes. Thus
the maximum time it takes to offload, receive and store all the pallets on a
delivery truck is 36 (1.5 x 24) minutes for offloading + 42 minutes for
receiving + 60 (5 x 36 / 3) minutes to put the pallets away = 138 minutes.
The put away time of 60 minutes can be reduced if reach trucks becomes
available from other areas. The stage area inside will be occupied for this
time. To accommodate 8 trucks in 8 hours you require (8 trucks x 138
38
minutes) / (8 hours x 60 minutes) = 2.3 stage areas thus 3 stage areas
that must be able to store 36 pallets each.
• At average it takes around 1.5 hours for a truck to dock, off-load plus
handle documentation. This is then the time that a delivery truck actually
takes up a parking bay. To accommodate 8 trucks in 8 hours you require
(8 trucks x 90 minutes) / (8 hours x 60 minutes) = 1.5 thus 2 docking bays
to offload trucks.
7.2.2 Basic space requirements for receiving areas
The steps followed in the systematic layout planning approach by Muther will
determine what the layout of all the departments will look like. The diagrams
below just demonstrate the space that will be required by the internal and
external receiving areas respectively.
Please note that as mentioned previously, forklifts will be used to unload delivery
trucks and thus provision has to be made for aisles of 3.6m wide in the receiving
areas to accommodate the equipment.
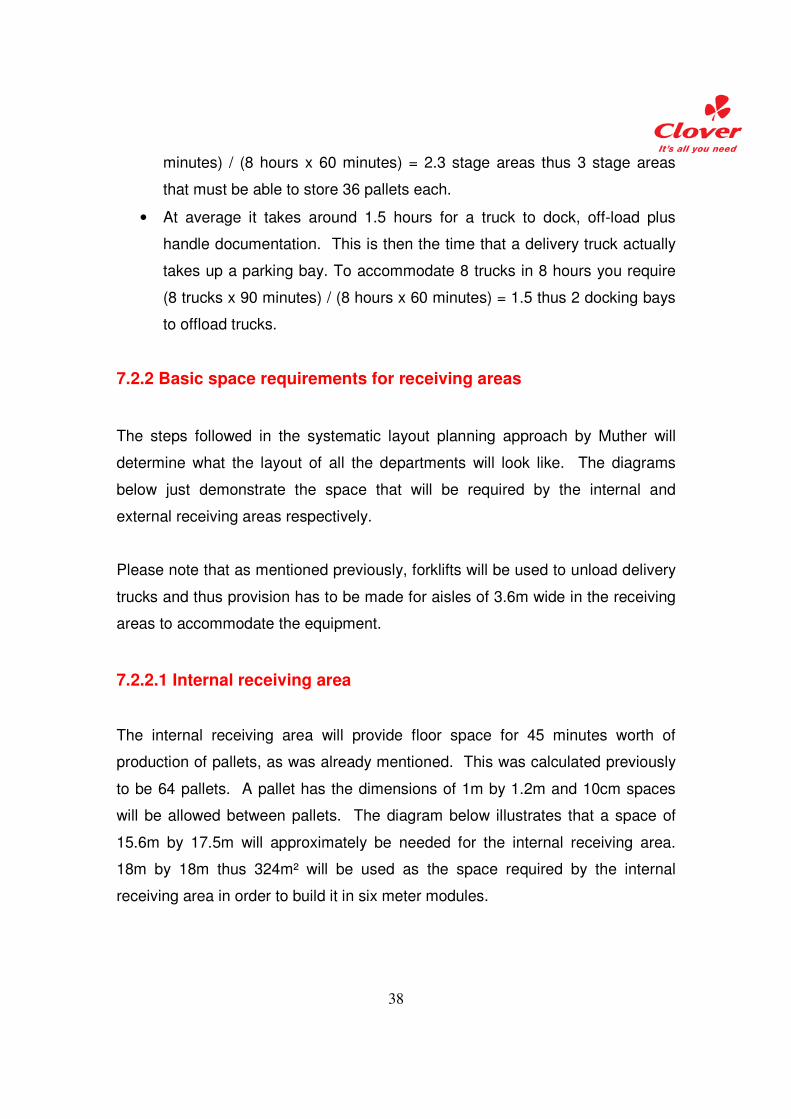
7.2.2.1 Internal receiving area
The internal receiving area will provide floor space for 45 minutes worth of
production of pallets, as was already mentioned. This was calculated previously
to be 64 pallets. A pallet has the dimensions of 1m by 1.2m and 10cm spaces
will be allowed between pallets. The diagram below illustrates that a space of
15.6m by 17.5m will approximately be needed for the internal receiving area.
18m by 18m thus 324m² will be used as the space required by the internal
receiving area in order to build it in six meter modules.
39
1.2 m
1 m
10 cm space
between pallets
1 765432 12111098
17 232221201918
3.6 m
AISLE
2827262524
33 393837363534 4443424140
1.2 m
1.2 m
16151413
48474645
32313029
49 555453525150 6059585756 64636261
3.6 m
AISLE
3.6 m
AISLE
1.2 m
Figure 15: Space required by internal receiving area
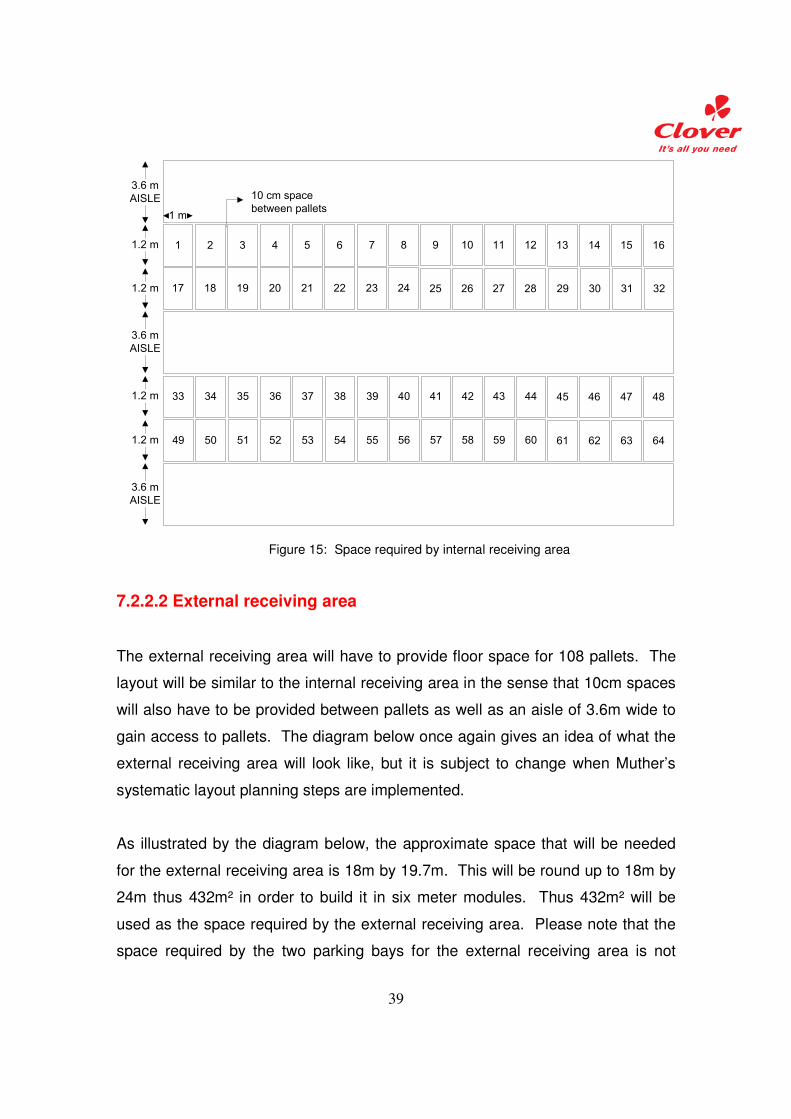
7.2.2.2 External receiving area
The external receiving area will have to provide floor space for 108 pallets. The
layout will be similar to the internal receiving area in the sense that 10cm spaces
will also have to be provided between pallets as well as an aisle of 3.6m wide to
gain access to pallets. The diagram below once again gives an idea of what the
external receiving area will look like, but it is subject to change when Muther’s
systematic layout planning steps are implemented.
As illustrated by the diagram below, the approximate space that will be needed
for the external receiving area is 18m by 19.7m. This will be round up to 18m by
24m thus 432m² in order to build it in six meter modules. Thus 432m² will be
used as the space required by the external receiving area. Please note that the
space required by the two parking bays for the external receiving area is not
40
included in the above space requirements. This will be taken in to account
though when the layout alternatives are developed.
Figure 16: Space required by external receiving area
7.3 Layout design of dispatching area
The dispatching area will consist of:
• Stage areas and
• Dock cubicles.
Please note that the assumption is made that the same amount of pallets that are
received per hour should be dispatched per hour to ensure that the contents level
of the warehouse remains stable. If more products are received than dispatched,
the warehouse might exceed its capacity. On the other hand, if more products
41
are dispatched than received, the capacity of the warehouse will not be optimally
utilized.
Products will be dispatched in three eight hour shifts, thus over a 24 hour period
and will be divided as follows:
• 40% during the first shift.
• 30% during the second shift.
• 30% during the third shift.
Stage areas are a term that is used to refer to floor space within the warehouse
that is allocated to temporarily keep pallets that are ready and waiting to be
dispatched to the customer that ordered it. Each stage area contains the
products from a separate order to ensure that products from different orders do
not get mixed up. An amount of 28 pallets can fit in to one stage area since that
is also the amount that can fit in to a truck if required.
It is assumed that 75% of the 24 pallets inventory ordered by a customer, thus 18
pallets, will be full pallets i.e. pallets that is fully stacked by one type of product.
The other 25% or 6 pallets contain more than one product. These pallets are
stacked with cases of different products that are individually picked by pickers in
the storage area. These individual picks of different cases of products are
referred to as tasks. A task is just an instruction to a picker to go to a certain
location in the storage area and pick a certain amount of cases of a certain
product.
Dock cubicles are similar to parking bays referred to in the external receiving
area. It is basically only an opening in the wall off the warehouse where goods
can be loaded on to a truck. A dock cubicle is the same width as a truck, which
is 2.8m. A dock leveler is used to ease the movement of the forklifts transporting
the products from the warehouse in to the back of the truck.
42
Sufficient space has to be provided on the outside of the warehouse, in front of
the dock cubicles for multiple trucks to gain access to the different dock cubicles.
Provision is thus made for only one dock cubicle within a 6m module.
The length of a truck is usually 18m which makes it difficult to reverse these
vehicles in order to park it with the back of the truck facing the dock cubicle. 50m
will thus be provided for maneuvering trucks in and out of dock cubicles.
All the products that have been ordered by a certain customer (irrespective of
whether it is a full pallet of products or different cases of products stacked on to
one pallet) will already be stacked on pallets and be waiting in the stage area by
the time the truck arrives to collect the order. This means that the time it takes to
pick full pallets and tasks have no influence on the time a truck takes up a dock
cubicle. The only time that has to be taken in to account is the time it takes a
forklift to load a truck.
As mentioned with the external receiving area, it takes a forklift 1.5 minutes to
load a pallet on to a truck and a truck usually have to be loaded with 28 pallets
meaning that it takes 1.5 x 28 pallets = 42 minutes to load a truck.
7.3.1 Basic space requirements for dispatching area
As mentioned previously, the same amount of pallets that are received per hour
has to be dispatched per hour in order to keep the contents level of the
warehouse stable.
The following information will be used to determine the space requirements of the
stage areas and dock cubicles:
43
• 1346 pallets are received internally per day.
• 374 pallets are received externally per day.
• Trucks are loaded during three eight hour shifts, thus over a 24 hour
period.
• 28 physical pallets (24 pallets inventory) are loaded on to each truck
• A total of 1720 pallets are received per day and need to be dispatched
over a 24 hour period.
• 1720 pallets per day / 24 pallets per truck = 71.67 thus 72 trucks are
dispatched per day.
7.3.1.1 Basic space requirements for stage area
There will be assumed that stage areas will have to be provided for the pallets of
35% of the trucks that are loaded in the first shift. 40% of the total number of
trucks that are loaded in a day will be loaded during the first shift, thus 40% of 72
trucks gives 28.8, thus 29 trucks. 35% of 29 trucks are 10.15. Provision will thus
be made for 10 stage areas.
The space requirement for one stage area is the space consumed by 28 pallets.
Although trucks usually contain only 24 pallets when it arrives at the external
receiving area, 28 pallets can be loaded on to a truck at the dispatching area.
The stage areas will thus have to be able to accommodate 28 pallets.
A pallet has the dimensions of 1m by 1.2m and 10cm spaces will be allowed
between pallets. The stage area will be designed for two rows of 14 pallets each
back-to-back. Provision has to be made for aisles of 3.6m between stage areas
in order for checkers to gain access to pallets and for forklifts to access the
different stage areas and load different trucks simultaneously.
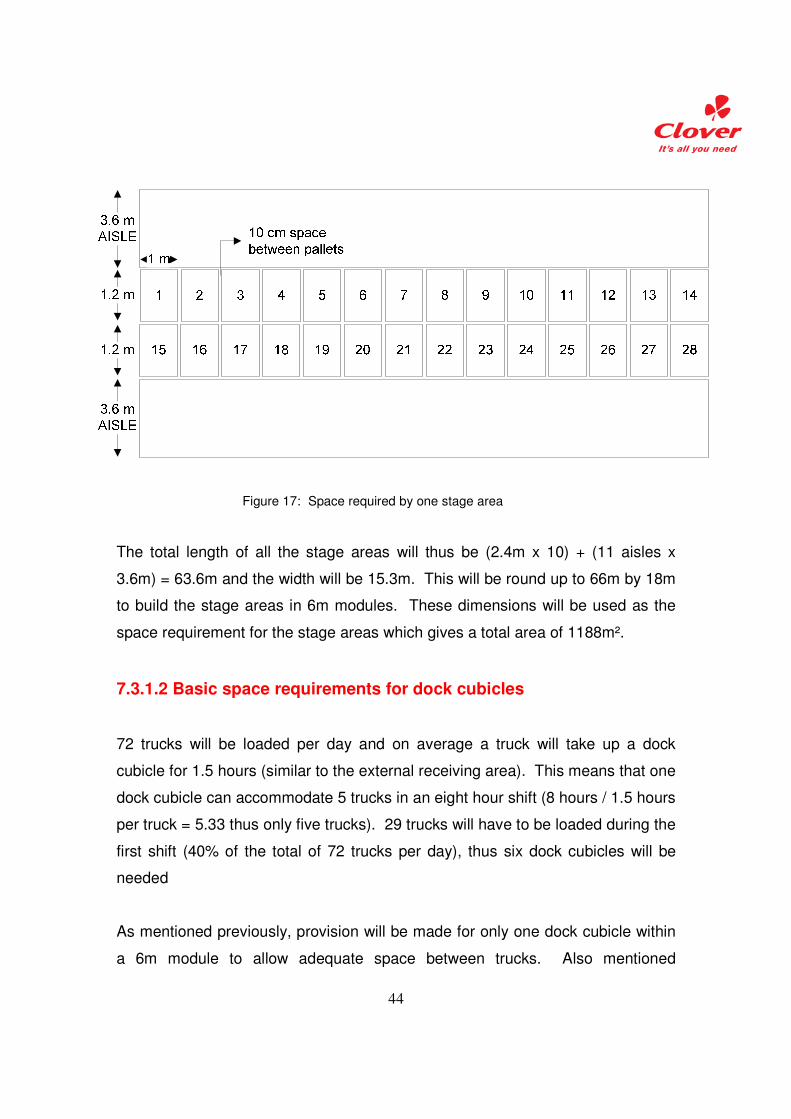
The diagram on the following page illustrates one stage area.
44
Figure 17: Space required by one stage area
The total length of all the stage areas will thus be (2.4m x 10) + (11 aisles x
3.6m) = 63.6m and the width will be 15.3m. This will be round up to 66m by 18m
to build the stage areas in 6m modules. These dimensions will be used as the
space requirement for the stage areas which gives a total area of 1188m².
7.3.1.2 Basic space requirements for dock cubicles
72 trucks will be loaded per day and on average a truck will take up a dock
cubicle for 1.5 hours (similar to the external receiving area). This means that one
dock cubicle can accommodate 5 trucks in an eight hour shift (8 hours / 1.5 hours
per truck = 5.33 thus only five trucks). 29 trucks will have to be loaded during the
first shift (40% of the total of 72 trucks per day), thus six dock cubicles will be
needed
As mentioned previously, provision will be made for only one dock cubicle within
a 6m module to allow adequate space between trucks. Also mentioned
45
previously is that 50m space has to be provided on the outside for maneuvering
trucks in and out of dock cubicles.
The space requirement for the dock cubicles is thus 36m (6 x 6m modules) by
50m thus 1800m².
7.4 Layout design of offices
Provision has to be made for two operational offices, one for personnel working
in the receiving department and the other for personnel from the dispatching
department. The dispatching department will have more operational workers
than the receiving department and will consequently need a larger office that can
accommodate more office equipment.
7.4.1 Basic space requirements for offices
The space requirements that will be used for the receiving and dispatching
offices respectively are:
• 6m x 3m, thus 18m² and
• 6m x 6m, thus 36m².
• TOTAL: 18m² + 36m² = 54m²
7.5 Layout design of battery room
The details of the battery room are not included in the project scope, but a space
requirement has to be determined in order to design the layout of the facility.
The battery room is a room in which the batteries of all equipment are charged.
The space required by this department is thus dependant on the equipment
requirements of the facility.
46
7.5.1 Equipment requirements
As calculated previously, the internal and external receiving area will respectively
require five and two scanners and seven and two reach trucks. The external
receiving area will also need one forklift with which to unload the delivery trucks.
The following information is relevant to calculate the equipment requirements for
the dispatching area:
• It takes a reach truck five minutes to fetch a pallet of products from the
storage area and also five minutes to do a replenishment. (A
replenishment is when a reach truck takes products from the bulk storage
area and moves it to the pick face area where separate crates of products
can be picked).
• It takes a power pallet truck 2 minutes to pick one task. In other words
this means that it takes 2 minutes to go to a certain location in the storage
area and pick a certain amount of cases of a certain product.
• A maximum of 2000 tasks will be picked per day.
• 72 trucks will be loaded per day.
• 18 of the 24 pallets inventory on a truck will be full pallets, thus a reach
truck will have to fetch 18 pallets x 72 trucks = 1296 pallets per day.
• The 6 remaining pallets out of the total of 24 pallets inventory will be
stacked with products picked in different tasks. A reach truck is required
to bring products from the bulk storage area into the pick face area
(replenishment) for these 6 pallets. The replenishments that need to be
done per day is 6 pallets x 72 trucks = 432 pallets.
• Products will be picked in two eight hour shifts, 50% during each shift.
• Trucks will be loaded during three eight hour shifts, 40% during the first
and 30% in both the second and third shifts. This means that the first
shift will constrain the system.
47
• Reach trucks will need to pick 50% of the 18 full pallets for 72 trucks in an
eight hour shift, thus 0.5 x 18 x 72 = 648 pallets in eight hours. A reach
truck can pick 96 pallets in an eight hour shift (8 hours x 60 minutes /
5minutes per pallet = 96 pallets). This means that 648 pallets / 96 pallets
per reach truck = 6.75 reach trucks. Reach trucks will also need to do the
replenishment of 50% of inventory (6 pallets per truck) during the first
eight hour shift, thus 0.5 x 6 x 72 = 216 pallets in eight hours. This means
that 216 pallets / 96 pallets per reach truck = 2.25. Thus, a total of 9
reach trucks are required for dispatching to take place.
• Power pallet trucks will need to pick 40% of 2000 tasks in an eight hour
shift, thus 800 tasks. A power pallet truck can pick 240 tasks in an eight
hour shift (8 hours x 60 minutes / 2 minutes per task = 240 tasks). This
means that 800 / 240 = 3.33 thus 4 power pallet trucks will be needed. A
picker requires a scanner for each power pallet truck thus 4 scanners are
required.
• Forklifts will need to load 28 pallets (irrespective of whether it is full pallets
of products or different cases of products stacked on to one pallet) per
truck for 29 trucks in the first eight hour shift, thus 28 x 29 = 812 pallets.
A forklift can load 320 pallets in an eight hour shift (8 hours x 60 minutes /
1.5 minutes per pallet = 320), meaning that three forklifts will be required.
No scanners are required for loading.
48
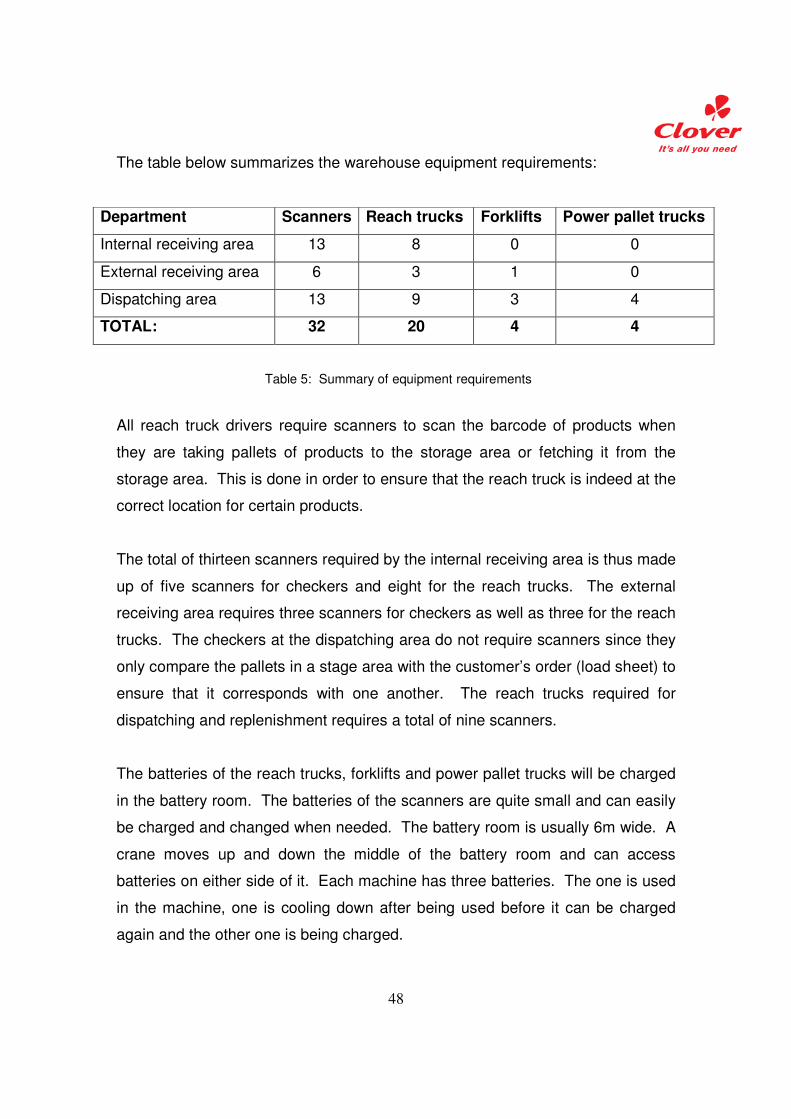
The table below summarizes the warehouse equipment requirements:
Department Scanners Reach trucks Forklifts Power pallet trucks
Internal receiving area 13 8 0 0
External receiving area 6 3 1 0
Dispatching area 13 9 3 4
TOTAL: 32 20 4 4
Table 5: Summary of equipment requirements
All reach truck drivers require scanners to scan the barcode of products when
they are taking pallets of products to the storage area or fetching it from the
storage area. This is done in order to ensure that the reach truck is indeed at the
correct location for certain products.
The total of thirteen scanners required by the internal receiving area is thus made
up of five scanners for checkers and eight for the reach trucks. The external
receiving area requires three scanners for checkers as well as three for the reach
trucks. The checkers at the dispatching area do not require scanners since they
only compare the pallets in a stage area with the customer’s order (load sheet) to
ensure that it corresponds with one another. The reach trucks required for
dispatching and replenishment requires a total of nine scanners.
The batteries of the reach trucks, forklifts and power pallet trucks will be charged
in the battery room. The batteries of the scanners are quite small and can easily
be charged and changed when needed. The battery room is usually 6m wide. A
crane moves up and down the middle of the battery room and can access
batteries on either side of it. Each machine has three batteries. The one is used
in the machine, one is cooling down after being used before it can be charged
again and the other one is being charged.
49
Space required by the batteries of the different types of equipment is as follows:
• 2m per reach truck.
• 1.5m per forklift.
• 1.2m per power pallet truck.
Provision has to be made for a docking area where the equipment can enter the
battery room and the crane can access the equipment in order to remove or
replace the battery. Provision will be made for a 6m by 6m docking area.
The battery room should also include a maintenance area for the equipment.
Provision will be made for a maintenance area of 10m by 6m.
The diagram below illustrates on a high level what the battery room will look like
and the space that it will consume. Please note that 30cm spaces (not shown on
the diagram below) will be allowed between each station.
50
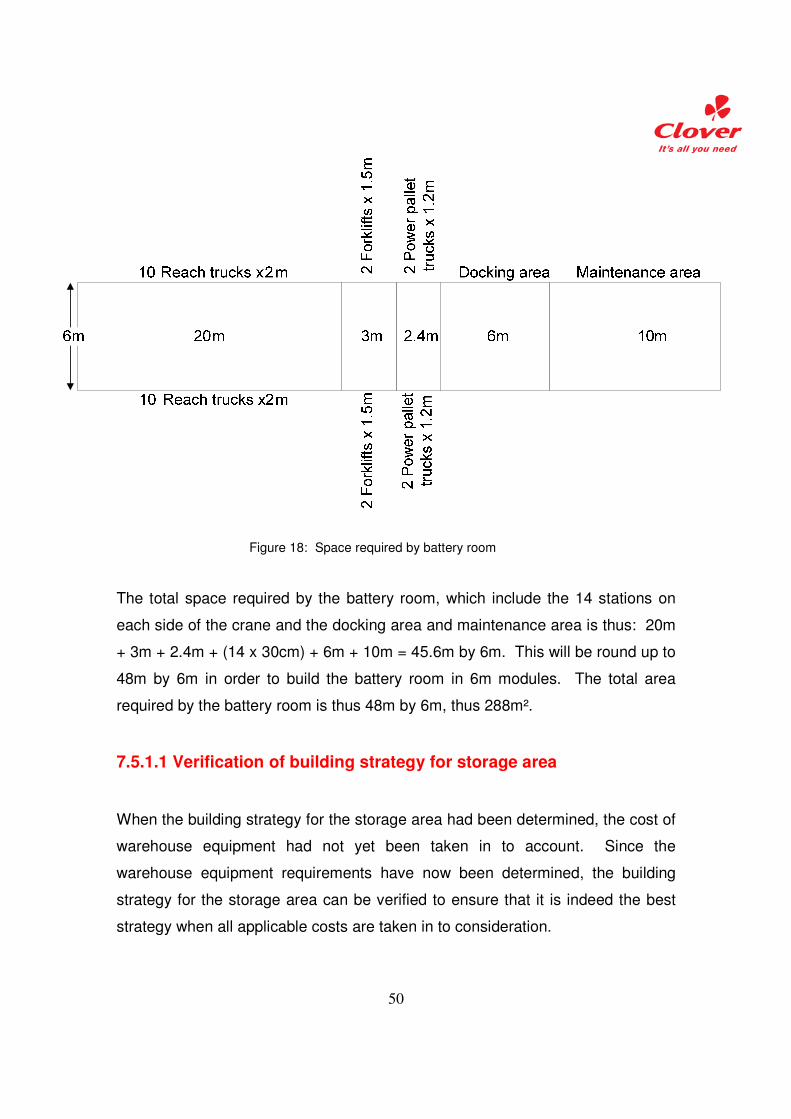
Figure 18: Space required by battery room
The total space required by the battery room, which include the 14 stations on
each side of the crane and the docking area and maintenance area is thus: 20m
+ 3m + 2.4m + (14 x 30cm) + 6m + 10m = 45.6m by 6m. This will be round up to
48m by 6m in order to build the battery room in 6m modules. The total area
required by the battery room is thus 48m by 6m, thus 288m².
7.5.1.1 Verification of building strategy for storage area
When the building strategy for the storage area had been determined, the cost of
warehouse equipment had not yet been taken in to account. Since the
warehouse equipment requirements have now been determined, the building
strategy for the storage area can be verified to ensure that it is indeed the best
strategy when all applicable costs are taken in to consideration.
51
Option 1m or
1.2m
entry
No. of
pallets
high
Total no.
of pallets
Applicable
reach truck
cost
Total reach
truck cost
Applicable
building
cost (R/m²)
Total
building
cost
Cost
per
pallet
1 1m 4 3544 500 000 10000000 6520 23472000 9445
2 1.2m 4 3080 500 000 10000000 6520 23472000 10868
3 1m 5 4430 500 000 10000000 6876 24753600 7845
4 1.2m 5 3850 500 000 10000000 6876 24753600 9027
5 1m 6 5316 650 000 13000000 7351 26463600 7424
6 1.2m 6 4620 650 000 13000000 7351 26463600 8542
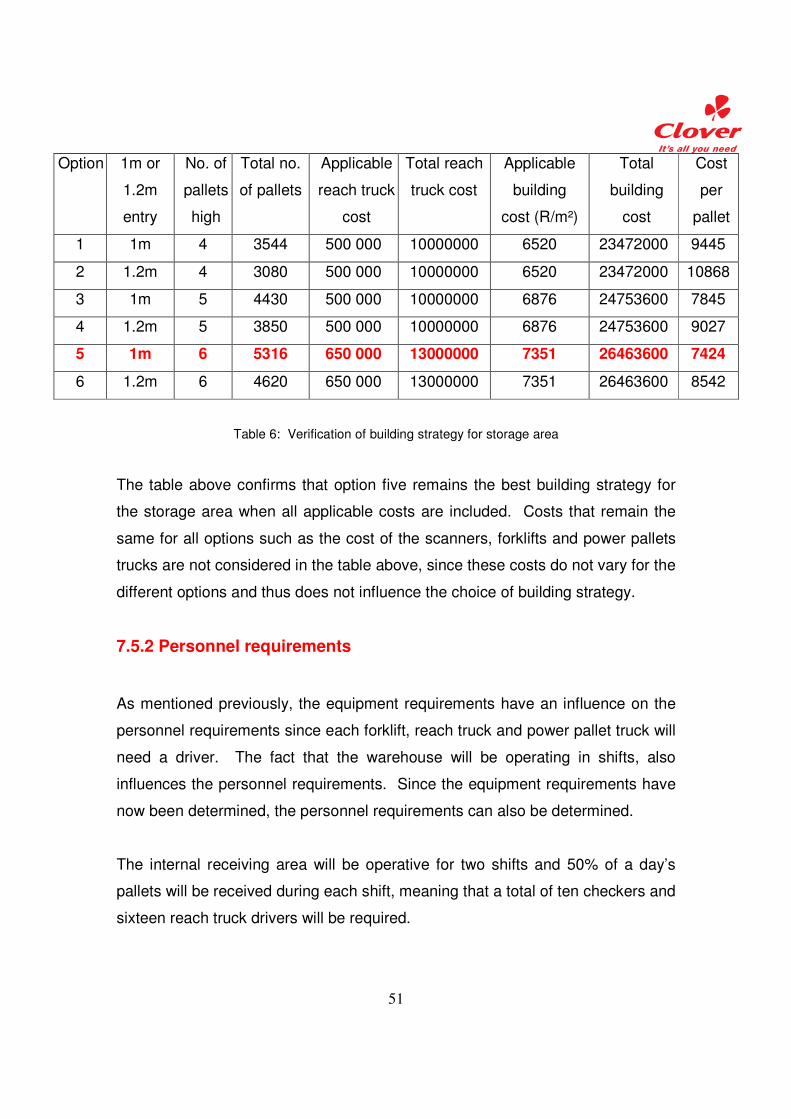
Table 6: Verification of building strategy for storage area
The table above confirms that option five remains the best building strategy for
the storage area when all applicable costs are included. Costs that remain the
same for all options such as the cost of the scanners, forklifts and power pallets
trucks are not considered in the table above, since these costs do not vary for the
different options and thus does not influence the choice of building strategy.
7.5.2 Personnel requirements
As mentioned previously, the equipment requirements have an influence on the
personnel requirements since each forklift, reach truck and power pallet truck will
need a driver. The fact that the warehouse will be operating in shifts, also
influences the personnel requirements. Since the equipment requirements have
now been determined, the personnel requirements can also be determined.
The internal receiving area will be operative for two shifts and 50% of a day’s
pallets will be received during each shift, meaning that a total of ten checkers and
sixteen reach truck drivers will be required.
52
The external receiving area will be operative for three shifts. 50% of the day’s
pallets will be received during the first shift while the other 50% will be received
over the second and third shifts. The first shift, which is the busiest shift, requires
three checkers, three reach truck drivers and one forklift driver. There can not be
assumed that the 50% of pallets received over the second and third shifts are
divided equally into 25% per shift. For this reason provision will be made for two
checkers, two reach truck drivers and one forklift driver for the second and third
shifts respectively. The total personnel requirements for the external receiving
area is thus seven checkers, seven reach truck drivers and three forklift drivers.
The dispatching of products also takes place over three shifts. 40%, 30% and
30% of a day’s pallets will be dispatched over the first, second and third shifts
respectively.
It takes a checker 3.5 minutes to check a pallet. This means that one person can
check 137 pallets in an eight hour shift (8 hours x 60 minutes / 3.5 minutes per
pallet = 137.14 thus 137 pallets). 700 pallets will be received during the first shift
which represents 40% of the total amount of pallets received per day. 30% of the
total amount of pallets received per day will thus be 525 pallets. This means that
six checkers will be needed for the first shift (700 pallets / 137 pallets per person
= 5.1, thus six) and 4 checkers for the second and third shifts respectively (525
pallets / 137 pallets per person = 3.8 thus four).
The first shift requires nine reach truck drivers, three forklift drivers and four
power pallet truck drivers. In relation to this, the second and third shifts will
require seven reach truck drivers [(9 reach trucks / 40%) x 30%], three forklift
drivers [(3 forklifts / 40%) x 30%] and three power pallet truck drivers respectively
[(4 power pallet trucks / 40%) x 30%].
The total amount of forklift, reach truck and power pallet truck drivers are
summarized in the table below as well as the amount of checkers and required.
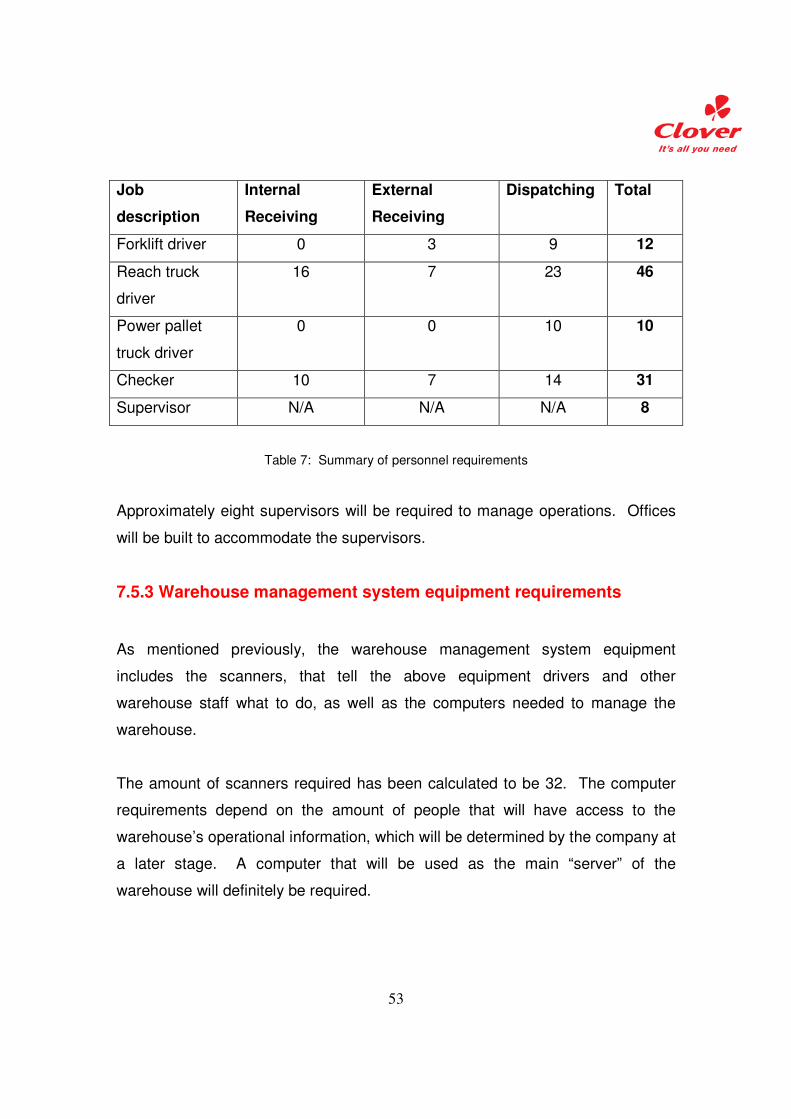
53
Job
description
Internal
Receiving
External
Receiving
Dispatching Total
Forklift driver 0 3 9 12
Reach truck
driver
16 7 23 46
Power pallet
truck driver
0 0 10 10
Checker 10 7 14 31
Supervisor N/A N/A N/A 8
Table 7: Summary of personnel requirements
Approximately eight supervisors will be required to manage operations. Offices
will be built to accommodate the supervisors.
7.5.3 Warehouse management system equipment requirements
As mentioned previously, the warehouse management system equipment
includes the scanners, that tell the above equipment drivers and other
warehouse staff what to do, as well as the computers needed to manage the
warehouse.
The amount of scanners required has been calculated to be 32. The computer
requirements depend on the amount of people that will have access to the
warehouse’s operational information, which will be determined by the company at
a later stage. A computer that will be used as the main “server” of the
warehouse will definitely be required.
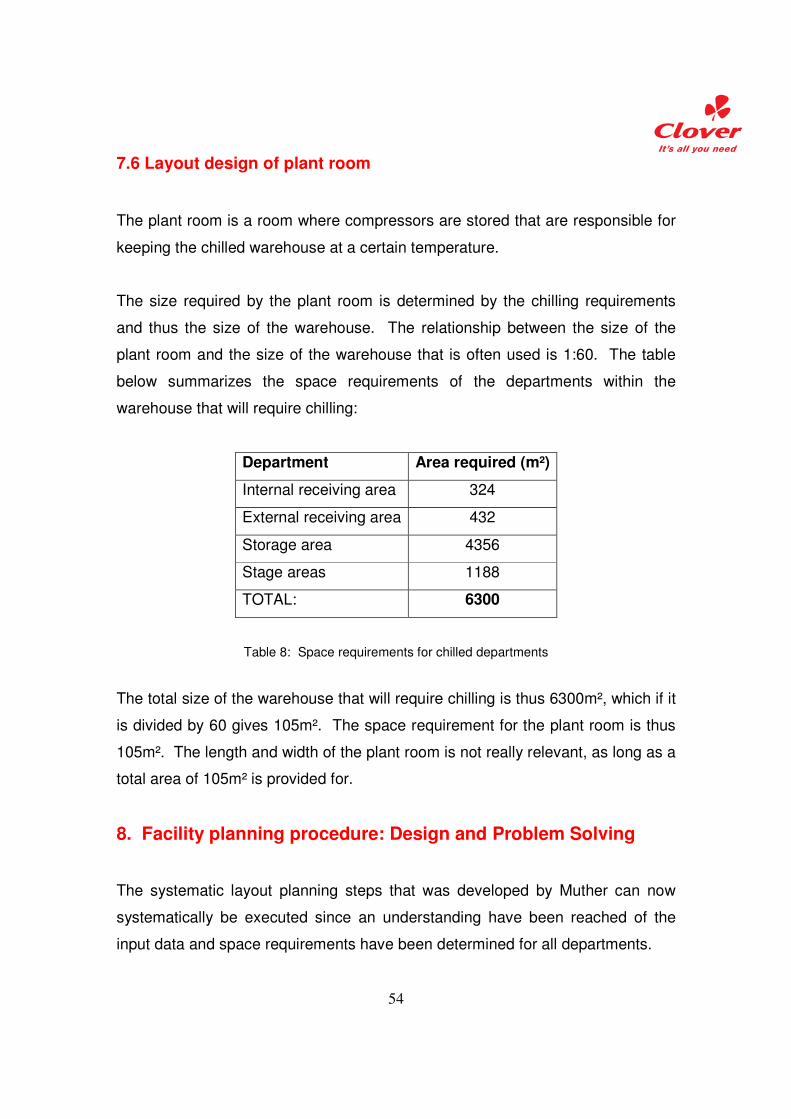
54
7.6 Layout design of plant room
The plant room is a room where compressors are stored that are responsible for
keeping the chilled warehouse at a certain temperature.
The size required by the plant room is determined by the chilling requirements
and thus the size of the warehouse. The relationship between the size of the
plant room and the size of the warehouse that is often used is 1:60. The table
below summarizes the space requirements of the departments within the
warehouse that will require chilling:
Department Area required (m²)
Internal receiving area 324
External receiving area 432
Storage area 4356
Stage areas 1188
TOTAL: 6300
Table 8: Space requirements for chilled departments
The total size of the warehouse that will require chilling is thus 6300m², which if it
is divided by 60 gives 105m². The space requirement for the plant room is thus
105m². The length and width of the plant room is not really relevant, as long as a
total area of 105m² is provided for.
8. Facility planning procedure: Design and Problem Solving
The systematic layout planning steps that was developed by Muther can now
systematically be executed since an understanding have been reached of the
input data and space requirements have been determined for all departments.
55
8.1 Measuring Flow
According to Tompkins (Tompkins et al, 2003), the flow among departments is
one of the most important factors in the arrangement of departments within the
facility. The establishment of a measure of flow is critical to evaluate alternative
arrangements of the facility.
A measure of flow can be specified in either a quantitative manner or a
qualitative manner. Quantitative measures may include the number of products
that moves between the departments per hour or per day. Qualitative measures
are used to measure intangible factors such as communication or information. It
is measured in terms of a “value” ranging from being absolutely necessary for
departments to be next to each other to it being undesirable for departments to
be close to each other.
8.1.1 Quantitative Flow Measurement
As mentioned previously, flows may be measured quantitatively in terms of the
amount moved between departments. According to Muther’s SLP approach, a
“From-To chart” will be used to record these flows.
According to Tompkins (Tompkins et al, 2003), a “From-To chart” is constructed
as follows:
1. List all departments of the warehouse down the row and across the
column following the overall flow pattern.
The operational offices, battery room and plant room are lastly listed since
products do not physically move to these departments thus it is not part of
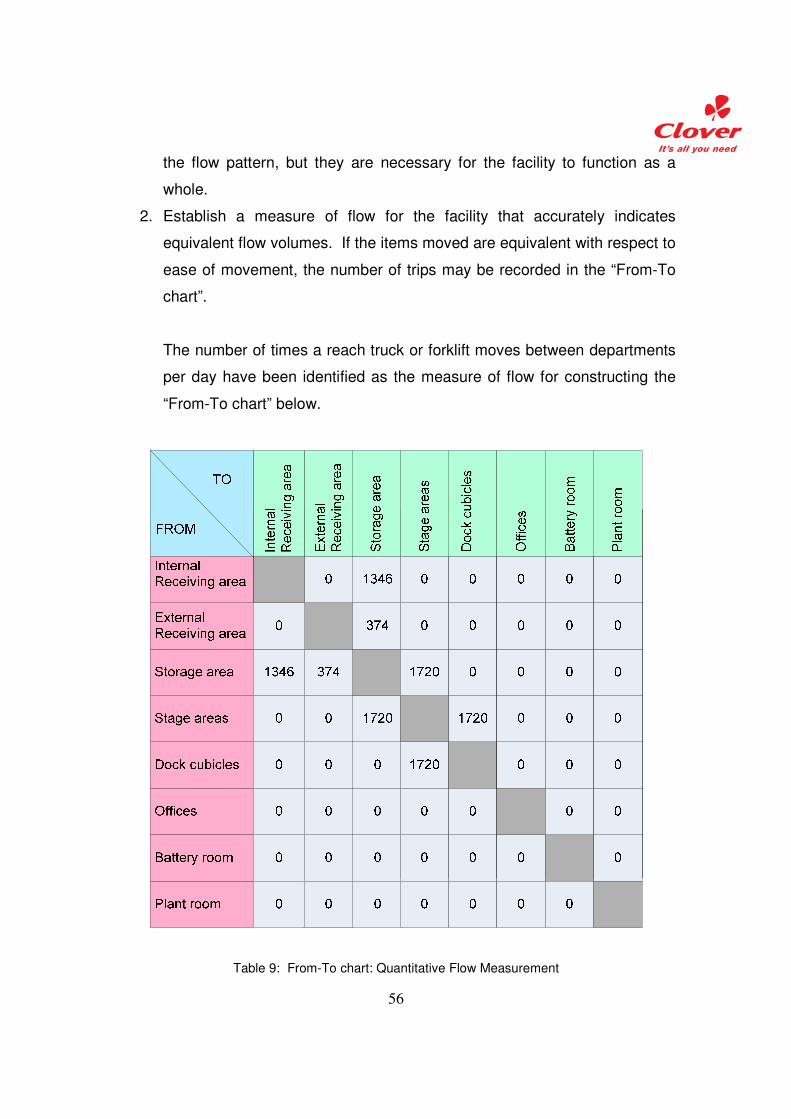
56
the flow pattern, but they are necessary for the facility to function as a
whole.
2. Establish a measure of flow for the facility that accurately indicates
equivalent flow volumes. If the items moved are equivalent with respect to
ease of movement, the number of trips may be recorded in the “From-To
chart”.
The number of times a reach truck or forklift moves between departments
per day have been identified as the measure of flow for constructing the
“From-To chart” below.
Table 9: From-To chart: Quantitative Flow Measurement
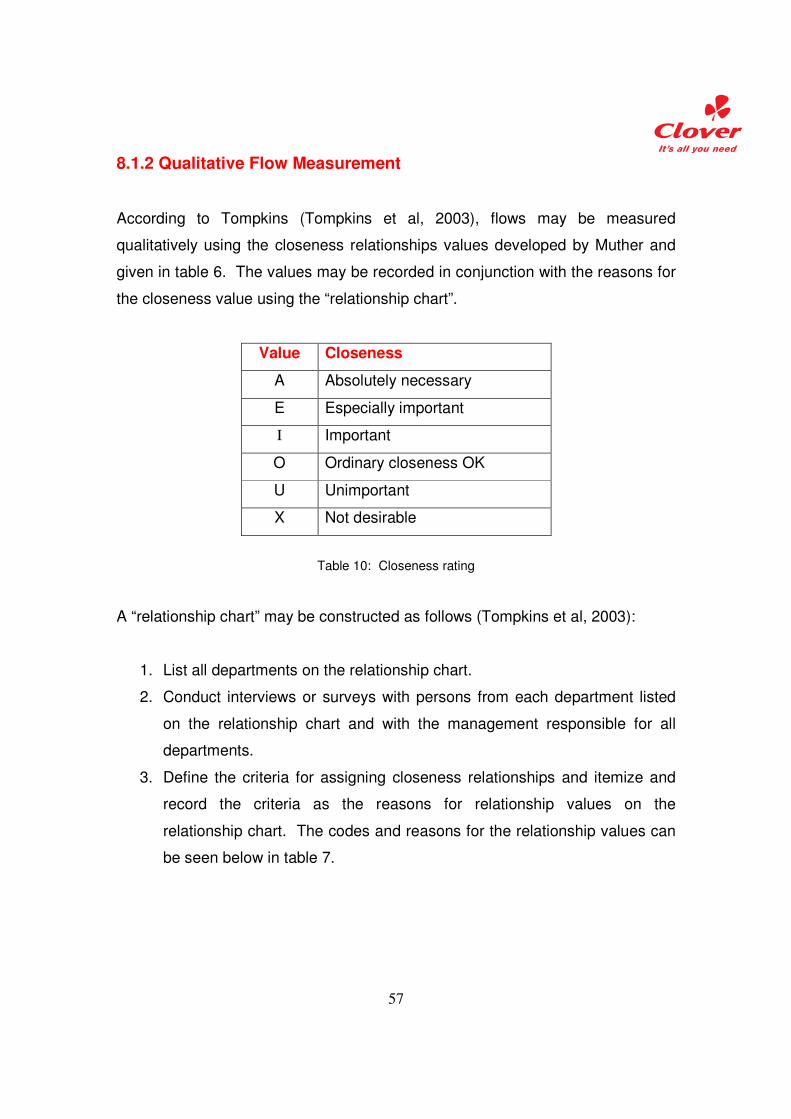
57
8.1.2 Qualitative Flow Measurement
According to Tompkins (Tompkins et al, 2003), flows may be measured
qualitatively using the closeness relationships values developed by Muther and
given in table 6. The values may be recorded in conjunction with the reasons for
the closeness value using the “relationship chart”.
Value Closeness
A Absolutely necessary
E Especially important
I Important
O Ordinary closeness OK
U Unimportant
X Not desirable
Table 10: Closeness rating
A “relationship chart” may be constructed as follows (Tompkins et al, 2003):
1. List all departments on the relationship chart.
2. Conduct interviews or surveys with persons from each department listed
on the relationship chart and with the management responsible for all
departments.
3. Define the criteria for assigning closeness relationships and itemize and
record the criteria as the reasons for relationship values on the
relationship chart. The codes and reasons for the relationship values can
be seen below in table 7.
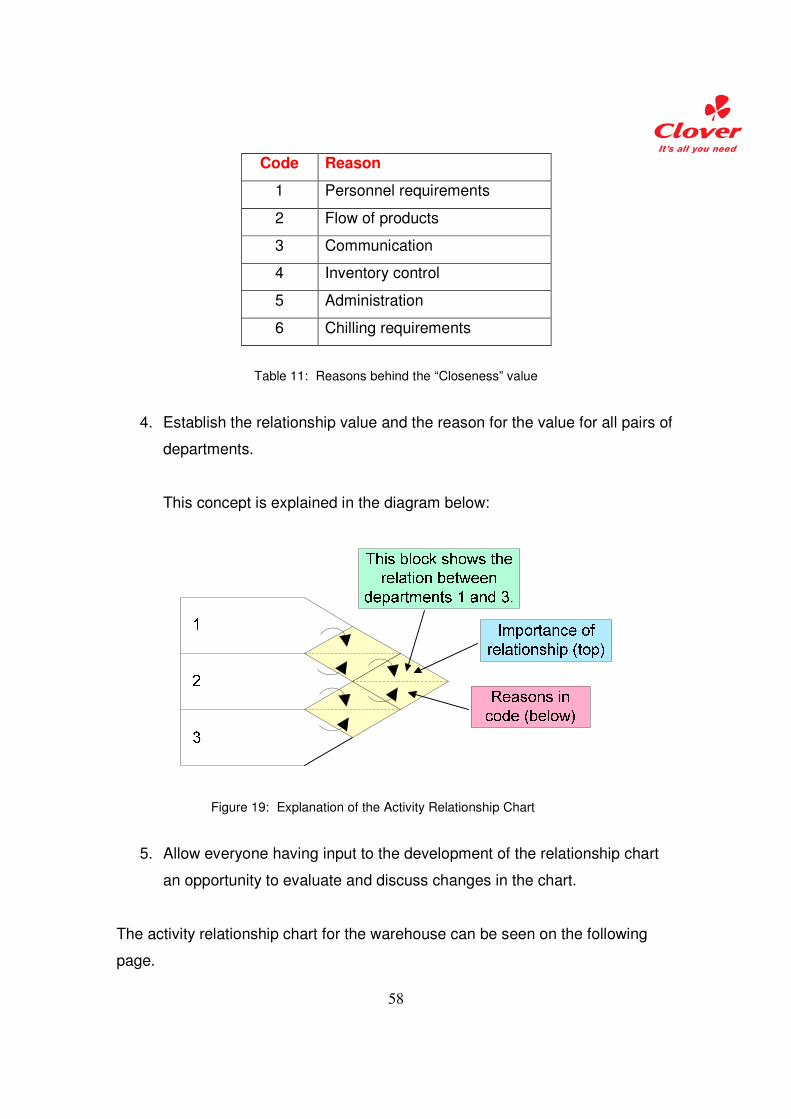
58
Code Reason
1 Personnel requirements
2 Flow of products
3 Communication
4 Inventory control
5 Administration
6 Chilling requirements
Table 11: Reasons behind the “Closeness” value
4. Establish the relationship value and the reason for the value for all pairs of
departments.
This concept is explained in the diagram below:
Figure 19: Explanation of the Activity Relationship Chart
5. Allow everyone having input to the development of the relationship chart
an opportunity to evaluate and discuss changes in the chart.
The activity relationship chart for the warehouse can be seen on the following
page.
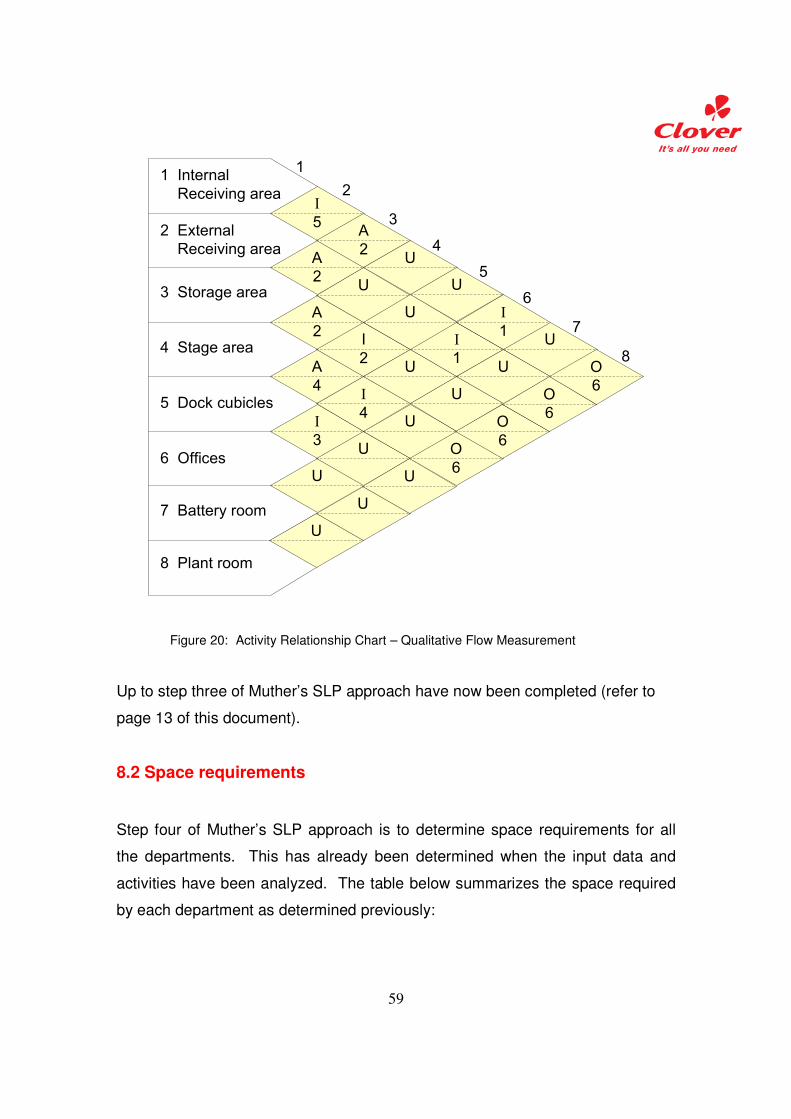
59
A
2
A
2
U
A
4
I
3
I
5A
2
U
U
I
2
I
4
U
U
U
U
U
U
I
1U
I
1U
1 Internal
Receiving area
3 Storage area
6 Offices
7 Battery room
8 Plant room
1
2
3
4
5
6
7
5 Dock cubicles
4 Stage area
U
U
U
O
6
O
6
O
6
O
6
2 External
Receiving area
8
Figure 20: Activity Relationship Chart – Qualitative Flow Measurement
Up to step three of Muther’s SLP approach have now been completed (refer to
page 13 of this document).
8.2 Space requirements
Step four of Muther’s SLP approach is to determine space requirements for all
the departments. This has already been determined when the input data and
activities have been analyzed. The table below summarizes the space required
by each department as determined previously:
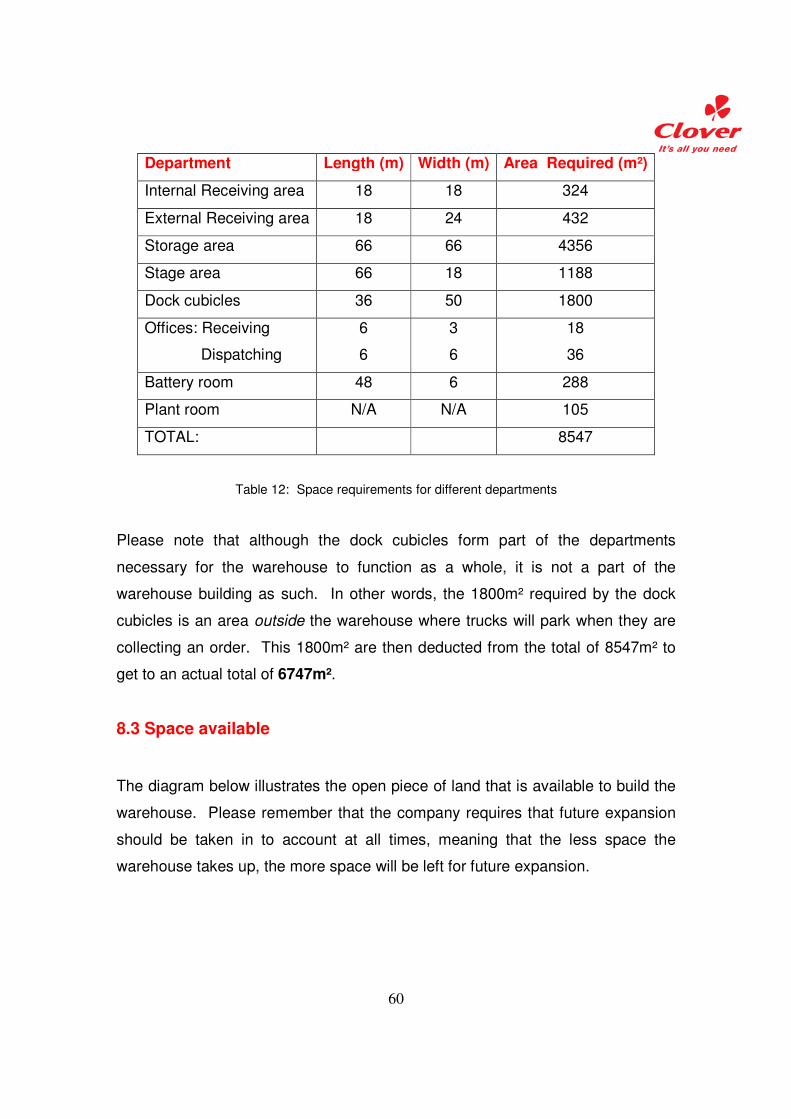
60
Department Length (m) Width (m) Area Required (m²)
Internal Receiving area 18 18 324
External Receiving area 18 24 432
Storage area 66 66 4356
Stage area 66 18 1188
Dock cubicles 36 50 1800
Offices: Receiving
Dispatching
6
6
3
6
18
36
Battery room 48 6 288
Plant room N/A N/A 105
TOTAL: 8547
Table 12: Space requirements for different departments
Please note that although the dock cubicles form part of the departments
necessary for the warehouse to function as a whole, it is not a part of the
warehouse building as such. In other words, the 1800m² required by the dock
cubicles is an area outside the warehouse where trucks will park when they are
collecting an order. This 1800m² are then deducted from the total of 8547m² to
get to an actual total of 6747m².
8.3 Space available
The diagram below illustrates the open piece of land that is available to build the
warehouse. Please remember that the company requires that future expansion
should be taken in to account at all times, meaning that the less space the
warehouse takes up, the more space will be left for future expansion.
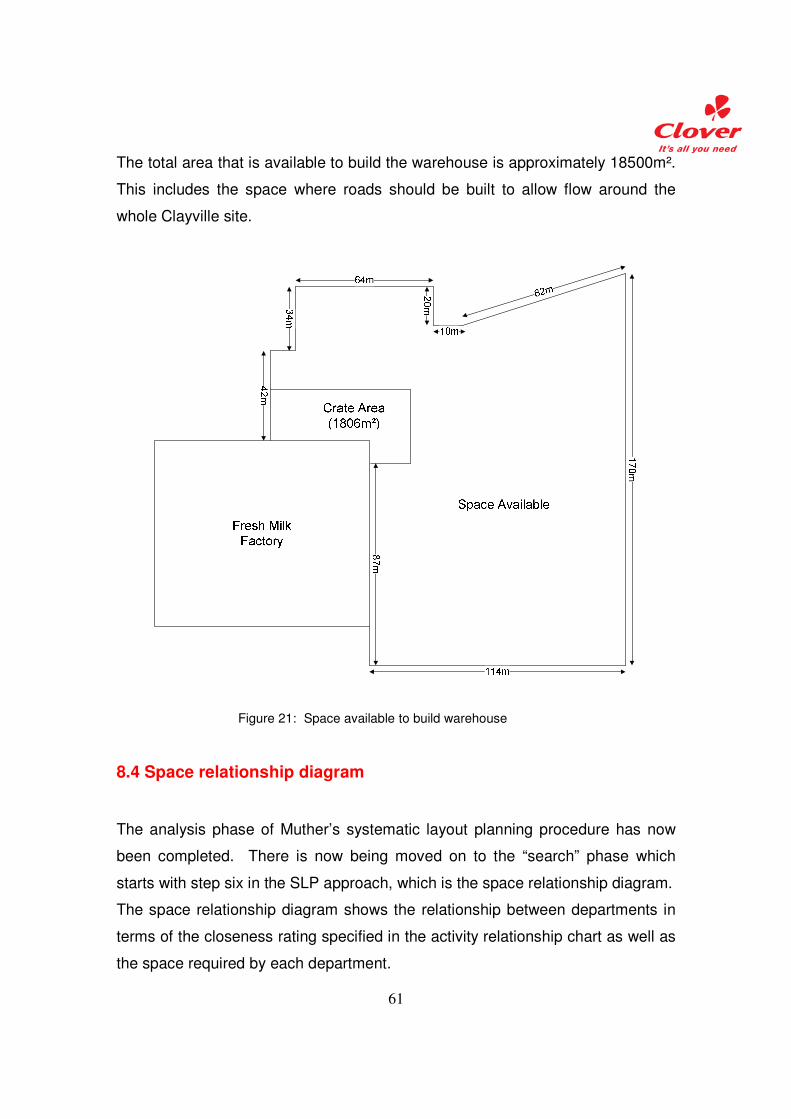
61
The total area that is available to build the warehouse is approximately 18500m².
This includes the space where roads should be built to allow flow around the
whole Clayville site.
Figure 21: Space available to build warehouse
8.4 Space relationship diagram
The analysis phase of Muther’s systematic layout planning procedure has now
been completed. There is now being moved on to the “search” phase which
starts with step six in the SLP approach, which is the space relationship diagram.
The space relationship diagram shows the relationship between departments in
terms of the closeness rating specified in the activity relationship chart as well as
the space required by each department.
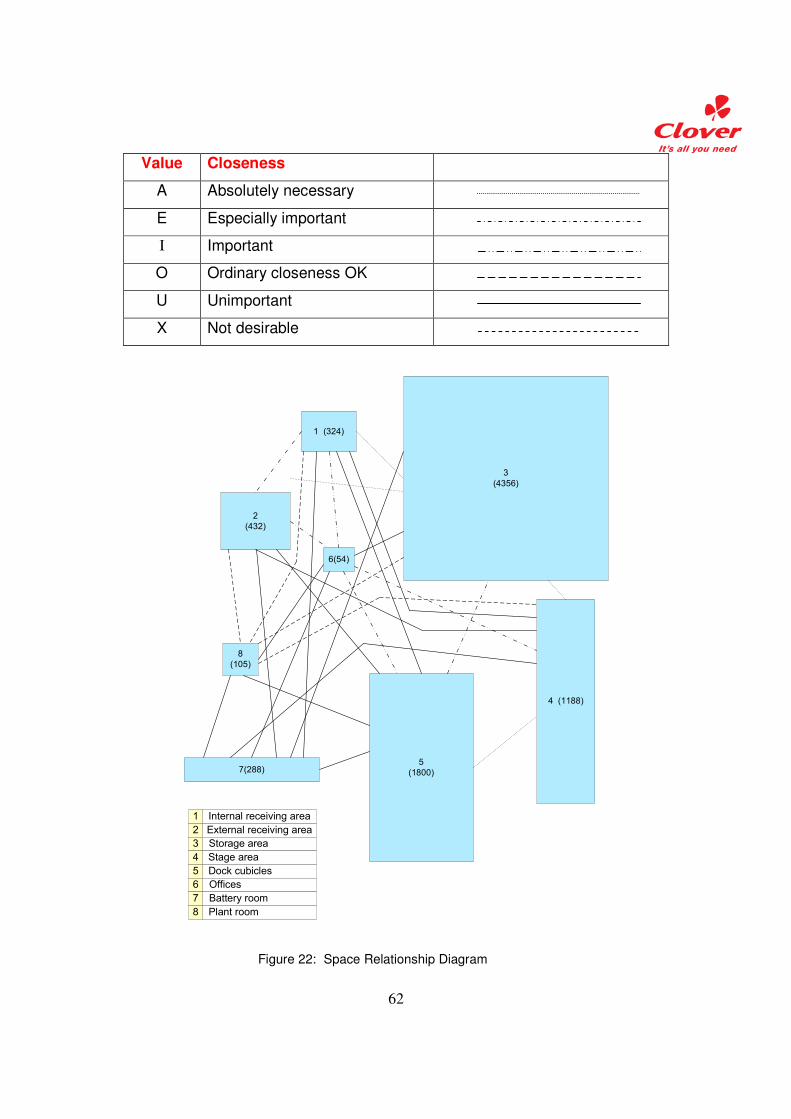
62
Value Closeness
A Absolutely necessary
E Especially important
I Important
O Ordinary closeness OK
U Unimportant
X Not desirable
3
(4356)
4 (1188)
1 (324)
2
(432)
6(54)
7(288)
8
(105)
5
(1800)
Internal receiving area1
External receiving area2
Storage area3
Stage area4
Dock cubicles5
Offices6
Battery room7
Plant room8
Figure 22: Space Relationship Diagram
63
8.5 Develop Layout Alternatives
The final step in Muther’s SLP approach is to develop layout alternatives for the
facility. This can be done using very complex software and algorithms or it can
be done by using the From-To chart and the Activity Relationship chart that
depicts the relationships between the departments as well as the amount of
times equipment moves between departments.
Three alternative layouts will be developed to ensure that a variety of options are
taken in to account before deciding on a layout best suited for the warehouse.
The three layout alternatives that were designed can be seen on the following
three pages.
Please take note that the shaded areas are not part of the building itself. As
mentioned previously, the space required by the dock cubicles is an area outside
the warehouse where trucks will park when they are collecting an order. The
same goes for the parking bays where external receiving takes place, where
trucks will park when they are delivering an order.
Space is provided for a road on all sides of the Clayville site, in order to ensure
that vehicles can gain access to all areas where required. Please note that the
flow of traffic differs for the different layouts. The reason for this is to ease the
parking of the delivery trucks since a truck is 18m in length and it is quite difficult
to park.
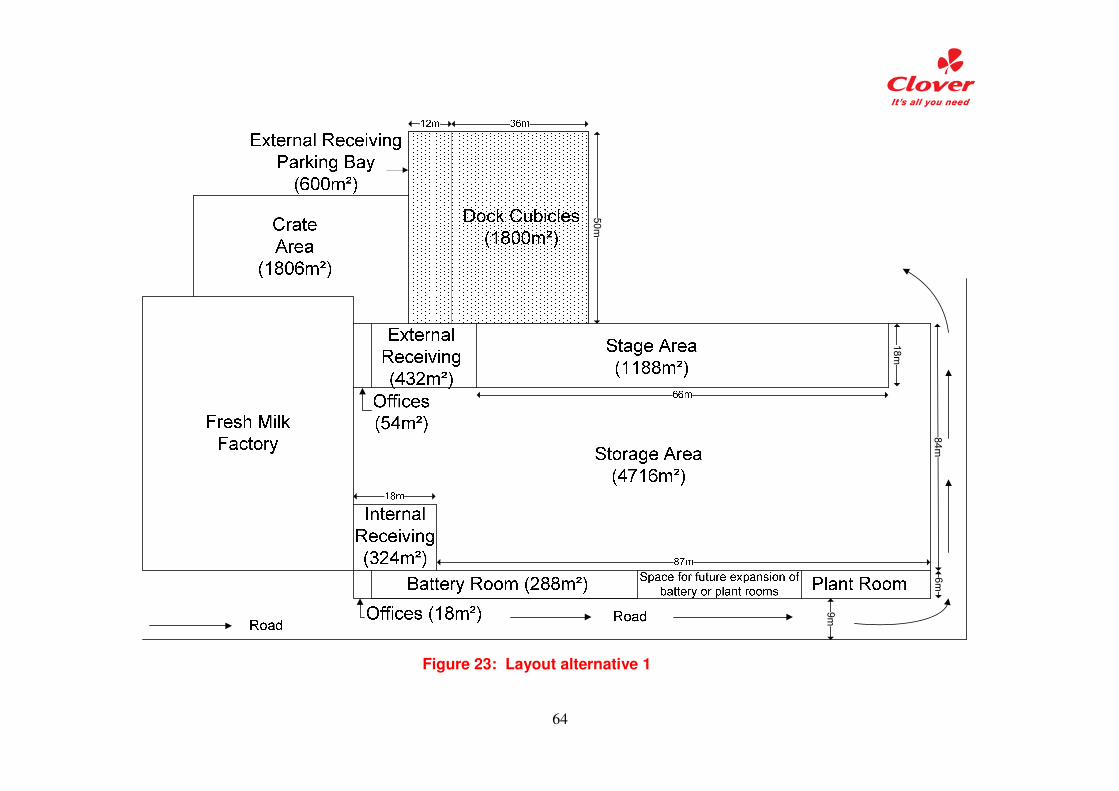
64
18m
9m
84m
6m
50m
Figure 23: Layout alternative 1
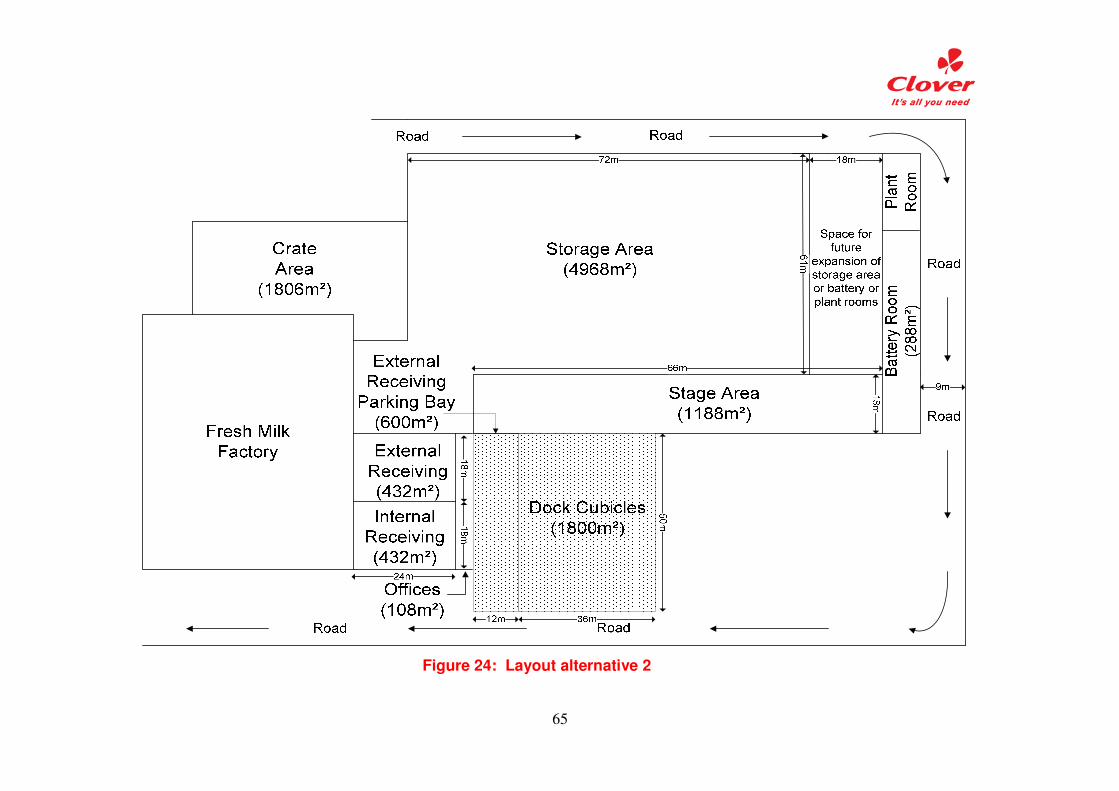
65
Figure 24: Layout alternative 2
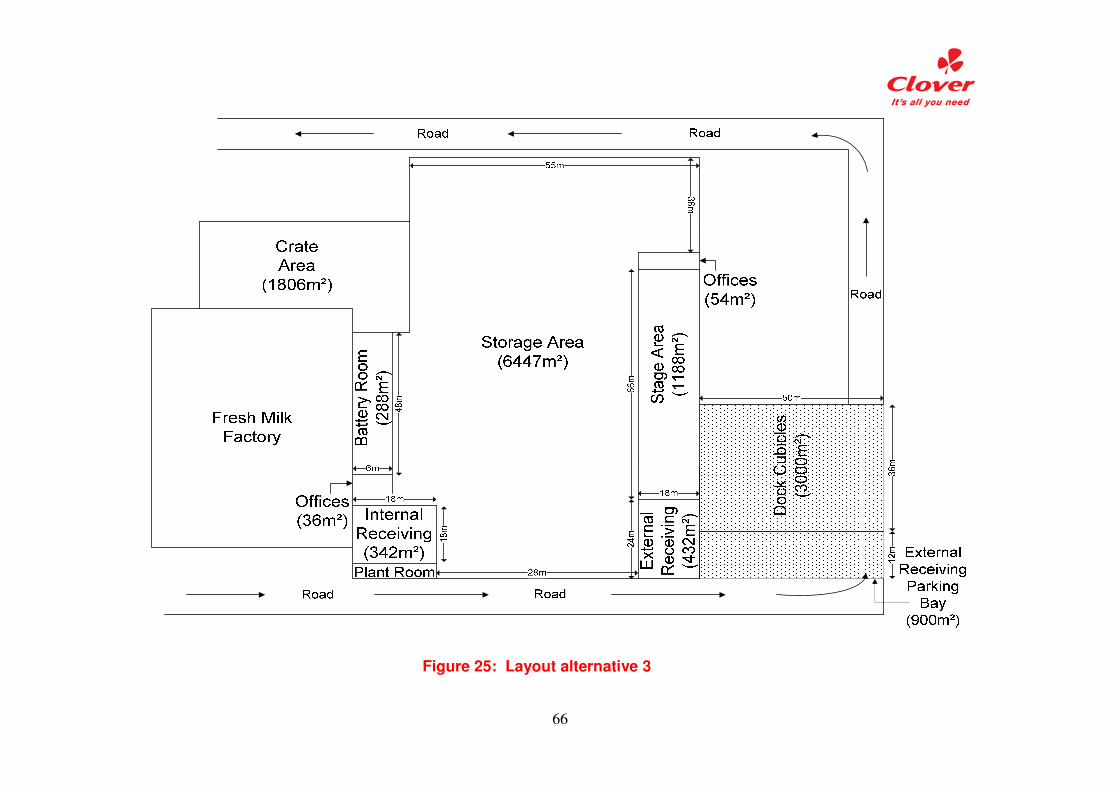
66
Figure 25: Layout alternative 3
67
8.5.1 Evaluate Facility Layout Alternatives
The dimensions of some of the departments had to be altered in the above layout
alternatives in order to make all of the departments fit in to the available space.
The storage space have been altered from 4356m² to 4716m², 4968m² and
6447m² in alternative one, two and three respectively. The area provided for in
all three layout alternatives exceeds the space requirement for the storage area.
The extra space provided for can be used for future expansion.
The dimensions of the offices have also slightly been changed. The bigger
offices make provision for an increase in the personnel requirements.
Specified criteria will be used to evaluate the three layout alternatives in order to
select the optimal layout. A “weighted-factor-comparison-method” will be used to
measure the weight of each criterion against every layout. The following criteria
were specified:
1. Space utilization
2. Management and control
3. Flow of materials
4. Internal household and employee satisfaction
5. Traffic flow around the Clayville site
6. Preferred closeness
7. Attractiveness
Each criterion (1-7) is given a weight in terms of the importance thereof. The
total weights of the seven criteria should equal 100. Each alternative is then
given a rating score between 0-10, where zero means that the alternative does
not at all take the criterion in to consideration and ten means the layout is
excellent in terms of the specific criterion.
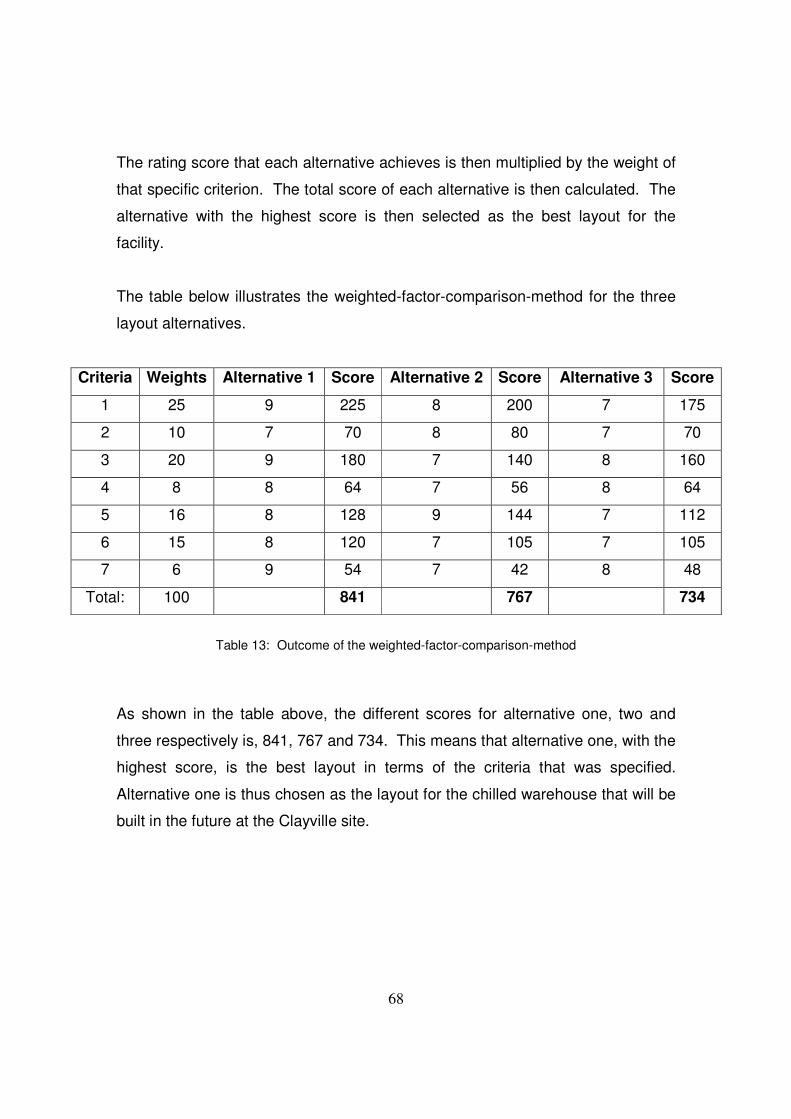
68
The rating score that each alternative achieves is then multiplied by the weight of
that specific criterion. The total score of each alternative is then calculated. The
alternative with the highest score is then selected as the best layout for the
facility.
The table below illustrates the weighted-factor-comparison-method for the three
layout alternatives.
Criteria Weights Alternative 1 Score Alternative 2 Score Alternative 3 Score
1 25 9 225 8 200 7 175
2 10 7 70 8 80 7 70
3 20 9 180 7 140 8 160
4 8 8 64 7 56 8 64
5 16 8 128 9 144 7 112
6 15 8 120 7 105 7 105
7 6 9 54 7 42 8 48
Total: 100 841 767 734
Table 13: Outcome of the weighted-factor-comparison-method
As shown in the table above, the different scores for alternative one, two and
three respectively is, 841, 767 and 734. This means that alternative one, with the
highest score, is the best layout in terms of the criteria that was specified.
Alternative one is thus chosen as the layout for the chilled warehouse that will be
built in the future at the Clayville site.
69
9. Materials handling
According to Tompkins (Tompkins et al, 2003), the design of the material
handling system is an important component of the overall facilities design. The
integration between layout design and material handling system design is
particularly critical in the design of a new facility such as the chilled warehouse.
During the facility planning process, when Muther’s SLP approach was followed,
the flow of products between departments was taken in to account. In a sense
this then means that the handling of products was taken in to account.
One of the objectives of a materials handling system is to ease the flow of
materials, or in this case products, through the facility. The storage area and
stage area as well as the internal and external receiving areas were designed in
such a way that all aisles face in the same direction. This layout eases the
movement of reach trucks and power pallet trucks between different departments
within the warehouse.
A materials handling system that has been proven to work at one or more of
Clover’s existing warehouses might be adjusted and implemented according to
this new facility’s needs or a totally new system can now be designed for this
specific warehouse and layout.
70
9.1 Materials handling equipment
The equipment that will be used to handle, move and transport the products in
the warehouse includes the following:
• Forklifts
• Reach trucks and
• Power pallet trucks.
Forklifts are used to load and unload delivery vehicles, while reach trucks
transport pallets from the receiving area to the storage area and from the storage
area to the stage areas. Reach trucks are designed to handle pallets and not
cases of products. Reach trucks are much bigger than forklifts and for this
reason it cannot be used to load or unload trucks.
As mentioned previously, the power pallet trucks are used to pick cases of
products. After the power pallet truck has picked the cases of products it is
stacked on to a pallet. A power pallet truck is thus the smallest of the materials
handling equipment.
Different materials handling systems will have different costs associated with it.
This will definitely have to be considered when deciding on a materials handling
system. As mentioned in the literature study, materials handling can be defined
as both an art and a science. It entails not only the moving of material but also
the storing, controlling and protecting thereof (Tompkins, Tompkins et al, 2003).
71
10. Conclusion
The aim of this project was to reduce the strain on Clover’s current distribution
network by planning and building a chilled warehouse at the Clayville site that will
be able to handle the future required volumes.
The existing warehouses at Clayville, together with the new, extra warehouse will
now be able to pick and store more of the products that are produced on site for
the 16 warehouses all around the country. This means that the products no
longer have to be distributed to other warehouses in Gauteng to be stored and
picked for the remaining warehouses. This results in a reduction of the strain on
the current distribution network and thus achieves the aim of the project.
The new proposed facility was designed to optimize flow of materials within the
facility and thus result in more effective material handling. It aims to save idle
time of workers and personnel and takes future expansion in to account.
According to Tompkins (Tompkins et al, 2003), facilities planning is no longer just
a science, but a strategy for navigating a competitive global economy. This
project has provided Clover with a layout for a warehouse that will result in cost
savings and give the company a competitive advantage.
72
Bibliography
Tompkins, J.A., White, J.A. (1984). Facilities Planning. John Wiley & Sons, Inc.
Tompkins, J.A., White, J.A., Bozer, Y.A., Tanchoco, J.M.A. (2003). Facilities
Planning, 3rd ed. John Wiley & Sons, Inc.
Kerns, F., (1999), “Strategic facility planning”, Work Study, Vol. 48, No. 5, pp.
176-181.
Gopalakrishnan, B., Li Weng, Gupta, D.P., (2003), “Facilities design using a split
departmental layout configuration“, Facilities, Vol. 21, No. 3/4, pp. 66-73.
Hassan, M.M.D., (2002), “A framework for the design of warehouse layout”,
Facilities, Vol. 20, No. 13/14, pp. 432-440.
Chien, T., (2004), “An empirical study of facility layout using a modified SLP
procedure”, Journal of Manufacturing Technology Management, Vol. 15, No. 6,
pp. 455-465.
Wikipedia Encyclopaedia, Viewed on the 14th May 2009,
http://www.wikipedia.com
Clover South Africa’s website, Viewed on the 21st March 2009,
http://www.clover.co.za