Embed Size (px)
Citation preview
FactBookFall 2006-Fall 2010
Demographics*Unless otherwise specified, charts exclude students taking only non‐credit courses
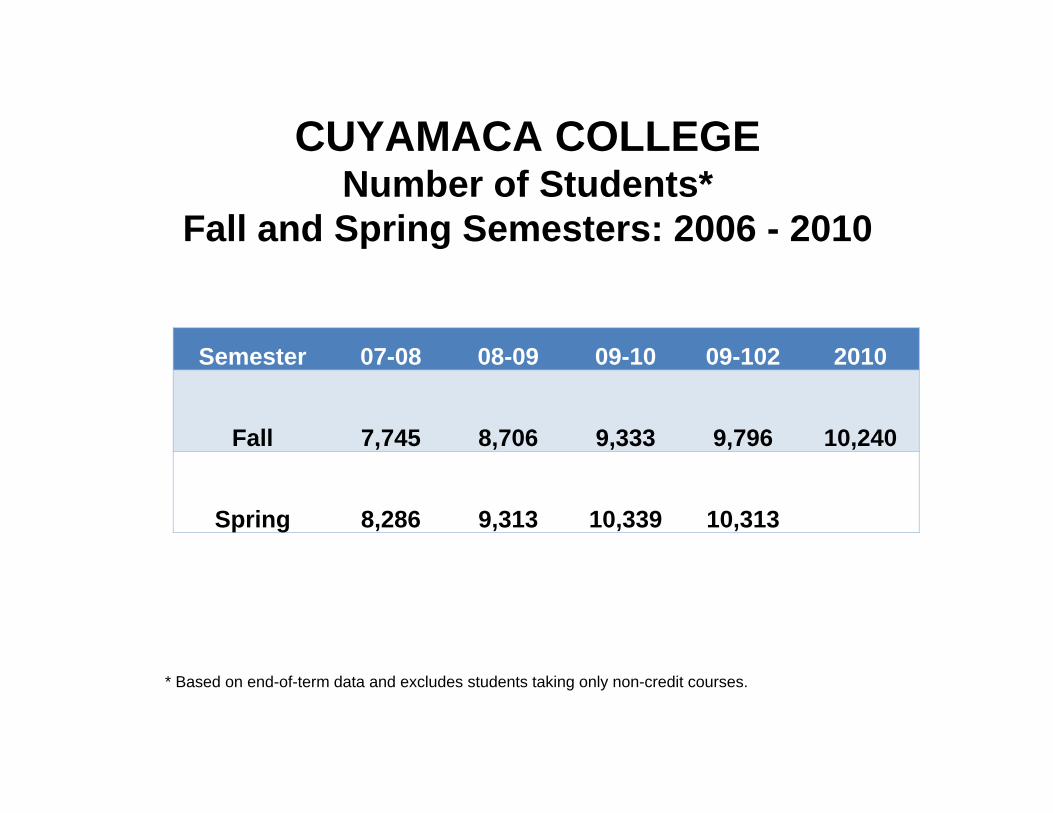
CUYAMACA COLLEGENumber of Students*
Fall and Spring Semesters: 2006 - 2010
Semester 07-08 08-09 09-10 09-102 2010
Fall 7,745 8,706 9,333 9,796 10,240
Spring 8,286 9,313 10,339 10,313
* Based on end-of-term data and excludes students taking only non-credit courses.
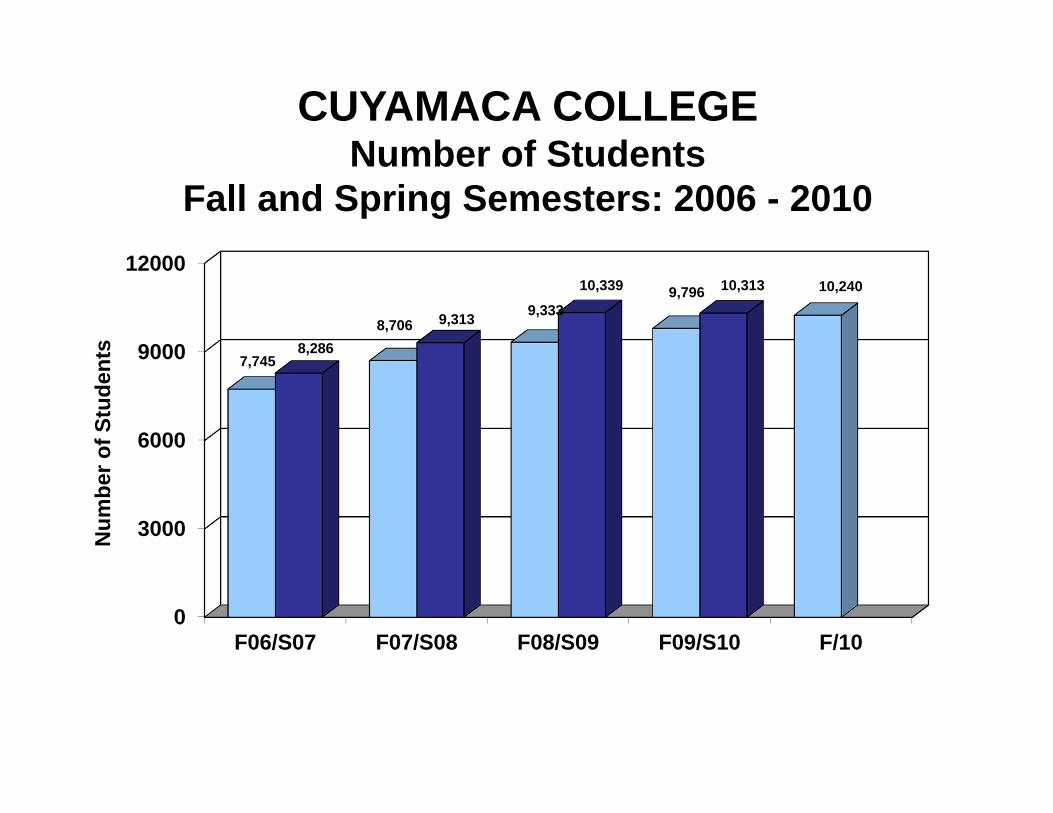
0
3000
6000
9000
12000
F06/S07 F07/S08 F08/S09 F09/S10 F/10
7,745
8,7069,333
9,796 10,240
8,286
9,313
10,339 10,313
Num
ber o
f Stu
dent
s
Fall/Spring Enrollment
CUYAMACA COLLEGENumber of Students
Fall and Spring Semesters: 2006 - 2010
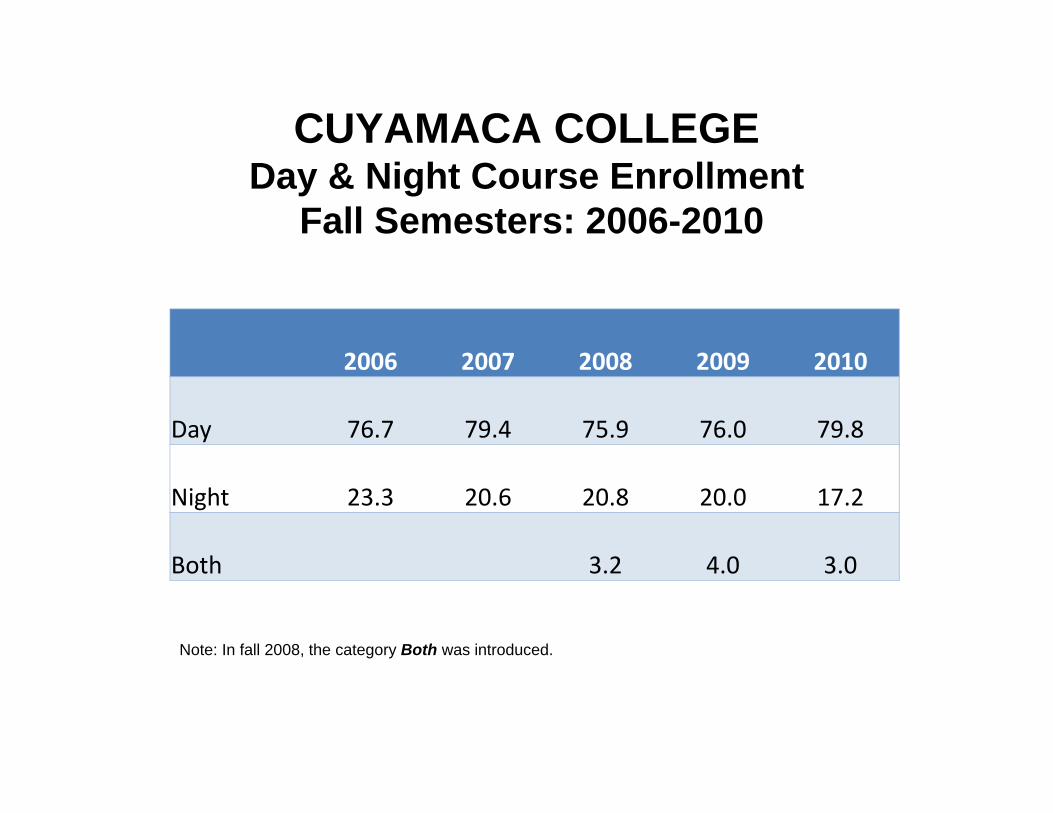
2006 2007 2008 2009 2010
Day 76.7 79.4 75.9 76.0 79.8
Night 23.3 20.6 20.8 20.0 17.2
Both 3.2 4.0 3.0
CUYAMACA COLLEGEDay & Night Course Enrollment
Fall Semesters: 2006-2010
Note: In fall 2008, the category Both was introduced.
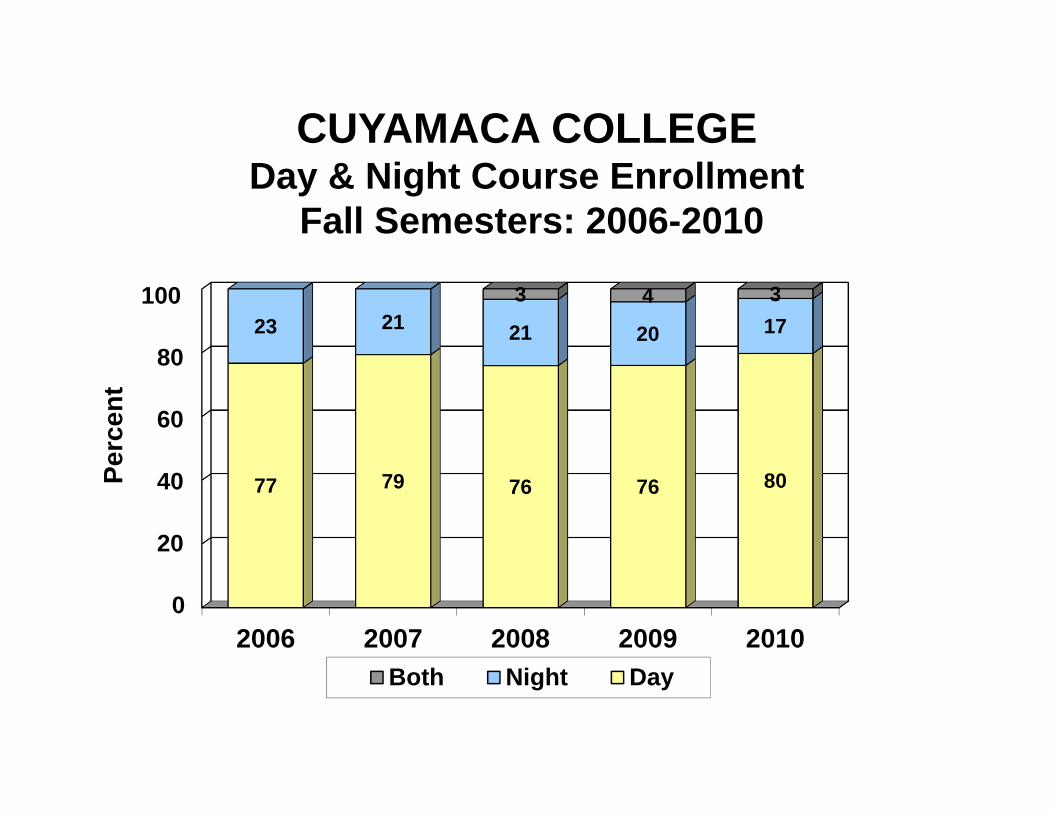
2006 2007 2008 2009 2010
77 79 76 76 80
23 21 21 20 173 4 3
Perc
ent
Both Night Day
100
80
60
40
20
0
Day/Night Attendance
CUYAMACA COLLEGEDay & Night Course Enrollment
Fall Semesters: 2006-2010
2006 2007 2008 2009 2010
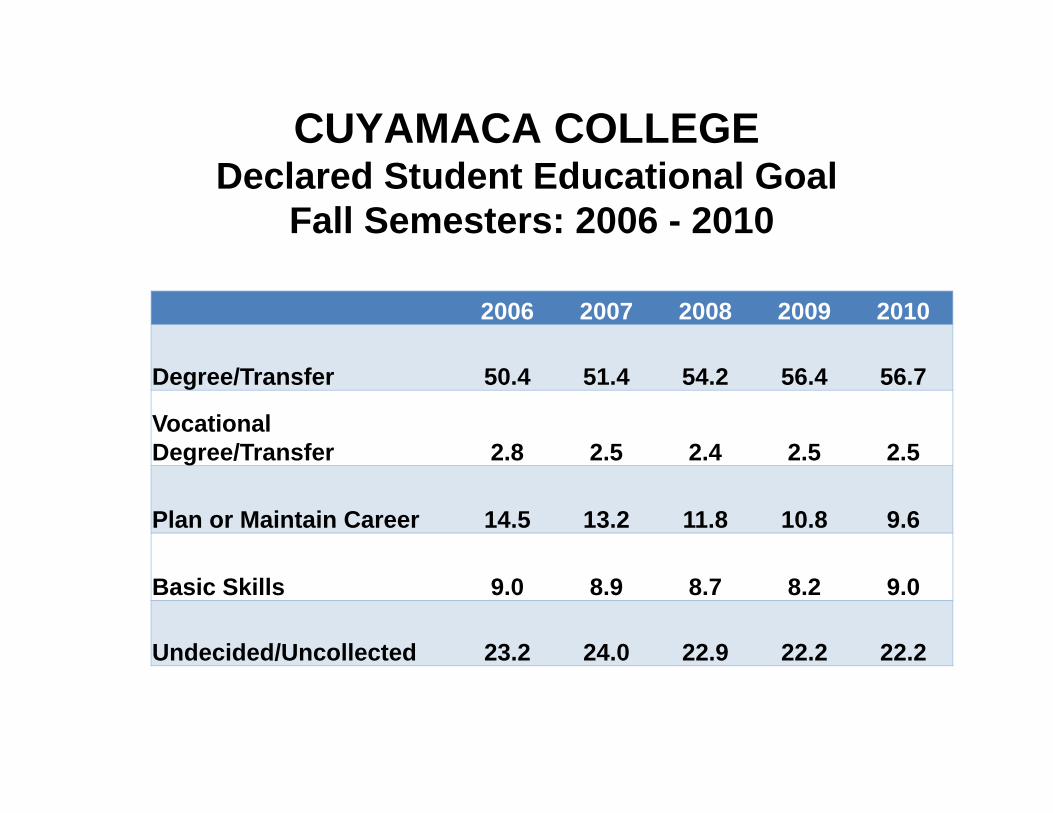
Degree/Transfer 50.4 51.4 54.2 56.4 56.7
Vocational Degree/Transfer 2.8 2.5 2.4 2.5 2.5
Plan or Maintain Career 14.5 13.2 11.8 10.8 9.6
Basic Skills 9.0 8.9 8.7 8.2 9.0
Undecided/Uncollected 23.2 24.0 22.9 22.2 22.2
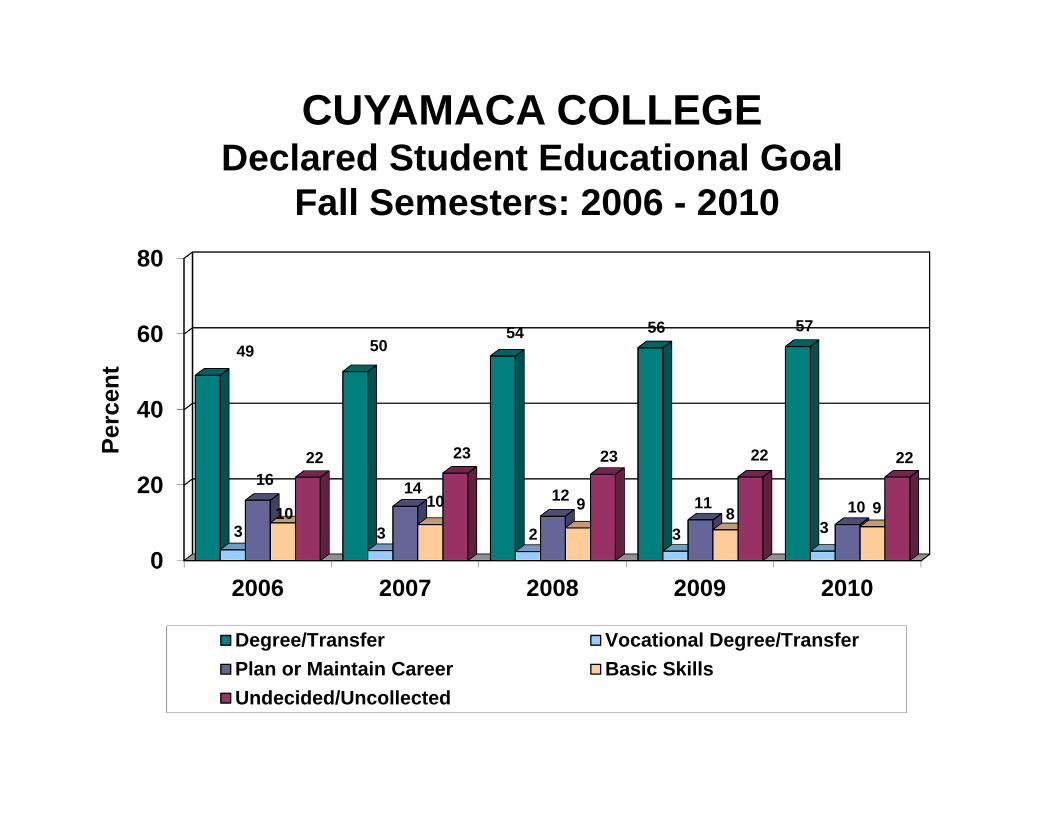
CUYAMACA COLLEGEDeclared Student Educational Goal
Fall Semesters: 2006 - 2010
0
20
40
60
80
2006 2007 2008 2009 2010
49 5054 56 57
3 3 2 3 3
16 14 12 11 101010 9 8 9
22 23 23 22 22Perc
ent
Degree/Transfer Vocational Degree/TransferPlan or Maintain Career Basic SkillsUndecided/Uncollected
CUYAMACA COLLEGEDeclared Student Educational Goal
Fall Semesters: 2006 - 2010
Educational Goal
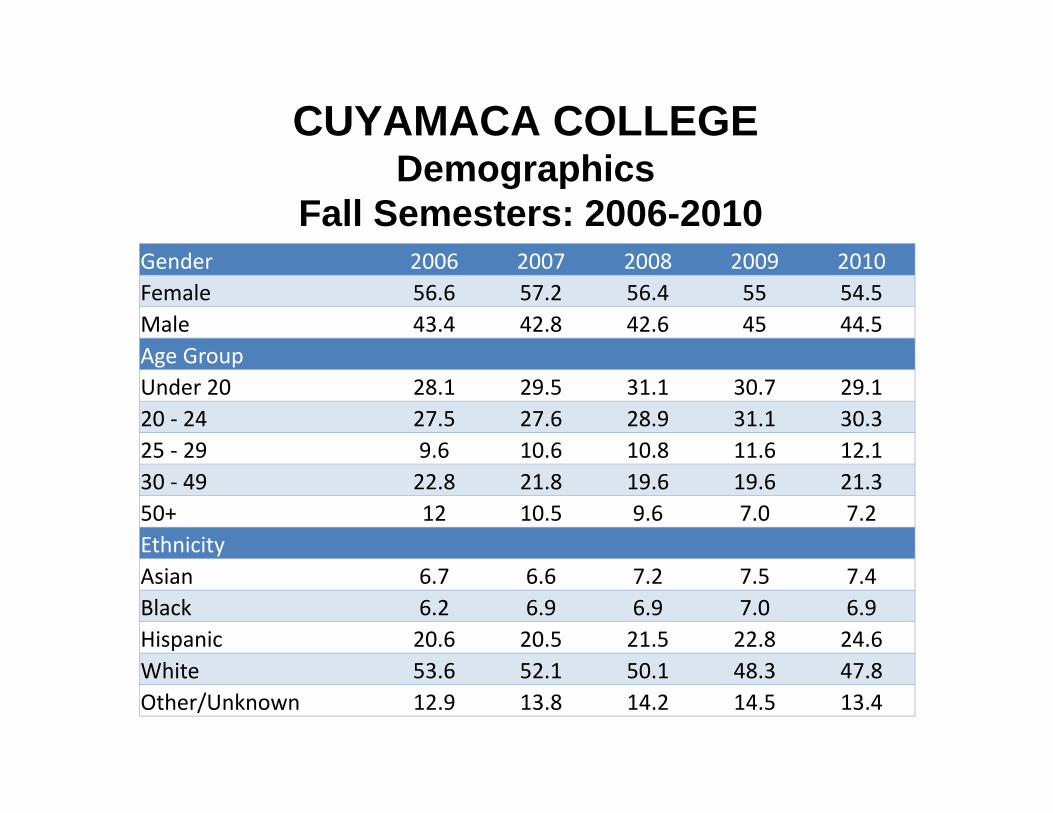
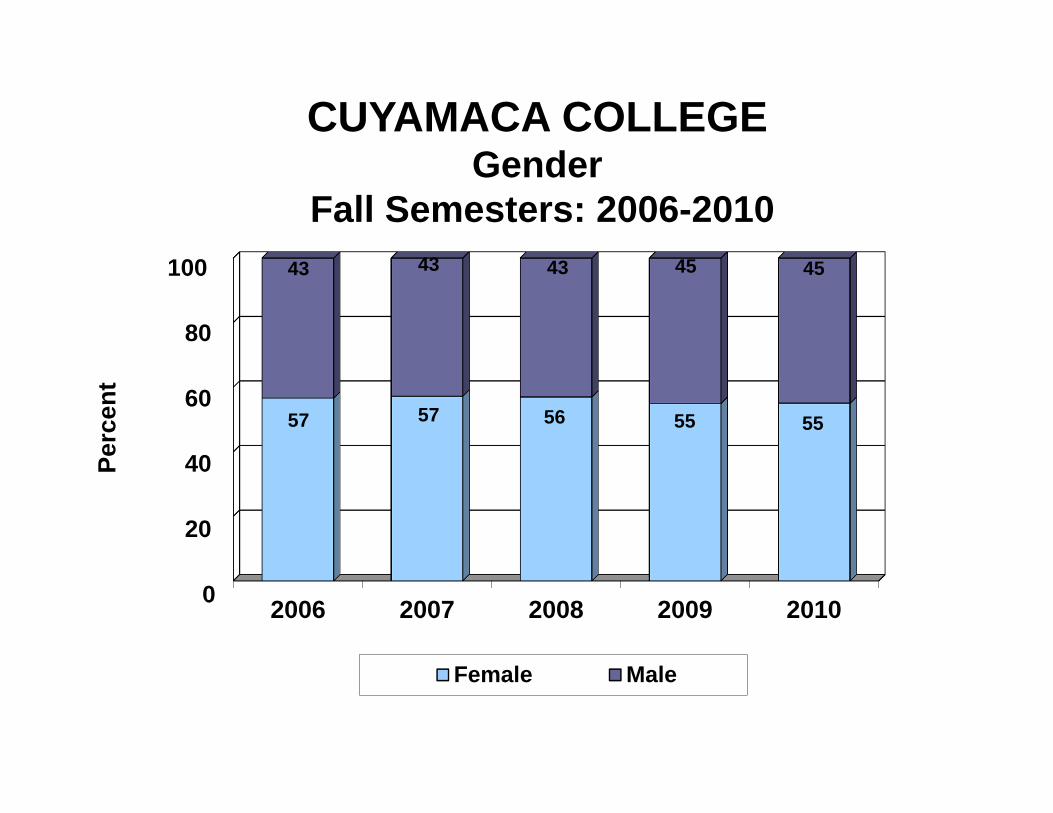
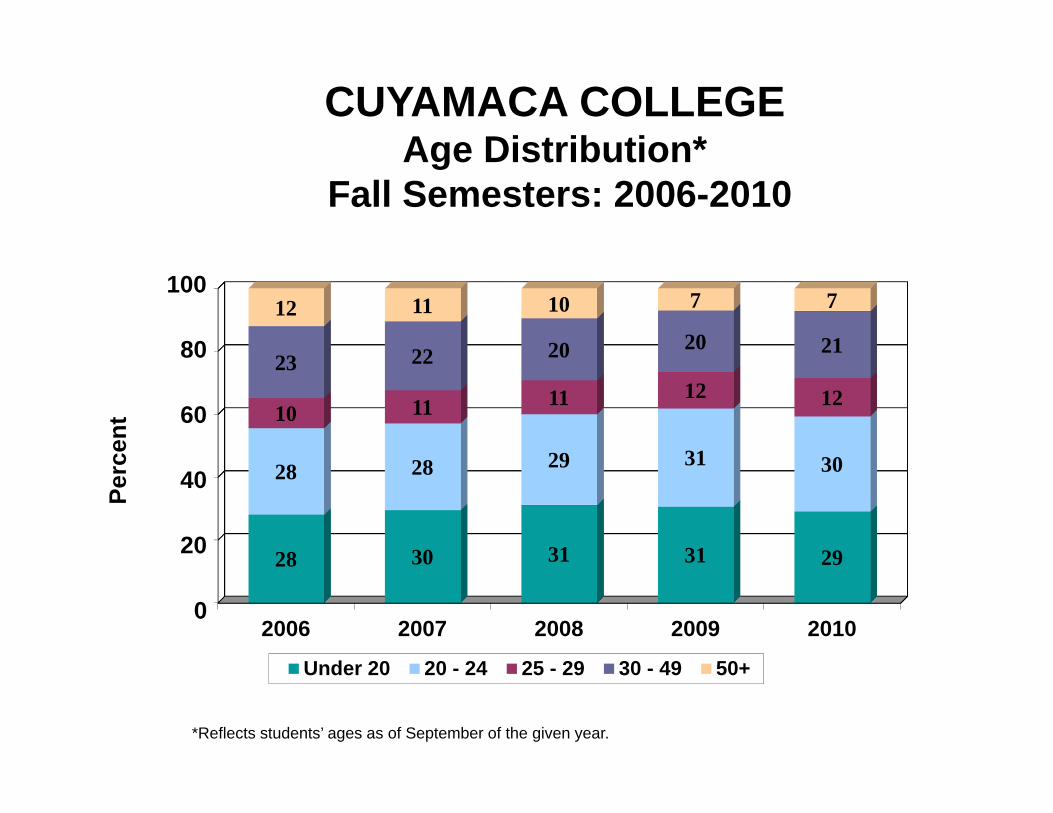
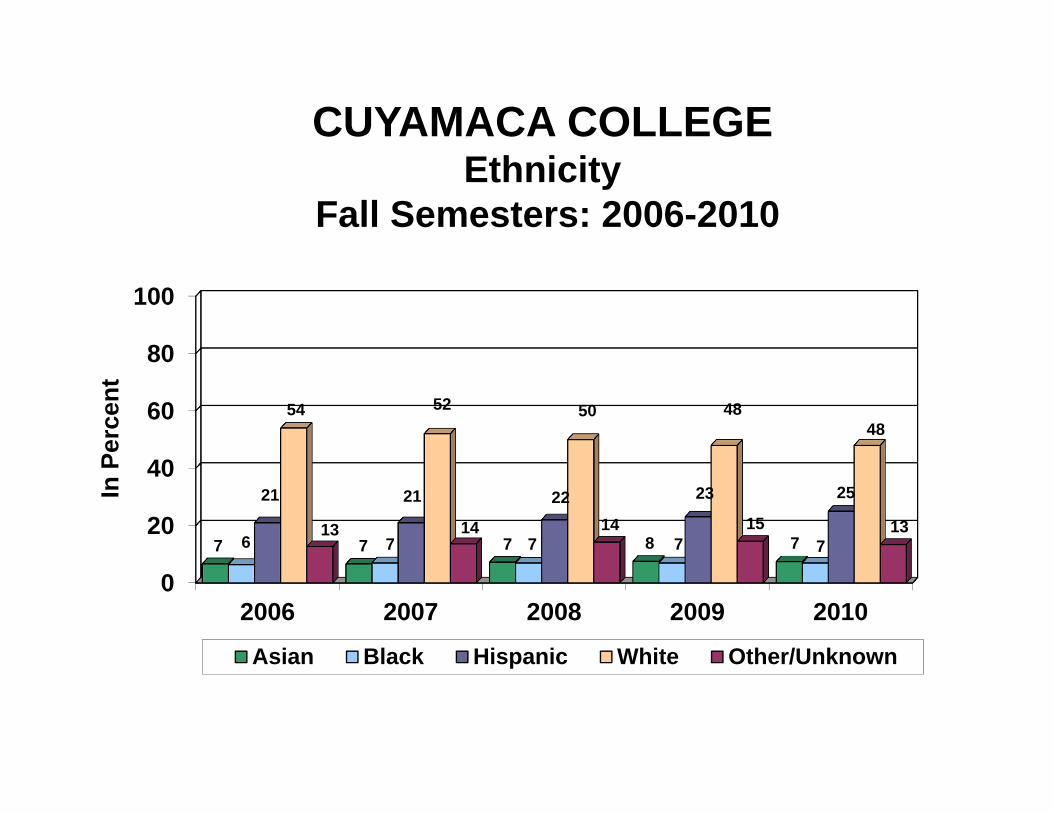
Gender 2006 2007 2008 2009 2010Female 56.6 57.2 56.4 55 54.5Male 43.4 42.8 42.6 45 44.5Age GroupUnder 20 28.1 29.5 31.1 30.7 29.120 ‐ 24 27.5 27.6 28.9 31.1 30.325 ‐ 29 9.6 10.6 10.8 11.6 12.130 ‐ 49 22.8 21.8 19.6 19.6 21.350+ 12 10.5 9.6 7.0 7.2EthnicityAsian 6.7 6.6 7.2 7.5 7.4Black 6.2 6.9 6.9 7.0 6.9Hispanic 20.6 20.5 21.5 22.8 24.6White 53.6 52.1 50.1 48.3 47.8Other/Unknown 12.9 13.8 14.2 14.5 13.4
CUYAMACA COLLEGEDemographics
Fall Semesters: 2006-2010
2006 2007 2008 2009 2010
57 57 56 55 55
43 43 43 45 45
Perc
ent
Female Male
100
80
60
40
20
0
CUYAMACA COLLEGEGender
Fall Semesters: 2006-2010Gender
0
0
0
1
1
1
2006 2007 2008 2009 2010
28 30 31 31 29
28 28 29 31 30
10 11 11 12 1223 22 20 20 21
12 11 10 7 7
Under 20 20 - 24 25 - 29 30 - 49 50+
100
80
60
40
20
0
Perc
ent
*Reflects students’ ages as of September of the given year.
CUYAMACA COLLEGEAge Distribution*
Fall Semesters: 2006-2010Age
0
20
40
60
80
100
2006 2007 2008 2009 2010
7 7 7 8 76 7 7 7 7
21 21 22 23 25
54 52 50 4848
13 14 14 15 13
In P
erce
nt
Asian Black Hispanic White Other/Unknown
CUYAMACA COLLEGEEthnicity
Fall Semesters: 2006-2010Ethnicity
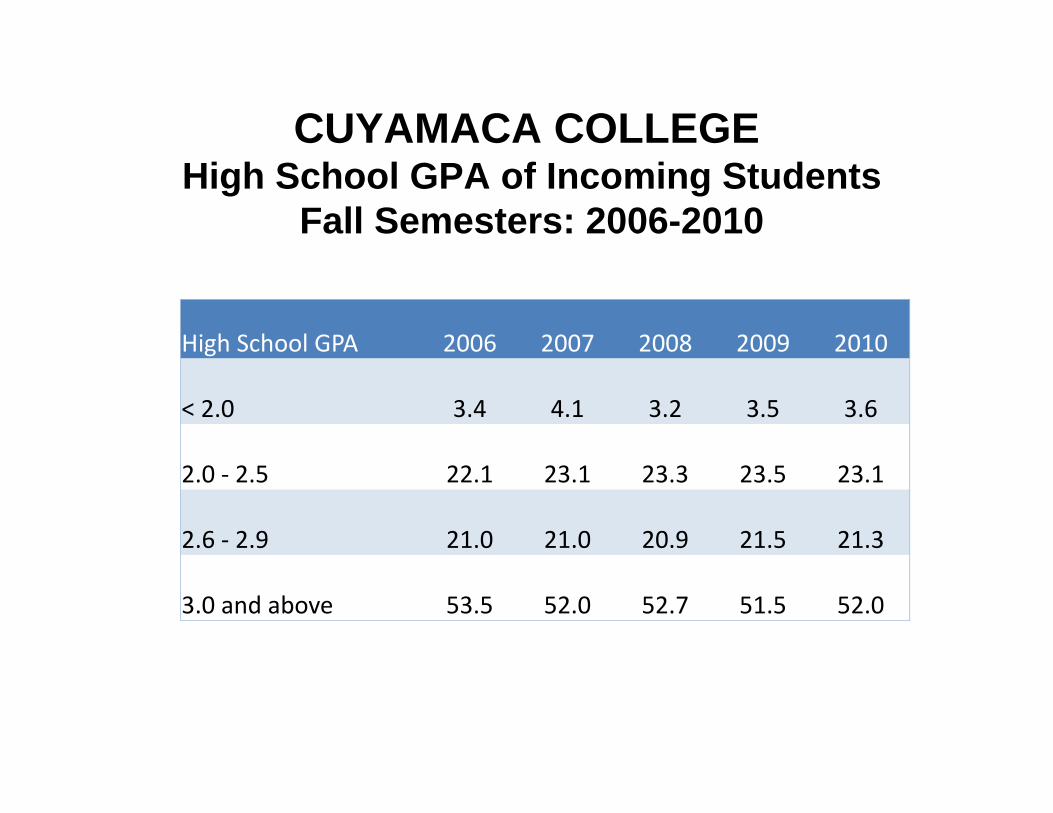
High School GPA 2006 2007 2008 2009 2010
< 2.0 3.4 4.1 3.2 3.5 3.6
2.0 ‐ 2.5 22.1 23.1 23.3 23.5 23.1
2.6 ‐ 2.9 21.0 21.0 20.9 21.5 21.3
3.0 and above 53.5 52.0 52.7 51.5 52.0
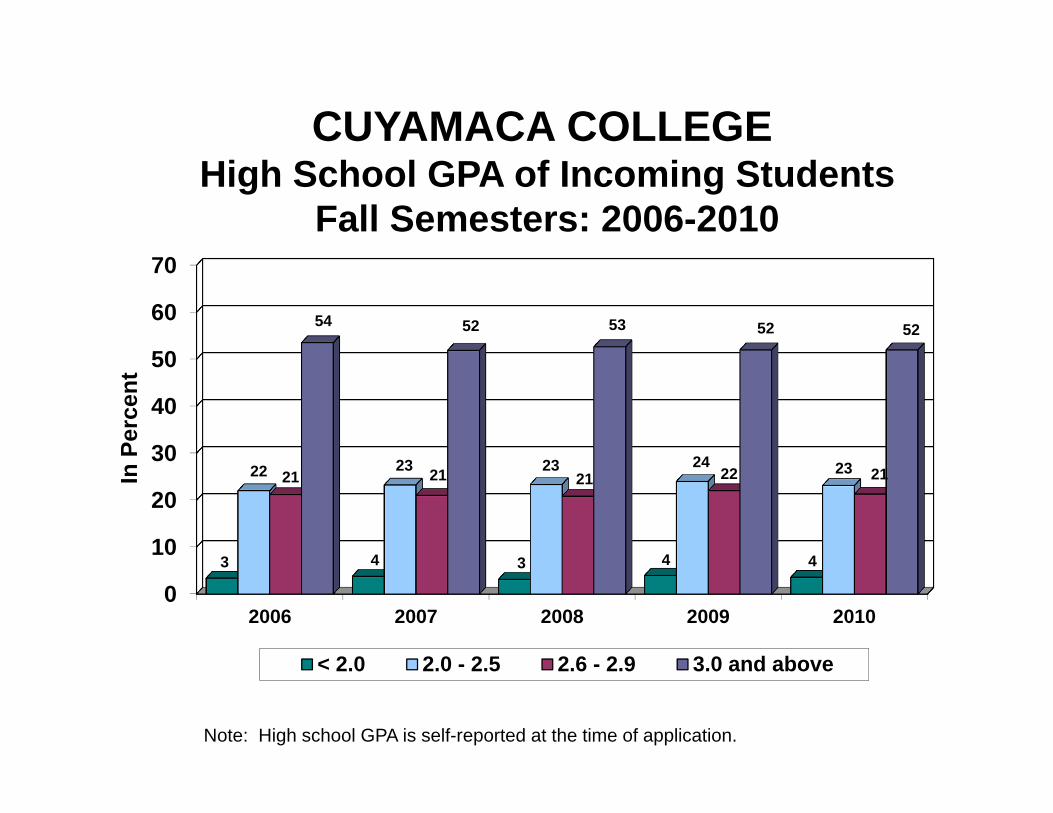
CUYAMACA COLLEGEHigh School GPA of Incoming Students
Fall Semesters: 2006-2010
0
10
20
30
40
50
60
70
2006 2007 2008 2009 2010
3 4 3 4 4
22 23 23 24 2321 21 21 22 21
54 52 53 52 52
In P
erce
nt
< 2.0 2.0 - 2.5 2.6 - 2.9 3.0 and above
CUYAMACA COLLEGEHigh School GPA of Incoming Students
Fall Semesters: 2006-2010High School GPA
Note: High school GPA is self-reported at the time of application.
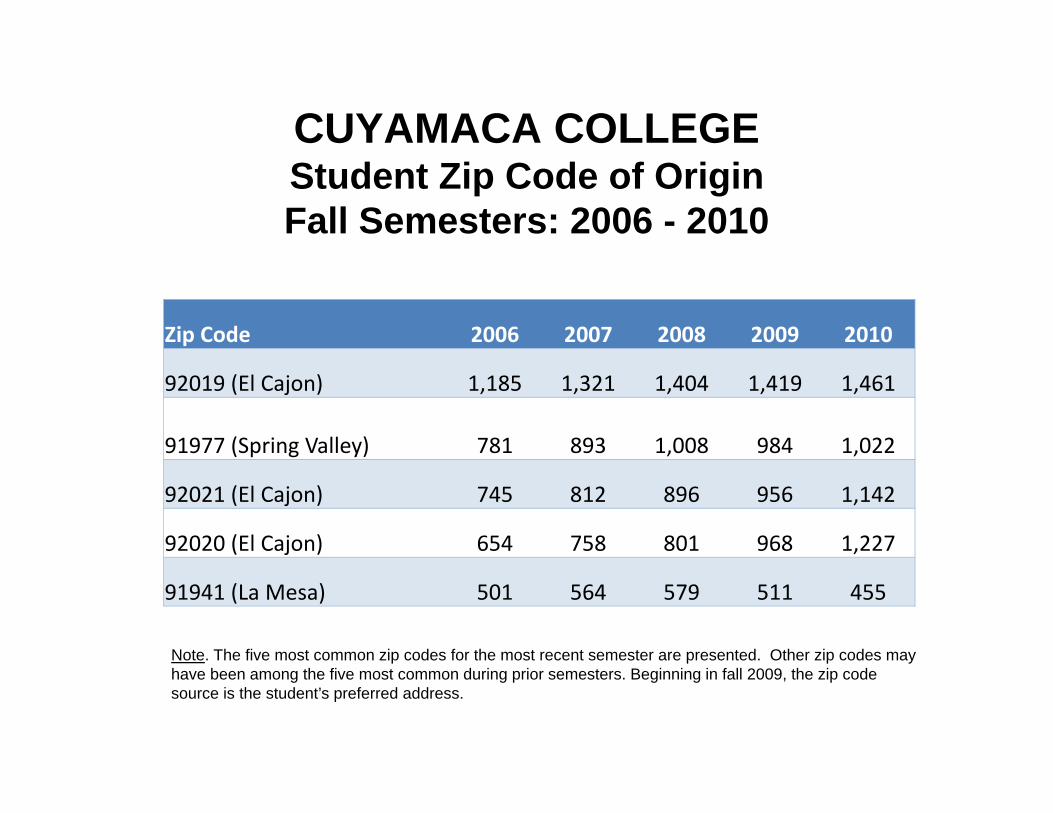
Zip Code 2006 2007 2008 2009 2010
92019 (El Cajon) 1,185 1,321 1,404 1,419 1,461
91977 (Spring Valley) 781 893 1,008 984 1,022
92021 (El Cajon) 745 812 896 956 1,142
92020 (El Cajon) 654 758 801 968 1,227
91941 (La Mesa) 501 564 579 511 455
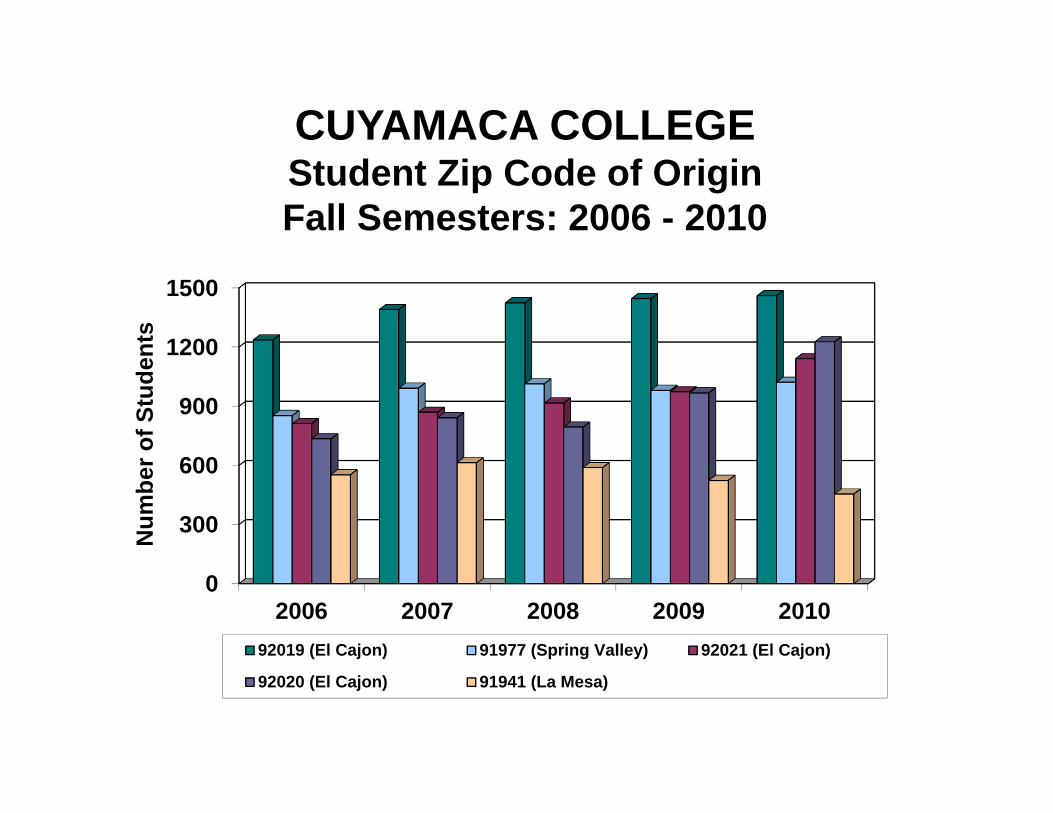
CUYAMACA COLLEGEStudent Zip Code of OriginFall Semesters: 2006 - 2010
Note. The five most common zip codes for the most recent semester are presented. Other zip codes may have been among the five most common during prior semesters. Beginning in fall 2009, the zip code source is the student’s preferred address.
0
300
600
900
1200
1500
2006 2007 2008 2009 2010
Num
ber o
f Stu
dent
s
92019 (El Cajon) 91977 (Spring Valley) 92021 (El Cajon)
92020 (El Cajon) 91941 (La Mesa)
CUYAMACA COLLEGEStudent Zip Code of OriginFall Semesters: 2006 - 2010
Top 5 Zips
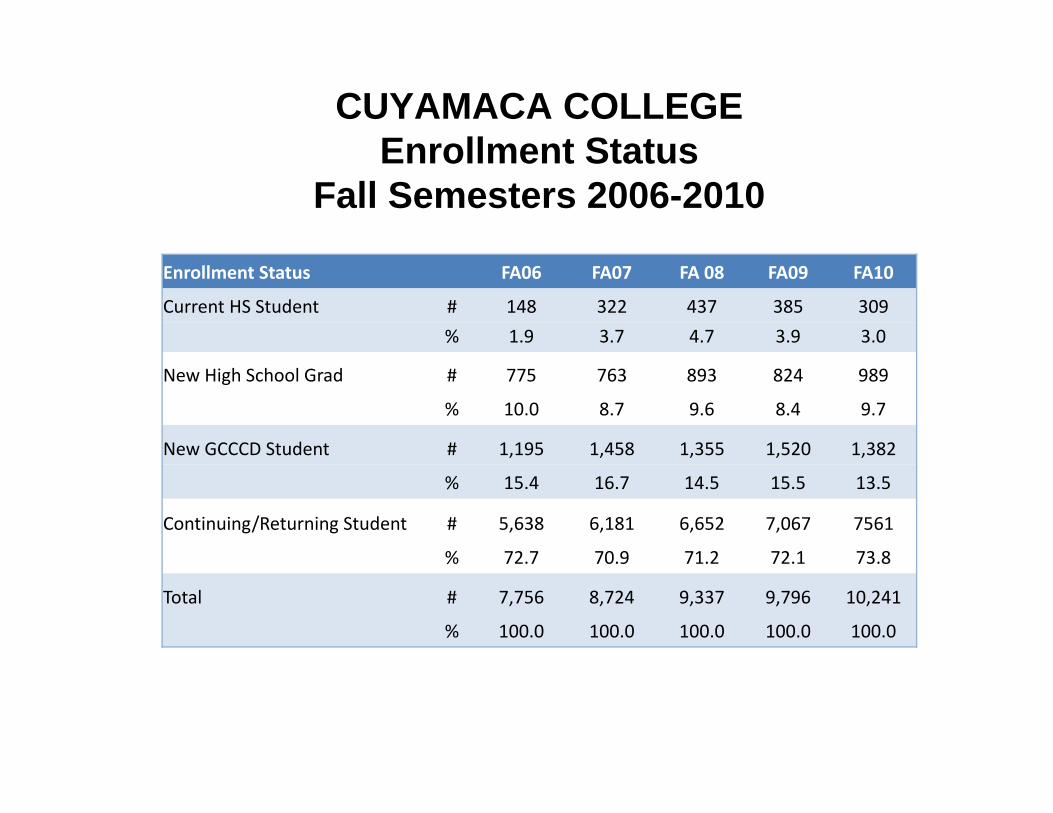
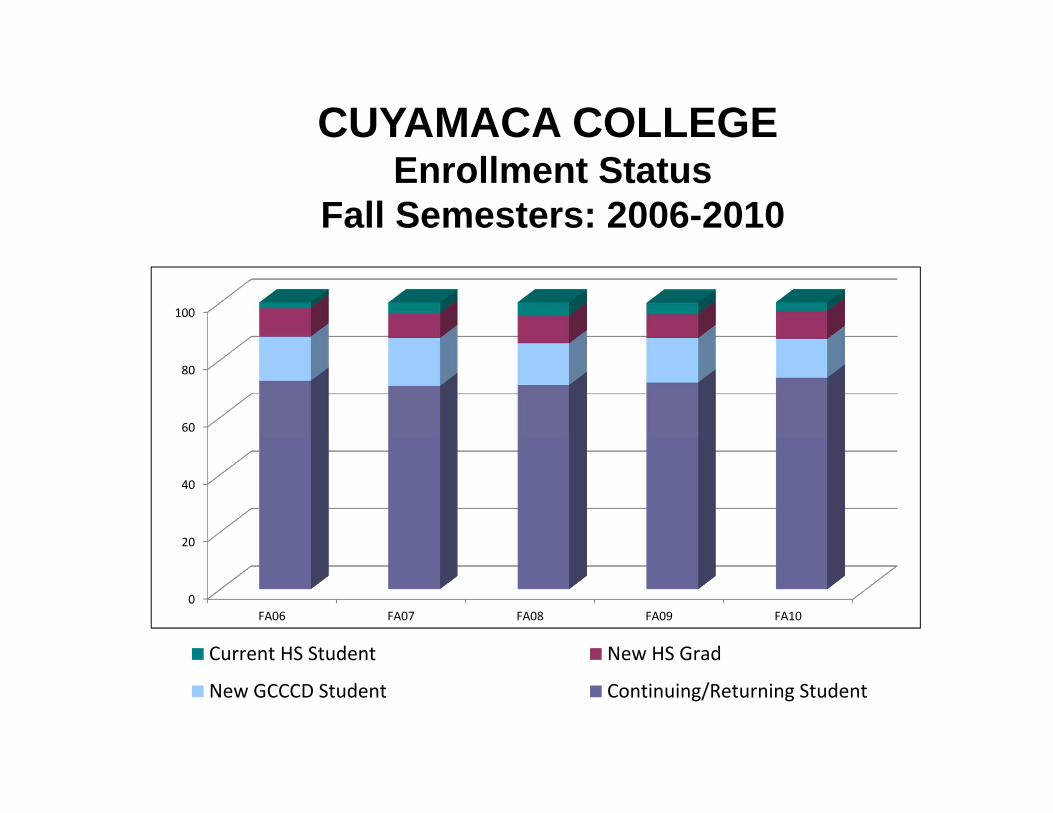
CUYAMACA COLLEGE Enrollment Status
Fall Semesters 2006-2010
Enrollment Status FA06 FA07 FA 08 FA09 FA10
Current HS Student # 148 322 437 385 309% 1.9 3.7 4.7 3.9 3.0
New High School Grad # 775 763 893 824 989
% 10.0 8.7 9.6 8.4 9.7
New GCCCD Student # 1,195 1,458 1,355 1,520 1,382
% 15.4 16.7 14.5 15.5 13.5
Continuing/Returning Student # 5,638 6,181 6,652 7,067 7561
% 72.7 70.9 71.2 72.1 73.8
Total # 7,756 8,724 9,337 9,796 10,241
% 100.0 100.0 100.0 100.0 100.0
0
20
40
60
80
100
FA06 FA07 FA08 FA09 FA10
Current HS Student New HS Grad
New GCCCD Student Continuing/Returning Student
CUYAMACA COLLEGEEnrollment Status
Fall Semesters: 2006-2010

Outcomes*Unless otherwise specified, charts exclude students taking only non‐credit courses
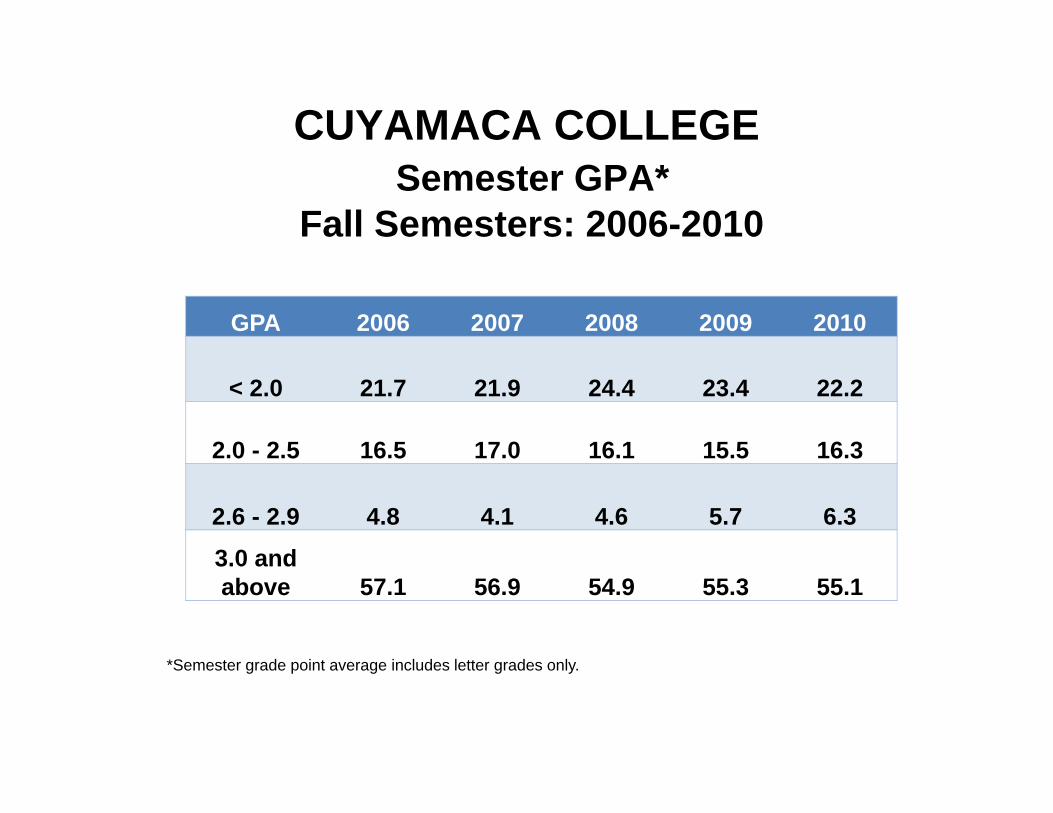
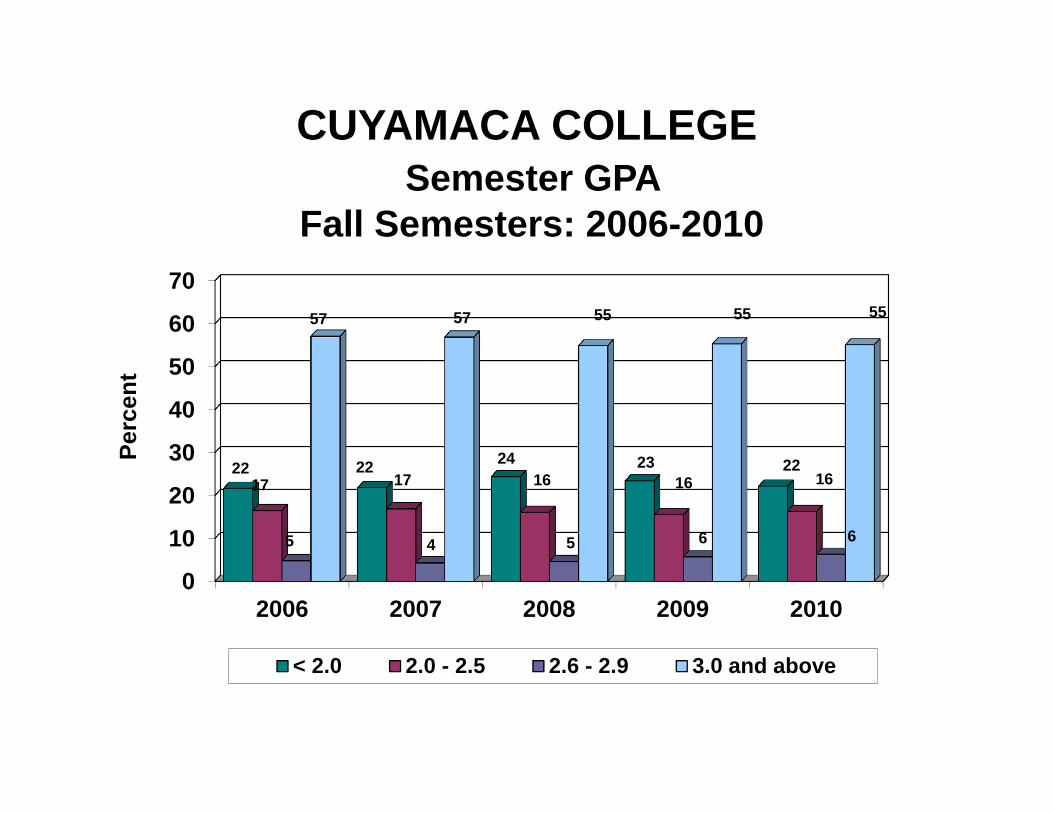
GPA 2006 2007 2008 2009 2010
< 2.0 21.7 21.9 24.4 23.4 22.2
2.0 - 2.5 16.5 17.0 16.1 15.5 16.3
2.6 - 2.9 4.8 4.1 4.6 5.7 6.3
3.0 and above 57.1 56.9 54.9 55.3 55.1
CUYAMACA COLLEGESemester GPA*
Fall Semesters: 2006-2010
*Semester grade point average includes letter grades only.
0
10
20
30
40
50
60
70
2006 2007 2008 2009 2010
22 22 24 23 2217 17 16 16 16
5 4 5 6 6
57 57 55 55 55
Perc
ent
< 2.0 2.0 - 2.5 2.6 - 2.9 3.0 and above
Semester GPA
CUYAMACA COLLEGESemester GPA
Fall Semesters: 2006-2010
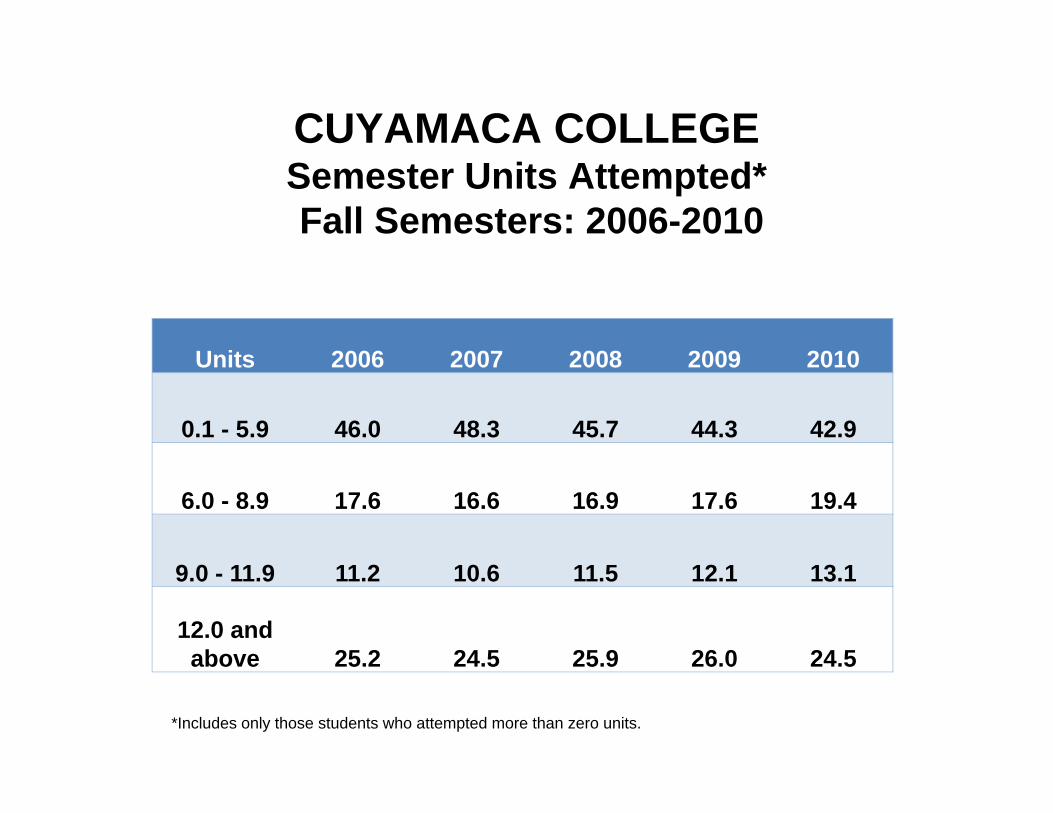
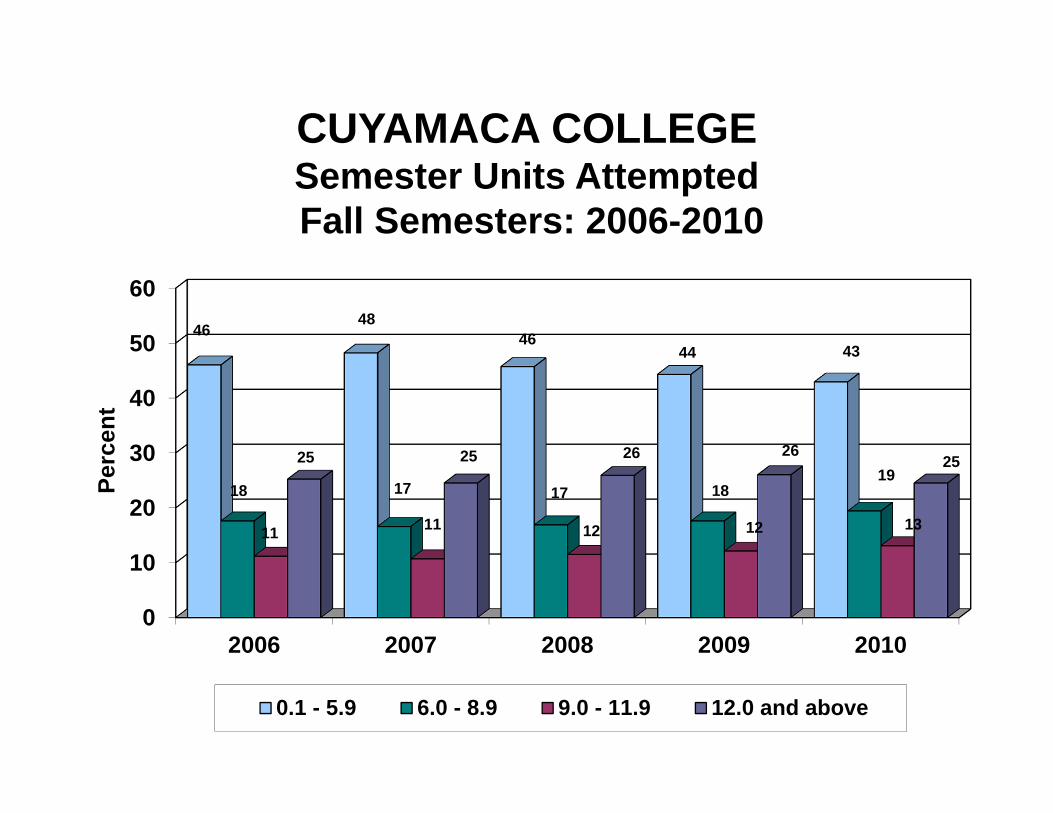
Units 2006 2007 2008 2009 2010
0.1 - 5.9 46.0 48.3 45.7 44.3 42.9
6.0 - 8.9 17.6 16.6 16.9 17.6 19.4
9.0 - 11.9 11.2 10.6 11.5 12.1 13.1
12.0 and above 25.2 24.5 25.9 26.0 24.5
CUYAMACA COLLEGESemester Units Attempted*Fall Semesters: 2006-2010
*Includes only those students who attempted more than zero units.
0
10
20
30
40
50
60
2006 2007 2008 2009 2010
4648
4644 43
18 17 17 1819
11 11 12 12 13
25 25 26 2625
Perc
ent
0.1 - 5.9 6.0 - 8.9 9.0 - 11.9 12.0 and above
Semester Units Attempted
CUYAMACA COLLEGESemester Units AttemptedFall Semesters: 2006-2010
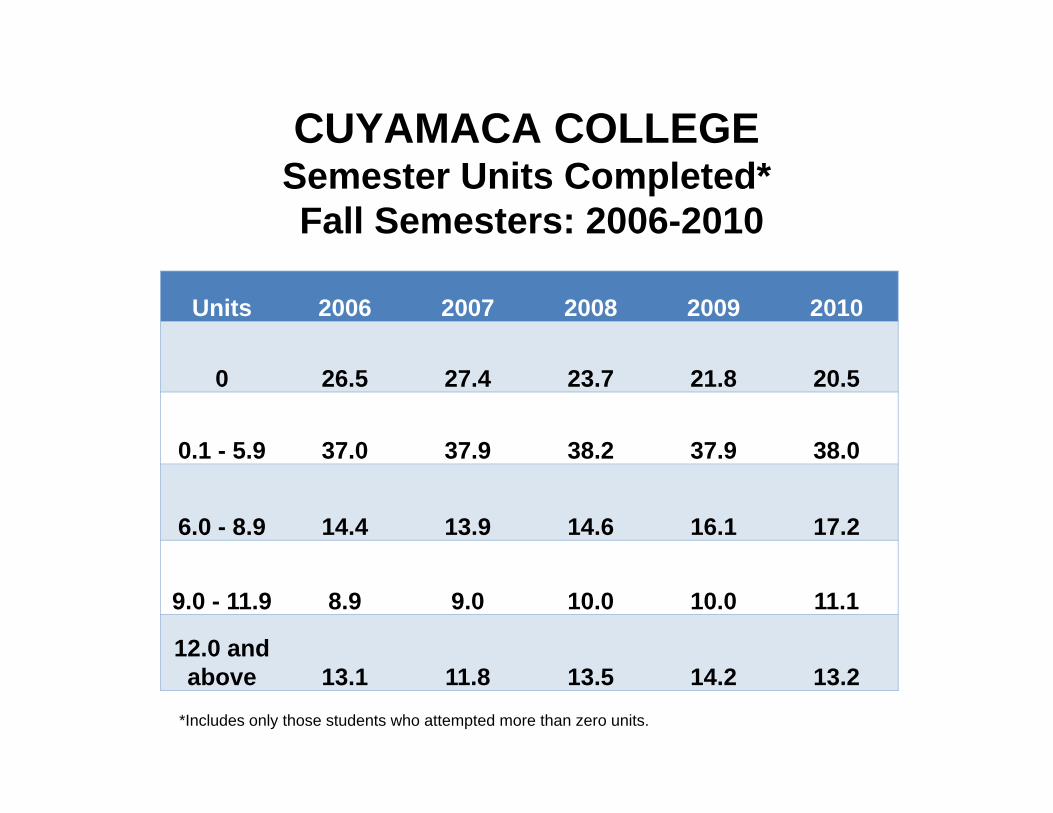
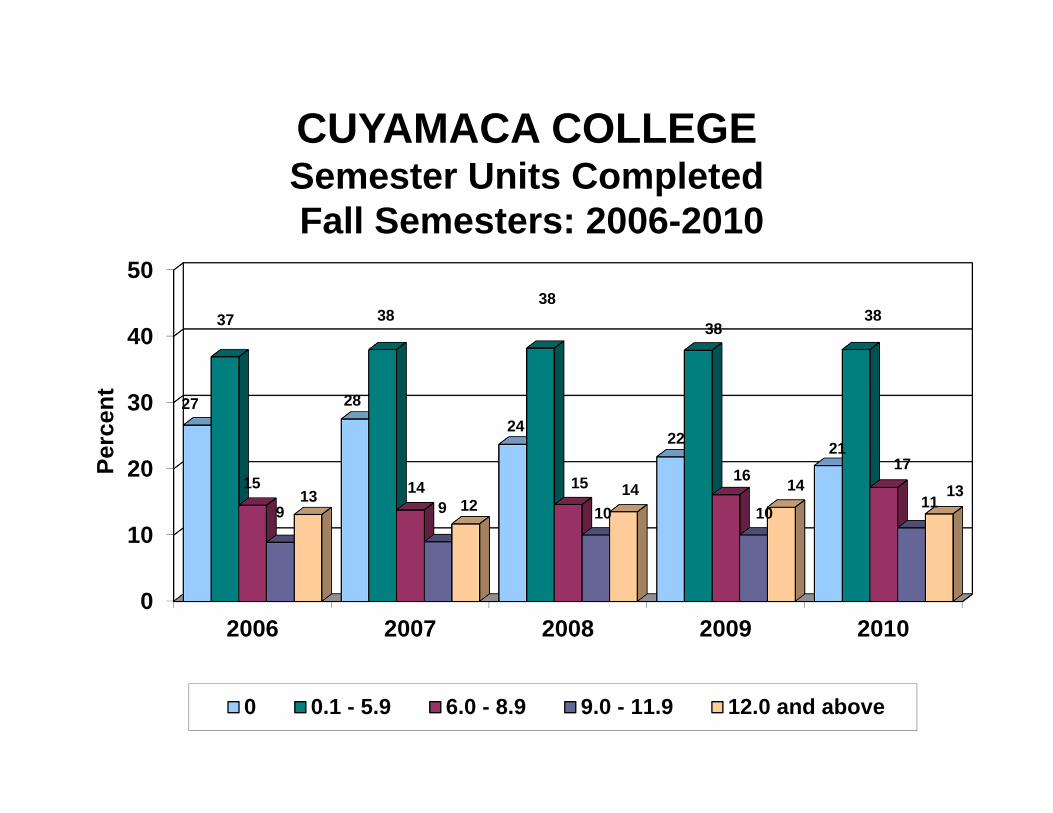
Units 2006 2007 2008 2009 2010
0 26.5 27.4 23.7 21.8 20.5
0.1 - 5.9 37.0 37.9 38.2 37.9 38.0
6.0 - 8.9 14.4 13.9 14.6 16.1 17.2
9.0 - 11.9 8.9 9.0 10.0 10.0 11.1
12.0 and above 13.1 11.8 13.5 14.2 13.2
CUYAMACA COLLEGESemester Units Completed*Fall Semesters: 2006-2010
*Includes only those students who attempted more than zero units.
0
10
20
30
40
50
2006 2007 2008 2009 2010
27 2824
22 21
37 3838
3838
15 14 15 1617
9 9 10 101113 12
14 14 13
Perc
ent
0 0.1 - 5.9 6.0 - 8.9 9.0 - 11.9 12.0 and above
Semester Units Completed
CUYAMACA COLLEGESemester Units CompletedFall Semesters: 2006-2010
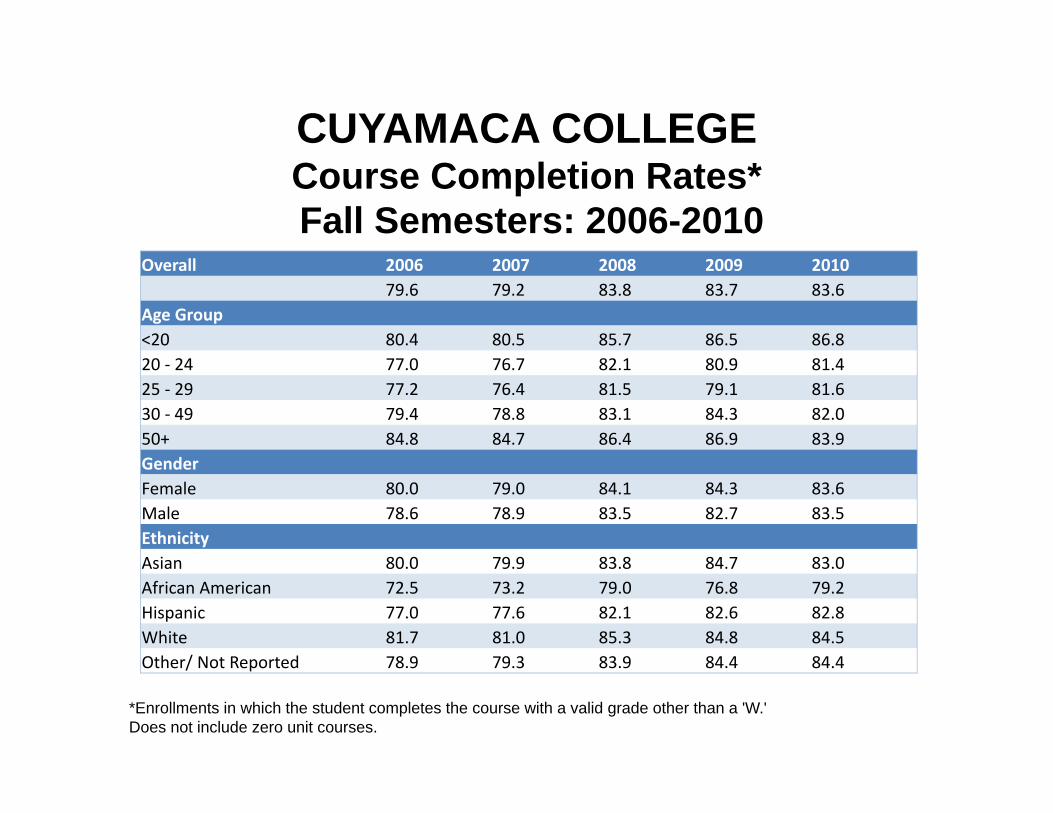
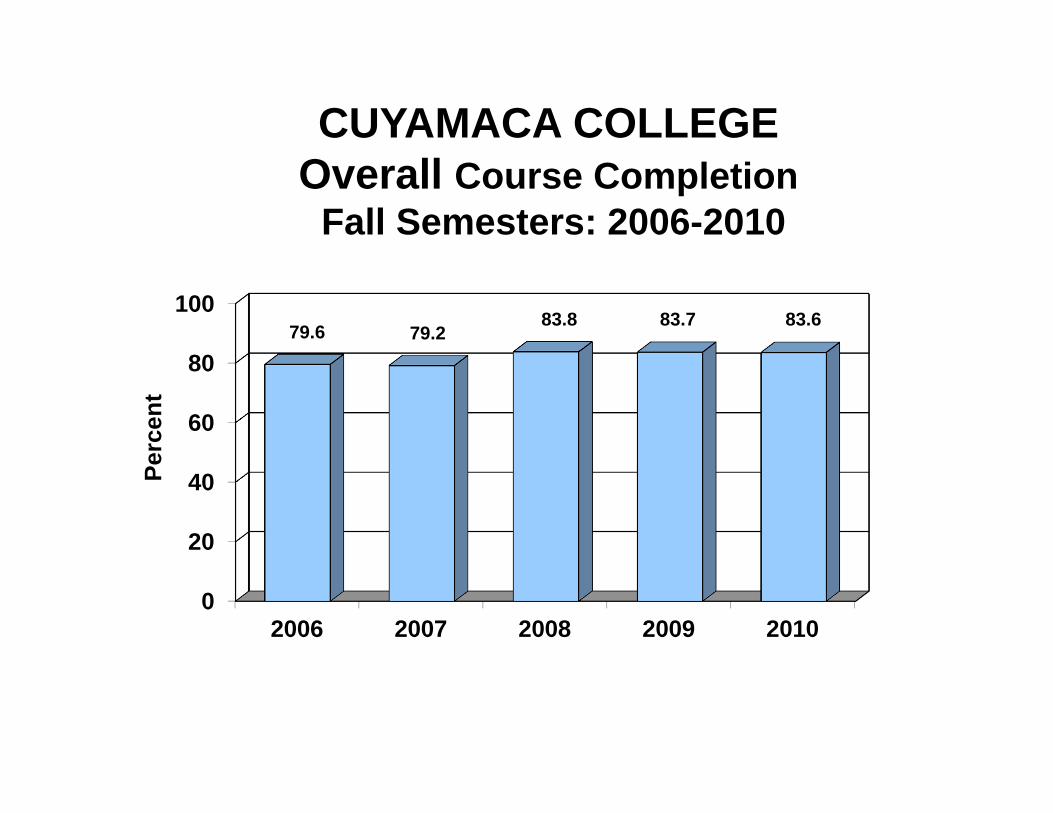
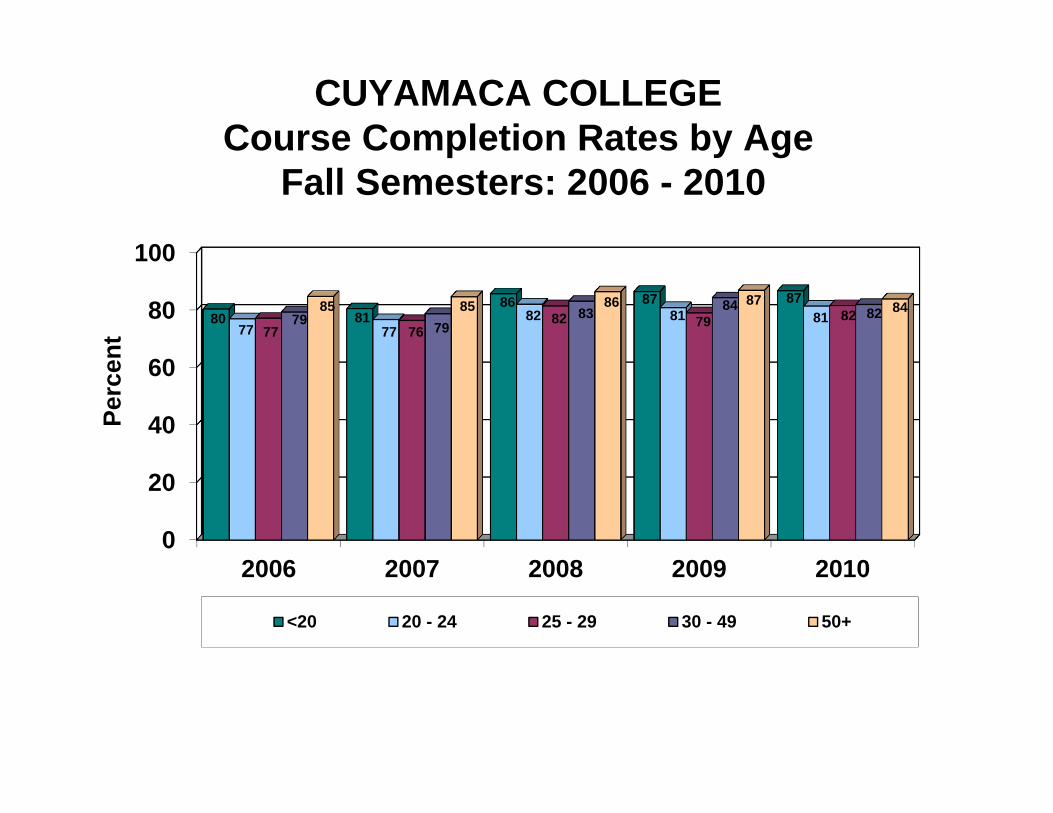
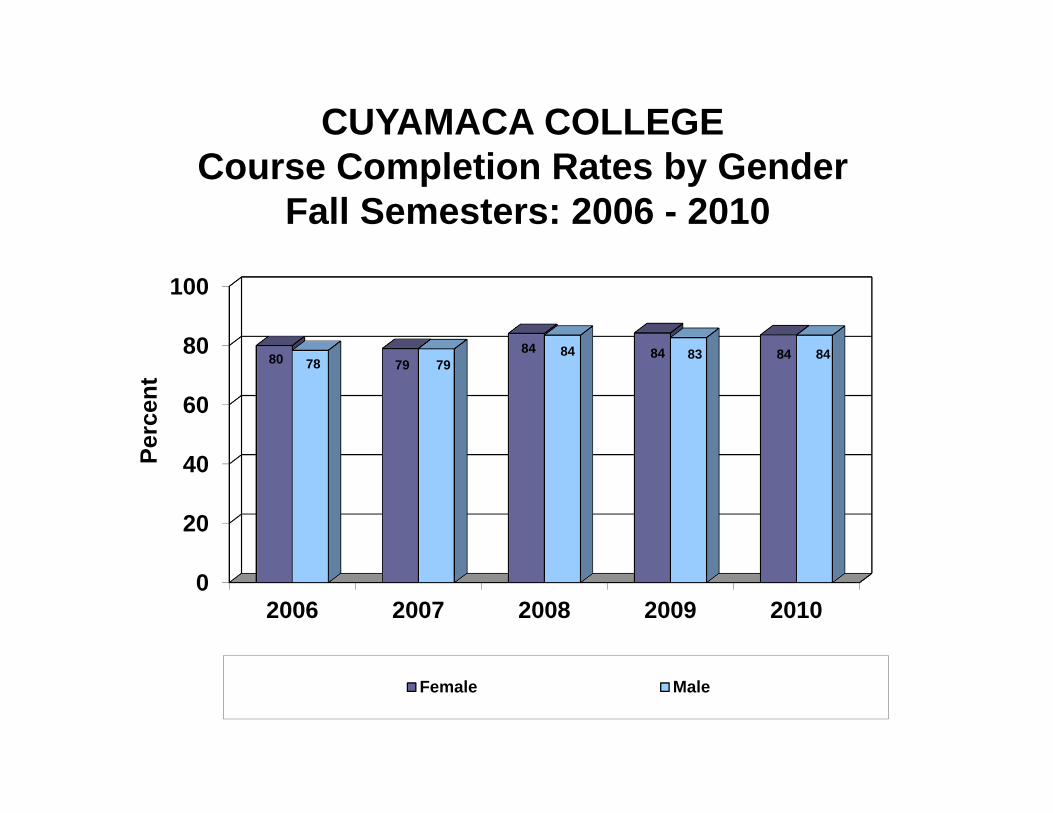
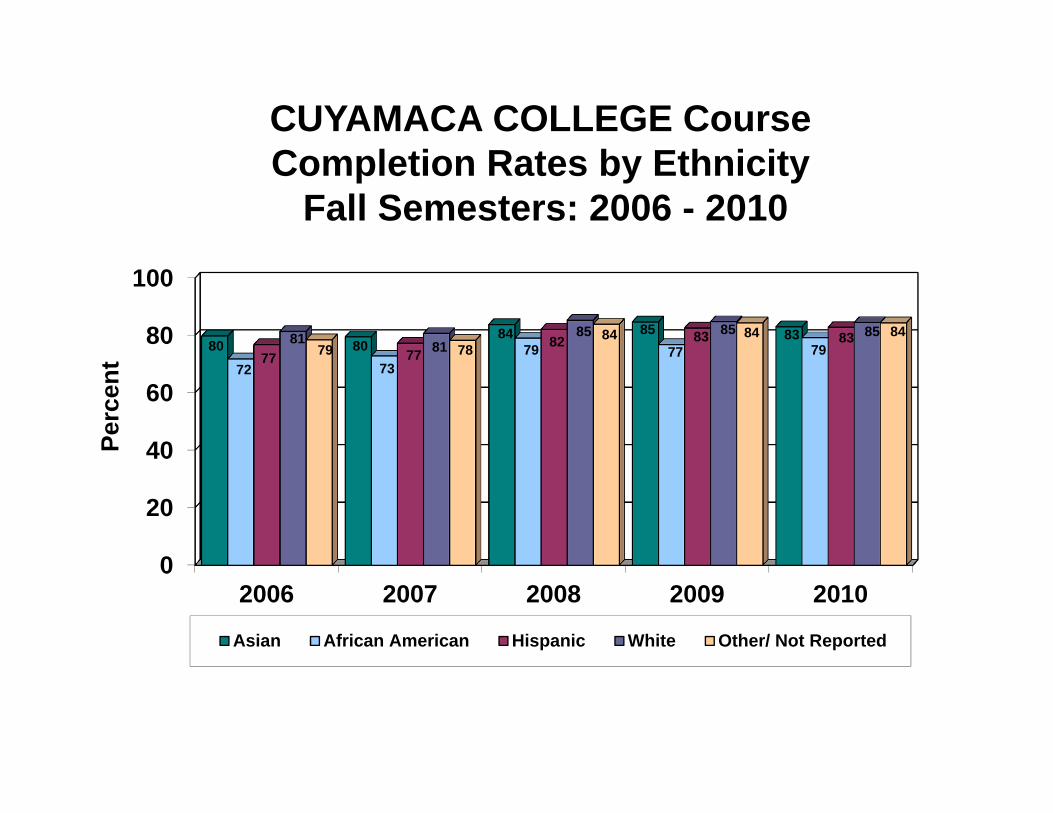
CUYAMACA COLLEGECourse Completion Rates*Fall Semesters: 2006-2010
Overall 2006 2007 2008 2009 201079.6 79.2 83.8 83.7 83.6
Age Group<20 80.4 80.5 85.7 86.5 86.820 ‐ 24 77.0 76.7 82.1 80.9 81.425 ‐ 29 77.2 76.4 81.5 79.1 81.630 ‐ 49 79.4 78.8 83.1 84.3 82.050+ 84.8 84.7 86.4 86.9 83.9GenderFemale 80.0 79.0 84.1 84.3 83.6Male 78.6 78.9 83.5 82.7 83.5EthnicityAsian 80.0 79.9 83.8 84.7 83.0African American 72.5 73.2 79.0 76.8 79.2Hispanic 77.0 77.6 82.1 82.6 82.8White 81.7 81.0 85.3 84.8 84.5Other/ Not Reported 78.9 79.3 83.9 84.4 84.4
*Enrollments in which the student completes the course with a valid grade other than a 'W.'Does not include zero unit courses.
0
20
40
60
80
100
2006 2007 2008 2009 2010
79.6 79.283.8 83.7 83.6
Perc
ent
CUYAMACA COLLEGEOverall Course Completion
Fall Semesters: 2006-2010
0
20
40
60
80
100
2006 2007 2008 2009 2010
80 8186 87 87
77 7782 81 81
77 7682 79 8279 79
83 84 8285 85 86 87 84
Perc
ent
<20 20 - 24 25 - 29 30 - 49 50+
Course
Retention by Age
CUYAMACA COLLEGE Course Completion Rates by Age
Fall Semesters: 2006 - 2010
0
20
40
60
80
100
2006 2007 2008 2009 2010
80 7984 84 84
78 7984 83 84
Perc
ent
Female Male
CUYAMACA COLLEGE Course Completion Rates by Gender
Fall Semesters: 2006 - 2010
Course Retention by
Gender
0
20
40
60
80
100
2006 2007 2008 2009 2010
80 8084 85 83
72 7379 77 7977 77
82 83 8381 8185 85 85
79 7884 84 84
Perc
ent
Asian African American Hispanic White Other/ Not Reported
CUYAMACA COLLEGE Course Completion Rates by Ethnicity
Fall Semesters: 2006 - 2010
Course
Retention by Ethnicity
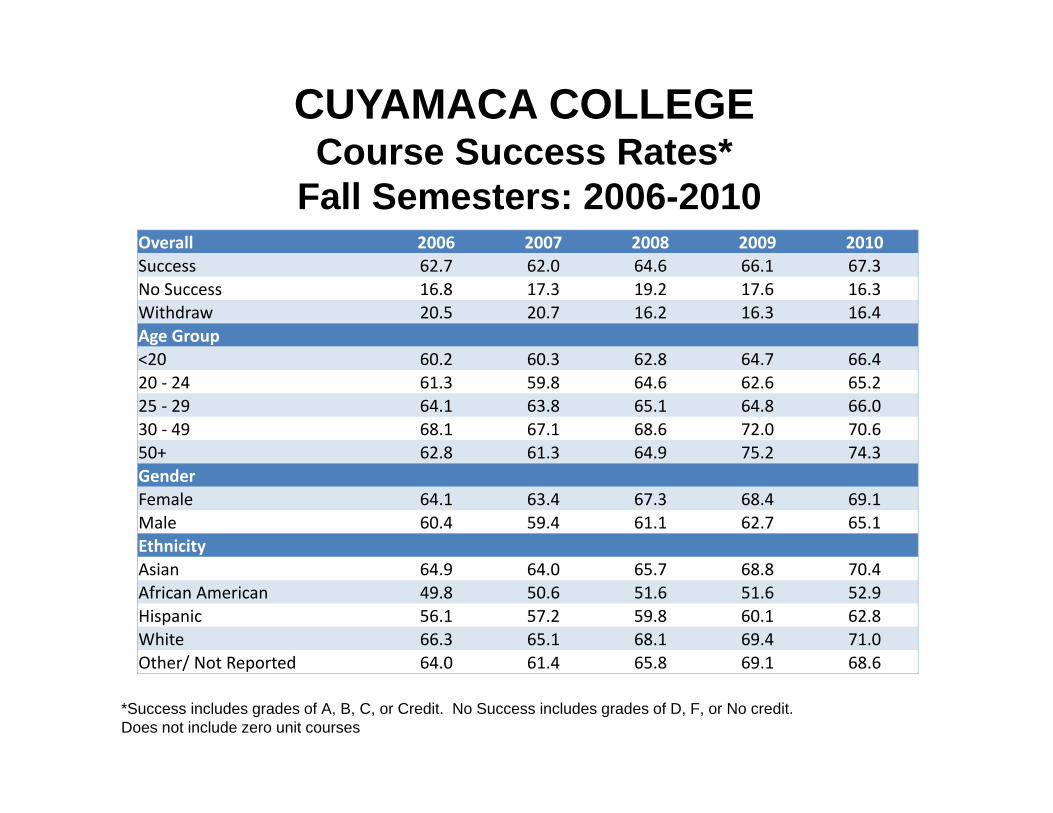
CUYAMACA COLLEGECourse Success Rates*
Fall Semesters: 2006-2010Overall 2006 2007 2008 2009 2010Success 62.7 62.0 64.6 66.1 67.3No Success 16.8 17.3 19.2 17.6 16.3Withdraw 20.5 20.7 16.2 16.3 16.4Age Group<20 60.2 60.3 62.8 64.7 66.420 ‐ 24 61.3 59.8 64.6 62.6 65.225 ‐ 29 64.1 63.8 65.1 64.8 66.030 ‐ 49 68.1 67.1 68.6 72.0 70.650+ 62.8 61.3 64.9 75.2 74.3GenderFemale 64.1 63.4 67.3 68.4 69.1Male 60.4 59.4 61.1 62.7 65.1EthnicityAsian 64.9 64.0 65.7 68.8 70.4African American 49.8 50.6 51.6 51.6 52.9Hispanic 56.1 57.2 59.8 60.1 62.8White 66.3 65.1 68.1 69.4 71.0Other/ Not Reported 64.0 61.4 65.8 69.1 68.6
*Success includes grades of A, B, C, or Credit. No Success includes grades of D, F, or No credit.Does not include zero unit courses
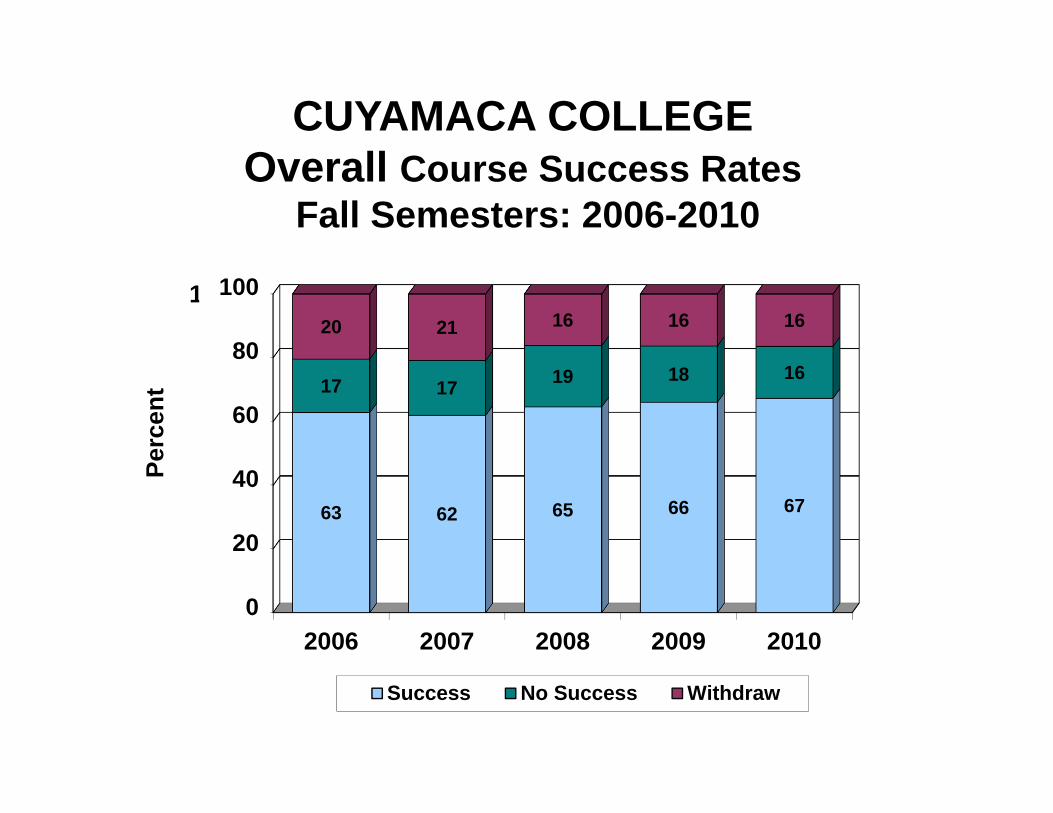
0%
20%
40%
60%
80%
100%
2006 2007 2008 2009 2010
63 62 65 66 67
17 17 19 18 16
20 21 16 16 16
Perc
ent
Success No Success Withdraw
100
80
60
40
20
0
CUYAMACA COLLEGEOverall Course Success Rates
Fall Semesters: 2006-2010
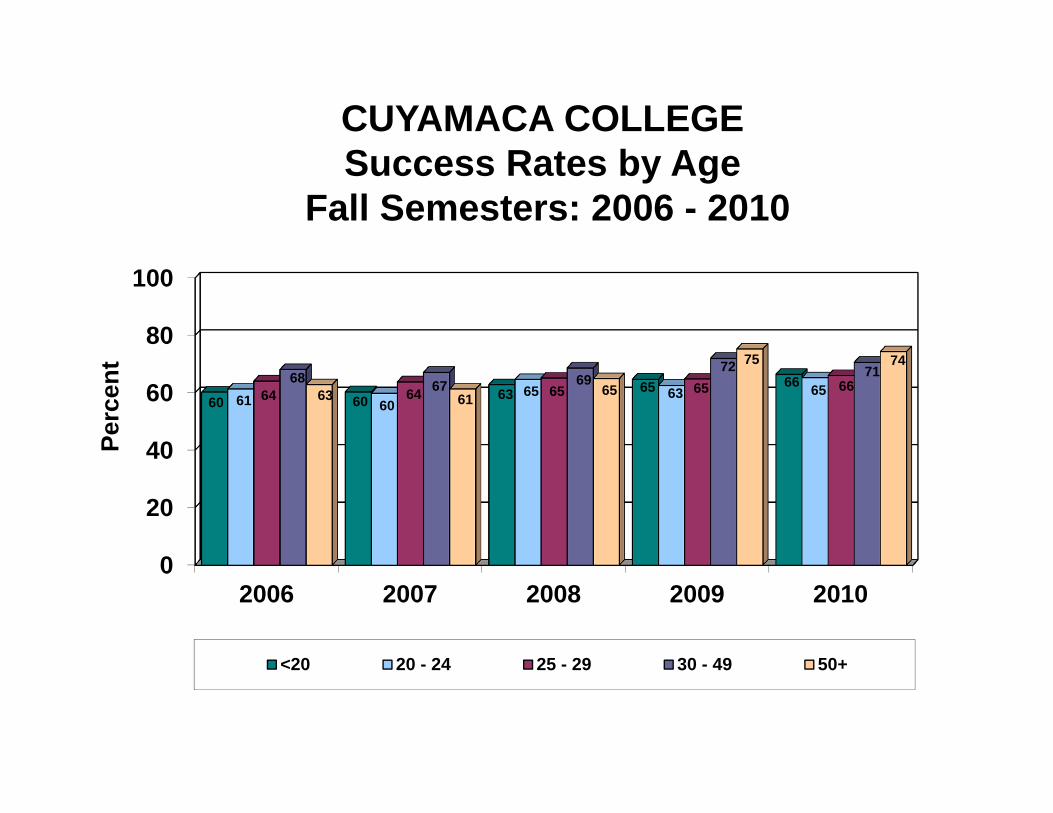
0
20
40
60
80
100
2006 2007 2008 2009 2010
60 60 63 65 6661 60
65 63 6564 64 65 65 6668 67 6972 71
63 61 65
75 74
Perc
ent
<20 20 - 24 25 - 29 30 - 49 50+
CUYAMACA COLLEGE Success Rates by Age
Fall Semesters: 2006 - 2010
Course Success by
Age
0
20
40
60
80
100
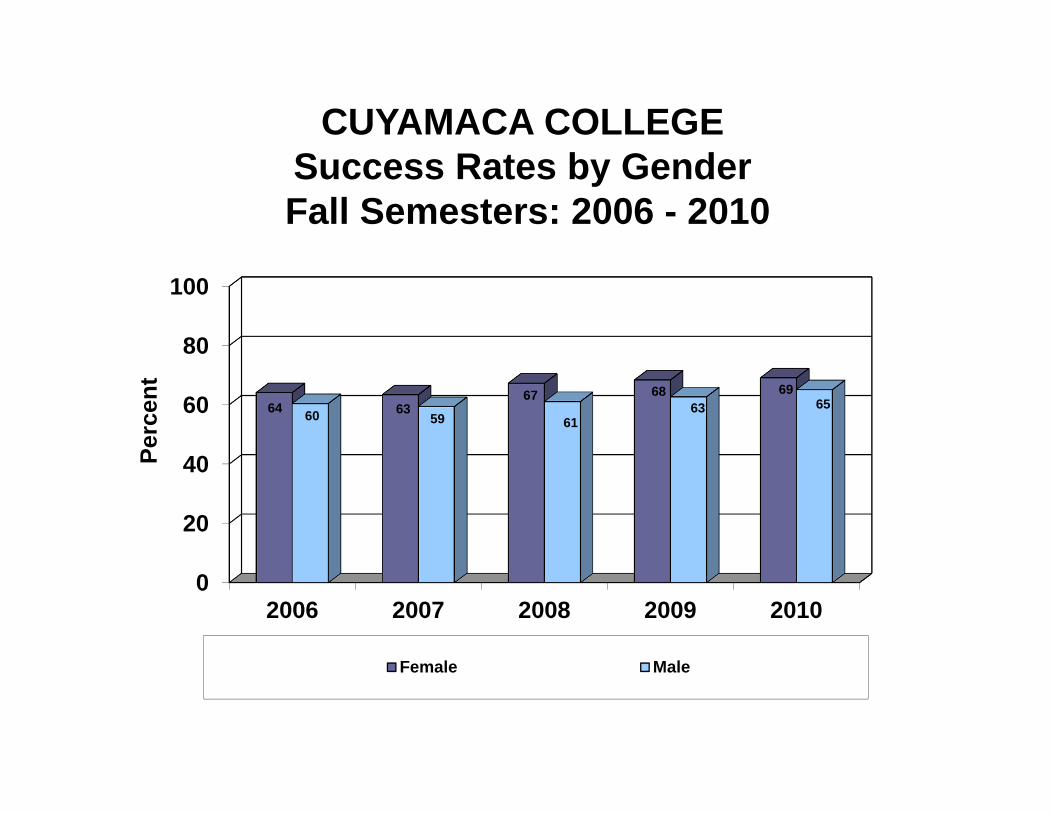
2006 2007 2008 2009 2010
64 6367 68 69
60 59 6163 65
Perc
ent
Female Male
CUYAMACA COLLEGE Success Rates by GenderFall Semesters: 2006 - 2010
Course Success by
Gender
0
20
40
60
80
100
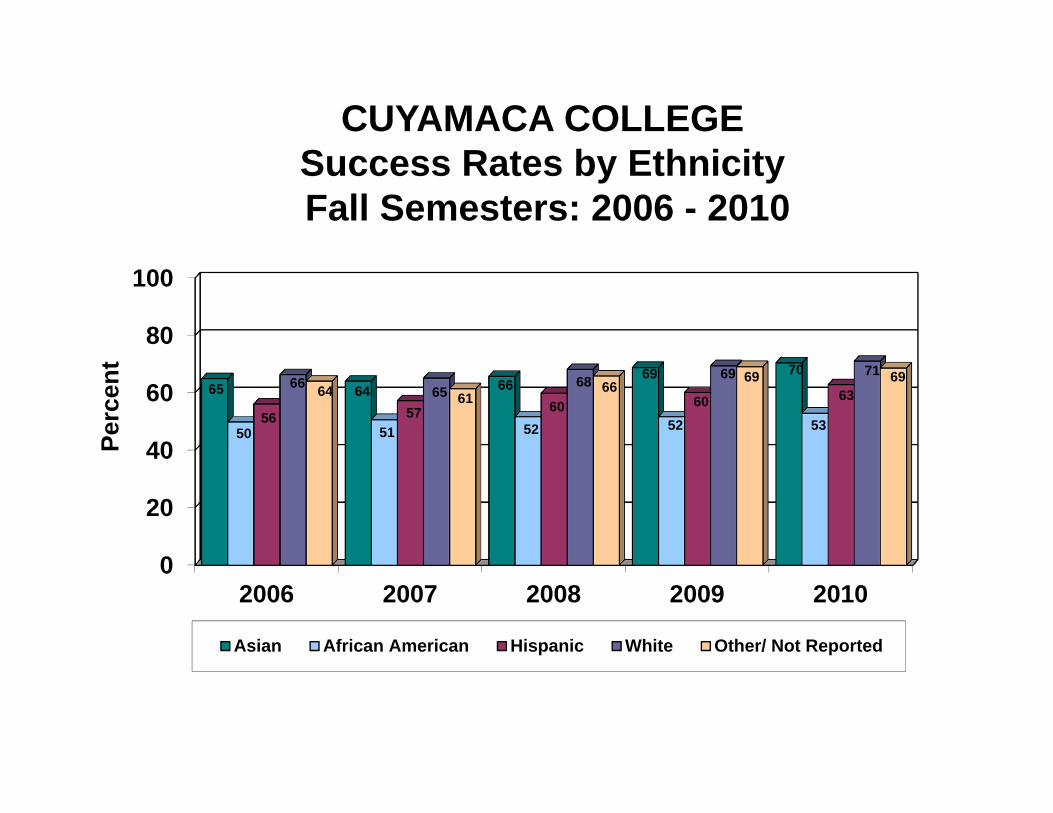
2006 2007 2008 2009 2010
65 64 6669 70
50 51 52 52 5356 57 60 60 6366 65
68 69 7164 61
6669 69
Perc
ent
Asian African American Hispanic White Other/ Not Reported
CUYAMACA COLLEGE Success Rates by EthnicityFall Semesters: 2006 - 2010
urse
Success by
Ethnicity
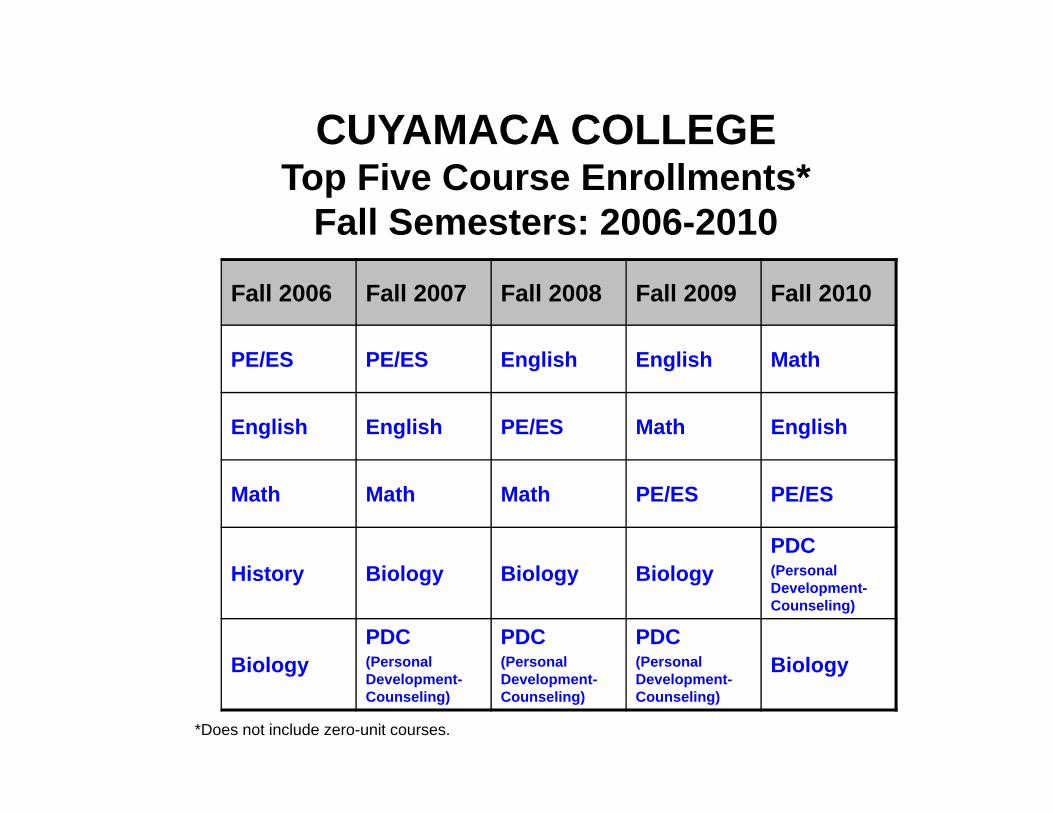
Top Five Course Enrollments
*Does not include zero-unit courses.
Fall 2006 Fall 2007 Fall 2008 Fall 2009 Fall 2010
PE/ES PE/ES English English Math
English English PE/ES Math English
Math Math Math PE/ES PE/ES
History Biology Biology BiologyPDC(Personal Development-Counseling)
BiologyPDC(Personal Development-Counseling)
PDC(Personal Development-Counseling)
PDC(Personal Development-Counseling)
Biology
CUYAMACA COLLEGETop Five Course Enrollments*
Fall Semesters: 2006-2010
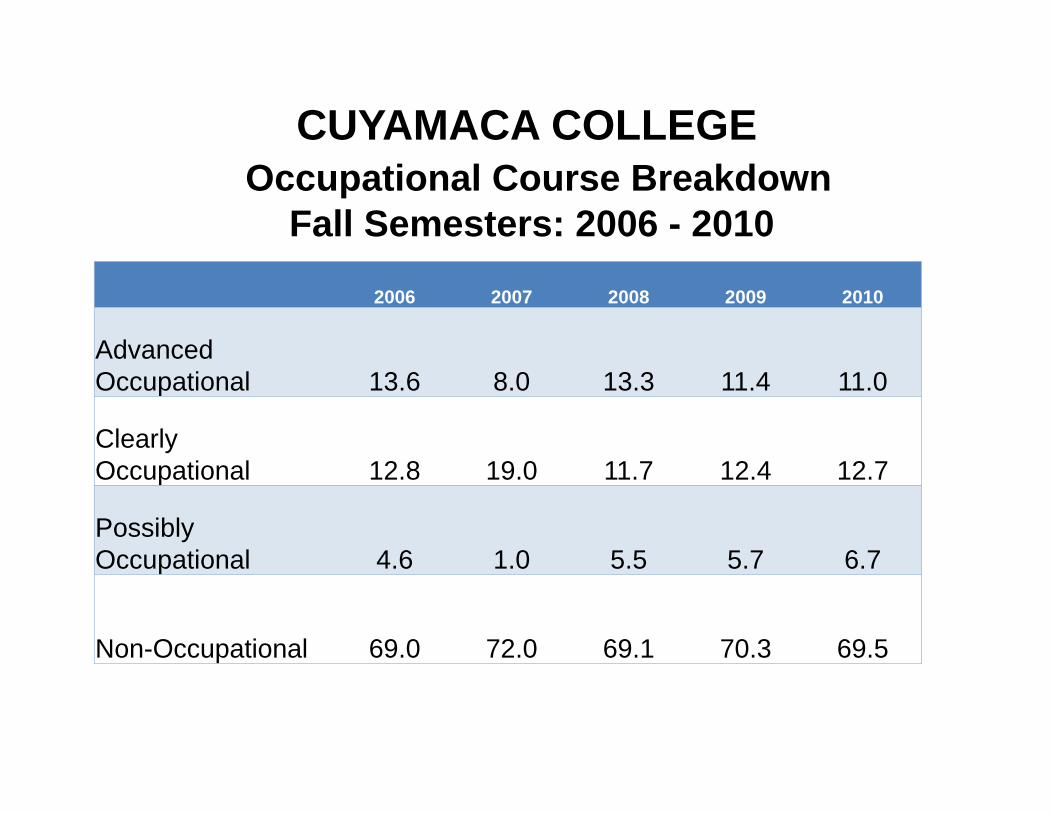
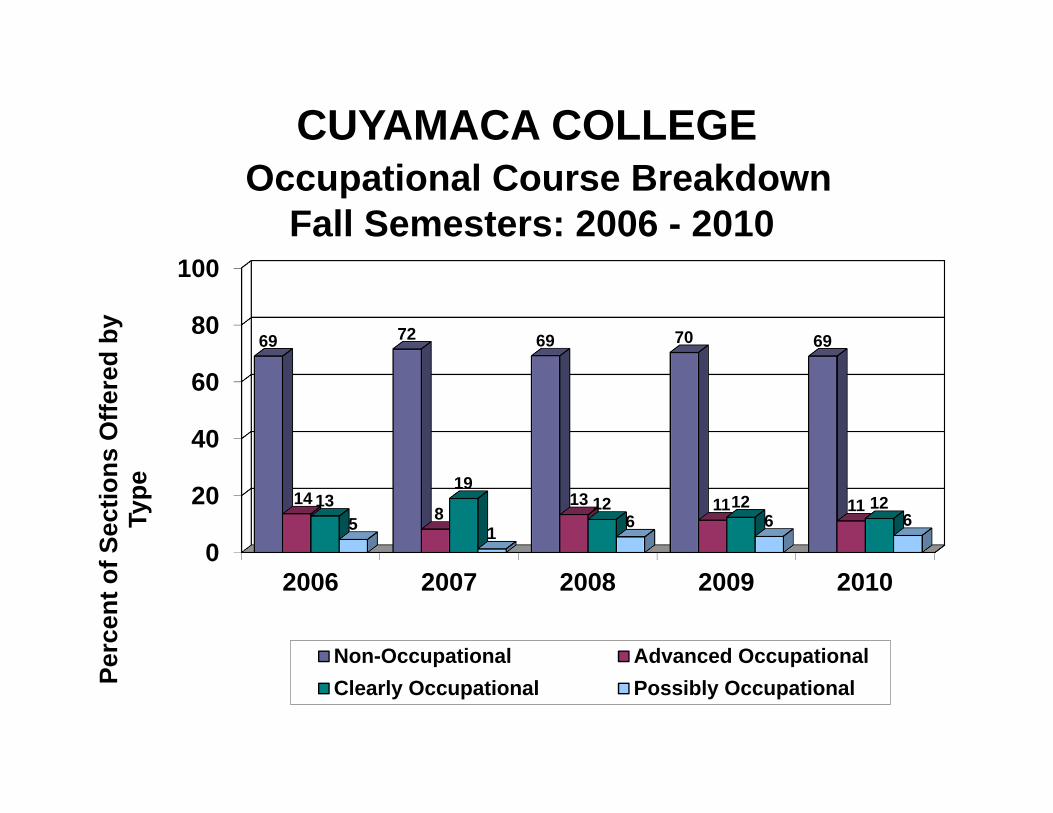
CUYAMACA COLLEGEOccupational Course Breakdown
Fall Semesters: 2006 - 2010
2006 2007 2008 2009 2010
Advanced Occupational 13.6 8.0 13.3 11.4 11.0
Clearly Occupational 12.8 19.0 11.7 12.4 12.7
Possibly Occupational 4.6 1.0 5.5 5.7 6.7
Non-Occupational 69.0 72.0 69.1 70.3 69.5
0
20
40
60
80
100
2006 2007 2008 2009 2010
69 72 69 70 69
148
13 11 111319
12 12 125 1
6 6 6
Perc
ent o
f Sec
tions
Offe
red
by
Type
Non-Occupational Advanced OccupationalClearly Occupational Possibly Occupational
Occupation
al Cours
e Breakdown
CUYAMACA COLLEGEOccupational Course Breakdown
Fall Semesters: 2006 - 2010
0
100
200
300
400
84
181207
65 78
206
7268
232
72103
72
143 120
19
38
83
2132
75
29
35
Num
ber o
f Deg
rees
/Cer
tific
ates
Certificates Degrees
* Information is current as of 5/24/11.
CUYAMACA COLLEGEDegrees and Certificates*
2006 – 2010
Degrees and Certificates
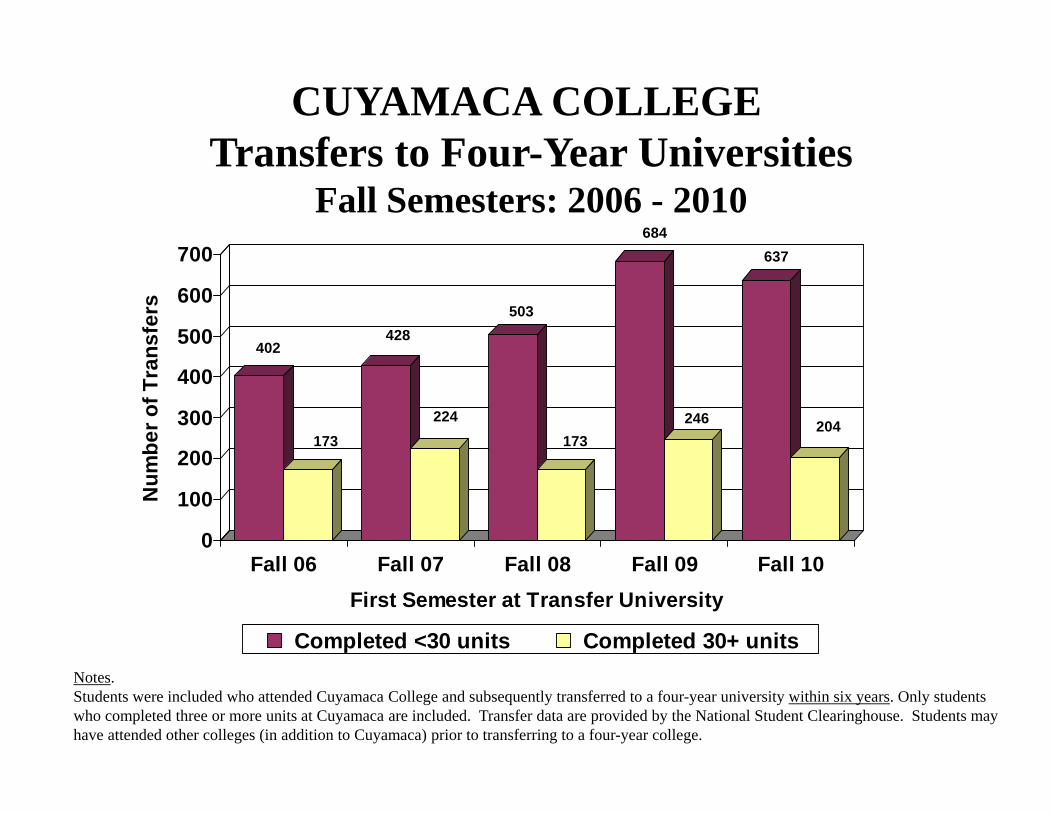
CUYAMACA COLLEGETransfers to Four-Year Universities
Fall Semesters: 2006 - 2010
402
173
428
224
503
173
684
246
637
204
0
100
200
300
400
500
600
700
Num
ber o
f Tra
nsfe
rs
Fall 06 Fall 07 Fall 08 Fall 09 Fall 10First Semester at Transfer University
Completed <30 units Completed 30+ unitsNotes.Students were included who attended Cuyamaca College and subsequently transferred to a four-year university within six years. Only students who completed three or more units at Cuyamaca are included. Transfer data are provided by the National Student Clearinghouse. Students may have attended other colleges (in addition to Cuyamaca) prior to transferring to a four-year college.
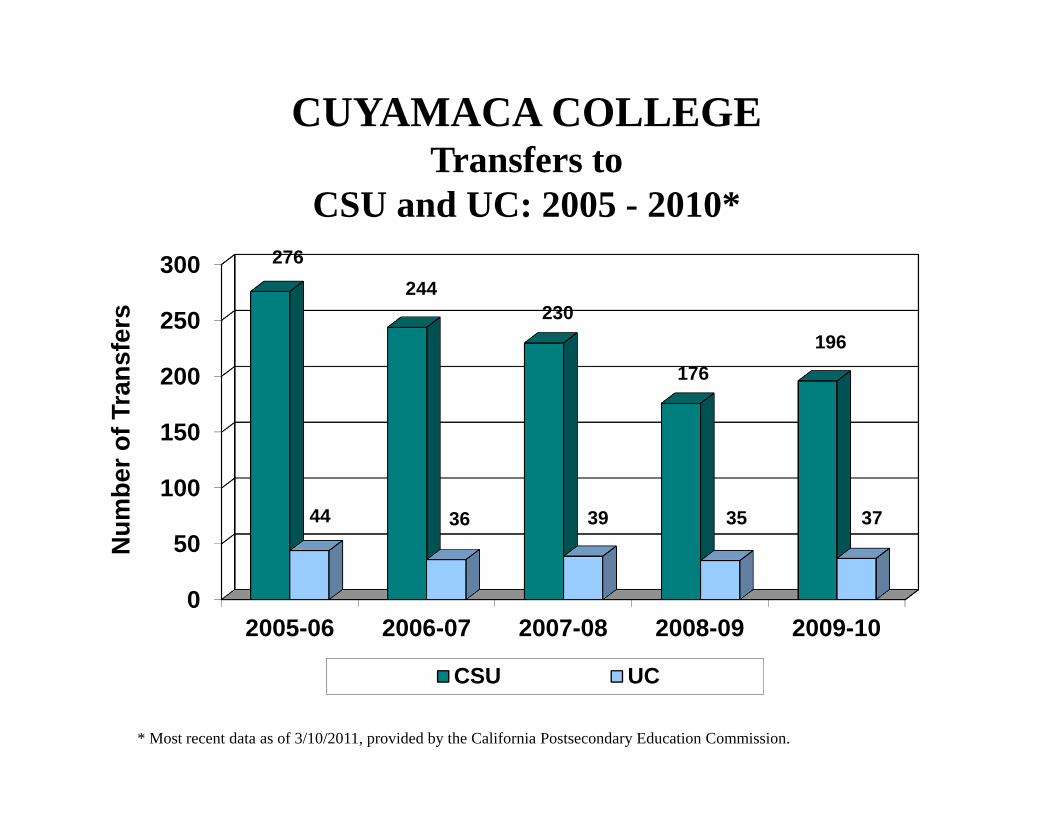
Transfers to CSU and UCCUYAMACA COLLEGE
Transfers toCSU and UC: 2005 - 2010*
0
50
100
150
200
250
300
2005-06 2006-07 2007-08 2008-09 2009-10
276244
230
176196
44 36 39 35 37
Num
ber o
f Tra
nsfe
rs
CSU UC
* Most recent data as of 3/10/2011, provided by the California Postsecondary Education Commission.
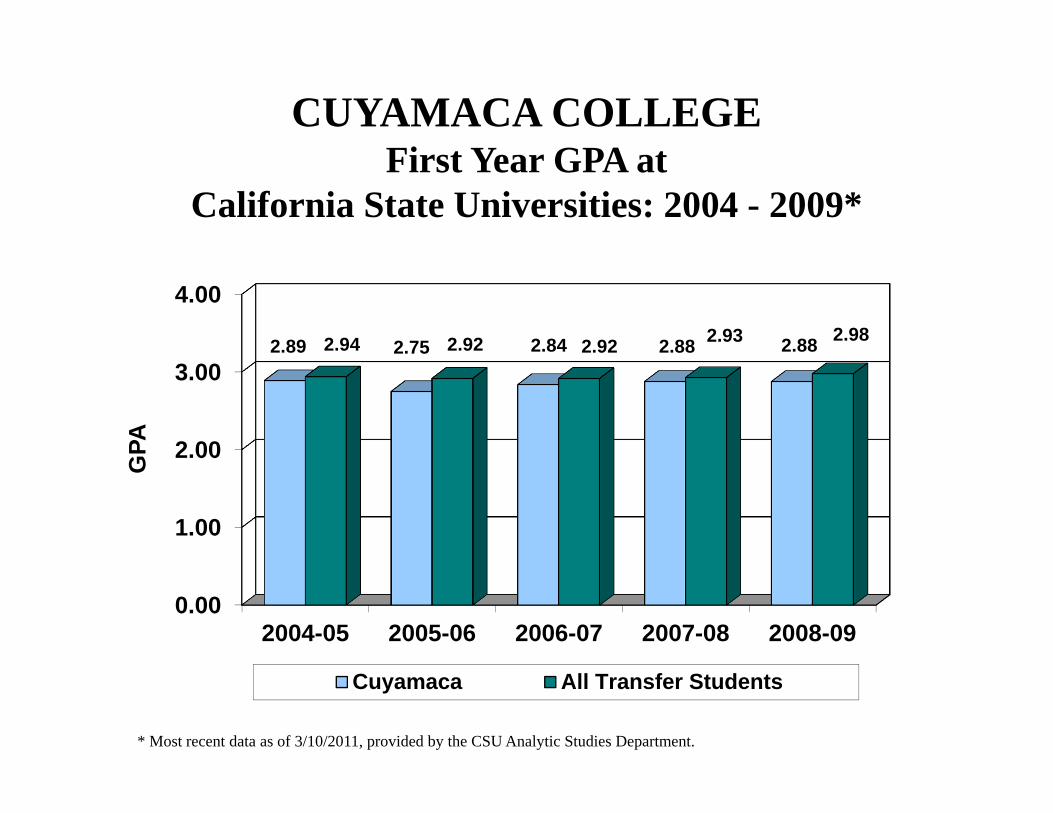
Transfer GPA
0.00
1.00
2.00
3.00
4.00
2004-05 2005-06 2006-07 2007-08 2008-09
2.89 2.75 2.84 2.88 2.882.94 2.92 2.92 2.93 2.98
GPA
Cuyamaca All Transfer Students
CUYAMACA COLLEGEFirst Year GPA at
California State Universities: 2004 - 2009*
* Most recent data as of 3/10/2011, provided by the CSU Analytic Studies Department.
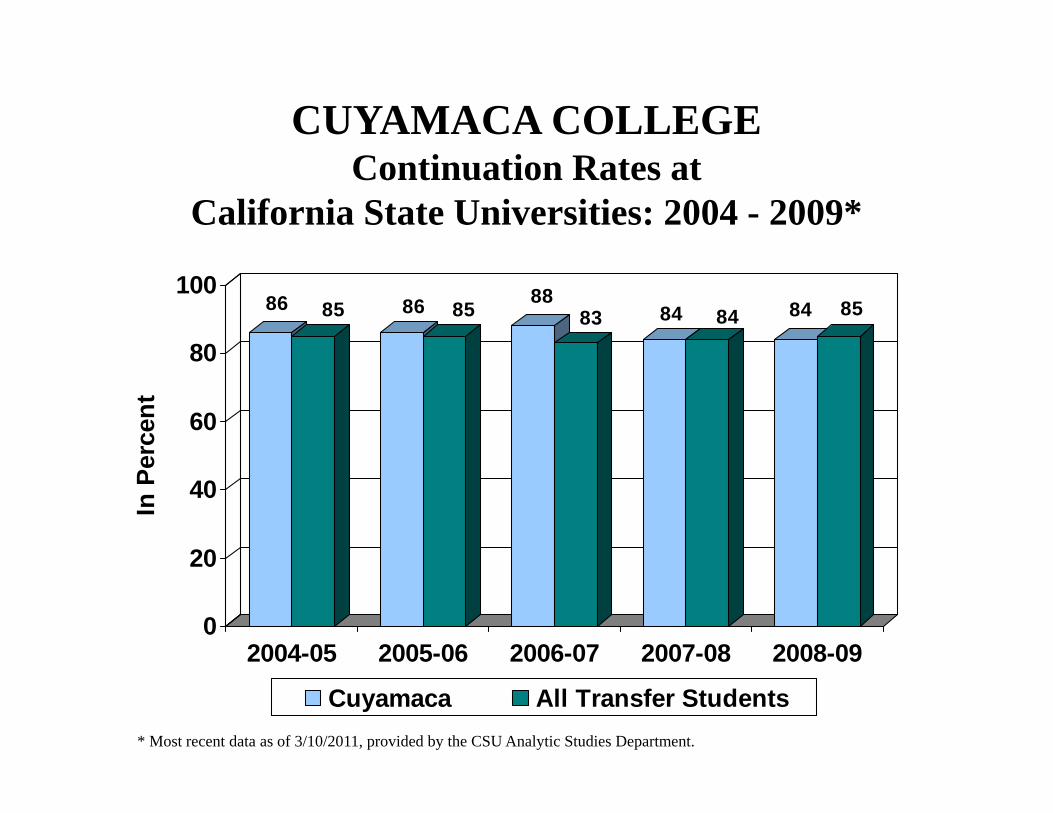
Transfer Continuation Rates
86 85 86 85 8883 84 84 84 85
0
20
40
60
80
100
In P
erce
nt
2004-05 2005-06 2006-07 2007-08 2008-09
Cuyamaca All Transfer Students
CUYAMACA COLLEGEContinuation Rates at
California State Universities: 2004 - 2009*
* Most recent data as of 3/10/2011, provided by the CSU Analytic Studies Department.