Embed Size (px)
Citation preview

Factors a↵ecting the adoption and use of urban air mobility
Christelle Al Haddada,⇤, Emmanouil Chaniotakisb, Anna Straubingerc, Kay Plotnerc, ConstantinosAntonioua
aChair of Transportation Systems Engineering, Technical University of Munich, Arcisstrasse 21, 80333 Munich, GermanybMaaSLab, Energy Institute, University College London, 14 Upper Woburn Place, WC1H0NN London, UK
cBauhaus Luftfahrt e.V., Willy–Messerschmitt–Strasse 1, 82024 Taufkirchen, Germany
Abstract
Technological advances have recently led to the development of urban air mobility (UAM), an alternativetransportation mode with several concepts including vehicles operated by on-demand fully-automated verti-cal take-o↵ and landing aircraft (VTOL) for intra–city passenger transportation. However, despite a growinginterest in UAM, understanding users’ perceptions to it remains limited. This research aims to identify andquantify the factors a↵ecting the adoption and use of UAM, based on relevant tools from the literature,such as recurring factors in studies on aerial vehicle concepts, ground autonomous vehicles, but also accep-tance models, such as the Technology Acceptance Model by Davis et al. (1989). A stated–preference surveywas developed to assess the perception of users in terms of adoption time horizon, including options suchas the first six years of the service’s implementation, “unsure”, and “never”. The obtained results wereevaluated using exploratory factor analyses, and the specification and estimation of suitable discrete choicemodels, multinomial logit models (MNLs) and ordered logit models (OLMs), with adoption time horizonas dependent variable. Findings revealed the importance of safety and trust, a�nity to automation, dataconcerns, social attitude, and socio–demographics for adoption. Factors, such as the value of time savings,the perception of automation costs, and service reliability, were also found to be highly influential. Therewas also an indication that skeptical respondents, i.e. answering “unsure”, had a behavior similar to lateand non-adopters, i.e. adoption time horizon higher than six years or answering “never”. The summarizedresults were represented in an extended Technology Acceptance Model for urban air mobility, and providedinsights for policymakers and industrial stakeholders.
Keywords: urban air mobility, adoption, acceptance, technology acceptance model, perception, statedpreference, exploratory factor analysis, discrete choice modeling
1. Introduction
Shared mobility services are providing users with more e�cient travel options, characterized by lowerdemand for parking spaces, lower vehicle ownership, but also reduced environmental impacts resulting fromlower emissions (Baptista et al., 2014). At the same time, autonomous vehicles promise safe and comfortabletransportation, and most automobile manufacturers are likely to launch fully autonomous vehicles in the5
coming decade (Bimbraw, 2015). This trend has led to a research interest in ground shared autonomousmobility (Fagnant & Kockelman, 2014), and possibly to the exploration of the third dimension: the skyscape.This has been reflected in aerial vehicle concepts for passenger transportation, also called as “urban airmobility” (UAM). The concepts for short–haul passenger air trips are facilitated by technological advances
⇤Corresponding authorEmail addresses: [email protected] (Christelle Al Haddad), [email protected] (Emmanouil
Chaniotakis), [email protected] (Anna Straubinger), [email protected] (KayPlotner), [email protected] (Constantinos Antoniou)
Preprint submitted to Transportation Research Part A; https: // doi. org/ 10. 1016/ j. tra. 2019. 12. 020 January 2, 2020

in terms of battery storage, electrical power transmission and distributed propulsion systems (Shamiyeh10
et al., 2017). The US National Aeronautics and Space Administration (NASA) is developing a framework forthe integration of urban air mobility airspace research with the e↵orts of di↵erent partners and stakeholders(Thipphavong et al., 2018). For instance, Airbus (2018) introduces urban air mobility as the integration ofthe third dimension to urban transport networks, including the on–demand sharing mobility operated byvertical take–o↵ and landing aircraft (VTOL) for intra–city passenger trips, with a long–term vision entailing15
electrical self–piloted VTOLs, such as Vahana and CityAirbus demonstrators, for one or more passengersrespectively. The introduction of urban air mobility, according to Airbus (2017), promises to o↵er a safer,more reliable, and more environmental alternative to alleviate congestion on transport networks. Currently,Voom (an Airbus company) is providing on–demand helicopter bookings in megacities like Mexico City andSao Paulo, laying the ground for further developments in urban air mobility (Airbus, 2018). Uber has also20
introduced air taxi models in their business plans, such as the economic model assuming a four–seat capacity(including the pilot if the vehicle is not self–piloted), for which passengers have the possibility to share theflight and thereby save on the ride cost (Uber Elevate, 2016). Porsche Consulting (2018) defines the processof this service as follows: starting from the first mile (access to the vertiport), followed by the boardingon the vehicle, the flight time (including take–o↵ and landing), the de–boarding, and finally the last mile25
transfer; the service can be booked online and the assumed boarding and de–boarding times are aroundthree minutes each. In this study, Porsche Consulting (2018) presents three e–VTOL concepts with di↵erentcertification times, travel speeds (from 70 to 300 km/h), routes, and purposes (intra– and/or intercity trips),projecting for 2035 a passenger market of around 23 000 aircraft and worth $32 Billion.
Despite di↵erent model definitions, urban air mobility is constrained by many aspects related to regula-30
tions, infrastructure availability, air tra�c control, environmental impacts, but also community acceptance(Vascik, 2017). In terms of infrastructure challenges, Cohen (1996) studied vertiport prototypes to optimizeland use, site selection, and community acceptance and more recently Fadhil (2018) focused on a GIS–basedanalysis for ground infrastructure selection for urban air mobility. In modeling UAM impacts, the serviceimplications on the inhabitants and the changes on the city were evaluated (Straubinger & Verhoef, 2018),35
but also an agent–based simulation and an initial analysis of the service’s performance were conducted(Rothfeld et al., 2018).
To better understand the service demand and to be able to predict it, understanding consumer adoptionis crucial; in other words, if and when users are going to use urban air mobility. For instance, a study fromthe Georgia Institute of Technology designed a survey to collect responses from 2,500 high–income workers40
in di↵erent areas of the US to predict their demand for eVTOL in urban areas, with flights ranging up to90 km (Garrow et al., 2018). Passenger adoption in a UAM environment was also explored using choicemodeling in a case study based in Munich (Fu et al., 2019). Setting the context for the characteristics thatimply the use of VTOL, Antcli↵ et al. (2016) proposes Silicon Valley as an ideal region for early introductionof on–demand civil VTOL operations, mostly due to good weather, high housing prices, high incomes, but45
also number of hyper commuters (those who commute two or more hours per day) who would greatly reducetheir time in congestion (Antcli↵ et al., 2016). In Germany, research on UAM has targeted the city ofIngolstadt as part of the “Urban Air Mobility Initiative”, supported by the European Commission.
Vascik & Hansman (2018) emphasized the significance of noise and altitude levels as areas of concernsfor community acceptance of urban air mobility systems. To the best of the authors’ knowledge, however,50
the acceptance of urban air mobility has not yet been investigated in terms of users’ profiles (not relatedto the service characteristics) outside of a mode choice context, and in relation to adoption time horizon.This paper helps to fill this gap by developing a framework for UAM adoption and use, assuming an on-demand intra–city passenger transportation, operated by fully-automated electric VTOL, integrated withpublic transportation systems, with the possibility to ride-pool (share the ride with other passengers to55
save money). This is based on the development of a novel stated preference survey design with adoptiontime horizon as a dependent variable, aiming to reveal factors a↵ecting adoption of this service. Futuristicscenarios were introduced to evaluate a hypothetical system starting in 2030, aiming to better understandif and when users would adopt them, but also the barriers and opportunities from a behavioral perspective.Accordingly, factors were identified by exploring those found to be significant in the perception of aerial60
vehicle concepts, in technology and automation acceptance models, and a↵ecting automation acceptance in
2

transport. This research contributes to the existing body of literature on the acceptance and adoption ofnew forms of mobility by presenting a novel methodological approach using a non–conventional dependentvariable for ordered logit models: time variable in a scale including a non–ordinal parameter, such as“unsure”, as to the best of the authors’ knowledge these models are mostly used with ordinal scales, such as65
Likert scales, for attitudes and satisfaction. The obtained results are represented in a Technology AcceptanceModel for urban air mobility that could be generalized for disruptive transport technologies. The significantlyidentified factors o↵er a good basis for the investigation of more realistic scenarios in a nearer future, asthey show an aptitude of users towards them.
The remainder of this paper is structured as follows. A literature review is first presented, followed70
by the methods used including the survey design, descriptive analysis and model development, and studylimitations. The data collected and main statistical results are then derived. After that, the developed andestimated models are shown, namely the exploratory factor analyses and discrete choice models. Then, adiscussion of the main survey findings is presented along with the proposed Technology Acceptance Modelfor Disruptive Transport Technologies, and the policy level insights and recommendations. Industrial stake-75
holders could thereby appropriately care for the needs of di↵erent classes of users, while policymakers couldbenefit from these factors by setting guidelines or more stringent regulations if required. Finally, a conclusionis drawn with some recommendations on future relevant work.
2. Literature review
To examine the adoption of a new service, pertinent literature suggests that it is necessary to understand80
the conditions for trusting this service and accepting its operational characteristics. In the case of UAM,this inevitably passes through the investigation of technology and automation acceptance models, and offactors commonly a↵ecting the acceptance of automation in transport. As only a few studies have explicitlyfocused on consumer adoption of urban air mobility, examining studies on community acceptance of otheraerial vehicles or services might be useful despite its limitations.85
2.1. Factors a↵ecting aerial vehicles perception
Recent studies commissioned by NASA investigated market potentials for urban air mobility, focusingon the di↵erent barriers to its implementation, including community acceptance and key factors for itsusers and non–users’ adoption. The study commissioned to Crown Consulting studied the viability of threeUAM use cases in 15 US cities (NASA, 2019): last mile delivery (for packages), air metro (an autonomous90
public transit style commuter system) and air taxi (an autonomous on-demand ridesharing system). Thisstudy revealed that nearly half of all surveyed consumers were potentially comfortable with delivery andUAM use cases. Major concerns presented were safety, privacy, job security, environmental threats andnoise and visual pollution. Moreover, cybersecurity, a↵ordability and willingness to pay were perceived asbarriers to the UAM viability. The study commissioned to Booz Allen Hamilton (NASA, 2018) looked at95
three potential UAM markets (airport shuttle, air taxi and air ambulance) in ten target urban areas, toexplore market size and barriers, understand the potential viability of the use cases, but also the societaland environmental impacts of UAM; this study included a survey, focus groups, and stakeholder interviews.Societal barriers were analyzed by looking at both user and non-user perspectives. Key factors were safety(including passengers’ need for security screening), privacy and noise, preference for piloted aircraft, impact100
of having a flight attendant, cybersecurity, cost and convenience, but also socio–demographics; men (alongwith millennials and younger respondents) were found to be more comfortable and willing to use UAM.
In a stated preference survey based in Munich, Fu et al. (2019) explored transportation mode preferencesin an Urban Air Mobility environment including four alternatives: private car, public transportation, au-tonomous taxi, and autonomous flying taxi (or UAM). The study results indicated that travel time, travel105
cost, and safety might be critical for determining UAM adoption. Socio–demographics were also found ashighly influential in UAM use, as market segments showed that younger individuals as well as older oneswith higher household income are more likely to adopt UAM. Also, trip purpose proved to be significant,with non–commuting being the respondents’ most preferred option.
3

Research on consumer acceptance of unmanned civilian drones identified common concerns among people,110
such as privacy (Wang et al., 2016; Clothier et al., 2015), risks associated with accidents, and securityregarding the recognition of drones used for emergency (Lidynia et al., 2017). Additionally, Chamata (2017)identified social and economic concerns as factors delaying the adoption of civilian drones. According tothe trip purpose, the community acceptance of drones might di↵er (Boucher, 2016). For unmanned aerialvehicles (UAV), MacSween (2003) found that emotional and safety data increased users’ persuasions of UAV115
applications, including commercial, cargo, and passenger transportation. Whereas the above concerns applyto community acceptance of drones, they could be very relevant to consumer adoption of UAM, as they alldiscuss users’ perceptions of unmanned aviation.
A stated preference study by Peeta et al. (2008) investigating the travel propensity towards air taxi ser-vice, defined as very light jet–based on–demand air service (ODAS), predicted the probability of individuals120
of switching from their usual mode of intercity transportation to an on-demand air service (ODAS) given aset of scenarios of travel distance and cost. The adoption of ODAS was found to be highly dependent ontravel distance, service fare, and level of accessibility. Kreimeier & Stumpf (2017) found cost to be crucialin determining consumer adoption in Germany. The market share for thin–haul on–demand air mobilityservices has been estimated as 19% or 235 million trips per year, based on a choice model assuming 0.1125
AC/km costs gap between UAM services and cars; a sensitivity analysis showed that this volume would dropto 24 million for a gap of 0.2 AC/km. This market would be potentially viable for distances above 100 km,with 60% of the market expected for distances between 200 and 400 km (inter–city). Both studies by Peetaet al. (2008) and Kreimeier & Stumpf (2017) presented inter–city applications or thin–haul flights, whichare arguably di↵erent than intra–city application of UAM; however, they still highlighted cost and time as130
significant factors for consumer adoption of on–demand aerial mobility.
2.2. Technology and automation acceptance models
Technology acceptance has long been an area of interest in research with the main purpose of modelinghow people accept and use a technology. Perhaps the most renown technology acceptance model is theTechnology Acceptance Model (TAM) by Davis et al. (1989), developed to investigate technology use of135
information systems, particularly computer technology, in which the correlation between the intention touse and actual usage is measured. The main aim of the model is to present a framework for modeling the useracceptance in terms of factors that influence his or her decision in using the technology. This model is basedon two main constructs: the perceived usefulness (PU) and the perceived ease of use (PEU), where PEUreinforces PU. The former is the extent to which the user believes the technology use would enhance his or her140
job performance, whereas the latter is the degree to which using the technology requires e↵ort. Both factorsdetermine the user attitude towards using the system, which in turn determine the behavioral intention (BI)to use the system, and then the actual system use. This model also includes external variables, which a↵ectthe defined constructs. Based on this model, the Technology Acceptance Model 2 (TAM2) was extended byadding variables grouped into social influence and cognitive processes (Venkatesh & Davis, 2000), impacting145
the perceived usefulness of the technology. Social influence includes subjective norms, voluntariness, image;cognitive processes included job relevance, output quality, and result demonstrability. In TAM2, these mainfactors directly influence user perception (PU and PEU). A further revision extended TAM into the UnifiedTheory of Acceptance and Use of Technology (UTAUT), (Venkatesh et al., 2003), and a later revision intoTAM3 (Venkatesh & Bala, 2008). According to Ghazizadeh et al. (2012), the UTAUT o↵ers a more complete150
account of acceptance in comparison with TAM2. In UTAUT, three constructs directly determine BI:performance expectancy, e↵ort expectancy, and social influence (as defined in TAM2); facilitating conditionsis a fourth construct that directly determines the use behavior. Gender, age, experience, and voluntarinessmoderate the impact of the four constructs. The role of moderating factors (factors impacting adoption andreducing the limitations of the models’ explanatory power) has been found crucial (Sun & Zhang, 2006) in155
technology acceptance models; for instance, the moderating e↵ects of gender and self–e�cacy in the contextof mobile payment adoption (Riad et al., 2014).
To combine constructs from TAM models with those from the Cognitive Engineering literature, Ghaz-izadeh et al. (2012) proposed a framework for automation acceptance model (AAM), by adding two mainconstructs: compatibility (namely task–techhnology compatibility) and trust. The former includes previous160
4
experience with automation, existing work practices, work style, and values; the latter (trust) influences BIdirectly and indirectly through PU and PEU. The model is also reinforced by the feedback mechanisms ofthe di↵erent constructs. Zhang et al. (2019) used structural equation modeling to test hypotheses on theirproposed autonomous vehicles acceptance model, in which initial trust is the most critical factor in promot-ing a positive attitude towards using autonomous vehicles, which along with perceived usefulness determine165
the behavioral intention (to use autonomous vehicles). In this model, initial trust is a↵ected by perceivedusefulness, perceived ease of use, but also two types of risk: the perceived safety risk and the perceivedprivacy risk; initial trust can be improved by enhancing perceived usefulness or by reducing perceived safetyrisk. More recently, a study at the University of St.Gallen in Switzerland developed an adapted TAM forpersonal autonomous mobility, focusing on ground autonomous vehicles (Jenkins et al., 2018). The main170
additions in automation–related models could serve as a motivation for the extension or application of anurban air mobility acceptance model.
2.3. Factors a↵ecting automation acceptance in transport
Social acceptance is a widely researched area in the field of automation, particularly for ground au-tonomous vehicles1. In a study on the trust and acceptance of shared autonomous vehicles (SAE2 level 4),175
Merat et al. (2016) summarized the factors influencing the use of conventional ride–sharing vehicles, but alsothose a↵ecting the acceptance and trust of robotic systems, where trust includes reliability and safety. Choi& Ji (2015) also noted the importance of trust in adopting autonomous vehicles; by conducting a surveyof 552 drivers and analyzing the data using partial least squares, they noted the importance of perceivedlocus of control or situation management for gaining trust. Nees (2016) found that realistic expectations,180
and thereby perceived reliability, are influential in user acceptance of autonomous vehicles. In urban areasin particular, passenger security as part of perceived safety has been noted as crucial for gaining trust (andthereby the implementation and adoption of AVs); especially during the night (Piao et al., 2016). The user’sfeeling of safety could depend on the vehicle’s interior (Merat et al., 2016), but might also be hinderedby cyber–security concerns (Kyriakidis et al., 2015). In Germany, 90% of the respondents of a study on185
autonomous driving stated that they would feel safer, if they were able to intervene or control the vehicleat any time, or at least in case of emergency (Deloitte Analytics Institute, 2017). Control has also beenassociated with feeling more independent (Gaggi, 2017) and proved to positively impact the user’s perceivedease of use (Rodel et al., 2014). Overall, users have to be aware and convinced of the benefits of the newtechnology in order to be able to trust it and therefore use it. Manufacturers’ reputation could be a positive190
factor in gaining this trust (Deloitte Analytics Institute, 2017). Real–life tests for autonomous vehicles and ahigher transparency in demonstrating the new modes could also lead to a higher trust through an increaseduser awareness (Bjørner, 2015; Choi & Ji, 2015).
A higher perception of the benefits of automation could help users gain trust to use the technology, whichis reflected in a higher perceived usefulness. A decrease in congestion and improvement of road safety are195
associated with social benefits (Kaan, 2017) resulting from the reduced number of road crashes. Improvedmobility for mobility–impaired users (Clements & Kockelman, 2017) can be seen as another social benefit.Moreover, the trip purpose could play a role in behavioral intention. Users might be more interested inusing autonomous vehicles for leisure trips, after alcohol consumption (Connected Automated Driving EU,2017), or if the intended trip is unpleasant (Deloitte Analytics Institute, 2017). The perceived advantages200
of automation may lead to a higher perceived usefulness, resulting in a higher user acceptance. Ease ofuse in terms of e↵ort expectancy in the case of autonomous vehicles, or ease of access for dependents ormobility–impaired users (Merat et al., 2016) might influence the intention to use autonomous vehicles. ForUAM, however, the perceived ease of use (PEU) is not related to e↵ort expectancy or driver intervention,like in the case of ground AVs, as users are not expected at any time to take control of the air vehicle;205
instead PEU could be translated to simply the booking and boarding processes, since these are the onlytasks expected from the users.
1For practical reasons, the term “autonomous vehicles” will be used to refer to autonomous ground vehicles, and abbreviatedwith AV. Otherwise, the term urban air mobility or on–demand air mobility will be used to refer to autonomous air vehicles.
2Society of Automotive Engineers
5

Attributes, such as time (Krueger et al., 2016) and costs (Merat et al., 2016), were found to be highlyinfluential in the acceptance of autonomous vehicles. Comfort (Rychel, 2016), vehicle cleanliness (Meratet al., 2016), and availability in di↵erent weather conditions (Merat et al., 2016) proved to impact the210
intention to use; the latter may also be influenced by social behavior, including the willingness to sharethe ride with strangers (Merat et al., 2016) and the perceived fun of driving or driving enjoyment (Bjørner,2015). Social attitudes can also include concerns from the loss of jobs induced by automation (DeloitteAnalytics Institute, 2017), concerns regarding terrorism, crime, or cyber–security in general, data concerns,such as data protection, data use, or privacy in broader terms (Kyriakidis et al., 2015), but also cultural215
values since acceptance and adoption vary globally. In industrialized countries, for example, automatedvehicles might face higher skepticism compared to emerging countries like India or China (Rychel, 2016).As in the former accident rates are lower, due to higher measures of safety, people might be more reluctanttowards automation, as they are not necessarily convinced of its benefits. Also, in more developed countries,users are less likely to be comfortable with their data being shared or used (Kyriakidis et al., 2015).220
Socio–demographic factors were mentioned in several studies focusing on automation perception (Rodelet al., 2014; Kyriakidis et al., 2015; Payre et al., 2014). Women were often found to have a lower intention touse autonomous vehicles, compared to their male counterparts (Hohenberger et al., 2016); in contrast, youngindividuals (Deloitte Analytics Institute, 2017) and individuals with multimodal travel patterns (Kruegeret al., 2016) were found to be more likely to adopt shared autonomous vehicles. Similarly, technology225
awareness was a positive impact on autonomous vehicles acceptance; this includes, for instance, havingheard of Google cars (Bansal et al., 2016), autonomous vehicles (Schoettle & Sivak, 2014), and/or previousexperience with advanced driver–assistance systems (ADAS).
3. Methods
3.1. Survey design230
As the service in question is not yet operational and can not be observed or used, a Stated Preference (SP)survey was designed to identify the most influential factors in UAM’s adoption time horizon. The surveywas structured in four parts, with a total of 31 questions (or question groups3). The study particularlyfocused on the Munich region, and therefore the survey was available in both languages: English (EN) andGerman (DE).235
The first and last parts of the survey targeted respondents’ travel behavior and socio–demographics,respectively. In the first part, respondents were asked about their commute behavior, their satisfaction withthe public transportation system of their region, and their attitudes towards automated systems (enjoyment,trust, perceived usefulness, and previous experience with automation). As these attitudes are commonlyfound in technology acceptance and use, but are rather di�cult to measure directly, they were assessed240
through (five–point) Likert scale agreement statements (Likert, 1932), with options ranging from “stronglydisagree” to “strongly agree”; answers were verbally labelled and midpoints (“neither disagree nor agree”used for attitude measures) were used for attitude measures, as suggested by Dolnicar (2013). Thesestatements included: “I enjoy interacting with automated systems, such as Siri (Apple) or Alexa (Amazon)”,“I trust such automated systems”, “I think driver assistance systems, such as adaptive cruise control, lane245
keeping assistance, or other advanced systems, are useful”, “I have used (in my own car or someone else’s)such advanced driver-assistance systems”. Socio–demographic questions included age, gender, householdsize, disability in household, education level, main occupation, household income, and current residencelocation (city and country), with a “prefer not to answer” option for these. As stated preference studiesare susceptible to anchoring bias (McFadden, 2001), socio–demographic questions were placed at the end of250
the survey, so that people would not be biased in answering them according to what they think would beconsistent with their choices. This can also overcome the stereotype threat (Steele, 1995) in which peopletry to avoid the confirmation of any stereotype they feel threatened by.
3A question consisted sometimes of a matrix including several agreement statements, focusing on one attribute for instance.
6

In the second part, UAM was introduced by presenting some of its properties found in the pertinentliterature (presented in Section 1). The assumptions for the vehicle design were mostly based on the economic255
model by Uber Elevate (2018) who proposed a vehicle with four seats. The process was defined as in PorscheConsulting (2018), starting with the first mile, followed by boarding, in–vehicle flight including take–o↵ andlanding, de–boarding, and finally the last mile; in this study, both boarding and de–boarding processes wereestimated at around three minutes, with flight ranges of 20 to 50 km (for intra–city). In particular, for ourstudy, an example of 30 km was given for the transfer from Munich’s airport to its city center (Marienplatz).260
Based on the above studies, the system was defined as a future mobility service provided by fully–automated electrically powered vertical take–o↵ and landing aircraft (eVTOL) with four–seat capacity (in-cluding one wheelchair seat), operating at a speed of around 150 km/h. The service would be on–demand,booked online (through the service’s app or website), and passengers would have the possibility to book forup to four passengers or to ride–pool with other passengers and save money. The required boarding time was265
set to be 5 minutes prior to take–o↵, with access and egress through vertiports (helipad–like infrastructures)that would be integrated with the existing public transportation system.
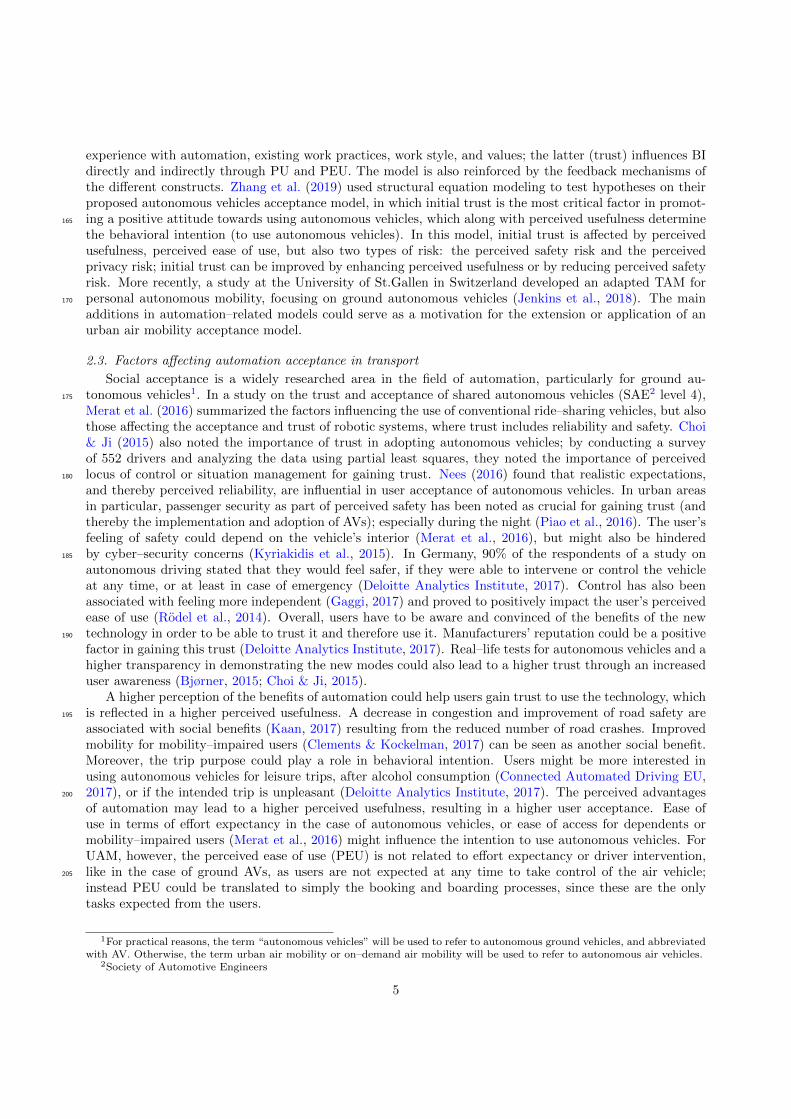
Two scenarios were given to present realistic attributes of the service (trip duration and fare), startinghypothetically in 2030, with taxi as a benchmark. These targeted the region of Munich, by presenting twotrips where public transportation would need more than an hour with a necessary transfer in the center,270
with intra–city urban ranges of 20 and 30 km (for the second and first examples respectively). Other modeswere not presented as the aim of the survey was to understand the user adoption and not to conduct a modechoice study; scenarios therefore aimed to familiarize respondents with the system. For UAM, the accesstime was given as the combination of travel time to the nearest vertiport and an average waiting time offive minutes (assuming a service integrated with public transportation and a 10–min frequency4). In–vehicle275
travel times (including vehicle take–o↵ and landing) were based on a travel speed approximation of 150 km/hand the direct distance between the origins and destinations. Boarding time was approximated as the sum ofboth boarding and de–boarding times, assumed to be 5 minutes in total. On the other hand, taxi attributeswere based on tra�c conditions and a waiting time of five minutes was assumed for taxi; service scenariosare presented in Figure 1. Following this introduction, respondents were first asked to rank the given factors280
they believed to be the most important for adopting and using UAM. These were “booking experience”,“on-time performance (reliability)”, “operation characteristics (availability/frequency of service)”, “processof boarding”, “safety”, “trip cost”, “trip purpose”, “trip duration”, “vehicle characteristics (comfort andcleanliness)”. Then, respondents’ perceived usefulness of the service was assessed in a Likert-scale questionwith options ranging from “not at all useful” to “extremely useful”.285
In this second part of the survey, latent constructs a↵ecting automation acceptance were investigated,in the form of five–point Likert scale agreement statements (ranging from “strongly disagree” to “stronglyagree”), such as data concerns, trust and safety, cost perception, and the value of travel time savings.Statements on data concerns were: “I am worried that my data goes to a third party”, “My fear of cyber–security could prevent me from using UAM”, “I am concerned about the loss of jobs induced by automation”;290
on trust and safety through UAM’s operation characteristics: “Service reliability (on-time performance) isa very important feature for trusting UAM”, “In order for me to feel safe, I would expect UAM’s vehiclesto be equipped with surveillance cameras”, “I should be able to talk to an operator on the ground at anytime”, “The operator should be able to override the system and remotely control the UAM’s vehicles in caseof emergency”, “The service provider’s reputation is very important to gain trust to use UAM”. Statements295
on cost perceptions included the following: “I would be willing to use the service, as long as its price isin the same range as that of a taxi”, “I would first think about cost when deciding whether or not to useUAM”, “I think UAM’s service costs provided in the scenarios are reasonable”. Finally, statements on timesavings were as follows: “Travel time saving is a key factor in deciding whether or not to use UAM”, “5-mintravel time saving is important”, “10-min travel time saving is important”, “20-min travel time saving is300
important”.Latent statements were followed by the stated preference question on adoption time horizon: “When
are you most likely going to use UAM?”. Alternatives included options ranking from the first year of
4Both access and egress time were based on assumptions of a 10–min frequency of the service.
7
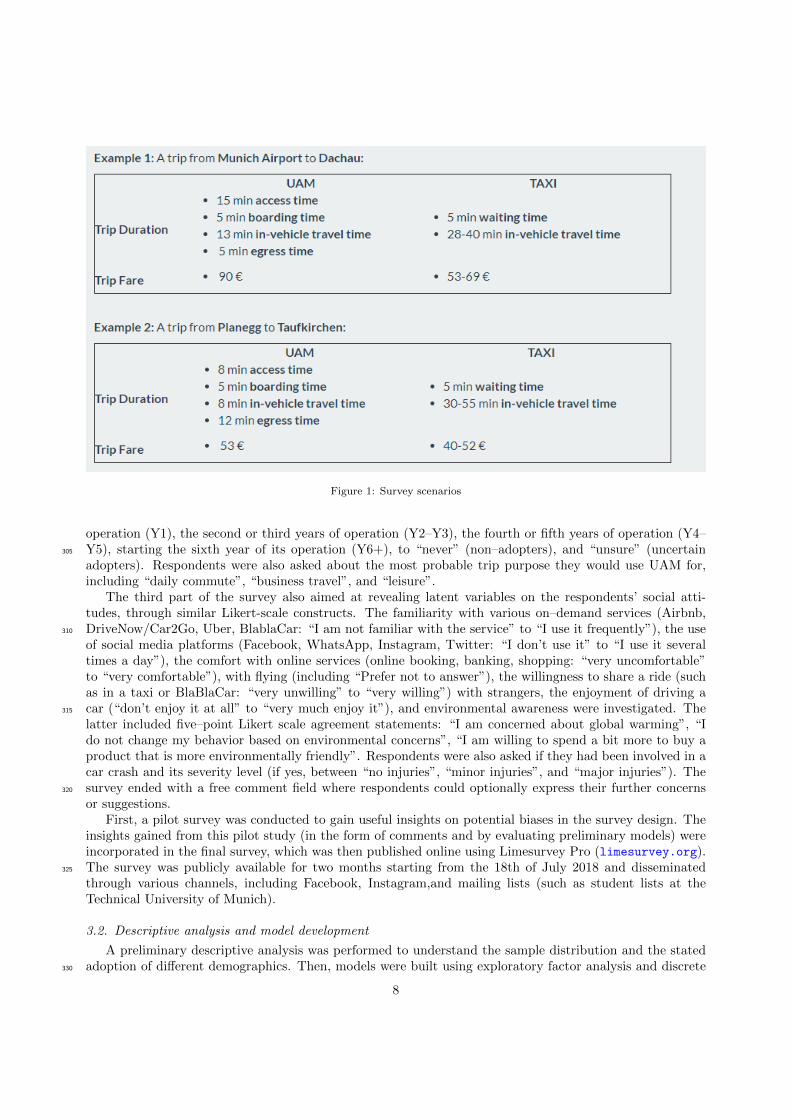
Figure 1: Survey scenarios
operation (Y1), the second or third years of operation (Y2–Y3), the fourth or fifth years of operation (Y4–Y5), starting the sixth year of its operation (Y6+), to “never” (non–adopters), and “unsure” (uncertain305
adopters). Respondents were also asked about the most probable trip purpose they would use UAM for,including “daily commute”, “business travel”, and “leisure”.
The third part of the survey also aimed at revealing latent variables on the respondents’ social atti-tudes, through similar Likert-scale constructs. The familiarity with various on–demand services (Airbnb,DriveNow/Car2Go, Uber, BlablaCar: “I am not familiar with the service” to “I use it frequently”), the use310
of social media platforms (Facebook, WhatsApp, Instagram, Twitter: “I don’t use it” to “I use it severaltimes a day”), the comfort with online services (online booking, banking, shopping: “very uncomfortable”to “very comfortable”), with flying (including “Prefer not to answer”), the willingness to share a ride (suchas in a taxi or BlaBlaCar: “very unwilling” to “very willing”) with strangers, the enjoyment of driving acar (“don’t enjoy it at all” to “very much enjoy it”), and environmental awareness were investigated. The315
latter included five–point Likert scale agreement statements: “I am concerned about global warming”, “Ido not change my behavior based on environmental concerns”, “I am willing to spend a bit more to buy aproduct that is more environmentally friendly”. Respondents were also asked if they had been involved in acar crash and its severity level (if yes, between “no injuries”, “minor injuries”, and “major injuries”). Thesurvey ended with a free comment field where respondents could optionally express their further concerns320
or suggestions.First, a pilot survey was conducted to gain useful insights on potential biases in the survey design. The
insights gained from this pilot study (in the form of comments and by evaluating preliminary models) wereincorporated in the final survey, which was then published online using Limesurvey Pro (limesurvey.org).The survey was publicly available for two months starting from the 18th of July 2018 and disseminated325
through various channels, including Facebook, Instagram,and mailing lists (such as student lists at theTechnical University of Munich).
3.2. Descriptive analysis and model development
A preliminary descriptive analysis was performed to understand the sample distribution and the statedadoption of di↵erent demographics. Then, models were built using exploratory factor analysis and discrete330
8

choice modeling (namely multinomial logit models and ordered logit models).The exploratory factor analysis (EFA) was applied to the second and third parts of the survey pertaining
to the respondents’ perceptions (mostly of UAM automation) and social behaviors, respectively. Thismethod was used to primarily identify latent constructs behind the variables and secondarily to reduce thedata dimensionality. The variables mainly used were those with the same scale, such as five–point Likert335
scale agreement statements. In this study, EFA was applied using the maximum likelihood estimation (MLE)as a factor extraction method: factanal in the R statistical computing software (R Core Team, 2019). Thesuggested number of factors was obtained using the Kaiser–Guttman method (Yeomans & Golder, 1982).Also, after trying di↵erent rotations, varimax orthogonal rotation was used (Kaiser, 1958). Factor scoreswere computed using factor.scores and the “component” method, a weighted sum of the factor loads.340
As the answer options of the survey are discrete categories of adoption time horizon, discrete choicemodeling was applied to identify and analyze the factors significantly a↵ecting adoption (independent vari-ables). Using pythonbiogeme (Bierlaire, 2003), both multinomial and ordered logit models were specifiedand estimated. As the outcomes for “Y6+” and “never” represented very small percentages of the samplesize (less than 5%), both categories were ultimately merged. Starting from multinomial logit models and345
based on the inputs from the factor analysis, models were developed in a stepwise fashion, first backward(from saturated models), where only variables of high significance (95% or 90 % confidence interval) werekept, then forward (from empty models), where significant variables were added one after the other, usingsimilar confidence levels. Both generic and alternative specific models were developed, where independentvariables were specific to the di↵erent outcomes. Hypothesis testing was used in case some variables had350
similar estimates in order to test if merging them into generic variables would improve the overall model.Also, models were compared against each other by performing a log–likelihood test, and by assessing thevalues of the statistical parameters AIC and BIC. After assessing the results of the multinomial logit mod-els (MNLs), ordered logit models (OLMs) were proposed by initially specifying models with variables thatshowed patterns across the outcomes (adoption time horizon), then testing them for significance like in the355
MNLs. After testing the model performance, the late adopters (Y6) and non–adopters (never) were mergedin the proposed OLM. Despite the limitations of OLMs for the non–ordinal scale, these were used for testingthe possible order of the outcomes, mostly for “unsure” respondents.
3.3. Study limitations
The convenience sample resulting from the online dissemination of the survey is a limitation of the360
sampling approach, might influence the results, and may potentially lead to a lower representativeness ofthe population. To overcome this, the authors conducted statistical tests to test the significance of attitudesacross demographics; for instance gender, or language. These were then taken into consideration for themodel development. Moreover, the assumption that factors used for the factor analysis are uncorrelated issubject to limitations; Fabrigar et al. (1999) advise instead the use of oblique correlations, and Mokhtarian365
et al. (2009) use it in their study to reveal correlations among factors.Since this is a Stated Preference (SP) survey, some statements might be biased. Particularly, attitude
statements may induce some prompting due to their formulation, as they lead to respondents’ tendency toagree, also known as the acquiescence bias. According to Baumgartner & Steenkamp (2001), this responsebias is a threat to the validity of the questionnaire results. To overcome this, these statements were controlled370
for their quality, as discussed in Section 4.Finally, most factors in our study are perception variables, only related to respondents’ attitudes and
not to the service attributes, which might a↵ect the dataset variability.
4. Data collection and results
The survey generated 221 responses, with most respondents residing in Europe (181 respondents), par-375
ticularly in Germany (138 or about 60% of the sample size), and specifically the region of Munich (97respondents). The rest were scattered outside Europe between the US, Latin America, and the MiddleEast. Due to its high concentration and significance, the group of Munich was considered as a significant
9

subsample. It should be noted that the location only represents the place of residence, and not the place oforigin. The average completion time was 13.6 min with a standard deviation of 6.5 min. Overall, a good380
representation of gender, occupation, household size, and household incomes was observed, as well as anoverrepresentation of the age category 25–34 and of higher levels of education, possibly due to the onlinemethod of survey distribution. Also, public transportation as a main commute mode was overrepresentedin the Munich subsample. In all cases, missing values (representing less than 5% of the sample size) wererecoded using mean or median values (Tabachnick et al., 2007). The summary statistics of the entire sam-385
ple and the major subsample (Munich) are presented (before further processing) in Table 1, benchmarkedagainst the latest Munich Census for reference (Statistische Amter des Bundes und der Lander, 2014).
Among the 221 respondents, 36.65% stated that they would adopt UAM in the second or third year ofits implementation, followed by 22.17% claiming an adoption during its first year, 14.03% during its fourthand fifth year, 2.71% starting its sixth year, and 3.17% stating that they would never adopt the service.390
Moreover, 21.27% of the respondents expressed uncertainty (“unsure”) on their adoption time horizon ofUAM. The analysis of the results highlighted the importance of safety for UAM adoption as the majorityof respondents (more than 50 %) ranked it as the most important factor in their intention to adopt UAM.Also, a strong indication towards the importance of UAM costs (second factor), trip duration (third factor),on–time reliability (fourth factor), and operation characteristics (fifth factor) was given. The suggested395
ranking was obtained by extracting for each rank (e.g.: first rank, second rank, etc.) the factor with thehighest percentage of respondents. For the second to fifth ranks, the mentioned factors had a share of about20 % of the respondents. On the other hand, vehicle characteristics, boarding process, booking experience,and trip purpose were ranked as sixth to ninth factor by most of the respondents, gathering each also about20 % of the respondents.400
10

Table 1: Summary of sample and subsample characteristics
Total sample(N=221)
Munich subsample(N=97)
Munich Census(2011)
Gender Female 43.0% 51.6% 48.6%Male 56.1% 47.4% 51.4%Prefer not to an-swer
0.9% 1.0% -
Agea 0-17 0.5% - -18-24 19.5% 23.7% 9.2%25-34 45.7% 56.7% 21.7%35-44 19.0% 16.5% 22.4%45-54 9.5% 16.5% 22.2%55-64 5.0% - 16.8%65+ 0.9% - 7.7%
Main occupation Full–time employed 57.9% 46% 87.1%Part-time employed 9.1% 8%Student 28.1% 42% 2.9%Unemployed 0.5% 1% 2.2%Self-employed 2.3% 1% 7.8%Retired 0.9% -Prefer not to an-swer
1.4% 1% -
Education High School 8.6% 6% 34.1%Apprenticeship 2.7% 1% 40.7%Bachelor 26.7% 26% 22.7%Master 47.5% 52%Doctorate 13.1% 13% 2.5%Prefer not to an-swer
1.4% 2% -
Household incomeb <500 AC 7.2% 13.4 %500-1000 AC 8.6% 13.4%1000-2000 AC 11.3% 10.3%2000-3000 AC 14.0% 16.5%3000-4000 AC 10.9% 6.2%4000-5000 AC 10.9% 7.2%5000-6000 AC 4.9% 3.1%6000-7000 AC 5.4% 30.9%>7000 AC 6.3% 21.7%Prefer not to an-swer
20.4% 3.1%
Main commute c Car as a driver 33.9% 14.0% 31.0%mode Car as a passenger 1.8% -
Public transporta-tion
40.7% 63.0% 28.8%
Bike 15.4% 20.0% 14.7%Walk 5.9% 1.0% 25.5%Other 2.3% 2.0% -
a Census values for age are based on di↵erent age categories and are therefore best-fit values for the survey classes.b There are no census values for income levels; however the average disposable household income for the year 2016 is4220 AC (Euromonitor International, 2017).
c The given values are trip distribution percentages (MVG 2011).
11

A preliminary analysis of the attitudes of di↵erent demographics showed the importance of these factorsfor the adoption intention. This was mostly observable for gender, main occupation, education, surveylanguage, and previous crashes, as observed in Figure 2. Females were found to have a lower tendency ofbeing immediate adopters (Y1), and a higher of being “unsure” about their adoption time; as expressed bythe 12% of female respondents for Y1 compared to 30% for their male counterparts. For the main occupation,405
respondents working full–time expressed a higher immediate adoption intention (30%) compared with part–time employees (0%), or students (14%), which can be due to higher income levels and/or higher value oftime. The survey language also seemed to impact stated adoption. Respondents who filled the survey inEnglish showed a higher interest in early adoption (31%) and less skepticism (12%) compared to those fillingthe survey in German. Respondents with previous crashes and no injuries expressed a higher intention410
of immediate adoption (26%) compared to those who had injuries. Respondents with di↵erent educationlevels also stated di↵erent preferences: those with lower levels of education (bachelor or lower) expressedless uncertainty (19%) compared to the ones with higher levels of education (doctorate). On the other hand,the latter group showed a higher interest in immediate adoption (26%) compared to the former (18%). Ofcourse some of these comparisons are limited to their statistical significance, since the compared outcomes415
were not well represented for all categories, such as occupation, crash history, and education levels. On theother hand, gender and survey language were rather well distributed.
Education Gender Language Occupation Previous crashes
Bacheloror lower(N=84)
Master(N=105)
Doctorate(N=29)
Female(N=97)
Male(N=124)
English(N=128)
German(N=93)
Student(N=62)
Part−time(N=20)
Full−time(N=128)
Yes(injuries)(N=47)
Yes(no injuries)
(N=89)
No(N=83)
0
25
50
75
100
Perc
enta
ge a
dopt
ion
(%)
Stated time adoption Y1 Y2−Y3 Y4−Y5 Y6+ Never Unsure
Figure 2: UAM adoption by di↵erent demographics
The exploration of respondents’ attitudes, based on the Likert scale statements, showed that gender andsurvey language were the demographics where most di↵erences were observed. As presented in Figure 3,females seemed to give a higher level of importance to the loss of jobs due to automation as well as to safety;420
the latter is demonstrated by higher safety camera expectations and requirements for an operator on theground and to override the vehicle in case of emergency. On the other hand, male respondents seemed tohave more flying comfort than their female counterparts. These findings are statistically significant (errorbars in Figure 3 drawn based on the standard error) and compatible with those from the literature; inparticular the study by Hohenberger et al. (2016), where women were found to have a lower intention to use425
autonomous vehicles, possibly due to the e↵ect of gender on anxiety, rather than on pleasure.Di↵erent attitudes were observed based on the survey language. Notably, the respondents filling the
survey in English expressed a higher trust in automation, enjoyment of automation, perceived usefulness ofADAS, and of UAM, compared to those filling the survey in German. A similar, less remarkable, pattern was
12
observed for respondents residing in Munich as opposed to those who don’t. This finding parallels the results430
of the study on Autonomous Vehicles Readiness, where Germany was ranked 12th in consumer acceptance,despite being third in technology and innovation (KPMG, 2018): it can be assumed that language reflectsbetter the culture than the place of residence.
Expect in−vehicle safety cameras
Flying comfort
Loss of job concerns
Operator on ground
Operator overrides in emergency
0 1 2 3 4Mean value on a 5−point Likert scale
All significant to at least 97% confidence level
Gender Female Male
(a)
Enjoy automation
Fear of cyber−security
Perceived ADAS usefulness
Perceived UAM usefulness
Trust automation
0 1 2 3 4Mean value on a 5−point Likert scale
All significant to at least 99.9% confidence level, except for cyber−security with a 94% confidence
Survey language English German
(b)
Figure 3: Attitudes towards di↵erent statements: (a) by gender; and (b) by language
Attitude statements from the second and third parts of the survey (see Section 3.1) were also analyzedto assess the quality of the responses. After a careful examination of the distribution of the answers across435
the Likert–scale (“strongly disagree” to “strongly agree”), two statements were identified as prompted. Thiswas observed for the agreement statements on the necessity of an operator to override the vehicle in caseof emergency, and on the importance of the service provider’s reputation to gain trust to use UAM. Forboth statements, the respondents’ tendency to agree, also known as the acquiescence bias, was noted, asmentioned in the study limitations (see Section 3.3). Accordingly, both statements were removed from the440
subsequent analysis and model specifications.Finally, a qualitative analysis of the comments left at the end of the survey showed additional concerns
of the respondents. The biggest concern was expressed by eight respondents on environmental impacts,including concerns from noise and visual pollution (four respondents for each). For the latter, the respondentsexpressed the disturbance they would feel from being watched from above (“Not in My Backyard” e↵ect,445
as described by one respondent). Two respondents expressed their concerns about privacy (concerning datasharing) and safety (one of them stated the desire to wait for an incident–free operation of UAM). Moreover,three respondents expressed their concern of economic impacts of UAM; one of them was concerned that theservice would target a niche market. Also, two respondents expressed their desire for a system integration ofUAM (with the existing and future transportation systems), one respondent was interested in the information450
sharing inside the vehicle, another for a high frequency service with on–demand availability, and finally onemore about the use case or purpose of UAM.
13

5. Model development and estimation
This section describes the model development, starting from exploratory factor analysis and continuingwith the developed discrete choice models.455
5.1. Exploratory factor analysis
The outcome of the exploratory factor analysis for respondents’ perceptions on automation is presentedin Table 2. Four factors were eventually extracted, explaining a cumulative variance of 52% of the totalvariance. As observed in Table 2, each factor explains more than 10% of the total variance (with the exceptionof one that explains 9%5), which is considered acceptable according to Costello & Osborne (2005). This is460
compatible with the work of several researchers who used factor analysis to understand users’ perceptionsof transportation systems (Tyrinopoulos & Antoniou, 2008; Efthymiou et al., 2013), reducing the initialindicators to fewer factors each explaining more than 10% of the total variance (with one exception atmost), with a cumulative total variance ranging roughly from an average of 46% to 50%. Loadings lowerthan 0.4 are not shown to simplify the table.465
By looking at the latent meaning that these variables might have, the factors are interpreted as follows.The value of time savings is a cluster of the three variables on the perception of saving 5, 10, and 20 minof travel time. The enjoyment of automation6, trust of automation, and perceived usefulness of UAM areinterpreted as the a�nity to automation. The fear of cyber–security, the concern of data being shared to athird party, and the concern of loss of jobs due to automation are grouped under data and ethical concerns.470
Finally, the need for an operator on the ground, and of in–vehicle safety cameras are interpreted as safetyconcerns.
Table 2: Factor analysis on respondents’ perceptions
Loadings Factor 1 Factor 2 Factor 3 Factor 4
Travel time savings 5min 0.78Travel time savings 10min 0.98Travel time savings 20min 0.59Enjoy automation 0.80Trust automation 0.75UAM is useful 0.51Fear of cyber–security 0.70Fear that data goes to a third party 0.53Loss of job concerns 0.49Operator on the ground 0.67In–vehicle safety cameras 0.50
Sum of square of loadings 2.01 1.66 1.14 0.96Proportion variance 0.18 0.15 0.10 0.09Cumulative variance 0.18 0.33 0.44 0.52
Factor interpretationValue of
time savingsA�nity toautomation
Data andethical concerns
Safetyconcerns
For respondents’ social attitudes, four factors were extracted, explaining a cumulative variance of 55% ofthe total variance, presented in Table 3. Variables pertaining to social attitudes were grouped under a�nityto online services, environmental awareness, a�nity to social media, and a�nity to sharing, with all factors475
explaining at least 10% of the a variance and therefore also considered acceptable (Costello & Osborne,2005).
5This factor was retained due to its high explanatory power and interpretability.6Enjoyment of automated systems like Alexa or Siri
14

Table 3: Factor analysis on respondents’ social attitudes and behaviors
Loadings Factor 1 Factor 2 Factor 3 Factor 4
Online booking 0.81Online banking 0.86Online shopping 0.65Concerned about global warming 0.99Spend on environmental products 0.5Instagram 0.99Facebook 0.43BlaBlaCar 0.67Airbnb 0.5Willingness to share 0.5
Sum of square of loadings 1.93 1.28 1.24 1.06Proportion variance 0.19 0.13 0.12 0.11Cumulative variance 0.19 0.32 0.45 0.55
Factor interpretationA�nity to
online servicesEnvironmental
awarenessA�nity tosocial media
A�nity tosharing
The factor analysis interpretation (Tables 1 and 2) is similar to the one on shoppers’ attitudes byMokhtarian et al. (2009), where a factor analysis was applied to 42 attitude agreement statements (five-point Likert Scale), reducing them to 13: shopping enjoyment, time consciousness, trust, trendsetting,480
pro-environment, technology; these are comparable to the presented factors: a�nity to automation, timesavings, safety concerns, a�nity to online services and social media, environmental awareness, and a�nityto automation and social media, respectively.
5.2. Multinomial logit model
Aiming at a better understanding with regards to the factors which a↵ect adoption, a multinomial logit485
model was estimated; the model specification and estimation results are shown in Table 4. The coe�cientestimates were in general reasonable in sign and magnitude and consistent with prior expectations; most ofthem significant at least to the 95% confidence level with a t–value higher than 1.96, with a couple beingsignificant to the 90% with a t–value higher than 1.65. For instance, estimates for the a�nity to automationwere highly significant and positive mostly for early adoption (estimate of 1.15 for Y1), but also (to a lesser490
extent) for later years (estimate of 0.79 for Y2–Y5). For most of the respondents (Y1–Y5 and unsure),highly significant and positive impacts were also noted for the a�nity to social media and to WhatsApp(estimate coe�cients of 0.50 and 0.53, respectively); the same impact was observed for full–time employment(estimate of 0.63 for Y1–Y3). Cost factors also had a significant positive impact on adoption. Scaling UAMprices to taxis’ highly contributed to immediate adoption (estimate of 0.32 for Y1). On the other hand,495
higher data and ethical concerns (including fear of cyber–security, concerns of data being passed to thirdparties, and loss of job concerns) had influential negative impacts on early adoption (-0.24 for Y1). Previouscrash experiences also had a negative impact on adoption in general, with lesser impacts on later adoption(estimate of -2.42 for Y1, compared to -1.89 for Y2–Y5). Safety concerns (including the importance of havingan operator on the ground at any time and of in–vehicle safety cameras) also negatively a↵ected adoption500
(estimate of -0.34) with a high influence on immediate adoption (Y1) and later adoption (Y4–Y5). Femalerespondents were in general less likely than their male counterparts to adopt UAM (estimate of -2.94 for allyears) and highly educated respondents (doctorate level or higher) less likely to adopt it in its early years(estimate of -1.43 for Y2–Y3). Moreover, German as a survey language (compared to English) was highlycorrelated with uncertainty (estimate of 1.42). Furthermore, higher income level respondents were less likely505
to be late adopters of UAM (estimate of -1.42 for Y4–Y5). The perception of travel time importance wasalso decisive in UAM adoption for the second and third years (estimate of 0.28 for Y2–Y3) and the valueof time savings (including the perception of each of 5,10, and 20 minutes of time savings) for later adoption
15

(estimate of 0.33 for Y4–Y5). Finally, public transport commuters were more likely to adopt UAM duringits later years (estimate of 0.85 for Y4–Y5) and the alternative–specific constant for respondents stating a510
very late or non–adoption (Y6+, Never) was positive and highly significant (estimate of 6.73).
Table 4: Multinomial logit model results (N=221)
Parameters estimate std. error t–stat
ASC Y6+ or never 6.73 2.20 3.06A�nity to automation Y1 1.15 0.32 3.59A�nity to automation Y2–Y5 and unsure 0.79 0.31 2.60Cost as taxi Y1 0.32 0.18 1.83Previous crash with injuries Y1 -2.42 0.97 -2.49Previous crash with injuries Y2–Y5, unsure -1.89 0.86 -2.20Starting language German unsure 1.42 0.34 4.13Data concerns Y1 -0.24 0.12 -1.98Doctorate level of education Y2–Y3 -1.43 0.53 -2.67Female Y1–Y5 and unsure -2.94 1.14 -2.58Full–time employment Y1-Y3 0.63 0.31 2.09High income: 3000–7000 Euro Y4–Y5 -1.42 0.65 -2.20PT commute Y4–Y5 0.85 0.40 2.11Safety concerns Y1 and Y4–Y5 -0.34 0.10 -3.46A�nity to social media Y1–Y5 and unsure 0.50 0.29 1.71TT important for UAM Y2–Y3 0.28 0.07 3.81Value of time savings Y4–Y5 0.33 0.08 4.07A�nity to WhatsApp Y1–Y5 and unsure 0.53 0.26 2.07
Summary statistics⇢2 0.23AIC 546.42BIC 607.587
5.3. Ordered logit model
Ordered logit models were also built with adoption time horizon as a dependent variable. Althoughtime frame can theoretically be ordered from the first to the sixth or more years (even never), the category“unsure” cannot be ranked in that scale. Therefore, based on previously observed patterns in the MNL515
model, OLMs were proposed . For instance, the a�nity to automation estimate from the MNL (Table 4)was positive and strongly significant (more than 95%) for both immediate adoption (Y1) and later adopters(Y2 to Y5) and unsure respondents; however, the impact was higher for immediate adopters (Y1), expressedby the higher coe�cient estimate (1.15 compared to 0.79). Similarly, previous crashes with injuries negativelyimpacted adoption, expressed by strongly significant (more than 95%) and negative coe�cient estimates;520
higher even for Y1 (-2.42 compared to -1.89 for the rest). These for instance guided the specification ofan ordered logit model, where such attributes would be ranked, as suggested by the patterns in the MNL.Accordingly, two cases were proposed. In the first case, the ordered categories were as follows: Y1; Y2–Y3;Y4–Y5; Unsure; Y6+/Never. The second case was built from the first by merging the “unsure” categorywith the one of late and non–adopters. The corresponding categories were therefore: Y1; Y2–Y3; Y4–Y5;525
Unsure, Y6+ and Never.Table 5 represents the final OLM model for both cases. The highly significant cut values for case 1
indicate that adoption is indeed ordered and people who are unsure display a behavior that is rankedbetween late (Y4–Y5) and extremely late or non–adopters (Y6+ or Never). This was rather expected fromthe patterns observed in MNL models. The significant parameters are the same for both cases: a�nity to530
automation, full–time employment, and cost as taxi (meaning the willingness to use the service for pricesin the range of taxis) are associated with an early adoption. On the other hand, data and ethical concernsand starting language German are strongly correlated with a later adoption.
16

Table 5: Ordered logit models results (N=221)
Case 1 Case 2Parameters estimate std. error t–stat estimate std. error t–stat
A�nity to automation -0.26 0.07 -3.54 -0.23 0.07 -3.11Cost as taxi -0.37 0.13 -2.82 -0.38 0.14 -2.70Starting language German 0.61 0.30 2.05 0.70 0.30 2.32Data and ethical concerns 0.27 0.08 3.32 0.26 0.08 3.19Full–time employment -0.96 0.26 -3.68 -1.03 0.27 -3.84
InterceptsCase 1Y1—Y2–Y3 -4.22 0.85 -4.97Y2–Y3—Y4–Y5 -2.16 0.21 9.96Y4–Y5—Unsure -1.36 0.14 5.93Unsure—Y6+/Never 0.87 0.31 7.10Case 2Y1—Y2–Y3 -4.02 0.88 -4.57Y2–Y3—Y4–Y5 -1.96 0.21 9.92Y4–Y5—Unsure/Y6+/Never -1.15 0.14 5.93
Summary statistics⇢2 0.25 0.26AIC 585.10 526.04BIC 615.69 553.23
Compared to Case 1, Case 2 presents similar values for the relevant parameters with close estimatesin terms of value and significance. This model also presents significant cuto↵ values between the ordered535
categories and indicates that uncertain respondents can be merged with very late (Y6+) and non–adopters.In other terms, respondents showing some skepticism regarding their adoption time horizon of UAM are morelikely to use it at a later stage, or not to use it at all. In both cases, uncertain adopters are associated withrather late adoption; the only di↵erence is that one case considers uncertainty as part of non–adoption andthe other as one degree less. However, due to the di↵erence in the nature of the data between these models540
(since the first case provides five outcomes for the dependent variable compared to four in the second), alikelihood ratio test is not possible. Therefore as both models have more or less the same meaning, decidingon the number of ordered categories depends on personal judgment and preference: parsimony vs. richness.
6. Discussion
6.1. Summary findings545
Despite high stated adoption rates for UAM (about 37% for Y2–Y3 and 22 % for Y1), a non-negligiblenumber of respondents expressed their uncertainty about their intention to use the service, as shown by thepercentage of “unsure” respondents (more than 22 %). The analysis of the responses showed that safetywas perceived as the factor of highest importance in using UAM (ranked by the majority of respondentsas the first factor in UAM adoption). A high indication for the importance of trip cost, trip duration,550
service reliability and operation characteristics was also observed, as they were mostly ranked as second,third, fourth, and fifth most important factors for UAM adoption. The survey statistics indicated a highimpact of socio–demographic factors on adoption and attitudes. Females expressed a much lower interest inimmediate UAM adoption, expressing overall lower trust and perceived usefulness of automation, and greatersecurity and safety concerns and expectations, expressing a higher desire for operators on the ground, and555
of in–vehicle safety cameras, as reflected in the mean values of the attitude Likert–scale questions (partiallypresented in Figure 3). On the other hand, both fully-employed and higher income respondents expresseda greater interest in early adoption, as discussed in the survey statistics (Section 4.1). Cultural impact was
17

observed through the survey language, which seemed to also have an impact on automation; respondentsfilling the survey in German expressed a lower interest in early adoption and a higher skepticism observed560
through a higher degree of uncertainty. This is interesting when compared to the impact of the place ofresidence (Munich or Germany), which was less influential than the survey language, as only the latter wasa significant variable in the adoption models (MNL and OLM).
The discussed findings from the statistics were confirmed by the specified models. For instance, MNLsdemonstrated the high impact of gender (female), employment (full–time), language (German language),565
income levels on adoption. The MNLs also showed that public transportation users were more likely to belate UAM adopters, as expressed by the positive and significant coe�cient estimate for PT commuters (Table4). Moreover, respondents with previous crash experiences with injuries were less likely to be immediateadopters, as revealed by the model finding estimates (Table 4). Safety concerns were also found to playan inhibiting role in early and late adoption, expressed by the negative and highly significant (more than570
99.9 %) coe�cient estimate in the MNL. These included the need for in–vehicle surveillance cameras, andfor an operator on the ground at any time (resulting from the factor analysis in Table 2). Lack of safetymay hinder UAM, and lead to late UAM adoption. Moreover, the a�nity to automation was found crucialfor UAM adoption (as demonstrated by the positive coe�cients for the MNL, higher still for Y1 than forY4-Y5, and negative for the OLM, proving as well the higher e↵ect on immediate adoption of the a�nity575
to automation) and included the enjoyment and trust of automation, and the perceived usefulness of UAM.Furthermore, the value of time savings and perceived costs were highly influential for late UAM adoption.As some of these findings might be counter–intuitive, their occurrence might be due to respondents’ priorexpectations and judgments of service properties. For instance, respondents may be skeptical about actualtime savings and therefore as they value this factor, they might decide to adopt UAM later on, waiting for580
the service to improve its performance. This was also observed for respondents who are highly sensitiveto costs as they might believe that costs would decrease a few years after the service implementation tobe in the range of taxis. Moreover, higher safety concerns were negatively associated with late adoption,possibly due to the users’ beliefs that safety would only need a few years to be demonstrated; waiting for toolong would therefore not be needed. Also, data and ethical concerns were found to be hindering immediate585
adoption; this could refer to the respondents who are rather worried about their data being shared to thirdparties, and who tend to be uncertain about the future as they are concerned from cyber–security threatsand/or the loss of jobs due to automation. Finally, the impact of social media and WhatsApp was found tobe positive on adoption.
OLMs confirmed some of these factors found in the MNLs, notably the cost range importance (comparable590
to the taxi range for early adoption), the cultural impact (correlation between German language and lateradoption), the data and ethical concerns (associated with later adoption and including the fear of cyber–security, data sharing, and the loss of job concerns), the a�nity to automation, and the employment impact.Finally, the ordered models gave meaningful insights regarding “unsure” respondents, in which these werefound to have similar or close (one degree less) behavioral intentions to late adopters.595
When comparing the results of this study with the reports commissioned by NASA and presented inSection 2.1, parallel findings were observed. The study by Crown Consulting (NASA, 2019) mentionedthat nearly half of the consumers were potentially comfortable with delivery and UAM use cases, whichis quite comparable with our results (more than 50% stated time adoption within the first three years ofimplementation). Moreover, common factors were observed such as safety, privacy, loss of jobs concerns,600
environmental concerns, and noise and visual pollution that were extracted from our qualitative analysis.Common results were also shared with the study by Booz Allen Hamilton (NASA, 2018), particularly foruser concerns like safety, privacy and noise, piloted aircraft and flight attendant, cybersecurity, cost andconvenience, and gender impact with men being more comfortable and willing to use UAM; in our studyhowever, the system was assumed to be fully automated, and therefore a flight attendant was not mentioned.605
Instead, the importance of having an operator (available on the ground and/or remotely control the vehiclein case of emergency) was investigated.
18

6.2. Technology Acceptance Model for Disruptive Transport Technologies
The model findings pertaining to acceptance were incorporated to extend the Technology AcceptanceModel for the application of urban air mobility, and more generally disruptive transport technologies (Fig-610
ure 4). Compared to the initial TAM by Davis et al. (1989), the model retains only one of the two mainconstructs: the perceived usefulness (PU), which directly impacts the behavioral intention (BI). The per-ceived ease of use (PEU; in the case of urban air mobility: service booking or boarding) was not foundinfluential and was therefore removed from the model. More generally, for fully-automated systems, theuser is not expected to do any e↵ort. Actual system use is also omitted, as there is no way to measure it615
for non–existing systems. The attitude towards using the system is removed; instead the following factors(including PU) are considered as attitudes directly impacting the behavioral intention: perceived usefulness,social behavior (social attitudes related to social media use, environmental concerns, etc.), value of time(the value given to time savings), perceived costs (cost perceptions: cost range), data and ethical concerns(fear of data sharing to a third party, fear of cyber–security, and the loss of job concerns). These factors620
result from the estimated multinomial logit models (MNLs); data and ethical concerns and cost perceptionsalso result from the ordered logit models (OLMs).
The construct of trust is added as a main construct in this model, as suggested by the AutomationAcceptance Model (AAM) by Ghazizadeh et al. (2012). Additionally, the proposed model introduces factorsdirectly and positively impacting trust. These are the perceived reliability of automation, the perceived625
vehicle’s safety, the perceived locus of control, and the previous experience with automation. The vehicle’ssafety and perceived locus of control are supported by the MNLs and refer to the safety from in–vehiclesafety cameras and the locus of control confirmed by the importance given to the human factor (operatoron the ground at any time). Moreover, both service reliability and automation experience were found fromanalyzing respondents’ attitudes. Finally, external variables, similarly to the AAM directly impact trust,630
but not PU. These are given as socio–demographics and a�nity to automation. The former includes gender,education, occupation, income, cultural impact (demonstrated by the survey language). In the proposedmodel, these external variables directly impact behavioral intention as well.
Trust/ Value of Safety
Value of Time
Perceived Usefulness
Social Behavior
Behavioral Intention
Affinity to Automation
Socio-Demographics
Perceived Costs
Data and EthicalConcerns
PerceivedVehicle‘s Safety
PerceivedLocus of Control
Perceived Reliabilityof Automation
PreviousAutomation Experience
+
-External variables
Figure 4: Technology Acceptance Model for Disruptive Transport Technologies, adapted from the original TAM by Davis et al.(1989) and the Automation Acceptance Model (AAM) by Ghazizadeh et al. (2012)
19

6.3. Insights for policymakers and industrial stakeholders
The findings of this research provide insights for both responsible policymaking and industrial stake-635
holder engagement, to ensure a smooth urban air mobility implementation and integration with the existingtransport systems. Recommendations on such areas can be summarized in the following points.
6.3.1. Insights for policymakers
• Safety concerns
As highlighted in the proposed Technology Acceptance Model, trust or the value of safety is a crucial640
component in users’ adoption of urban air mobility and is determined by several components. Amongthese, the perception of automation reliability, vehicle’s safety and locus of control are areas wherestringent regulations could improve users’ trust and reduce skepticism resulting from missing or erro-neous information. Accordingly, safety standards enforced by the responsible authorities could ensureusers’ trust, alleviating negative perceptions on automation reliability and service performance. En-645
forcing regulations acting upon in-vehicle safety, such as the presence of in-vehicle surveillance cameras,might help increasing trust and feeling of safety. Finally, regulations focusing on the human factor inthe operation of urban air mobility could take into consideration the importance of the availability (atany time) of an operator on the ground, to increase the users’ perceived locus of control, and therebytrust and safety towards the service.650
• Data concerns
The proposed TAM also highlights the importance of data and ethical concerns for UAM adoption,and their negative impacts on safety perception. These include concerns from information sharingto third parties, from cyber-security, and from the loss of jobs due to automation, as shown by theexploratory factor analysis results. Responsible policymaking in the area of data sharing and protection655
would probably ensure a higher sense of privacy for the users. For ground Autonomous Vehicles,Fagnant & Kockelman (2015) recommend the creation of nationally recognized licensing frameworkfor autonomous vehicles (ground), determining appropriate standards for liability, security, and dataprivacy. Such frameworks could be appropriately developed and transferred to urban air mobility.
• Other concerns660
Not directly stemming from the models, environmental concerns expressed by respondents demonstratethe need for policy–making in the area of noise and visual impact. Regulating the allowed noise levelsand flying altitudes of the vehicles could address community acceptance of both users, and non-usersof urban air mobility. Moreover, an inclusive and integrated system, as defined by our study shouldensure a proper integration of UAM services with existing transportation systems.665
6.3.2. Insights for industrial stakeholders
• Service attributes
The proposed TAM revealed the importance of service attributes, i.e. cost and time, for the adoption ofurban air mobility. If the system aims to attract a wider public, user requirements must be prioritized,notably pricing schemes must be defined, and regulated by the authorities, so that the service would670
not only be a niche market. These for instance need to be within a certain reasonable range, i.e. taxiprices, allowing competition with existing ground vehicles. Similarly, the time from access to egress(to and from the vertiports) must be optimized: a smoother process must enable an e�cient processfor the service to be accepted; again, if the service aims to be integrated with the existing systems, thiscan only be done through a proper stakeholder engagement with the responsible authorities. Finally,675
a higher transparency on both time and costs of the service would ensure a higher awareness on theservice attributes, which is crucial for users’ perceptions towards it.
• Socio-demographics
For an inclusive service, industrial stakeholders should consider the importance of socio-demographicsin the perception of the service. User categories with di↵erent gender or cultural background could be680
20

targeted according to their specific needs. Incentives might as well help some respondents to overcometheir fears of automation.
7. Conclusions
In this paper, users’ acceptance and adoption of urban air mobility was assessed by analyzing an onlinestated preference study that gathered 221 respondents from all over the world, with a subsample of 97 Munich685
residents. Using mostly factors from the literature on the acceptance of both technology and automation(notably autonomous vehicles), and by projecting them to UAM, the survey aimed at uncovering manyhypotheses on this new mobility service and thereby also validated an extended technology acceptancemodel for an urban air mobility context. The analysis of the survey data highlighted the importanceof socio–demographic parameters and their attitudes in adoption. Using the exploratory factor analysis,690
many variables were clustered into groups having a high explanatory power and thus reducing the datasetdimensionality. These included the a�nity to automation, safety concerns, data and ethical concerns, thevalue of time savings, in addition to social attitudes such as environmental awareness, the a�nity to socialmedia, online services, and sharing. Using the inputs from the factor analysis, significant multinomial andordered logit models were developed with adoption time horizon as a dependent variable, which can be a695
considered as a theoretical contribution to the use case of ordered logit models with a non–conventionalordinal dependent time variable (including non-ordinal parameters such as “unsure” and “never”). Mostly,the influence of socio–demographics, cultural impact, a�nity to automation (including the enjoyment andtrust of automation) were shown. Trust and safety were found to be key components for UAM adoption; inparticular, the presence of in–vehicle cameras and operators, as well as performance expectancy in terms of700
service reliability and on–time performance were noted. Data and ethical concerns, the value of time savingsand costs, social attitudes including a high a�nity to social media were also found as highly influential forUAM adoption. Finally, public transportation as a commute mode was found to be rather related to lateadoption.
Overall, the study extracted relevant and highly significant factors, extending accordingly the TAM705
model for UAM use, and contributing in filling the gap in research on this new service. The findings of thiswork have strong insights for policymakers. Regulatory bodies should have departments targeting UAMregulations and work closely with other countries to have some unified standards; for instance, a unifiedEuropean framework on suggested safety standards and allowed noise levels.
Most factors in the developed models are related to the perception and attitudes of respondents, and710
not to the service attributes; newer models could therefore be developed with alternative-specific variables.Scenarios could for instance present travel times or costs for di↵erent time frames. Future work couldtherefore focus on uncertainties pertaining to the service attributes and business models. Another researchmotivation could be to build a nested ordered logit model with one or more ordered nests; one of the nestscould comprise uncertain or non–adopters and the other the certain adopters including the ordered (time)715
adoption categories. Other studies could test the developed UAM TAM by applying a confirmatory factoranalysis (CFA) and developing a hybrid latent class model, in which both analysis methods (factor analysisand choice models) would be combined.
Acknowledgements
This work has been partly funded by the Bavarian Ministry of Economic A↵airs, Regional Development and720
Energy through the OBUAM project.
References
Airbus (2017). Rethinking urban air mobility. URL: https://www.airbus.com/newsroom/stories/
rethinking-urban-air-mobility.html.Airbus (2018). Urban air mobility - the sky is yours. URL: https://www.airbus.com/innovation/725
Urban-air-mobility-the-sky-is-yours.html.
21

Antcli↵, K. R., Moore, M. D., & Goodrich, K. H. (2016). Silicon valley as an early adopter for on-demand civil VTOLoperations. In 16th AIAA Aviation Technology, Integration, and Operations Conference (p. 3466).
Bansal, P., Kockelman, K. M., & Singh, A. (2016). Assessing public opinions of and interest in new vehicle technologies: AnAustin perspective. Transportation Research Part C: Emerging Technologies, 67 , 1–14.730
Baptista, P., Melo, S., & Rolim, C. (2014). Energy, environmental and mobility impacts of car-sharing systems. empiricalresults from lisbon, portugal. Procedia-Social and Behavioral Sciences, 111 , 28–37.
Baumgartner, H., & Steenkamp, J.-B. E. (2001). Response styles in marketing research: A cross-national investigation. Journalof Marketing Research, 38 , 143–156. URL: https://doi.org/10.1509/jmkr.38.2.143.18840. doi:10.1509/jmkr.38.2.143.18840. arXiv:https://doi.org/10.1509/jmkr.38.2.143.18840.735
Bierlaire, M. (2003). Biogeme: a free package for the estimation of discrete choice models. In Swiss Transport ResearchConference TRANSP-OR-CONF-2006-048.
Bimbraw, K. (2015). Autonomous cars: Past, present and future a review of the developments in the last century, the presentscenario and the expected future of autonomous vehicle technology. In Informatics in Control, Automation and Robotics(ICINCO), 2015 12th International Conference on (pp. 191–198). IEEE volume 1.740
Bjørner, T. (2015). A priori user acceptance and the perceived driving pleasure in semi-autonomous and autonomous vehicles.In European Transport Conference 2015 .
Boucher, P. (2016). ‘You wouldn’t have your granny using them’: Drawing boundaries between acceptable and unac-ceptable applications of civil drones. Science and Engineering Ethics, 22 , 1391–1418. URL: https://doi.org/10.1007/s11948-015-9720-7.745
Chamata, J. (2017). Factors delaying the adoption of civil drones: A primitive framework. The International TechnologyManagement Review , 6 , 125–132.
Choi, J. K., & Ji, Y. G. (2015). Investigating the importance of trust on adopting an autonomous vehicle. InternationalJournal of Human-Computer Interaction, 31 , 692–702.
Clements, L. M., & Kockelman, K. M. (2017). Economic e↵ects of automated vehicles. Transportation Research Record:750
Journal of the Transportation Research Board , (pp. 106–114).Clothier, R. A., Greer, D. A., Greer, D. G., & Mehta, A. M. (2015). Risk perception and the public acceptance of drones. Risk
Analysis, 35 , 1167–1183.Cohen, M. M. (1996). The Vertiport as an Urban Design Problem. Technical Report SAE Technical Paper.Connected Automated Driving EU (2017). New study on user acceptance of driverless cars released. URL: https:755
//connectedautomateddriving.eu/mediaroom/nes-study-user-acceptance-driverless-cars-released/.Costello, A. B., & Osborne, J. W. (2005). Best practices in exploratory factor analysis: Four recommendations for getting the
most from your analysis. Practical Assessment, Research & Evaluation, 10 , 1–9.Davis, F. D., Bagozzi, R. P., & Warshaw, P. R. (1989). User acceptance of computer technology: a comparison of two theoretical
models. Management Science, 35 , 982–1003.760
Deloitte Analytics Institute (2017). Autonomous driving in Germany how to convince customers. URL: https://www2.
deloitte.com/content/dam/Deloitte/de/Documents/consumer-industrial-products/Autonomous-driving-in-Germany_
PoV.pdf/.Dolnicar, S. (2013). Asking good survey questions. Journal of Travel Research, 52 , 551–574.Efthymiou, D., Antoniou, C., & Waddell, P. (2013). Factors a↵ecting the adoption of vehicle sharing systems by young drivers.765
Transport Policy, 29 , 64–73.Euromonitor International (2017). Munich city review. URL: http://www.euromonitor.com/munich-city-review/report.Fabrigar, L. R., Wegener, D. T., MacCallum, R. C., & Strahan, E. J. (1999). Evaluating the use of exploratory factor analysis
in psychological research. Psychological methods, 4 , 272.Fadhil, D. N. (2018). A GIS-Based Analysis for Selecting Ground Infrastructure Locations for Urban Air Mobility. Master’s770
Thesis Technical University of Munich.Fagnant, D. J., & Kockelman, K. (2015). Preparing a nation for autonomous vehicles: opportunities, barriers and policy
recommendations. Transportation Research Part A: Policy and Practice, 77 , 167–181.Fagnant, D. J., & Kockelman, K. M. (2014). The travel and environmental implications of shared autonomous vehicles, using
agent-based model scenarios. Transportation Research Part C: Emerging Technologies, 40 , 1–13.775
Fu, M., Rothfeld, R., & Antoniou, C. (2019). Exploring preferences for transportation modes in an urban air mobilityenvironment: a Munich case study. Transportation Research Record: Journal of the Transportation Research Board , InPress.
Gaggi, S. (2017). Driverless cars and user acceptance. URL: https://mobilitybehaviour.eu/2017/07/26/
driverless-cars-and-user-acceptance/.780
Garrow, L. A., German, B., Mokhtarian, P., Daskilewicz, M., Douthat, T. H., & Binder, R. (2018). If you fly it, will commuterscome? A survey to model demand for e–VTOL urban air trips. In 2018 Aviation Technology, Integration, and OperationsConference (p. 2882).
Ghazizadeh, M., Lee, J. D., & Boyle, L. N. (2012). Extending the technology acceptance model to assess automation. Cognition,Technology & Work , 14 , 39–49.785
Hohenberger, C., Sporrle, M., & Welpe, I. M. (2016). How and why do men and women di↵er in their willingness to useautomated cars? the influence of emotions across di↵erent age groups. Transportation Research Part A: Policy and Practice,94 , 374–385.
Jenkins, S., Linden, E., & Wittmer, A. (2018). Autonomous Mobility - An Application of the Technology Acceptance Model.URL: https://cfac.unisg.ch/en/research-publications-consulting/cfac-working-paper-series.790
Kaan, J. (2017). User acceptance of autonomous vehicles: Factors & implications, . URL: https://repository.tudelft.nl.
22
Kaiser, H. F. (1958). The varimax criterion for analytic rotation in factor analysis. Psychometrika, 23 , 187–200.KPMG (2018). Autonomous vehicles readiness index. URL: https://assets.kpmg.com/content/dam/kpmg/tw/pdf/2018/03/
KPMG-Autonomous-Vehicle-Readiness-Index.pdf.Kreimeier, M., & Stumpf, E. (2017). Market volume estimation of thin-haul on-demand air mobility services in Germany. In795
17th AIAA Aviation Technology, Integration, and Operations Conference (p. 3282).Krueger, R., Rashidi, T. H., & Rose, J. M. (2016). Preferences for shared autonomous vehicles. Transportation Research Part C:
Emerging Technologies, 69 , 343 – 355. URL: http://www.sciencedirect.com/science/article/pii/S0968090X16300870.Kyriakidis, M., Happee, R., & de Winter, J. C. (2015). Public opinion on automated driving: Results of an international
questionnaire among 5000 respondents. Transportation Research Part F: Tra�c Psychology and Behaviour , 32 , 127–140.800
Lidynia, C., Philipsen, R., & Ziefle, M. (2017). Droning on about dronesacceptance of and perceived barriers to drones in civilusage contexts. In Advances in Human Factors in Robots and Unmanned Systems (pp. 317–329). Springer.
Likert, R. (1932). A technique for the measurement of attitudes. Archives of psychology , 20 , 5–55.MacSween, S. (2003). A public opinion survey-unmanned aerial vehicles for cargo, commercial, and passenger transportation.
In 2nd AIAA” Unmanned Unlimited” Conf. and Workshop & Exhibit (p. 6519).805
McFadden, D. (2001). Economic choices. American economic review , 91 , 351–378.Merat, N., Madigan, R., & Nordho↵, S. (2016). Human factors, user requirements, and user acceptance of ride-sharing
in automated vehicles. In International Transport Forum Roundtable on Cooperative Mobility Systems and AutomatedDriving (pp. 6–7).
Mokhtarian, P. L., Ory, D. T., & Cao, X. (2009). Shopping-related attitudes: a factor and cluster analysis of Northern California810
shoppers. Environment and Planning B: Planning and Design, 36 , 204–228.NASA (2018). Urban Air Mobility (UAM) Market Study. Technical Report. URL: https://ntrs.nasa.gov/archive/nasa/
casi.ntrs.nasa.gov/20190001472.pdf.NASA (2019). Urban Air Mobility (UAM) Market Study. URL: https://ntrs.nasa.gov/archive/nasa/casi.ntrs.nasa.gov/
20190026762.pdf.815
Nees, M. A. (2016). Acceptance of self-driving cars: an examination of idealized versus realistic portrayals with a self-drivingcar acceptance scale. In Proceedings of the Human Factors and Ergonomics Society Annual Meeting (pp. 1449–1453). SAGEPublications Sage CA: Los Angeles, CA volume 60.
Payre, W., Cestac, J., & Delhomme, P. (2014). Intention to use a fully automated car: Attitudes and a priori acceptability.Transportation Research Part F: Tra�c Psychology and Behaviour , 27 , 252–263.820
Peeta, S., Paz, A., & DeLaurentis, D. (2008). Stated preference analysis of a new very light jet based on-demand air service.Transportation Research Part A: Policy and Practice, 42 , 629 – 645. URL: http://www.sciencedirect.com/science/
article/pii/S096585640800013X.Piao, J., McDonald, M., Hounsell, N., Graindorge, M., Graindorge, T., & Malhene, N. (2016). Public views towards imple-
mentation of automated vehicles in urban areas. Transportation Research Procedia, 14 , 2168–2177.825
Porsche Consulting (2018). The future of vertical mobility: Sizing the market for passenger, inspection, and good services until2035.
R Core Team (2019). R: A Language and Environment for Statistical Computing. R Foundation for Statistical ComputingVienna, Austria. URL: http://www.R-project.org/.
Riad, M.-I., Jaradat, m.-i., Fagih, K., & S Faqih, M. (2014). Investigating the moderating e↵ects of gender and self-e�cacy830
in the context of mobile payment adoption: A developing country perspective. International Journal of Business andManagement , 9 .
Rodel, C., Stadler, S., Meschtscherjakov, A., & Tscheligi, M. (2014). Towards autonomous cars: the e↵ect of autonomy levelson acceptance and user experience. In Proceedings of the 6th International Conference on Automotive User Interfaces andInteractive Vehicular Applications (pp. 1–8). ACM.835
Rothfeld, R. L., Balac, M., Ploetner, K. O., & Antoniou, C. (2018). Initial Analysis of Urban Air Mobility’s TransportPerformance in Sioux Falls. In AIAA AVIATION, Modeling and Simulation for Unmanned and Personal Aerial VehicleOperations. Atlanta.
Rychel, A. (2016). Cultural divides: How acceptance of driverless cars varies globally. URL: https://www.2025ad.com/latest/driverless-cars-acceptance/.840
Schoettle, B., & Sivak, M. (2014). A survey of public opinion about autonomous and self-driving vehicles in the US, the UK,and Australia.
Shamiyeh, M., Bijewitz, J., & Hornung, M. (2017). A review of recent personal air vehicle concepts. In Aerospace Europe 6thCEAS Conference.
Statistische Amter des Bundes und der Lander (2014). Ergebnisse des zensus 2011. URL: https://www.zensus2011.de/DE/845
Home/home_node.html.Steele, C. M. (1995). Stereotype threat and the intellectual test performance. Journal of Personality and Social Psychology,
69 , 1.Straubinger, A., & Verhoef, E. T. (2018). (Working Paper) Options for a Welfare Analysis of Urban Air Mobility. Hong Kong.Sun, H., & Zhang, P. (2006). The role of moderating factors in user technology acceptance. International Journal of Human-850
Computer Studies, 64 , 53–78.Tabachnick, B. G., Fidell, L. S., & Ullman, J. B. (2007). Using multivariate statistics volume 5. Pearson Boston, MA.Thipphavong, D. P., Apaza, R., Barmore, B., Battiste, V., Burian, B., Dao, Q., Feary, M., Go, S., Goodrich, K. H., Homola, J.
et al. (2018). Urban air mobility airspace integration concepts and considerations. In 2018 Aviation Technology, Integration,and Operations Conference (p. 3676).855
Tyrinopoulos, Y., & Antoniou, C. (2008). Public transit user satisfaction: Variability and policy implications. Transport
23

Policy, 15 , 260–272.Uber Elevate (2016). Fast-forwarding to a future of on-demand urban air transportation. URL: https://www.uber.com/
elevate.pdf.Uber Elevate (2018). Fast-forwarding to the future of on-demand, urban air transportation. URL: https://www.uber.com/860
info/elevate/.Vascik, P. D. (2017). Systems-level analysis of On Demand Mobility for aviation. Ph.D. thesis Massachusetts Institute of
Technology.Vascik, P. D., & Hansman, R. J. (2018). Scaling constraints for urban air mobility operations: Air tra�c control, ground
infrastructure, and noise. In 2018 Aviation Technology, Integration, and Operations Conference (p. 3849).865
Venkatesh, V., & Bala, H. (2008). Technology acceptance model 3 and a research agenda on interventions. Decision sciences,39 , 273–315.
Venkatesh, V., & Davis, F. D. (2000). A theoretical extension of the technology acceptance model: Four longitudinal fieldstudies. Management Science, 46 , 186–204.
Venkatesh, V., Morris, M. G., Davis, G. B., & Davis, F. D. (2003). User acceptance of information technology: Toward a870
unified view. MIS quarterly, (pp. 425–478).Wang, Y., Xia, H., Yao, Y., & Huang, Y. (2016). Flying eyes and hidden controllers: A qualitative study of people’s privacy
perceptions of civilian drones in the US. Proceedings on Privacy Enhancing Technologies, 2016 , 172–190.Yeomans, K. A., & Golder, P. A. (1982). The guttman-kaiser criterion as a predictor of the number of common factors. The
Statistician, (pp. 221–229).875
Zhang, T., Tao, D., Qu, X., Zhang, X., Lin, R., & Zhang, W. (2019). The roles of initial trust and perceived risk in publicsacceptance of automated vehicles. Transportation Research Part C: Emerging Technologies, 98 , 207–220.
24
View publication statsView publication stats