Embed Size (px)
Citation preview
ST. MARY UNIVERSITY
SCHOOL OF GRADUATE STUDIES
INSTITUTE OF QUALITY AND PRODUCTIVITY MANAGEMENT
FACTORS AFFECTING EFFECTIVENESS OF THE ETHIOPIAN
NATIONAL QUALITY INFRASTRUCTURE
BY
FIKREAB MARKOS DOLEBO
(ID No:-SGS/0201/2008B)
JUN, 2018
ADDIS ABABA, EHTIOPIA
1
FACTORS AFFECTING EFFECTIVENESS OF THE ETHIOPIAN
NATIONAL QUALITY INFRASTRUCTURE
BY
FIKREAB MARKOS DOLEBO
(ID No:-SGS/0201/2008B)
A THESIS SUBMITTED TO THE INSTITUTE OF QUALITY
AND PRODUCTIVITY MANAGEMENT IN PARTIAL FULFILLMENT FOR
THE REQUIREMENTS OF THE DEGREE OF MASTERS OF SCIENCE IN
QUALITY AND PRODUCTIVITY MANAGEMENT
JUN, 2018
ADDIS ABABA, EHTIOPIA
i
ST. MARY UNIVERSITY
SCHOOL OF GRADUATE STUDIES
INSTITUTE OF QUALITY AND PRODUCTIVITY MANAGEMENT
FACTORS AFFECTING EFFECTIVENESS OF THE ETHIOPIAN
NATIONAL QUALITY INFRASTRUCTURE
APPROVED BY BOARD OF EXAMINERS
Dean, Graduate Studies Signature
__________________ ________________
Advisor Signature
___________________ ________________
External Examiner Signature
___________________ ________________
Internal Examiner Signature
_______________ ____ ________________
ii
TABLE OF CONTENTS
PAGE
TABLE OF CONTENTS....................................................................................................................... ii
DECLARATION .................................................................................................................................... v
ENDORSEMENT ................................................................................................................................. vi
ACKNOWLEDGEMENTS................................................................................................................. vii
LIST OF ABBREVIATIONS AND ACRONYMS .......................................................................... viii
LIST OF TABLES ................................................................................... Error! Bookmark not defined.
LIST OF FIGURES ............................................................................................................................. xii
ABSTRACT ......................................................................................................................................... xiii
CHAPTER ONE: INTRODUCTION ......................................................................................... 1
1.1. Background of the Study ................................................................................................... 1
1.2. Statement of the Problem .................................................................................................. 2
1.3. Objectives of the Study ...................................................................................................... 4
1.4.1 General Objective ................................................................................................................................ 4
1.4.2 Specific Objectives ............................................................................................................................... 4
1.4. Significance of the Study .................................................................................................... 4
1.5. Scope of the Study .............................................................................................................. 5
1.6. Limitation of the Study ...................................................................................................... 5
1.7. Definitions of Key Terms ................................................................................................... 5
1.8. Organization of the Study .................................................................................................. 6
CHAPTER TWO : REVIEW OF THE RELATED LITERATURE ............................................... 7
2.1. Theoretical Issues of the National Quality Infrastructure System ................................ 7
2.2. Why National Quality Infrastructure is Needed in Ethiopia? ..................................... 10
2.3. Current Status of the Ethiopian National Quality Infrastructure. ............................. 12
2.3.1. Ethiopian Standard Agency .............................................................................................................. 12
2.3.2. National Metrology Institute of Ethiopia ......................................................................................... 13
2.3.3. Ethiopian Conformity Assessment Enterprise ................................................................................ 14
2.3.4. Ethiopian National Accreditation Office .......................................................................................... 15
2.4. Empirical Literature on Organizational Effectiveness ................................................. 17
2.4.1. The Goal Approach ............................................................................................................................ 18
2.4.2. The System Resource Approach ....................................................................................................... 18
2.4.3. The Process Approach ....................................................................................................................... 18

iii
2.4.4. The Strategic Constituency Approach ............................................................................................. 19
CHAPTER THREE: THE RESEARCH DESIGN AND METHODOLOGY ............................... 20
3.1. The Research Design ........................................................................................................ 20
3.2. The Research Methods ..................................................................................................... 20
3.3. Source of Data ................................................................................................................... 21
3.4. Samples and Sampling Techniques................................................................................. 21
3.5. Instruments of Data Collection ....................................................................................... 23
3.5.1. Standardization of Data Gathering Instruments ............................................................................ 24
3.6. Procedures of Data Collection ......................................................................................... 26
3.7. Methods of Data Analysis ................................................................................................ 26
3.8. Ethical Consideration ....................................................................................................... 26
CHAPTER FOUR: RESULT AND DISCUSSION .......................................................................... 27
4.1 Demographic Characteristics of the Respondents ........................................................ 27
4.2 Provision of Service Quality by NQI Institutions. ......................................................... 30
4.2.1 The Performance of NQI Institutions with Respect to Service Quality. ....................................... 30
4.2.2 Customer Handling by the NQI institutions. ................................................................................... 34
4.2.3 Scope of Services ................................................................................................................................ 36
4.2.4 Service Deliverability. ........................................................................................................................ 38
4.2.5 Stakeholder Participation .................................................................................................................. 40
4.2.6 Employee Performance ...................................................................................................................... 42
4.2.7 Leadership Commitment ................................................................................................................... 44
4.2.8 Technology/ICT usage ....................................................................................................................... 46
4.3 NQIs' Achievement on its Technical Services from Process Perspectives. ................ 48
4.3.1 NQI Institutions Provision of Standard Documents ....................................................................... 48
4.3.2 Provision of Training ......................................................................................................................... 51
4.3.3 Technical Support and Consultancy Services .................................................................................. 52
4.3.4 Use of Technologies. ........................................................................................................................... 53
4.3.5 Product Quality and Compatibility .................................................................................................. 54
4.4 NQIs' performance from Strategic Constituency Approach ....................................... 56
4.4.1 Lesson Learned Experience .............................................................................................................. 56
4.4.2 Revision and Evaluation of Customer Satisfaction Level .............................................................. 58
4.4.3 Market Surveillance ........................................................................................................................... 59
4.4.4 Motivating Factors ............................................................................................................................. 60
4.4.5 NQIs' Integration ............................................................................................................................... 61
4.4.6 Concept and Importance of NQI Services ....................................................................................... 64
iv
4.4.7 Private NQI Service Providers. ......................................................................................................... 66
4.5 NQI Performance from System Resource Approach .................................................... 67
4.5.1 Management of Resource .................................................................................................................. 67
4.5.2 Handling of Equipments and Working Standards .......................................................................... 71
4.6 NQIs' Achievement ........................................................................................................... 73
4.6.1 Product Quality Aspects within a Specific Value Chain is Strengthened ..................................... 74
4.6.2 International Recognition .................................................................................................................. 77
4.6.3 Number of Requests for Quality Institutions Services is Increased ............................................... 78
CHAPTER FIVE : SUMMARY, CONCLUSIONS AND RECOMMENDATIONS .................... 80
5.1 Summary ........................................................................................................................... 80
5.2 Conclusion ......................................................................................................................... 85
5.3 Recommendation .............................................................................................................. 86
REFERENC91
ANNEX
A: QUESTIONNAIRE
B: INTERVIEW QUESTIONS.
C: ANALYSIS OF INTERVIEW DATA
D: OPEN ENDED QUESTIONNAIRE ASKED QUESTIONS AND
RESPONSE
E: TIME SCHEDULE
v
DECLARATION
I, the under signed, declare that this 'Thesis' entitled with “FACTORS
AFFECTING EFFECTIVENESS OF THE ETHIOPIAN NATIONAL QUALITY
INFRASTRUCTURE”, is my original work, prepared under the guidance of
my Advisor Dr. Abdu Abagibe. All necessary sources of materials used for
the preparation of this 'thesis' have been appropriately acknowledged.
Moreover, I want to confirm that the thesis has not been submitted either in
part or in full to any other higher learning institution for the purpose of
earning any degree.
____________________________________ _____________________________
Name Signature & Date
vi
ENDORSEMENT
This is to certify that this Thesis paper work, entitled “FACTORS AFFECTING
EFFECTIVENESS OF THE ETHIOPIAN NATIONAL QUALITY
INFRASTRUCTURE”, which is undertaken by Fikreab Markos for the partial fulfillment
for the requirements of the degree of Masters of Science in Quality and Productivity
Management (QPM) at St. Mary University, is an original work and not submitted earlier
for any degree either at this University or any other University.
__________________________ __________________________
Research Advisor Signature & Date
vii
ACKNOWLEDGEMENTS
At the beginning, I would like to thank God for giving me endurance to start
and finish what I dared as one of educational carrier. My warmest gratitude
and appreciation goes to my advisor Abdu Abagibe (PhD) for his unreserved
professional guidance, helpful reviews and comments as well as constrictive
clarification throughout this process. I want also to thank Ato Wondwosen
Fiseha, for his prompt advice on my work and respond on all the documents
I need from him.

viii
LIST OF ABBREVIATIONS AND ACRONYMS
AFRIMETS Inter Africa Metrology Organization
BIPM International Bureau of Weights and Measures
BPR Business Process Reengineering
ECAE Ethiopian Conformity Assessment Enterprise
ENAO Ethiopian National Accreditation Office
EUROMET European Metrology system
ESA Ethiopian Standard Agency
Frqu. Frequency
HACCP Hazard Analysis and Critical Control Points
IAF International Accreditation Forum
IEC International Electric Commission
ILAC International Laboratory Accreditation Cooperation
ISO International Organization for Standards
ITU International Telecommunication Union
KCDB Key Comparison Database
NMIE National Metrology Institute of Ethiopia
NQI National Quality Infrastructure
MoST Ministry of Science and Technology
OIML International Organization for Legal Metrology
SADC Southern Africa Development Community
SIM Inter-American Metrology System
Stdv. Standard deviation
TBT Technical Barrier to Trade
WTO World Trade Organization

ix
LIST OF TABLES
Page
Table 2.1.1: Elements and Services of a Quality Infrastructure .........................................8
Table 3.4.1: Population, Sampling Frame and Number of Respondents from
NQI Institution ..............................................................................................22
Table 3.4.2: Population, Sampling Frame and Number of Respondents from
Industry .........................................................................................................23
Table 3.9.1: Case Processing Summary and Reliability Statistics ....................................25
Table 4.1.1: The Profile of the Respondents from NQI Institution ...................................27
Table 4.1.2: The Profile of the Respondents from Industries ............................................29
Table 4.2.1.1: Evaluation of NQI's Service Quality by the NQI Institutions’
Respondents ...............................................................................................31
Table 4.2.1.2: Evaluation of NQIs' Service Quality by Industry Respondents ................32
Table 4.2.1.3: Two Tailed t- Test analyses, for the Provision of Service Quality by
NQI institutions ...........................................................................................33
Table 4.2.2.1: Belief of the NQI Respondents on Customer Handling of the
NQI Institutions ..........................................................................................34
Table 4.2.2.2: Belief of the Industry Respondents on Customer Handling of the
NQIs Institutions ........................................................................................35
Table 4.2.3.1: Belief of the NQI Respondents on the Scope of
Services of the NQIs ..................................................................................36
Table 4.2.3.2: Belief of the Industry Respondents on the Scope of Services of the
NQIs ...........................................................................................................37
Table 4.2.4.1: Attitude of NQI Respondents on NQIs Service Deliverability ..................38
Table 4.2.4.2: Attitude of Industry Respondents on NQIs Service Deliverability ............39
Table 4.2.5.1: Evaluation of Stakeholder Participation by the NQI respondents ..............40
Table 4.2.5.2: Evaluation of Stakeholder Participation by the Industry Respondents .....41
Table 4.2.6.1: Evaluation of employee performance by the NQI respondents .................42
Table 4.2.6.2: Evaluation of Employee Performance by the Industry Respondents .........43

x
Table 4.2.7.1: Proportion of the NQI Respondents towards NQIs Leadership
Commitment .............................................................................................44
Table 4.2.7.2: Proportion of the Industry Respondents towards NQIs
Leadership Commitment ............................................................................45
Table 4.2.8.1: Proportion of the NQI Respondents Regarding
Technology/ICT Usage ..............................................................................46
Table 4.2.8.2: Proportion of the Industry Respondents Regarding
Technology/ICT usage ..............................................................................47
Table 4.3.1.1: Response for provision of standardize documents ....................................48
Table 4.3.1.2: Two Tailed t-Test for the Analysis of NQIs' Achievement from its
Process Perspectives .................................................................................49
Table 4.3.2.1: Response for provision of training ............................................................51
Table 4.3.3.1: Response for provision of technical support and consultancy services ......52
Table 4.3.4.1: Response for the use of technologies .........................................................53
Table 4.3.5.1: Response for Product Quality and Compatibility .......................................54
Table 4.4.1.1: Response for lack of lesson learned experience ........................................56
Table 4.4.1.2: Two Tailed t- Test, for Analyzing the NQIs' Performance from
Strategic Constituency Approach ..............................................................57
Table 4.4.2.1: NQI Response for Revision and Evaluation of Customer
Satisfaction Level.......................................................................................58
Table 4.4.3.1: Response for Proper Market Surveillance ..................................................59
Table 4.4.4.1: Response for Motivating Factors ................................................................60
Table 4.4.5.1: Response for Conflict of Interest among NQIs ..........................................61
Table 4.4.5.3: Response for Coordination and Collaboration ...........................................62
Table 4.4.6.1: Response for Quality Concepts across the Society.....................................64
Table 4.4.6.3: Response for the Understanding the Importance of the NQI Services .......65
Table 4.4.7.1: Response for Private NQI Service Providers..............................................66
Table 4.5.1.1: Response for knowledge management .......................................................67
Table 4.5.1.2: Two Tailed t-Test for NQI Performance from System Resource
Approach .....................................................................................................69
Table 4.5.1.3: Response for implementation of standards .................................................70
xi
Table 4.5.1.4: Response for resources within the NQI framework ..................................70
Table 4.5.2.1: Response for Equipments Utilization Activities........................................71
Table 4.5.2.3: Response for Validating Working Standards, Procedures and
Methods......................................................................................................73
Table 4.6.1.1: Response Regarding to Product Quality in the Value Chain ......................74
Table 4.6.1.2: Two Tailed t- Test for the analysis of NQIs' Achievement ........................76
Table 4.6.2.1: Response Regarding to Gaining International Recognition .......................77
Table 4.6.3.1: Response regarding the number of requests for quality institutions
Services ................................................................................................................ 78
Table 5.1: Summary of Analyzed Data ........................................................................80
xii
LIST OF FIGURES
PAGE
Figure 1. International Relationships among Elements of the NQI. ------------------------10
Figure 2. Interaction of NQI elements-----------------------------------------------------------17
xiii
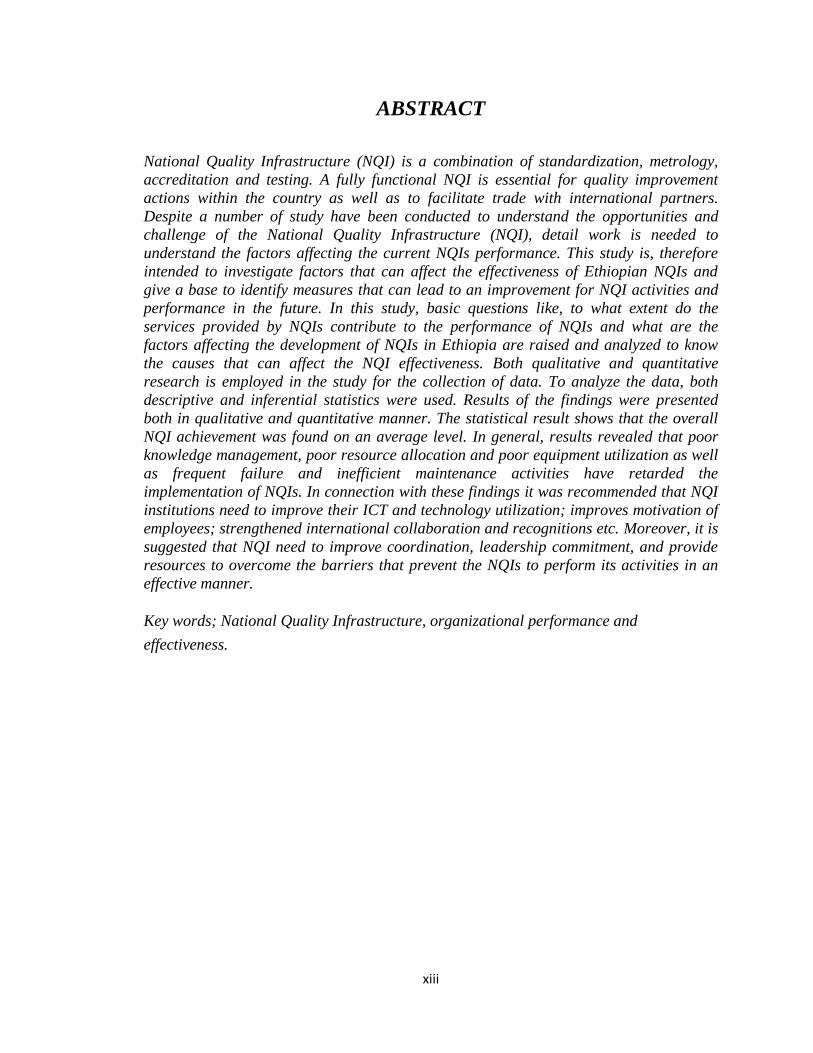
ABSTRACT
National Quality Infrastructure (NQI) is a combination of standardization, metrology,
accreditation and testing. A fully functional NQI is essential for quality improvement
actions within the country as well as to facilitate trade with international partners.
Despite a number of study have been conducted to understand the opportunities and
challenge of the National Quality Infrastructure (NQI), detail work is needed to
understand the factors affecting the current NQIs performance. This study is, therefore
intended to investigate factors that can affect the effectiveness of Ethiopian NQIs and
give a base to identify measures that can lead to an improvement for NQI activities and
performance in the future. In this study, basic questions like, to what extent do the
services provided by NQIs contribute to the performance of NQIs and what are the
factors affecting the development of NQIs in Ethiopia are raised and analyzed to know
the causes that can affect the NQI effectiveness. Both qualitative and quantitative
research is employed in the study for the collection of data. To analyze the data, both
descriptive and inferential statistics were used. Results of the findings were presented
both in qualitative and quantitative manner. The statistical result shows that the overall
NQI achievement was found on an average level. In general, results revealed that poor
knowledge management, poor resource allocation and poor equipment utilization as well
as frequent failure and inefficient maintenance activities have retarded the
implementation of NQIs. In connection with these findings it was recommended that NQI
institutions need to improve their ICT and technology utilization; improves motivation of
employees; strengthened international collaboration and recognitions etc. Moreover, it is
suggested that NQI need to improve coordination, leadership commitment, and provide
resources to overcome the barriers that prevent the NQIs to perform its activities in an
effective manner.
Key words; National Quality Infrastructure, organizational performance and
effectiveness.
1
CHAPTER ONE: INTRODUCTION
This chapter deals with the background of the study, the statement of the problem, the
objectives, the significance of the research work, the limitation and its scope, definition
of basic terms and the organization of the study.
1.1. Background of the Study
The National Quality Infrastructure (NQI) is the institutional framework that establishes
and implements maintain and control the practice of standardization, conformity
assessment, metrology, and accreditation. It enhances competitiveness by offering
authorization on the quality of products and services that they adhere to requirements of
governments or the market place. When used effectively, they facilitate international
trade and contribute to technology upgrading and absorption. Since the researcher have a
decade experience in the working environments of the NQI institutions and also has an
interest to know and contribute for the improvement of the NQIs performance, this study
was initiated. This initiation leads the researcher to focuses on those problems that can
have an impediment on the effectiveness of the NQIs performances. The 2015 and 2016
annual reports of the NQI institutions showed that there are problems regarding to
customer satisfaction, problem of implementation of system standards, problem of
stakeholder participation, failures in scientific equipments, and also inadequacy and
inefficiency of related NQI service provisions. Therefore this study has covered a wide
spectrum of factors to understand the things that can affect the NQI institutions
effectiveness.
In the literature, there is no single model of organizational effectiveness to fit all
organizations. To study the NQI effectiveness this study relied on four main approach
forwarded by (Balduck & Buelens, 2008). According to Balduck & Buelens, 2008 the
issue of effectiveness in organizations revolves round four main approaches: the system
resource approach, the goal approach, the strategic constituency approach and the internal
process approach. This model is being used for analyzing, the effectiveness of the NQIs.
2
The first extensively used approach in organizational effectiveness is the goal approach.
Its focus is on the output to figure out the essential operating objectives like profit,
innovation and finally product quality (Schermerhorn, Hunt, R. N. Osborn, & R. Osborn,
2004). The second approach which is named the system resource approach, explains the
effectiveness from the point of view of the ability to obtain necessary resources from the
environments outside the organization (Schermerhorn et. al., 2004). As the third
approach is known as the process approach which pays attention to the transformation
process and is dedicated to seeing the extent to which the resources are officially used to
give services or produce goods (Schermerhorn et. al., 2004). The fourth approach is the
strategic constituency approach, which deals with the effect of the organization on the
main stakeholders and their interests (Schermerhorn et. al., 2004). In line with these
approaches the effectiveness of the NQIs were studied from its internal and external
perspectives. The NQI is considered as an important tool that can be utilized to improve
competitiveness, to facilitate global trade, to facilitate international harmonization and
recognition. The goal of this study is to explore those factors that can affect the
effectiveness of Ethiopian NQIs and recommend and give suggestions to the institutions.
1.2. Statement of the Problem
Secondary data showed that the NQI institutions have conducted an independent
assessment to understand their respective organizational performance and effectiveness
focusing on customer and employee satisfaction, for which the satisfaction level is found
an average. Moreover, none of the institution has touched both the administrative and
technical aspect of the NQI functions in their studies to explore its effectiveness. This
thesis work discussed the importance, the central elements and the factors that affect the
effectiveness of the Ethiopian National Quality Infrastructure (NQI). The study got in
depth to understand those factors which can affect the effectiveness of the NQIs.
To understand the factors that can affect the NQIs effectiveness, the researcher has
analyzed NQI institutions' 2015 and 2016 annual report and found that there is a
noticeable problem in the sector with respect to quality service provision, management of
system standards, stakeholders participation and resource utilization within the
3
institutions. Generally the identified problem indicates that there is inefficiency of service
delivery of the NQIs. Moreover, according to the World Bank report of August 2016 the
Ethiopia’s NQI fails short of meeting the increasing demand from industries and suffers
from weaknesses that hinder promoting and strengthening the use of NQI services among
the private sector as tools to increase their competitiveness. These weaknesses include:
(i) Capability of service delivery of existing NQI institutions;
(ii) Lack of consultation on NQI service development with industries;
(iii) Low level of understanding on the NQI services among the private sector and local
consumers;
(iv) Inadequate incentives for industries to comply with quality standards;
(v) Lack of private NQI service providers;
(vi) Weak coordination and collaboration in the implementation of technical regulations
among the regulatory agencies and NQI institutions.
As a result of these indicated problems and weaknesses, there seems to emerge lack of
competitiveness of Ethiopian products and services and which then affect the
improvement and creativity in the country. Therefore, this study is dedicated to expose
and understand the factor that can affect effectiveness of the NQI's from resource
utilization, management of system standards, services and customer satisfaction, and
stakeholder participation and related issues in the indicated institutions.
In light of the above perspectives the study was guided by the following basic questions.
1) To what extent do the services provided by NQIs contribute to overall performance of
the firm in the selected textile, pharmaceuticals and metal industries and able to assist
them in product and process quality?
2) What are the factors affecting the development of NQIs in Ethiopia? In this research
question specific areas like awareness of the society on the role of NQIs, the extent of
resources such as manpower, finance and material as well as leadership were seen.
3) What is the level of the current performance of NQIs services?
4) To what extent that the activities of the NQI elements do affect NQIs effectiveness?

4
1.3. Objectives of the Study
1.4.1 General Objective
The general objective of this study is to investigate factors affecting the effectiveness of
Ethiopian NQIs.
1.4.2 Specific Objectives
1) To understand those factors which can have an effect in the effectiveness of the NQI?
2) To identify the current status of the NQI, especially its strengths, weaknesses and
challenges.
3) To provide the research findings to the NQI institutions.
1.4. Significance of the Study
This research is important to the NQI institutions to know their gap and to understand
what they have to do in the future. If this research would not be conducted and shows the
existing gaps, the problem in the area would be left unanswered for a while and they
could not be able to identify the root cause of the ineffectiveness in the NQI activities.
The findings of this study are also expected to guide and show proper direction to provide
adequate NQI services for institutions that have direct or indirect contribution in
implementing NQI activities. The findings of the study could also provide some new
strategies and show directions for policy maker to help them in reviewing and
formulating related policies. Furthermore, the study is expected to fill gaps in the
literature regarding factors affecting the effectiveness of the National Quality
Infrastructure, thereby add to the existing body of literature and can serve as a stepping
stone for future studies. For its practical implication the finding of this research work
could contribute to understand the major factors that can determine its effectiveness.
More specifically, the study addressed the major constraint around the NQI system in the
country. Generally, the importance can have both theoretical contribution and practical
implication.
5
1.5. Scope of the Study
This study focused on NQIs at Federal level, because the regional level NQIs are at their
infant stage for they have been established in not more than a year or two years. The
study focused in assessing the factors related to stakeholder participation, the extent of
services provided to industries by NQIs, and factors affecting the development of NQIs.
1.6. Limitation of the Study
Small number of respondents creates a limitation on the data coverage and limited the
researcher to get extra detail information to study the problem. Moreover, the tight
schedules of the NQIs manager forced the researcher to use limited contact time with
them to gather information through interview. Moreover, there were unreturned
questionnaires and improperly filled which were totally ignored. Thus, the research is
limited on the gathered information; out of 223 distributed questionnaires, only 162
(72.6%) correctly filled questionnaire were able to be collected.
1.7. Definitions of Key Terms
National Quality Infrastructure (NQI):- The NQI comprises a variety of organizations
each of which plays a role in establishing standards; evaluating whether products,
process, or services fulfill specified technical requirements; and certifying that these
requirements are met. Each of the central components of the NQI are National Metrology
Institute, National Standard Body, National Accreditation Body, Calibration Bodies,
Testing Bodies, Inspection Bodies, Certification Bodies, Enterprises, Authorities,
Consumers and General Public.
Effectiveness: Means the extent to which the organization's current performance system
meets the criteria for an effective performance appraisal system (McCann, 2004)
Organizational Effectiveness:- Organizational effectiveness is related to issues such as
the ability of an organization to access and attract resources and consequently achieve its
aims (Federman, 2006). The criterion of the organization's successful completion of their
purposes is through core strategies (McCann, 2004).
6
1.8. Organization of the Study
This study is structured into five chapters. The first chapter, which is the introductory
part, deals with the background of the study, overview of the study area, statement of the
problem, objectives and significance of the study, scope of the study and definition of the
key terms used in the study. Chapter two presents the review of the related literature
which treats the fundamental of the NQI system, the need for NQI and detailed
explanation on the NQI activities both in the international and national perspectives.
Moreover, the literature review describes theoretical issues regarding organizational
effectiveness. The research design and methodology is explicitly presented in the chapter
three of the research document. Chapter four is dedicated to discuss the results and the
findings obtained from the study. Finally, the summary of major findings, conclusions
and recommendations are explained in chapter five.
7
CHAPTER TWO : REVIEW OF THE RELATED LITERATURE
The chapter deals with the details of the theoretical issues in the National Quality
Infrastructure System, the importance of National Quality Infrastructure in Ethiopia, the
current status of the Ethiopian National Quality Infrastructure, Empirical Literature on
Organizational Effectiveness and the conceptual framework.
2.1. Theoretical Issues of the National Quality Infrastructure System
The core elements of a Quality Infrastructure fall under Metrology, Standardization,
Conformity Assessment and Accreditation. QI is not a disciplinary system; rather it seeks
to support technical competence and compliance with international requirements.
Technical competence makes it reliable for every kind of application so that, instead of
setting up costly parallel structures, industries, consumers, public sector and regulatory
bodies can all benefit from it for quality and for consumer protection purposes. When
properly implemented and recognized by governments, it reduces use of resources in
each ministry to a “one-stop shop” and serves for any kind of product and service.
(Clamense et. at., 2007)
Quality infrastructure is based on a number of components that are closely interrelated
and form a network whose logical links are based on a technical hierarchy. Five
components can be identified which have been described by (Sanetra & Marbán, 2007):
These five components comprise a national QI (NQI). Its fundamental institutions are the
metrology institute as well as the standards and the accreditation-body (Sanetra & Stoldt,
2014Marbán, 2007). The NQI, however, cannot been seen as an isolated system. In order
to get access to world markets and enhance international competiveness, a national QI
system must be oriented according to international framework conditions (). The service
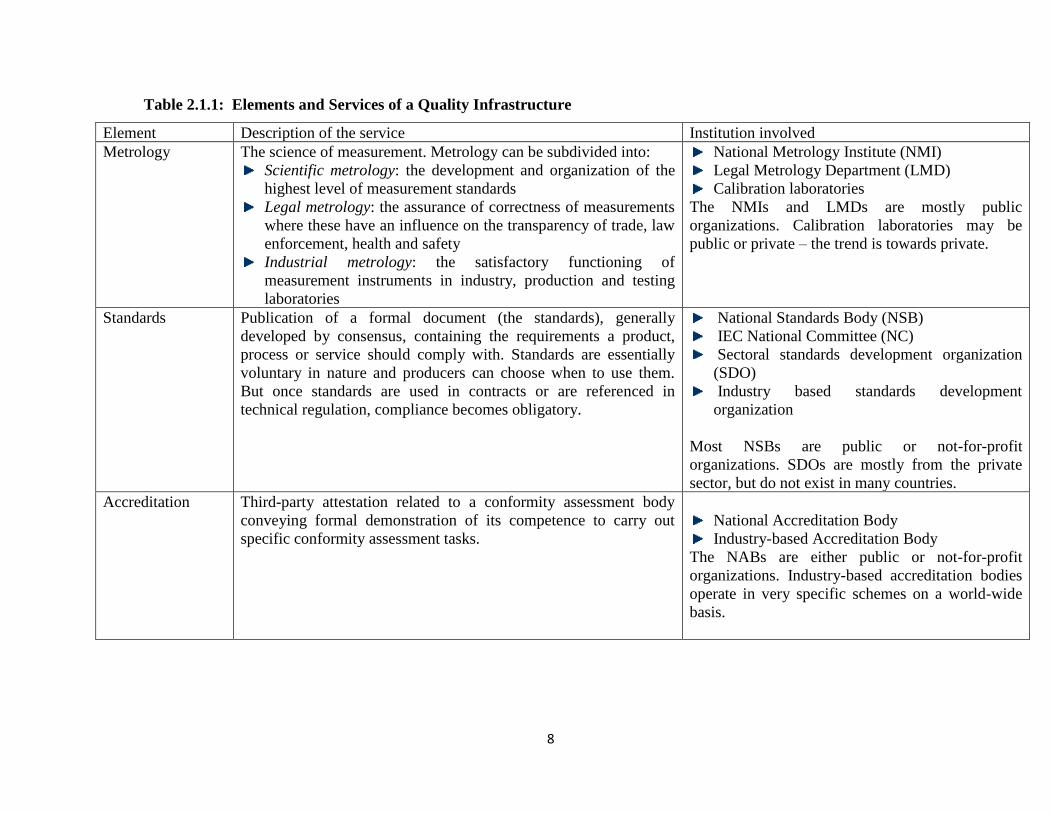
provided by the NQIs is described in Table 2.1.1. These NQI institutions are highly
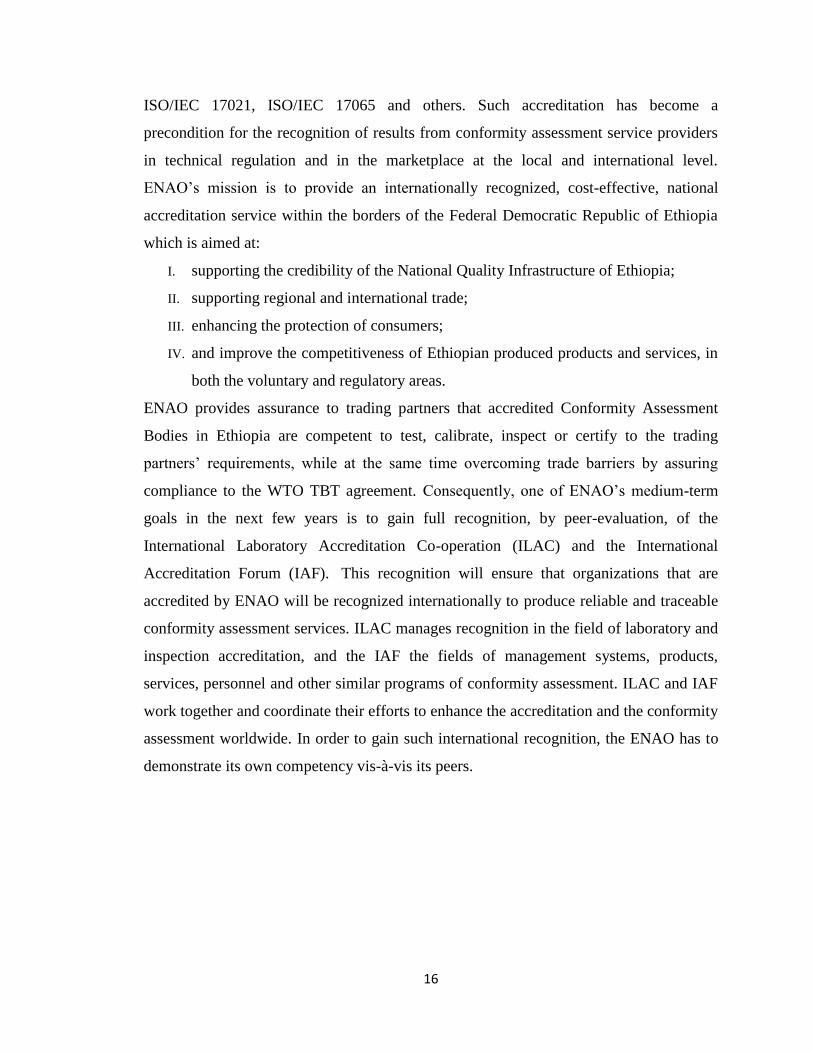
related each other in their function to realize their objectives; this is pictorial described on
figure 1 and figure 2.
8
Table 2.1.1: Elements and Services of a Quality Infrastructure
Element Description of the service Institution involved
Metrology The science of measurement. Metrology can be subdivided into:
Scientific metrology: the development and organization of the
highest level of measurement standards
Legal metrology: the assurance of correctness of measurements
where these have an influence on the transparency of trade, law
enforcement, health and safety
Industrial metrology: the satisfactory functioning of
measurement instruments in industry, production and testing
laboratories
National Metrology Institute (NMI)
Legal Metrology Department (LMD)
Calibration laboratories
The NMIs and LMDs are mostly public
organizations. Calibration laboratories may be
public or private – the trend is towards private.
Standards Publication of a formal document (the standards), generally
developed by consensus, containing the requirements a product,
process or service should comply with. Standards are essentially
voluntary in nature and producers can choose when to use them.
But once standards are used in contracts or are referenced in
technical regulation, compliance becomes obligatory.
National Standards Body (NSB)
IEC National Committee (NC)
Sectoral standards development organization
(SDO)
Industry based standards development
organization
Most NSBs are public or not-for-profit
organizations. SDOs are mostly from the private
sector, but do not exist in many countries.
Accreditation Third-party attestation related to a conformity assessment body
conveying formal demonstration of its competence to carry out
specific conformity assessment tasks.
National Accreditation Body
Industry-based Accreditation Body
The NABs are either public or not-for-profit
organizations. Industry-based accreditation bodies
operate in very specific schemes on a world-wide
basis.
9
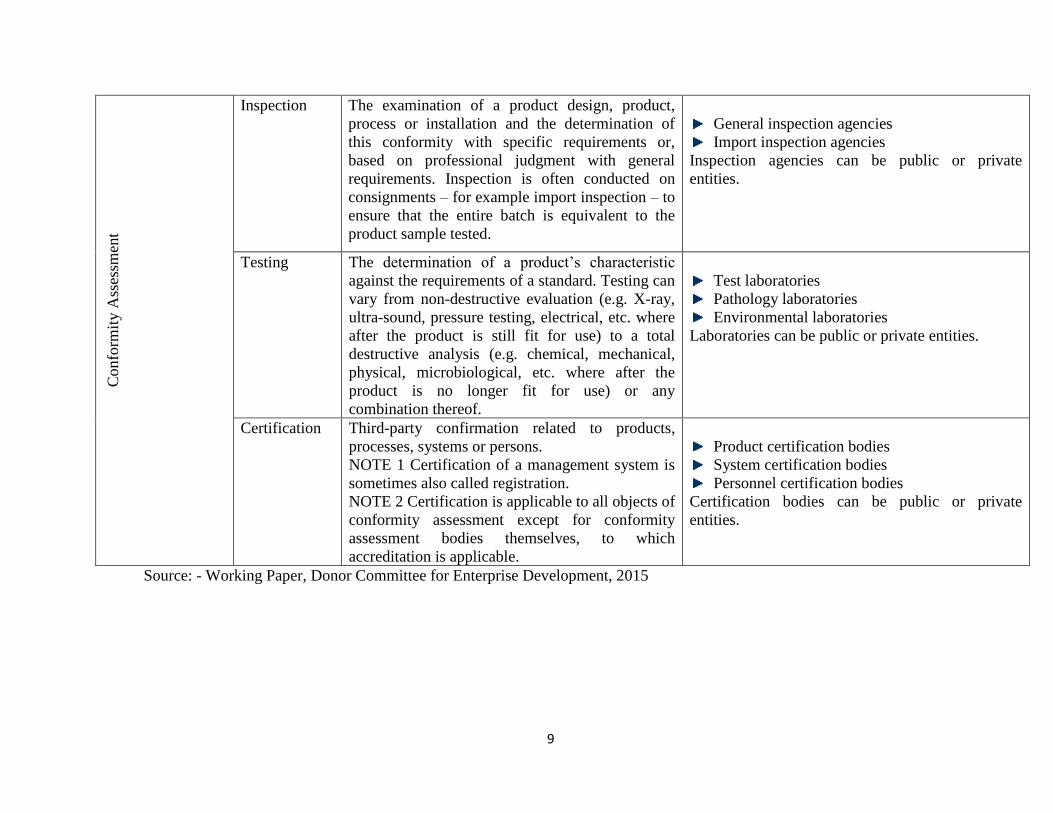
Confo
rmit
y A
sses
smen
t Inspection The examination of a product design, product,
process or installation and the determination of
this conformity with specific requirements or,
based on professional judgment with general
requirements. Inspection is often conducted on
consignments – for example import inspection – to
ensure that the entire batch is equivalent to the
product sample tested.
General inspection agencies
Import inspection agencies
Inspection agencies can be public or private
entities.
Testing The determination of a product’s characteristic
against the requirements of a standard. Testing can
vary from non-destructive evaluation (e.g. X-ray,
ultra-sound, pressure testing, electrical, etc. where
after the product is still fit for use) to a total
destructive analysis (e.g. chemical, mechanical,
physical, microbiological, etc. where after the
product is no longer fit for use) or any
combination thereof.
Test laboratories
Pathology laboratories
Environmental laboratories
Laboratories can be public or private entities.
Certification Third-party confirmation related to products,
processes, systems or persons.
NOTE 1 Certification of a management system is
sometimes also called registration.
NOTE 2 Certification is applicable to all objects of
conformity assessment except for conformity
assessment bodies themselves, to which
accreditation is applicable.
Product certification bodies
System certification bodies
Personnel certification bodies
Certification bodies can be public or private
entities.
Source: - Working Paper, Donor Committee for Enterprise Development, 2015
10
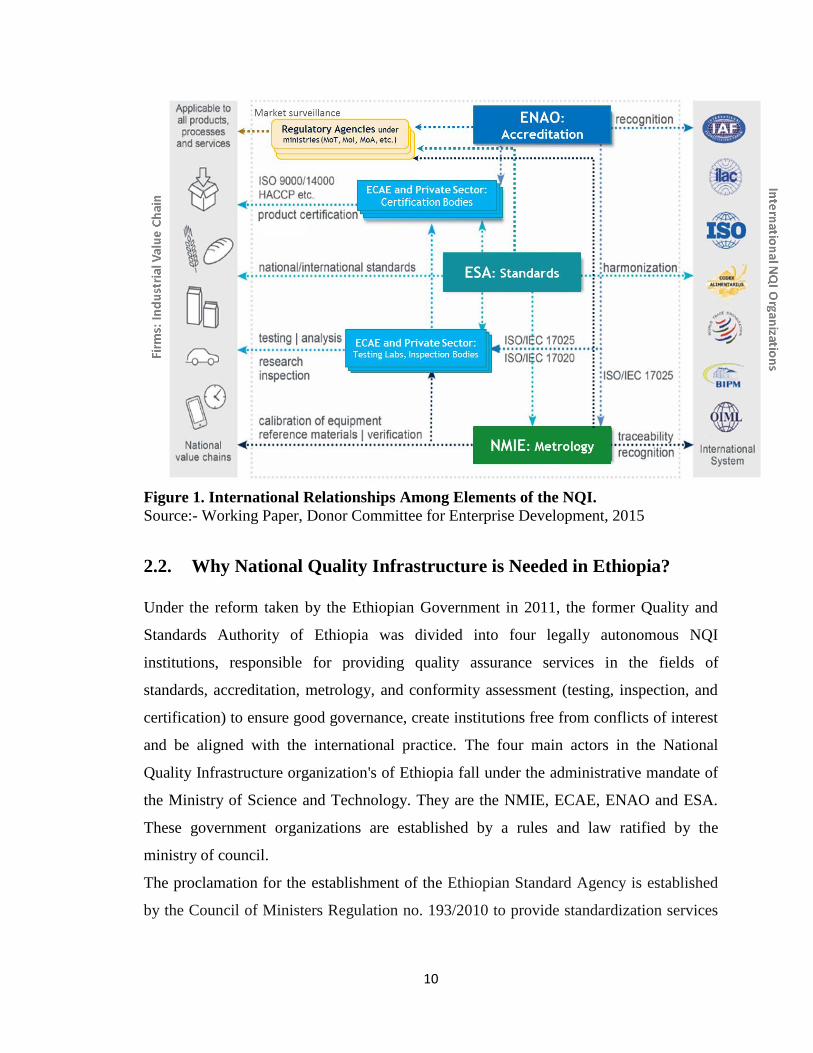
Figure 1. International Relationships Among Elements of the NQI.
Source:- Working Paper, Donor Committee for Enterprise Development, 2015
2.2. Why National Quality Infrastructure is Needed in Ethiopia?
Under the reform taken by the Ethiopian Government in 2011, the former Quality and
Standards Authority of Ethiopia was divided into four legally autonomous NQI
institutions, responsible for providing quality assurance services in the fields of
standards, accreditation, metrology, and conformity assessment (testing, inspection, and
certification) to ensure good governance, create institutions free from conflicts of interest
and be aligned with the international practice. The four main actors in the National
Quality Infrastructure organization's of Ethiopia fall under the administrative mandate of
the Ministry of Science and Technology. They are the NMIE, ECAE, ENAO and ESA.
These government organizations are established by a rules and law ratified by the
ministry of council.
The proclamation for the establishment of the Ethiopian Standard Agency is established
by the Council of Ministers Regulation no. 193/2010 to provide standardization services
11
in the country. Some of the power and duties given for the agency, which is relevant to
this research topic is stated as follow:
i. develop, implement and follow up standardization strategy for the purpose of
quality promotion activities which are in line with the country's developmental
programs;
ii. recognize any standard published by a national, regional, intimation or any other
standardization body as Ethiopian standard, as may be relevant;
iii. establish national technical committees for the purpose of developing Ethiopian
standards and determine their working guidelines;
iv. establish national enquiry point and deliver services on standardization,
conformity assessment guidelines and technical regulations; develop and
implement awareness creation strategies for consumers on quality and standards;
v. build the capability of companies through technical support, training and
consultancy services for developing their own company standards;
Powers and duties of the NMIE granted by the proclamation No. 194/2010, which is
relevant to the topic of this study, are described below;
i. transform existing traditional measurement instruments into modernity trough
introducing international system of units and by enabling to use other acceptable
measurement instruments in the country; determine, and maintain national
measurement etalons;
ii. based on other countries best practices, provide support in building the capacities
of universities and research in situations in curriculum designing and
implementation process and conducting research in the field of metrology;
iii. represent the country's interest in international forums regarding metrology and
follow up the implementation of treaties to which Ethiopia is a party;
iv. work in cooperation with the relevant stakeholders to ensure the existence of an
integrated support for strengthening the national . quality infrastructure;
v. conduct research in the field of metrology in collaboration with universities and
research in situations and disseminate the results thereof to industries;
Ethiopian National Accreditation office Re-establishment by a regulation No. 279/2012
to perform the following activities
12
i. To provide accreditation service to conformity assessment bodies based on
national and international requirements.
ii. Issue and implement directives governing the accreditation process, in
particular, the assessment of applicants and granting, suspending and
withdrawing of accreditations and handling of grievance relating thereto.
iii. Works in collaboration with the relevant stakeholders to ensure the existence
of an integrated support for strengthen the national quality infrastructure.
iv. Represent the country's interest in international forums regarding accreditation
and follow up the implementation of treaties to which Ethiopia is a party.
The Ethiopian-Conformity Assessment Enterprise is established by the Council of
Ministers Regulation No. 196/2010. The purposes for which the Enterprise is established
are, by organizing robust certification, inspection and testing laboratory services, to:
i. provide certificate of conformity to production enterprises or service providers
by assessing the conformity of their production processes or service
provisions to the relevant national or international standards and legal
requirements;
ii. provide certificate of conformity with respect to the country’s export products
by assessing their conformity to the relevant Ethiopian standards, international
standards or the standards of other countries;
iii. provide certificate of conformity with respect to imported products by
assessing their conformity to the relevant national or international’ standards
and legal requirements;
2.3. Current Status of the Ethiopian National Quality
Infrastructure.
2.3.1. Ethiopian Standard Agency
The Ethiopian Standard Agency (ESA) is a governmental organization established by the
proclamation of the council of ministers regulation no. 193/2010 to provide
standardization services in the country. The primary responsibilities of ESA are to
oversee the development of national standards and to publish the same. Ethiopian
standards agency has three core business areas which mainly focus on the standard
13
formulation, training and Technical support and organizing and disseminating standards,
Conformity assessment procedures and Technical regulation for the customers
The most important functions of ESA are:
i. To lead and coordinate national standardization.
ii. To confirm and publish the national Ethiopian Standards;
iii. To promote the implementation of standards;
iv. To Promote Ethiopian Standard Mark and authorize its use;
v. To represent Ethiopia in the International Standards Organization and work in
collaboration with other foreign national standard bodies;
vi. To establishes National Enquiry Point and deliver services on Standardization,
Conformity Assessment Guidelines and Technical Regulation;
vii. To enable Ethiopian industries to benefit from technology transfer by providing
Technical Support, Trainings and Consultancy Services and assisting them in
implementation of standards.
The standards development sector takes place in technical committees which are
representative of all stakeholders. With respect to standards information the ESA has a
well equipped standards information centre, where users can obtain up-to-date
information on international, regional and national standards, also of main trading
partners, or are able to purchase the document.
2.3.2. National Metrology Institute of Ethiopia
The National Metrology Institute of Ethiopia (NMIE) is a governmental institute that is
established by the Council of Ministers regulation No. 194/2010. The mission of the
NMIE is to make the society beneficiary of the modern measurement system by
implementing national measurement system based on the internationally accepted
practices.
The main responsibility of the NMIE is to ensure that any measurement made in a
country can be traced to the International System of Units (the SI) via international
standards, thereby helping to facilitate acceptance of products, processes, measurements
and testing in the local and foreign markets. The institute is also responsible for the
14
maintenance of Ethiopian National Measurement Standards and Certified Reference
Materials (CRM). It also provides calibration, training and consultancy services in the
areas of metrology and scientific equipments. NMIE perform its activities in Addis
Ababa as a head office and has branches laboratories at Desie, Jimma, Bahirdar, Awassa
and Diredawa.
NMIE is a member of the Inter Africa Metrology Organization (AFRIMETS) and is an
associate member of the BIPM. It is through this cooperation that the country’s
measurement system will gain international recognition. The list of the NMIE's
Calibration and Measurement Capabilities (CMCs) needs to be recognized through key
comparisons and peer evaluations, and thereafter listed in the key comparison database
(KCDB) managed by the BIPM. Without such CMC entries, the country’s industry will
find it hard in the long run to gain acceptance of measurement results in the international
markets.
2.3.3. Ethiopian Conformity Assessment Enterprise
The Ethiopian-Conformity Assessment Enterprise is a governmental organization which
is Establishment Council of Ministers Regulation No. 196/2010 it is a federal owned
Public Enterprise, governed by the Ministry of Science and Technology. ECAE’s mission
is to provide internationally accepted and recognized testing, inspection and
certification services for exporters, producers, service providers, regulatory bodies,
consumers and importers as well as the public through credible, effective, accessible and
efficient conformity assessment services to ensure the availability of quality products and
services. ECAE has 6 specialized testing laboratories operating at the head quarter, and 5
of them are accredited (Chemical, Electrical, Mechanical, Microbiology & textile)
Radiation laboratory is in process to be accredited. Chemical laboratory is one of those
accredited laboratories, the products Tested by ECAE's Chemical Laboratory among
many are the chemical and agricultural and food products are some among many. Under
electrical laboratory solar battery charge controller, solar panel, solar inventor, electric
cable, electric wires, circuit breakers, plug and socket outlets are some of the equipments
which are getting services.
The Textile and Leather laboratory of the ECAE's textile and leather laboratory is
performing a test for Textile fabric, paper, pulp, paper board, paper products, and chrome
15
crust leather. The ECAE's mechanical laboratory is performing a test of galvanized steel
wire, corrugated/plain steel sheets, nails, reinforcement steel bars, cement, building lime,
hollow concrete blocks, roof tiles, ceramic wall and floor tiles, course and fine/
aggregate, concrete cubes, river sand are some from many. ECAE provides Certification
services for product, system, persons and certified companies based on Mandatory and
Voluntary Ethiopian Standards and International Standards. ECAE provide international
training and certification on Quality Management with the collaboration of Quality
Austria. The international qualification programs offered by ECAE are Quality
Management Representative, Quality Management Internal Auditor and Quality
Management Technician. ECAE provides independent third-party and internationally
accredited inspection services on the following areas based on ISO/IEC 17020. Factory
Evaluation:- Inspecting whether factories/industries are following the required
manufacturing systems during production process. Pre-Production Inspection: Inspecting
the raw materials and components to be used during the production process. During
Production Inspection: Inspecting after the first product leave the production line for any
defects or deviation from quality parameters and suggesting practical and effective ways
in which these can be improved.
Pre-Shipment Inspection: Inspecting the merchandise when it is packed and ready for
shipment by pulling out random samples based on international sampling techniques
verifying quantity, function, color, size, specifications, labeling details to make sure that
requirements are met Supervision of Loading: After pre-shipment inspection is over
inspecting the loading materials appropriateness, environmental conditions, cleanliness
and integrity of the containers to ensure the safety deliver of the products
2.3.4. Ethiopian National Accreditation Office
Ethiopian National Accreditation Office (ENAO) is a governmental institute that is re-
established by the Council of Ministers regulation No. 279/2012. The key responsibility
of the ENAO is to give formal recognition those laboratories of various kinds,
certification bodies, inspection bodies, proficiency scheme providers and good laboratory
practice test facilities are competent to carry out specific tasks. The ENAO accreditation
process is based on international standards such as ISO/IEC 17025, ISO/IEC 17020,
16
ISO/IEC 17021, ISO/IEC 17065 and others. Such accreditation has become a
precondition for the recognition of results from conformity assessment service providers
in technical regulation and in the marketplace at the local and international level.
ENAO’s mission is to provide an internationally recognized, cost-effective, national
accreditation service within the borders of the Federal Democratic Republic of Ethiopia
which is aimed at:
I. supporting the credibility of the National Quality Infrastructure of Ethiopia;
II. supporting regional and international trade;
III. enhancing the protection of consumers;
IV. and improve the competitiveness of Ethiopian produced products and services, in
both the voluntary and regulatory areas.
ENAO provides assurance to trading partners that accredited Conformity Assessment
Bodies in Ethiopia are competent to test, calibrate, inspect or certify to the trading
partners’ requirements, while at the same time overcoming trade barriers by assuring
compliance to the WTO TBT agreement. Consequently, one of ENAO’s medium-term
goals in the next few years is to gain full recognition, by peer-evaluation, of the
International Laboratory Accreditation Co-operation (ILAC) and the International
Accreditation Forum (IAF). This recognition will ensure that organizations that are
accredited by ENAO will be recognized internationally to produce reliable and traceable
conformity assessment services. ILAC manages recognition in the field of laboratory and
inspection accreditation, and the IAF the fields of management systems, products,
services, personnel and other similar programs of conformity assessment. ILAC and IAF
work together and coordinate their efforts to enhance the accreditation and the conformity
assessment worldwide. In order to gain such international recognition, the ENAO has to
demonstrate its own competency vis-à-vis its peers.
17
Figure 2. Interaction of NQI elements
Source:- World Bank 2007
2.4. Empirical Literature on Organizational Effectiveness
Organizational effectiveness is a multifaceted concept; there are several approaches to
explain what it means. Since organizational effectiveness is a complex concept, there are
a number of approaches to explain what it means. Various organizational theories are
structured based on the different conditions and organizational factors while effectiveness
is one of the most used criteria (Baker et.al., 1997) and (Ajilia, 2006). According to
(Kushner & Poole, 1996) the effectiveness of an organization can be evaluated using four
18
components which are resource acquisitions, efficiency, goal achievement, and customer
satisfaction. (Parhizgari & Gilbert, 2004) assume that a domain including effective
factors can be defined with its constraints due to feasibility considerations for each
company, or each industry, or each sector and the measurement of organizational
effectiveness could be done based on this domain of effective factors using the views of
the employees and/or the customers. In the literature, there is no single model of
organizational effectiveness to fit all organizations. According to (Balduck & Buelens,
2008), the issue of effectiveness in organizations revolves round four main approaches:
the system resource approach, the goal approach, the strategic constituency approach and
the internal process approach. These are effective and efficient approaches which are
dependent upon the type of situation to arise.
2.4.1. The Goal Approach
The goal approach focus is on the output to outline the essential operating objectives like
profit, improvement and finally product quality (Schermerhorn et. al., 2004). According
to Robbins, 2003 the basic assumptions for the goal approach is that there should be a
general agreement on the specific goals and the people involved should feel committed to
fulfilling them. The next assumption is that the number of goals is limited and achieving
them requires certain essential resources.
2.4.2. The System Resource Approach
This approach focused on the inputs. It explains the effectiveness from the point of view
of the ability to obtain necessary resources from the environments outside the
organization (Schermerhorn et. al., 2004). The application of system resource can be
effective if a clear relation exists between the resources which an organization receives
and the goods or services it produces (Cameron, 1981). This approach invites managers
to consider the organization not only as a whole but as a part of a larger group as well.
2.4.3. The Process Approach
The third approach is known as the process approach which pays consideration to the
transformation process and is dedicated to seeing to what extent the resources are
officially used to give services or produce goods (Schermerhorn et. al., 2004). By
19
effectiveness, it is meant that the organization is internally well and efficient and the
internal processes and measures in that place are quite well oriented. In an effective
organization, there is no trace of stress and damage. The members are completely part of
the system and the system itself works smoothly. The relationship between the members
is based on faith, integrity, and good will.
2.4.4. The Strategic Constituency Approach
It deals with the effect of the organization on the main stakeholders and their interests
(Schermerhorn et. al., 2004). Based on this approach, effectiveness refers to the smallest
agreement of all of the strategic constituencies of the organization. Strategic constituency
involves all the people that are somehow associated to the organization. These people
may have different roles such as the users of the services or products of the organization,
the resource suppliers, the facilitators of the organization’s output, the main supporters
and the dependents of the organization (Cameron, 1981).
20
CHAPTER THREE: THE RESEARCH DESIGN AND
METHODOLOGY
(Kumar, 1999) stated that a research design is a procedural plan that is adopted by
researchers to answer questions objectively, accurately, economically and with validity.
Moreover, (Bryman & Bell, 2007) stressed that research design should provide the overall
structure and orientation of an investigation as well as a framework within which data can be
collected and analyzed. Therefore in this study a detailed descriptions of the essential
considerations in designing the research project which encompass the research method,
source of samples data and sampling techniques, data gathering instruments, procedure of
data collection, methods of data analysis and ethical considerations.
3.1. The Research Design
This study used a mixed method of design. (Creswell, 2007) described that a strong
mixed design study should start with a mixed methods research question, to shape the
methods and the overall design of a study. Mixed type approach was used for both
qualitative and quantitative methods. The research was examined in qualitative and
quantitative for the fact that the focus of the research had on understanding and
interpretation of the data, as well it deals with the effects of variables that affects the NQI
effectiveness. More specifically, in this study exploratory design was employed.
Regarding the importance of exploratory design experiences depict that if any event is
taught to be new to the research participants, it is advisable to have a clear picture of the
phenomena prior to collecting data. (Saunders, Lewis & Thronhill, 2004)
3.2. The Research Methods
In this study a descriptive survey method was used for it used to measure the
characteristics described in the research question, which portray an accurate profile of a
person, his or her attitude and beliefs. In connection with the application of descriptive
survey method, it was stated that this method is a method of investigation which attempts
to describe and interpret what exists at present in the form of conditions, practice,
21
process, trends, effects, attitudes, beliefs, etc ( Crosswell & Plano Clark, 2011). More
specifically, cross sectional descriptive survey method was employed in this study for it
is a method to collect data only once at time.
3.3. Source of Data
In this study both the primary and secondary sources of data was used. Primary source of
data was collected from interview, observation and questionnaire from NQI and industry
respondents. Moreover data collection through literature review, journals, and periodicals
was referred as secondary sources of data.
3.4. Samples and Sampling Techniques
During designing samples, (Copper & Schindler, 2008) suggested that the following
should be clearly described: the target population, parameters of interest, sampling frame,
appropriate sampling method and the required sample size of the sample. The target
population of this study included management member and experts from NQI institutions
(NMIE, ECAE, ESA and ENAO). The sample was taken from the target population
being researched. As a sample, the senior technical staff of NQIs was selected using
purposive sampling techniques for they were assumed to be rich in information.
(Cresswell, J. W., & Plano Clark, V. L., 2011), stated that purposive sampling involves
identification and selection of individuals or groups of individuals that are proficient and
well-informed with a phenomenon of interest. The reasons for this purposive sampling
was because that the researcher believes that these people can satisfy and reliable because
of the following criteria. Firstly, they are working directly on specialized assignment on
NQI core issues and are experts in the field of quality infrastructure. Secondly, they are
the one who works in international recognition area and even some of them are
participating as a member in international organizations. Thirdly, they are the ones that
manage to liaison between their organization and stakeholders in quality related issues in
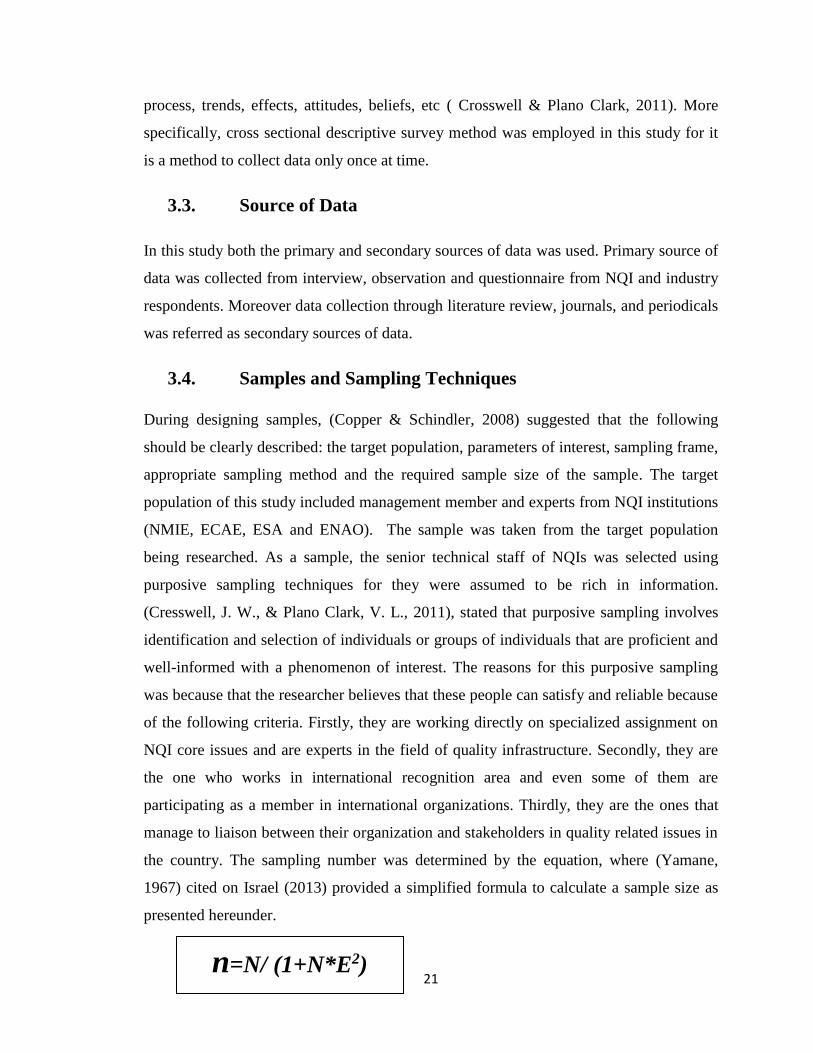
the country. The sampling number was determined by the equation, where (Yamane,
1967) cited on Israel (2013) provided a simplified formula to calculate a sample size as
presented hereunder.
n=N/ (1+N*E2)

22
Where n stands for number of sample, N stands population size, and E stands for margin
of error. In this study the confidence interval was used is 95% and estimated population is
one hundred fifty two, which comprises experts and management of NQI institutions.
Based on this technique, the sample size taken was one hundred and thirty three
respondents. First the number of sample from each institution of the NQIs was calculated
using proportional sampling techniques and data were collected using simple random
sampling techniques. A proportional stratified sampling technique is used because this
technique enables to give an equal chance for the respondents to be selected (Battaglia &
M. P., 2008).
Table 3.4.1. Population, Sampling Frame and Number of Respondents from NQI
Institutions.
No
.
Organiza
tion
Total
experts
Manageme
nt Expert
Total
numbe
r
Selected Department for
sampling the experts
Total sampling
using
proportionate
1 NMIE 50 10 606060 Industrial and scientific
Metrology Directorate
52
2 ECAE 35 10 45 Testing, Certification
and inspection
departments.
40
3 ESA 20 10 30 Standard Preparation and
from training
26
4 ENAO 10 7 17 Inspection and testing 15
Total 115 37 152 133
Moreover, based on the customer registration data base of the NQI institutions, it was
obtained that about two hundred different companies were getting direct services in
standardization, calibration, testing, inspection and consultancy services in their core
business area. From these institutions the Textile, Leather, Pharmaceuticals and Metal
Industry found in Addis Ababa have been taken as a population of interest for this study
and selected using purposive sampling techniques. As shown in the tables below from a
population of one hundred around ninety samples were taken using the formula of
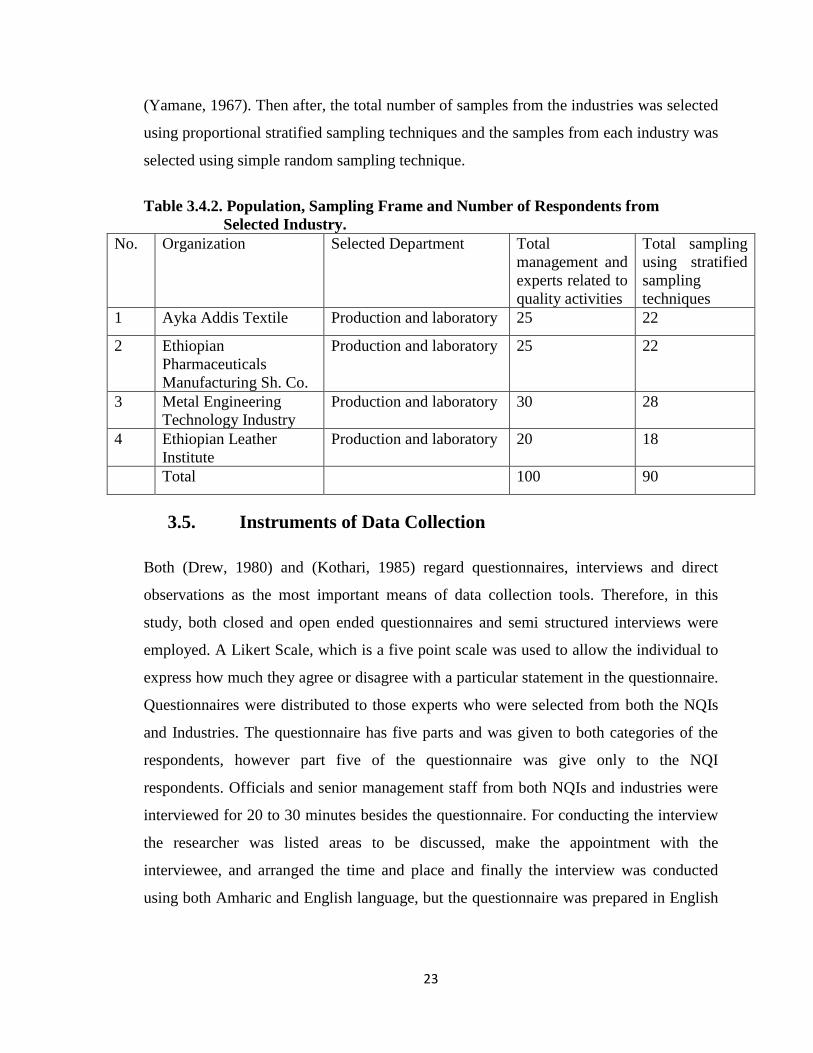
23
(Yamane, 1967). Then after, the total number of samples from the industries was selected
using proportional stratified sampling techniques and the samples from each industry was
selected using simple random sampling technique.
Table 3.4.2. Population, Sampling Frame and Number of Respondents from
Selected Industry.
No. Organization Selected Department Total
management and
experts related to
quality activities
Total sampling
using stratified
sampling
techniques
1 Ayka Addis Textile Production and laboratory 25 22
2 Ethiopian
Pharmaceuticals
Manufacturing Sh. Co.
Production and laboratory 25 22
3 Metal Engineering
Technology Industry
Production and laboratory 30 28
4 Ethiopian Leather
Institute
Production and laboratory 20 18
Total 100 90
3.5. Instruments of Data Collection
Both (Drew, 1980) and (Kothari, 1985) regard questionnaires, interviews and direct
observations as the most important means of data collection tools. Therefore, in this
study, both closed and open ended questionnaires and semi structured interviews were
employed. A Likert Scale, which is a five point scale was used to allow the individual to
express how much they agree or disagree with a particular statement in the questionnaire.
Questionnaires were distributed to those experts who were selected from both the NQIs
and Industries. The questionnaire has five parts and was given to both categories of the
respondents, however part five of the questionnaire was give only to the NQI
respondents. Officials and senior management staff from both NQIs and industries were
interviewed for 20 to 30 minutes besides the questionnaire. For conducting the interview
the researcher was listed areas to be discussed, make the appointment with the
interviewee, and arranged the time and place and finally the interview was conducted
using both Amharic and English language, but the questionnaire was prepared in English
24
language because participants of this study are assumed that they are educated in English
language.
3.5.1. Standardization of Data Gathering Instruments
3.5.1.1. Validity
According to (Paul, 1998) validity is defined as how much any measuring instrument
measures what it is intended to measure. Validity is the most critical criterion and indicates
the degree to which an instrument measures what it is supposed to measure. There are three
types of validity check for data. These are: (i) Content validity; (ii) Criterion-related validity
and (iii) Construct validity, according to (Kothari, 1985).
(i) Content validity is the extent to which a measuring instrument provides adequate coverage
of the topic under study, ii) Criterion-related validity relates to our ability to predict some
outcome or estimate the existence of some current condition and iii) Construct validity is the
most complex and abstract. A measure is said to possess construct validity to the degree that
it confirms to predicted correlations with other theoretical propositions. It is believed that
the instrument of this research work contains a representative sample of the population of
both the NQI and industry respondents. The sample drawn from the population that was
taken from the log book of the NQI institutions which shows institutions that frequently
uses NQI's services in the year 2017.
3.5.1.2. Reliability
The validity of the data gathering tools was checked by selecting ten experts, who have
back ground and experience on the issue under the study. And then the reliability of the
tools was checked using Cronbach’s alpha values. The descriptive statistics helped to
determine uni-dimensionality and construct validity of the measures and the Cronbach’s
alpha values of the factors helped to show the reliability about the factor affecting the
NQIs effectiveness and its performance scales. The Cronbach’s alpha measures the
internal consistency of a group of items by measuring the homogeneity of the group of
items. “It is an indication of how well the different items complement each other in their
measurement of different aspects of the same variable or quality” (Litwin, 2003, p.22).
25
Cronbach’s alpha ranges in value between zero and one. Values closer to one indicate a
higher internal consistency; values closer to zero indicate a lower internal consistency.
(McMillan & Schumacher, 2001) suggest that groups of items with an alpha below 0.70
should be used with caution. The internal consistency of a scale can also be examined
with item-to-scale correlations and inter-correlations of items within a scale (DeVellis,
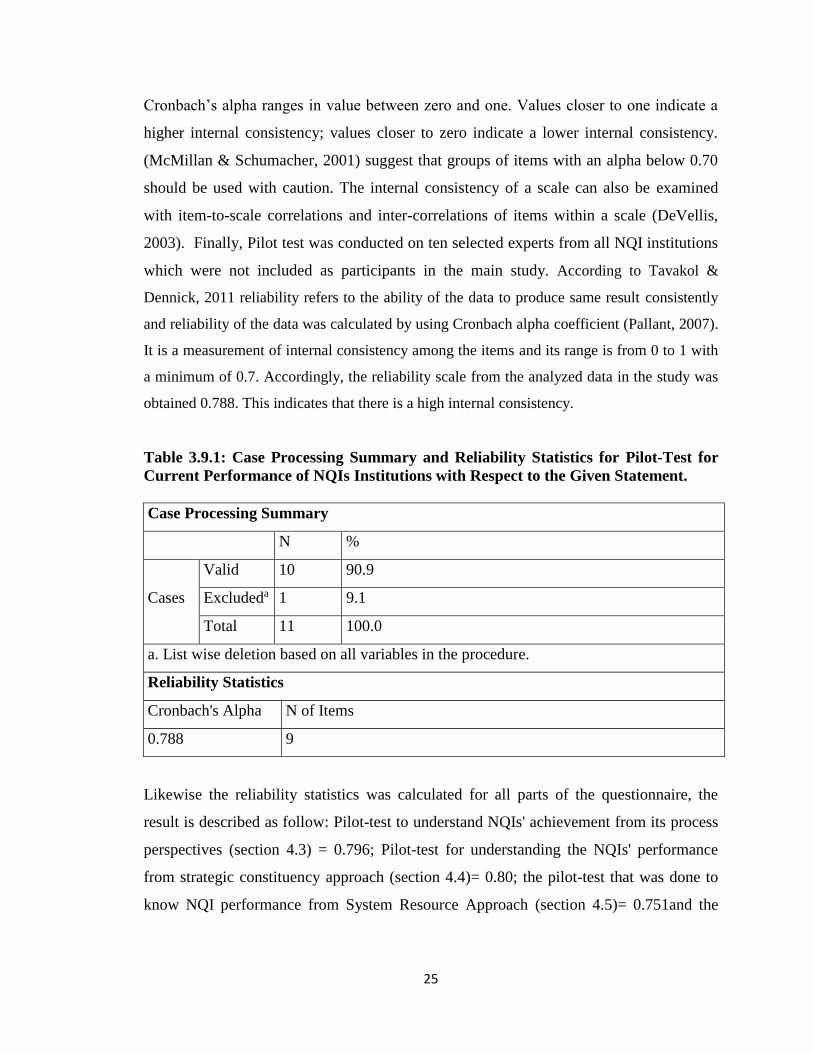
2003). Finally, Pilot test was conducted on ten selected experts from all NQI institutions
which were not included as participants in the main study. According to Tavakol &
Dennick, 2011 reliability refers to the ability of the data to produce same result consistently
and reliability of the data was calculated by using Cronbach alpha coefficient (Pallant, 2007).
It is a measurement of internal consistency among the items and its range is from 0 to 1 with
a minimum of 0.7. Accordingly, the reliability scale from the analyzed data in the study was
obtained 0.788. This indicates that there is a high internal consistency.
Table 3.9.1: Case Processing Summary and Reliability Statistics for Pilot-Test for
Current Performance of NQIs Institutions with Respect to the Given Statement.
Case Processing Summary
N %
Cases
Valid 10 90.9
Excludeda 1 9.1
Total 11 100.0
a. List wise deletion based on all variables in the procedure.
Reliability Statistics
Cronbach's Alpha N of Items
0.788 9
Likewise the reliability statistics was calculated for all parts of the questionnaire, the
result is described as follow: Pilot-test to understand NQIs' achievement from its process
perspectives (section 4.3) = 0.796; Pilot-test for understanding the NQIs' performance
from strategic constituency approach (section 4.4)= 0.80; the pilot-test that was done to
know NQI performance from System Resource Approach (section 4.5)= 0.751and the
26
pilot-test that was done to know the NQIs' achievement (section 4.6)= 0.815 and these
shows that there is a high internal consistency among the variable.
3.6. Procedures of Data Collection
After checking and conducting test for reliability and the pilot test, the data gathering
instruments was edited. Then after, data were collected by the researcher. Accordingly,
the researcher had set up respondents for the research individuals, groups, and a panel of
respondents whose opinion might seek on specific issues. Interviewing and
questionnaires were the two main data collection methods in survey research. From a
total of 223 questionnaires that were distributed to both the NQIs and the industries
respondents found in Addis Ababa, a total of 162 questionnaires, which is 72.64%, were
collected. Finally, data was also collected using participant observation using checklists.
3.7. Methods of Data Analysis
The quantitative data first had been organized and put into tables to suit for analysis.
Then after these data were analyzed using descriptive statistical methods like mean,
standard deviation and percentages and be calculated suing statistical package for the
social sciences (SPSS) version 20. Other than this, the qualitative data was transcribed
and then coded and put into categories and discussed. Moreover, a two tailed t -test as an
inferential statistical method was employed to analyze if there is idea difference between
the two groups of respondents. Finally the two types of data were triangulated to forward
summaries, conclusions and recommendations.
3.8. Ethical Consideration
The researcher informed the respondents that the information collected from them will
not be used for any other purpose other than this research objective. During data
collection a brief explanation was given to the respondents about the benefit obtained
from this research activity. Moreover they are informed that the information given by the
respondent was used only for the purpose of this research and their rights and well-being
is adequately protected.
27
CHAPTER FOUR: RESULT AND DISCUSSION
This chapter has six sub sections, section 4.1 presents the demographic characteristics of
the respondents, section 4.2 describes about the analysis of current performance of NQIs
institutions, section 4.3 deals with the analysis of NQIs' achievement from its process
perspectives, section 4.4 illustrates the NQIs' performance from strategic constituency
approach, section 4.5 presents the NQI performance from system resource perspectives
and the last section (4.6) describes about the NQIs' achievement from its expected goal
and outcome.
4.1 Demographic Characteristics of the Respondents
A total of 162 (male=129, female=33) person were participated in the study. From this,
102 participants were from the NQI institution and 60 participants were from the
industry. Thus, table 4.1.1 and Table 4.1.2 below represent the profile of the research
participant from NQI institutions and from selected industries getting services from NQI
institutions respectively in terms of sex, age, educational qualification and years of
experience in their current working positions in their respective organization as well as
their total work experiences. Moreover, twelve participants from NQI and twelve
participants from industry were participated on interview questions, i.e from each
selected institutions four interviewee were selected.
Table 4.1.1. The profile of the Respondents from NQI Institution.
No. Variable F Percent
1 Gender Male 85 83.33
Female 17 16.67
2 Age
18-25 3 2.78
26-35 70 68.63
36-45 21 20.37
>45 9 8.52
3
Education
Level Diploma 3 2.78
First Degree 95 93.52
Second Degree and above 4 3.7
4
Work
Experience in
years
1- 5 36 35.19
6-10 41 39.81
11-15 11 10.19
>15 4 3.7
Source: Data collected by the researcher through Questionnaire, 2018

28
From Table 4.1.1 above, it could be seen that 85 (88.33%) of the respondents from NQI
institutions were male and 17 (16.6%) were females. From this finding, it could be
deduced that female participation in NQI institutions seems below expected which in turn
could affect the performance levels of the NQI institutions.
Concerning the age distributions of the participants from NQI institutions, only 3 (2.78%)
were aged from 18-25; 70 (76.3%) were having their ages from 26-35; Moreover, 21
(20.37%) were aged from 36-45 while the rest 9 (8.52%) were above 45 years old. From
this one can infer that most of the respondents are at their energetic ages to carry out their
responsibilities in their respective institutes.
From the same Table, it could also be seen that 99 (97.22%) of the research participants
from NQI institutions have qualifications equal to and above first degree while the rest 3
(2.78%) were qualified at diploma level. This shows that there are adequate number of
intellectuals in the institutions where is could have high contribution to promote the
service provision of the NQI institutions if their commitment is added.
With regard to work experience of the participants from NQI institutions 36 (35.19%)
have served from one to five years, 51 (50%) have experience from six to ten years, 11
(10.9%) were having a services years from eleven to fifteen years and 4 (4.7%) have
served above 15 years in their respective organizations. From this, it could be inferred
that the staff of the NQI institutes have adequate experiences to implement what they
have been assigned to do in their respective institutions.
In general the demographic data shows that the educational capacity, work experience
and a composition of young experts and management in the NQI institutions are expected
to transform the institutional activities in a better way and to a higher level of
achievements.
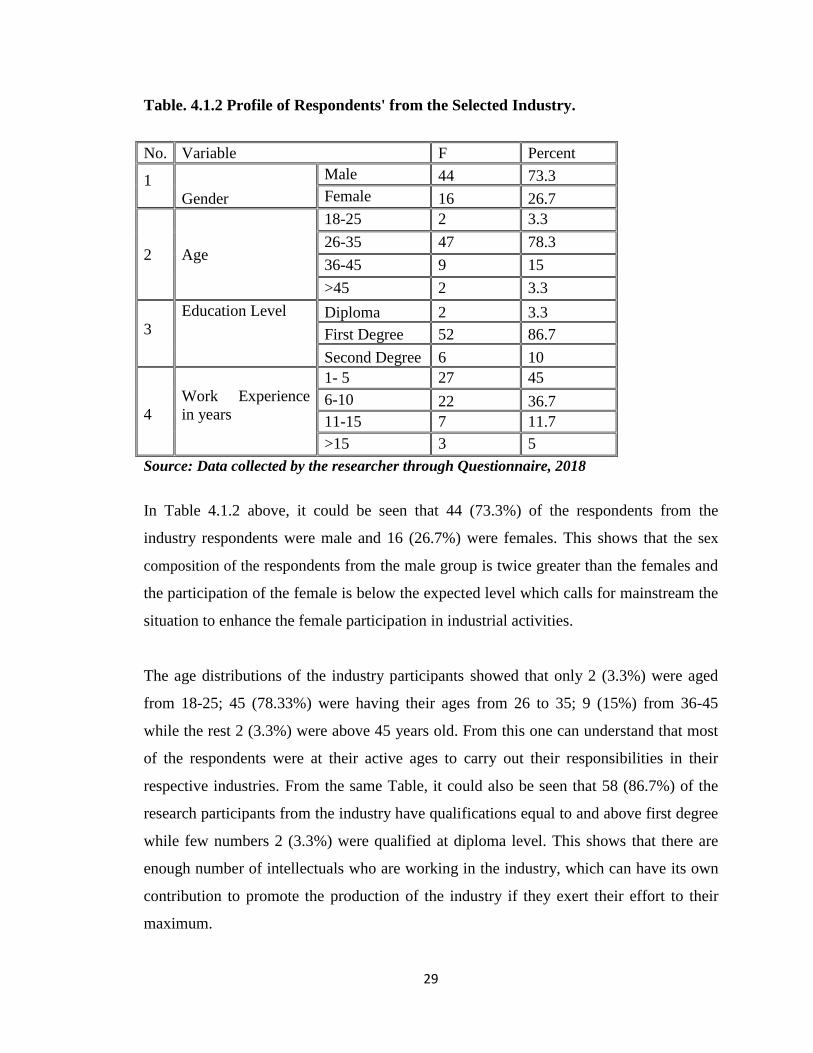
29
Table. 4.1.2 Profile of Respondents' from the Selected Industry.
No. Variable F Percent
1
Gender
Male 44 73.3
Female 16 26.7
2 Age
18-25 2 3.3
26-35 47 78.3
36-45 9 15
>45 2 3.3
3
Education Level Diploma 2 3.3
First Degree 52 86.7
Second Degree 6 10
4
Work Experience
in years
1- 5 27 45
6-10 22 36.7
11-15 7 11.7
>15 3 5
Source: Data collected by the researcher through Questionnaire, 2018
In Table 4.1.2 above, it could be seen that 44 (73.3%) of the respondents from the
industry respondents were male and 16 (26.7%) were females. This shows that the sex
composition of the respondents from the male group is twice greater than the females and
the participation of the female is below the expected level which calls for mainstream the
situation to enhance the female participation in industrial activities.
The age distributions of the industry participants showed that only 2 (3.3%) were aged
from 18-25; 45 (78.33%) were having their ages from 26 to 35; 9 (15%) from 36-45
while the rest 2 (3.3%) were above 45 years old. From this one can understand that most
of the respondents were at their active ages to carry out their responsibilities in their
respective industries. From the same Table, it could also be seen that 58 (86.7%) of the
research participants from the industry have qualifications equal to and above first degree
while few numbers 2 (3.3%) were qualified at diploma level. This shows that there are
enough number of intellectuals who are working in the industry, which can have its own
contribution to promote the production of the industry if they exert their effort to their
maximum.
30
With regard to work experience of the participants from the selected industries 27 (45%)
have served from one to five years, 22 (36.7%) have experiences from six to ten years, 7
(11.7%) were having a services years from eleven to fifteen years and 4 (4.7%) have
served above 15 years in their respected organization. From this it could be inferred that
the staff of the selected industries have adequate experiences to implement the objectives
of their respective industries.
In general, the educational capacity, work experience and a composition of young experts
and management in the industries are expected to enhance the provision of adequate
services from the industries. Thus, the respondents' age, educational capacity and work
experience of both categories of participants that is those from NQI institutions and from
industries show that most of the employees are qualified, energetic, quite representative
and competent in filing the questionnaire, assuming that they are working in relevant
field of practice in relation to their educational qualifications in their respective
organizations. Furthermore, the experience and educational back ground of the
respondents were reliable and it makes the study easier and able to get informative data
for analysis.
4.2 Provision of Service Quality by NQI Institutions.
4.2.1 The Performance of NQI Institutions with Respect to Service Quality.
The questionnaire was designed by using Likert Scale and almost all of the statements
were measured on a five point Likert Scale with 1 = Very Poor, 2 = Poor, 3 = Average, 4
= Good, and 5 = Very Good. Moreover, the calculated means are interpreted as; above 4=
Strongly Agree, 3.01 to 4.00 = Agree, 2.51 to 3.00= Average, 1.50 to 2.50 = Disagree and
below 1.5 it is interpreted as strongly disagree. The information obtained from the
questionnaires are summarized and discussed in the following manner.
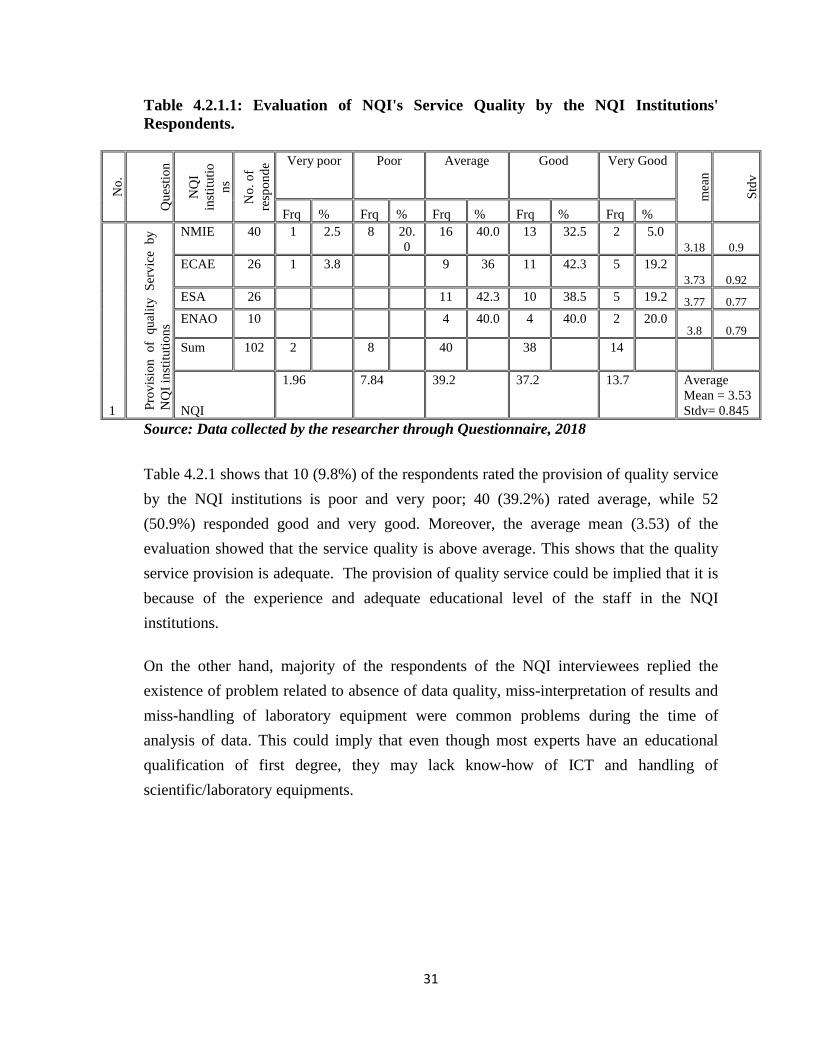
31
Table 4.2.1.1: Evaluation of NQI's Service Quality by the NQI Institutions'
Respondents.
No
.
Qu
esti
on
NQ
I
inst
itu
tio
ns
No
. o
f
resp
on
de
nt
Very poor
Poor
Average
Good
Very Good
mea
n
Std
v
Frq % Frq % Frq % Frq % Frq %
1 Pro
vis
ion
of
qu
alit
y
Ser
vic
e by
NQ
I in
stit
uti
on
s
NMIE 40 1 2.5 8 20.
0
16 40.0 13 32.5 2 5.0
3.18 0.9
ECAE 26 1 3.8
9
36 11 42.3 5 19.2
3.73 0.92
ESA 26
11 42.3 10 38.5 5 19.2 3.77 0.77
ENAO 10
4 40.0 4 40.0 2 20.0 3.8 0.79
Sum 102 2 8 40
38
14
NQI
1.96
7.84
39.2
37.2
13.7
Average
Mean = 3.53
Stdv= 0.845
Source: Data collected by the researcher through Questionnaire, 2018
Table 4.2.1 shows that 10 (9.8%) of the respondents rated the provision of quality service
by the NQI institutions is poor and very poor; 40 (39.2%) rated average, while 52
(50.9%) responded good and very good. Moreover, the average mean (3.53) of the
evaluation showed that the service quality is above average. This shows that the quality
service provision is adequate. The provision of quality service could be implied that it is
because of the experience and adequate educational level of the staff in the NQI
institutions.
On the other hand, majority of the respondents of the NQI interviewees replied the
existence of problem related to absence of data quality, miss-interpretation of results and
miss-handling of laboratory equipment were common problems during the time of
analysis of data. This could imply that even though most experts have an educational
qualification of first degree, they may lack know-how of ICT and handling of
scientific/laboratory equipments.
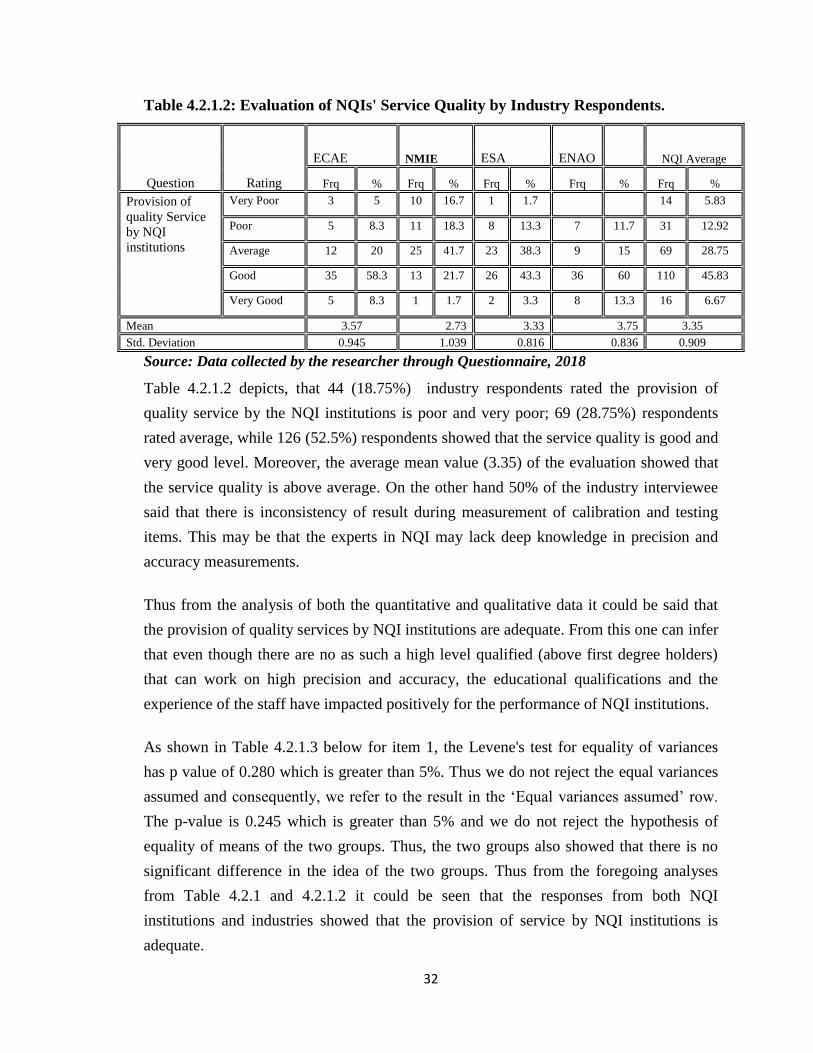
32
Table 4.2.1.2: Evaluation of NQIs' Service Quality by Industry Respondents.
Question Rating
ECAE NMIE ESA ENAO NQI Average
Frq % Frq % Frq % Frq % Frq %
Provision of
quality Service
by NQI
institutions
Very Poor 3 5 10 16.7 1 1.7 14 5.83
Poor 5 8.3 11 18.3 8 13.3 7 11.7 31 12.92
Average 12 20 25 41.7 23 38.3 9 15 69 28.75
Good 35 58.3 13 21.7 26 43.3 36 60 110 45.83
Very Good 5 8.3 1 1.7 2 3.3 8 13.3 16 6.67
Mean 3.57 2.73 3.33 3.75 3.35
Std. Deviation 0.945 1.039 0.816 0.836 0.909
Source: Data collected by the researcher through Questionnaire, 2018
Table 4.2.1.2 depicts, that 44 (18.75%) industry respondents rated the provision of
quality service by the NQI institutions is poor and very poor; 69 (28.75%) respondents
rated average, while 126 (52.5%) respondents showed that the service quality is good and
very good level. Moreover, the average mean value (3.35) of the evaluation showed that
the service quality is above average. On the other hand 50% of the industry interviewee
said that there is inconsistency of result during measurement of calibration and testing
items. This may be that the experts in NQI may lack deep knowledge in precision and
accuracy measurements.
Thus from the analysis of both the quantitative and qualitative data it could be said that
the provision of quality services by NQI institutions are adequate. From this one can infer
that even though there are no as such a high level qualified (above first degree holders)
that can work on high precision and accuracy, the educational qualifications and the
experience of the staff have impacted positively for the performance of NQI institutions.
As shown in Table 4.2.1.3 below for item 1, the Levene's test for equality of variances
has p value of 0.280 which is greater than 5%. Thus we do not reject the equal variances
assumed and consequently, we refer to the result in the ‘Equal variances assumed’ row.
The p-value is 0.245 which is greater than 5% and we do not reject the hypothesis of
equality of means of the two groups. Thus, the two groups also showed that there is no
significant difference in the idea of the two groups. Thus from the foregoing analyses
from Table 4.2.1 and 4.2.1.2 it could be seen that the responses from both NQI
institutions and industries showed that the provision of service by NQI institutions is
adequate.
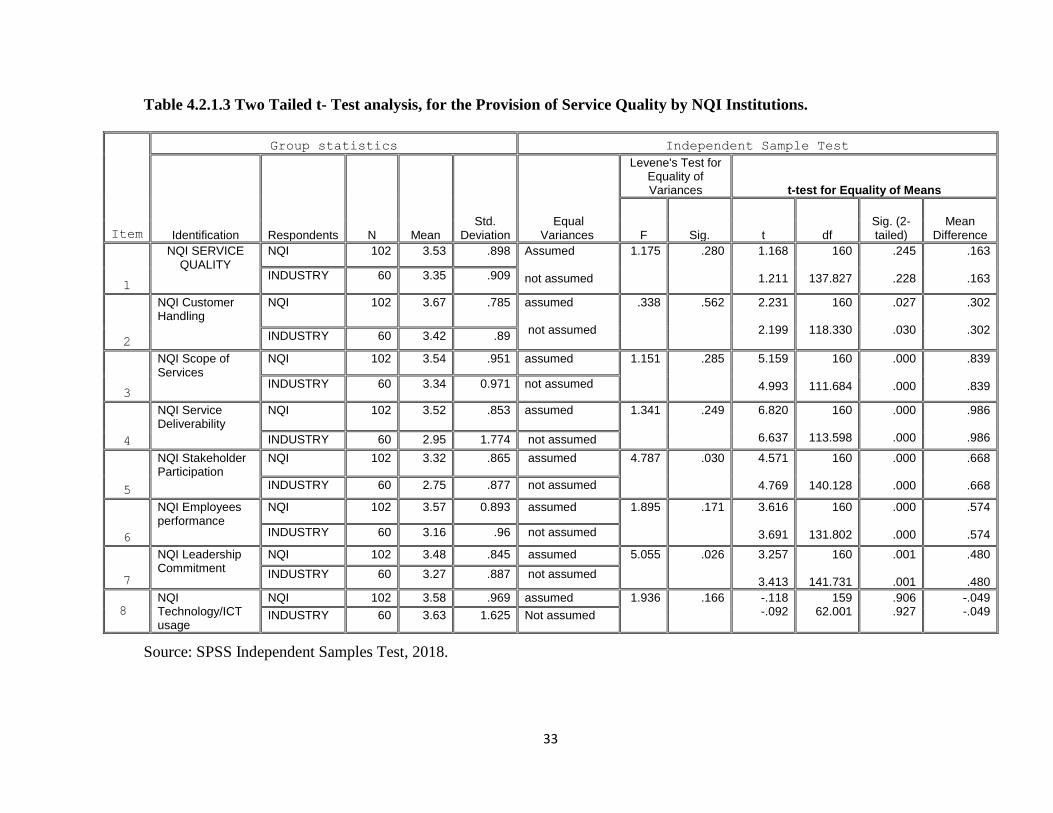
33
Table 4.2.1.3 Two Tailed t- Test analysis, for the Provision of Service Quality by NQI Institutions.
Item
Group statistics Independent Sample Test
Identification Respondents N Mean Std.
Deviation Equal
Variances
Levene's Test for Equality of Variances t-test for Equality of Means
F Sig. t df Sig. (2-tailed)
Mean Difference
1
NQI SERVICE QUALITY
NQI 102 3.53 .898 Assumed not assumed
1.175
.280
1.168
1.211
160
137.827
.245
.228
.163
.163 INDUSTRY 60 3.35 .909
2
NQI Customer Handling
NQI 102 3.67 .785 assumed not assumed
.338
.562
2.231
2.199
160
118.330
.027
.030
.302
.302 INDUSTRY 60 3.42 .89
3
NQI Scope of Services
NQI 102 3.54 .951 assumed 1.151
.285
5.159
4.993
160
111.684
.000
.000
.839
.839 INDUSTRY 60 3.34 0.971 not assumed
4
NQI Service Deliverability
NQI 102 3.52 .853 assumed 1.341
.249
6.820
6.637
160
113.598
.000
.000
.986
.986 INDUSTRY 60 2.95 1.774 not assumed
5
NQI Stakeholder Participation
NQI 102 3.32 .865 assumed 4.787
.030
4.571
4.769
160
140.128
.000
.000
.668
.668 INDUSTRY 60 2.75 .877 not assumed
6
NQI Employees performance
NQI 102 3.57 0.893 assumed 1.895
.171
3.616
3.691
160
131.802
.000
.000
.574
.574 INDUSTRY 60 3.16 .96 not assumed
7
NQI Leadership Commitment
NQI 102 3.48 .845 assumed 5.055
.026
3.257
3.413
160
141.731
.001
.001
.480
.480 INDUSTRY 60 3.27 .887 not assumed
8 NQI Technology/ICT usage
NQI 102 3.58 .969 assumed 1.936 .166 -.118 -.092
159 62.001
.906
.927 -.049 -.049 INDUSTRY 60 3.63 1.625 Not assumed
Source: SPSS Independent Samples Test, 2018.
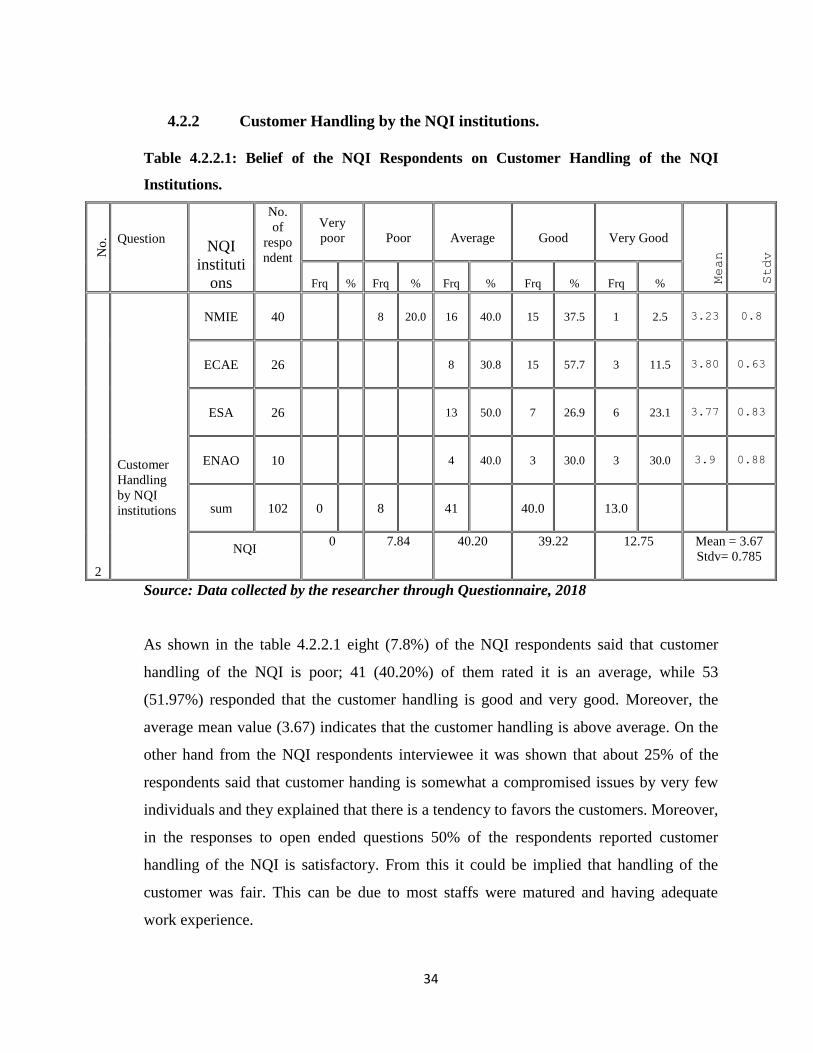
34
4.2.2 Customer Handling by the NQI institutions.
Table 4.2.2.1: Belief of the NQI Respondents on Customer Handling of the NQI
Institutions.
No
. Question
NQI
instituti
ons
No.
of
respo
ndent
Very
poor
Poor
Average
Good
Very Good
Mean
Stdv
Frq
%
Frq
%
Frq
%
Frq
%
Frq
%
2
Customer
Handling
by NQI
institutions
NMIE
40
8 20.0 16 40.0 15 37.5 1 2.5 3.23 0.8
ECAE
26
8 30.8 15 57.7 3 11.5 3.80 0.63
ESA
26
13 50.0 7 26.9 6 23.1 3.77 0.83
ENAO
10
4 40.0 3 30.0 3 30.0 3.9 0.88
sum
102 0
8
41
40.0
13.0
NQI
0
7.84
40.20 39.22
12.75
Mean = 3.67
Stdv= 0.785
Source: Data collected by the researcher through Questionnaire, 2018
As shown in the table 4.2.2.1 eight (7.8%) of the NQI respondents said that customer
handling of the NQI is poor; 41 (40.20%) of them rated it is an average, while 53
(51.97%) responded that the customer handling is good and very good. Moreover, the
average mean value (3.67) indicates that the customer handling is above average. On the
other hand from the NQI respondents interviewee it was shown that about 25% of the
respondents said that customer handing is somewhat a compromised issues by very few
individuals and they explained that there is a tendency to favors the customers. Moreover,
in the responses to open ended questions 50% of the respondents reported customer
handling of the NQI is satisfactory. From this it could be implied that handling of the
customer was fair. This can be due to most staffs were matured and having adequate
work experience.
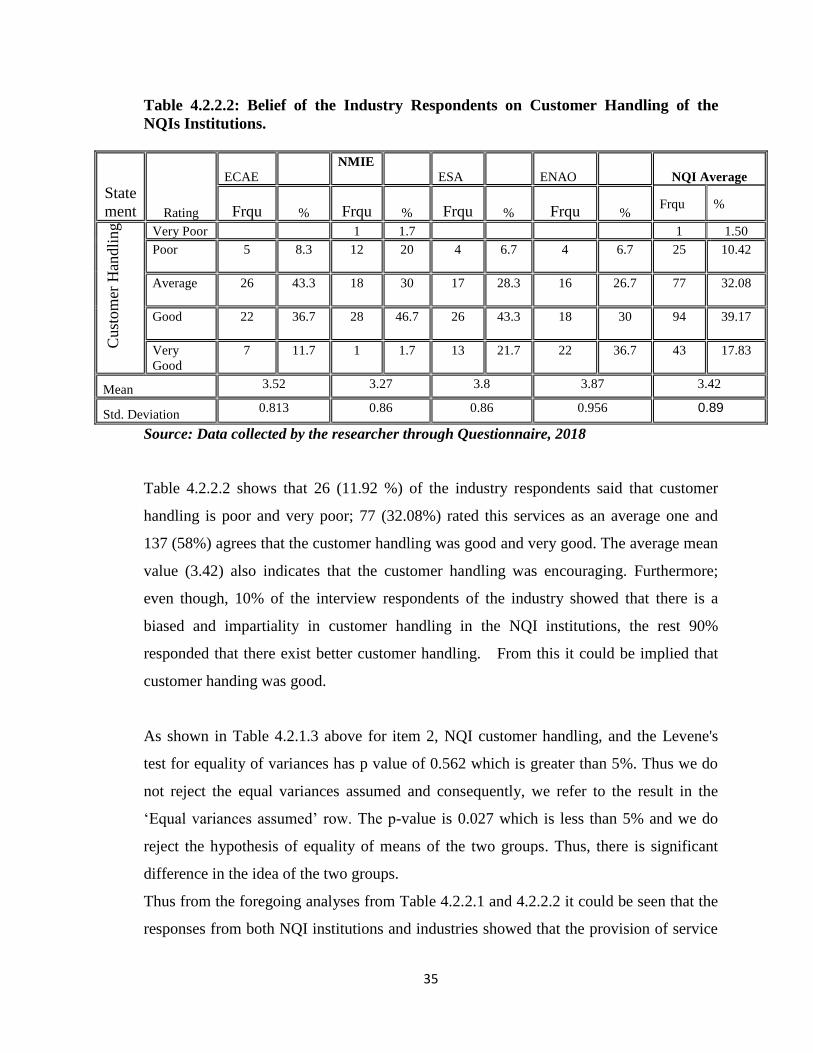
35
Table 4.2.2.2: Belief of the Industry Respondents on Customer Handling of the
NQIs Institutions.
State
ment Rating
ECAE
NMIE
ESA ENAO NQI Average
Frqu % Frqu % Frqu % Frqu % Frqu %
Cust
om
er H
andli
ng
Very Poor 1 1.7 1 1.50
Poor 5 8.3 12 20 4 6.7 4 6.7 25 10.42
Average 26 43.3 18 30 17 28.3 16 26.7 77 32.08
Good 22 36.7 28 46.7 26 43.3 18 30 94 39.17
Very
Good
7 11.7 1 1.7 13 21.7 22 36.7 43 17.83
Mean 3.52 3.27 3.8 3.87 3.42
Std. Deviation 0.813 0.86 0.86 0.956 0.89
Source: Data collected by the researcher through Questionnaire, 2018
Table 4.2.2.2 shows that 26 (11.92 %) of the industry respondents said that customer
handling is poor and very poor; 77 (32.08%) rated this services as an average one and
137 (58%) agrees that the customer handling was good and very good. The average mean
value (3.42) also indicates that the customer handling was encouraging. Furthermore;
even though, 10% of the interview respondents of the industry showed that there is a
biased and impartiality in customer handling in the NQI institutions, the rest 90%
responded that there exist better customer handling. From this it could be implied that
customer handing was good.
As shown in Table 4.2.1.3 above for item 2, NQI customer handling, and the Levene's
test for equality of variances has p value of 0.562 which is greater than 5%. Thus we do
not reject the equal variances assumed and consequently, we refer to the result in the
‘Equal variances assumed’ row. The p-value is 0.027 which is less than 5% and we do
reject the hypothesis of equality of means of the two groups. Thus, there is significant
difference in the idea of the two groups.
Thus from the foregoing analyses from Table 4.2.2.1 and 4.2.2.2 it could be seen that the
responses from both NQI institutions and industries showed that the provision of service
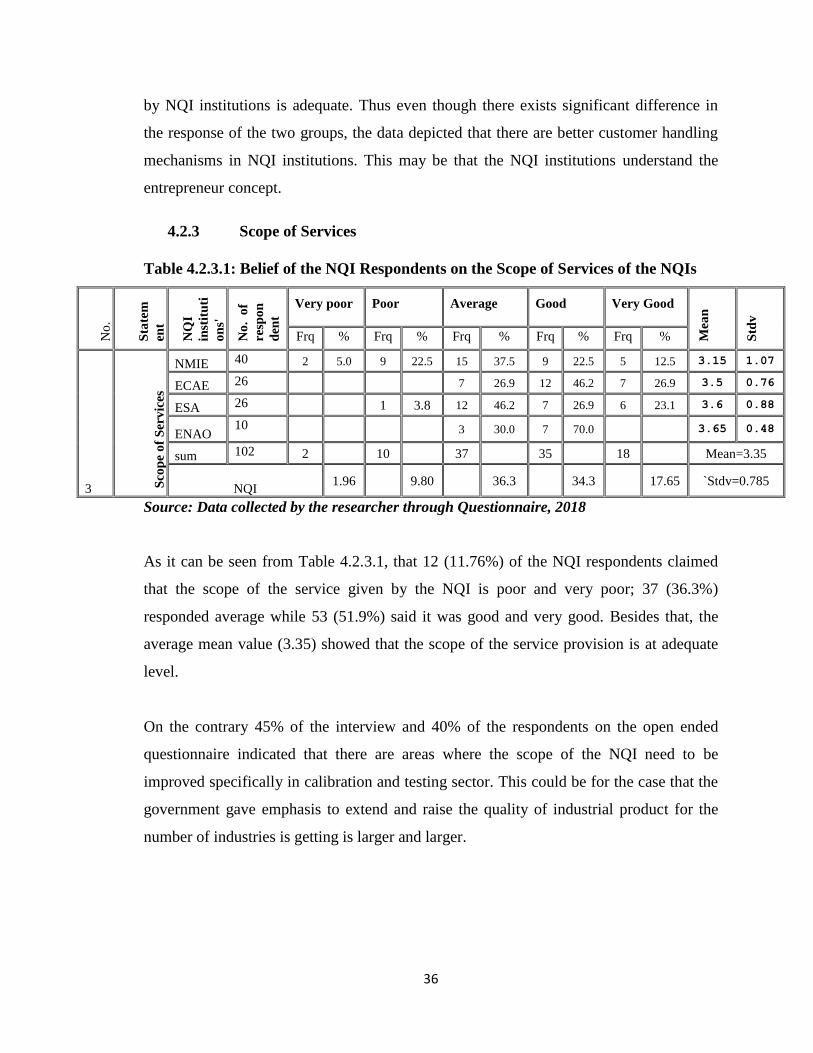
36
by NQI institutions is adequate. Thus even though there exists significant difference in
the response of the two groups, the data depicted that there are better customer handling
mechanisms in NQI institutions. This may be that the NQI institutions understand the
entrepreneur concept.
4.2.3 Scope of Services
Table 4.2.3.1: Belief of the NQI Respondents on the Scope of Services of the NQIs
No
.
Sta
tem
ent
NQ
I
inst
itu
ti
on
s'
No
. o
f
resp
on
den
t
Very poor
Poor
Average
Good
Very Good
Mea
n
Std
v
Frq % Frq % Frq % Frq % Frq %
3 Sco
pe
of
Ser
vic
es
NMIE 40 2 5.0 9 22.5 15 37.5 9 22.5 5 12.5 3.15 1.07
ECAE 26
7 26.9 12 46.2 7 26.9 3.5 0.76
ESA 26
1 3.8 12 46.2 7 26.9 6 23.1 3.6 0.88
ENAO 10
3 30.0 7 70.0
3.65 0.48
sum 102 2
10
37
35
18
Mean=3.35
NQI 1.96
9.80
36.3
34.3
17.65 `Stdv=0.785
Source: Data collected by the researcher through Questionnaire, 2018
As it can be seen from Table 4.2.3.1, that 12 (11.76%) of the NQI respondents claimed
that the scope of the service given by the NQI is poor and very poor; 37 (36.3%)
responded average while 53 (51.9%) said it was good and very good. Besides that, the
average mean value (3.35) showed that the scope of the service provision is at adequate
level.
On the contrary 45% of the interview and 40% of the respondents on the open ended
questionnaire indicated that there are areas where the scope of the NQI need to be
improved specifically in calibration and testing sector. This could be for the case that the
government gave emphasis to extend and raise the quality of industrial product for the
number of industries is getting is larger and larger.
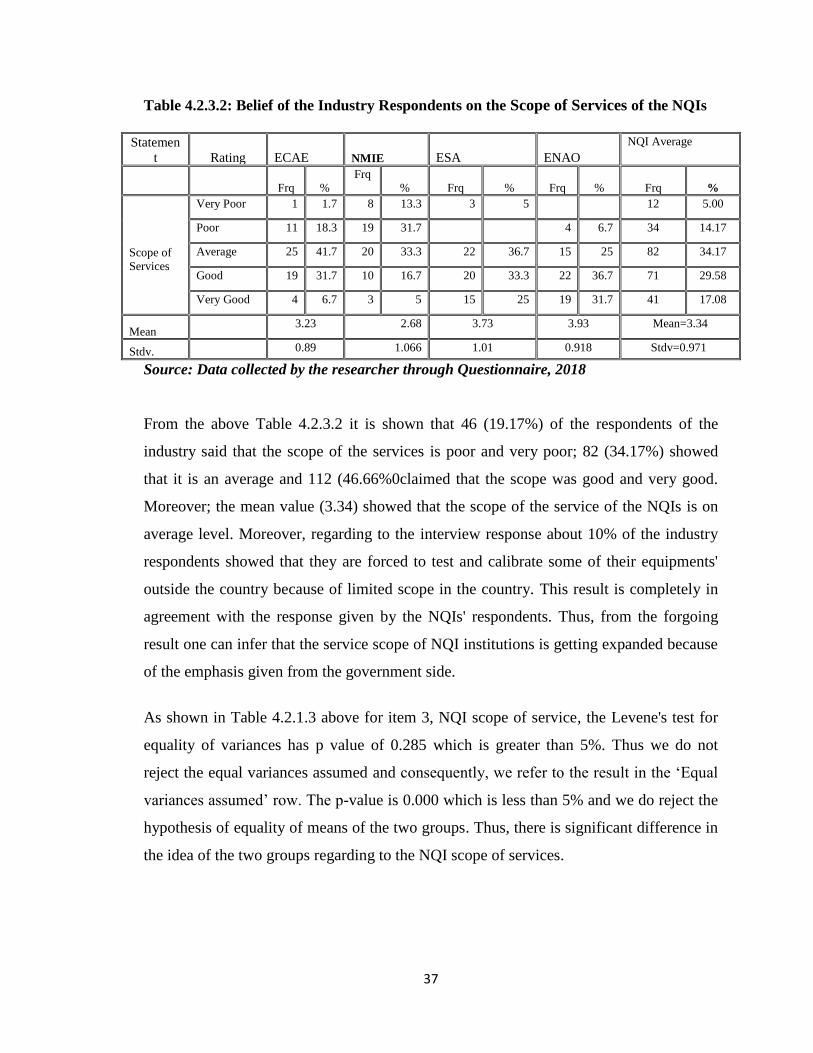
37
Table 4.2.3.2: Belief of the Industry Respondents on the Scope of Services of the NQIs
Statemen
t Rating ECAE NMIE ESA ENAO
NQI Average
Frq %
Frq
% Frq % Frq % Frq %
Scope of
Services
Very Poor 1 1.7 8 13.3 3 5
12 5.00
Poor 11 18.3 19 31.7 4 6.7 34 14.17
Average 25 41.7 20 33.3 22 36.7 15 25 82 34.17
Good 19 31.7 10 16.7 20 33.3 22 36.7 71 29.58
Very Good 4 6.7 3 5 15 25 19 31.7 41 17.08
Mean 3.23 2.68 3.73 3.93 Mean=3.34
Stdv. 0.89 1.066 1.01 0.918 Stdv=0.971
Source: Data collected by the researcher through Questionnaire, 2018
From the above Table 4.2.3.2 it is shown that 46 (19.17%) of the respondents of the
industry said that the scope of the services is poor and very poor; 82 (34.17%) showed
that it is an average and 112 (46.66%0claimed that the scope was good and very good.
Moreover; the mean value (3.34) showed that the scope of the service of the NQIs is on
average level. Moreover, regarding to the interview response about 10% of the industry
respondents showed that they are forced to test and calibrate some of their equipments'
outside the country because of limited scope in the country. This result is completely in
agreement with the response given by the NQIs' respondents. Thus, from the forgoing
result one can infer that the service scope of NQI institutions is getting expanded because
of the emphasis given from the government side.
As shown in Table 4.2.1.3 above for item 3, NQI scope of service, the Levene's test for
equality of variances has p value of 0.285 which is greater than 5%. Thus we do not
reject the equal variances assumed and consequently, we refer to the result in the ‘Equal
variances assumed’ row. The p-value is 0.000 which is less than 5% and we do reject the
hypothesis of equality of means of the two groups. Thus, there is significant difference in
the idea of the two groups regarding to the NQI scope of services.
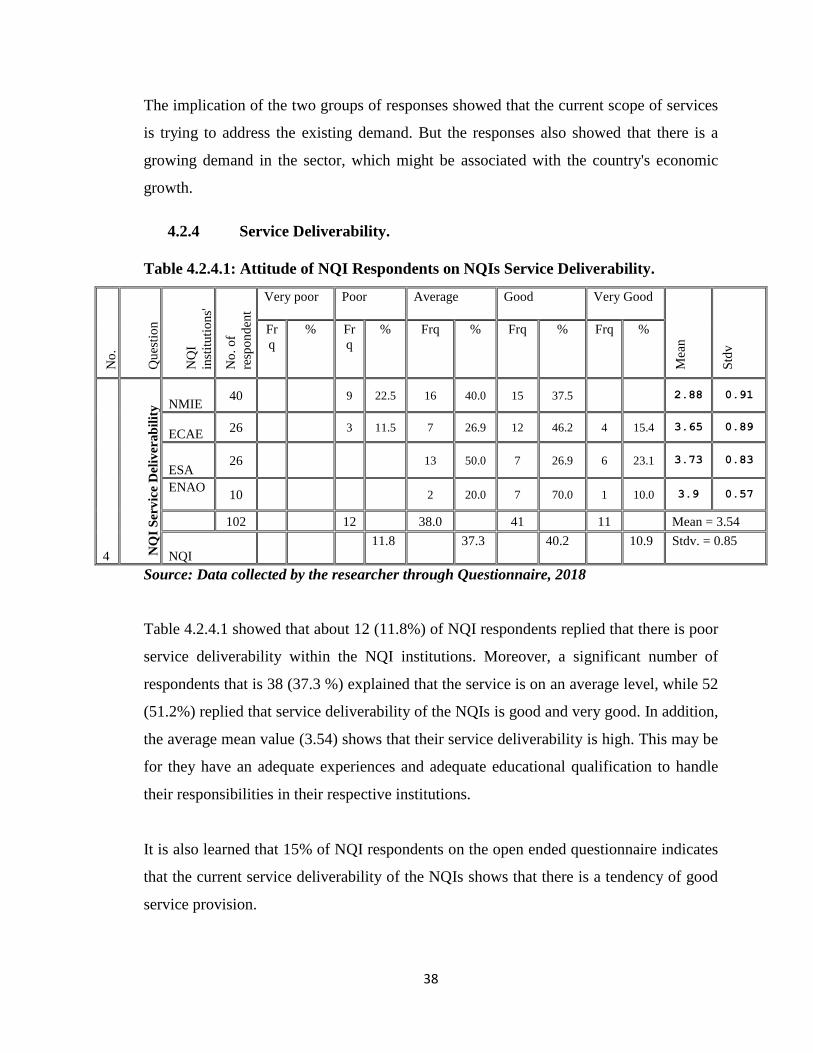
38
The implication of the two groups of responses showed that the current scope of services
is trying to address the existing demand. But the responses also showed that there is a
growing demand in the sector, which might be associated with the country's economic
growth.
4.2.4 Service Deliverability.
Table 4.2.4.1: Attitude of NQI Respondents on NQIs Service Deliverability.
No
.
Qu
esti
on
NQ
I
inst
itu
tio
ns'
No
. o
f
resp
on
den
t
Very poor
Poor
Average
Good
Very Good
Mea
n
Std
v
Fr
q
% Fr
q
% Frq % Frq % Frq %
4 NQ
I S
erv
ice
Del
iver
ab
ilit
y NMIE
40
9 22.5 16 40.0 15 37.5
2.88 0.91
ECAE 26
3 11.5 7 26.9 12 46.2 4 15.4 3.65 0.89
ESA 26
13 50.0 7 26.9 6 23.1 3.73 0.83
ENAO
10
2 20.0 7 70.0 1 10.0 3.9 0.57
102
12
38.0
41
11
Mean = 3.54
NQI
11.8 37.3 40.2 10.9 Stdv. = 0.85
Source: Data collected by the researcher through Questionnaire, 2018
Table 4.2.4.1 showed that about 12 (11.8%) of NQI respondents replied that there is poor
service deliverability within the NQI institutions. Moreover, a significant number of
respondents that is 38 (37.3 %) explained that the service is on an average level, while 52
(51.2%) replied that service deliverability of the NQIs is good and very good. In addition,
the average mean value (3.54) shows that their service deliverability is high. This may be
for they have an adequate experiences and adequate educational qualification to handle
their responsibilities in their respective institutions.
It is also learned that 15% of NQI respondents on the open ended questionnaire indicates
that the current service deliverability of the NQIs shows that there is a tendency of good
service provision.
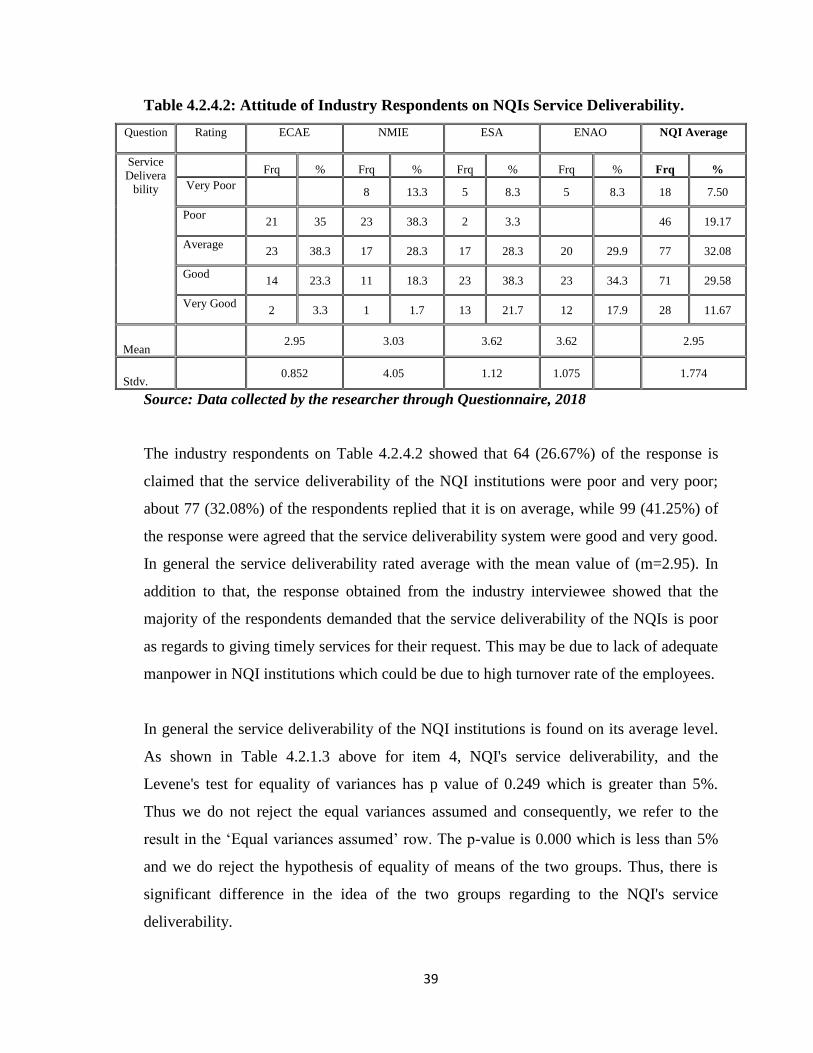
39
Table 4.2.4.2: Attitude of Industry Respondents on NQIs Service Deliverability.
Question Rating ECAE NMIE
ESA ENAO NQI Average
Service
Delivera
bility
Frq % Frq % Frq % Frq % Frq %
Very Poor
8 13.3 5 8.3 5 8.3 18 7.50
Poor
21 35 23 38.3 2 3.3
46 19.17
Average
23 38.3 17 28.3 17 28.3 20 29.9 77 32.08
Good
14 23.3 11 18.3 23 38.3 23 34.3 71 29.58
Very Good
2 3.3 1 1.7 13 21.7 12 17.9 28 11.67
Mean
2.95 3.03 3.62 3.62
2.95
Stdv.
0.852 4.05 1.12 1.075
1.774
Source: Data collected by the researcher through Questionnaire, 2018
The industry respondents on Table 4.2.4.2 showed that 64 (26.67%) of the response is
claimed that the service deliverability of the NQI institutions were poor and very poor;
about 77 (32.08%) of the respondents replied that it is on average, while 99 (41.25%) of
the response were agreed that the service deliverability system were good and very good.
In general the service deliverability rated average with the mean value of (m=2.95). In
addition to that, the response obtained from the industry interviewee showed that the
majority of the respondents demanded that the service deliverability of the NQIs is poor
as regards to giving timely services for their request. This may be due to lack of adequate
manpower in NQI institutions which could be due to high turnover rate of the employees.
In general the service deliverability of the NQI institutions is found on its average level.
As shown in Table 4.2.1.3 above for item 4, NQI's service deliverability, and the
Levene's test for equality of variances has p value of 0.249 which is greater than 5%.
Thus we do not reject the equal variances assumed and consequently, we refer to the
result in the ‘Equal variances assumed’ row. The p-value is 0.000 which is less than 5%
and we do reject the hypothesis of equality of means of the two groups. Thus, there is
significant difference in the idea of the two groups regarding to the NQI's service
deliverability.
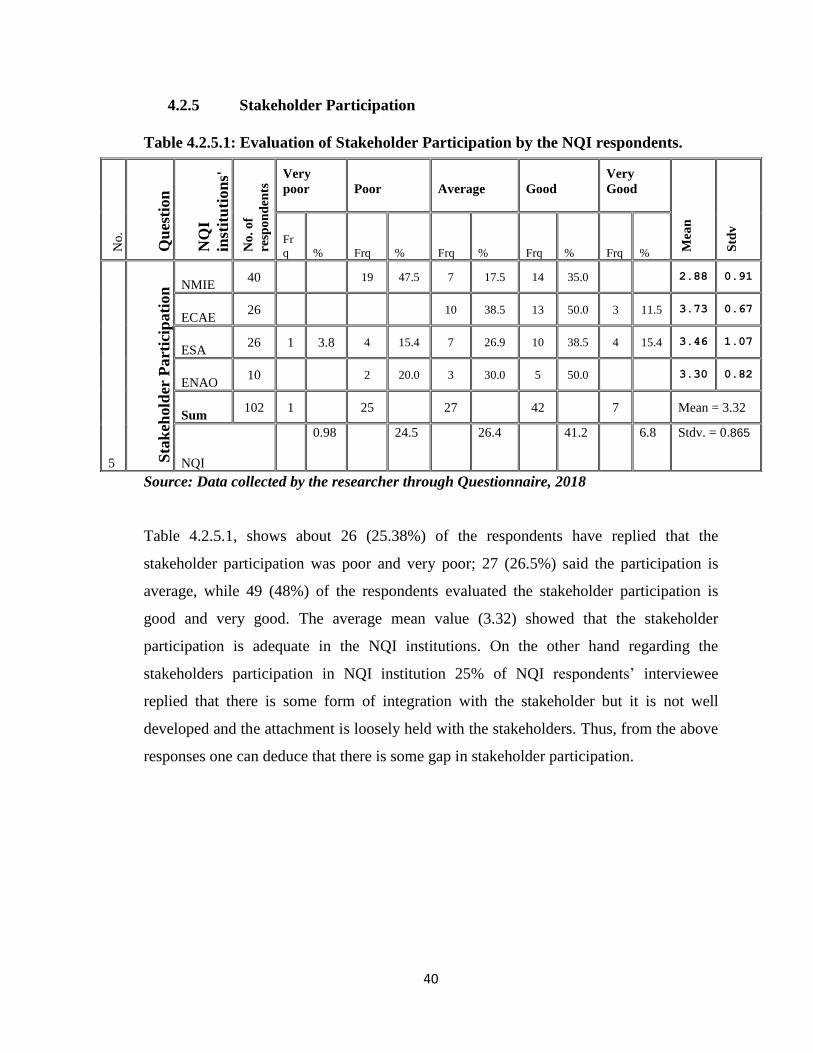
40
4.2.5 Stakeholder Participation
Table 4.2.5.1: Evaluation of Stakeholder Participation by the NQI respondents.
Source: Data collected by the researcher through Questionnaire, 2018
Table 4.2.5.1, shows about 26 (25.38%) of the respondents have replied that the
stakeholder participation was poor and very poor; 27 (26.5%) said the participation is
average, while 49 (48%) of the respondents evaluated the stakeholder participation is
good and very good. The average mean value (3.32) showed that the stakeholder
participation is adequate in the NQI institutions. On the other hand regarding the
stakeholders participation in NQI institution 25% of NQI respondents’ interviewee
replied that there is some form of integration with the stakeholder but it is not well
developed and the attachment is loosely held with the stakeholders. Thus, from the above
responses one can deduce that there is some gap in stakeholder participation.
No
.
Qu
esti
on
NQ
I
inst
itu
tion
s'
No
. o
f
resp
on
den
ts
Very
poor
Poor
Average
Good
Very
Good
Mea
n
Std
v
Fr
q % Frq % Frq % Frq % Frq %
5 Sta
keh
old
er P
art
icip
ati
on
NMIE 40
19 47.5 7 17.5 14 35.0
2.88 0.91
ECAE 26
10 38.5 13 50.0 3 11.5 3.73 0.67
ESA 26 1 3.8 4 15.4 7 26.9 10 38.5 4 15.4 3.46 1.07
ENAO 10
2 20.0 3 30.0 5 50.0
3.30 0.82
Sum 102 1
25
27
42
7
Mean = 3.32
NQI
0.98 24.5 26.4 41.2 6.8 Stdv. = 0.865
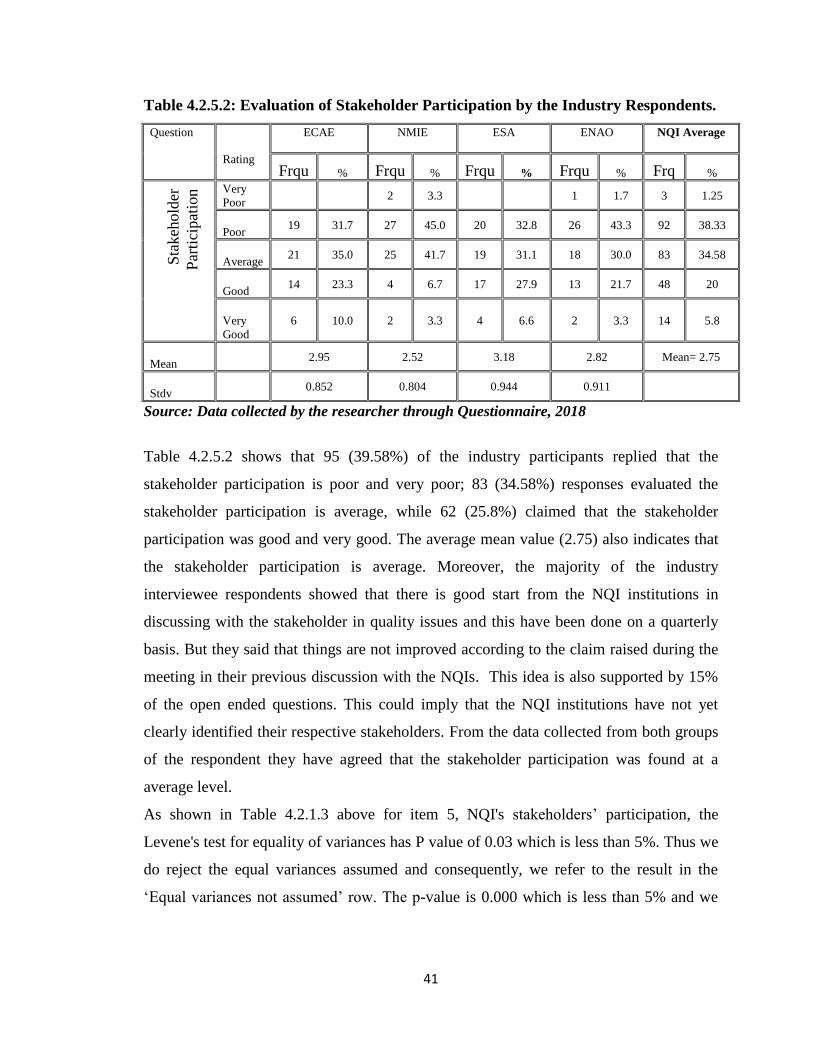
41
Table 4.2.5.2: Evaluation of Stakeholder Participation by the Industry Respondents.
Question
Rating
ECAE
NMIE
ESA
ENAO
NQI Average
Frqu % Frqu % Frqu % Frqu % Frq % S
takeh
old
er
Par
tici
pat
ion
Very
Poor 2 3.3
1 1.7 3 1.25
Poor 19 31.7 27 45.0 20 32.8 26 43.3 92 38.33
Average 21 35.0 25 41.7 19 31.1 18 30.0 83 34.58
Good 14 23.3 4 6.7 17 27.9 13 21.7 48 20
Very
Good
6 10.0 2 3.3 4 6.6 2 3.3 14 5.8
Mean
2.95 2.52 3.18 2.82 Mean= 2.75
Stdv
0.852 0.804 0.944 0.911
Source: Data collected by the researcher through Questionnaire, 2018
Table 4.2.5.2 shows that 95 (39.58%) of the industry participants replied that the
stakeholder participation is poor and very poor; 83 (34.58%) responses evaluated the
stakeholder participation is average, while 62 (25.8%) claimed that the stakeholder
participation was good and very good. The average mean value (2.75) also indicates that
the stakeholder participation is average. Moreover, the majority of the industry
interviewee respondents showed that there is good start from the NQI institutions in
discussing with the stakeholder in quality issues and this have been done on a quarterly
basis. But they said that things are not improved according to the claim raised during the
meeting in their previous discussion with the NQIs. This idea is also supported by 15%
of the open ended questions. This could imply that the NQI institutions have not yet
clearly identified their respective stakeholders. From the data collected from both groups
of the respondent they have agreed that the stakeholder participation was found at a
average level.
As shown in Table 4.2.1.3 above for item 5, NQI's stakeholders’ participation, the
Levene's test for equality of variances has P value of 0.03 which is less than 5%. Thus we
do reject the equal variances assumed and consequently, we refer to the result in the
‘Equal variances not assumed’ row. The p-value is 0.000 which is less than 5% and we

42
do reject the hypothesis of equality of means of the two groups. Thus, there is significant
difference in the idea of the two groups regarding to the NQI's stakeholder participation.
4.2.6 Employee Performance
Table 4.2.6.1: Evaluation of Employee Performance by the NQI Respondents.
Source: Data collected by the researcher through Questionnaire, 2018
Table 4.2.6.1 showed that 14 (13.72%) of the NQI respondents replied that the employee
performance of the NQI is poor and very poor; 37 (36.3%) responded that it is on average
level, while 51 (50.05%) agreed that it is good and very good. Besides this, the average
mean value (3.57) showed that the employee performance is above the average level.
This illustrated that the employees educational level and experience helped them to
exhibit this level, but also it is indicated in the result that there is some limitation with
respect to employee performance in some parameters of the working activities within the
NQI system.
From the interview response also, 37% of them showed that there are employees who
were assigned to work on some parameters without getting enough training and
experience in the specific fields of activities. This might be as a result of shortage or
absences of experts in that particular practice. If such practice is continually done it might
have contribution to the poor performance of the employees within the NQI.
No
.
Qu
esti
on
NQ
I
inst
itu
tio
ns'
No
. o
f
resp
on
de
nt
Very poor
Poor
Average
Good
Very Good
Mea
n
Std
v
Frq % Frq % Frq % Frq % Frq %
6 Em
plo
yee
s p
erfo
rma
nce
NMIE 40 1 2.5 8 20.0 16 40.0 13 32.5 2 5.0
3.18 0.90
ECAE 26 3 11.5 2 7.7 6 23.1 12 46.2 3 11.5
3.38 1.17
ESA 26
13 50.0 7 26.9 6 23.1
3.73 0.83
ENAO 10
2 20.0 6 60.0 2 20.0
4.00 0.67
102 4
10
37
38
13
Mean = 3.57
NQI
3.92 9.80 36.3 37.25 12.8 Stdv= 0.893
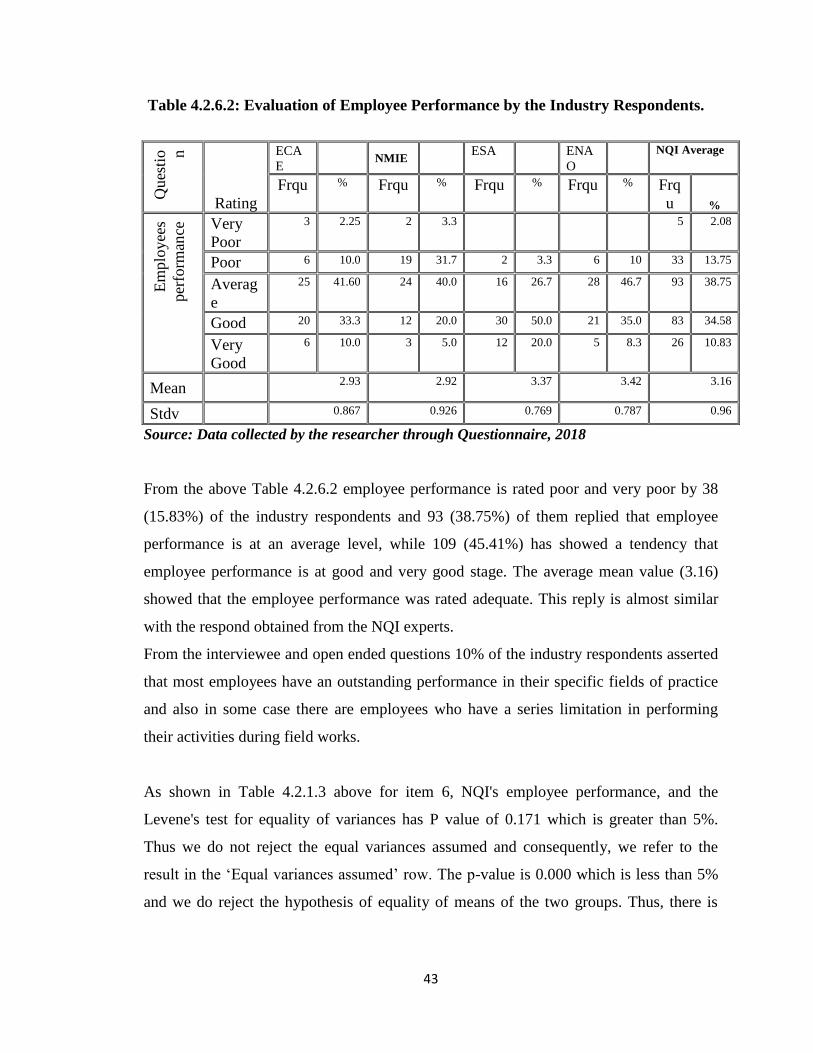
43
Table 4.2.6.2: Evaluation of Employee Performance by the Industry Respondents.
Ques
tio n
Rating
ECA
E NMIE
ESA
ENA
O
NQI Average
Frqu % Frqu % Frqu % Frqu % Frq
u %
Em
plo
yee
s
per
form
ance
Very
Poor
3 2.25 2 3.3
5 2.08
Poor 6 10.0 19 31.7 2 3.3 6 10 33 13.75
Averag
e
25 41.60 24 40.0 16 26.7 28 46.7 93 38.75
Good 20 33.3 12 20.0 30 50.0 21 35.0 83 34.58
Very
Good
6 10.0 3 5.0 12 20.0 5 8.3 26 10.83
Mean 2.93 2.92 3.37 3.42 3.16
Stdv 0.867 0.926 0.769 0.787 0.96
Source: Data collected by the researcher through Questionnaire, 2018
From the above Table 4.2.6.2 employee performance is rated poor and very poor by 38
(15.83%) of the industry respondents and 93 (38.75%) of them replied that employee
performance is at an average level, while 109 (45.41%) has showed a tendency that
employee performance is at good and very good stage. The average mean value (3.16)
showed that the employee performance was rated adequate. This reply is almost similar
with the respond obtained from the NQI experts.
From the interviewee and open ended questions 10% of the industry respondents asserted
that most employees have an outstanding performance in their specific fields of practice
and also in some case there are employees who have a series limitation in performing
their activities during field works.
As shown in Table 4.2.1.3 above for item 6, NQI's employee performance, and the
Levene's test for equality of variances has P value of 0.171 which is greater than 5%.
Thus we do not reject the equal variances assumed and consequently, we refer to the
result in the ‘Equal variances assumed’ row. The p-value is 0.000 which is less than 5%
and we do reject the hypothesis of equality of means of the two groups. Thus, there is
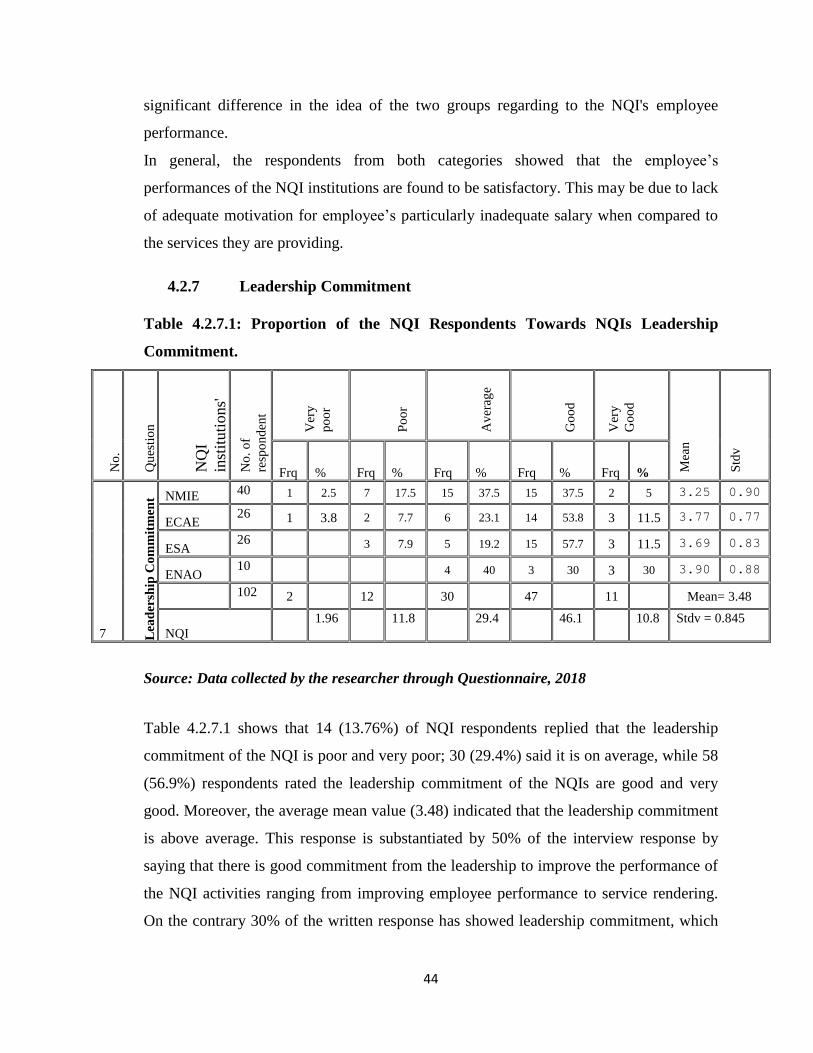
44
significant difference in the idea of the two groups regarding to the NQI's employee
performance.
In general, the respondents from both categories showed that the employee’s
performances of the NQI institutions are found to be satisfactory. This may be due to lack
of adequate motivation for employee’s particularly inadequate salary when compared to
the services they are providing.
4.2.7 Leadership Commitment
Table 4.2.7.1: Proportion of the NQI Respondents Towards NQIs Leadership
Commitment.
No
.
Qu
esti
on
NQ
I
inst
ituti
ons'
No
. o
f
resp
on
den
t
Ver
y
po
or
Po
or
Av
erag
e
Go
od
Ver
y
Go
od
Mea
n
Std
v
Frq % Frq % Frq % Frq % Frq %
7 Lea
der
ship
Co
mm
itm
ent NMIE 40 1 2.5 7 17.5 15 37.5 15 37.5 2 5 3.25 0.90
ECAE 26 1 3.8 2 7.7 6 23.1 14 53.8 3 11.5 3.77 0.77
ESA 26
3 7.9 5 19.2 15 57.7 3 11.5 3.69 0.83
ENAO 10
4 40 3 30 3 30 3.90 0.88
102 2
12
30
47
11
Mean= 3.48
NQI
1.96 11.8 29.4 46.1 10.8 Stdv = 0.845
Source: Data collected by the researcher through Questionnaire, 2018
Table 4.2.7.1 shows that 14 (13.76%) of NQI respondents replied that the leadership
commitment of the NQI is poor and very poor; 30 (29.4%) said it is on average, while 58
(56.9%) respondents rated the leadership commitment of the NQIs are good and very
good. Moreover, the average mean value (3.48) indicated that the leadership commitment
is above average. This response is substantiated by 50% of the interview response by
saying that there is good commitment from the leadership to improve the performance of
the NQI activities ranging from improving employee performance to service rendering.
On the contrary 30% of the written response has showed leadership commitment, which

45
can be explained as a focal point to inspire and motivate other to achieve the objectives
are poorly practiced and needs to be improved.
Table 4.2.7.2: Proportion of the Industry Respondents Towards NQIs Leadership
Commitment.
Question
Rating
ECAE
NMIE
ESA
ENAO
NQI Average
Frqu % Frqu %
Frq
u %
Frq
u %
Frq
u %
leadership
Commitment
Very Poor
1 1.7 2 3.3 3 1.25
Poor 11 18.3 16 26.7 5 8.33 2 3.3 34 14.16
Average
16 26.6 25 41.7 12 20.0 22 36.7 78 34.17
Good
29 48.3 18 30.0 31 51.7 22 36.7 100 41.67
Very Good
4 6.7 12 20.0 12 20 28 11.67
Mean
3.16 3.00 3.45 3.50 3.27
Stdv
0.867 0.803 0.730 0.951 0.887
Source: Data collected by the researcher through Questionnaire, 2018
As can be described by Table 4.2.7.2 from the industry 128 (53.3 %) of the respondents
showed that the NQIs leadership commitment is good and very good, 82 (34.17%)
explained it is on average level, whereas 30 (12.5 %) responded that it is poor. Moreover,
the average mean value (3.27) tells us that the NQIs leadership commitment is on
average. This could imply that the leadership in NQI institutions have given due
emphasis in promoting the activities of the NQI institutions.
As shown in Table 4.2.1.3 above for item 7, NQI's leadership commitment, and the
Levene's test for equality of variances has p value of 0.026 which is less than 5%. Thus
we do reject the equal variances assumed and consequently, we refer to the result in the
‘Equal variances not assumed’ row. The p-value is 0.001 which is less than 5% and we
do reject the hypothesis of equality of means of the two groups. Thus, there is a
significant difference in the idea of the two groups regarding to the NQI's leadership
commitment.

46
4.2.8 Technology/ICT usage
Table 4.2.8.1: Proportion of the NQI Respondents Regarding Technology/ICT usage
No
.
Qu
esti
on
Org
aniz
atio
n
No
. o
f
resp
on
den
t
Very poor
Poor
Average
Good
Very Good
Mea
n
Std
v
Frq
u
% Frq
u
% Frqu % Frqu % Frq
u
%
8
Techn
ology/I
CT
usage
NMIE
40 2 5.0 4 10.0 18 45.0 8 20.0 8 20.0 3.4 1.08
ECAE
26
3 11.5 7 26.9 14 53.8 2 7.7 3.62 0.94
ESA
26 1 3.8 3 11.5 11 42.3 5 19.2 6 23.1 3.46 1.10
ENAO
10
4 40.0 6 60.0
3.6 0.52
102 3
10
40
33
16
3.4 1.08
NQI
2.94
9.8
39.2
32.4
15.7
Mean = 3.52;
Stdv =0.91
Source: Data collected by the researcher through Questionnaire, 2018
As shown in Table 4.2.8.1 as the respondents from the NQI institutions explained, that 13
(12.24%) said that the technology/ICT usage of the NQI is poor and very poor, 40
(39.2%) have asserted that it is on average, while 49 (48.1%) stressed that it is good and
very good. Moreover, the average mean value (3.5) showed that the technology/ICT
usage of the NQI is above average. This shows that NQI can able to utilize the benefit of
technology on a satisfactory basis to improve its service deliverability and performance.
On the other hand interview response (60%) showed that NQI have not adequate use of
technology to maximize their reporting system through the use of different software
application, email, web site and other electronic media rather than relying up on the hard
copy result and report format. Moreover, it has not revolutionalized itself to use the
benefit of the technology specifically through automating their activities and to avail their
services online for the customer. Thus, even though, the average mean indicated that
technology usage is better, the other results pulled down the response rate, indicating that
there are gaps in utilizing ICT in NQI institutions. This could imply that NQIs give more
emphasis for their regular works rather than giving time to modern technological data
usage.
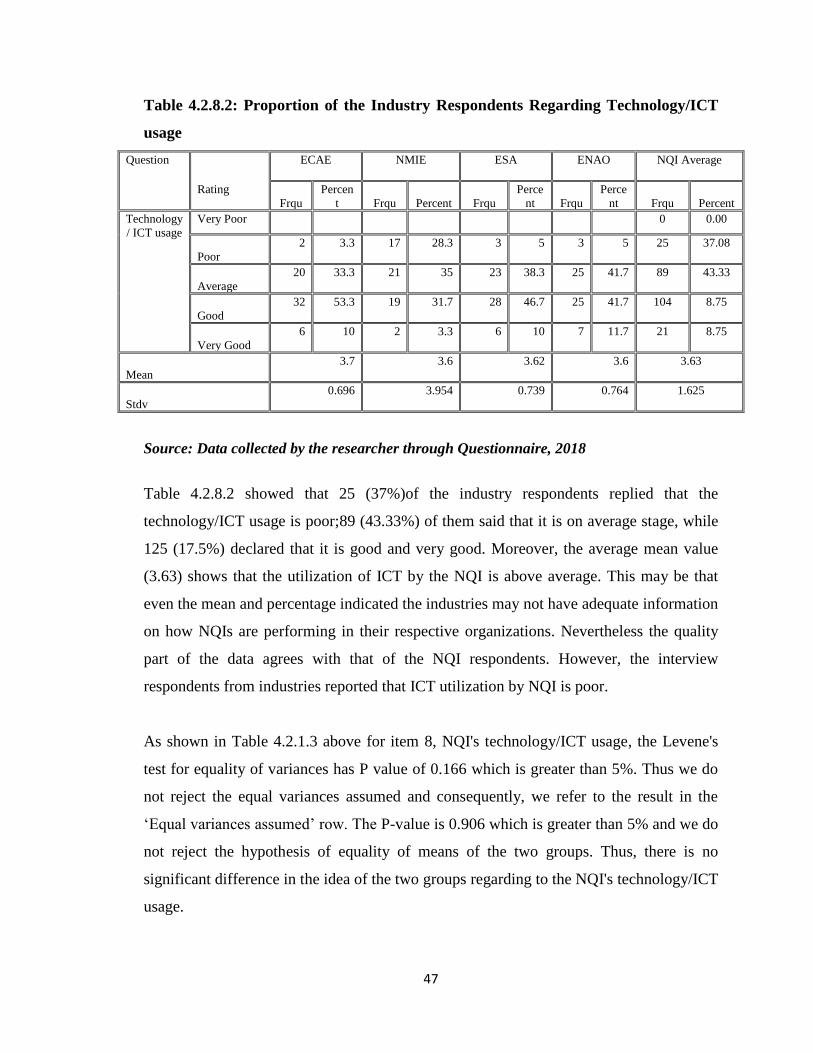
47
Table 4.2.8.2: Proportion of the Industry Respondents Regarding Technology/ICT
usage
Question
Rating
ECAE
NMIE
ESA
ENAO
NQI Average
Frqu
Percen
t Frqu Percent Frqu
Perce
nt Frqu
Perce
nt Frqu Percent
Technology
/ ICT usage
Very Poor
0 0.00
Poor
2 3.3 17 28.3 3 5 3 5 25 37.08
Average
20 33.3 21 35 23 38.3 25 41.7 89 43.33
Good
32 53.3 19 31.7 28 46.7 25 41.7 104 8.75
Very Good
6 10 2 3.3 6 10 7 11.7 21 8.75
Mean
3.7 3.6 3.62 3.6 3.63
Stdv
0.696 3.954 0.739 0.764 1.625
Source: Data collected by the researcher through Questionnaire, 2018
Table 4.2.8.2 showed that 25 (37%)of the industry respondents replied that the
technology/ICT usage is poor;89 (43.33%) of them said that it is on average stage, while
125 (17.5%) declared that it is good and very good. Moreover, the average mean value
(3.63) shows that the utilization of ICT by the NQI is above average. This may be that
even the mean and percentage indicated the industries may not have adequate information
on how NQIs are performing in their respective organizations. Nevertheless the quality
part of the data agrees with that of the NQI respondents. However, the interview
respondents from industries reported that ICT utilization by NQI is poor.
As shown in Table 4.2.1.3 above for item 8, NQI's technology/ICT usage, the Levene's
test for equality of variances has P value of 0.166 which is greater than 5%. Thus we do
not reject the equal variances assumed and consequently, we refer to the result in the
‘Equal variances assumed’ row. The P-value is 0.906 which is greater than 5% and we do
not reject the hypothesis of equality of means of the two groups. Thus, there is no
significant difference in the idea of the two groups regarding to the NQI's technology/ICT
usage.
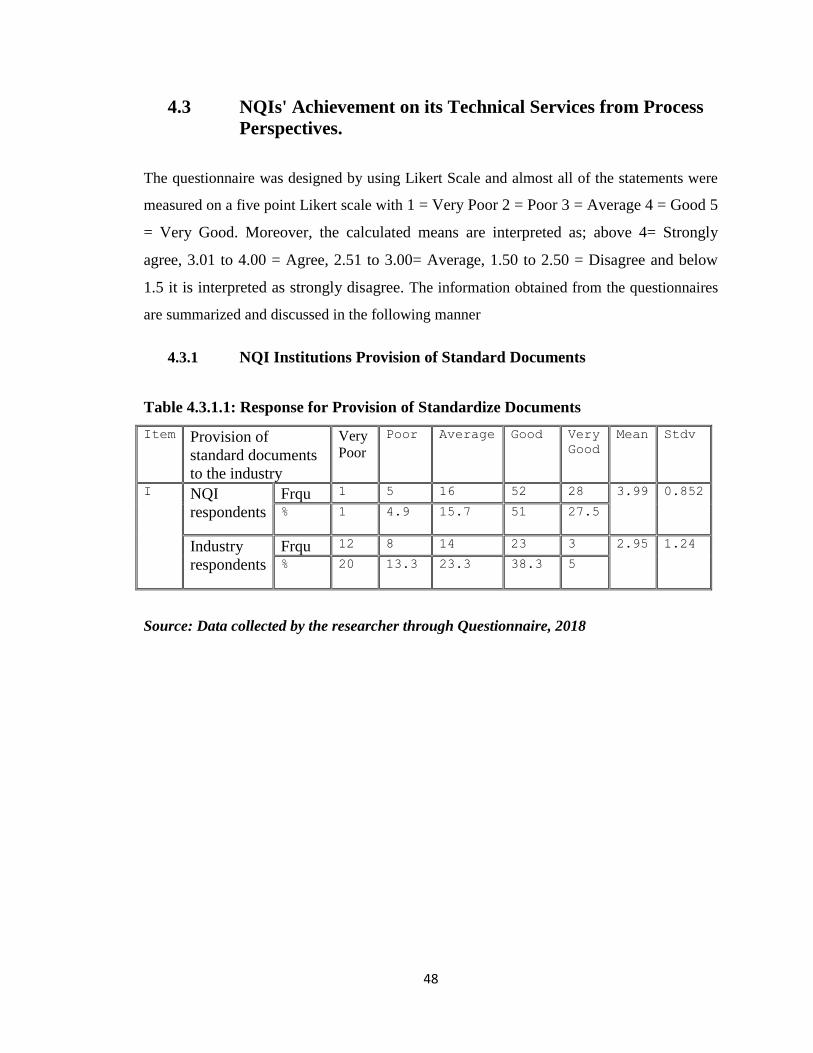
48
4.3 NQIs' Achievement on its Technical Services from Process
Perspectives.
The questionnaire was designed by using Likert Scale and almost all of the statements were
measured on a five point Likert scale with 1 = Very Poor 2 = Poor 3 = Average 4 = Good 5
= Very Good. Moreover, the calculated means are interpreted as; above 4= Strongly
agree, 3.01 to 4.00 = Agree, 2.51 to 3.00= Average, 1.50 to 2.50 = Disagree and below
1.5 it is interpreted as strongly disagree. The information obtained from the questionnaires
are summarized and discussed in the following manner
4.3.1 NQI Institutions Provision of Standard Documents
Table 4.3.1.1: Response for Provision of Standardize Documents
Item Provision of
standard documents
to the industry
Very
Poor
Poor Average Good Very
Good
Mean Stdv
I NQI
respondents
Frqu 1 5 16 52 28 3.99 0.852
%
1 4.9 15.7 51 27.5
Industry
respondents
Frqu 12 8 14 23 3 2.95 1.24
%
20 13.3 23.3 38.3 5
Source: Data collected by the researcher through Questionnaire, 2018
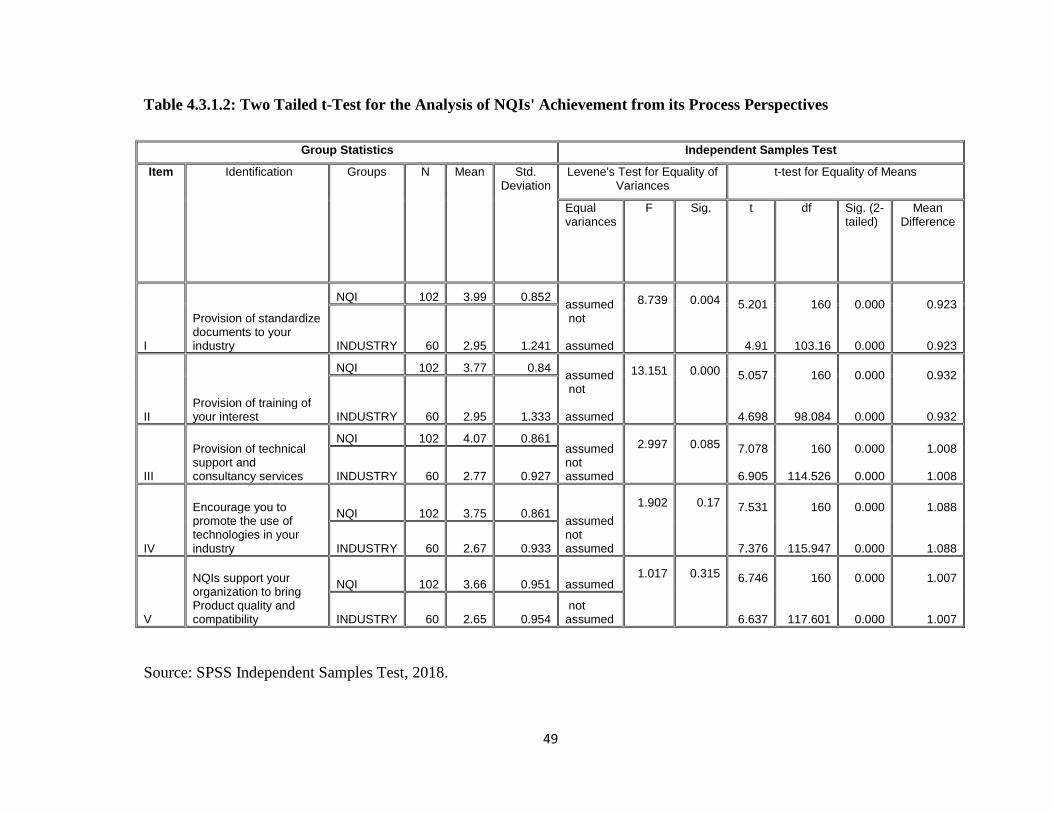
49
Table 4.3.1.2: Two Tailed t-Test for the Analysis of NQIs' Achievement from its Process Perspectives
Group Statistics Independent Samples Test
Item Identification Groups N Mean Std. Deviation
Levene's Test for Equality of Variances
t-test for Equality of Means
Equal variances
F Sig. t df Sig. (2-tailed)
Mean Difference
I
Provision of standardize documents to your industry
NQI 102 3.99 0.852 assumed not assumed
8.739
0.004
5.201
4.91
160
103.16
0.000
0.000
0.923
0.923 INDUSTRY 60 2.95 1.241
II Provision of training of your interest
NQI 102 3.77 0.84 assumed not assumed
13.151
0.000
5.057
4.698
160
98.084
0.000
0.000
0.932
0.932 INDUSTRY 60 2.95 1.333
III
Provision of technical support and consultancy services
NQI 102 4.07 0.861 assumed not assumed
2.997
0.085
7.078
6.905
160
114.526
0.000
0.000
1.008
1.008 INDUSTRY 60 2.77 0.927
IV
Encourage you to promote the use of technologies in your industry
NQI 102 3.75 0.861 assumed not assumed
1.902
0.17
7.531
7.376
160
115.947
0.000
0.000
1.088
1.088 INDUSTRY 60 2.67 0.933
V
NQIs support your organization to bring Product quality and compatibility
NQI 102 3.66 0.951 assumed
1.017
0.315
6.746
6.637
160
117.601
0.000
0.000
1.007
1.007 INDUSTRY 60 2.65 0.954 not assumed
Source: SPSS Independent Samples Test, 2018.
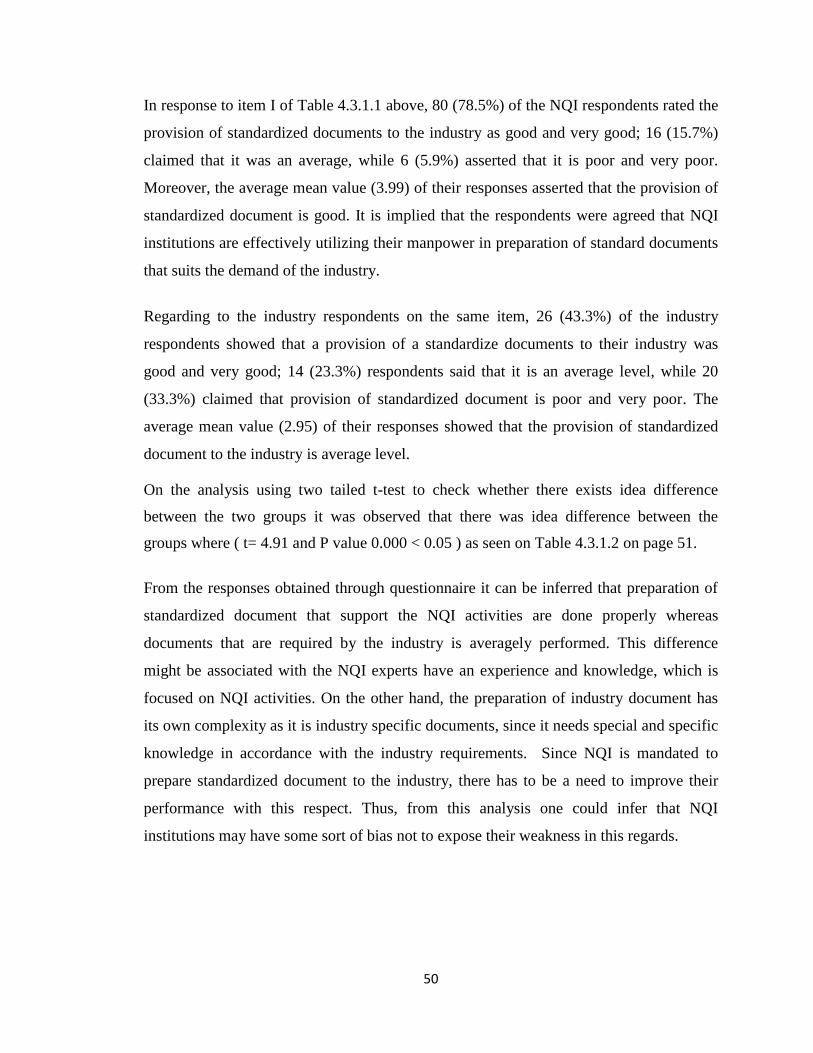
50
In response to item I of Table 4.3.1.1 above, 80 (78.5%) of the NQI respondents rated the
provision of standardized documents to the industry as good and very good; 16 (15.7%)
claimed that it was an average, while 6 (5.9%) asserted that it is poor and very poor.
Moreover, the average mean value (3.99) of their responses asserted that the provision of
standardized document is good. It is implied that the respondents were agreed that NQI
institutions are effectively utilizing their manpower in preparation of standard documents
that suits the demand of the industry.
Regarding to the industry respondents on the same item, 26 (43.3%) of the industry
respondents showed that a provision of a standardize documents to their industry was
good and very good; 14 (23.3%) respondents said that it is an average level, while 20
(33.3%) claimed that provision of standardized document is poor and very poor. The
average mean value (2.95) of their responses showed that the provision of standardized
document to the industry is average level.
On the analysis using two tailed t-test to check whether there exists idea difference
between the two groups it was observed that there was idea difference between the
groups where ( t= 4.91 and P value 0.000 < 0.05 ) as seen on Table 4.3.1.2 on page 51.
From the responses obtained through questionnaire it can be inferred that preparation of
standardized document that support the NQI activities are done properly whereas
documents that are required by the industry is averagely performed. This difference
might be associated with the NQI experts have an experience and knowledge, which is
focused on NQI activities. On the other hand, the preparation of industry document has
its own complexity as it is industry specific documents, since it needs special and specific
knowledge in accordance with the industry requirements. Since NQI is mandated to
prepare standardized document to the industry, there has to be a need to improve their
performance with this respect. Thus, from this analysis one could infer that NQI
institutions may have some sort of bias not to expose their weakness in this regards.
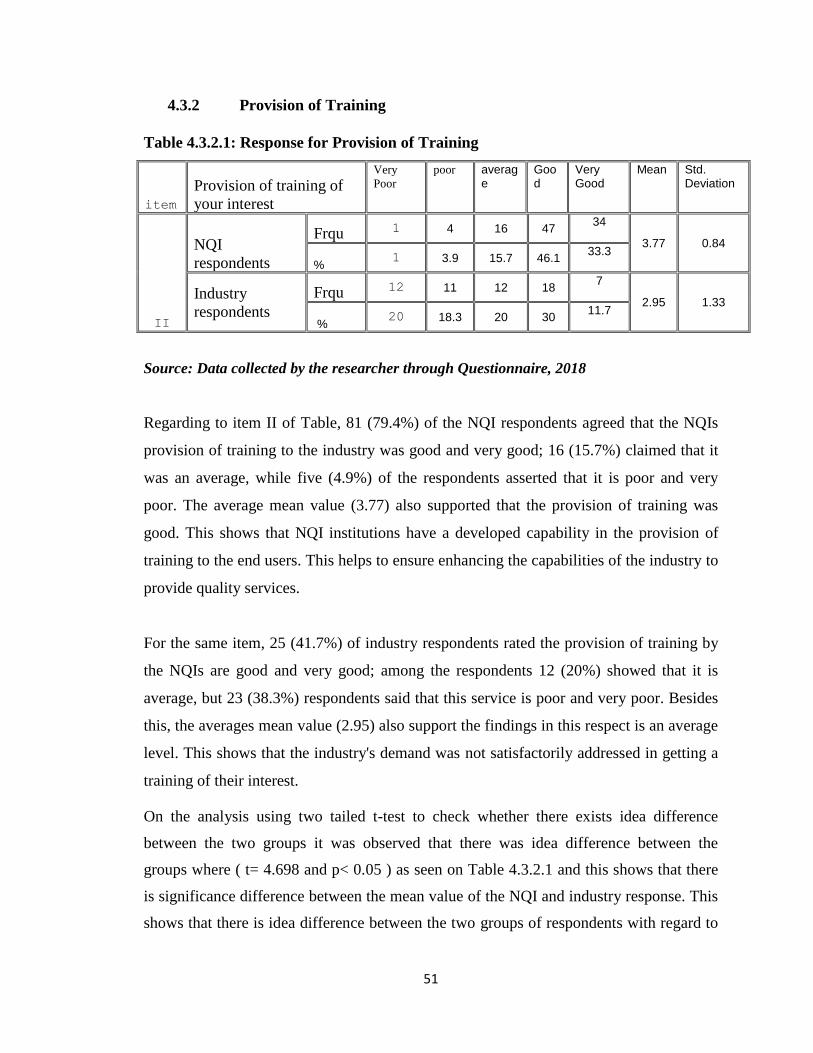
51
4.3.2 Provision of Training
Table 4.3.2.1: Response for Provision of Training
item
Provision of training of
your interest
Very
Poor
poor average
Good
Very Good
Mean Std. Deviation
II
NQI
respondents
Frqu 1 4 16 47
34
3.77 0.84
% 1 3.9 15.7 46.1
33.3
Industry
respondents
Frqu 12 11 12 18
7
2.95 1.33
% 20 18.3 20 30
11.7
Source: Data collected by the researcher through Questionnaire, 2018
Regarding to item II of Table, 81 (79.4%) of the NQI respondents agreed that the NQIs
provision of training to the industry was good and very good; 16 (15.7%) claimed that it
was an average, while five (4.9%) of the respondents asserted that it is poor and very
poor. The average mean value (3.77) also supported that the provision of training was
good. This shows that NQI institutions have a developed capability in the provision of
training to the end users. This helps to ensure enhancing the capabilities of the industry to
provide quality services.
For the same item, 25 (41.7%) of industry respondents rated the provision of training by
the NQIs are good and very good; among the respondents 12 (20%) showed that it is
average, but 23 (38.3%) respondents said that this service is poor and very poor. Besides
this, the averages mean value (2.95) also support the findings in this respect is an average
level. This shows that the industry's demand was not satisfactorily addressed in getting a
training of their interest.
On the analysis using two tailed t-test to check whether there exists idea difference
between the two groups it was observed that there was idea difference between the
groups where ( t= 4.698 and p< 0.05 ) as seen on Table 4.3.2.1 and this shows that there
is significance difference between the mean value of the NQI and industry response. This
shows that there is idea difference between the two groups of respondents with regard to
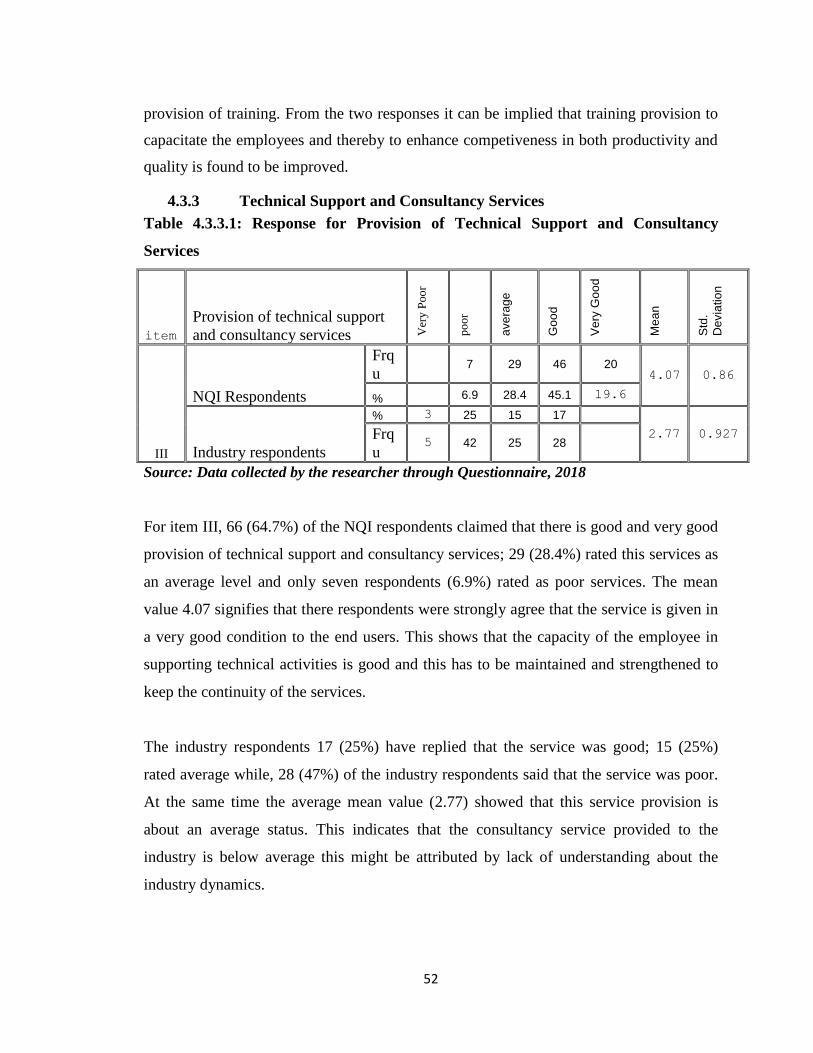
52
provision of training. From the two responses it can be implied that training provision to
capacitate the employees and thereby to enhance competiveness in both productivity and
quality is found to be improved.
4.3.3 Technical Support and Consultancy Services
Table 4.3.3.1: Response for Provision of Technical Support and Consultancy
Services
item
Provision of technical support
and consultancy services Ver
y P
oo
r
po
or
ave
rag
e
Go
od
Ve
ry G
oo
d
Me
an
Std
.
De
via
tio
n
III
NQI Respondents
Frq
u 7 29 46 20
4.07 0.86
% 6.9 28.4 45.1 19.6
Industry respondents
% 3 25 15 17
2.77 0.927 Frq
u 5 42 25 28
Source: Data collected by the researcher through Questionnaire, 2018
For item III, 66 (64.7%) of the NQI respondents claimed that there is good and very good
provision of technical support and consultancy services; 29 (28.4%) rated this services as
an average level and only seven respondents (6.9%) rated as poor services. The mean
value 4.07 signifies that there respondents were strongly agree that the service is given in
a very good condition to the end users. This shows that the capacity of the employee in
supporting technical activities is good and this has to be maintained and strengthened to
keep the continuity of the services.
The industry respondents 17 (25%) have replied that the service was good; 15 (25%)
rated average while, 28 (47%) of the industry respondents said that the service was poor.
At the same time the average mean value (2.77) showed that this service provision is
about an average status. This indicates that the consultancy service provided to the
industry is below average this might be attributed by lack of understanding about the
industry dynamics.
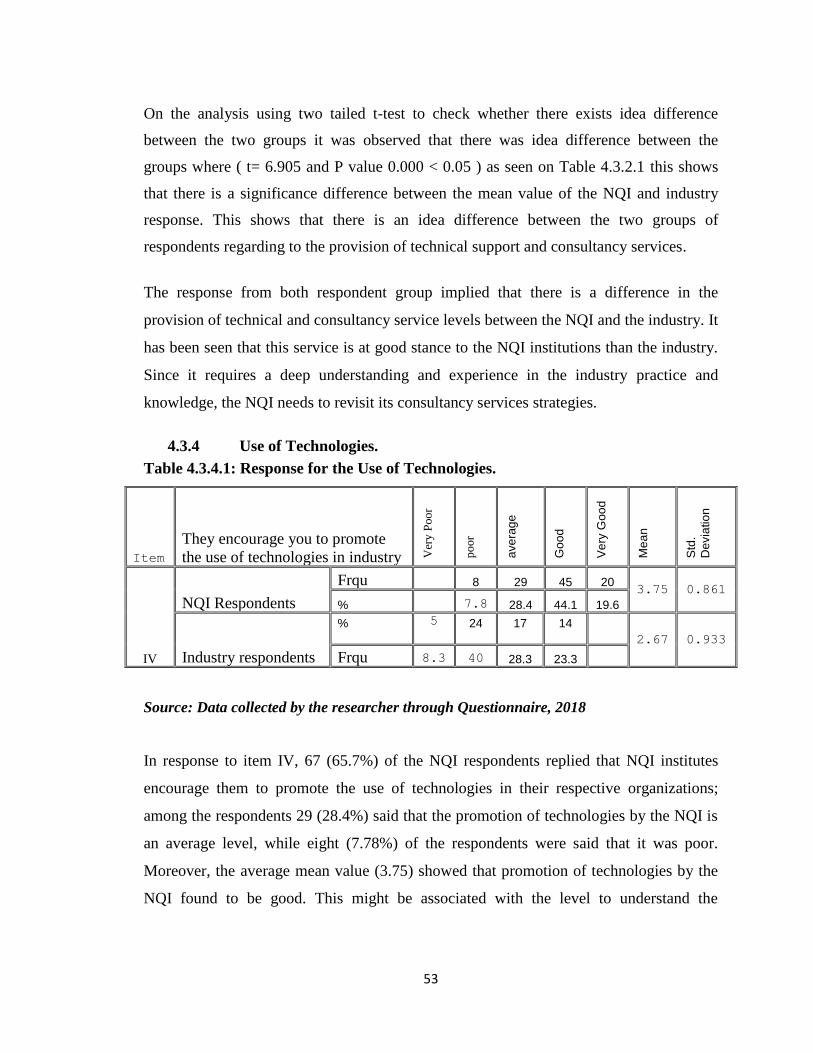
53
On the analysis using two tailed t-test to check whether there exists idea difference
between the two groups it was observed that there was idea difference between the
groups where ( t= 6.905 and P value 0.000 < 0.05 ) as seen on Table 4.3.2.1 this shows
that there is a significance difference between the mean value of the NQI and industry
response. This shows that there is an idea difference between the two groups of
respondents regarding to the provision of technical support and consultancy services.
The response from both respondent group implied that there is a difference in the
provision of technical and consultancy service levels between the NQI and the industry. It
has been seen that this service is at good stance to the NQI institutions than the industry.
Since it requires a deep understanding and experience in the industry practice and
knowledge, the NQI needs to revisit its consultancy services strategies.
4.3.4 Use of Technologies.
Table 4.3.4.1: Response for the Use of Technologies.
Item
They encourage you to promote
the use of technologies in industry Ver
y P
oo
r
po
or
ave
rag
e
Go
od
Ve
ry G
oo
d
Me
an
Std
.
Devia
tio
n
IV
NQI Respondents
Frqu
8 29 45 20 3.75 0.861
%
7.8 28.4 44.1 19.6
Industry respondents
%
5
24
17
14
2.67 0.933
Frqu 8.3 40 28.3 23.3
Source: Data collected by the researcher through Questionnaire, 2018
In response to item IV, 67 (65.7%) of the NQI respondents replied that NQI institutes
encourage them to promote the use of technologies in their respective organizations;
among the respondents 29 (28.4%) said that the promotion of technologies by the NQI is
an average level, while eight (7.78%) of the respondents were said that it was poor.
Moreover, the average mean value (3.75) showed that promotion of technologies by the
NQI found to be good. This might be associated with the level to understand the
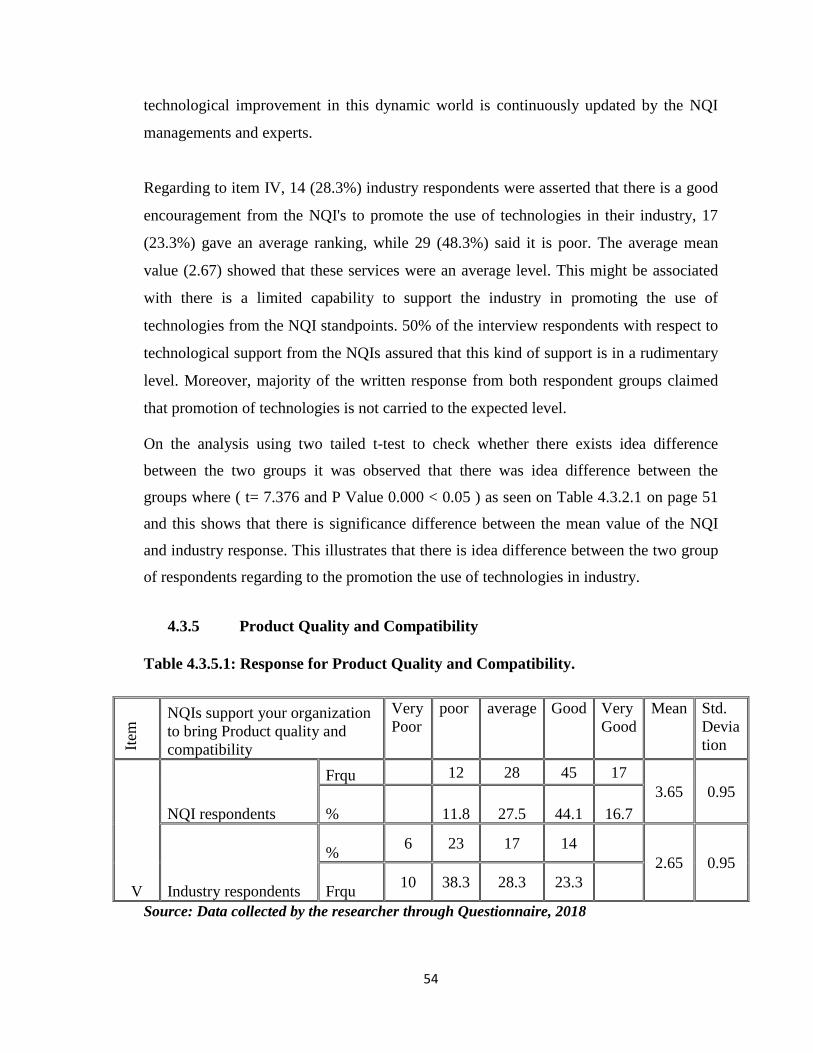
54
technological improvement in this dynamic world is continuously updated by the NQI
managements and experts.
Regarding to item IV, 14 (28.3%) industry respondents were asserted that there is a good
encouragement from the NQI's to promote the use of technologies in their industry, 17
(23.3%) gave an average ranking, while 29 (48.3%) said it is poor. The average mean
value (2.67) showed that these services were an average level. This might be associated
with there is a limited capability to support the industry in promoting the use of
technologies from the NQI standpoints. 50% of the interview respondents with respect to
technological support from the NQIs assured that this kind of support is in a rudimentary
level. Moreover, majority of the written response from both respondent groups claimed
that promotion of technologies is not carried to the expected level.
On the analysis using two tailed t-test to check whether there exists idea difference
between the two groups it was observed that there was idea difference between the
groups where ( t= 7.376 and P Value 0.000 < 0.05 ) as seen on Table 4.3.2.1 on page 51
and this shows that there is significance difference between the mean value of the NQI
and industry response. This illustrates that there is idea difference between the two group
of respondents regarding to the promotion the use of technologies in industry.
4.3.5 Product Quality and Compatibility
Table 4.3.5.1: Response for Product Quality and Compatibility.
Item
NQIs support your organization
to bring Product quality and
compatibility
Very
Poor
poor average Good Very
Good
Mean Std.
Devia
tion
V
NQI respondents
Frqu 12 28 45 17
3.65 0.95
% 11.8 27.5 44.1 16.7
Industry respondents
% 6 23 17 14
2.65 0.95
Frqu 10 38.3 28.3 23.3
Source: Data collected by the researcher through Questionnaire, 2018
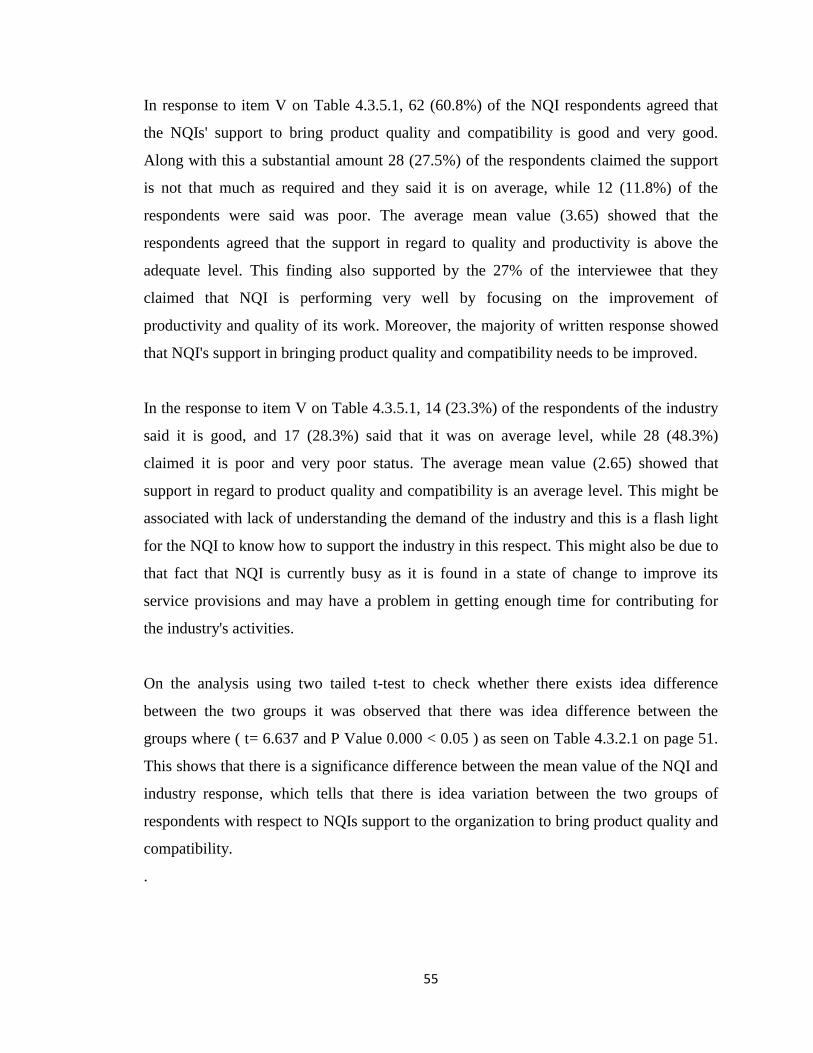
55
In response to item V on Table 4.3.5.1, 62 (60.8%) of the NQI respondents agreed that
the NQIs' support to bring product quality and compatibility is good and very good.
Along with this a substantial amount 28 (27.5%) of the respondents claimed the support
is not that much as required and they said it is on average, while 12 (11.8%) of the
respondents were said was poor. The average mean value (3.65) showed that the
respondents agreed that the support in regard to quality and productivity is above the
adequate level. This finding also supported by the 27% of the interviewee that they
claimed that NQI is performing very well by focusing on the improvement of
productivity and quality of its work. Moreover, the majority of written response showed
that NQI's support in bringing product quality and compatibility needs to be improved.
In the response to item V on Table 4.3.5.1, 14 (23.3%) of the respondents of the industry
said it is good, and 17 (28.3%) said that it was on average level, while 28 (48.3%)
claimed it is poor and very poor status. The average mean value (2.65) showed that
support in regard to product quality and compatibility is an average level. This might be
associated with lack of understanding the demand of the industry and this is a flash light
for the NQI to know how to support the industry in this respect. This might also be due to
that fact that NQI is currently busy as it is found in a state of change to improve its
service provisions and may have a problem in getting enough time for contributing for
the industry's activities.
On the analysis using two tailed t-test to check whether there exists idea difference
between the two groups it was observed that there was idea difference between the
groups where ( t= 6.637 and P Value 0.000 < 0.05 ) as seen on Table 4.3.2.1 on page 51.
This shows that there is a significance difference between the mean value of the NQI and
industry response, which tells that there is idea variation between the two groups of
respondents with respect to NQIs support to the organization to bring product quality and
compatibility.
.

56
In general the NQI activities towards product quality and compatibility to support the
industry need to be given due attention, because keeping product quality is one of the
foundation of competitiveness in the global market.
4.4 NQIs' performance from Strategic Constituency Approach
The questionnaire was designed by using Likert Scale and almost all of the statements were
measured on a five point scale with 1= Strongly Disagree; 2= Disagree; 3= Moderate; 4=
Agree; 5=Strongly Agree. The information obtained from the questionnaires are summarized
and discussed in the following manner.
4.4.1 Lesson Learned Experience
Table 4.4.1.1. Response for Lack of Lesson Learned Experience
Item Lack of lesson learned
experience
Strongl
y
Disagr
ee
Disagr
ee medium
Agr
ee
Strongly
Agree Mean
Std. Deviatio
n
I
NQI
respondents
Frqu 5 16 64 17
3.91 0.719
% 4.9 15.7 62.7 16.7
Industry
Respondents
Frqu 4 9 30 17
4 0.844
% 6.7 15 50 28.3
Source: Data collected by the researcher through Questionnaire, 2018
Table 4.4.1.1 shows that 81(79.4%) of the NQI respondents were agreed and strongly
agreed that there is lack of lesson learned experience in the NQI; while 16(15.7%) were
asserted that it is on an average level. Moreover, the mean value (3.91) tells that the
respondents were agreed that there is lack of lesson learned experience in the NQI
institutions.
The industry respondents 47(78.3%) were agreed and strongly agreed that there is lack of
lesson learning experience in the NQI institutions, while nine (15%) were said it is
medium level.
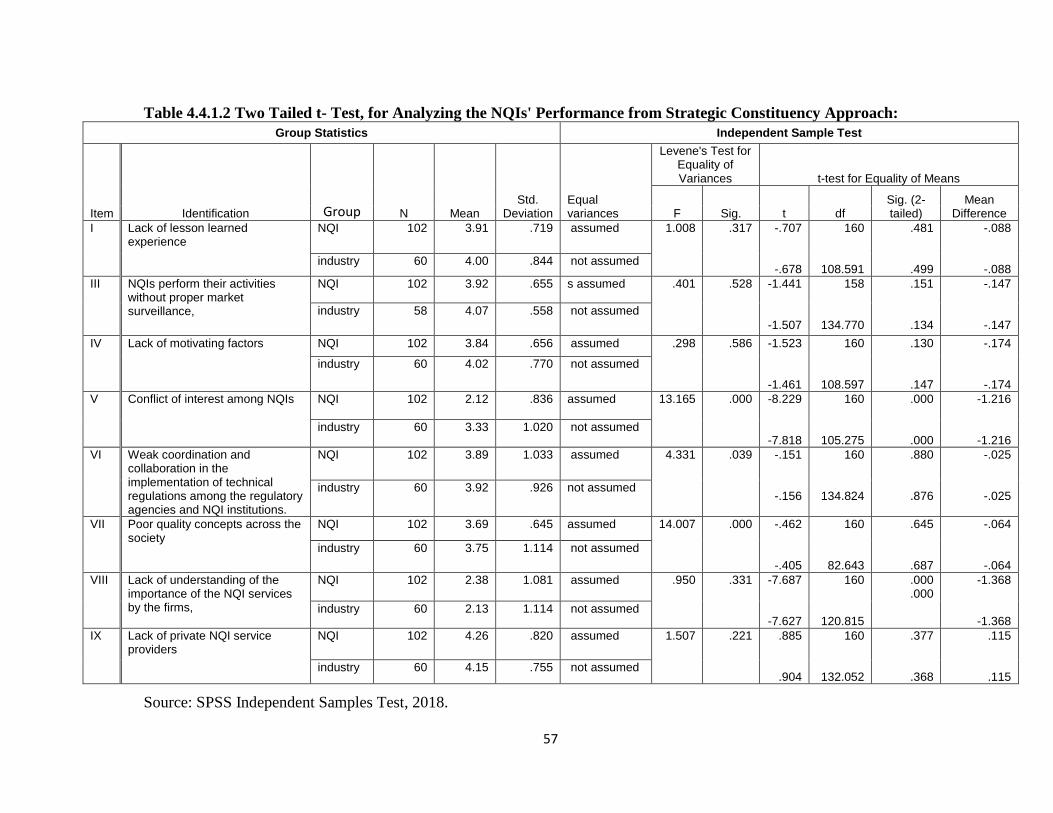
57
Table 4.4.1.2 Two Tailed t- Test, for Analyzing the NQIs' Performance from Strategic Constituency Approach:
Group Statistics Independent Sample Test
Item Identification Group N Mean Std.
Deviation Equal variances
Levene's Test for Equality of Variances t-test for Equality of Means
F Sig. t df Sig. (2-tailed)
Mean Difference
I Lack of lesson learned experience
NQI 102 3.91 .719 assumed 1.008
.317
-.707
-.678
160
108.591
.481
.499
-.088
-.088 industry 60 4.00 .844 not assumed
III NQIs perform their activities without proper market surveillance,
NQI 102 3.92 .655 s assumed .401
.528
-1.441
-1.507
158
134.770
.151
.134
-.147
-.147
industry 58 4.07 .558 not assumed
IV Lack of motivating factors NQI 102 3.84 .656 assumed .298
.586
-1.523
-1.461
160
108.597
.130
.147
-.174
-.174
industry 60 4.02 .770 not assumed
V Conflict of interest among NQIs NQI 102 2.12 .836 assumed 13.165
.000
-8.229
-7.818
160
105.275
.000
.000
-1.216
-1.216 industry 60 3.33 1.020 not assumed
VI Weak coordination and collaboration in the implementation of technical regulations among the regulatory agencies and NQI institutions.
NQI 102 3.89 1.033 assumed 4.331
.039
-.151
-.156
160
134.824
.880
.876
-.025
-.025 industry 60 3.92 .926 not assumed
VII Poor quality concepts across the society
NQI 102 3.69 .645 assumed 14.007
.000
-.462
-.405
160
82.643
.645
.687
-.064
-.064
industry 60 3.75 1.114 not assumed
VIII Lack of understanding of the importance of the NQI services by the firms,
NQI 102 2.38 1.081 assumed .950
.331
-7.687
-7.627
160
120.815
.000
.000 -1.368
-1.368 industry 60 2.13 1.114 not assumed
IX Lack of private NQI service providers
NQI 102 4.26 .820 assumed 1.507
.221
.885
.904
160
132.052
.377
.368
.115
.115 industry 60 4.15 .755 not assumed
Source: SPSS Independent Samples Test, 2018.
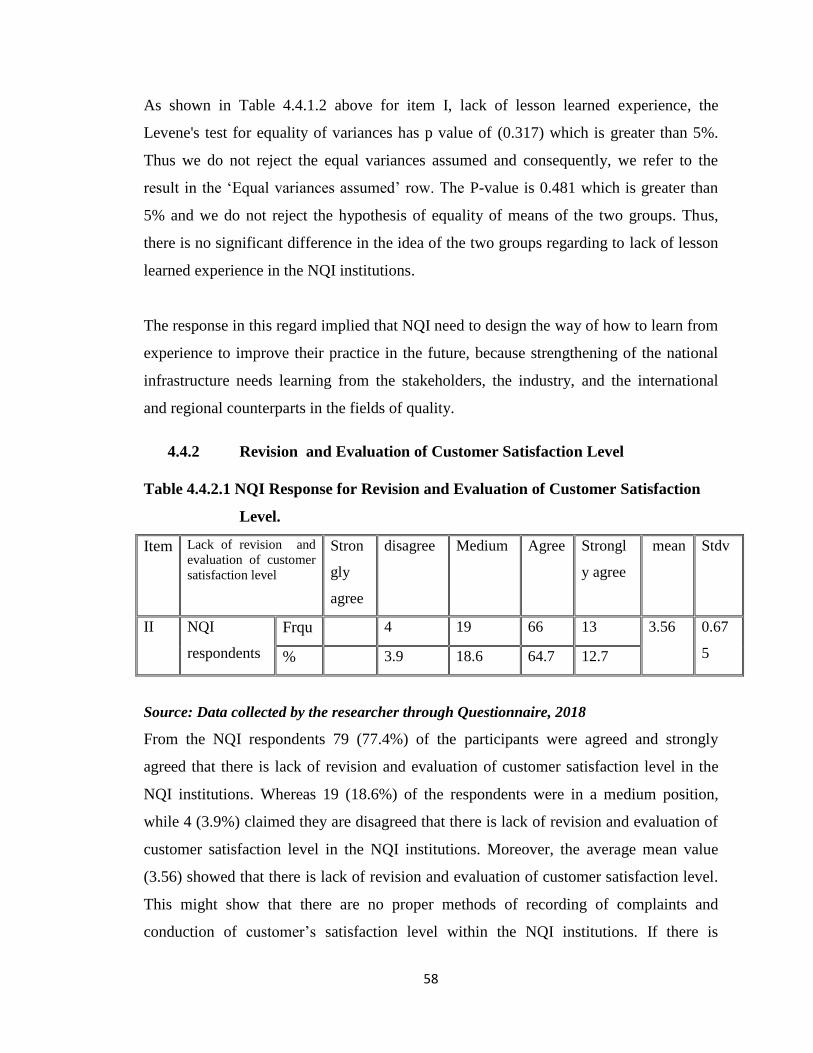
58
As shown in Table 4.4.1.2 above for item I, lack of lesson learned experience, the
Levene's test for equality of variances has p value of (0.317) which is greater than 5%.
Thus we do not reject the equal variances assumed and consequently, we refer to the
result in the ‘Equal variances assumed’ row. The P-value is 0.481 which is greater than
5% and we do not reject the hypothesis of equality of means of the two groups. Thus,
there is no significant difference in the idea of the two groups regarding to lack of lesson
learned experience in the NQI institutions.
The response in this regard implied that NQI need to design the way of how to learn from
experience to improve their practice in the future, because strengthening of the national
infrastructure needs learning from the stakeholders, the industry, and the international
and regional counterparts in the fields of quality.
4.4.2 Revision and Evaluation of Customer Satisfaction Level
Table 4.4.2.1 NQI Response for Revision and Evaluation of Customer Satisfaction
Level.
Item Lack of revision and
evaluation of customer
satisfaction level
Stron
gly
agree
disagree Medium Agree Strongl
y agree
mean Stdv
II NQI
respondents
Frqu 4 19 66 13 3.56 0.67
5 % 3.9 18.6 64.7 12.7
Source: Data collected by the researcher through Questionnaire, 2018
From the NQI respondents 79 (77.4%) of the participants were agreed and strongly
agreed that there is lack of revision and evaluation of customer satisfaction level in the
NQI institutions. Whereas 19 (18.6%) of the respondents were in a medium position,
while 4 (3.9%) claimed they are disagreed that there is lack of revision and evaluation of
customer satisfaction level in the NQI institutions. Moreover, the average mean value
(3.56) showed that there is lack of revision and evaluation of customer satisfaction level.
This might show that there are no proper methods of recording of complaints and
conduction of customer’s satisfaction level within the NQI institutions. If there is
59
improper customer revision methods persist in the institutions there is a possibility to
repeat mistakes since mistakes may not be recorded and revised. Moreover, constructive
suggestion might also be missed, which can be regarded as an opportunities for
development.
4.4.3 Market Surveillance
Table 4.4.3.1 Response for Proper Market Surveillance.
Ite
m
NQIs perform their
activities without proper
market surveillance
Stron
gly
agree
Disag
ree
Medi
um agree
Strongly
agree Mean STDV.
III
NQIs response
Frqu 4 14 70 14
3.92 0.655
% 3.9 13.7 68.6 13.7
Industry
response
% 9 40 11
4.07
0.55
8
Frqu 15 66.7 18.3
Source: Data Collected through Questionnaire, 2018
Response from the NQI respondents shows that 84 (82.3%) were agree and strongly
agree that NQI perform their activities without proper market surveillance; 14 (13.7%)
were said it is in medium while four (3.9%) were disagreed. The average mean value
(4.07) showed that NQI performs their activities without proper market surveillance. This
might show that it is an indication for the limitation in the NQI scope of services.
Table 4.4.3.1, item III, shows that 51(85%) of the industry response were agreed and
strongly agreed that the NQI perform their activities without proper market surveillance;
9 (15%) of them said it is a medium level. This indicates that many of the industries
demand are not covered by the NQI system as their demand is not accessed and
addressed in the frame work of the NQI activities.
As shown on page 59 in Table 4.4.1.2 above for item III, NQIs perform their activities
without proper market surveillance, the Levene's test for equality of variances has shown
that the P value of 0.528 is greater than 5%. Thus we do not reject the equal variances
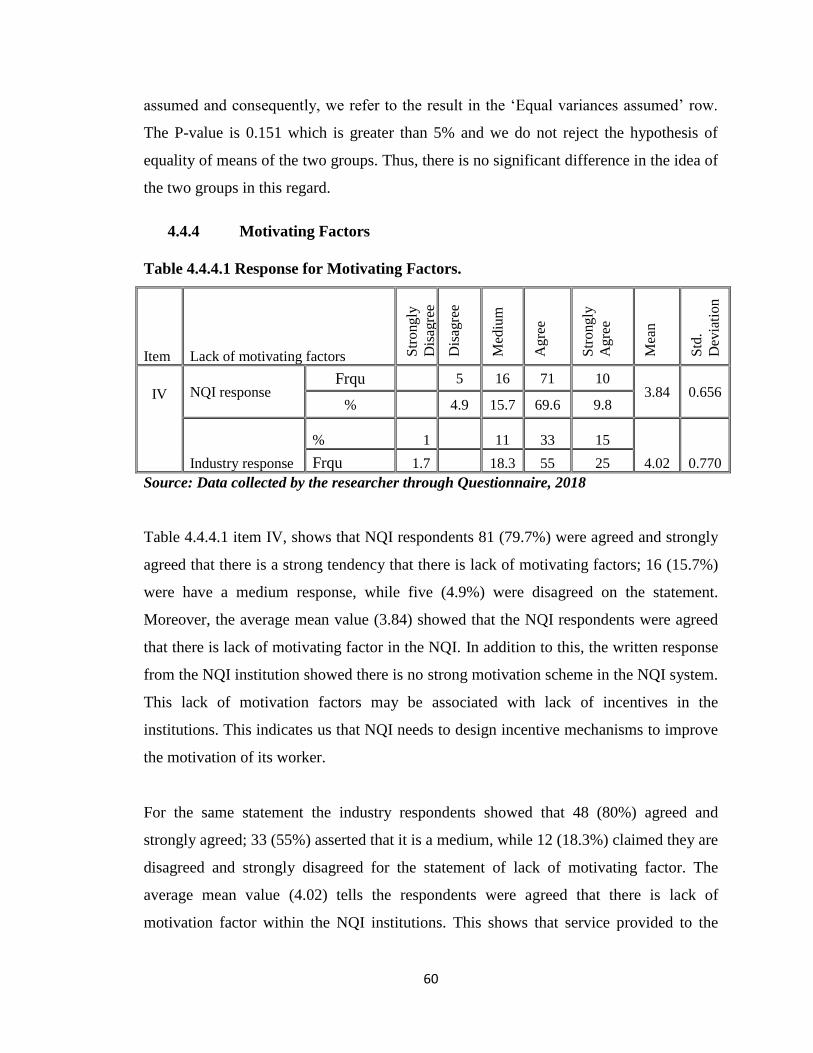
60
assumed and consequently, we refer to the result in the ‘Equal variances assumed’ row.
The P-value is 0.151 which is greater than 5% and we do not reject the hypothesis of
equality of means of the two groups. Thus, there is no significant difference in the idea of
the two groups in this regard.
4.4.4 Motivating Factors
Table 4.4.4.1 Response for Motivating Factors.
Item
Lack of motivating factors Str
ong
ly
Dis
agre
e
Dis
agre
e
Med
ium
Ag
ree
Str
ong
ly
Ag
ree
Mea
n
Std
.
Dev
iati
on
IV
NQI response Frqu
5 16 71 10
3.84 0.656 %
4.9 15.7 69.6 9.8
Industry response
% 1 11 33 15
4.02 0.770 Frqu 1.7 18.3 55 25
Source: Data collected by the researcher through Questionnaire, 2018
Table 4.4.4.1 item IV, shows that NQI respondents 81 (79.7%) were agreed and strongly
agreed that there is a strong tendency that there is lack of motivating factors; 16 (15.7%)
were have a medium response, while five (4.9%) were disagreed on the statement.
Moreover, the average mean value (3.84) showed that the NQI respondents were agreed
that there is lack of motivating factor in the NQI. In addition to this, the written response
from the NQI institution showed there is no strong motivation scheme in the NQI system.
This lack of motivation factors may be associated with lack of incentives in the
institutions. This indicates us that NQI needs to design incentive mechanisms to improve
the motivation of its worker.
For the same statement the industry respondents showed that 48 (80%) agreed and
strongly agreed; 33 (55%) asserted that it is a medium, while 12 (18.3%) claimed they are
disagreed and strongly disagreed for the statement of lack of motivating factor. The
average mean value (4.02) tells the respondents were agreed that there is lack of
motivation factor within the NQI institutions. This shows that service provided to the
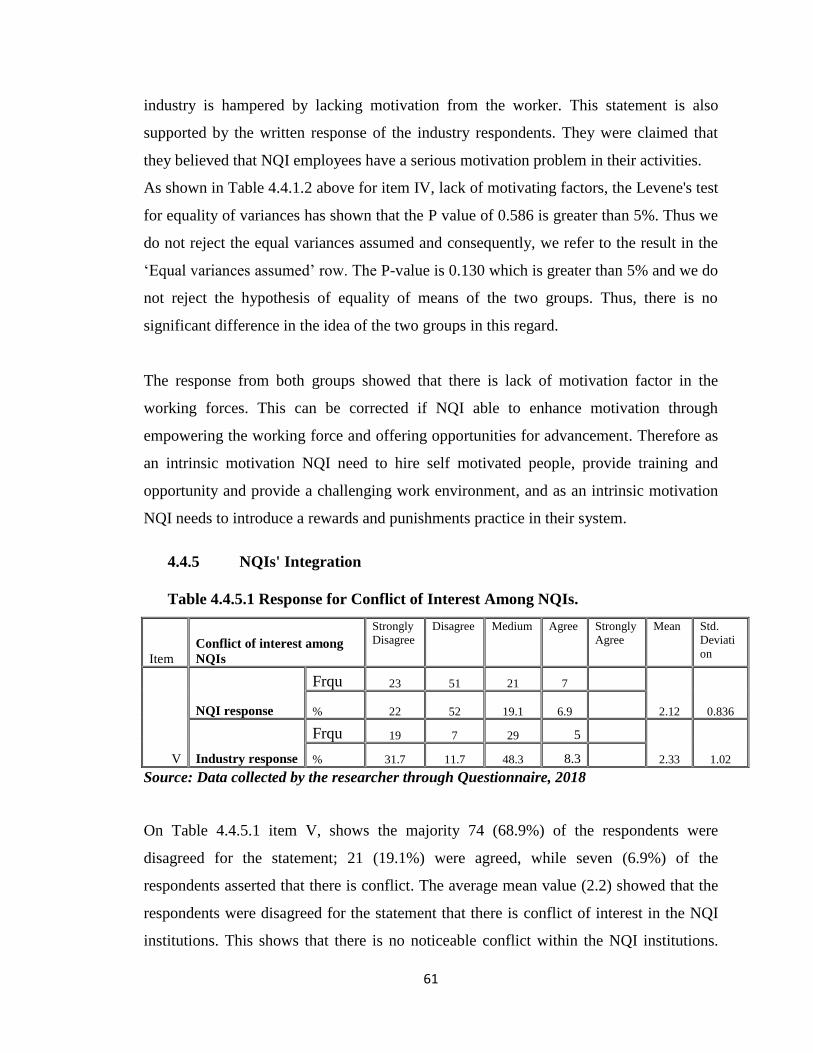
61
industry is hampered by lacking motivation from the worker. This statement is also
supported by the written response of the industry respondents. They were claimed that
they believed that NQI employees have a serious motivation problem in their activities.
As shown in Table 4.4.1.2 above for item IV, lack of motivating factors, the Levene's test
for equality of variances has shown that the P value of 0.586 is greater than 5%. Thus we
do not reject the equal variances assumed and consequently, we refer to the result in the
‘Equal variances assumed’ row. The P-value is 0.130 which is greater than 5% and we do
not reject the hypothesis of equality of means of the two groups. Thus, there is no
significant difference in the idea of the two groups in this regard.
The response from both groups showed that there is lack of motivation factor in the
working forces. This can be corrected if NQI able to enhance motivation through
empowering the working force and offering opportunities for advancement. Therefore as
an intrinsic motivation NQI need to hire self motivated people, provide training and
opportunity and provide a challenging work environment, and as an intrinsic motivation
NQI needs to introduce a rewards and punishments practice in their system.
4.4.5 NQIs' Integration
Table 4.4.5.1 Response for Conflict of Interest Among NQIs.
Item
Conflict of interest among
NQIs
Strongly
Disagree
Disagree Medium Agree Strongly
Agree
Mean Std.
Deviati
on
V
NQI response
Frqu 23 51 21 7
2.12 0.836 % 22 52 19.1 6.9
Industry response
Frqu 19 7 29 5
2.33 1.02 % 31.7 11.7 48.3 8.3
Source: Data collected by the researcher through Questionnaire, 2018
On Table 4.4.5.1 item V, shows the majority 74 (68.9%) of the respondents were
disagreed for the statement; 21 (19.1%) were agreed, while seven (6.9%) of the
respondents asserted that there is conflict. The average mean value (2.2) showed that the
respondents were disagreed for the statement that there is conflict of interest in the NQI
institutions. This shows that there is no noticeable conflict within the NQI institutions.
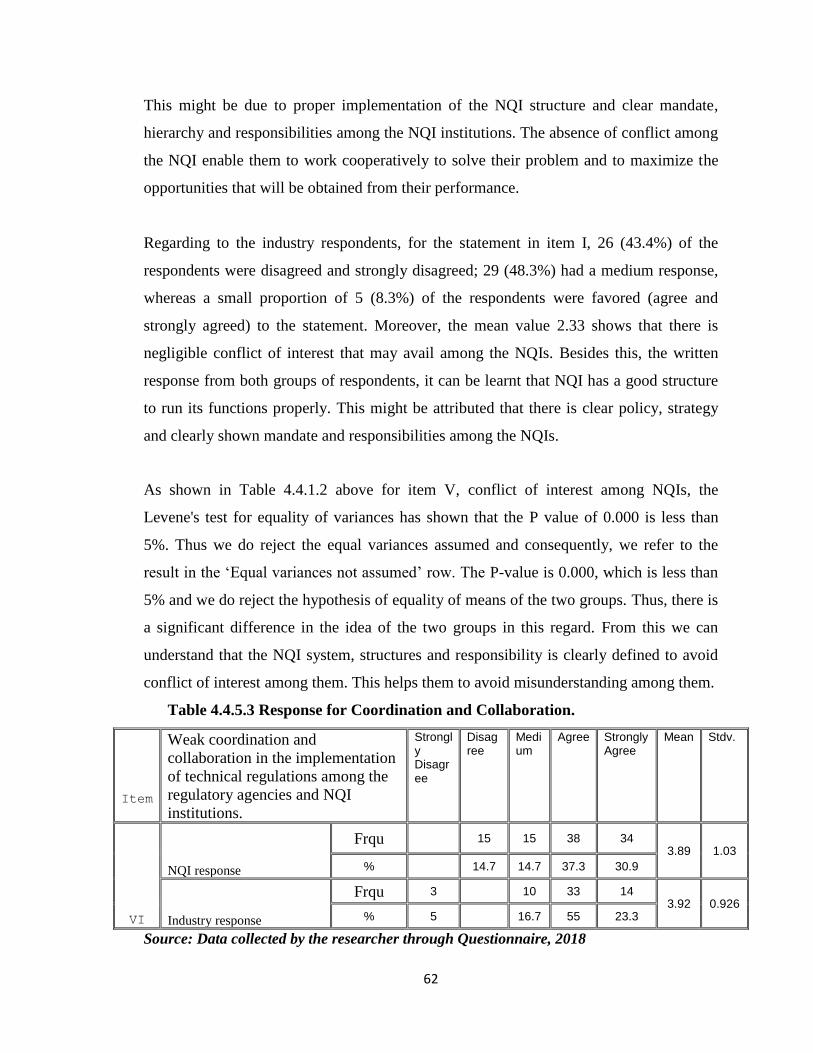
62
This might be due to proper implementation of the NQI structure and clear mandate,
hierarchy and responsibilities among the NQI institutions. The absence of conflict among
the NQI enable them to work cooperatively to solve their problem and to maximize the
opportunities that will be obtained from their performance.
Regarding to the industry respondents, for the statement in item I, 26 (43.4%) of the
respondents were disagreed and strongly disagreed; 29 (48.3%) had a medium response,
whereas a small proportion of 5 (8.3%) of the respondents were favored (agree and
strongly agreed) to the statement. Moreover, the mean value 2.33 shows that there is
negligible conflict of interest that may avail among the NQIs. Besides this, the written
response from both groups of respondents, it can be learnt that NQI has a good structure
to run its functions properly. This might be attributed that there is clear policy, strategy
and clearly shown mandate and responsibilities among the NQIs.
As shown in Table 4.4.1.2 above for item V, conflict of interest among NQIs, the
Levene's test for equality of variances has shown that the P value of 0.000 is less than
5%. Thus we do reject the equal variances assumed and consequently, we refer to the
result in the ‘Equal variances not assumed’ row. The P-value is 0.000, which is less than
5% and we do reject the hypothesis of equality of means of the two groups. Thus, there is
a significant difference in the idea of the two groups in this regard. From this we can
understand that the NQI system, structures and responsibility is clearly defined to avoid
conflict of interest among them. This helps them to avoid misunderstanding among them.
Table 4.4.5.3 Response for Coordination and Collaboration.
Item
Weak coordination and
collaboration in the implementation
of technical regulations among the
regulatory agencies and NQI
institutions.
Strongly Disagree
Disagree
Medium
Agree Strongly Agree
Mean Stdv.
VI
NQI response
Frqu 15 15 38 34
3.89 1.03
%
14.7 14.7 37.3 30.9
Industry response
Frqu 3
10 33 14 3.92 0.926
% 5
16.7 55 23.3
Source: Data collected by the researcher through Questionnaire, 2018
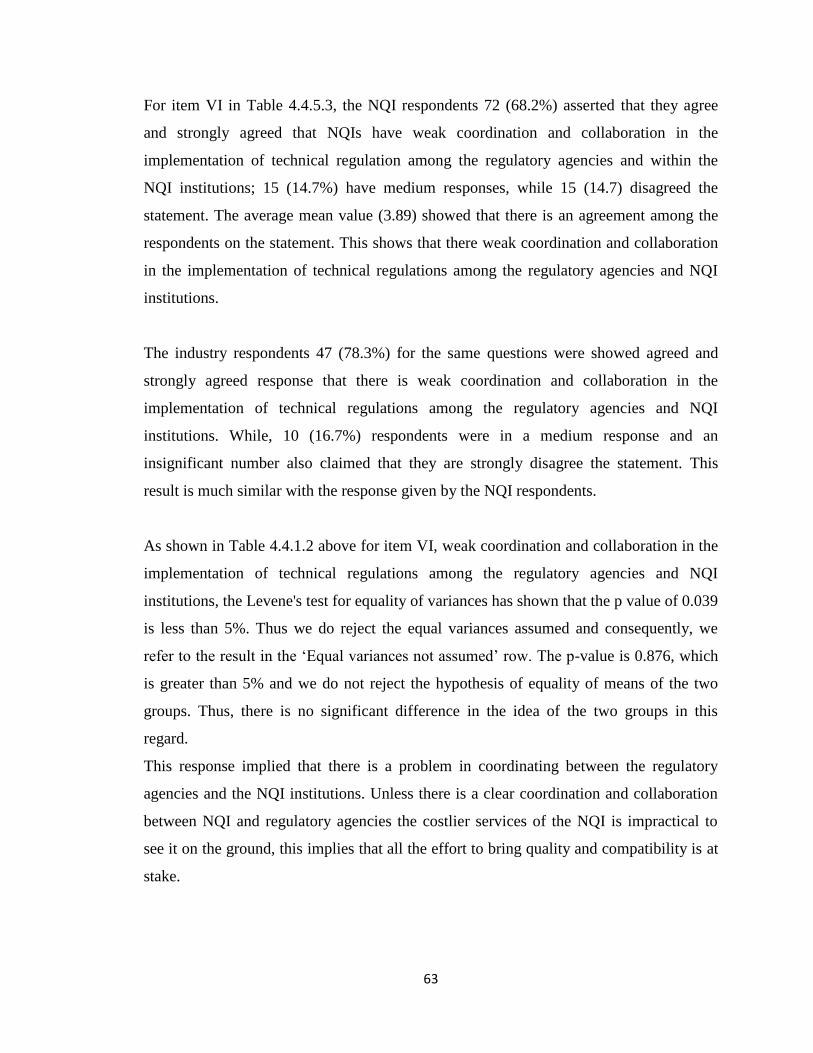
63
For item VI in Table 4.4.5.3, the NQI respondents 72 (68.2%) asserted that they agree
and strongly agreed that NQIs have weak coordination and collaboration in the
implementation of technical regulation among the regulatory agencies and within the
NQI institutions; 15 (14.7%) have medium responses, while 15 (14.7) disagreed the
statement. The average mean value (3.89) showed that there is an agreement among the
respondents on the statement. This shows that there weak coordination and collaboration
in the implementation of technical regulations among the regulatory agencies and NQI
institutions.
The industry respondents 47 (78.3%) for the same questions were showed agreed and
strongly agreed response that there is weak coordination and collaboration in the
implementation of technical regulations among the regulatory agencies and NQI
institutions. While, 10 (16.7%) respondents were in a medium response and an
insignificant number also claimed that they are strongly disagree the statement. This
result is much similar with the response given by the NQI respondents.
As shown in Table 4.4.1.2 above for item VI, weak coordination and collaboration in the
implementation of technical regulations among the regulatory agencies and NQI
institutions, the Levene's test for equality of variances has shown that the p value of 0.039
is less than 5%. Thus we do reject the equal variances assumed and consequently, we
refer to the result in the ‘Equal variances not assumed’ row. The p-value is 0.876, which
is greater than 5% and we do not reject the hypothesis of equality of means of the two
groups. Thus, there is no significant difference in the idea of the two groups in this
regard.
This response implied that there is a problem in coordinating between the regulatory
agencies and the NQI institutions. Unless there is a clear coordination and collaboration
between NQI and regulatory agencies the costlier services of the NQI is impractical to
see it on the ground, this implies that all the effort to bring quality and compatibility is at
stake.

64
4.4.6 Concept and Importance of NQI Services
Table 4.4.6.1 Response for Quality Concepts Across the Society It
e
m Poor quality concepts across the
society
Strongly
Disagree
Disagr
ee
Medi
um
Agre
e
Strongl
y Agree
Mea
n
Stdv
VII
NQI response
Frqu
4 30 62 6
3.69 0.65
%
3.6 27.3 56.4 7.3
Industry response
Frqu 4 4 10 27 15 3.75 1.114
% 6.7 6.7 16.7 45 25
Source: Data collected by the researcher through Questionnaire, 2018
Regarding to item VII on Table 4.4.6.1 about 72 (66.7%) of the NQI respondents have
replied that they were agreed and strongly agreed that there is poor quality concepts
across the society. Whereas 30 (27.3%) of the respondents were in medium response
while, four (3.6%) were disagreed the statement. This fact can tell us that this factor can
have a negative effect on NQI development.
In response to item VII, the majority of the respondents from the industry 42 (70%) were
agreed and strongly agreed that there is poor quality concepts across the society; 10
(16.7%) were replied that it is medium; while eight of them (13.4%) showed that they
disagreed and strongly disagreed the statement. In overall the average mean value (3.75)
indicates that most of the respondents were agreed that there are poor concepts about
quality among the people.
As shown in Table 4.4.1.2 above for item VII, poor quality concepts across the society,
the Levene's test for equality of variances has shown that the p value of 0.000 is less than
5%. Thus we do reject the equal variances assumed and consequently, we refer to the
result in the ‘Equal variances not assumed’ row. The p-value is 0.687, which is greater
than 5% and we do not reject the hypothesis of equality of means of the two groups.
Thus, there is no significant difference in the idea of the two groups in regard to poor
quality concepts across the society.
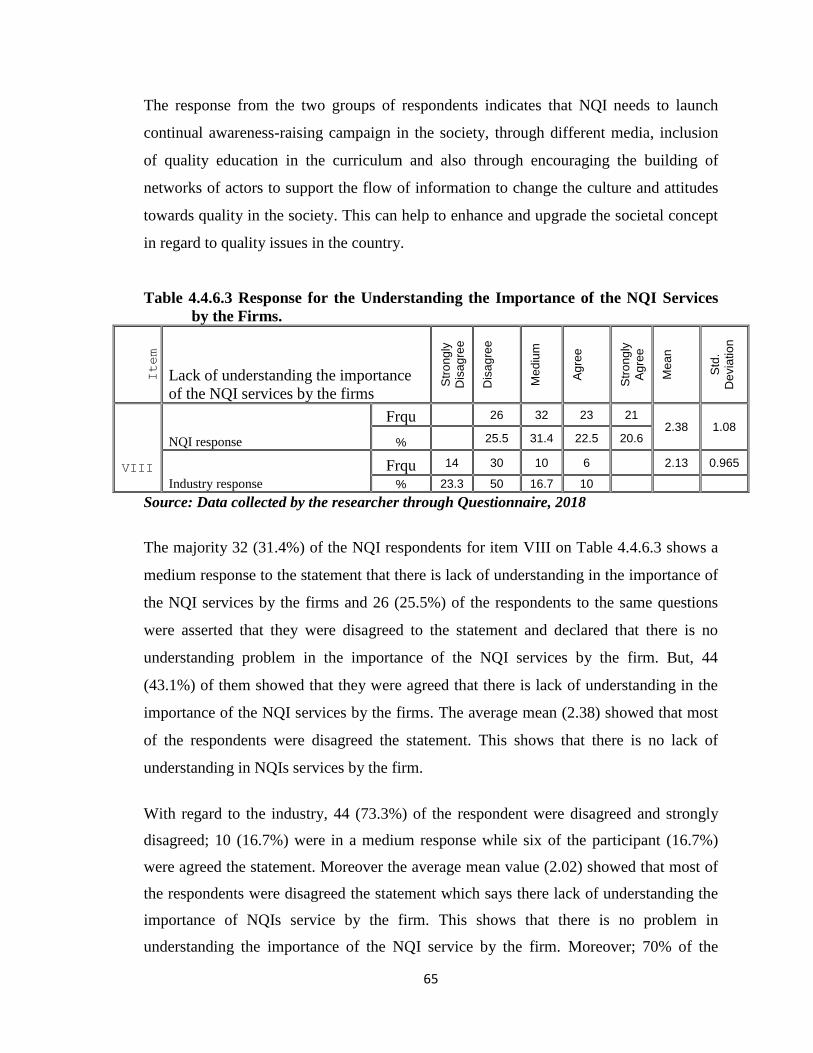
65
The response from the two groups of respondents indicates that NQI needs to launch
continual awareness-raising campaign in the society, through different media, inclusion
of quality education in the curriculum and also through encouraging the building of
networks of actors to support the flow of information to change the culture and attitudes
towards quality in the society. This can help to enhance and upgrade the societal concept
in regard to quality issues in the country.
Table 4.4.6.3 Response for the Understanding the Importance of the NQI Services
by the Firms.
Item
Lack of understanding the importance
of the NQI services by the firms
Str
on
gly
Dis
ag
ree
Dis
ag
ree
Me
diu
m
Ag
ree
Str
on
gly
Ag
ree
Me
an
Std
.
Devia
tio
n
VIII
NQI response
Frqu
26 32 23 21 2.38 1.08
% 25.5 31.4 22.5 20.6
Industry response
Frqu 14 30 10 6
2.13 0.965
% 23.3 50 16.7 10
Source: Data collected by the researcher through Questionnaire, 2018
The majority 32 (31.4%) of the NQI respondents for item VIII on Table 4.4.6.3 shows a
medium response to the statement that there is lack of understanding in the importance of
the NQI services by the firms and 26 (25.5%) of the respondents to the same questions
were asserted that they were disagreed to the statement and declared that there is no
understanding problem in the importance of the NQI services by the firm. But, 44
(43.1%) of them showed that they were agreed that there is lack of understanding in the
importance of the NQI services by the firms. The average mean (2.38) showed that most
of the respondents were disagreed the statement. This shows that there is no lack of
understanding in NQIs services by the firm.
With regard to the industry, 44 (73.3%) of the respondent were disagreed and strongly
disagreed; 10 (16.7%) were in a medium response while six of the participant (16.7%)
were agreed the statement. Moreover the average mean value (2.02) showed that most of
the respondents were disagreed the statement which says there lack of understanding the
importance of NQIs service by the firm. This shows that there is no problem in
understanding the importance of the NQI service by the firm. Moreover; 70% of the
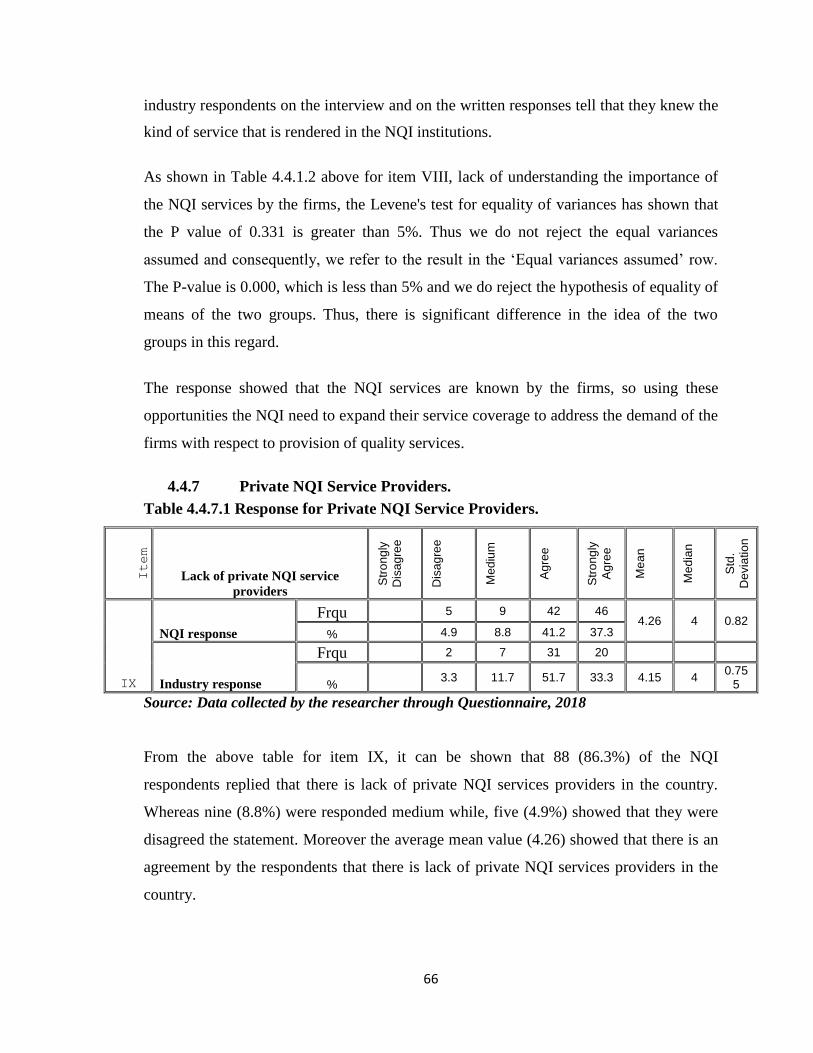
66
industry respondents on the interview and on the written responses tell that they knew the
kind of service that is rendered in the NQI institutions.
As shown in Table 4.4.1.2 above for item VIII, lack of understanding the importance of
the NQI services by the firms, the Levene's test for equality of variances has shown that
the P value of 0.331 is greater than 5%. Thus we do not reject the equal variances
assumed and consequently, we refer to the result in the ‘Equal variances assumed’ row.
The P-value is 0.000, which is less than 5% and we do reject the hypothesis of equality of
means of the two groups. Thus, there is significant difference in the idea of the two
groups in this regard.
The response showed that the NQI services are known by the firms, so using these
opportunities the NQI need to expand their service coverage to address the demand of the
firms with respect to provision of quality services.
4.4.7 Private NQI Service Providers.
Table 4.4.7.1 Response for Private NQI Service Providers.
Item
Lack of private NQI service
providers
Str
on
gly
Dis
ag
ree
Dis
ag
ree
Me
diu
m
Ag
ree
Str
on
gly
Ag
ree
Me
an
Me
dia
n
Std
.
Devia
tio
n
IX
NQI response
Frqu 5 9 42 46
4.26 4 0.82 % 4.9 8.8 41.2 37.3
Industry response
Frqu 2 7 31 20
% 3.3 11.7 51.7 33.3 4.15 4
0.755
Source: Data collected by the researcher through Questionnaire, 2018
From the above table for item IX, it can be shown that 88 (86.3%) of the NQI
respondents replied that there is lack of private NQI services providers in the country.
Whereas nine (8.8%) were responded medium while, five (4.9%) showed that they were
disagreed the statement. Moreover the average mean value (4.26) showed that there is an
agreement by the respondents that there is lack of private NQI services providers in the
country.
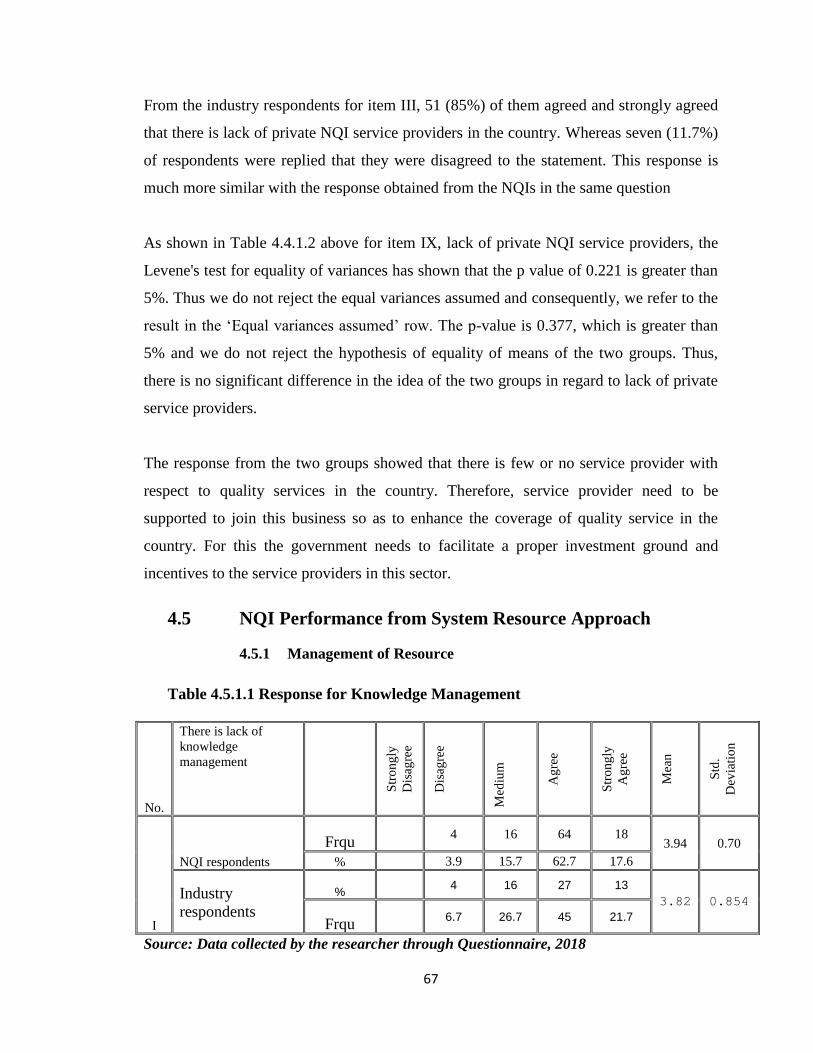
67
From the industry respondents for item III, 51 (85%) of them agreed and strongly agreed
that there is lack of private NQI service providers in the country. Whereas seven (11.7%)
of respondents were replied that they were disagreed to the statement. This response is
much more similar with the response obtained from the NQIs in the same question
As shown in Table 4.4.1.2 above for item IX, lack of private NQI service providers, the
Levene's test for equality of variances has shown that the p value of 0.221 is greater than
5%. Thus we do not reject the equal variances assumed and consequently, we refer to the
result in the ‘Equal variances assumed’ row. The p-value is 0.377, which is greater than
5% and we do not reject the hypothesis of equality of means of the two groups. Thus,
there is no significant difference in the idea of the two groups in regard to lack of private
service providers.
The response from the two groups showed that there is few or no service provider with
respect to quality services in the country. Therefore, service provider need to be
supported to join this business so as to enhance the coverage of quality service in the
country. For this the government needs to facilitate a proper investment ground and
incentives to the service providers in this sector.
4.5 NQI Performance from System Resource Approach
4.5.1 Management of Resource
Table 4.5.1.1 Response for Knowledge Management
No.
There is lack of
knowledge
management
Str
on
gly
Dis
agre
e
Dis
agre
e
Med
ium
Ag
ree
Str
on
gly
Ag
ree
Mea
n
Std
.
Dev
iati
on
I
NQI respondents
Frqu 4 16 64 18
3.94 0.70
%
3.9 15.7 62.7 17.6
Industry
respondents
%
4 16 27 13
3.82 0.854
Frqu 6.7 26.7 45 21.7
Source: Data collected by the researcher through Questionnaire, 2018
68
In response to item I of Table 4.5.1.1, 82 (80.3%) of the NQI respondents agreed and
strongly agreed for the question that there is lack of knowledge management in NQI
institutions; 16 (15.7%) responded that it is in a medium level while four respondents
disagreed the statement. Moreover, the mean value (3.94) also showed that the
respondents were agreed that there is lack of knowledge management in NQI institutions.
The industry respondents 40 (66.7%) were agreed and strongly agreed that there is lack
of knowledge management in NQI institutions; a significant number 16 (26.7%) of the
respondents showed a medium response to this statement. The average mean value (3.82)
of the respondents showed that they were agreed that there is lack of knowledge
management in the NQI institutions.
Majority of the written response showed that NQI's knowledge management is found to
be in its lowest stage. They claimed also that there is no proper mechanism for
knowledge transfer and as a result of this accumulation of knowledge is very poor in the
NQI institutions.
As shown in Table 4.5.1.2 below for item I, lack of knowledge management, the Levene's
test for equality of variances has shown that the p value of 0.008 is smaller than 5%. Thus
we do reject the equal variances assumed and consequently, we refer to the result in the
‘Equal variances not assumed’ row. The p-value is 0.341, which is greater than 5% and
we do not reject the hypothesis of equality of means of the two groups. Thus, there is no
significant difference in the idea of the two groups in regard to lack of private service
providers.
The two categories of response dictate that there is a need to develop a knowledge
management mainstream and incentivize contributions in the sector. This can be achieved
through institution wide activities and a need in an overall cultural shift in attitudes
towards knowledge management and preservation.
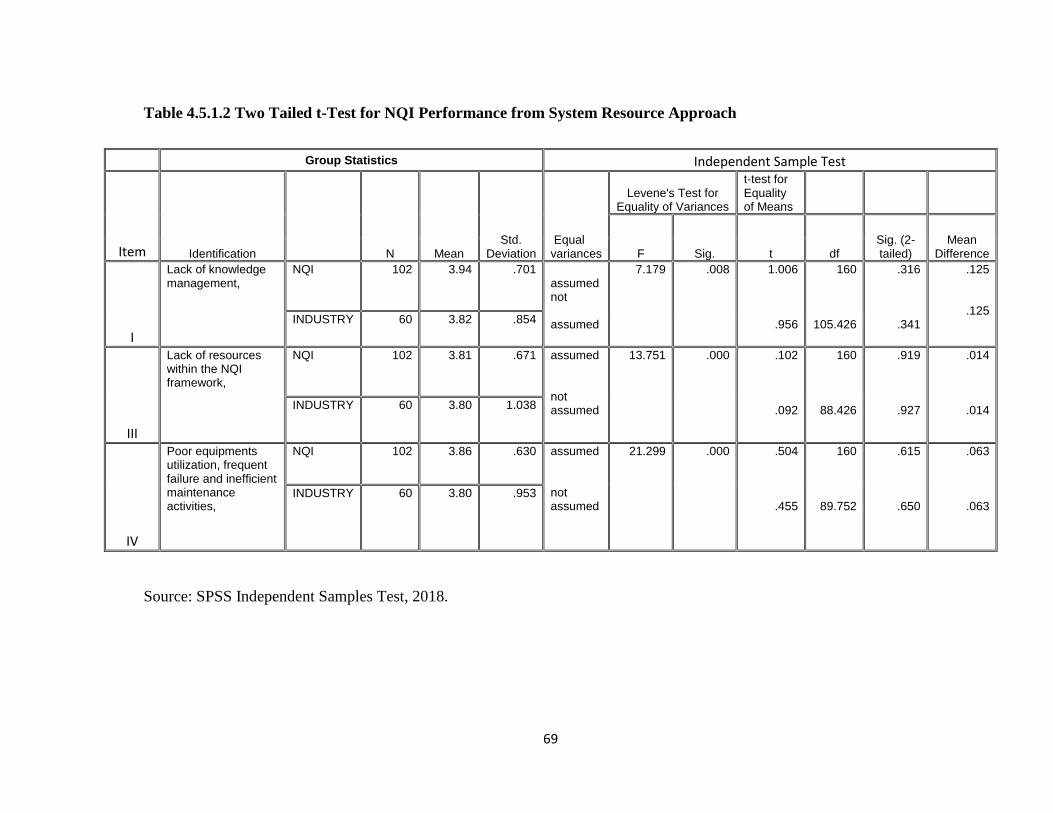
69
Table 4.5.1.2 Two Tailed t-Test for NQI Performance from System Resource Approach
Group Statistics Independent Sample Test
Item Identification N Mean Std.
Deviation Equal variances
Levene's Test for Equality of Variances
t-test for Equality of Means
F Sig. t df Sig. (2-tailed)
Mean Difference
I
Lack of knowledge management,
NQI 102 3.94 .701 assumed not assumed
7.179
.008
1.006
.956
160
105.426
.316
.341
.125
.125 INDUSTRY 60 3.82 .854
III
Lack of resources within the NQI framework,
NQI 102 3.81 .671 assumed not assumed
13.751
.000
.102
.092
160
88.426
.919
.927
.014
.014 INDUSTRY 60 3.80 1.038
IV
Poor equipments utilization, frequent failure and inefficient maintenance activities,
NQI 102 3.86 .630 assumed not assumed
21.299
.000
.504
.455
160
89.752
.615
.650
.063
.063 INDUSTRY 60 3.80 .953
Source: SPSS Independent Samples Test, 2018.
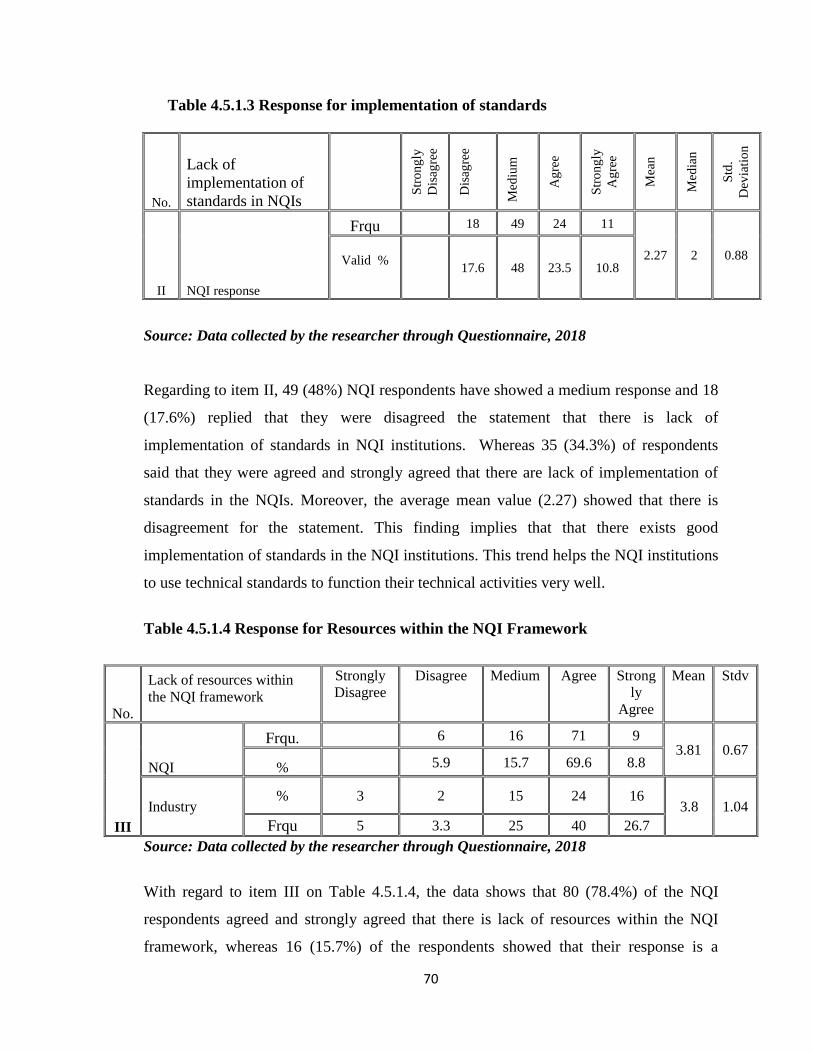
70
Table 4.5.1.3 Response for implementation of standards
No.
Lack of
implementation of
standards in NQIs
Str
on
gly
Dis
agre
e
Dis
agre
e
Med
ium
Ag
ree
Str
on
gly
Ag
ree
Mea
n
Med
ian
Std
.
Dev
iati
on
II NQI response
Frqu 18 49 24 11
2.27 2 0.88
Valid %
17.6 48 23.5 10.8
Source: Data collected by the researcher through Questionnaire, 2018
Regarding to item II, 49 (48%) NQI respondents have showed a medium response and 18
(17.6%) replied that they were disagreed the statement that there is lack of
implementation of standards in NQI institutions. Whereas 35 (34.3%) of respondents
said that they were agreed and strongly agreed that there are lack of implementation of
standards in the NQIs. Moreover, the average mean value (2.27) showed that there is
disagreement for the statement. This finding implies that that there exists good
implementation of standards in the NQI institutions. This trend helps the NQI institutions
to use technical standards to function their technical activities very well.
Table 4.5.1.4 Response for Resources within the NQI Framework
No.
Lack of resources within
the NQI framework
Strongly
Disagree
Disagree Medium Agree Strong
ly
Agree
Mean Stdv
III
NQI
Frqu. 6 16 71 9
3.81 0.67
% 5.9 15.7 69.6 8.8
Industry % 3 2 15 24 16
3.8 1.04
Frqu 5 3.3 25 40 26.7
Source: Data collected by the researcher through Questionnaire, 2018
With regard to item III on Table 4.5.1.4, the data shows that 80 (78.4%) of the NQI
respondents agreed and strongly agreed that there is lack of resources within the NQI
framework, whereas 16 (15.7%) of the respondents showed that their response is a
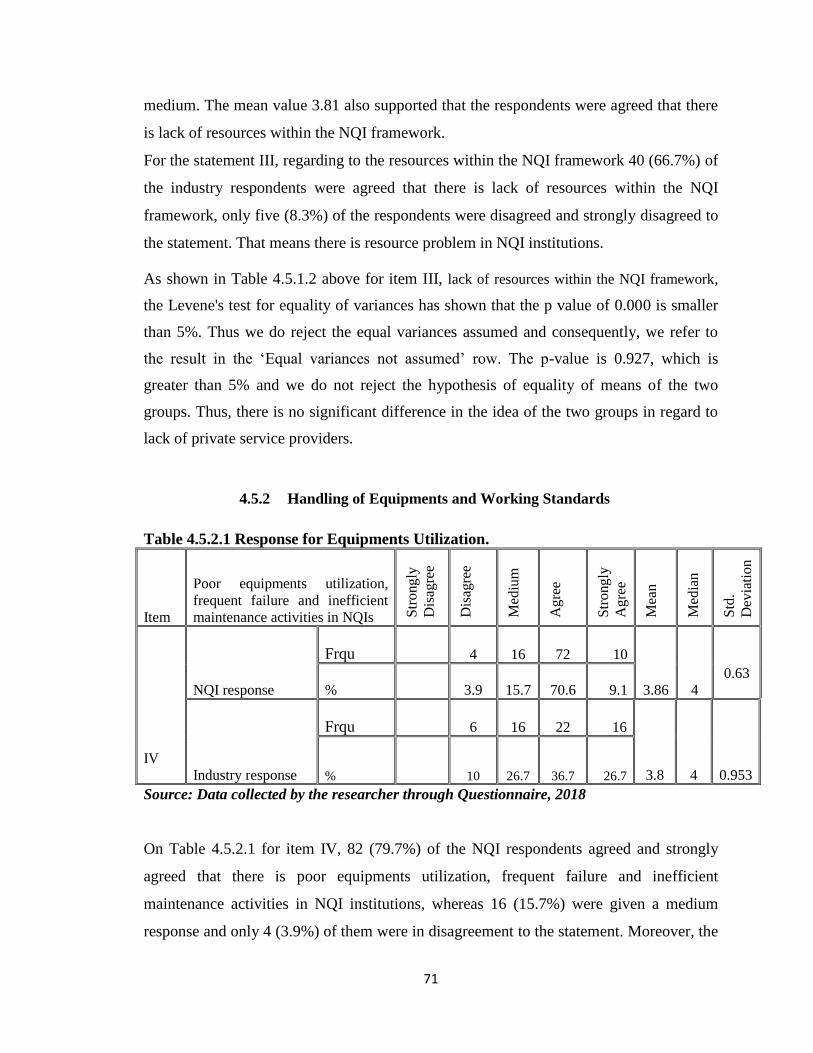
71
medium. The mean value 3.81 also supported that the respondents were agreed that there
is lack of resources within the NQI framework.
For the statement III, regarding to the resources within the NQI framework 40 (66.7%) of
the industry respondents were agreed that there is lack of resources within the NQI
framework, only five (8.3%) of the respondents were disagreed and strongly disagreed to
the statement. That means there is resource problem in NQI institutions.
As shown in Table 4.5.1.2 above for item III, lack of resources within the NQI framework,
the Levene's test for equality of variances has shown that the p value of 0.000 is smaller
than 5%. Thus we do reject the equal variances assumed and consequently, we refer to
the result in the ‘Equal variances not assumed’ row. The p-value is 0.927, which is
greater than 5% and we do not reject the hypothesis of equality of means of the two
groups. Thus, there is no significant difference in the idea of the two groups in regard to
lack of private service providers.
4.5.2 Handling of Equipments and Working Standards
Table 4.5.2.1 Response for Equipments Utilization.
Item
Poor equipments utilization,
frequent failure and inefficient
maintenance activities in NQIs Str
ongly
Dis
agre
e
Dis
agre
e
Med
ium
Agre
e
Str
ongly
Agre
e
Mea
n
Med
ian
Std
.
Dev
iati
on
IV
NQI response
Frqu 4 16 72 10
3.86 4
0.63
% 3.9 15.7 70.6 9.1
Industry response
Frqu 6 16 22 16
3.8 4 0.953
% 10 26.7 36.7 26.7
Source: Data collected by the researcher through Questionnaire, 2018
On Table 4.5.2.1 for item IV, 82 (79.7%) of the NQI respondents agreed and strongly
agreed that there is poor equipments utilization, frequent failure and inefficient
maintenance activities in NQI institutions, whereas 16 (15.7%) were given a medium
response and only 4 (3.9%) of them were in disagreement to the statement. Moreover, the

72
average mean value (3.86) asserted that there is poor equipments utilization, frequent
failure and inefficient maintenance activities in the NQI institutions. This shows that the
NQI institutions are failed to use their equipments properly.
In response to item I, the majority 38 (63.4%) of the industry respondents were agreed
and strongly agreed that there is poor equipments utilization, frequent failure and
inefficient maintenance activities which affects the NQI development; 16 (26.7%) of the
respondents gave a medium response to the statement. Besides, the average mean value
(3.8) asserted that there is poor equipments utilization, frequent failure and inefficient
maintenance activities in the NQI institutions.
As shown in Table 4.5.1.2 above for item IV, poor equipments utilization, frequent
failure and inefficient maintenance activities in NQIs, the Levene's test for equality of
variances has shown that the p value of 0.000 is smaller than 5%. Thus we do reject the
equal variances assumed and consequently, we refer to the result in the ‘Equal variances
not assumed’ row. The p-value is 0.650, which is greater than 5% and we do not reject
the hypothesis of equality of means of the two groups. Thus, there is no significant
difference in the idea of the two groups in regard to lack of private service providers.
The responses from both categories showed that poor equipments utilization, frequent
failure and inefficient maintenance activities are prevalent in the NQI institutions and this
exposes the institutions to a huge scientific equipments loss and an increased
maintenance costs. Therefore NQI needs to upgrade the existing scientific equipment
maintenance services in capacity development both in infrastructure and human capital.
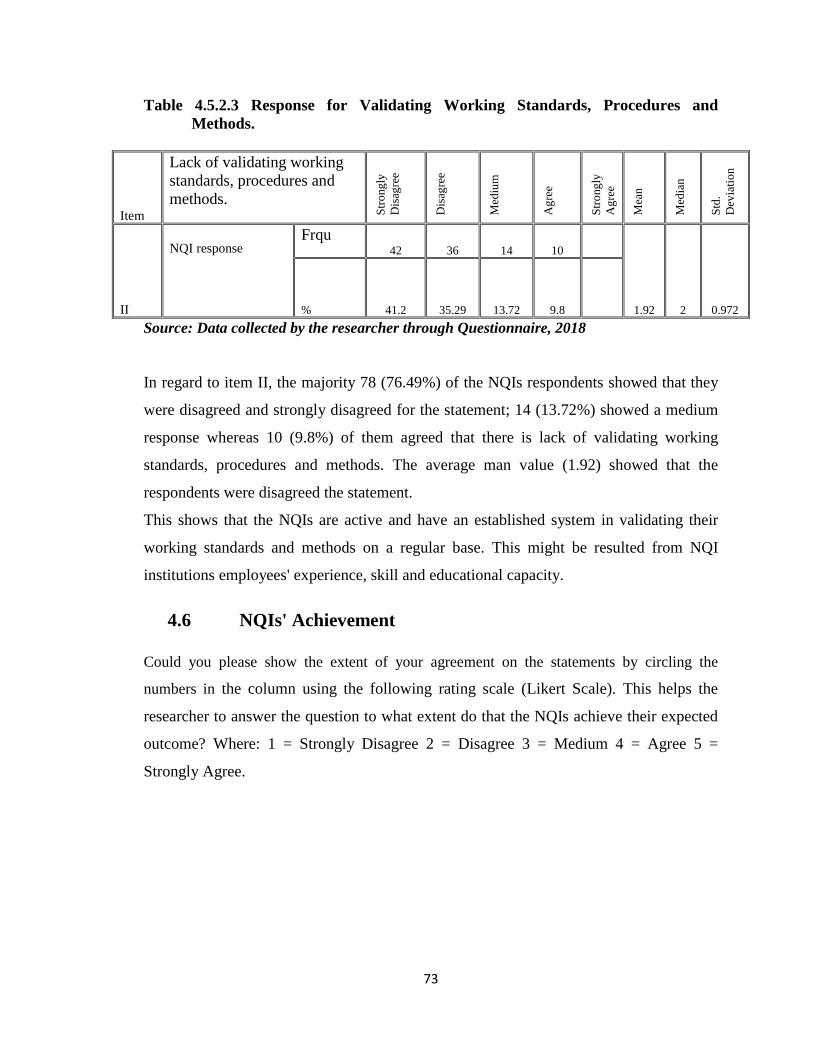
73
Table 4.5.2.3 Response for Validating Working Standards, Procedures and
Methods.
Item
Lack of validating working
standards, procedures and
methods. S
tro
ng
ly
Dis
agre
e
Dis
agre
e
Med
ium
Ag
ree
Str
ong
ly
Ag
ree
Mea
n
Med
ian
Std
.
Dev
iati
on
II
NQI response
Frqu 42 36 14 10
1.92 2 0.972 % 41.2 35.29 13.72 9.8
Source: Data collected by the researcher through Questionnaire, 2018
In regard to item II, the majority 78 (76.49%) of the NQIs respondents showed that they
were disagreed and strongly disagreed for the statement; 14 (13.72%) showed a medium
response whereas 10 (9.8%) of them agreed that there is lack of validating working
standards, procedures and methods. The average man value (1.92) showed that the
respondents were disagreed the statement.
This shows that the NQIs are active and have an established system in validating their
working standards and methods on a regular base. This might be resulted from NQI
institutions employees' experience, skill and educational capacity.
4.6 NQIs' Achievement
Could you please show the extent of your agreement on the statements by circling the
numbers in the column using the following rating scale (Likert Scale). This helps the
researcher to answer the question to what extent do that the NQIs achieve their expected
outcome? Where: 1 = Strongly Disagree 2 = Disagree 3 = Medium 4 = Agree 5 =
Strongly Agree.

74
4.6.1 Product Quality Aspects within a Specific Value Chain is
Strengthened
Table 4.6.1.1 Response Regarding to Product Quality in the Value Chain It
em Product quality aspects within a specific value
chain is strengthened
Str
on
gly
Dis
agre
e
Dis
agre
e
Med
ium
Ag
ree
Str
on
gly
Ag
ree
Mea
n
Std
.
Dev
iati
o
n
I
NQI respondents
Frqu 8 57 11 24 2 2.56 0.991
% 7.8 55.9 10.8 23.5 2
Industry respondents Frqu 16 31 10 3
2.00 0.803 % 26.7 51.6 16.7 5
Source: Data collected by the researcher through Questionnaire, 2018
In regard to the response for item I of TABLE 4.6.1.1, the majority of the NQI
respondents 65 (63.7%) were disagreed and strongly disagreed for the statement that
product quality aspects within a specific value chain is strengthened, whereas 26 (25.5%)
of the respondents were agreed and strongly agreed for the statement. The mean average
value (2.56) shows that product quality aspects within a specific value chain are found to
be below medium level. This shows that the product quality aspects within a specific
value chain are not strengthened according to the NQI respondents.
The industry respondents to the item in the table 4.6.1 showed that 47 (78.3%) of the
respondents were disagree and strongly disagreed; 10 (16.7%) claimed it is a medium,
while 3 (5%) were agreed that for the statement that describe product quality aspects
within a specific value chain is strengthened. The average mean value (2.00) tells that the
product quality aspects within a specific value chain are not strengthened.
As shown in Table 4.6.1.2 below on page 76 for item I, product quality aspects within a
specific value chain is strengthened, the Levene's test for equality of variances has shown
that the p value of 0.000 is smaller than 5%. Thus we do reject the equal variances
assumed and consequently, we refer to the result in the ‘Equal variances not assumed’
row. The p-value is 0.000, which is less than 5% and we do reject the hypothesis of
equality of means of the two groups. Thus, there is significant difference in the idea of
the two groups in this regard.
75
This signifies that both respondents categories have claimed that the product quality
aspect within the specific value chain is not strengthened, which is a good call for notice
to the NQI institutions to participate in the value addition activities to products and
services produced in the country as they pass from one link in the chain to the next until
reaching the final consumer. This is quite helpful to realize competency of products and
services in the globalized market.
Therefore coordination at national as well as global legislative context and socio,
economic and with in political environment is quite needed to strengthens the value chain
by participating in the whole system.

76
Table 4.6.1.2 Two Tailed t- Test for the Analysis of NQIs' Achievement
Item
Group Statistics
Independent Sample Test
Equal variances
Levene's Test for Equality of Variances t-test for Equality of Means
F Sig. t df Sig. (2-tailed)
Mean Difference Identification Group N Mean
Std. Deviation
I
Product quality aspects within a specific value chain is strengthened
NQI 102 2.56 .991 assumed not assumed
14.180
.000
3.710
3.917
160
144.410
.000
.000
.559
.559 INDUSTRY 60 2.00 .803
II
Quality institutions are gaining international recognition
NQI 102 3.48 1.208 assumed not assumed
.276
.600
3.319
3.338
160
126.074
.001
.001
.647
.647 INDUSTRY 60 2.83 1.181
III
Number of requests for Quality institutions services is increased
NQI 102 4.49 .558 assumed not assumed
3.633
.058
4.449
4.075
160
93.881
.000
.000
.474
.474 INDUSTRY 60 4.02 .792
Source: SPSS Independent Samples Test, 2018.
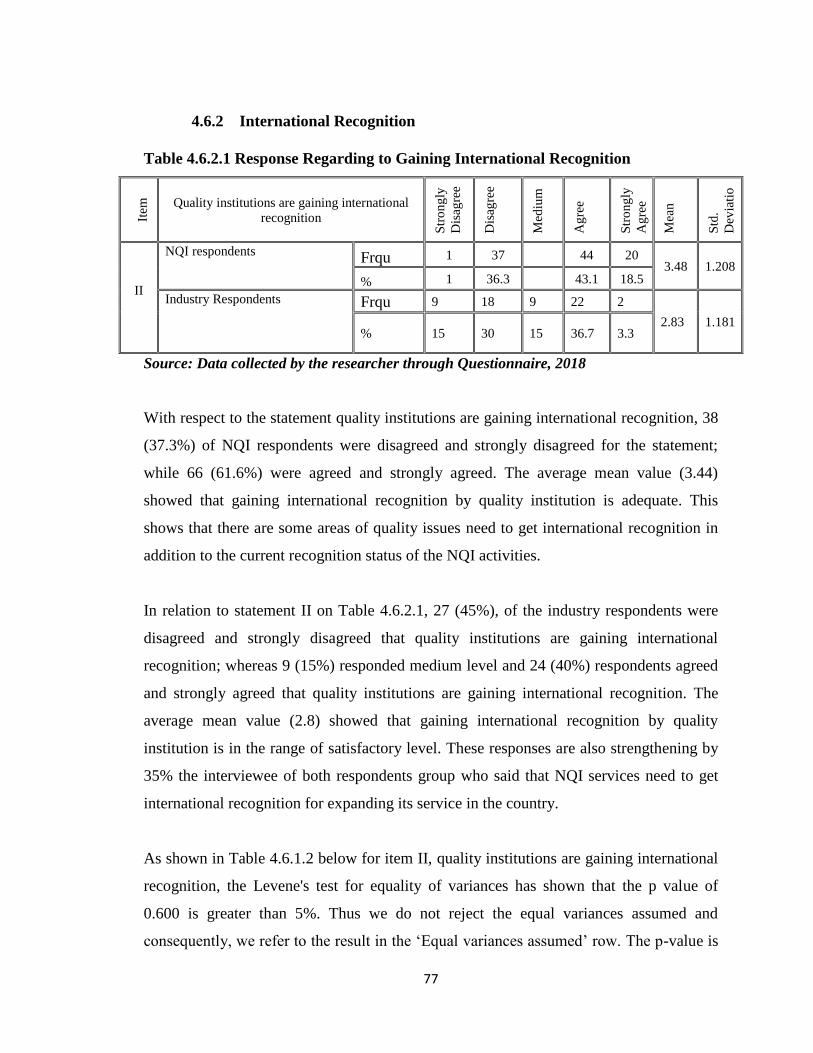
77
4.6.2 International Recognition
Table 4.6.2.1 Response Regarding to Gaining International Recognition It
em
Quality institutions are gaining international
recognition
Str
on
gly
Dis
agre
e
Dis
agre
e
Med
ium
Ag
ree
Str
on
gly
Ag
ree
Mea
n
Std
.
Dev
iati
o
n
II
NQI respondents
Frqu 1 37
44 20 3.48 1.208
% 1 36.3
43.1 18.5
Industry Respondents
Frqu 9 18 9 22 2
2.83 1.181 % 15 30 15 36.7 3.3
Source: Data collected by the researcher through Questionnaire, 2018
With respect to the statement quality institutions are gaining international recognition, 38
(37.3%) of NQI respondents were disagreed and strongly disagreed for the statement;
while 66 (61.6%) were agreed and strongly agreed. The average mean value (3.44)
showed that gaining international recognition by quality institution is adequate. This
shows that there are some areas of quality issues need to get international recognition in
addition to the current recognition status of the NQI activities.
In relation to statement II on Table 4.6.2.1, 27 (45%), of the industry respondents were
disagreed and strongly disagreed that quality institutions are gaining international
recognition; whereas 9 (15%) responded medium level and 24 (40%) respondents agreed
and strongly agreed that quality institutions are gaining international recognition. The
average mean value (2.8) showed that gaining international recognition by quality
institution is in the range of satisfactory level. These responses are also strengthening by
35% the interviewee of both respondents group who said that NQI services need to get
international recognition for expanding its service in the country.
As shown in Table 4.6.1.2 below for item II, quality institutions are gaining international
recognition, the Levene's test for equality of variances has shown that the p value of
0.600 is greater than 5%. Thus we do not reject the equal variances assumed and
consequently, we refer to the result in the ‘Equal variances assumed’ row. The p-value is
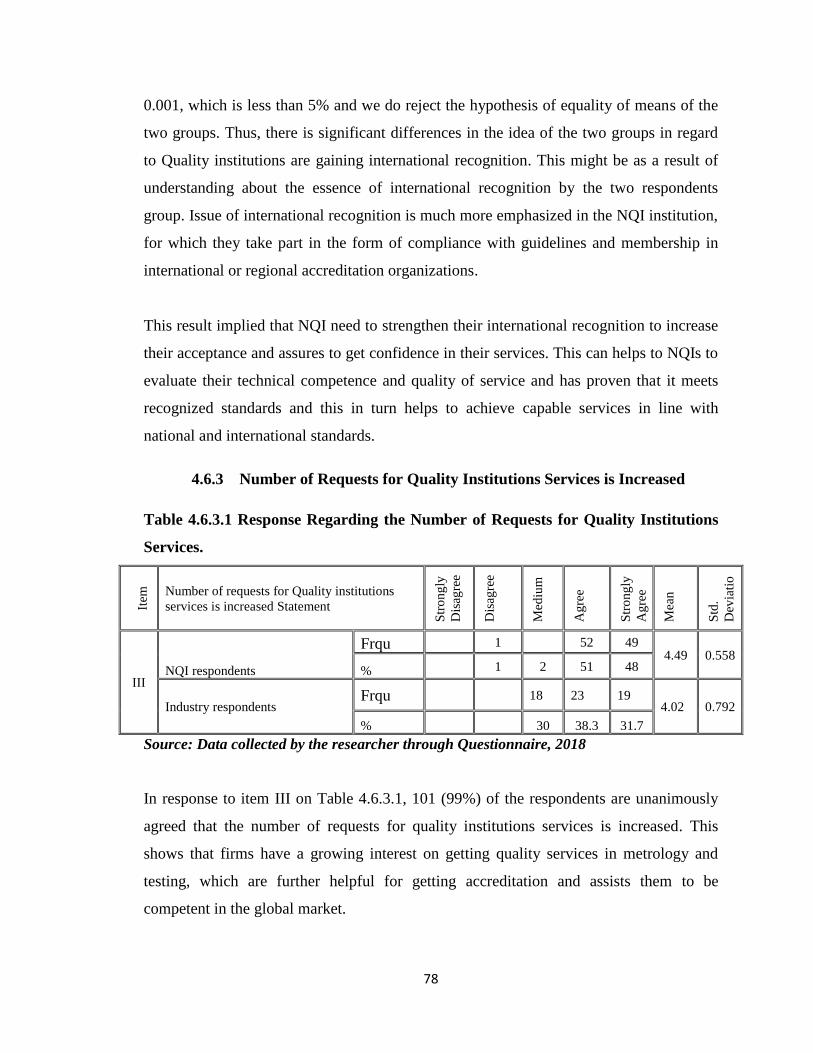
78
0.001, which is less than 5% and we do reject the hypothesis of equality of means of the
two groups. Thus, there is significant differences in the idea of the two groups in regard
to Quality institutions are gaining international recognition. This might be as a result of
understanding about the essence of international recognition by the two respondents
group. Issue of international recognition is much more emphasized in the NQI institution,
for which they take part in the form of compliance with guidelines and membership in
international or regional accreditation organizations.
This result implied that NQI need to strengthen their international recognition to increase
their acceptance and assures to get confidence in their services. This can helps to NQIs to
evaluate their technical competence and quality of service and has proven that it meets
recognized standards and this in turn helps to achieve capable services in line with
national and international standards.
4.6.3 Number of Requests for Quality Institutions Services is Increased
Table 4.6.3.1 Response Regarding the Number of Requests for Quality Institutions
Services.
Item
Number of requests for Quality institutions
services is increased Statement
Str
on
gly
Dis
agre
e
Dis
agre
e
Med
ium
Ag
ree
Str
on
gly
Ag
ree
Mea
n
Std
.
Dev
iati
o
n
III NQI respondents
Frqu 1
52 49
4.49 0.558
% 1 2 51 48
Industry respondents Frqu
18 23 19
4.02 0.792
% 30 38.3 31.7
Source: Data collected by the researcher through Questionnaire, 2018
In response to item III on Table 4.6.3.1, 101 (99%) of the respondents are unanimously
agreed that the number of requests for quality institutions services is increased. This
shows that firms have a growing interest on getting quality services in metrology and
testing, which are further helpful for getting accreditation and assists them to be
competent in the global market.
79
With regard to industry response, 42 (70%) of them agreed and strongly agreed that the
number of requests for quality institutions services is increased. Whereas, nearly one
third of the respondent were rated it is a medium level. The average mean value (4.02)
showed that the number of request is increasing. Moreover; the majority more than two-
third of the interviewee and the written response showed that the number of service
request in metrology and testing is increasing from time to time.
As shown in Table 4.6.1.2 below for item III, number of requests for quality institutions
services is increased Statement, the Levene's test for equality of variances has shown that
the p value of 0.058 is greater than 5%. Thus we do not reject the equal variances
assumed and consequently, we refer to the result in the ‘Equal variances assumed’ row.
The p-value is 0.000, which is less than 5% and we do reject the hypothesis of equality of
means of the two groups. Thus, there is significant difference in the idea of the two
groups in this regard.
From both groups of respondents it is evident that the number of requests for quality
institutions services is increased. This shows that the expansion of the industrial growth
and their demand to quality services in the country is increasing from time to time.
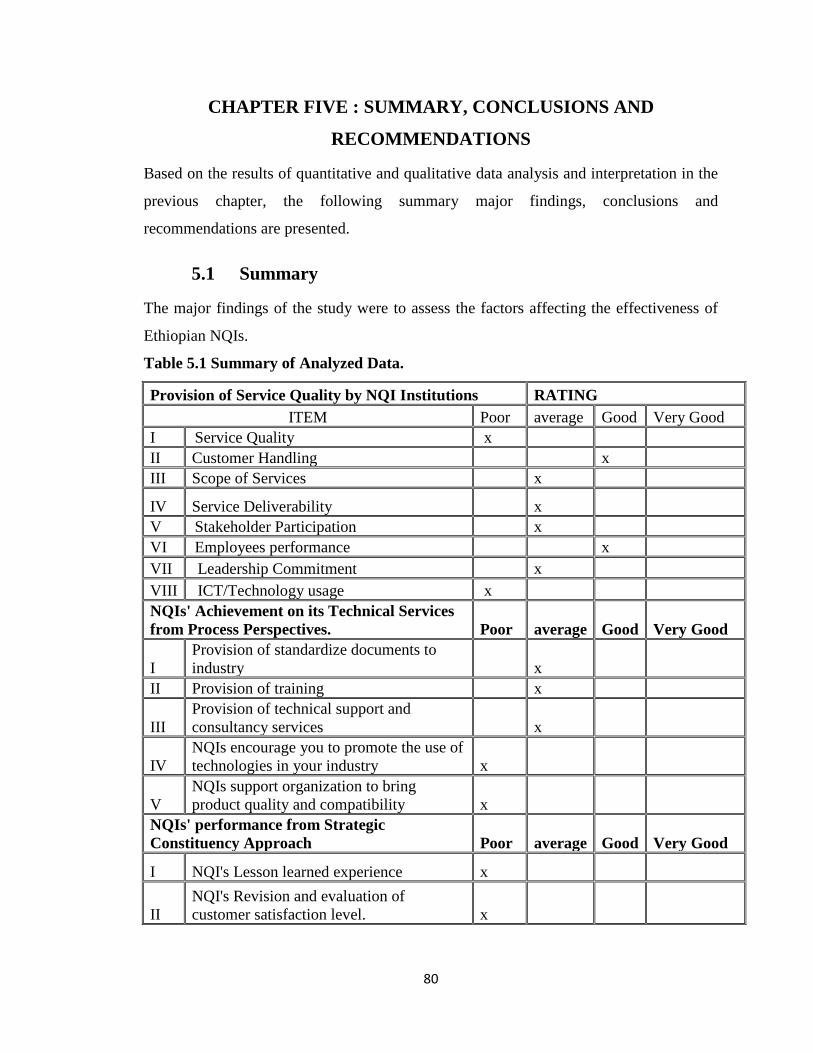
80
CHAPTER FIVE : SUMMARY, CONCLUSIONS AND
RECOMMENDATIONS
Based on the results of quantitative and qualitative data analysis and interpretation in the
previous chapter, the following summary major findings, conclusions and
recommendations are presented.
5.1 Summary
The major findings of the study were to assess the factors affecting the effectiveness of
Ethiopian NQIs.
Table 5.1 Summary of Analyzed Data.
Provision of Service Quality by NQI Institutions RATING
ITEM Poor average Good Very Good
I Service Quality x
II Customer Handling x
III Scope of Services x
IV Service Deliverability x
V Stakeholder Participation x
VI Employees performance x
VII Leadership Commitment x
VIII ICT/Technology usage x
NQIs' Achievement on its Technical Services
from Process Perspectives. Poor average Good Very Good
I
Provision of standardize documents to
industry x
II Provision of training x
III
Provision of technical support and
consultancy services x
IV
NQIs encourage you to promote the use of
technologies in your industry x
V
NQIs support organization to bring
product quality and compatibility x
NQIs' performance from Strategic
Constituency Approach Poor average Good Very Good
I NQI's Lesson learned experience x
II
NQI's Revision and evaluation of
customer satisfaction level. x
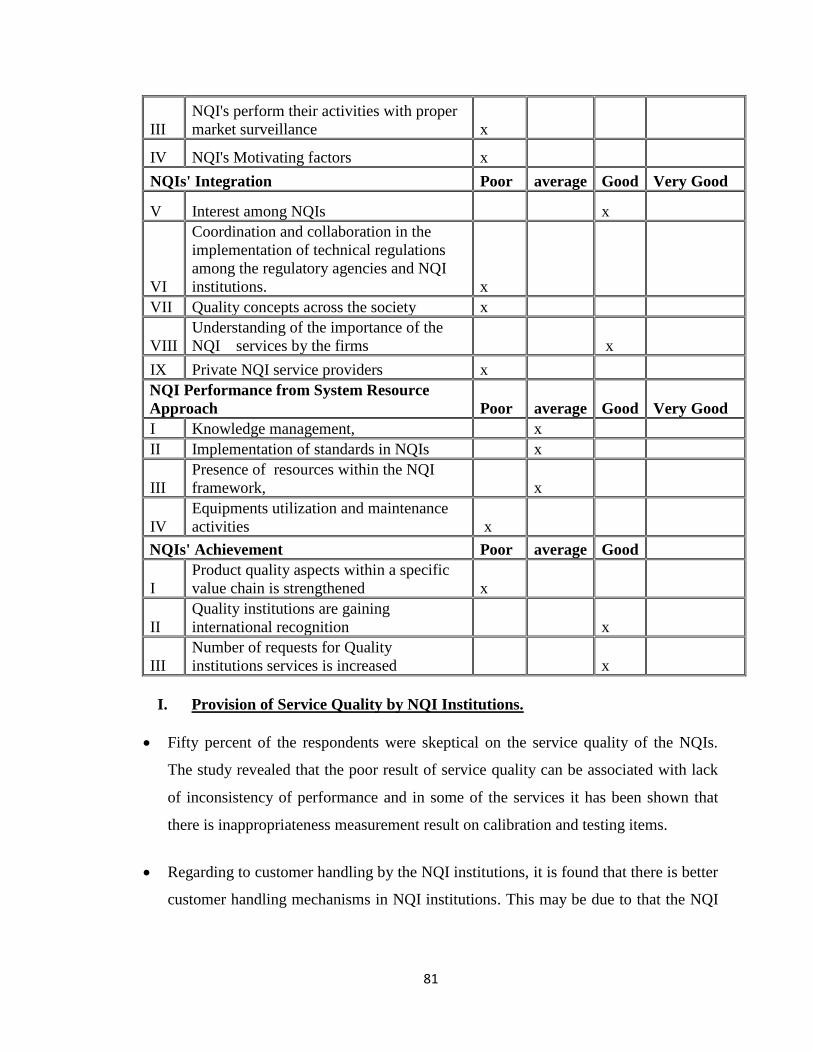
81
III
NQI's perform their activities with proper
market surveillance x
IV NQI's Motivating factors x
NQIs' Integration Poor average Good Very Good
V Interest among NQIs
x
VI
Coordination and collaboration in the
implementation of technical regulations
among the regulatory agencies and NQI
institutions. x
VII Quality concepts across the society x
VIII
Understanding of the importance of the
NQI services by the firms
x
IX Private NQI service providers x
NQI Performance from System Resource
Approach Poor average Good Very Good
I Knowledge management, x
II Implementation of standards in NQIs
x
III
Presence of resources within the NQI
framework, x
IV
Equipments utilization and maintenance
activities x
NQIs' Achievement Poor average Good
I
Product quality aspects within a specific
value chain is strengthened x
II
Quality institutions are gaining
international recognition
x
III
Number of requests for Quality
institutions services is increased x
I. Provision of Service Quality by NQI Institutions.
• Fifty percent of the respondents were skeptical on the service quality of the NQIs.
The study revealed that the poor result of service quality can be associated with lack
of inconsistency of performance and in some of the services it has been shown that
there is inappropriateness measurement result on calibration and testing items.
• Regarding to customer handling by the NQI institutions, it is found that there is better
customer handling mechanisms in NQI institutions. This may be due to that the NQI
82
institutions are able to understand the industrialist thought and they have matured
work force that can respect the value of customer.
• The study revealed that the scope of the service provision of the NQI services were
found on an average level, even if there is still a significant demand from the
respondents for the NMIE and ECAE services.
• Majority of the respondents showed that the service deliverability of the NQI
institutions is found on its average level and have less capability to satisfy the
customer both in timely response and service coverage.
• Most of the respondents from both groups have rated that the technology/ ICT usage
of the NQI institutions are on average. But, from the qualitative response of both
groups it could be able to see that the NQIs did not modernize their technology/ICT
to meet the demand of the current need of the sector and a significant work is
remained by the NQI institutions in promoting the use of technologies in the industry.
II. NQIs' Achievement on its Technical Services from Process Perspectives.
• The result showed that preparation of standardized document by the NQI
institutions it was found on an average level.
• The NQI respondents indicated that provision of training to the end users was at a
good level of achievements, while the industry's demand was satisfactorily
addressed in getting a training of their interest.
• The provision of technical support and consultancy service to the industry is
found unsatisfactory, while among the NQI institutions it was found adequate.
This might be attributed by those departments that render the technical support
lacks understanding about the industry dynamics.
• The study revealed that NQI itself is not capacitated itself with modernizing ICT
technologies for its activities and also nothing is conducted in promoting the use
of technologies in the industry. Majority of the interview respondents with respect
83
to technological support from the NQI assured this kind of support is in a
rudimentary level.
III. NQIs' Performance from Strategic Constituency Approach
• The finding indicates that there is lack of lesson learned experience in the NQI
institutions. Majority of the respondents in the open ended qualitative questions
exhibited that NQI is not a learning institution. In the same development, the NQI
methods of recording complaints are not proper and have not continuity, and it
was found that there is poor revision of customer’s satisfaction level within the
NQI institutions.
• The study revealed that NQI performs their activities without proper market
surveillance. This might show that it is an indication for the limitation in the NQI
scope of services. Response from open ended questionnaire of the study showed
that conducting market inspection is much helpful to understand the real need of
the industry.
• The response from the majority of the respondents showed that there is lack of
motivation factor in the working forces.
IV. NQIs' Integration
• The finding of the study indicates that there is no observable conflict within the NQI
institutions. This might be due to proper implementation of the NQI structure and
have a clear mandate, hierarchy and responsibilities among the NQI institutions.
• It is found that there is a weak coordination and collaboration among the NQI
institutions and the regulatory agencies to implement technical and regulatory issues.
This response is mutually agreed by the two groups of the respondents.
• Result indicates that most of the respondents were agreed that there are poor concepts
about quality among the society. The majority of the written responses from the
industry respondents further supports that they knew most of services rendered in the
NQI institutions.
84
V. NQI Performance from System Resource Approach
• The study showed that there is lack of knowledge management in NQI institutions.
They claimed also that there is no proper mechanism for knowledge transfer and as a
result of this accumulation of knowledge is very poor within the NQI institutions.
And it was shown that both groups of respondents have no idea difference in their
responses.
• The finding showed that there exist good implementation of standards and validating
working standards, procedures and methods in the NQI institutions. Majority of the
interview respondents also acknowledged the implementation of standards in the NQI
institutions help to use technical standards to function their technical activities very
well.
• Both groups of respondents have claimed that the equipments utilization of the NQI
institutions is poor and there is frequent failure and inefficient maintenance activities
for their equipments. The finding shows that NQI did not use their limited equipments
properly.
VI. NQIs' Achievement
• The study shows that product quality aspects within a specific value chain are found
to be below medium level. This shows that the product quality aspects within a
specific value chain are not well strengthened.
• Gaining international recognition by quality institution was found adequate. This
shows that there are some areas of quality issues need to get international recognition
in addition to the current recognition status of the NQI activities.
• The study showed that there is a continual increment in the number of requests for
quality institutions services.
85
5.2 Conclusion
This section provides the conclusion that is inferred from the result of empirical
exploration conducted to know the effectiveness of the NQI institutions. It has high
contributions in improving and understanding the current situation of the National
Quality Infrastructure activities. From the result of the study it can be concluded that:
To enhance the customer handling of the NQI institutions they need to develop a right
skill for managing the customers’ needs. These can be through developing work ethic,
creating good communication, through enhancing customer service strategy and make
ready to adapt the ever changing needs of the customer properly.
The study shows that there exists a limited services within the NQIs, particularly,
calibration and the testing scope of service is narrowed as a result of high expense of
equipments. To increase their service coverage, NQI institutions need to study and
analyze the existing and the future demand of the customer to increase the coverage of
the services in the field of measurement.
NQI's lack qualified human resource on the technical activities, which can associated
with high turnover of employees and unable to keep and transfer knowledge properly. It
has been seen that the NQI leadership commitment was rated as an average level and this
signifies that the NQI have to enhance the leadership commitment though using
communication to excellence and continuous improvement. Moreover; leaders role in
police and strategy development, allocation of appropriate resources, motivation and
recognition of employee's effort need to be strengthened within the NQI frame work.
Majority of respondents were agreed that there are poor quality concepts across the
society. This shows that there is a need of participatory approach and education to
increase understanding of NQI services by the firm and the society at large.
86
The provision of NQIs supports to bring product quality and compatibility need to be
improved in its scope and quality to address the demand both for the NQIs and for the
customer.
The global experience shows that when there is development and growth in an industry,
the demand for the provision of capable NQI services will increase, which in turn attracts
private investments and therefore the government should facilitate and encourage the
private sector to provide the NQI services.
The study showed that knowledge management within the NQI system is not improved
and is a neglected sector. To boost employee productivity and service quality there is a
need to capitalize on intellectual and knowledge management. NQIs should instill
appropriate knowledge management system in their institutions though continuous
training, education, skill development and community participation program.
It can be concluded that lack of harmonization among the NQI institutions decline the
effectiveness of the NQIs. Therefore NQI forum need to be in place and active. Creating
a medium in this regard and encourage to participate the service provider can also help to
engage private sector to provide additional input and feedback on the NQI services and
the challenges to the NQI institutions that hinders its development. A lack of
harmonization within the NQIs system may have a potential to decrease productivity and
create impediment on the NQIs process.
5.3 Recommendation
Based on the research findings, the following possible recommendations are forwarded to
all the concerned bodies.
The NQI needs to enhance the role of services, features and benefits of service provision
and concepts of service quality management in their system to improve the service
quality through a continuous improvement. This can be achieved by enhancing its service
quality through organizing quality circles, who can effectively identify and address
87
problems and able to recommend improvements, all with the goal of promoting quality,
efficiency, and productivity in their service provisions.
NQI institutions need to focus on stakeholder participation, which can be improved by
treating stakeholder as partners and keep track of new stakeholders. Since, calibration,
testing and most of quality related questions are presented on voluntary it is advisable to
create awareness to increase stakeholder participation.
The NIQ need to build institutional capability through support and recommend on
suitable governance, this can be achieved through involving outstanding industrialist at
the strategic management level.
NQI institutions need to establish a training center for assisting an extensive staff training
rather than relying on train the trainer approach only. This will help the NQI to adapt,
maintain and uplift a practical skill level in fields which is subjected to frequent
technological changes. Moreover, collaboration between the international and the
national experts is an effective and sustainable way to achieve know-how transfer.
Institutionalizing training within counterpart institutions might be an effective way to
extend the impact of trainings beyond a limited number of persons and time. It also
alleviates a staff turnover problem. Another good way to ensure sustainability of trainings
is to support and facilitates technological universities in offering specific curricula for
quality specialists in the fields of measurements, testing, and standard setting.
Coordination among the NQIs can be improved by optimizing product/ service process,
creating collaborative supporting process and perform a process planning and control
throughout their operation at all levels of the institutions. To have a coordinated effort
NQI should initiate an efficient integration of a process that creates responsibility within
its system. To implement sustainable coordination system, NQIs need to avoid
duplication of works and strictness in their system. If NQIs does not extend support to
coordinated efforts, innovation and progress can become inactive within the system.
88
Moreover, this coordination should be also need to be extended to potential stakeholders
who can contribute to the achievements of the NQIs.
An integrative and participatory approach need to be formulated by the NQI institutions
to continually satisfy the customer need. Furthermore; the NQIs need to device to create
adaptability according to the customer needs and economic development of the country.
This can be improved by treating stakeholder as partners and keep track of new
stakeholders.
Participation in international organization, particularly to meet the standard required by
the market and it is clearly fundamental for the conformity aspects. Therefore, NQI
institutions need to collaborate with financial institutions and industry groups to scale up
and expand the investment in standards adoption. This will assist in value addition to
products and increases their marketability.
International recognition in the field of laboratory and inspection to get accreditation
through ILAC and recognition in the fields of management systems, products, services
and personnel assessment through IAF is needed to be sought by the NQI institutions. For
increasing acceptance of conformity assessment service in the export market obtaining an
international recognition is significantly needed to the NQIs. In this regard, the Ethiopian
standard agency should actively participate and contributed in international and regional
technical committees relevant to the country.
NQIs need to implement a customer feedback system and continually monitor and
update, this helps to capitalize on previously unrealized opportunities. The NQIs should
work to promote the employee satisfaction and to increase workers commitment level
through the provision of a positive working environment and implementing system of
reward and recognition. Moreover, the NQI need to work on developing the skills and
knowledge of their workforce and conduct a continuous evaluation and measure of job
satisfaction.
89
Adequate budge allotment and provision of equipments is one of a core elements for the
NQI institutions. NQI needs to upgrade the capabilities in maintaining the modern
technical equipments through regular maintenance and need to get a timely dependable
repair services. For doing so, the NQI needs to upgrade the existing scientific equipments
maintenances center found in the NMIE.
NQIs need to design market surveillance techniques to address their activities to ensure
that products on the market are in conformity with the applicable law. This helps to
promote confidence from consumers buying products. It also, helps producers which
comply to stay in business and not lose market share as a result of poor competition.
Moreover, understanding industries’ demands is critical to create demand driven NQI
institutions for sustainable services provision.
To promote the service providers in calibration and testing service provision and to make
the industry an attractive and competitive end, MoST has to offer various
incentives/benefits package such as provision of plot of land from lease free, tax fee
import for their equipment and financial support and incentive are among others to be
recommended in this research work. Assisting the service providers in this area will have
an impact on increasing number of jobs, facilitating an increased private sector
competitiveness and assist for improvement of business climate/private sector
development in the field of quality.
The NQIs should strengthen its strategic direction to undertake quality problems in the
country and to demonstrate its effective implementation of systems to ensure
competitiveness in the country's product and need to play a very important role in trade
facilitations. This will help to reduce boarder rejection and can be achieved an increased
trade flows due to the synchronization of national legal and regulatory framework with
international standards.
NQI institution should create a favorable environment in creating good transfer of
knowledge and best practice of quality infrastructure system through devising different
training scheme both in the country and outside.
90
NQI institutions need to understand that the ongoing changes in how quality institution
systems work internationally require a constant upgrading of professional knowledge. In
this regard good practice is to conduct and participate in a regular international
conference to exchange best practices among experts in the field of quality infrastructure
development is desirable.
Implications of the study for future research work.
i) Since understanding the impact created by NQI institution on productivity and
quality in the country is not the focus of the study, it is advisable to conduct further study
which NQI services can have a significant impact on product and process quality in the
manufacturing industries.
ii) The response between the two groups of respondents, i.e. the NQI and the industry on
issues like provision of standardize documents, training, technical support and
consultancy services and others described in the study have showed a significant
difference in their idea of response. The root cause for this inconsistency of response is
not covered by this research and the researcher recommends a further study why this
disparity is happening.
iii) This research focused on the response of four industries as a service user of the NQI
institutions. Had it include more than this, the response coverage would have a possibility
to be extraordinary. Therefore, the researcher recommend further study that encompass
and covered a number of institutions that get services from the NQIs. This helps to have a
wide coverage of responses and a multitude spectrum of idea on the factors that can have
effects on the NQI effectiveness.
iv) The researcher recommends the same research can be addressed in different context,
this can be; to what extent that NQI institutions are effective in supporting the
agricultural development lead industrialization policy of the Federal Democratic
Republic of Ethiopia?

91
REFERENCE
Achieving Organizational Effectiveness Through Employee Engagement: A Role of
Leadership Style in Workplace, 2017. International Journal of Engineering
and Information Systems (IJEAIS) ISSN: 2000-000X Vol. 1 Issue 9.
Ajila, S. (2006), ‘The Impact of Firm Size on Knowledge Reuse and Exploration during
Software Product Development: an Empirical Study,’ Information Reuse and
Integration, 2006 IEEE International Conference, September 16-18, pp. 160-165.
Balduck, A. L., & Buelens, M. (2008). A two-level competing values approach to
measure nonprofit organizational effectiveness. Working Papers of Faculty
of Economics and Business Administration, Ghent University, Belgium.
Baker, C.M., Reising, D.L., Johnson, D.R., Stewart, R.L., & Day Baker, S. (1997),
Organizational Effectiveness: Toward an Integrated Model for Schools of
Nursing, Journal of Professional Nursing, 13 (4), 246–255.
Baker, K., & Branch, K. M. (2002). Concepts underlying organizational effectiveness:
Trends in the organization and management science literature. Management
Benchmark Study. USA: Office of Planning & Analysis, Department of Energy
Battaglia, M. P. (2008). Non Probability Sampling. Encyclopedia of Survey Research
Methods. 2008. SAGE Publications, 1-4.
Bryman, A., Bell, E. (2007), Business and Research Methods. Oxford University Press.
Buchanan D, FitzederLD l, Ketley D, Gollop R, Jones JL, Saint Lamont S, Neath A,
Whitby E.NO Going bACK: a review of the literature on sustaining
organizational change. International Journal of Management Review. Vol 7,
Issue 3, pp1 89-205. 2005.
Cameron, K. (1978). Measuring organizational effectiveness in institutions of higher
education.bAdministrative Science Quarterly, 23, 604-632.
http://dx.doi.org/10.2307/2392582
Cooper, D., & Schindler, P. (2008). Business research methods (10th ed.). New York,
McGraw-Hill/Irwin
Cresswell, J. W., & Plano Clark, V. L. (2011). Designing and Conducting mixed method
research (2nd ed.). Thousand Oaks, CA: Sage.
DeVellis, R. F. (2003). Scale development: Theory and applications (2nd Edition).
Thousand Oaks, CA: Sage Publications, Inc.
92
Drew, C.J. (1980) Introduction to Designing and Conducting Research, 2nd edn.
Missouri, CB: Mosby Company.
Federman, M. (2006). Essay: Towards an effective theory of organizational effectiveness.
[Online]Available:http://whatisthemessage.blogspot.com/2006_03_01_archive.ht
ml
Israel, Glen D. (1992) Determining Sample Size, Agricultural Education and
Communication Department, University of Florida, IFAS Extension,
PEOD6 (Reviewed 2013)
Kothari, C.R. (1985) Research Methodology, Methods and Techniques. Wiley Eastern
Limited, New Delhi.
Kushner, R., & Poole, P. (1996). Exploring structure-effectiveness relationships in
nonprofit arts organizations. Nonprofit Management & Leadership, 7,119-136.
Litwin, M. S. (2003). How to assess and interpret survey psychometrics, 2nd edition.
Thousand Oaks, CA: Sage Publications, Inc
Martin Kellermann and Daniel Paul Keller(2015). Leveraging the Impact of Business
Environment Reform: The Contribution of Quality Infrastructure Lessons from
Practice. Donor Committee for Enterprise Development.
McCann, J. (2004). Organizational effectiveness: Changing concepts for changing
environments. Human Resource Planning, 27(1). Mullins, L. J. (2008). Essentials
of organizational behavior: Pearson Education.
McMillan, J. H. & Schumacher, S. (2001). Research in education: A conceptual
introduction. New York: Longman
Overview of the ISO system, 2005-07-04, International Organization for Standardization,
www.iso.org
Pallant, J. (2007): SPSS Survival Manual: A Step by Step Guide to Data Analysis Using
SPSS for Windows (Version 15), 3rd Edition. Milton Keynes, UK: Open
University Press.
Parhizgari, A. M. & Gilbert, G. R. (2004). Measures of Organizational Effectiveness:
Private And Public Sector Performance. Omega, The International Journal of
Management Science.
Paul F. Tremblay (1998): Development and Construct Validity of the Academic
Motivation Inventory: Faculty of Graduate Studies the University of Western
Ontario London, Ontario
93
Robbins, S. P. (2003). Essentials of organizational behavior: Prentice Hall.
Sanetra, Clemens, (2004): Study on Metrology, Standards, Testing and Quality
Assurance (MSTQ) in Thailand.
Sanetra, C.; Marbán R.M. (2007): The answer to the global quality challenge: A National
Quality Infrastructure. Braunschweig: Physikalisch-Technische Bundesanstalt
Saunders MNK, Lewis P, Thornhill A. (2004) Research Methods for Business Students
(1st Indian Reprint). Delhi : Pearson Education
Schermerhorn, J. R., Hunt, J. G., Osborn, R. N., & Osborn, R. (2004). Core concepts of
organizational behavior: John Wiley & Sons Inc.
Stoldt, M. (2011): Sharing Expertise for Quality: PTB’s Technical Cooperation in Asia.
Braunschweig: Physikalisch-Technische Bundesanstalt
Tavakol, M., & Dennick, R. (2011). Making Sense of Cronbach’s Alpha. International
journal of Medical Education, 2, 53-55.
The Ethiopian-Conformity Assessment Enterprise Establishment Council of Ministers
Regulation No. 196/2010
The Ethiopian Standards Agency Establishment Council of Ministers Regulation
193/2010.
The Ethiopian National Accreditation office re-establishment Council of Ministers
Regulation 279/2012.
The National Metrology Institute Establishment Council of Ministers Regulation
194/2010
World Bank. 2007. Quality Systems and Standards for a Competitive Edge. World Bank,
Washington, DC

94
ANNEX
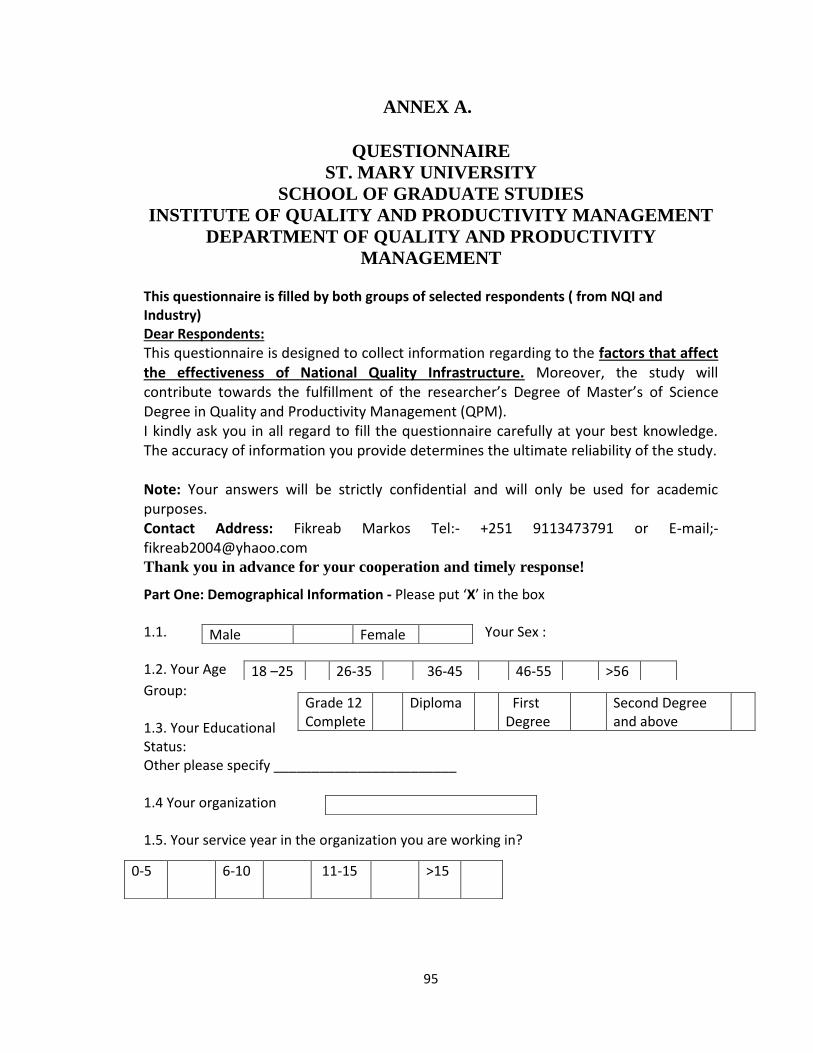
95
ANNEX A.
QUESTIONNAIRE
ST. MARY UNIVERSITY
SCHOOL OF GRADUATE STUDIES
INSTITUTE OF QUALITY AND PRODUCTIVITY MANAGEMENT
DEPARTMENT OF QUALITY AND PRODUCTIVITY
MANAGEMENT This questionnaire is filled by both groups of selected respondents ( from NQI and Industry) Dear Respondents:
This questionnaire is designed to collect information regarding to the factors that affect the effectiveness of National Quality Infrastructure. Moreover, the study will contribute towards the fulfillment of the researcher’s Degree of Master’s of Science Degree in Quality and Productivity Management (QPM). I kindly ask you in all regard to fill the questionnaire carefully at your best knowledge. The accuracy of information you provide determines the ultimate reliability of the study. Note: Your answers will be strictly confidential and will only be used for academic purposes. Contact Address: Fikreab Markos Tel:- +251 9113473791 or E-mail;- [email protected] Thank you in advance for your cooperation and timely response!
Part One: Demographical Information - Please put ‘X’ in the box 1.1. Your Sex : 1.2. Your Age
Group: 1.3. Your Educational Status: Other please specify ________________________ 1.4 Your organization 1.5. Your service year in the organization you are working in?
Male Female
18 –25 26-35 36-45 46-55 >56
Grade 12 Complete
Diploma First Degree
Second Degree and above
0-5 6-10 11-15 >15

96
Part Two:
The following questions are helpful to the researcher to know the current performance of NQIs institutions with
respect to the given statement. Industry respondents are expected to fill all questions of this part, whereas the NQI
respondents are expected to fill only their respective organization.
Can you please show your agreement on the statements by circling the numbers in the column using the following rating scale
(Likert Scale). Where: 1 = Very Poor 2 = Poor 3 = Average 4 = Good 5 = Very Good
Part Three: Answering these questions helps to understand the services extent provided by the NQI institutions. Both
NQI and industry respondents are expected to fill all the questions of this part
Can you please indicate your answer by Circling the numbers in the column using the following rating scale (Likert Scale). Where: 1 = Very Poor 2 = Poor 3 = Average 4 = Good 5 = Very Good
Item. Statement Rating
I Provision of standardize documents to your industry 1 2 3 4 5
II Provision of training of your interest 1 2 3 4 5
III Provision of technical support and consultancy services 1 2 3 4 5
IV They encourage you to promote the use of technologies in your industry 1 2 3 4 5
V NQIs support your organization to bring Product quality and compatibility 1 2 3 4 5
No Statement National Metrology Institute
of Ethiopia
Ethiopian Standard Agency Ethiopian Accreditation
Office
Ethiopian Conformity
Assessment Enterprises
1 Service Quality 1 2 3 4 5 1 2 3 4 5 1 2 3 4 5 1 2 3 4 5
2 Customer Handling 1 2 3 4 5 1 2 3 4 5 1 2 3 4 5 1 2 3 4 5
3 Scope of Services 1 2 3 4 5 1 2 3 4 5 1 2 3 4 5 1 2 3 4 5
4 Service Deliverability 1 2 3 4 5 1 2 3 4 5 1 2 3 4 5 1 2 3 4 5
5 Stakeholder Participation 1 2 3 4 5 1 2 3 4 5 1 2 3 4 5 1 2 3 4 5
6 Employees performance 1 2 3 4 5 1 2 3 4 5 1 2 3 4 5 1 2 3 4 5
7 Leadership Commitment 1 2 3 4 5 1 2 3 4 5 1 2 3 4 5 1 2 3 4 5
8 Technology/ICT usage 1 2 3 4 5 1 2 3 4 5 1 2 3 4 5 1 2 3 4 5
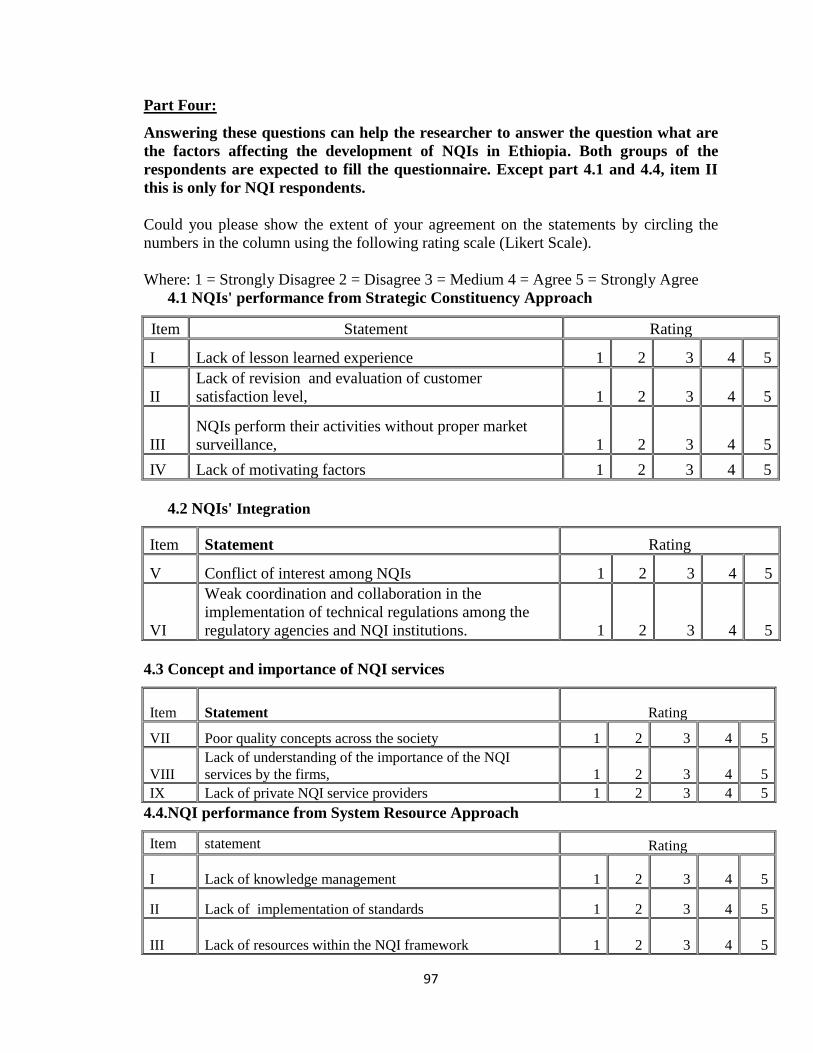
97
Part Four:
Answering these questions can help the researcher to answer the question what are
the factors affecting the development of NQIs in Ethiopia. Both groups of the
respondents are expected to fill the questionnaire. Except part 4.1 and 4.4, item II
this is only for NQI respondents.
Could you please show the extent of your agreement on the statements by circling the
numbers in the column using the following rating scale (Likert Scale).
Where: 1 = Strongly Disagree 2 = Disagree 3 = Medium 4 = Agree 5 = Strongly Agree
4.1 NQIs' performance from Strategic Constituency Approach
Item Statement Rating
I Lack of lesson learned experience 1 2 3 4 5
II
Lack of revision and evaluation of customer
satisfaction level, 1 2 3 4 5
III
NQIs perform their activities without proper market
surveillance, 1 2 3 4 5
IV Lack of motivating factors 1 2 3 4 5
4.2 NQIs' Integration
Item Statement Rating
V Conflict of interest among NQIs 1 2 3 4 5
VI
Weak coordination and collaboration in the
implementation of technical regulations among the
regulatory agencies and NQI institutions. 1 2 3 4 5
4.3 Concept and importance of NQI services
Item Statement Rating
VII Poor quality concepts across the society 1 2 3 4 5
VIII
Lack of understanding of the importance of the NQI
services by the firms, 1 2 3 4 5
IX Lack of private NQI service providers 1 2 3 4 5
4.4.NQI performance from System Resource Approach
Item statement Rating
I Lack of knowledge management 1 2 3 4 5
II Lack of implementation of standards 1 2 3 4 5
III Lack of resources within the NQI framework 1 2 3 4 5
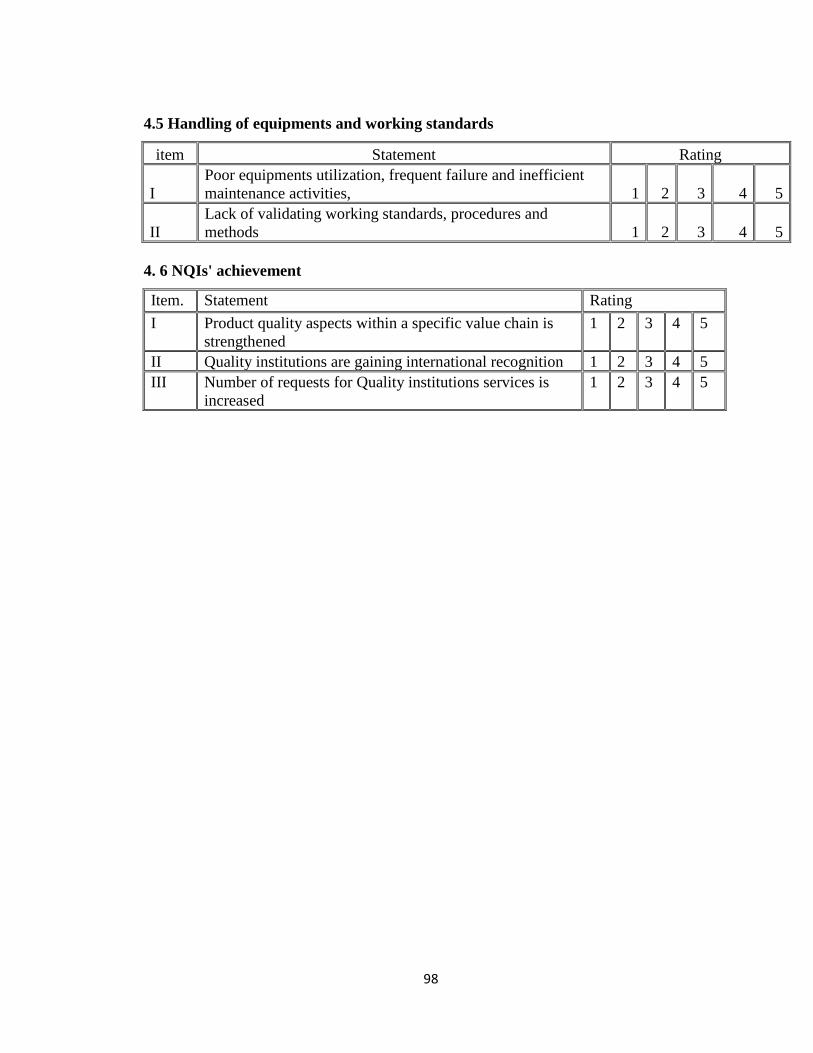
98
4.5 Handling of equipments and working standards
item Statement Rating
I
Poor equipments utilization, frequent failure and inefficient
maintenance activities, 1 2 3 4 5
II
Lack of validating working standards, procedures and
methods 1 2 3 4 5
4. 6 NQIs' achievement
Item. Statement Rating
I Product quality aspects within a specific value chain is
strengthened
1 2 3 4 5
II Quality institutions are gaining international recognition 1 2 3 4 5
III Number of requests for Quality institutions services is
increased
1 2 3 4 5
99
ANNEX B.
INTERVIEW QUESTIONS.
This interview question is filled by senior experts and management group of both
the respondents from NQI and industry. The answer from the question helps the
researcher to understand the overall performance of the NQI institutions, which is
the basic question of this study.
1) What are the strength and challenge of the NQIs in your view?
----------------------------------------------------------------------------------------------------------------
----------------------------------------------------------------------------------------------------------------
2) Which service of the NQI needs to be improved to address need of the industry?
---------------------------------------------------------------------------------------------------------------
-------------------------------------------------------------------------------------------------------------
3) What is the stand of the NQI in encouraging technology usage?
----------------------------------------------------------------------------------------------------------------
----------------------------------------------------------------------------------------------------------------
4) What needs that NQI needs to consider for improving its service? ----------------------------
--------------------------------------------------------------------------------
5) What are the weakness of NQIs
----------------------------------------------------------------------------------------------------------------
----------------------------------------------------------------------------------------------------------------
----------
Thank you for giving your precious time!
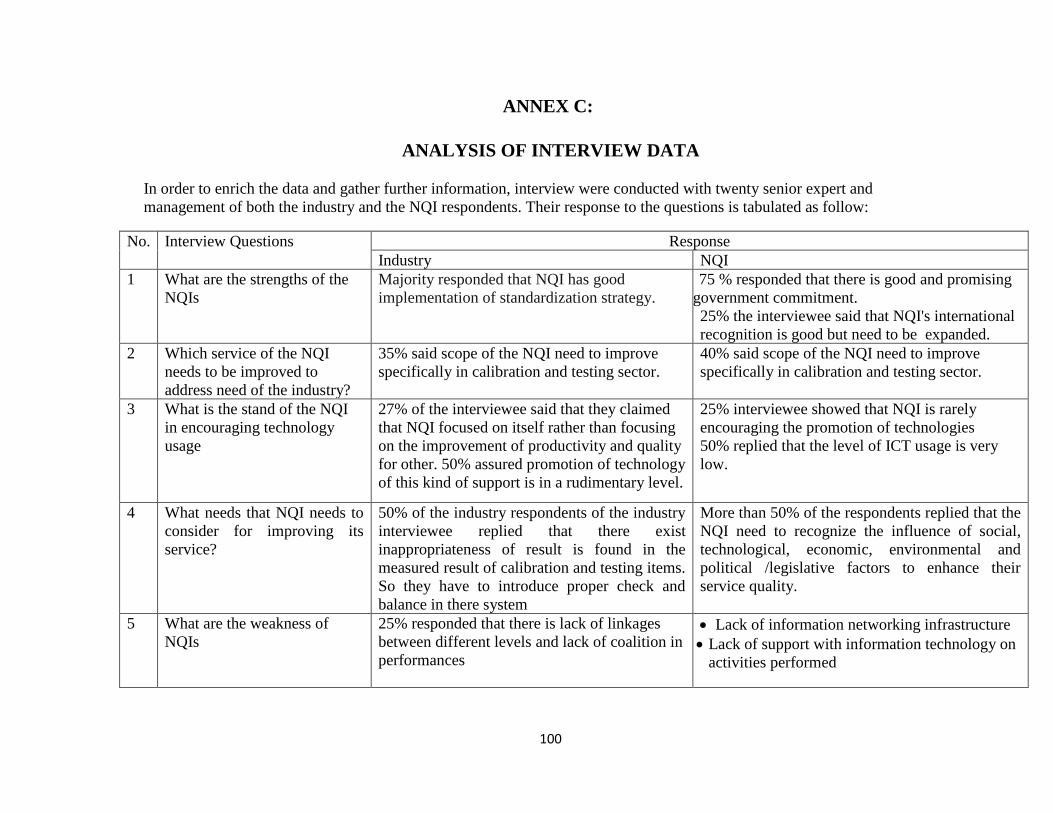
100
ANNEX C:
ANALYSIS OF INTERVIEW DATA
In order to enrich the data and gather further information, interview were conducted with twenty senior expert and
management of both the industry and the NQI respondents. Their response to the questions is tabulated as follow:
No. Interview Questions Response
Industry NQI
1 What are the strengths of the
NQIs
Majority responded that NQI has good
implementation of standardization strategy.
75 % responded that there is good and promising
government commitment.
25% the interviewee said that NQI's international
recognition is good but need to be expanded.
2 Which service of the NQI
needs to be improved to
address need of the industry?
35% said scope of the NQI need to improve
specifically in calibration and testing sector.
40% said scope of the NQI need to improve
specifically in calibration and testing sector.
3 What is the stand of the NQI
in encouraging technology
usage
27% of the interviewee said that they claimed
that NQI focused on itself rather than focusing
on the improvement of productivity and quality
for other. 50% assured promotion of technology
of this kind of support is in a rudimentary level.
25% interviewee showed that NQI is rarely
encouraging the promotion of technologies
50% replied that the level of ICT usage is very
low.
4 What needs that NQI needs to
consider for improving its
service?
50% of the industry respondents of the industry
interviewee replied that there exist
inappropriateness of result is found in the
measured result of calibration and testing items.
So they have to introduce proper check and
balance in there system
More than 50% of the respondents replied that the
NQI need to recognize the influence of social,
technological, economic, environmental and
political /legislative factors to enhance their
service quality.
5 What are the weakness of
NQIs
25% responded that there is lack of linkages
between different levels and lack of coalition in
performances
• Lack of information networking infrastructure
• Lack of support with information technology on
activities performed
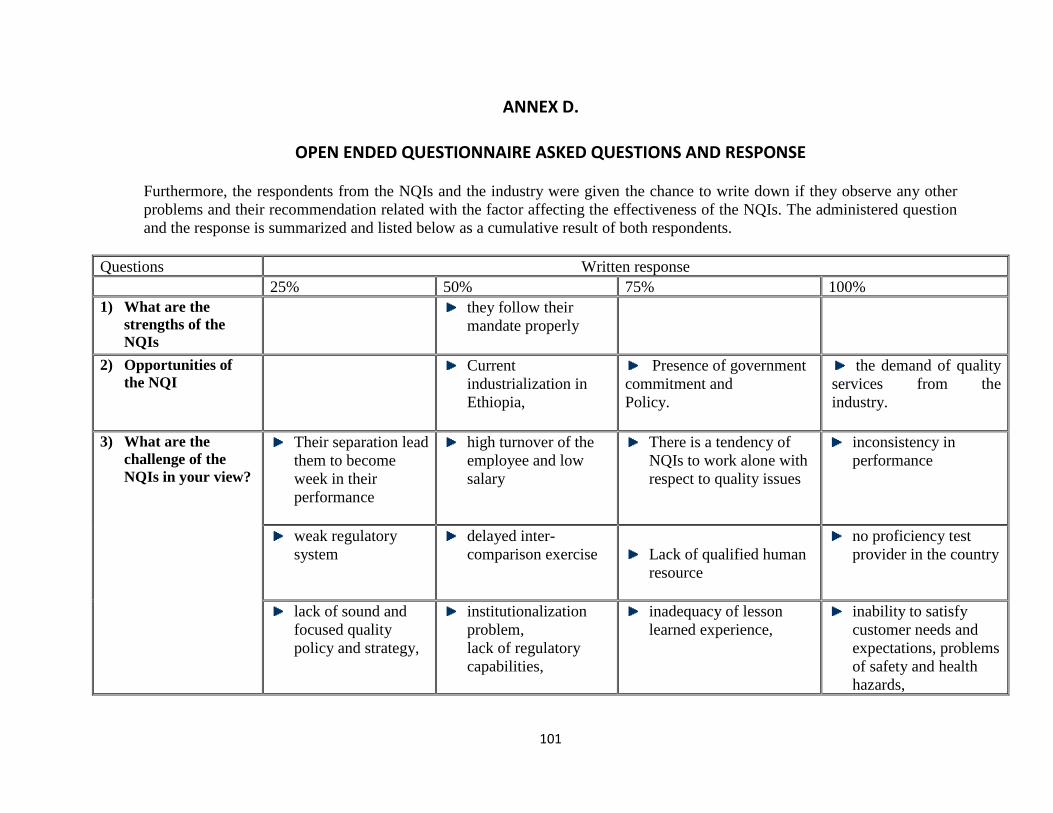
101
ANNEX D.
OPEN ENDED QUESTIONNAIRE ASKED QUESTIONS AND RESPONSE
Furthermore, the respondents from the NQIs and the industry were given the chance to write down if they observe any other
problems and their recommendation related with the factor affecting the effectiveness of the NQIs. The administered question
and the response is summarized and listed below as a cumulative result of both respondents.
Questions Written response
25% 50% 75% 100%
1) What are the
strengths of the
NQIs
they follow their
mandate properly
2) Opportunities of
the NQI Current
industrialization in
Ethiopia,
Presence of government
commitment and
Policy.
the demand of quality
services from the
industry.
3) What are the
challenge of the
NQIs in your view?
Their separation lead
them to become
week in their
performance
high turnover of the
employee and low
salary
There is a tendency of
NQIs to work alone with
respect to quality issues
inconsistency in
performance
weak regulatory
system
delayed inter-
comparison exercise
Lack of qualified human
resource
no proficiency test
provider in the country
lack of sound and
focused quality
policy and strategy,
institutionalization
problem,
lack of regulatory
capabilities,
inadequacy of lesson
learned experience,
inability to satisfy
customer needs and
expectations, problems
of safety and health
hazards,
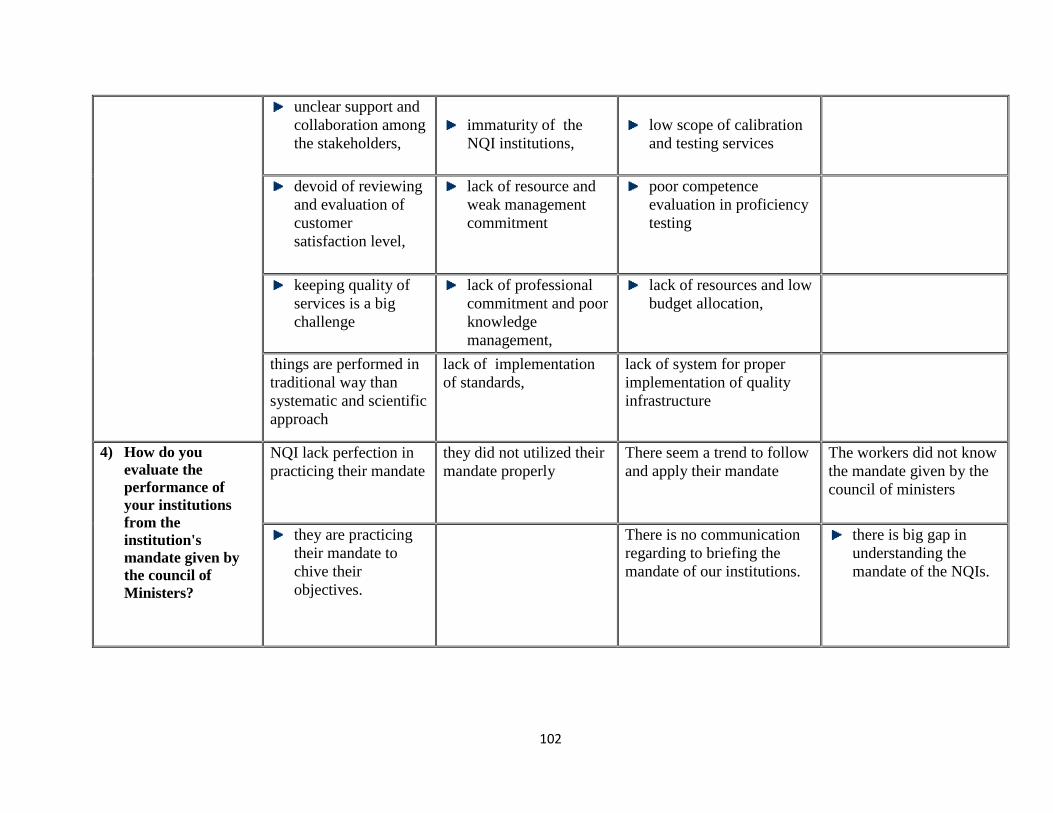
102
unclear support and
collaboration among
the stakeholders,
immaturity of the
NQI institutions,
low scope of calibration
and testing services
devoid of reviewing
and evaluation of
customer
satisfaction level,
lack of resource and
weak management
commitment
poor competence
evaluation in proficiency
testing
keeping quality of
services is a big
challenge
lack of professional
commitment and poor
knowledge
management,
lack of resources and low
budget allocation,
things are performed in
traditional way than
systematic and scientific
approach
lack of implementation
of standards,
lack of system for proper
implementation of quality
infrastructure
4) How do you
evaluate the
performance of
your institutions
from the
institution's
mandate given by
the council of
Ministers?
NQI lack perfection in
practicing their mandate
they did not utilized their
mandate properly
There seem a trend to follow
and apply their mandate
The workers did not know
the mandate given by the
council of ministers
they are practicing
their mandate to
chive their
objectives.
There is no communication
regarding to briefing the
mandate of our institutions.
there is big gap in
understanding the
mandate of the NQIs.
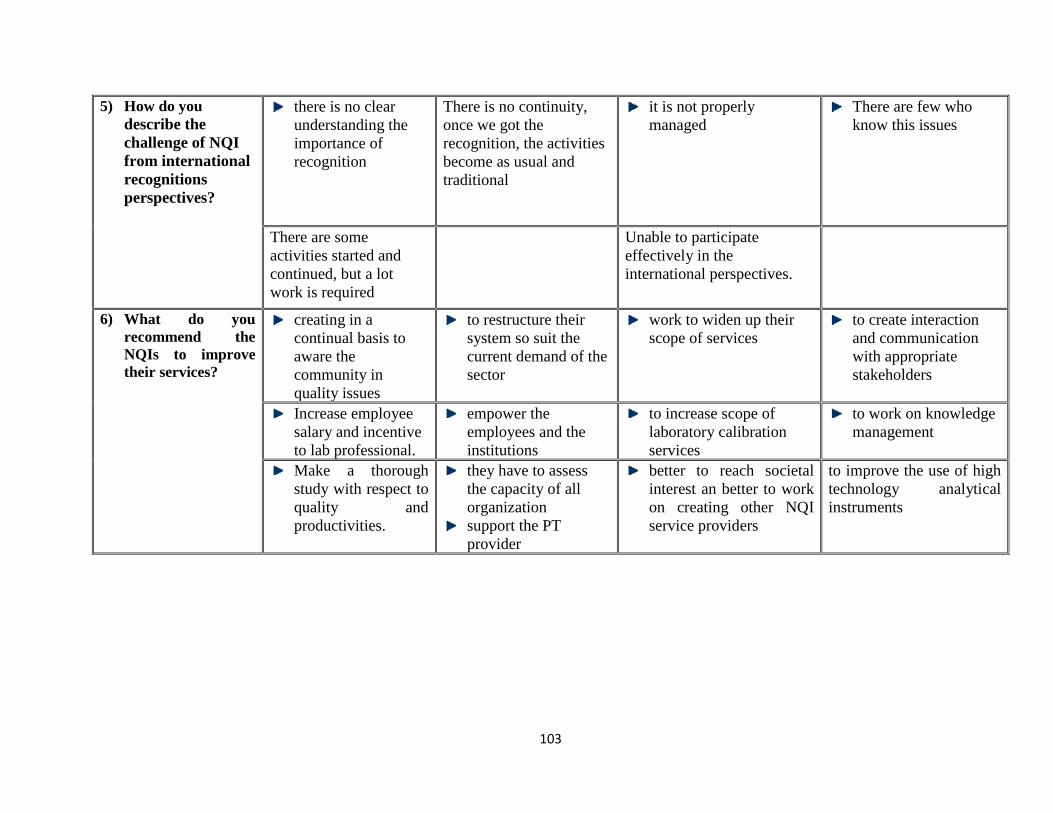
103
5) How do you
describe the
challenge of NQI
from international
recognitions
perspectives?
there is no clear
understanding the
importance of
recognition
There is no continuity,
once we got the
recognition, the activities
become as usual and
traditional
it is not properly
managed
There are few who
know this issues
There are some
activities started and
continued, but a lot
work is required
Unable to participate
effectively in the
international perspectives.
6) What do you
recommend the
NQIs to improve
their services?
creating in a
continual basis to
aware the
community in
quality issues
to restructure their
system so suit the
current demand of the
sector
work to widen up their
scope of services
to create interaction
and communication
with appropriate
stakeholders
Increase employee
salary and incentive
to lab professional.
empower the
employees and the
institutions
to increase scope of
laboratory calibration
services
to work on knowledge
management
Make a thorough
study with respect to
quality and
productivities.
they have to assess
the capacity of all
organization
support the PT
provider
better to reach societal
interest an better to work
on creating other NQI
service providers
to improve the use of high
technology analytical
instruments
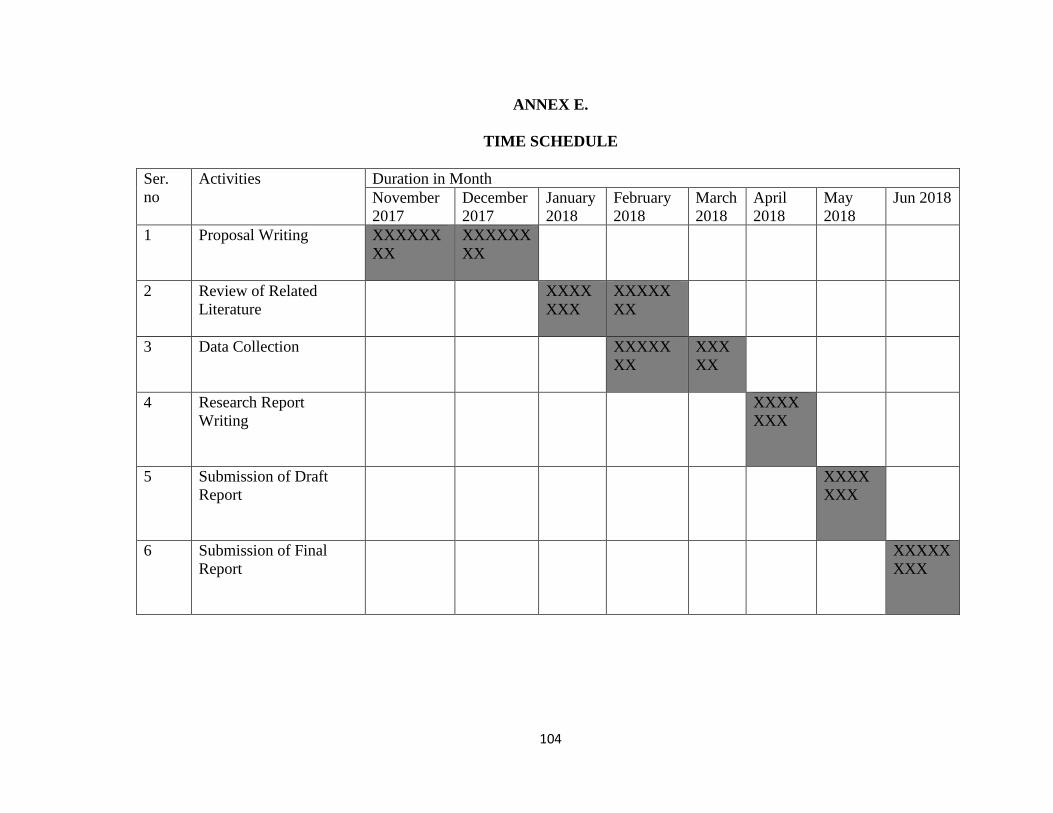
104
ANNEX E.
TIME SCHEDULE
Ser.
no
Activities Duration in Month
November
2017
December
2017
January
2018
February
2018
March
2018
April
2018
May
2018
Jun 2018
1 Proposal Writing
XXXXXX
XX
XXXXXX
XX
2 Review of Related
Literature
XXXX
XXX
XXXXX
XX
3 Data Collection
XXXXX
XX
XXX
XX
4 Research Report
Writing
XXXX
XXX
5 Submission of Draft
Report
XXXX
XXX
6 Submission of Final
Report
XXXXX
XXX