Embed Size (px)
Citation preview
FACTORS AFFECTING PRESERVICE
MATHEMATICS TEACHERS’ DECISIONS
ON PROBABILITY TEACHING
A THESIS SUBMITTED TO
THE GRADUATE SCHOOL OF NATURAL AND APPLIED SCIENCES
OF
MIDDLE EAST TECHNICAL UNIVERSITY
BY
EMEL ÖZAYTABAK
IN PARTIAL FULFILLMENT OF REQUIREMENTS
FOR
THE DEGREE OF MASTER FOR SCIENCE
IN
SECONDARY SCIENCE AND MATHEMATICS EDUCATION
AUGUST 2004
Approval of the Graduate School of Natural and Applied Sciences
Prof. Dr. Canan ÖZGEN
Director
I certify that this thesis satisfies all the requirements as a thesis for the degree of
Master of Science
Prof. Dr. Ömer GEBAN
Head of Department
This is to certify that e have read this thesis and that in our opinion it is fully
adequate, in scope and quality, as a thesis for the degree of Master of Science
Assoc. Prof. Dr. Safure BULUT
Examining Committee Members
Prof. Dr. Ömer GEBAN (METU,SSME)
Assoc. Prof. Dr. Safure BULUT (METU,SSME)
Assoc. Prof. Dr. Ahmet ARIKAN(GAZİ U.,SSME)
Assist.Prof. Dr. Cennet Engin DEMİR(METU,EDS)
Dr. Hasan KARAASLAN (METU,SSME)
iii
I hereby declare that all information in this document has been obtained and
presented in accordance with academic rules and ethical conduct. I also declare that,
as required by this rules and conduct, I have fully cited and referenced all material
and results that are not original to this work.
Name, Last name: Emel Özaytabak Signature :
iv
ABSTRACT
FACTORS AFFECTING PRESERVICES MATHEMATICS
TEACHERS’ DECISIONS
ON PROBABILITY TEACHING
ÖZAYTABAK, Emel
M. S. Department of Secondary Science and Mathematics Education
Supervisor: Assoc.Prof. Dr. Safure BULUT
August 2004, 83 pages
The purpose of this study was to examine the factors affecting preservice
mathematics teachers’ decisions on probability teaching.
The sample of the study was 248 preservice mathematics teachers from Gazi
University, Hacettepe University, and Middle East Technical University. According
to the gender the number of females and males were 170 and 78 respectively.
To obtain necessary data for the study, the following measuring instruments
were used: (1) Probability Achievement Test (PAT); (2) Probability Misconception
Test (PMT); (3) Attitude toward Probability Teaching Scale (APTS); (4) Attitude
toward Probability Scale (APS). Only the third measuring instrument was developed
and its reliability and validity was tested by the researcher. An interview was done
with 12 preservice mathematics teachers from Gazi University, Hacettepe University,
and Middle East Technical University.
The data of the study were analyzed by using SPSS and with qualitative
techniques.
v
The results of the study demonstrated that there are some factors affecting
preservice mathematics teachers’ decisions on probability teaching. These factors
were their attitude toward probability, probability achievement and misconceptions.
Subjects thought that gender would have no affect on their decision on probability
teaching.
KEYWORDS: Preservice Mathematics Teachers, Probability, Misconception,
Gender, Attitude, Teaching

vi
ÖZ
MATEMATİK ÖĞRETMEN ADAYLARININ OLASILIK ÖĞRETİMİ İLE
İLGİLİ DÜŞÜNCELERİNİ ETKİLEYEN FAKTÖRLER
ÖZAYTABAK, Emel
Yüksek Lisans Tezi, Matematik Eğitimi Anabilim Dalı
Tez Yöneticisi: Doç. Dr. Safure BULUT
Ağustos 2004, 83 sayfa
Bu çalışmanın amacı matematik öğretmen adaylarının olasılık öğretimi
hakkındaki düşüncelerini etkileyen faktörleri incelemektir. Çalışmanın örneklemi
Gazi Üniversitesi, Hacettepe Üniversitesi ve Orta Doğu Teknik Üniversitesindeki
248 hizmet öncesi matematik öğretmenidir. Cinsiyete göre kız ve erkek sayıları
sırasıyla 170 ve 78 dir.
Gerekli verileri toplamak amacıyla şu veri toplama araçları kullanılmıştır: (1)
Olasılık Başarı Testi; (2) Olasılık Kavram Yanılgısı Testi; (3) Olasılık Öğretimine
Yönelik Tutum Ölçeği; (4) Olasılık Konusuna Yönelik Tutum Ölçeği. Üçüncü ölçme
aracı araştırmacı tarafından geliştirilip, geçerlilik ve güvenilirlik çalışması
yapılmıştır. Gazi Üniversitesi, Hacettepe Üniversitesi ve Orta Doğu Teknik
Üniversitesinden 12 öğrenci ile görüşme yapılmıştır.
Çalışmanın verileri SPSS ve niteliksel analiz teknikleri kullanılarak yapılmıştır.
Bu çalışmanın sonuçları şunları göstermektedir: Matematik öğretmen
adaylarının olasılık öğretimini etkileyen bazı faktörler vardır. Bu faktörler olasılığa
karşı tutumları ,olasılık başarıları, kavram yanılgılarıdır. Katılımcılar, cinsiyetin
olasılık öğretimi hakkındaki düşüncelerine bir etkisi olduğunu düşünmemektedirler.

vii
Anahtar Kelimeler: Matematik Öğretmen Adayı, Olasılık, Kavram Yanılgısı,
Cinsiyet, Tutum, Öğretim
viii
ACKNOWLEDGMENTS
I would like to thank to Assoc. Prof. Dr. Safure BULUT for her warm support,
guidance, and suggestions during the study.
I am grateful to my parents who have provided me love, support, and
educational background. And to my lovely husband and my little son Ahmet Namık.
Thank you very much for your patience, moral support, and help.
ix
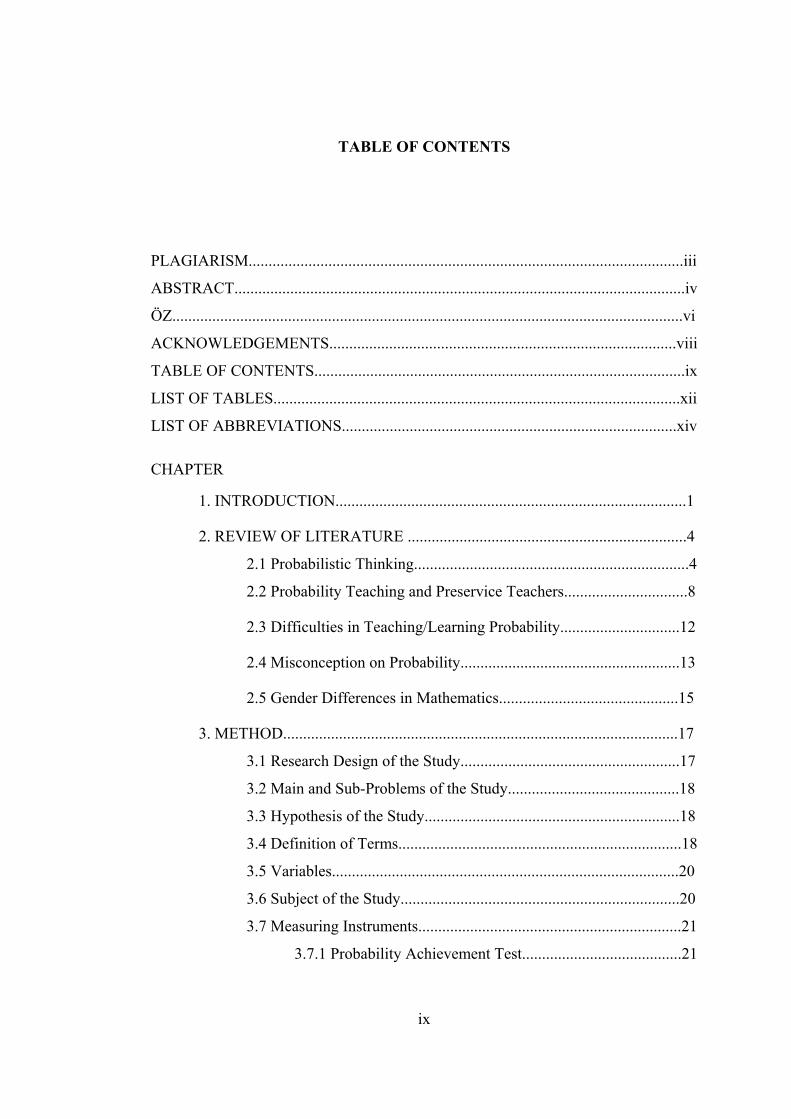
TABLE OF CONTENTS
PLAGIARISM.............................................................................................................iii
ABSTRACT.................................................................................................................iv
ÖZ................................................................................................................................vi
ACKNOWLEDGEMENTS.......................................................................................viii
TABLE OF CONTENTS.............................................................................................ix
LIST OF TABLES......................................................................................................xii
LIST OF ABBREVIATIONS....................................................................................xiv
CHAPTER
1. INTRODUCTION........................................................................................1
2. REVIEW OF LITERATURE ......................................................................4
2.1 Probabilistic Thinking.....................................................................4
2.2 Probability Teaching and Preservice Teachers...............................8
2.3 Difficulties in Teaching/Learning Probability..............................12
2.4 Misconception on Probability.......................................................13
2.5 Gender Differences in Mathematics.............................................15
3. METHOD...................................................................................................17
3.1 Research Design of the Study.......................................................17
3.2 Main and Sub-Problems of the Study...........................................18
3.3 Hypothesis of the Study................................................................18
3.4 Definition of Terms.......................................................................18
3.5 Variables.......................................................................................20
3.6 Subject of the Study......................................................................20
3.7 Measuring Instruments..................................................................21
3.7.1 Probability Achievement Test........................................21
x
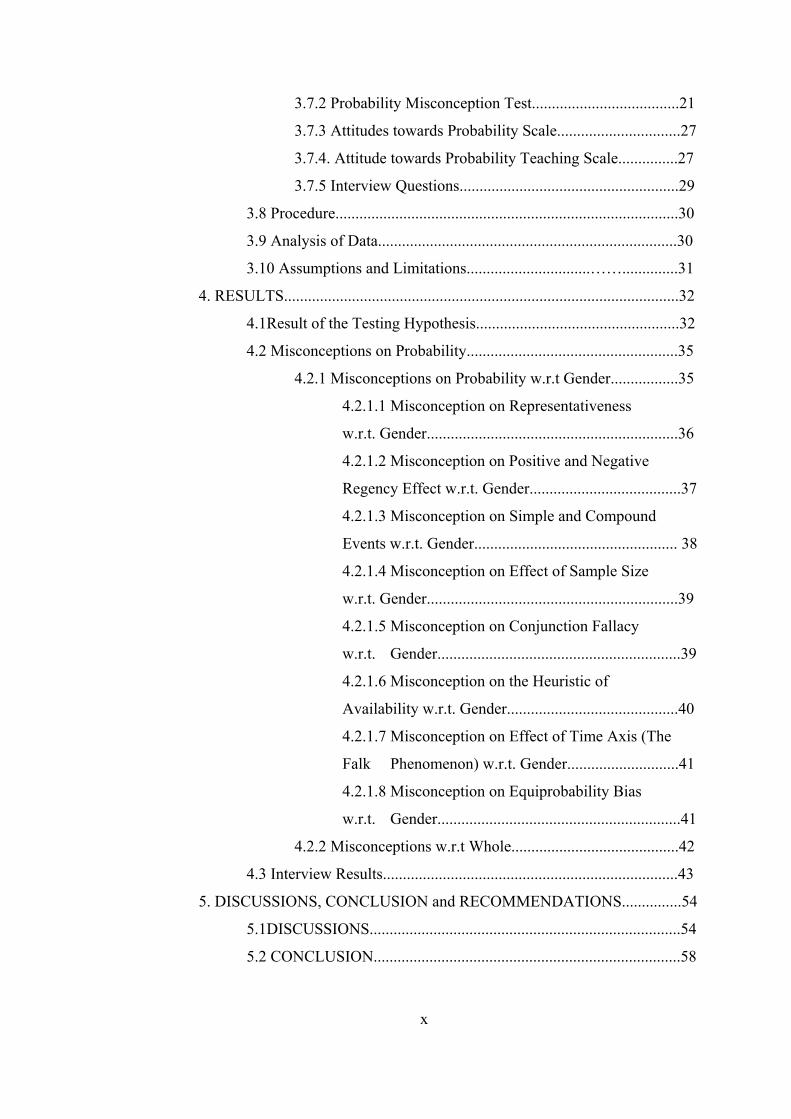
3.7.2 Probability Misconception Test.....................................21
3.7.3 Attitudes towards Probability Scale...............................27
3.7.4. Attitude towards Probability Teaching Scale...............27
3.7.5 Interview Questions.......................................................29
3.8 Procedure......................................................................................30
3.9 Analysis of Data...........................................................................30
3.10 Assumptions and Limitations...............................……..............31
4. RESULTS...................................................................................................32
4.1Result of the Testing Hypothesis...................................................32
4.2 Misconceptions on Probability.....................................................35
4.2.1 Misconceptions on Probability w.r.t Gender.................35
4.2.1.1 Misconception on Representativeness
w.r.t. Gender...............................................................36
4.2.1.2 Misconception on Positive and Negative
Regency Effect w.r.t. Gender......................................37
4.2.1.3 Misconception on Simple and Compound
Events w.r.t. Gender................................................... 38
4.2.1.4 Misconception on Effect of Sample Size
w.r.t. Gender...............................................................39
4.2.1.5 Misconception on Conjunction Fallacy
w.r.t. Gender.............................................................39
4.2.1.6 Misconception on the Heuristic of
Availability w.r.t. Gender...........................................40
4.2.1.7 Misconception on Effect of Time Axis (The
Falk Phenomenon) w.r.t. Gender............................41
4.2.1.8 Misconception on Equiprobability Bias
w.r.t. Gender.............................................................41
4.2.2 Misconceptions w.r.t Whole..........................................42
4.3 Interview Results..........................................................................43
5. DISCUSSIONS, CONCLUSION and RECOMMENDATIONS...............54
5.1DISCUSSIONS..............................................................................54
5.2 CONCLUSION.............................................................................58
xi
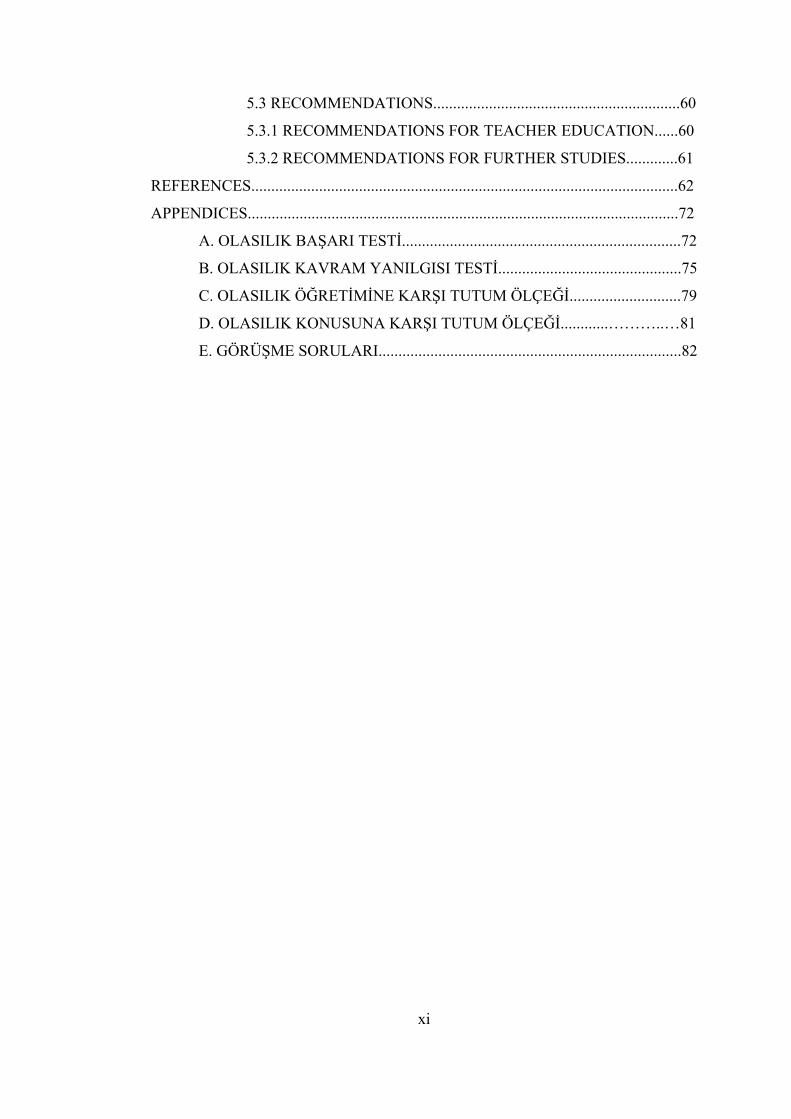
5.3 RECOMMENDATIONS..............................................................60
5.3.1 RECOMMENDATIONS FOR TEACHER EDUCATION......60
5.3.2 RECOMMENDATIONS FOR FURTHER STUDIES.............61
REFERENCES...........................................................................................................62
APPENDICES............................................................................................................72
A. OLASILIK BAŞARI TESTİ......................................................................72
B. OLASILIK KAVRAM YANILGISI TESTİ..............................................75
C. OLASILIK ÖĞRETİMİNE KARŞI TUTUM ÖLÇEĞİ............................79
D. OLASILIK KONUSUNA KARŞI TUTUM ÖLÇEĞİ............………..…81
E. GÖRÜŞME SORULARI............................................................................82
xii
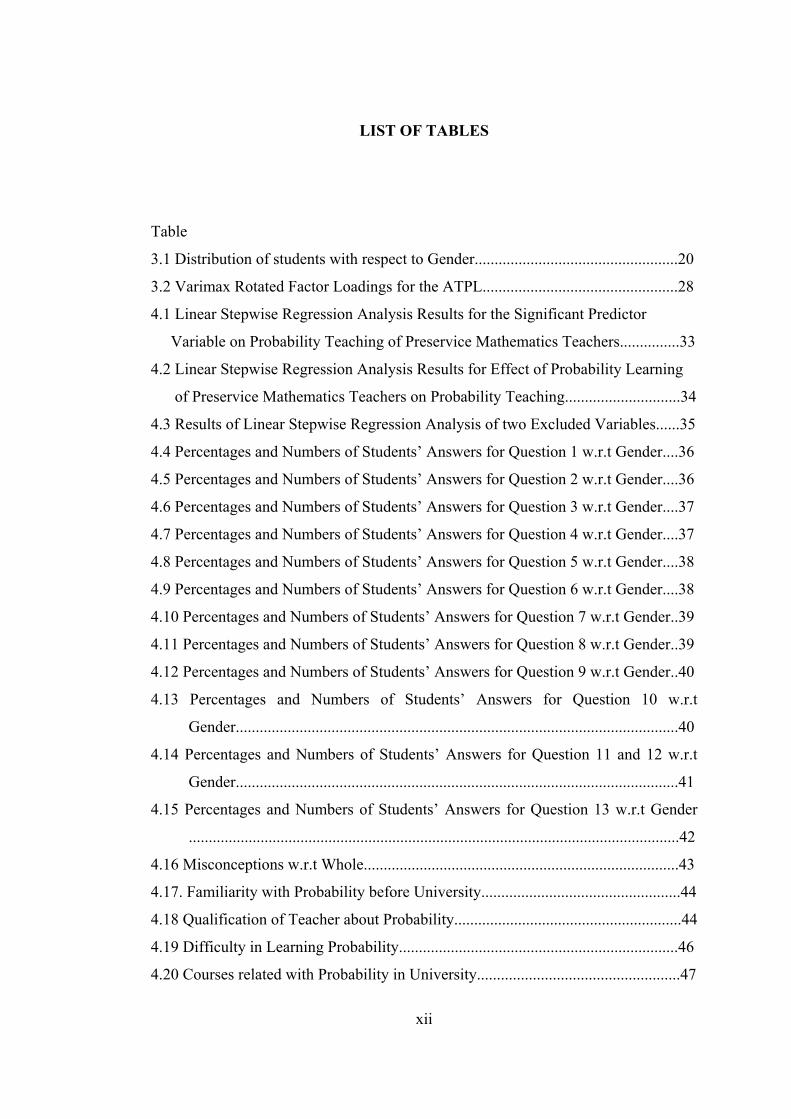
LIST OF TABLES
Table
3.1 Distribution of students with respect to Gender...................................................20
3.2 Varimax Rotated Factor Loadings for the ATPL.................................................28
4.1 Linear Stepwise Regression Analysis Results for the Significant Predictor
Variable on Probability Teaching of Preservice Mathematics Teachers...............33
4.2 Linear Stepwise Regression Analysis Results for Effect of Probability Learning
of Preservice Mathematics Teachers on Probability Teaching.............................34
4.3 Results of Linear Stepwise Regression Analysis of two Excluded Variables......35
4.4 Percentages and Numbers of Students’ Answers for Question 1 w.r.t Gender....36
4.5 Percentages and Numbers of Students’ Answers for Question 2 w.r.t Gender....36
4.6 Percentages and Numbers of Students’ Answers for Question 3 w.r.t Gender....37
4.7 Percentages and Numbers of Students’ Answers for Question 4 w.r.t Gender....37
4.8 Percentages and Numbers of Students’ Answers for Question 5 w.r.t Gender....38
4.9 Percentages and Numbers of Students’ Answers for Question 6 w.r.t Gender....38
4.10 Percentages and Numbers of Students’ Answers for Question 7 w.r.t Gender..39
4.11 Percentages and Numbers of Students’ Answers for Question 8 w.r.t Gender..39
4.12 Percentages and Numbers of Students’ Answers for Question 9 w.r.t Gender..40
4.13 Percentages and Numbers of Students’ Answers for Question 10 w.r.t
Gender...............................................................................................................40
4.14 Percentages and Numbers of Students’ Answers for Question 11 and 12 w.r.t
Gender...............................................................................................................41
4.15 Percentages and Numbers of Students’ Answers for Question 13 w.r.t Gender
...........................................................................................................................42
4.16 Misconceptions w.r.t Whole...............................................................................43
4.17. Familiarity with Probability before University..................................................44
4.18 Qualification of Teacher about Probability.........................................................44
4.19 Difficulty in Learning Probability......................................................................46
4.20 Courses related with Probability in University...................................................47
xiii
4.21 University effect on Attitudes.............................................................................48
4.22 Achievement on Probability at University..........................................................48
4.23 How Interviewees would teach Probability........................................................50
4.24 Factors effecting teachers’ attitude toward probability teaching........................52
4.25 Gender Effect on Probability Achievement........................................................52
xiv
LIST OF ABBREVIATIONS
APS..........................................: Attitude towards Probability Scale
APTS..........................................: Attitude towards Probability Teaching Scale
C.................................................: Correct
F..................................................: False
I...................................................: Incorrect
M.................................................: Misconception
n..................................................: Number of cases
NA...............................................: no answer
OA...............................................: own answer
PA...............................................: Probability Achievement
PAT.............................................: Probability Achievement Test
PL...............................................: Probability learning
PMT............................................: Probability Misconception Test
w.r.t.............................................: with respect to
1
CHAPTER 1
INTRODUCTION
As increased use of technology and the empirical sciences spread throughout the
global community, the use of data and graphs to communicate information was ever
increasing. Statistics and projected outcomes based on estimated probabilities
increasingly influenced daily decision making and discussions of social issues.
Unfortunately, most high school graduates had little or no background in
mathematics associated with calculating probabilities and interpreting statistics.
Therefore, schools needed to provide greater attention to probability and statistics in
mathematics and other courses in order for our students to be adequately prepared to
make informed decisions (Lee, 1999).
In past two decades, several influential organizations, including National
Council of Supervisors of Mathematics in 1978, NACOME in 1975, and UNESCO
in 1972, and CEEB in 1959, and the Cambridge Conference on School Mathematics
in 1963 had acknowledged the role that probability and statistics play in our society
(Hope & Kelly, 1983).
In recent recommendations the importance of having all students develop an
awareness of probability concepts and applications had been recognized (NCTM,
1989). Numerous educators recommended the introduction concepts related to
probability and statistics throughout the school years for all students, not just those
students bound for college (NCTM, 1989; NRC, 1989; Shaughnessy, 1992; Lee,
1999).
In spite of increased support for teaching probability and statistics in schools,
significant problems were reported in teaching and learning probability.

2
• Absence of probability and statistics lessons or courses in schools (Barnett,
1988; Shaughnessy, 1992): To date, very little probability and statistics had been
taught in schools.
• Teachers were not prepared to teach probability. Historically, teacher
preparation programs had not systematically included probability for preservice
mathematics teachers (Shaughnessy, 1992).
• Students’ misconceptions and understanding. Conditional probability and the
notion of independent events were as particularly difficult concepts for students
to grasp (Falk, 1988).
• Students’ beliefs and attitudes. Statistics courses were some of the most
rigorous and anxiety evoking for college students. Because of this, researchers
had investigated techniques that might help to reduce anxiety and change
negative attitudes experienced by students taking such courses (Sgoutas-Emch &
Johnson, 1998).
• Students had difficulty in interpreting the problems (Carpenter et al., 1981;
Mosteller, 1967).
• There was a conflict between probability ideas and students’ experiences and
how they viewed the world (Hope & Kelly, 1983).
The ideas behind probability were difficult to learn and hard to teach. Among
mathematics topics, probability concepts were basically indirect and theoretical and
teachers needed some particular experience to teach students (Ersoy & Bulut, 1993).
Some research studies confirmed the fact that probabilistic beliefs and conceptions
are difficult to change (delMas & Bart, 1987; Konold, 1983). There are several
studies about probabilistic thinking of students. But there were not many
investigations about probabilistic thinking of preservice teachers. In the introduction
of educational changes it constantly turned out that the teacher was the central factor
in the failure or success of the innovation, in general. Usually teacher decided
whether or not he or she would give emphasis to the new topics in the current
curricula and spent some afford how to teach them (Ersoy & Bulut, 1993).
The purpose of this study was to investigate the factors affecting preservice
mathematics teachers’ decisions on probability teaching.
3
In the present study we examined attitudes of preservice mathematics teachers
toward probability learning, achievement of preservice mathematics teachers on
probability, misconceptions of preservice mathematics teachers on probability and
effect of gender of preservice mathematics teachers toward probability teaching.
Understanding the factors affecting preservice mathematics teachers’ decisions
on probability teaching would be helpful to overcome the difficulties in teaching
probability to students. And it would be helpful to find the answers to such questions:
“As researchers, what could we do to change and influence their conceptions and
attitudes? And how could we manage to do this?”
4
CHAPTER 2
REVIEW OF RELATED LITERATURE
In this chapter theoretical bases of the present study would explained, and
related studies done would be reviewed. Development of probabilistic thinking,
probabilistic thinking, probability teaching and preservice teachers, difficulties in
teaching/ learning probability, misconceptions and gender differences in mathematics
were presented in this chapter.
2.1 Probabilistic Thinking
In the present study, the term “Probabilistic Thinking” was used to describe
children’s’ thinking in response to any probability situation. In particular, researchers
advocated the use of a general instructional model in which research-based
knowledge of students’ thinking was used to inform classroom instruction (Jones,
Langrall, Thornton, & Mogill, 1999).
There had been considerable research into students’ probabilistic thinking (e.g.,
Fischbein, Nello, & Marino, 1991; Fischbein & Schnarch, 1997; Jones, Langrall,
Thornton, & Mogill, 1997; Piaget & Inhelder, 1951/1975; Shaughnessy, 1992).
Various studies had been published concerning the developmental aspects of
probabilistic thinking, starting especially with the book of Piaget and Inhelder: La
Genèse de l’Idèe de Hasard chez l’Enfant (1951).
Also Fischbein (1975); Hawkins and Kapadia (1984); Garfield and Ahlgren
(1988) and Shaughnessy (1992) were the studies done about the developmental
aspects of probabilistic intuitions. As for misconceptions in statistical and
probabilistic reasoning the main work was edited by Kahneman, Slovic and Tversky
(1982).
5
Two main types of studies were reported in the research literature. The first type
described how people thought; the second type was concerned with influencing how
people thought. The first type investigated primitive conceptions or intuitions of
probability and statistics, misconceptions, fallacies in thinking, judgmental biases,
and so forth, the second type was concerned with influencing beliefs or conceptions,
even changing them if possible. It was true that the first type had been carried out
primarily by psychologists, and the second type primarily by mathematics educators.
Mathematics educators discovered they had to become familiar with students’
preexisting stochastic conceptions before they tried to teach the mathematical
conceptions of probability and statistics (Shaugnessy, 1992).
The ideas of Shaugnessy were supported by Resnick. Resnick (1983)
encouraged collaboration between cognitive psychologists and discipline specialists
to improve precollege instruction in mathematics and science.
Also Garfield and Ahlgren(1988a,1988b) suggested that cooperative research
endeavors between psychologists and mathematics educators would accomplish
research goals much more effectively than isolated efforts that we had seen so far in
stochastic. The work of Scholz and Bentrup (1984) was an example of cooperative
research efforts between psychologists and mathematics educators that we needed to
encourage.
Apart from these kinds of studies, Jones, Langrall, Thornton and Mogill (1997)
stated in their study that for young children to exhibit probabilistic thinking there was
a need for them to understand probability concepts which were multifaceted and
developed over time. In order to capture the manifold nature of probabilistic
thinking, their framework incorporated four key constructs. Three of these –sample
space, probability of an event, and probability comparisons- had been investigated by
several researchers. Few studies on the fourth construct, conditional probability, had
been directed to young children, although interpretations had been drawn from data
involving conditional probability.
One technique used in assessment of children’s understanding of probability was
to present a subject, two urns containing different proportions of balls of two colors
and to ask which urn would be better to choose if one wanted to draw out at random
a ball of a specified color. This technique was used by Piaget and Inhelder (1951),
6
Siegler (1981), Green (1982) and Singer and Resnick (1992). Others, such as
Hoeman and Ross (1972), did similar work involving the comparison of sectors of
spinners. It had been argued by some researchers (e.g., Fischbein, 1975) that in such
experiments children might be making perceptual rather than probabilistic
judgments.
In recent recommendations, the importance of having all students developed an
awareness of probability concepts and applications had been recognized (NCTM,
1989). Because of this emphasis on probability in school curriculum, there was a
need for further, ongoing research into learning and teaching of probability
(Shaughnessy, 1992). The movement toward curriculum reforms in school
mathematics (Department of Education and Science and the Welsh Office, 1991;
NCTM, 1989) brought a renewed emphasis on broadening the scope of the
elementary mathematics curriculum. In all cases, this broadened perspective of
curriculum generally adopted the position that young children need to explore the
processes of probability (Department of Education and Science and the Welsh
Office, 1991; NCTM, 1989). There was a growing movement to introduce elements
of statistics and probability into secondary and even elementary school curriculum,
as a part of basic literacy in mathematics (Garfield & Ahlgren, 1988). It was
understood that the future for research in stochastic looked very bright.
Conflicting claims had been made both about people’s understanding of basic
probabilistic and statistical concepts and about the ease with which these concepts
could be learned. A large body of research indicated that people employed a small set
of heuristics when making probability judgments (e.g., Tversky & Kahneman, 1974;
Shaughnassy, 1992). These heuristics often resulted in quick and generally
reasonable judgments that were strongly at odds with probability theory (Konold,
Pollotsek, Well, Lahmeier, & Lipson, 1993). Additionally, research by Konold
(1989) suggested that some college undergraduates reasoned about uncertain
outcomes using a fundamentally nonprobabilistic “outcome approach”. In contrast to
these findings were claims of Piaget and Inhelder (1975) that by the age of 12, most
children acquired basic probability concepts even without formal instruction
(Konold, Pollatsek, Well, Lohmeier, & Libson, 1993).
7
Briefly, Piaget claimed that the development of probability occured in three
stages. In the first stage, generally characteristic of children under 7 years of age, the
child was unable to distinguish between necessary events and possible events. There
was no evidence for a concept of uncertainty. According to Piaget, children at this
age would try to find order in a random mixture. In the second stage, up to 14 years,
the child recognized the distinction between necessary and possible events, but had
no systematic approach to generating a list of possibilities. A child at this stage
supposedly did not possess the combinatorial skills or mathematical maturity to make
an abstract model of a probability experiment. In the third stage, over age 14, the
child began to develop facility with combinatorial analyses, and understood
probability as the limit of a relative frequency. Thus, the concept of ratio would
appear crucial to the development of the probability concept from Piaget’s point of
view (Shaugnessy, 1992).
Like Piaget, Green studied with young adolescents between 11-16. His study had
been the largest study yet undertaken to investigate young adolescent’s concepts of
probability. Green(1979, 1983a, 1983b, 1987, 1988) surveyed over 3,000 students in
England, age 11-16 to determine their level of Piagetion development and to find out
what they knew about probability concepts and the language of uncertainty. Green
found that most students had not attained the stage of formal operations by their 16th
year.
Also Carpenter, Corbitt, Kepner, Lindquist, and Reys (1981) studied on relation
between age and development of probability. They reported that students seem to
have some intuitive notions of probabilities in very elementary situations, and that
those notions grow with age.
Beside age factor on development of probability, instruction had an important
role on children’s development of probability. Fischbein and Gazit (1984) looked at
the effects that teaching 12 lessons about probability and relative frequency had on
both children’s conceptions and intuitions. Fischbein believed that instruction could
improve students’ intuitive ideas of probability (Shaughnessy, 1992). Carpenter and
his colleagues (1981) stated that students have some intuitions but they did not know
how to report probability. They had difficulty in developing an intuition about
fundamental ideas of probability even after instruction (Shaughnessy, 1977).
8
2.2. Probability Teaching and Preservice Teachers
It was not surprising that much of what was researched in mathematics education
was driven by what was taught in schools, or by what a document recommended that
we should be teaching. (See An Agenda for Action, MCTM, 1980, for example).
Since very little probability or statistics had been systematically taught in our schools
in the past, there had been little impetus to carry out research on problems that
students had in learning it (Shaughnessy, 1992).
Meaningful mathematical content and a positive attitude toward the subject were
critical attributes for educators charged with teaching mathematics to children.
(Isenberg &Altizer-Tuning, 1984; Kerr & Lester, 1982). But most of the courses in
probability and statistics that were offered at the university level continue to be either
rule-bound, recipe-type courses for calculating statistics, or overly mathematized
introductions to statistical probability that were the norm a decade ago (Shaughnessy,
1977). Thus college level students, with their prior beliefs and conceptual
misunderstandings about stochastic rarely got the opportunity to improve their
statistical intuition or to see the applicability of the subject as undergraduates
(Shaughnesssy, 1992).
Garfield (1988) cited four issues that hinder the effective teaching of stochastic:
a) the role of probability and statistics in the curriculum, b) links between research
and instruction, c) the preparation of mathematics teachers and d) the way learning is
currently being assessed. The teaching and learning stochastic involved building
models of physical phenomena, development and use of strategies, and comparison
and evaluation of several different approaches to problems in order to monitor
possible misconceptions or misrepresentations. In addition, teachers’ backgrounds
were weak or nonexistent in stochastics. Our teacher preparation programs had not
systematically included stochastics for preservice mathematics teachers (Shaughessy,
1992).
Shaughnessy (1992) stated that the real barriers for improvement of stochastics
teaching were fundamentally a) getting stochastics into the mainstream of
mathematical science school curricula at all, b) enhancing teachers’ background and
9
conceptions of probability and statistics, and c) comforting students’ and teachers’
beliefs about probability and statistics.
In their study, Begg and Edwards found that teachers seemed to have weakly
developed concepts of probability and showed a reliance on prior beliefs. They
preferred the questions to do with everyday life. They tended to see things in terms
of representative heuristic. With randomness, they looked for spread across a range
of variables and did not seem to believe that order or patterns were likely to be
associated with random events.
In addition to Beggs and Edwards, in the study of Koirola, it was stated that even
though some preservice teachers attempted to solve problems using their formal
knowledge they ultimately relied on their everyday experiences whenever they were
confused with their formal knowledge. Many of the preservice teachers in her study
could not do the probability calculation formally because their probability learning
was not conceptual enough to apply to everyday problems. Moreover, they forgot the
mathematical rules and theorems from their probability courses. Probability at
university and probability in everyday life were two different phenomena with only a
small overlap. Her study also suggested that students’ problem-solving strategies
depended on the kinds of contexts in which problems were posed.
Today mathematicians, statisticians, and educators had different views about the
teaching and learning of the probability in schools and universities. These differing
views, especially the views held by preservice and in-service teachers, would have an
important role on how teachers delivered their teaching in schools. (Thompson,
1992), since the classroom teacher was the pivot of mathematical education and
served as the change agent in the teaching/learning process of mathematics. As
Lortie (1975) reminded us, teachers taught the way they were taught and as Cuban
(1993) found chancing that was hard.
Are there optimum teaching and learning techniques which take account of the
child’s conceptions of probabilistic notions while developing his understanding of
the formal knowledge of probability? (Hawkins & Kapadia, 1984). Is there a right
way to teach probability?
Fichbein (1987) believed that instruction could improve students’ intuitive ideas
of probability and made a distinction between primary and secondary intuitions.
10
Primary were the ideas and believes that we had before instructional intervention and
secondary were reconstructed cognitive beliefs that we accepted and used as a result
of instruction or experience.
Before Fichbein, Beyth- Maram and Denkel (1983) developed a curriculum to
improve probabilistic thinking, which they used with junior high students. They
found that teaching students to examine their thought processes and common modes
of thinking that may cause fallacies resulted in better performance on the
questionnaire used for evaluation. Pfannkuch and Brawn (1996) used activities to
challenge students’ intuitions and attempt to increase understanding of variation and
probability with some success.
In their study, Barz (1970) and Shaughnessy (1977) found evidence that a
practical involvement approach to students learning probability tended to result in
higher student achievement then a traditional set-theoretic approach to probability. In
Shaughnessy’s study of how to present probability in a way that would increase
student learning, he showed that students’ misconceptions could be addressed
through instruction. This was accomplished through hands-on experiments and
activities in which students discovered counting principles and other concepts for
themselves. Many researchers agreed that students must be active rather than passive
learners and should work on meaningful projects to answer questions of interest to
them (Cobb, 1991; 1993; Hogg, 1992; Roberts, 1982; Scheaffer, 1992; Snell, 1992;
1994). Newer approaches suggested an active learning format where students first
made predictions about the chance of occurrence for different outcomes, then did
experiments with random devices such as spinners, dice and coins, recorded their
results and compare the experimental probabilities generated to their original
predictions. Indeed, several researchers had recommended this method as a way to
encourage students to confront and correct their misconceptions about chance events
(e.g. Batanero, Serrano & Garfield; Godino et al, 1987; delMas & Bart, 1989;
Shaughnessy, 1992). Since students had misconceptions and had incorrect views
about probability and randomness, Garfield (1995) suggested that effective teaching
be based on the knowledge of students’ preconceptions. Garfield also stated that
when students learn something new, they construct their own meaning.
11
Beside student centered instruction, real-world applications must be used during
instruction. Introducing real-world applications to mathematics classes was one of
the best educational ways of motivating students in classes. Probability was an area
of mathematics with many interesting applications and it was the branch of
mathematics concerned with making rational statements about phenomena that
posses an element of uncertainty. When mathematical probability was used correctly,
it was an effective tool in legal decision-making. Most students in probability classes
would find a discussion of its possible uses and misuses in the legal profession
interesting and stimulating (Halpern, 1987). Probability was the study of like hood
and uncertainty. It played a critical role in all of the professions and in most everyday
decisions (Halpern, 1996, p.142).
Another point was to improve students’ conceptions. To improve students’
conceptions of randomness and probability, Green advocated experimental activities
and encouraged explicit classroom discussion of the language of probability. Because
Green found that the students’ verbal abilities were inadequate for describing
probabilistic situations. In the study of Fischbein and Gazit (1983). They taught 9
classes of older children (10-13years) probability up to simple and compound events.
They found a clear improvement with age and found two biased intuitions were
improved by teaching- the representativeness tendency and the negative regency
tendency.
Also Konold (1991) reported on beliefs of college students about probabilities.
In his study, he based much of his work on direct interview with students who
explained to him their thought process when addressing certain probability problems.
There were several models discussed in the study of Kahneman, Slovic, and Tversky
(1982), Garfield and Ahlgren (1988) or Konold (1989).
In Turkey, there were few studies on teaching probability (e.g. Bulut, 1994;
Cankoy, 1989). Bulut (1994) and Cankoy (1989) conducted study on 8th grade level.
Bulut found that students taught by cooperative learning method scored significantly
better on the Probability Achievement Test than those taught by traditional lecture
method. However, there were no statistically significant mean differences on PAT
scores among any other pairs of groups. Cankoy (1989) found that there was a

12
significant mean difference in the favor of the mathematics laboratory group over
those taught traditionally.
2.3. Difficulties in Teaching and Learning Probability
There was an abundance of research that documents difficulties students and
adults had reasoning with probabilistic information.
Garfield and Ahlgren (1988) found evidence that novices and experts alike
encounter difficulties with respect to understanding probabilistic concepts. They
identified three primary sources for this difficulty:
• Inadequately developed rational number concepts and proportional reasoning;
• Conceptual conflict between formal probabilistic ideas and everyday
experience;
• The abstract methods traditionally used in mathematics instruction.
Also some other researchers reported other difficulties listed below:
• Probability ideas often appear to conflict with students’ experiences and how
they view the world (Kapadia, 1985).
• Students develop distaste for probability through having been exposed to its
study in a highly abstract and formal way (Garfield and Ahlegen, 1988).
• Difficulties in translating verbal problem statements plague stochastics as
they do the rest of the school mathematics (Hansen, McConn, and Myers, 1985).
• They have difficulty in interpreting the problems (Mosteller, 1967; Carpenter
et al., 1981).
• They have difficulty in determining the probability of compound events
(Carpenter et al., 1981).
• They can not understand the idea of “Conditional Probability” (Bar- on and
Or-Bach, 1988).
• The less able pupils have difficulty with thinking of probability of occurrence
of events as a continuum ranging from “certain” to “impossible” (Baron & Or-
Bach, 1988).
• They perceive interdependence between unrelated events, i.e. Gambler’s
Fallacy (Hope & Kelly, 1983).
13
Adults as well as children confused probability concepts and had some
difficulties in problem solving. For example, Hope and Kelly (1983) pointed out that
people:
• Are unaware of highly ambiguous everyday expressions of probability;
• Have undue confidence in the reliability of small samples;
• Have a tendency to confuse the categories of unusual events with those of
low probability events;
• Have difficulty estimating the frequency of many salient or memorable
events.
2.4. Misconceptions on Probability
Students did not come to the class as a “blank slates” (Resnick, 1983). Instead,
they came with theories constructed from their everyday experiences. They had
actively constructed these theories, an activity crucial to all successful learning.
Some of the theories that students used to make sense of the world were, however,
incomplete half-truths (Mester, 1987). These were misconceptions.
Misconceptions were the subcategory of pre-instructional conception, which was
contradictory with the mathematical concepts. They did not simply signify a lack of
knowledge, factual errors, or incorrect definitions. They represented explanations of
phenomena constructed by students in response to their prior knowledge and
experience.
Misconceptions were a problem for two reasons. First, they interfered with
learning when students used them to interpret new experiences. Second, students
were emotionally and intellectually attached to their misconceptions, because they
had actively constructed them. Hence, students gave up their misconceptions, which
could have a harmful effect on learning, only with a great reluctance.
What do these findings mean? They showed teachers that their students almost
came to class with complex ideas about the subject at hand. Further, they suggested
that repeating a lesson on making it clearer would not help students who based their
reasoning on strongly held misconceptions (Champagne, Klopfer & Gunstone, 1982;
McDermatt, 1984; Resnick, 1983). In fact, students who overcame a misconception
14
after ordinarily instruction often returned to it only a short time later. Simply
lecturing to students on a particular topic would not help most students gave up their
misconceptions. Since they actively constructed knowledge, teachers must actively
help them dismantle their misconceptions. Teachers must also help students
reconstruct conceptions capable of guiding their learning in the future.
Remediation of misconceptions could be achieved with the help of teachers. So
teachers had the important role and they should be very well prepared for teaching
mathematics.
In probability, there were some studies about misconceptions. A different
approach to misconceptions in probability was by Amir and Williams (1995). They
stated that some intuitions, inclinations and biases might be affected by cultural
factors. As a result of their study, they found certain intuitions, approaches; biases
and heuristics noted in literature take a strong and common forming 11 year old
thinking, e.g. the outcome approach, Representativeness, availability,
equiprobability. In addition, Fichbein, Nello and Marino also indicated that cultural
influences on probabilistic reasoning might be important.
Another study about attempts to remedy probabilistic misconceptions resulted in
course designs which combine conceptual instruction and experience with stochastic
events (e.g., Beyth-Marom &Denkel, 1983).Students did not appear to have good
intuitions about stochastic events. Green (1982) observed that adolescents became
less likely to identify random sequences correctly with age. A lack of opportunity to
explore systematically the characteristics of stochastic events was assumed to be a
major source of students’ misconceptions. Experience with games of chance which
reward “good intuitions” (Obremski, 1981) were incorporated into instructional units
on probability as a means for providing such opportunities. Although Obremski
(1981) recommended the use of games of chance, no direct assessment of their
effectiveness in reducing misconceptions was presented
Newer approaches suggested an active learning format where students first made
predictions about the chance of occurrence for different outcomes, then did
experiments with random devices such as spinners, dice and coins, record their
results and compare the experimental probabilities generated to their original
predictions. Indeed, several researchers recommended this method as a way to
15
encourage students to confront and correct their misconceptions about chance events
(e.g. Batanero, Serrano & Garfield; Godino et al, 1987; delMas & Bart, 1989;
Shaughnessy, 1992).
In Turkey, there were few studies on misconceptions on probability (e.g., Yıldız
& Bulut, 2002; Mut, 2004). Yıldız and Bulut (2002) conducted a study on preservice
mathematics teachers in Ankara. They found that preservice mathematics teachers
had misconceptions on probability. Mut (2004) studied with students’ grade level
between 5 to 10. He found that frequencies of misconception types varied across
gender and grade levels. He also found that the percentages of students who received
instruction in probability were higher than those who did not received instruction in
terms of misconceptions on Effect of Sample Size and the Time Axis Fallacy.
2.5. Gender Differences in Mathematics
There had been a large body of investigations of gender differences in
mathematics and science education to try to determine if the myth was true that
females were less capable of doing mathematics than males (Marshall, 1984; Leder,
1992; Gallagher & Delisi, 1994; Levi, 2000; Linn & Hyde, 1989).
Marcia C. Linn, a leading researcher on gender differences in math education,
studied this subject for over twenty years. In her earlier studies she found that there
were some gender differences in mathematical processing and that boys did this well
than girls. She found in her later studies, however, that this was not the case, that the
gap had closed substantially (Linn & Hyde, 1989). In fact, even though middle
school students thought that boys were better than girls in mathematics and science,
this was not true. They were at least equal and in many cases, the girls surpassed the
boys. Linn now claimed that the main gender difference was in the confidence level
of the student (which may be influenced by gender).
In their study, Damarin (1995) and Leder (1992) stated that the commonly
supported societal belief that mathematics is male oriented domain demonstrates that
the differences in mathematics disadvantageous to girls aroused from social and
cultural reasons .Leder also pointed out that males express the need for mathematics
for better occupational opportunities than females.
16
Marshall (1984) found that girls were better than boys in solving computations,
whereas boys were better than girls in solving story problems. Kimball (1989)
focused on the differences between girls’ and boys’ approaches to mathematics
learning. Beller and Gafli (2000) boys performed better than girls.
According to Kimball and Marshal (1984), gender differences in mathematics
achievement did not appear in early ages of education, however the differences were
seen after junior high school years.
We could reach several international studies on gender differences on
probability. Dusek and Hill (1970) and Kreitler, Zigler and Kreitler (1983) found that
males outperformed significantly than females. In their study, Kreitler, Zigler and
Kreitler conducted research on 10th grade students and Dusek and Hill studied with
4th and 5th grade level students. In 1979, Moran and Mccullars found female 1st
year university students had significantly higher mean scores than males had. Hanna
(1986) stated there was no significant mean difference with respect to 8th grade
grade students’ probability achievement.
In our country, in 1994, Bulut found that 8th grade female students had
significantly higher mean score on probability achievement than males had. In their
study, Bulut, Yetkin and Kazak (2002) stated that there was a statistically significant
mean difference on preservice secondary mathematics teachers’ probability
achievement in favor of male. Also in his study Mut (2004) found that the
frequencies of all misconception types varied across gender.
17
CHAPTER 3
METHOD
This chapter presents the design of the study, main and sub problems, definition
of terms, variables, population and sampling, instruments, procedure, analysis of
data, and assumptions and limitations parts.
3.1. Research Design of the Study
The purpose of the study was to examine the factors affecting preservice
mathematics teachers’ decisions on probability teaching. Therefore the study was a
correlational study.
During the study four different tests and scales were administered:
• Probability Achievement Test (PAT): It includes open-ended questions.
• Probability Misconception Test (PMT): The test is consisting of probability
problems in a multiple choice format. The alternatives of each item are either
true or false or misconceptions that students can have. The aim is to find the
misconceptions students have.
• Attitude towards Probability Teaching Scale (APTS): This scale is
administered to determine preservice mathematics teachers’ attitude towards
probability teaching.
• Attitude towards Probability (APS): It is administered to determine preservice
mathematics teachers’ attitude towards probability.
18
To explain the results of the correlational study and to examine the third sub-
problem, qualitative analysis was accomplished.
After analyzing of data, 12 students were chosen; 6 from preservice mathematics
teachers, 6 from preservice science teachers according to their score from APTS.
Then 15 minutes interviews were done with each subject.
3.2. Main and Sub problems of the Study
The main research problem of the present study was the following:
“What are the factors affecting preservice mathematics teachers’ decisions on
probability teaching?”
The sub-problems related with the main problem are as follows:
Sub-problems:
• How well can attitudes toward probability teaching be explained in terms of
gender, probability achievement, and attitudes toward probability?
• What are the preservice mathematics teachers’ misconceptions about?
• How do preservice mathematics teachers’ experiences on probability affect
their view about teaching probability?
3.3. Hypothesis of the Study:
To examine the first sub-problem test, the following null hypothesis was stated:
The three variables together (probability achievement, attitudes toward
probability, and gender) do not explain a significant amount of variance in preservice
teacher’s attitudes toward probability.
It was tested at the significance level of 0.05
3.4. Definition of Terms
In this section, some terms that are used in the present study were defined to be
clear to prevent any misunderstanding.
19
• Representativeness (Fallacy of Regression): People will predict the like hood
of events based on how well an outcome represents some aspect of its parent
population.
• Negative and Positive Recency Effect: Negative recency effect is the
tendency to predict an outcome, which has not appeared for some time in a
series of trials. It has been the “Gambler’s Fallacy”. This is related to heuristic of
Representativeness. After the repeated occurrence of one outcome, a gambler
comes to believe that probability of the alternative outcome is increasing even
though successive events are independent. The converse of this is a tendency to
predict an outcome, which has repeatedly occurred.
• Simple and Compound Events: Students confuse or do not separate these
events.
• Conjunction Fallacy: The probability of an event appears under certain
conditions, to be higher than the probability of the intersection of the same event
with another event.
• Effect of Sample Size: Students tend to neglect the influence of the magnitude
of a sample when estimating probabilities. Representativeness also occurs when
students neglect the sample size.
• Availability of Heuristics: The tendency to make predictions based on how
accessible instances of an event are to the memory or on how easy it is to
construct particular instances of events. The judgmental heuristic can induce
significant bias because of one’s own narrow experience or personal perspective.
We all have egocentric impressions off the frequency of events based on our
own experiences. Often these impressions are biased.
• Time Axis Fallacy (Effect of the Time Axis): Children may assign a role in
chance events to the personal qualities of the player though objectively such an
effect does not exist. An inversion of the time axis of cause implying effect
contradicts one of our basic intuitions.
• Misconception: A misconception is an underlying belief that governs an
error.
• Probabilistic Thinking: It is used to describe children’s thinking in response
to any probability situation.
20
• Experience on Probability: Knowledge of probability gained during
probability instruction.
• Probability Achievement: It refers to score subjects got from PAT.
• Attitude toward Probability Teaching: It refers to subjects’ scores From
APTS.
• Attitude toward Probability Scale: It refers to the subjects’ scores from APS.
• Preservice Mathematics Teacher: It refers to subjects who were students in
Elementary School Science Education and Elementary School of Mathematics
Education.
3.5. Variables
There was one dependent variable in the study related to preservice mathematics
teachers’ attitude toward probability teaching. For this dependent variable, there
were four independent variables: Probability achievement, attitude toward
probability, probabilistic misconceptions and gender.
3.6 Subject of the study
The study was carried out during the spring semester of 2002-2003 academic
year.
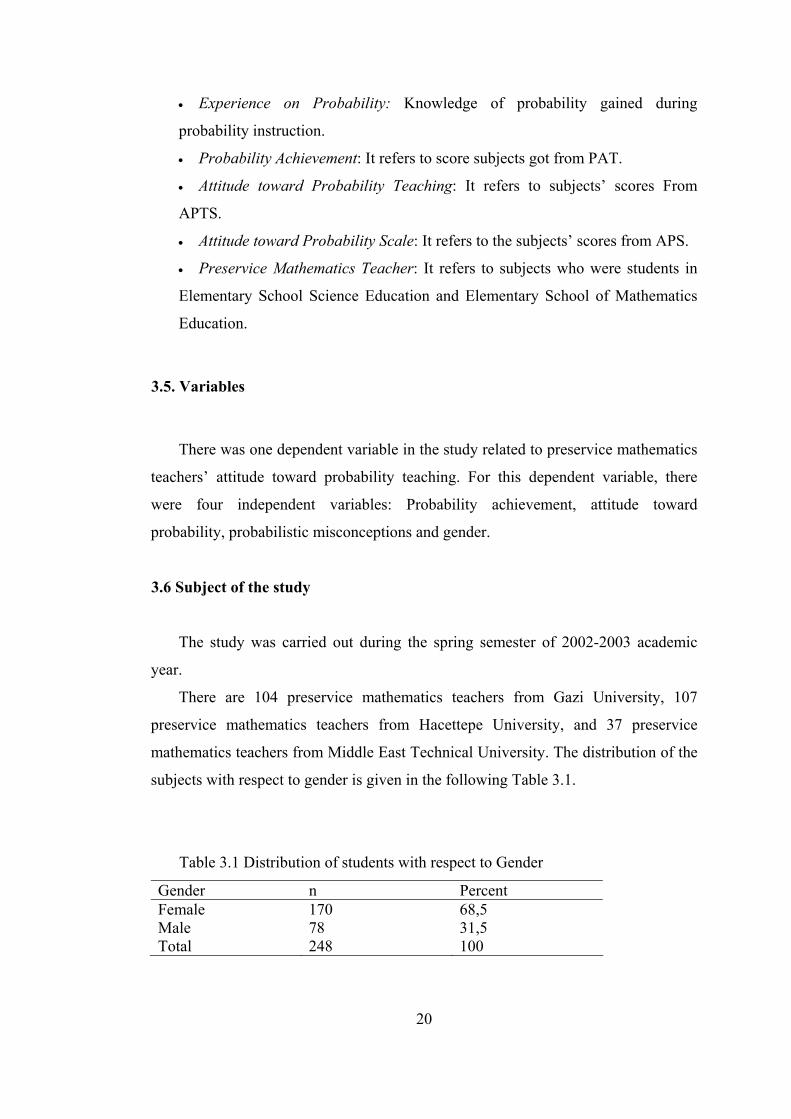
There are 104 preservice mathematics teachers from Gazi University, 107
preservice mathematics teachers from Hacettepe University, and 37 preservice
mathematics teachers from Middle East Technical University. The distribution of the
subjects with respect to gender is given in the following Table 3.1.
Table 3.1 Distribution of students with respect to Gender
Gender n Percent Female 170 68,5 Male 78 31,5 Total 248 100
21
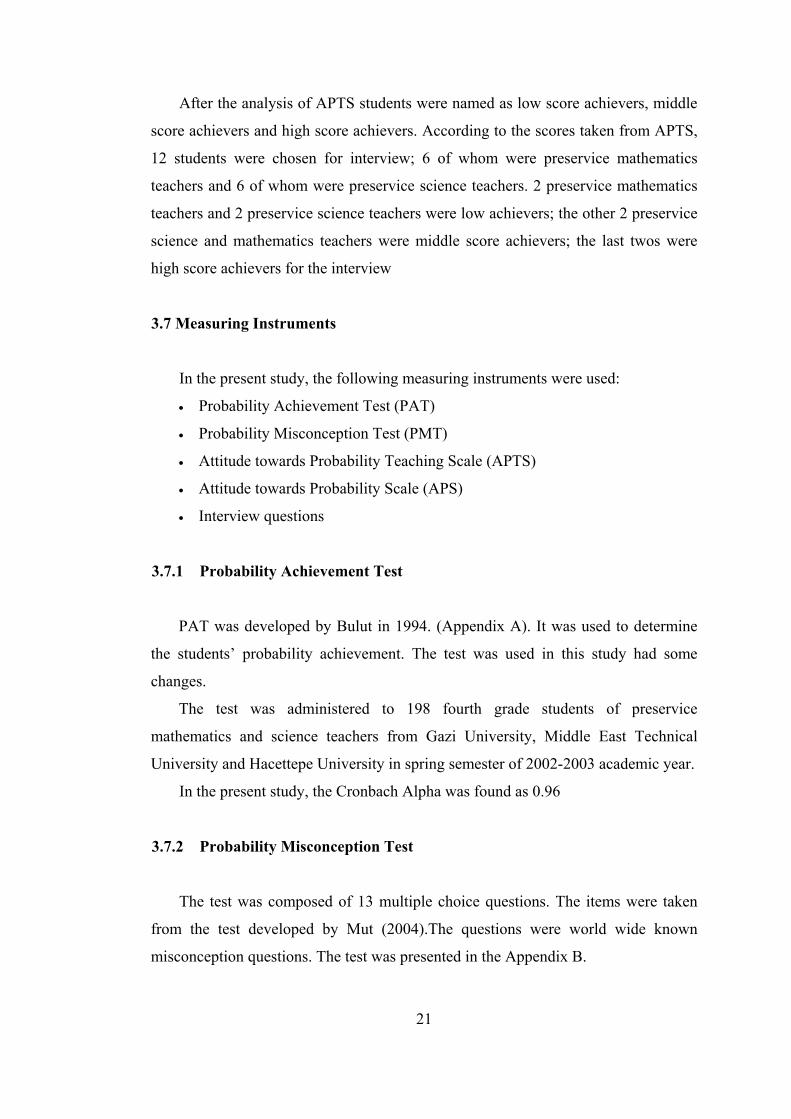
After the analysis of APTS students were named as low score achievers, middle
score achievers and high score achievers. According to the scores taken from APTS,
12 students were chosen for interview; 6 of whom were preservice mathematics
teachers and 6 of whom were preservice science teachers. 2 preservice mathematics
teachers and 2 preservice science teachers were low achievers; the other 2 preservice
science and mathematics teachers were middle score achievers; the last twos were
high score achievers for the interview
3.7 Measuring Instruments
In the present study, the following measuring instruments were used:
• Probability Achievement Test (PAT)
• Probability Misconception Test (PMT)
• Attitude towards Probability Teaching Scale (APTS)
• Attitude towards Probability Scale (APS)
• Interview questions
3.7.1 Probability Achievement Test
PAT was developed by Bulut in 1994. (Appendix A). It was used to determine
the students’ probability achievement. The test was used in this study had some
changes.
The test was administered to 198 fourth grade students of preservice
mathematics and science teachers from Gazi University, Middle East Technical
University and Hacettepe University in spring semester of 2002-2003 academic year.
In the present study, the Cronbach Alpha was found as 0.96
3.7.2 Probability Misconception Test
The test was composed of 13 multiple choice questions. The items were taken
from the test developed by Mut (2004).The questions were world wide known
misconception questions. The test was presented in the Appendix B.
22
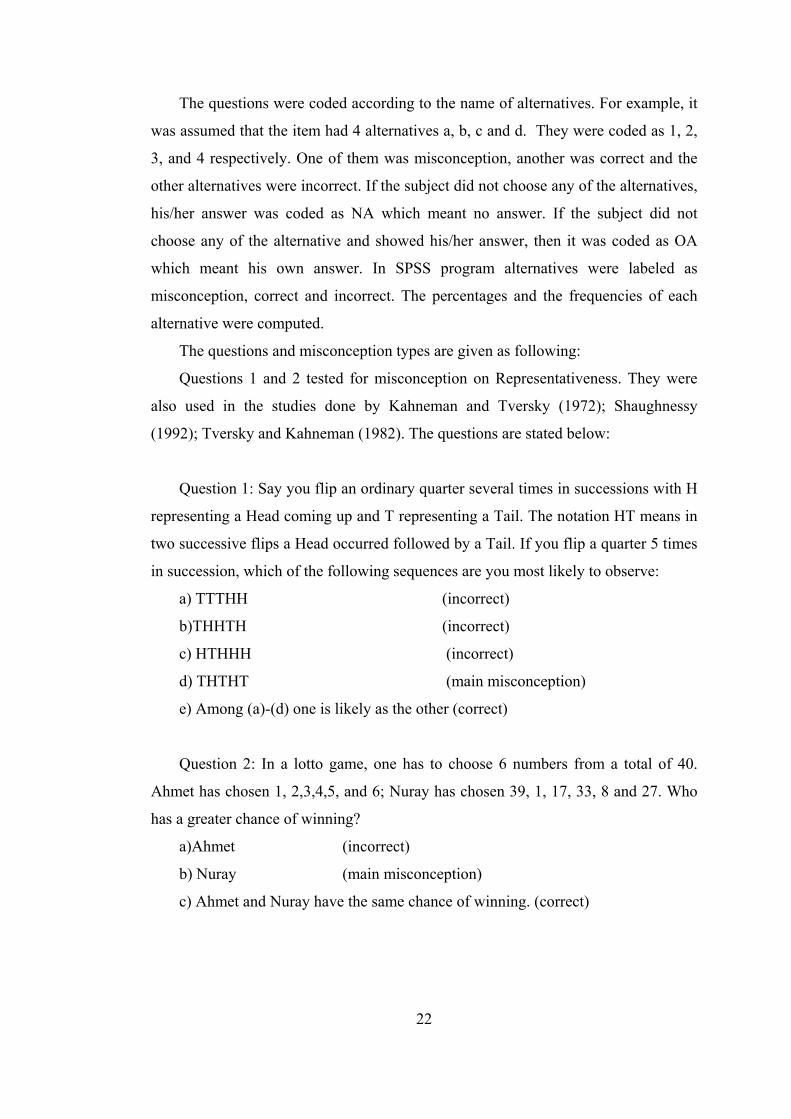
The questions were coded according to the name of alternatives. For example, it
was assumed that the item had 4 alternatives a, b, c and d. They were coded as 1, 2,
3, and 4 respectively. One of them was misconception, another was correct and the
other alternatives were incorrect. If the subject did not choose any of the alternatives,
his/her answer was coded as NA which meant no answer. If the subject did not
choose any of the alternative and showed his/her answer, then it was coded as OA
which meant his own answer. In SPSS program alternatives were labeled as
misconception, correct and incorrect. The percentages and the frequencies of each
alternative were computed.
The questions and misconception types are given as following:
Questions 1 and 2 tested for misconception on Representativeness. They were
also used in the studies done by Kahneman and Tversky (1972); Shaughnessy
(1992); Tversky and Kahneman (1982). The questions are stated below:
Question 1: Say you flip an ordinary quarter several times in successions with H
representing a Head coming up and T representing a Tail. The notation HT means in
two successive flips a Head occurred followed by a Tail. If you flip a quarter 5 times
in succession, which of the following sequences are you most likely to observe:
a) TTTHH (incorrect)
b)THHTH (incorrect)
c) HTHHH (incorrect)
d) THTHT (main misconception)
e) Among (a)-(d) one is likely as the other (correct)
Question 2: In a lotto game, one has to choose 6 numbers from a total of 40.
Ahmet has chosen 1, 2,3,4,5, and 6; Nuray has chosen 39, 1, 17, 33, 8 and 27. Who
has a greater chance of winning?
a)Ahmet (incorrect)
b) Nuray (main misconception)
c) Ahmet and Nuray have the same chance of winning. (correct)
23
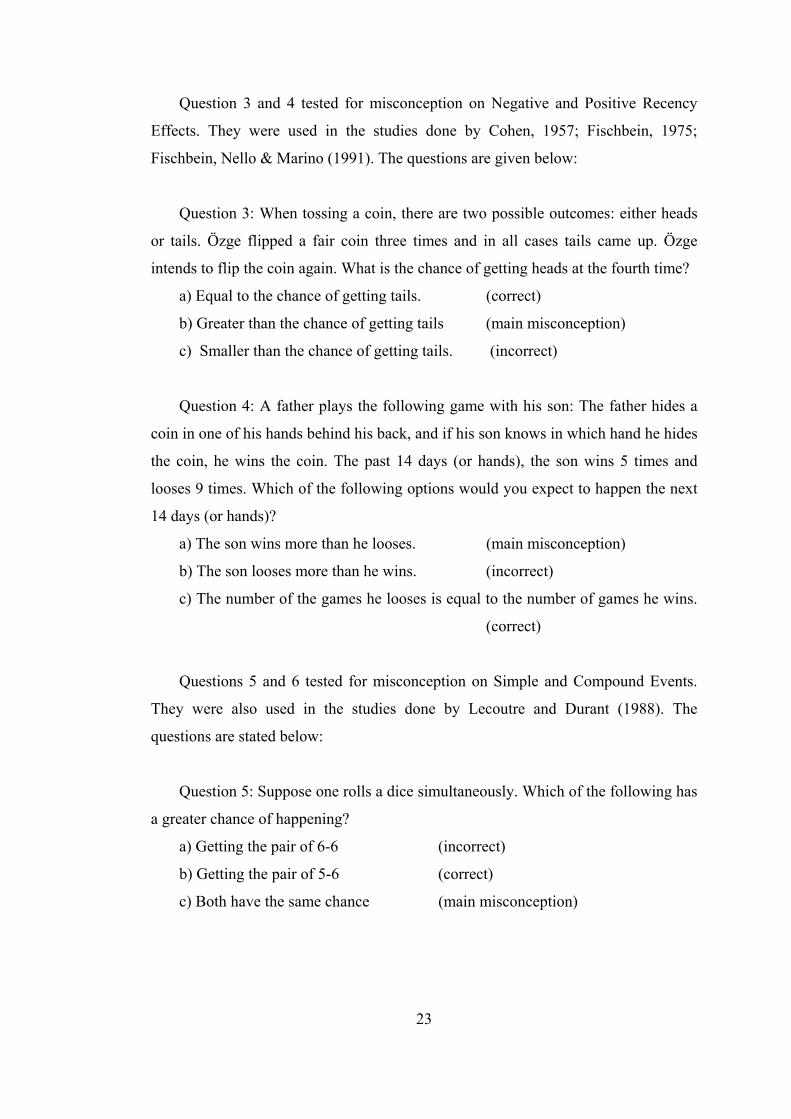
Question 3 and 4 tested for misconception on Negative and Positive Recency
Effects. They were used in the studies done by Cohen, 1957; Fischbein, 1975;
Fischbein, Nello & Marino (1991). The questions are given below:
Question 3: When tossing a coin, there are two possible outcomes: either heads
or tails. Özge flipped a fair coin three times and in all cases tails came up. Özge
intends to flip the coin again. What is the chance of getting heads at the fourth time?
a) Equal to the chance of getting tails. (correct)
b) Greater than the chance of getting tails (main misconception)
c) Smaller than the chance of getting tails. (incorrect)
Question 4: A father plays the following game with his son: The father hides a
coin in one of his hands behind his back, and if his son knows in which hand he hides
the coin, he wins the coin. The past 14 days (or hands), the son wins 5 times and
looses 9 times. Which of the following options would you expect to happen the next
14 days (or hands)?
a) The son wins more than he looses. (main misconception)
b) The son looses more than he wins. (incorrect)
c) The number of the games he looses is equal to the number of games he wins.
(correct)
Questions 5 and 6 tested for misconception on Simple and Compound Events.
They were also used in the studies done by Lecoutre and Durant (1988). The
questions are stated below:
Question 5: Suppose one rolls a dice simultaneously. Which of the following has
a greater chance of happening?
a) Getting the pair of 6-6 (incorrect)
b) Getting the pair of 5-6 (correct)
c) Both have the same chance (main misconception)

24
Question 6: The letters in the word “ÇİÇEK” are written one by one on the
cards and then these cars are placed in a bag. What is the probability of getting the
letter “Ç” from this box at random?
a) 52 (correct)
b) 32 (incorrect)
c) 41 (main misconception)
Questions 7 and 8 tested for misconception on Effect of Sample Size. They were
also used in the studies done by Tversky and Kahneman (1982). The questions are
given below:
Question 7: A doctor keeps the records of newborn babies. According to his
records, the probability of which of the following options is higher?
a) Out of the first 10 babies, the gender of 8 or more of them is
female.(correct)
b) Out of the first 100 babies, the gender of 80 or more of them is
female.(incorrect)
c) The probability of events (a) and (b) is the same.(misconception)
Question 8: The likehood of getting tails at least twice when tossing three coins
is:
a) Smaller than (incorrect)
b) Greater than (correct)
c) Equal to (main misconception)
the likehood of getting tails at least 200 times out of 300 times.
Question 9 tested for the misconception on Conjunction Fallacy. It was used also
in the study done by Shaughnessy, 1992; Tversky & Kahneman(1983). The question
is written below:
25
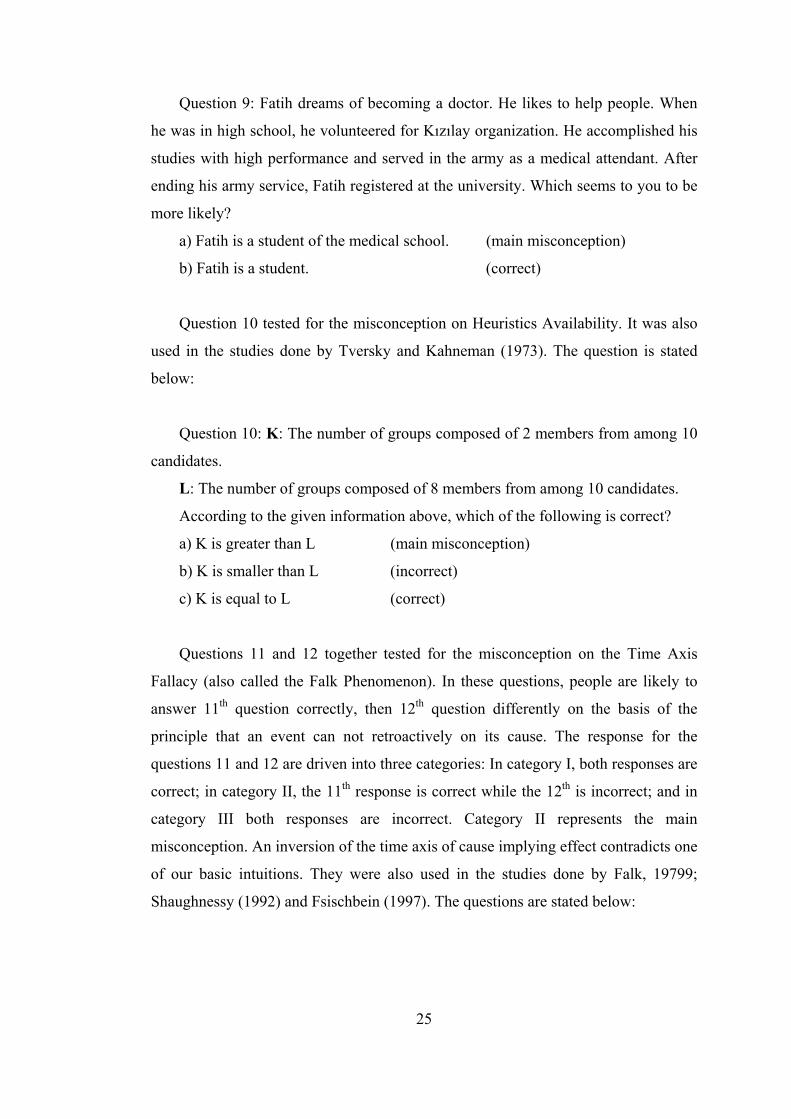
Question 9: Fatih dreams of becoming a doctor. He likes to help people. When
he was in high school, he volunteered for Kızılay organization. He accomplished his
studies with high performance and served in the army as a medical attendant. After
ending his army service, Fatih registered at the university. Which seems to you to be
more likely?
a) Fatih is a student of the medical school. (main misconception)
b) Fatih is a student. (correct)
Question 10 tested for the misconception on Heuristics Availability. It was also
used in the studies done by Tversky and Kahneman (1973). The question is stated
below:
Question 10: K: The number of groups composed of 2 members from among 10
candidates.
L: The number of groups composed of 8 members from among 10 candidates.
According to the given information above, which of the following is correct?
a) K is greater than L (main misconception)
b) K is smaller than L (incorrect)
c) K is equal to L (correct)
Questions 11 and 12 together tested for the misconception on the Time Axis
Fallacy (also called the Falk Phenomenon). In these questions, people are likely to
answer 11th question correctly, then 12th question differently on the basis of the
principle that an event can not retroactively on its cause. The response for the
questions 11 and 12 are driven into three categories: In category I, both responses are
correct; in category II, the 11th response is correct while the 12th is incorrect; and in
category III both responses are incorrect. Category II represents the main
misconception. An inversion of the time axis of cause implying effect contradicts one
of our basic intuitions. They were also used in the studies done by Falk, 19799;
Shaughnessy (1992) and Fsischbein (1997). The questions are stated below:
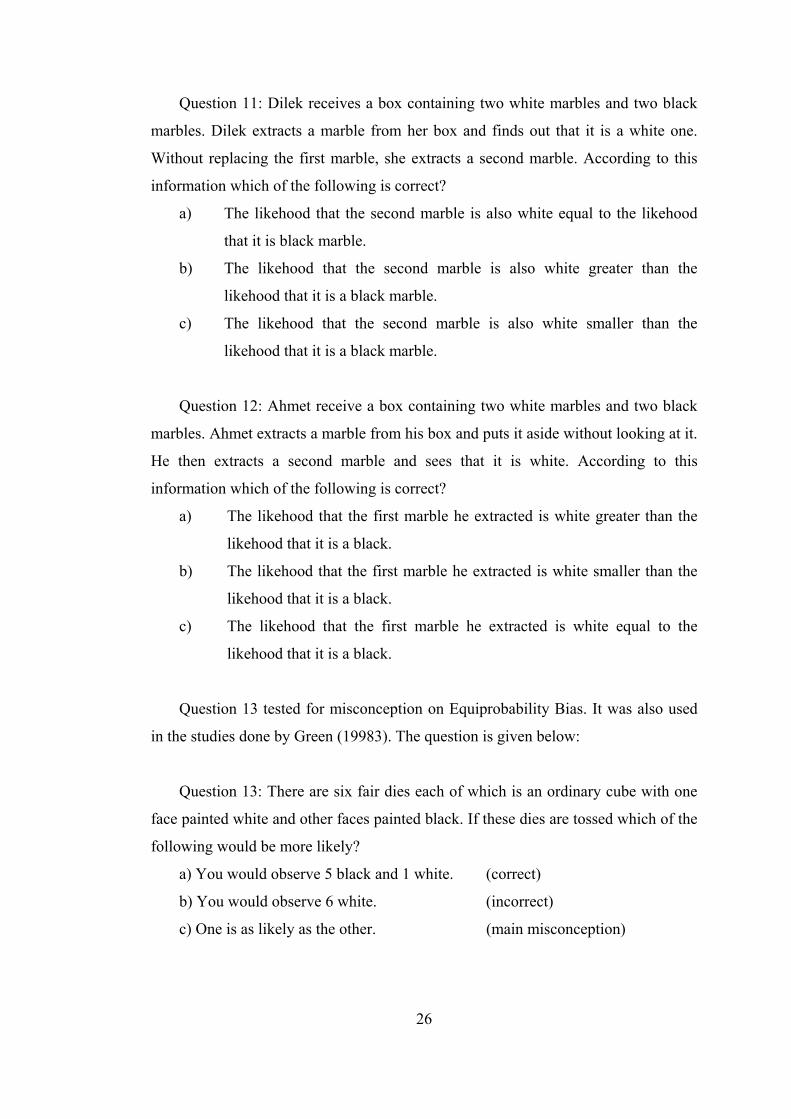
26
Question 11: Dilek receives a box containing two white marbles and two black
marbles. Dilek extracts a marble from her box and finds out that it is a white one.
Without replacing the first marble, she extracts a second marble. According to this
information which of the following is correct?
a) The likehood that the second marble is also white equal to the likehood
that it is black marble.
b) The likehood that the second marble is also white greater than the
likehood that it is a black marble.
c) The likehood that the second marble is also white smaller than the
likehood that it is a black marble.
Question 12: Ahmet receive a box containing two white marbles and two black
marbles. Ahmet extracts a marble from his box and puts it aside without looking at it.
He then extracts a second marble and sees that it is white. According to this
information which of the following is correct?
a) The likehood that the first marble he extracted is white greater than the
likehood that it is a black.
b) The likehood that the first marble he extracted is white smaller than the
likehood that it is a black.
c) The likehood that the first marble he extracted is white equal to the
likehood that it is a black.
Question 13 tested for misconception on Equiprobability Bias. It was also used
in the studies done by Green (19983). The question is given below:
Question 13: There are six fair dies each of which is an ordinary cube with one
face painted white and other faces painted black. If these dies are tossed which of the
following would be more likely?
a) You would observe 5 black and 1 white. (correct)
b) You would observe 6 white. (incorrect)
c) One is as likely as the other. (main misconception)
27
3.7.3 Attitude towards Probability Scale
APS was developed by Bulut and mathematics education students who attended
ScE 352 “Applied Statistics” course at METU in the spring semester of the 1991-
1992 academic year. The scale was presented in the Appendix D.
The scale consisted of 28 items of 15 positive and 13 negative items and it was
scaled on a six-point Likert Type scale: Strongly Agree, Agree, Tend to disagree,
disagree, and Strongly Disagree.
In the present study, the Cronbach Alpha was found as 0.95. The total score of
APS was between 28 and 168.
The scale was used to asses students’ attitude towards probability.
3.7.4 Attitude towards Probability Teaching
APTS was developed by the researcher. The scale was given in the Appendix C.
The scale was used to assess the students’ attitude toward probability learning. The
procedure followed in the development of APTS is outlined below.
The item bank for APTS was derived from:
a) scales of attitudes towards mathematics,
b) observations of people’s attitude toward probability,
c) beliefs about mathematics.
The item bank consisted of 61 items related to attitude toward probability
learning. All items were written in Turkish. From this item bank, 35 items were
selected.
The pilot study of 35 item scale was done with 196 preservice mathematics
teachers from Gazi and Hacettepe Universities in the spring semester of 2002-2003
academic year. It was analyzed by using “Statistical Packages for Social Sciences”
(SPSS). And an 18-item APTS was formed. It consisted of 12 positive items and 6
negative items and was scaled on a five-point Likert Scale: Strongly Agree, Agree,
Neutral, Disagree, and Strongly Disagree. Items were scored starting from strongly
agree as 5, to strongly disagree as 1, and negatively worded items were reversed to a
positive direction for scoring purposes.
28
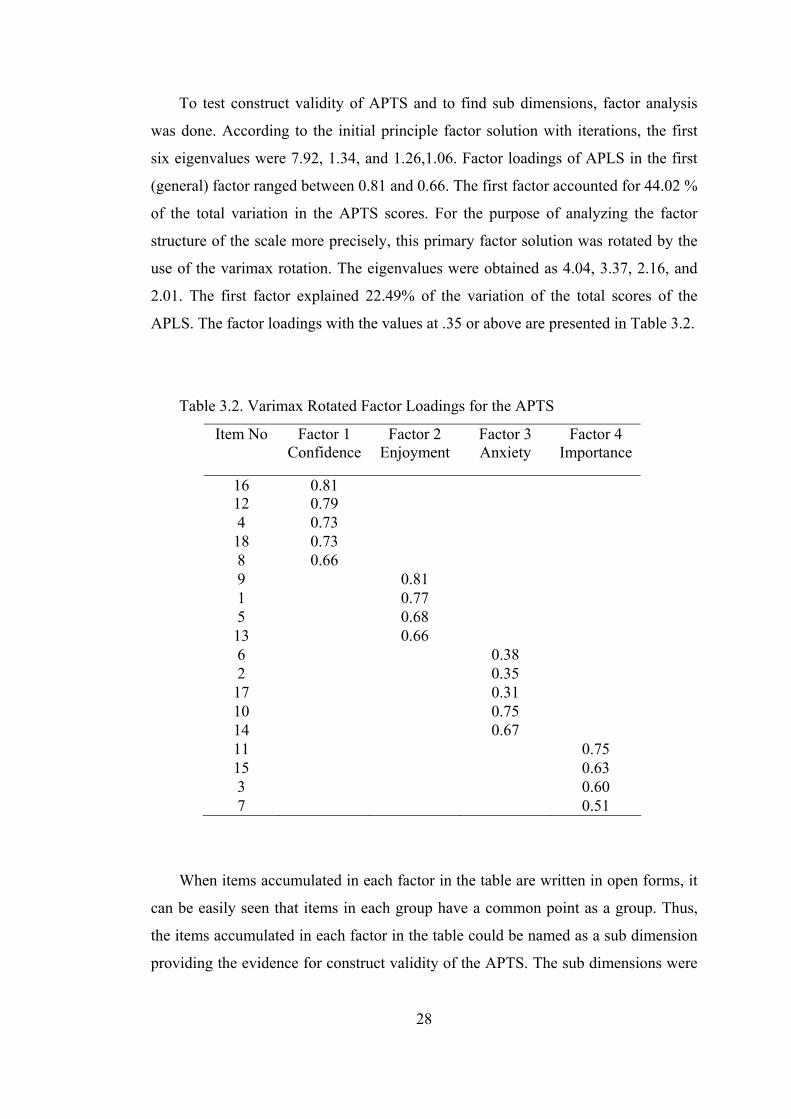
To test construct validity of APTS and to find sub dimensions, factor analysis
was done. According to the initial principle factor solution with iterations, the first
six eigenvalues were 7.92, 1.34, and 1.26,1.06. Factor loadings of APLS in the first
(general) factor ranged between 0.81 and 0.66. The first factor accounted for 44.02 %
of the total variation in the APTS scores. For the purpose of analyzing the factor
structure of the scale more precisely, this primary factor solution was rotated by the
use of the varimax rotation. The eigenvalues were obtained as 4.04, 3.37, 2.16, and
2.01. The first factor explained 22.49% of the variation of the total scores of the
APLS. The factor loadings with the values at .35 or above are presented in Table 3.2.
Table 3.2. Varimax Rotated Factor Loadings for the APTS
Item No
Factor 1 Confidence
Factor 2 Enjoyment
Factor 3 Anxiety
Factor 4 Importance
16 0.81 12 0.79 4 0.73 18 0.73 8 0.66 9 0.81 1 0.77 5 0.68 13 0.66 6 0.38 2 0.35 17 0.31 10 0.75 14 0.67 11 0.75 15 0.63 3 0.60 7 0.51
When items accumulated in each factor in the table are written in open forms, it
can be easily seen that items in each group have a common point as a group. Thus,
the items accumulated in each factor in the table could be named as a sub dimension
providing the evidence for construct validity of the APTS. The sub dimensions were
29
named as confidence, enjoyment, anxiety and importance of probability teaching
respectively.
In the present study, the Cronbach Alpha was found as 0.92.The total score of
APTS was between 18 and 90.
3.7.5 Interview Questions
The researcher thought that a semi-structured interview format with open-ended
questions would yield information needed to answer the research questions.
While preparing the interview structure, the researcher considered the following
issues:
• What questions to ask;
• How to sequence the questions;
• How much detail to solicit;
• How long the interview last;
• How to word the actual questions;
Three sets of interview schedules, one was for probability education background
before university, one was for probability education background during university,
one was for probability teaching as a teacher, were prepared by the researcher
(Appendix E).
The questions were prepared in Turkish and were checked by the expert in terms
of clarity and content-specificity. Some questions were revised, changed or dropped.
After implementing the necessary revisions to instruments, the researcher started
data collection procedure. The researcher and the interviewees decided the interview
calendar. After making appointments with interviewees, the researcher did the
followings in all interviews:
Before the interview started the researcher gave standard information to
interviewees; the purpose of study, who would use the interview data, and recording
technique. All the interviews were tape-recorded. The interviews took 15-20 minutes.
At the end of the interview the researcher thanked for time and effort.
Then the researcher transcribed 200 minutes took interview notes word by word
from tape she had recorded during the interview with the help of transcriber. The

30
researcher generated approximately 30 word-processed pages of raw data. The
transcript was formatted by leaving the left margin as wide as 5 inches in order to
allow sufficient space for writing comments, taking notes and assigning codes for
further analysis.
The data collected through, interviews were analysed by categorizing the data
under themes according to the answers to questions in the interview schedule. For
this purpose, similar responses were grouped and different responses were added.
The frequencies and percentages were drawn from data.
3.8 Procedure
The present study started with a review of literature about the intended
components of the research question. The data collection instruments were selected
and one was developed. Probability Achievement test was changed and Attitude
towards Probability Teaching Scale was developed and both were piloted with
preservice mathematics teachers in June 2002. According to results of the pilot study,
Attitude towards Probability Teaching Scale was revised. After the pilot study, in the
spring semester of 2002-2003 academic year 248 preservice mathematics teachers
from Gazi, Hacettepe and Middle East Technical Universities were administered all
instruments. There were no time limitations. First the two attitude scales were
administered; APS and APTS. then the PAT and PMT were administered
respectively. All necessary instructions were read before administration and
reminded when needed during administration.
Then these 12students were interviewed for 15-30 minutes in a semi structured
interviews.
3.9 Analysis of Data
Data analysis procedure of this study was conducted in the following steps:
• Data collected from subjects were coded and were transferred to computer
environment with MS Excel and SPSS package program.
• Probability of doing Type I error was set at 0.05 level.
31
• Interviews were transcribed.
• Some conclusions were drawn from interviews.
3.10 Assumptions and Limitations
As in other studies there were several assumptions and limitations of the present
study. The main assumptions of the present study were the following:
• The administration of the test and scales were completed under standard
conditions.
• All the subjects of the pilot and experimental studies answered the measuring
instruments accurately and sincerely.
• The students answered the interview questions sincerely.
• There was no interaction between the subjects to affect the results of the
present study.
The followings are the limitations of the present study:
• This study was limited to preservice mathematics students from Gazi,
Hacettepe and Middle East Technical Universities during the spring semester of
2002-2003 academic year.
• Semi structured interview technique which require the subject to respond
truthfully and willingly were used.
32
CHAPTER 4
RESULTS
In the previous chapters, the theoretical background of the study, the review of
related literature and the method of the present study were stated. In this chapter, the
result of the analyses that were conducted to obtain statistical evidence for our claims
would be presented. This chapter contained three sections. The first section contained
the problem of the present study examined by means of associated hypothesis. In the
second section, the analysis of misconceptions with respect to gender was included.
The results of the interview were included in the third section.
The purpose of the present study was to examine the factors affecting preservice
mathematics teachers’ decisions on probability teaching.
4.1. Results of Testing Hypothesis
In this section first sub-problem of the study was examined by means of
associated hypothesis.
The sub-problem of the present study stated as: “How well can preservice
mathematics teachers’ attitude toward probability teaching be explained in terms of
their attitude toward probability, probability achievement and gender.”
For investigating this sub-problem, one hypothesis was stated and was given
below:
The three variables together (preservice mathematics teachers’ attitude
toward probability, probability achievement and gender) do not explain
33
a significant amount of variance in their attitude toward probability
teaching.
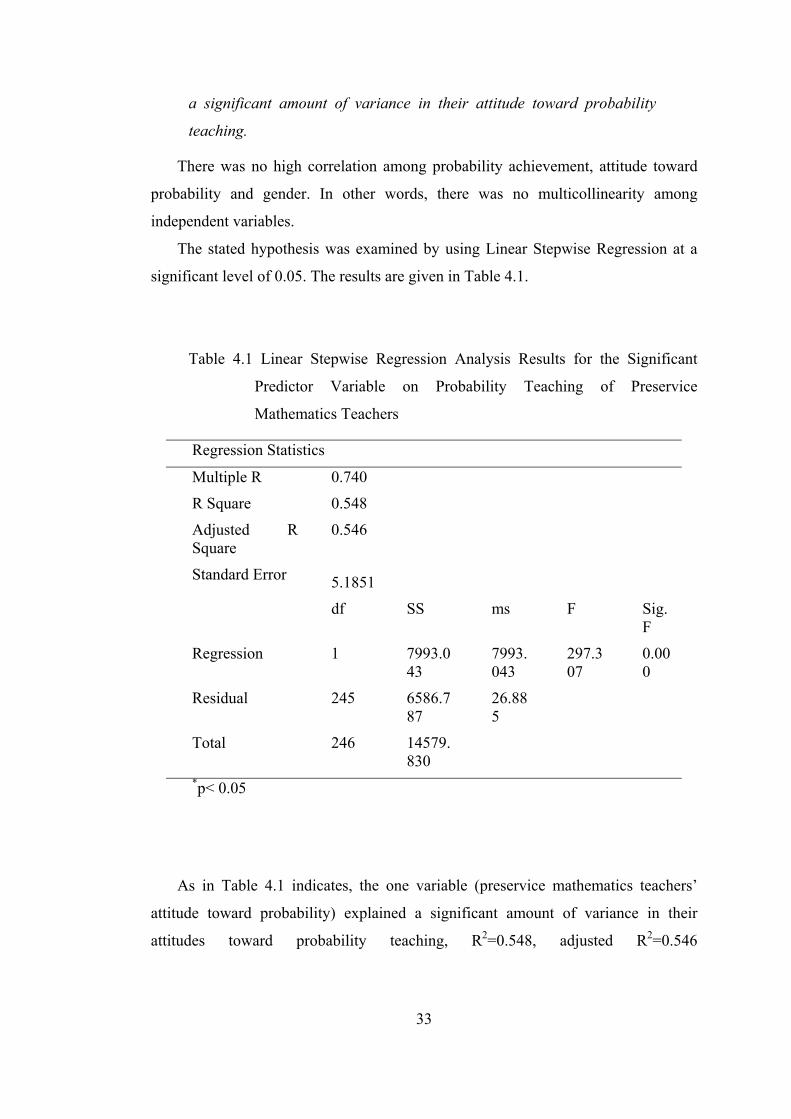
There was no high correlation among probability achievement, attitude toward
probability and gender. In other words, there was no multicollinearity among
independent variables.
The stated hypothesis was examined by using Linear Stepwise Regression at a
significant level of 0.05. The results are given in Table 4.1.
Table 4.1 Linear Stepwise Regression Analysis Results for the Significant
Predictor Variable on Probability Teaching of Preservice
Mathematics Teachers
Regression Statistics
Multiple R
R Square
Adjusted R Square
Standard Error
0.740
0.548
0.546
5.1851
df SS ms F Sig. F
Regression 1 7993.043
7993.043
297.307
0.000
Residual 245 6586.787
26.885
Total 246 14579.830
*p< 0.05
As in Table 4.1 indicates, the one variable (preservice mathematics teachers’
attitude toward probability) explained a significant amount of variance in their
attitudes toward probability teaching, R2=0.548, adjusted R2=0.546
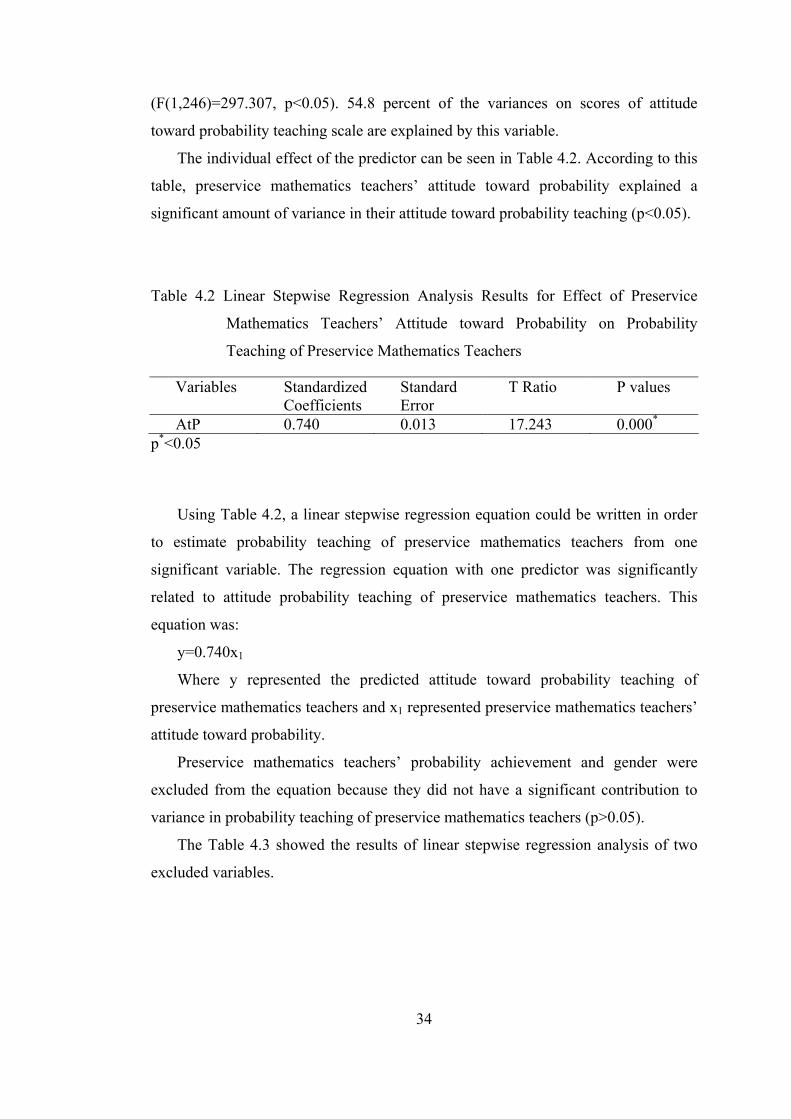
34
(F(1,246)=297.307, p<0.05). 54.8 percent of the variances on scores of attitude
toward probability teaching scale are explained by this variable.
The individual effect of the predictor can be seen in Table 4.2. According to this
table, preservice mathematics teachers’ attitude toward probability explained a
significant amount of variance in their attitude toward probability teaching (p<0.05).
Table 4.2 Linear Stepwise Regression Analysis Results for Effect of Preservice
Mathematics Teachers’ Attitude toward Probability on Probability
Teaching of Preservice Mathematics Teachers
Variables Standardized Coefficients
Standard Error
T Ratio P values
AtP 0.740 0.013 17.243 0.000* p*<0.05
Using Table 4.2, a linear stepwise regression equation could be written in order
to estimate probability teaching of preservice mathematics teachers from one
significant variable. The regression equation with one predictor was significantly
related to attitude probability teaching of preservice mathematics teachers. This
equation was:
y=0.740x1
Where y represented the predicted attitude toward probability teaching of
preservice mathematics teachers and x1 represented preservice mathematics teachers’
attitude toward probability.
Preservice mathematics teachers’ probability achievement and gender were
excluded from the equation because they did not have a significant contribution to
variance in probability teaching of preservice mathematics teachers (p>0.05).
The Table 4.3 showed the results of linear stepwise regression analysis of two
excluded variables.
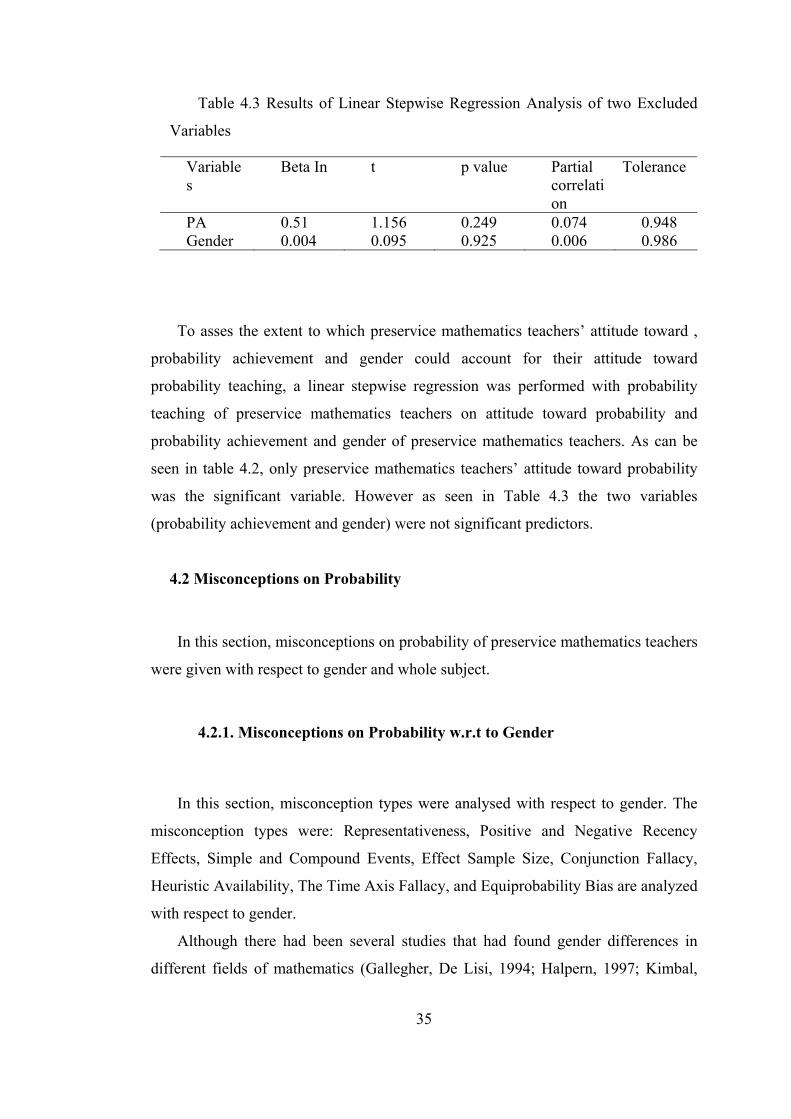
35
Table 4.3 Results of Linear Stepwise Regression Analysis of two Excluded
Variables
Variables
Beta In t p value Partial correlation
Tolerance
PA 0.51 1.156 0.249 0.074 0.948 Gender 0.004 0.095 0.925 0.006 0.986
To asses the extent to which preservice mathematics teachers’ attitude toward ,
probability achievement and gender could account for their attitude toward
probability teaching, a linear stepwise regression was performed with probability
teaching of preservice mathematics teachers on attitude toward probability and
probability achievement and gender of preservice mathematics teachers. As can be
seen in table 4.2, only preservice mathematics teachers’ attitude toward probability
was the significant variable. However as seen in Table 4.3 the two variables
(probability achievement and gender) were not significant predictors.
4.2 Misconceptions on Probability
In this section, misconceptions on probability of preservice mathematics teachers
were given with respect to gender and whole subject.
4.2.1. Misconceptions on Probability w.r.t to Gender
In this section, misconception types were analysed with respect to gender. The
misconception types were: Representativeness, Positive and Negative Recency
Effects, Simple and Compound Events, Effect Sample Size, Conjunction Fallacy,
Heuristic Availability, The Time Axis Fallacy, and Equiprobability Bias are analyzed
with respect to gender.
Although there had been several studies that had found gender differences in
different fields of mathematics (Gallegher, De Lisi, 1994; Halpern, 1997; Kimbal,
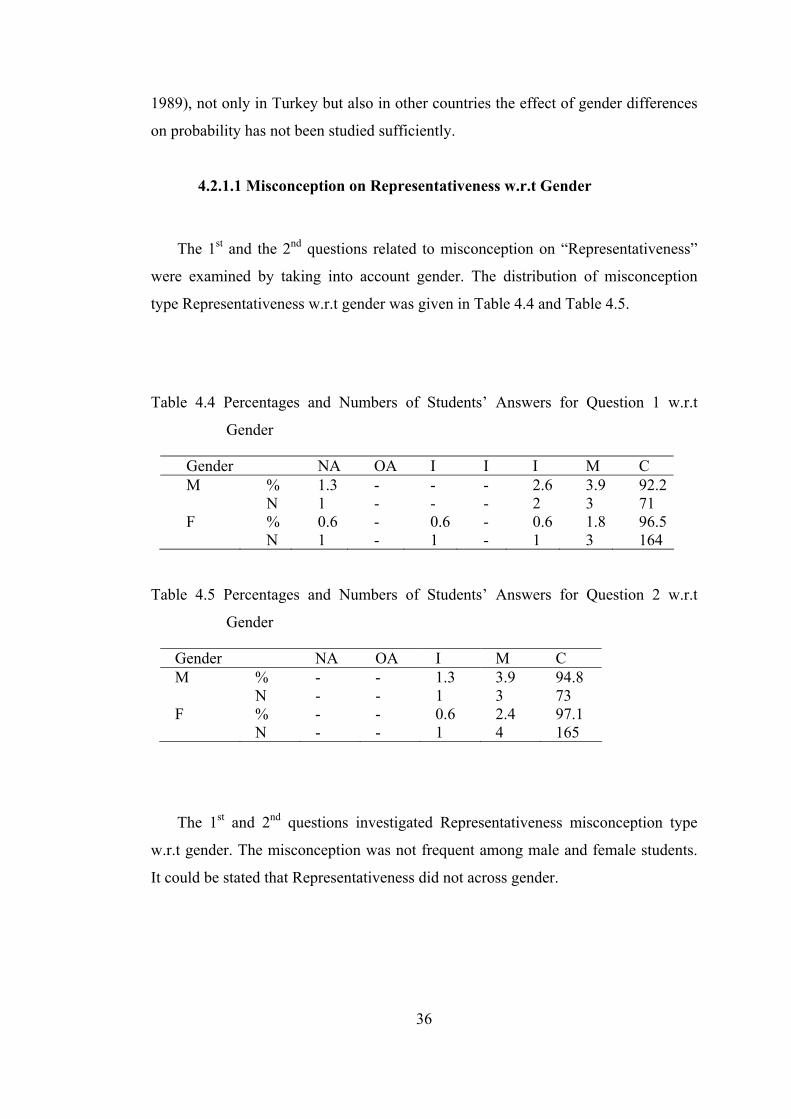
36
1989), not only in Turkey but also in other countries the effect of gender differences
on probability has not been studied sufficiently.
4.2.1.1 Misconception on Representativeness w.r.t Gender
The 1st and the 2nd questions related to misconception on “Representativeness”
were examined by taking into account gender. The distribution of misconception
type Representativeness w.r.t gender was given in Table 4.4 and Table 4.5.
Table 4.4 Percentages and Numbers of Students’ Answers for Question 1 w.r.t
Gender
Gender NA OA I I I M C M % 1.3 - - - 2.6 3.9 92.2 N 1 - - - 2 3 71 F % 0.6 - 0.6 - 0.6 1.8 96.5 N 1 - 1 - 1 3 164
Table 4.5 Percentages and Numbers of Students’ Answers for Question 2 w.r.t
Gender
Gender NA OA I M C M % - - 1.3 3.9 94.8 N - - 1 3 73 F % - - 0.6 2.4 97.1 N - - 1 4 165
The 1st and 2nd questions investigated Representativeness misconception type
w.r.t gender. The misconception was not frequent among male and female students.
It could be stated that Representativeness did not across gender.
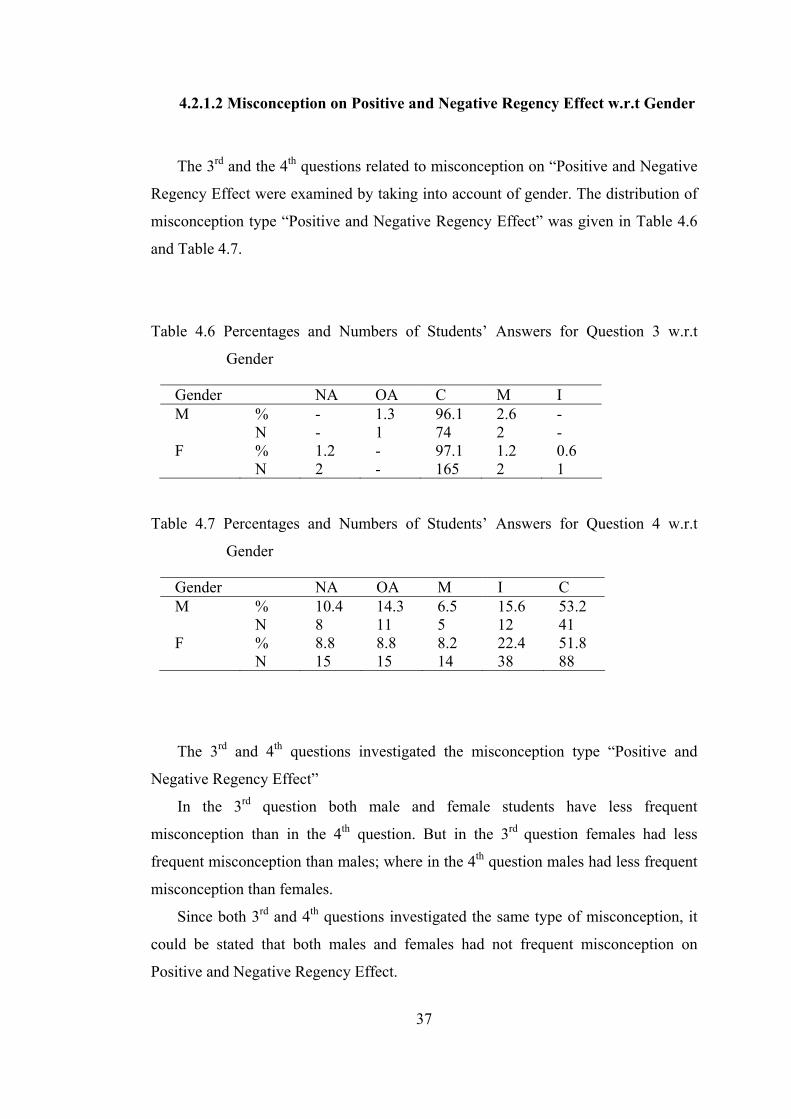
37
4.2.1.2 Misconception on Positive and Negative Regency Effect w.r.t Gender
The 3rd and the 4th questions related to misconception on “Positive and Negative
Regency Effect were examined by taking into account of gender. The distribution of
misconception type “Positive and Negative Regency Effect” was given in Table 4.6
and Table 4.7.
Table 4.6 Percentages and Numbers of Students’ Answers for Question 3 w.r.t
Gender
Gender NA OA C M I M % - 1.3 96.1 2.6 - N - 1 74 2 - F % 1.2 - 97.1 1.2 0.6 N 2 - 165 2 1
Table 4.7 Percentages and Numbers of Students’ Answers for Question 4 w.r.t
Gender
Gender NA OA M I C M % 10.4 14.3 6.5 15.6 53.2 N 8 11 5 12 41 F % 8.8 8.8 8.2 22.4 51.8 N 15 15 14 38 88
The 3rd and 4th questions investigated the misconception type “Positive and
Negative Regency Effect”
In the 3rd question both male and female students have less frequent
misconception than in the 4th question. But in the 3rd question females had less
frequent misconception than males; where in the 4th question males had less frequent
misconception than females.
Since both 3rd and 4th questions investigated the same type of misconception, it
could be stated that both males and females had not frequent misconception on
Positive and Negative Regency Effect.
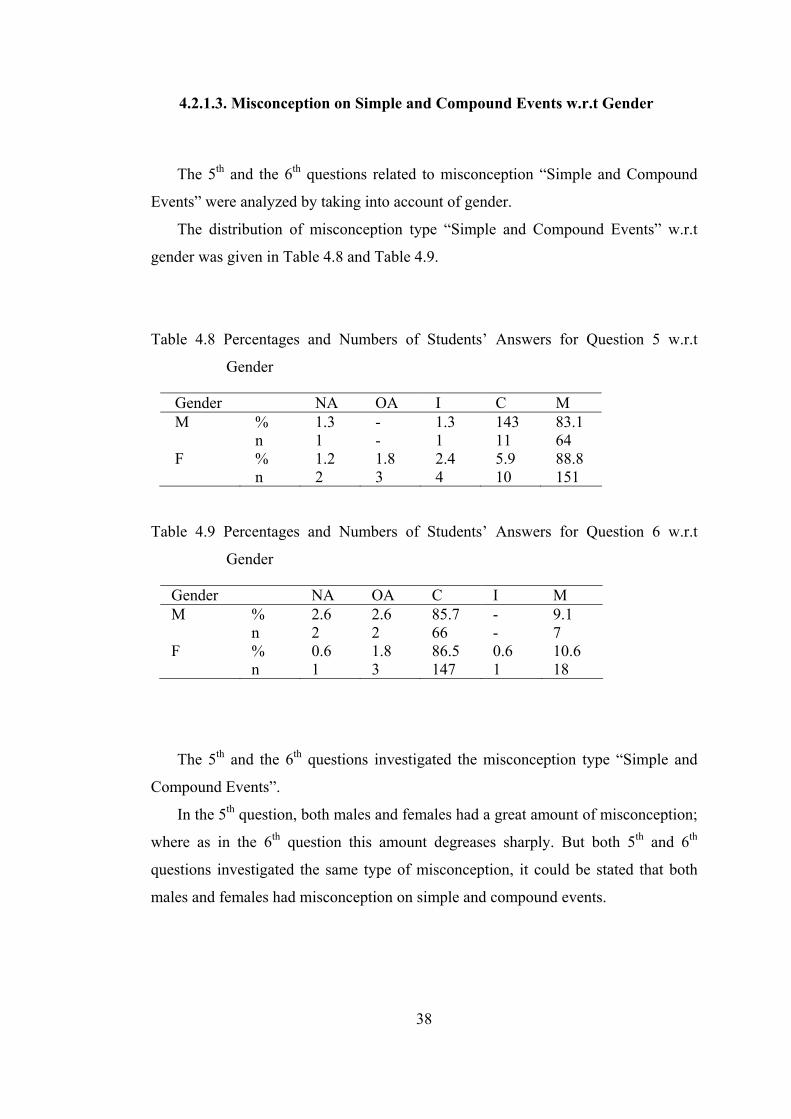
38
4.2.1.3. Misconception on Simple and Compound Events w.r.t Gender
The 5th and the 6th questions related to misconception “Simple and Compound
Events” were analyzed by taking into account of gender.
The distribution of misconception type “Simple and Compound Events” w.r.t
gender was given in Table 4.8 and Table 4.9.
Table 4.8 Percentages and Numbers of Students’ Answers for Question 5 w.r.t
Gender
Gender NA OA I C M M % 1.3 - 1.3 143 83.1 n 1 - 1 11 64 F % 1.2 1.8 2.4 5.9 88.8 n 2 3 4 10 151
Table 4.9 Percentages and Numbers of Students’ Answers for Question 6 w.r.t
Gender
Gender NA OA C I M M % 2.6 2.6 85.7 - 9.1 n 2 2 66 - 7 F % 0.6 1.8 86.5 0.6 10.6 n 1 3 147 1 18
The 5th and the 6th questions investigated the misconception type “Simple and
Compound Events”.
In the 5th question, both males and females had a great amount of misconception;
where as in the 6th question this amount degreases sharply. But both 5th and 6th
questions investigated the same type of misconception, it could be stated that both
males and females had misconception on simple and compound events.
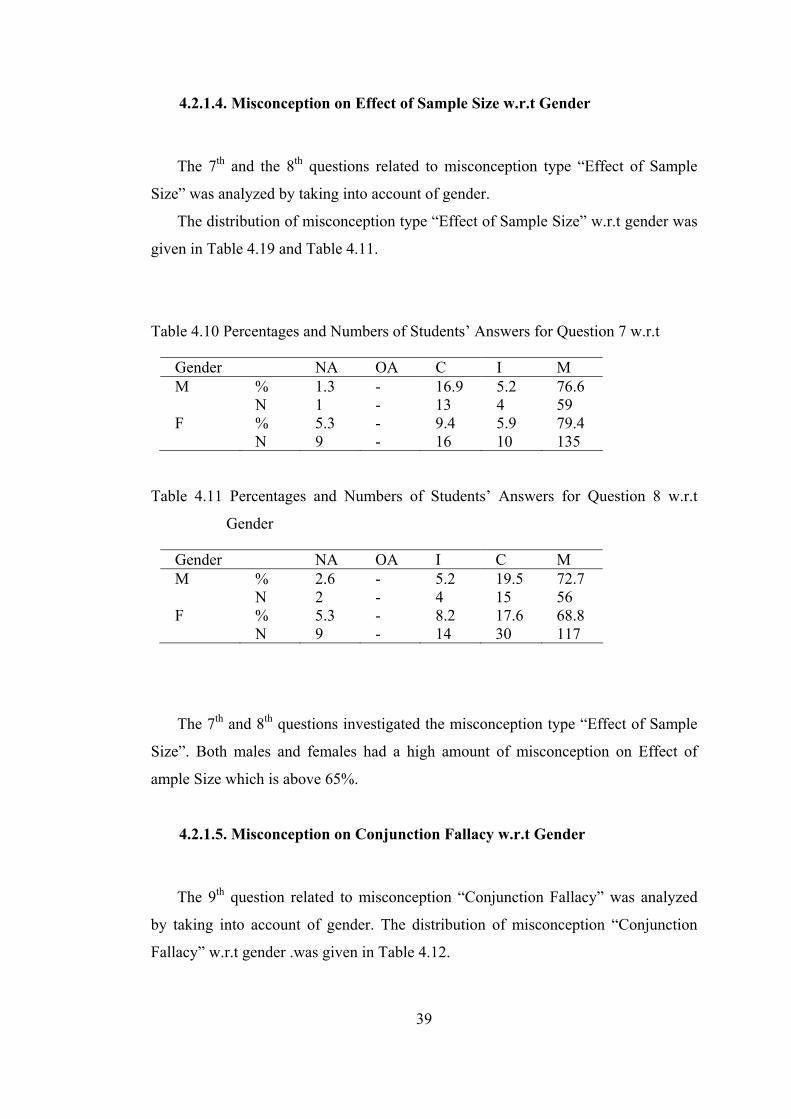
39
4.2.1.4. Misconception on Effect of Sample Size w.r.t Gender
The 7th and the 8th questions related to misconception type “Effect of Sample
Size” was analyzed by taking into account of gender.
The distribution of misconception type “Effect of Sample Size” w.r.t gender was
given in Table 4.19 and Table 4.11.
Table 4.10 Percentages and Numbers of Students’ Answers for Question 7 w.r.t
Gender NA OA C I M M % 1.3 - 16.9 5.2 76.6 N 1 - 13 4 59 F % 5.3 - 9.4 5.9 79.4 N 9 - 16 10 135
Table 4.11 Percentages and Numbers of Students’ Answers for Question 8 w.r.t
Gender
Gender NA OA I C M M % 2.6 - 5.2 19.5 72.7 N 2 - 4 15 56 F % 5.3 - 8.2 17.6 68.8 N 9 - 14 30 117
The 7th and 8th questions investigated the misconception type “Effect of Sample
Size”. Both males and females had a high amount of misconception on Effect of
ample Size which is above 65%.
4.2.1.5. Misconception on Conjunction Fallacy w.r.t Gender
The 9th question related to misconception “Conjunction Fallacy” was analyzed
by taking into account of gender. The distribution of misconception “Conjunction
Fallacy” w.r.t gender .was given in Table 4.12.
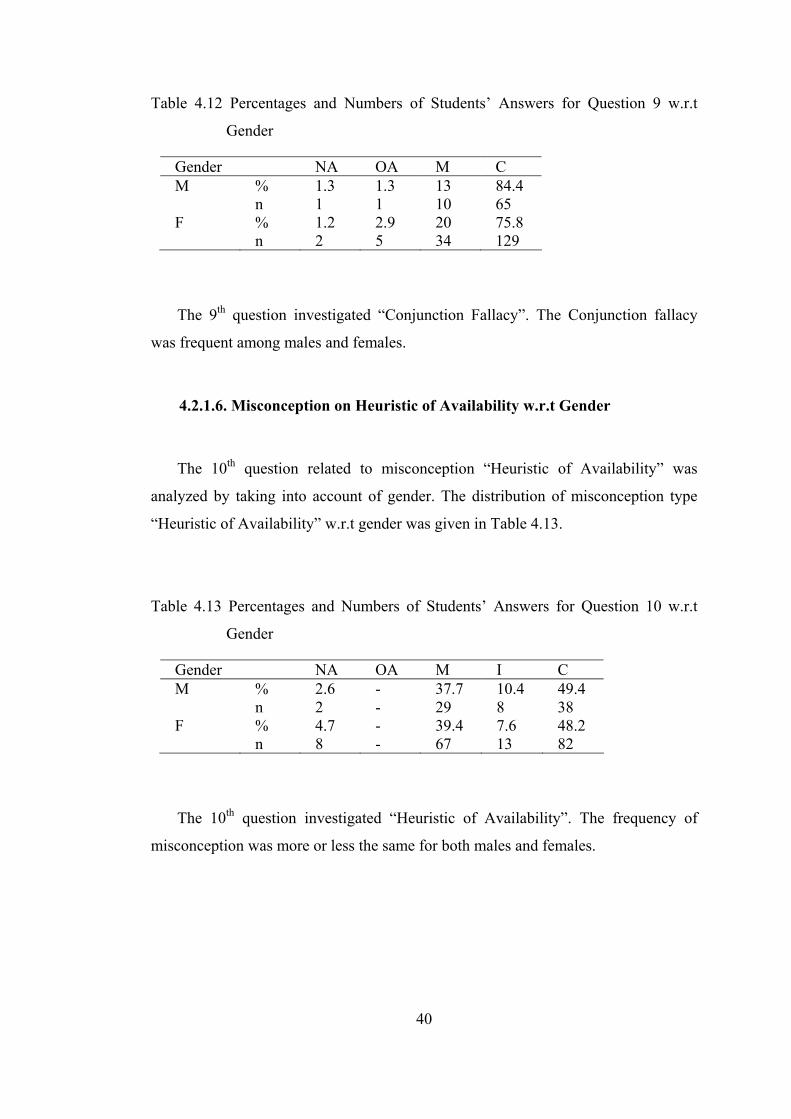
40
Table 4.12 Percentages and Numbers of Students’ Answers for Question 9 w.r.t
Gender
Gender NA OA M C M % 1.3 1.3 13 84.4 n 1 1 10 65 F % 1.2 2.9 20 75.8 n 2 5 34 129
The 9th question investigated “Conjunction Fallacy”. The Conjunction fallacy
was frequent among males and females.
4.2.1.6. Misconception on Heuristic of Availability w.r.t Gender
The 10th question related to misconception “Heuristic of Availability” was
analyzed by taking into account of gender. The distribution of misconception type
“Heuristic of Availability” w.r.t gender was given in Table 4.13.
Table 4.13 Percentages and Numbers of Students’ Answers for Question 10 w.r.t
Gender
Gender NA OA M I C M % 2.6 - 37.7 10.4 49.4 n 2 - 29 8 38 F % 4.7 - 39.4 7.6 48.2 n 8 - 67 13 82
The 10th question investigated “Heuristic of Availability”. The frequency of
misconception was more or less the same for both males and females.
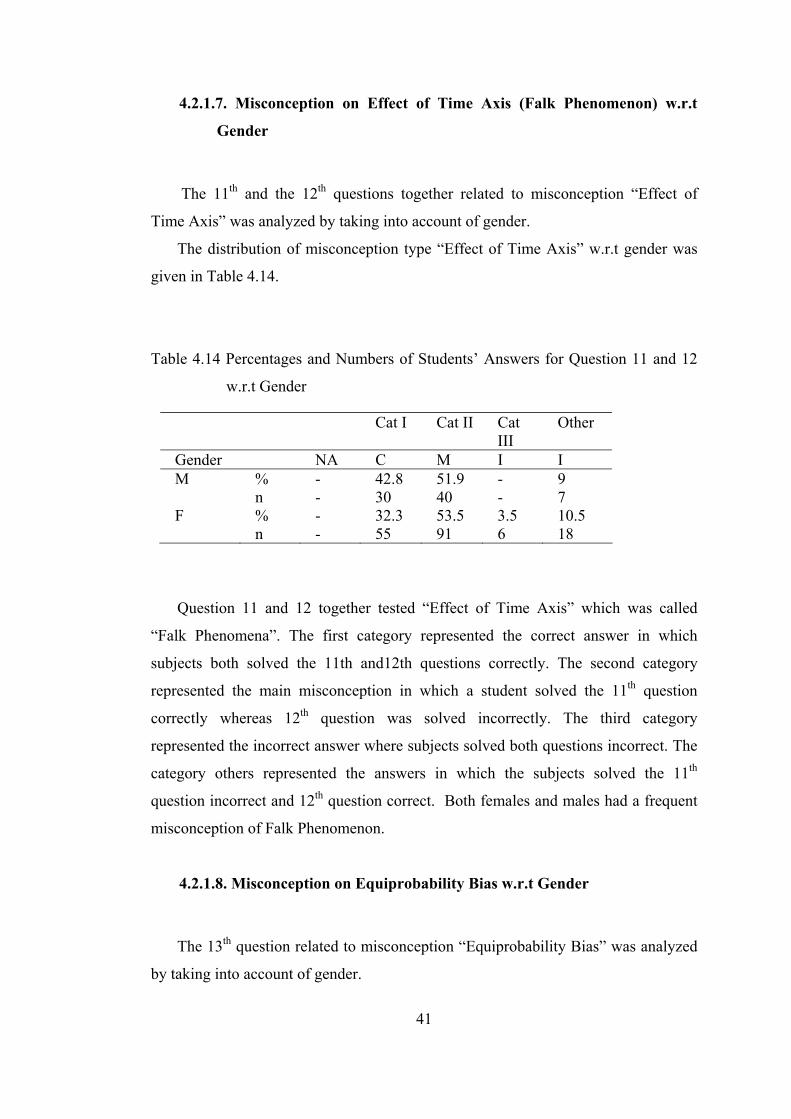
41
4.2.1.7. Misconception on Effect of Time Axis (Falk Phenomenon) w.r.t
Gender
The 11th and the 12th questions together related to misconception “Effect of
Time Axis” was analyzed by taking into account of gender.
The distribution of misconception type “Effect of Time Axis” w.r.t gender was
given in Table 4.14.
Table 4.14 Percentages and Numbers of Students’ Answers for Question 11 and 12
w.r.t Gender
Cat I Cat II Cat III
Other
Gender NA C M I I M % - 42.8 51.9 - 9 n - 30 40 - 7 F % - 32.3 53.5 3.5 10.5 n - 55 91 6 18
Question 11 and 12 together tested “Effect of Time Axis” which was called
“Falk Phenomena”. The first category represented the correct answer in which
subjects both solved the 11th and12th questions correctly. The second category
represented the main misconception in which a student solved the 11th question
correctly whereas 12th question was solved incorrectly. The third category
represented the incorrect answer where subjects solved both questions incorrect. The
category others represented the answers in which the subjects solved the 11th
question incorrect and 12th question correct. Both females and males had a frequent
misconception of Falk Phenomenon.
4.2.1.8. Misconception on Equiprobability Bias w.r.t Gender
The 13th question related to misconception “Equiprobability Bias” was analyzed
by taking into account of gender.
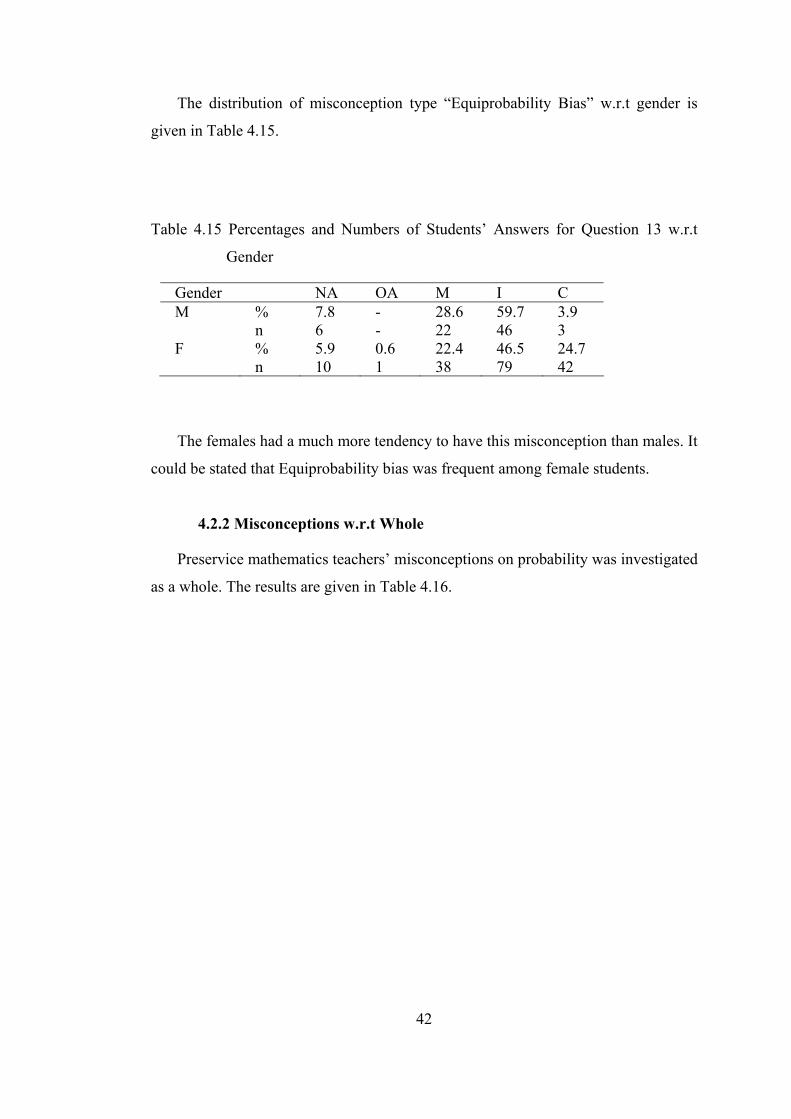
42
The distribution of misconception type “Equiprobability Bias” w.r.t gender is
given in Table 4.15.
Table 4.15 Percentages and Numbers of Students’ Answers for Question 13 w.r.t
Gender
Gender NA OA M I C M % 7.8 - 28.6 59.7 3.9 n 6 - 22 46 3 F % 5.9 0.6 22.4 46.5 24.7 n 10 1 38 79 42
The females had a much more tendency to have this misconception than males. It
could be stated that Equiprobability bias was frequent among female students.
4.2.2 Misconceptions w.r.t Whole
Preservice mathematics teachers’ misconceptions on probability was investigated
as a whole. The results are given in Table 4.16.
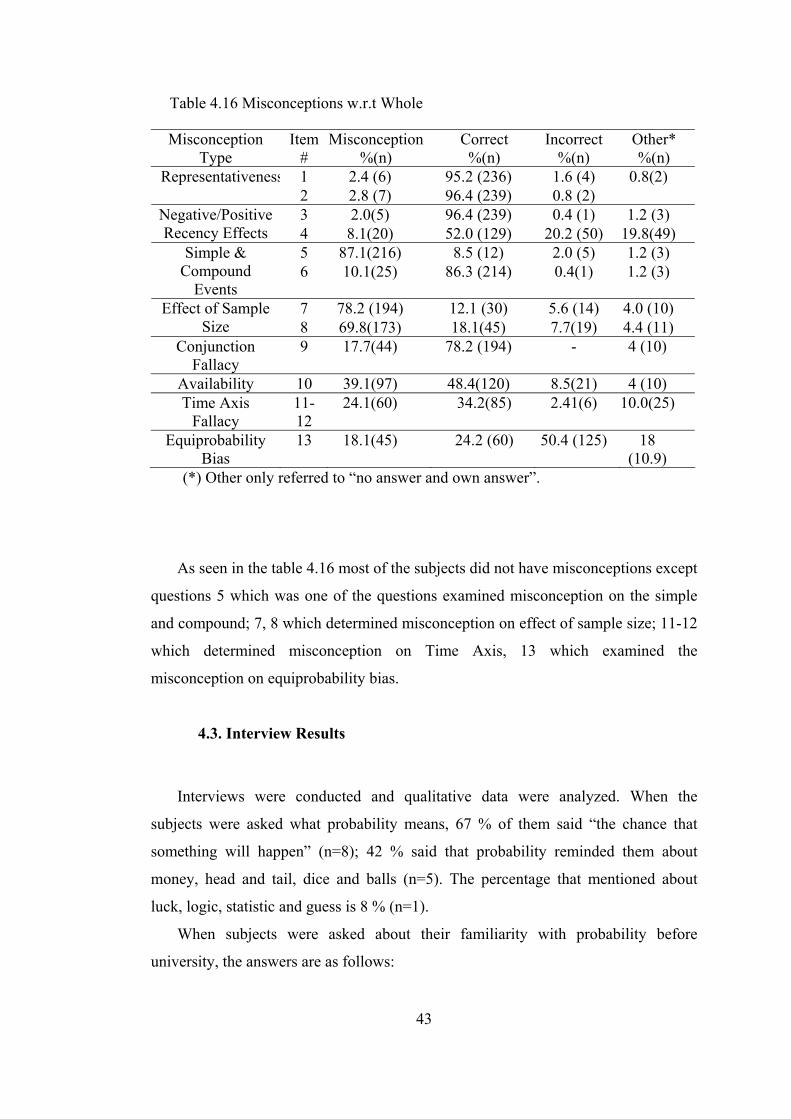
43
Table 4.16 Misconceptions w.r.t Whole
Misconception Type
Item #
Misconception %(n)
Correct %(n)
Incorrect %(n)
Other* %(n)
1 2.4 (6) 95.2 (236) 1.6 (4) 0.8(2) Representativeness2 2.8 (7) 96.4 (239) 0.8 (2) 3 2.0(5) 96.4 (239) 0.4 (1) 1.2 (3) Negative/Positive
Recency Effects 4 8.1(20) 52.0 (129) 20.2 (50) 19.8(49) 5 87.1(216) 8.5 (12) 2.0 (5) 1.2 (3) Simple &
Compound Events
6 10.1(25) 86.3 (214) 0.4(1) 1.2 (3)
7 78.2 (194) 12.1 (30) 5.6 (14) 4.0 (10) Effect of Sample Size 8 69.8(173) 18.1(45) 7.7(19) 4.4 (11)
Conjunction Fallacy
9 17.7(44) 78.2 (194) - 4 (10)
Availability 10 39.1(97) 48.4(120) 8.5(21) 4 (10) Time Axis
Fallacy 11-12
24.1(60) 34.2(85) 2.41(6) 10.0(25)
Equiprobability Bias
13 18.1(45) 24.2 (60) 50.4 (125) 18 (10.9)
(*) Other only referred to “no answer and own answer”.
As seen in the table 4.16 most of the subjects did not have misconceptions except
questions 5 which was one of the questions examined misconception on the simple
and compound; 7, 8 which determined misconception on effect of sample size; 11-12
which determined misconception on Time Axis, 13 which examined the
misconception on equiprobability bias.
4.3. Interview Results
Interviews were conducted and qualitative data were analyzed. When the
subjects were asked what probability means, 67 % of them said “the chance that
something will happen” (n=8); 42 % said that probability reminded them about
money, head and tail, dice and balls (n=5). The percentage that mentioned about
luck, logic, statistic and guess is 8 % (n=1).
When subjects were asked about their familiarity with probability before
university, the answers are as follows:
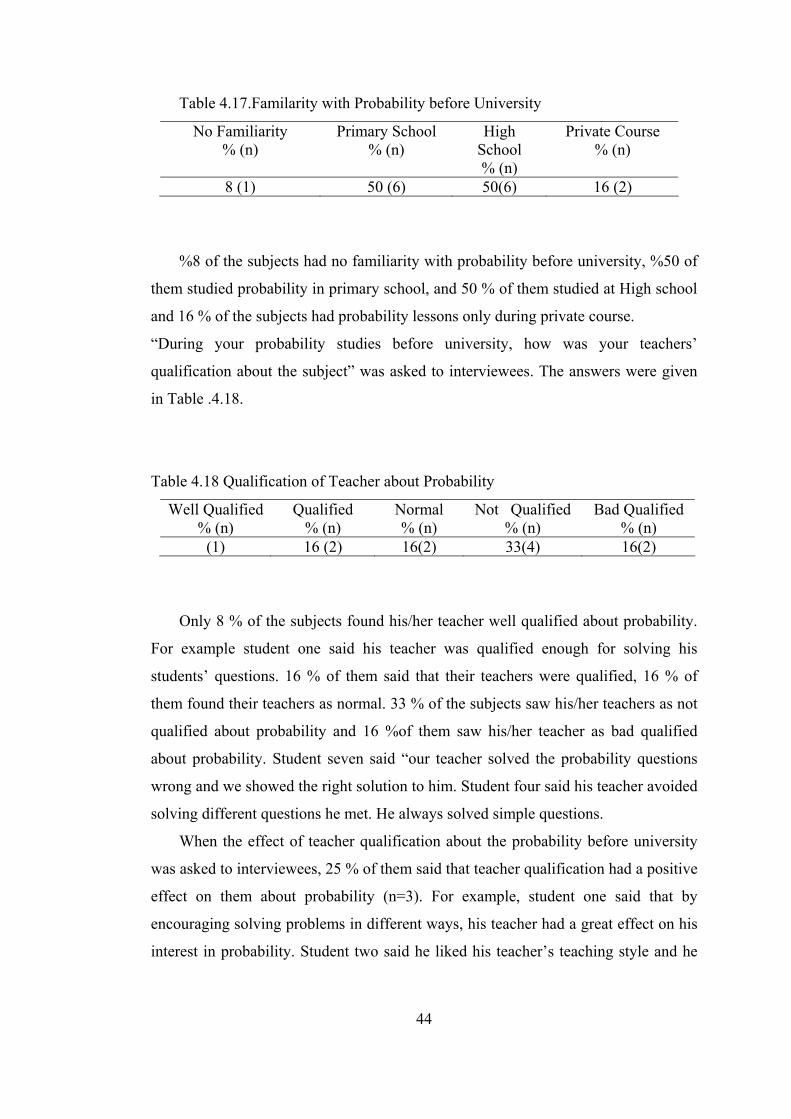
44
Table 4.17.Familarity with Probability before University
No Familiarity % (n)
Primary School % (n)
High School % (n)
Private Course % (n)
8 (1) 50 (6) 50(6) 16 (2)
%8 of the subjects had no familiarity with probability before university, %50 of
them studied probability in primary school, and 50 % of them studied at High school
and 16 % of the subjects had probability lessons only during private course.
“During your probability studies before university, how was your teachers’
qualification about the subject” was asked to interviewees. The answers were given
in Table .4.18.
Table 4.18 Qualification of Teacher about Probability
Well Qualified % (n)
Qualified % (n)
Normal % (n)
Not Qualified % (n)
Bad Qualified % (n)
(1) 16 (2) 16(2) 33(4) 16(2)
Only 8 % of the subjects found his/her teacher well qualified about probability.
For example student one said his teacher was qualified enough for solving his
students’ questions. 16 % of them said that their teachers were qualified, 16 % of
them found their teachers as normal. 33 % of the subjects saw his/her teachers as not
qualified about probability and 16 %of them saw his/her teacher as bad qualified
about probability. Student seven said “our teacher solved the probability questions
wrong and we showed the right solution to him. Student four said his teacher avoided
solving different questions he met. He always solved simple questions.
When the effect of teacher qualification about the probability before university
was asked to interviewees, 25 % of them said that teacher qualification had a positive
effect on them about probability (n=3). For example, student one said that by
encouraging solving problems in different ways, his teacher had a great effect on his
interest in probability. Student two said he liked his teacher’s teaching style and he

45
learnt a lot from him, at least he learnt enough to solve questions about probability at
university entrance examination. 16 % of the subjects believed that their teacher had
an effect on their probability learning (n=2). Student six said “My teacher is bad
qualified, so I did not get interested in probability.” 16 % of the subjects believed
that their teachers’ qualification had no effect during their probability learning (n=2).
Beside the effect of teacher qualification, the interviewees were asked how their
teachers’ attitude toward probability was; 33 % subjects said their teacher had a
positive attitude toward probability (n=4). Student one said “I saw my teacher gave
more importance to probability than to other subjects”. And also student two
believed that his teacher’s attitude was positive. 8 %subjects believed that his/her
teachers’ attitude was notr( n=1). Student twelve said “My teacher’s teaching style
was the same for all subjects”. 41 % of subjects believed that their teachers had
negative attitudes toward probability (n=5). Student four said that his teacher
bewared of probability. Student five said that his teacher did not give importance to
probability. Student six said that his teacher disliked probability.
When the interviewees’ attitudes toward probability learning before university
was asked, 50 % of them had positive attitude (n=6), 16 % of them had negative
attitude toward probability learning (n=2). For example student one said “My attitude
was always positive” and student two said “Since it requires complex thinking, I had
always a positive attitude”. Among the subjects who had negative attitude toward
probability learning before university, student five said “I do not want to learn”,
student twelve said “I never think that it is a very enjoyable subject to learn” and
student five said he learnt by memorizing and he did not want to learn probability so
he memorized.
The next question was how probability is taught before university, 83 % of
subjects of the interviewees complained about how probability was taught (n=10).
Student five said that the subject was not thought in detail. Student six said that their
teacher did not solve anything different from the book. He added that his teacher did
not give daily examples and did not do anything to take his interest. Student four said
they solved the same classical examples all the time. 16 % subjects said that basic
terms were given in detail and materials were used to get rid of abstract structure of
probability (n=2).
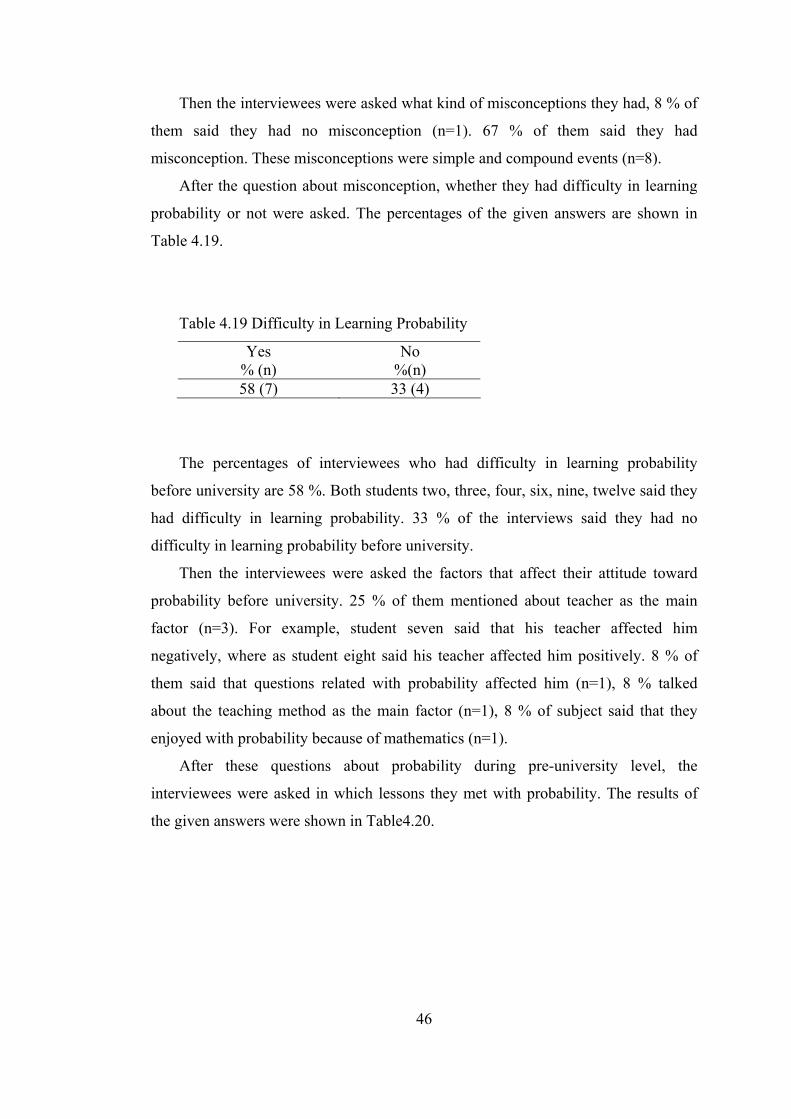
46
Then the interviewees were asked what kind of misconceptions they had, 8 % of
them said they had no misconception (n=1). 67 % of them said they had
misconception. These misconceptions were simple and compound events (n=8).
After the question about misconception, whether they had difficulty in learning
probability or not were asked. The percentages of the given answers are shown in
Table 4.19.
Table 4.19 Difficulty in Learning Probability
Yes % (n)
No %(n)
58 (7) 33 (4)
The percentages of interviewees who had difficulty in learning probability
before university are 58 %. Both students two, three, four, six, nine, twelve said they
had difficulty in learning probability. 33 % of the interviews said they had no
difficulty in learning probability before university.
Then the interviewees were asked the factors that affect their attitude toward
probability before university. 25 % of them mentioned about teacher as the main
factor (n=3). For example, student seven said that his teacher affected him
negatively, where as student eight said his teacher affected him positively. 8 % of
them said that questions related with probability affected him (n=1), 8 % talked
about the teaching method as the main factor (n=1), 8 % of subject said that they
enjoyed with probability because of mathematics (n=1).
After these questions about probability during pre-university level, the
interviewees were asked in which lessons they met with probability. The results of
the given answers were shown in Table4.20.
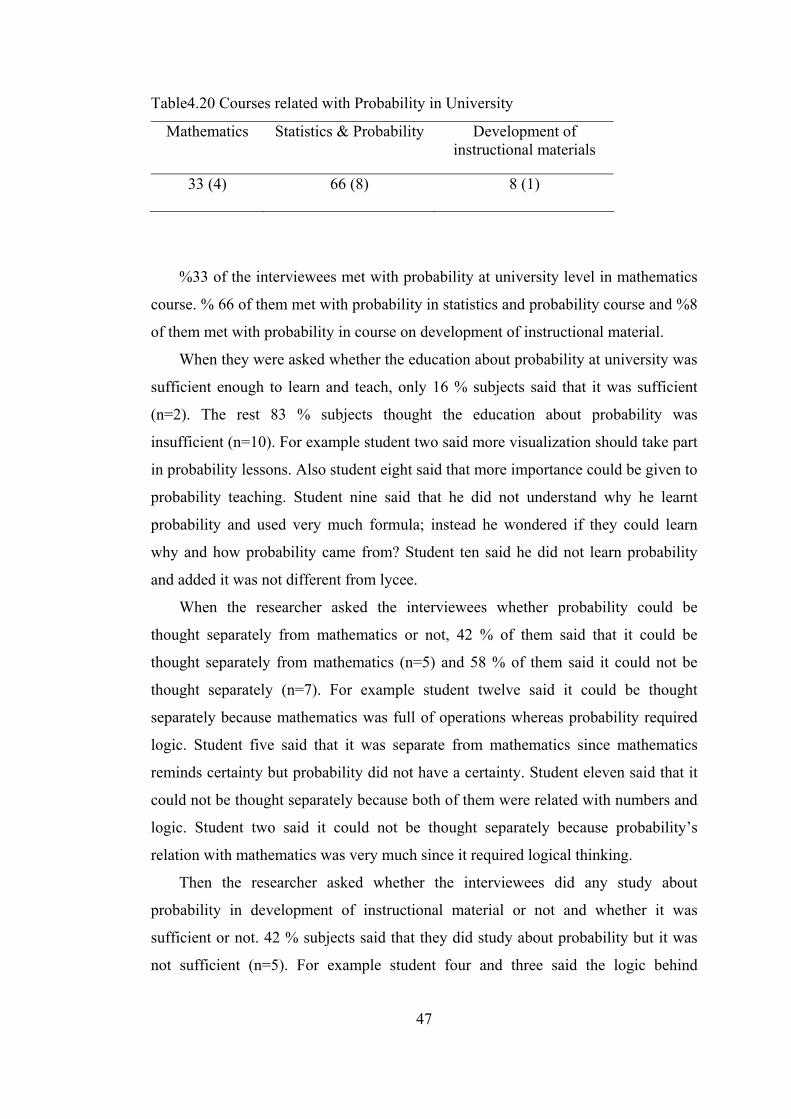
47
Table4.20 Courses related with Probability in University
Mathematics Statistics & Probability Development of instructional materials
33 (4) 66 (8) 8 (1)
%33 of the interviewees met with probability at university level in mathematics
course. % 66 of them met with probability in statistics and probability course and %8
of them met with probability in course on development of instructional material.
When they were asked whether the education about probability at university was
sufficient enough to learn and teach, only 16 % subjects said that it was sufficient
(n=2). The rest 83 % subjects thought the education about probability was
insufficient (n=10). For example student two said more visualization should take part
in probability lessons. Also student eight said that more importance could be given to
probability teaching. Student nine said that he did not understand why he learnt
probability and used very much formula; instead he wondered if they could learn
why and how probability came from? Student ten said he did not learn probability
and added it was not different from lycee.
When the researcher asked the interviewees whether probability could be
thought separately from mathematics or not, 42 % of them said that it could be
thought separately from mathematics (n=5) and 58 % of them said it could not be
thought separately (n=7). For example student twelve said it could be thought
separately because mathematics was full of operations whereas probability required
logic. Student five said that it was separate from mathematics since mathematics
reminds certainty but probability did not have a certainty. Student eleven said that it
could not be thought separately because both of them were related with numbers and
logic. Student two said it could not be thought separately because probability’s
relation with mathematics was very much since it required logical thinking.
Then the researcher asked whether the interviewees did any study about
probability in development of instructional material or not and whether it was
sufficient or not. 42 % subjects said that they did study about probability but it was
not sufficient (n=5). For example student four and three said the logic behind
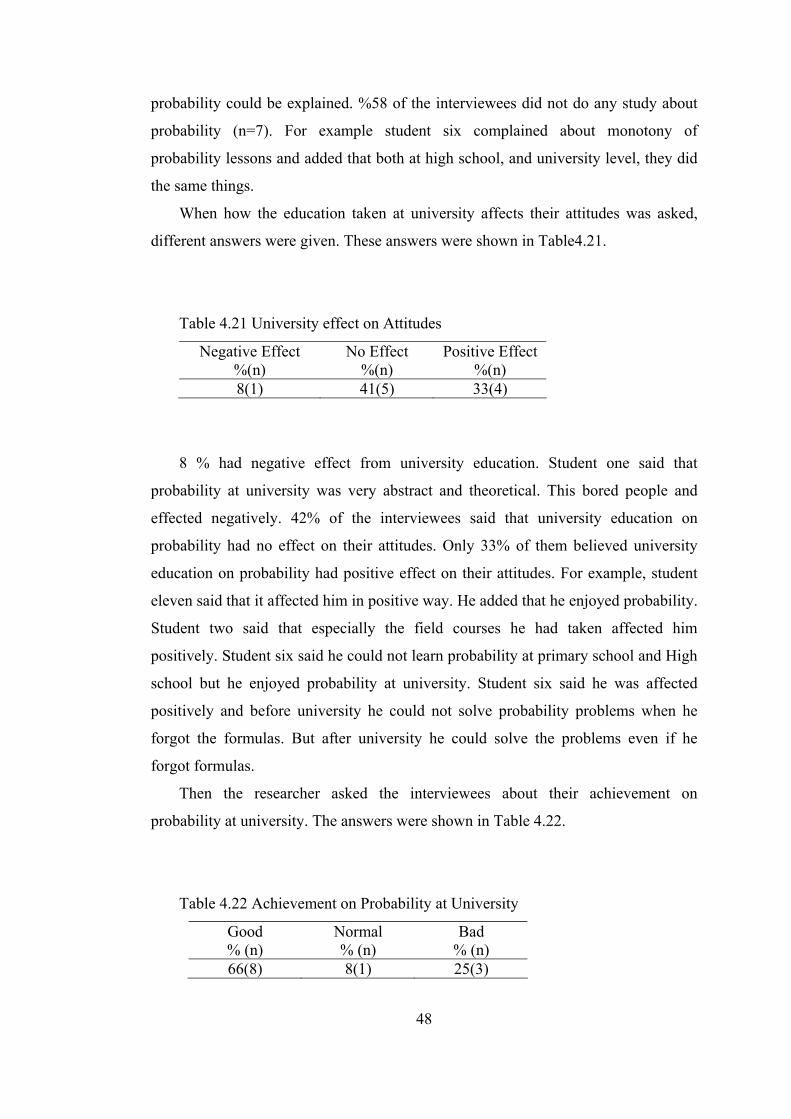
48
probability could be explained. %58 of the interviewees did not do any study about
probability (n=7). For example student six complained about monotony of
probability lessons and added that both at high school, and university level, they did
the same things.
When how the education taken at university affects their attitudes was asked,
different answers were given. These answers were shown in Table4.21.
Table 4.21 University effect on Attitudes
Negative Effect %(n)
No Effect %(n)
Positive Effect %(n)
8(1) 41(5) 33(4)
8 % had negative effect from university education. Student one said that
probability at university was very abstract and theoretical. This bored people and
effected negatively. 42% of the interviewees said that university education on
probability had no effect on their attitudes. Only 33% of them believed university
education on probability had positive effect on their attitudes. For example, student
eleven said that it affected him in positive way. He added that he enjoyed probability.
Student two said that especially the field courses he had taken affected him
positively. Student six said he could not learn probability at primary school and High
school but he enjoyed probability at university. Student six said he was affected
positively and before university he could not solve probability problems when he
forgot the formulas. But after university he could solve the problems even if he
forgot formulas.
Then the researcher asked the interviewees about their achievement on
probability at university. The answers were shown in Table 4.22.
Table 4.22 Achievement on Probability at University
Good % (n)
Normal % (n)
Bad % (n)
66(8) 8(1) 25(3)
49
66 % of the subjects believed their achievement were good, 8 % thought their
achievement level was normal and 25 % of them thought their achievement was bad
at university.
Then the researcher asked the effect of achievement on attitude toward
probability. 25 % of the interviewees said their attitudes were not affected by
achievement (n=3) while 42 % of them said their attitudes were affected by
achievement (n=5). For example, student two said that to be successful motivate me
positively.
After this question, the interviewees were asked why misconceptions occurred.
42 % of the interviewees said that the teacher was the reason for misconceptions to
occur (n=5). For example, student seven said that teacher was very important factor.
Teacher should think in detail then should reflect it to students. He added that when
something was missing, it was very hard to fill the gaps. Student two said that
probability was taught in a very abstract way. Nobody solved examples that made
students visualize probability. 16 % of them thought that misconceptions occurred
since they did not know the subject completely (n=2). For example, student four said
that basic concepts were not understood well, if the concepts were understood, no
problem he would meet. 8 % of the subjects said probability was an abstract subject
(n=1). 8 % of them believed that misconceptions occurred because of lack of
interaction between teacher and students (n=1).
Then the researcher asked the subjects whether they were aware of their
misconceptions and whether previous misconceptions were continuing and news
occurred or not. 33% of the students said that they were aware of their
misconceptions (n=4). 42% of the subjects said that they were aware of their
misconceptions (n=5). 25% of the interviewees said their misconceptions were
continuing (n=3). For example student four said which subjects in primary school
and high school I still could not understand in the university.
The next question was “What kind of relationship between achievement and
misconceptions is there?” 66 % of the subjects stated that as the number of
misconceptions increased, achievement degreased (n=8). For example student six
said that achievement and misconceptions were inversely proportional. If the number
of misconceptions is high, achievement is low.
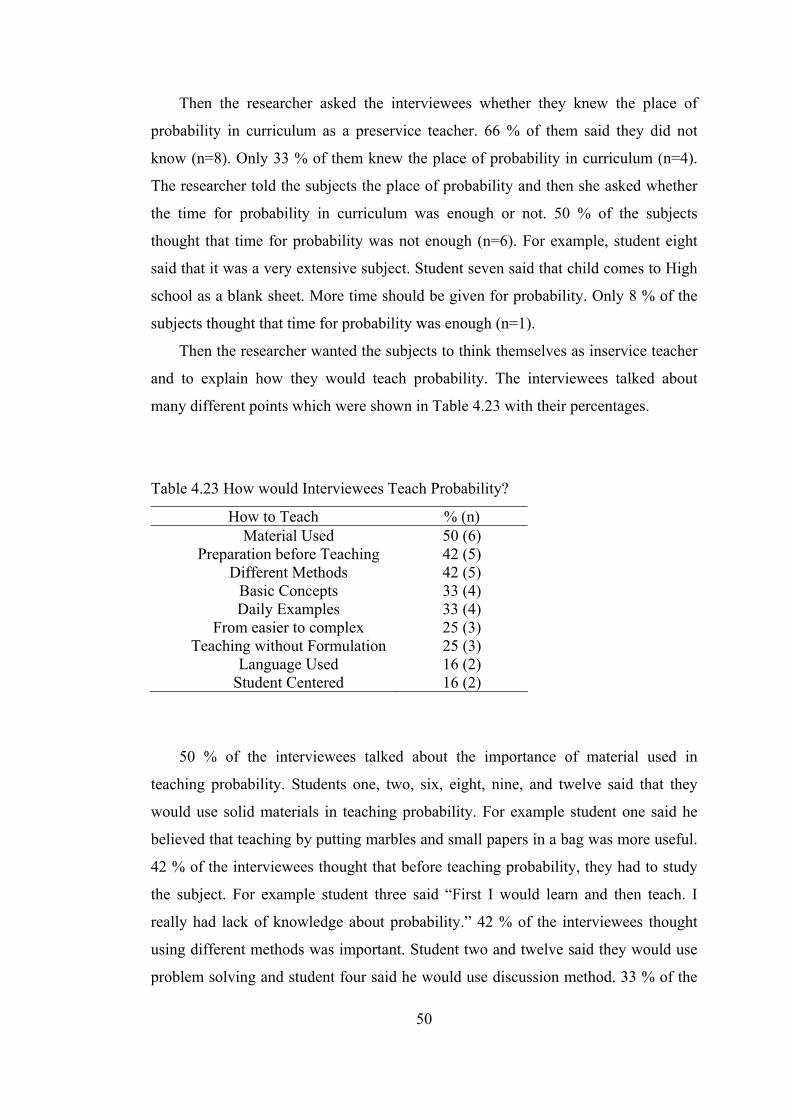
50
Then the researcher asked the interviewees whether they knew the place of
probability in curriculum as a preservice teacher. 66 % of them said they did not
know (n=8). Only 33 % of them knew the place of probability in curriculum (n=4).
The researcher told the subjects the place of probability and then she asked whether
the time for probability in curriculum was enough or not. 50 % of the subjects
thought that time for probability was not enough (n=6). For example, student eight
said that it was a very extensive subject. Student seven said that child comes to High
school as a blank sheet. More time should be given for probability. Only 8 % of the
subjects thought that time for probability was enough (n=1).
Then the researcher wanted the subjects to think themselves as inservice teacher
and to explain how they would teach probability. The interviewees talked about
many different points which were shown in Table 4.23 with their percentages.
Table 4.23 How would Interviewees Teach Probability?
How to Teach % (n) Material Used 50 (6)
Preparation before Teaching 42 (5) Different Methods 42 (5)
Basic Concepts 33 (4) Daily Examples 33 (4)
From easier to complex 25 (3) Teaching without Formulation 25 (3)
Language Used 16 (2) Student Centered 16 (2)
50 % of the interviewees talked about the importance of material used in
teaching probability. Students one, two, six, eight, nine, and twelve said that they
would use solid materials in teaching probability. For example student one said he
believed that teaching by putting marbles and small papers in a bag was more useful.
42 % of the interviewees thought that before teaching probability, they had to study
the subject. For example student three said “First I would learn and then teach. I
really had lack of knowledge about probability.” 42 % of the interviewees thought
using different methods was important. Student two and twelve said they would use
problem solving and student four said he would use discussion method. 33 % of the
51
interviewees emphasized the importance of using daily examples. For example,
student four said “I will start from the daily life of students. For example football is a
subject that boys are interested in. So they will see that probability can be used in
everyday life. 33 % of the interviewees mentioned about the importance of basic
concepts. Student seven said “Basic concepts at first. I will give the main concepts
and explain basic points, and then I will pass to more complex questions.” Not only
student seven but also 25 % of the interviewees emphasized the necessity of
advancing from easier to complex. 25 % of the interviewees believed that teaching
without formulation was important. For example, student four said “Giving
formulation directly does not work. Formulas only helps in simple examples, not
good for complex examples because logic behind probability can not be understood
with direct formulization. 16 % of them mentioned about the language used while
teaching probability. Student two said “The expressions used in classroom must be
chosen from student’s environment. It is not logical to say gambling cards or dice to
primary students. To use familiar expressions like marbles will be better.” 16 % of
them mentioned the importance of student centered education. For example, student
six said “I will want my students to participate by finding examples.”
The next question was “What do you think about teaching probability?” 33 % of
the interviewees thought that teaching probability was very difficult (n=4) and 16 %
of them did not like the subject. 33 % of them of mentioned about their insufficiency
so the said they had to study before teaching (n=4) and 8 % of them was afraid of
teaching (n=1), 8 % of them got accepted to teach (n=1) and 8 % of them preferred
not to teach (n=1). 25 % of the interviewees wanted to teach probability (n=3) and 8
% of them believed it was an important subject to teach (n=1).
Then the interviewees were asked which ones had more effect on their attitudes
toward probability teaching: students’ or teacher’s misconceptions, students’ or
teacher’s achievement, students’ or teacher’s attitude toward probability? The
answers were shown in Table4.24.
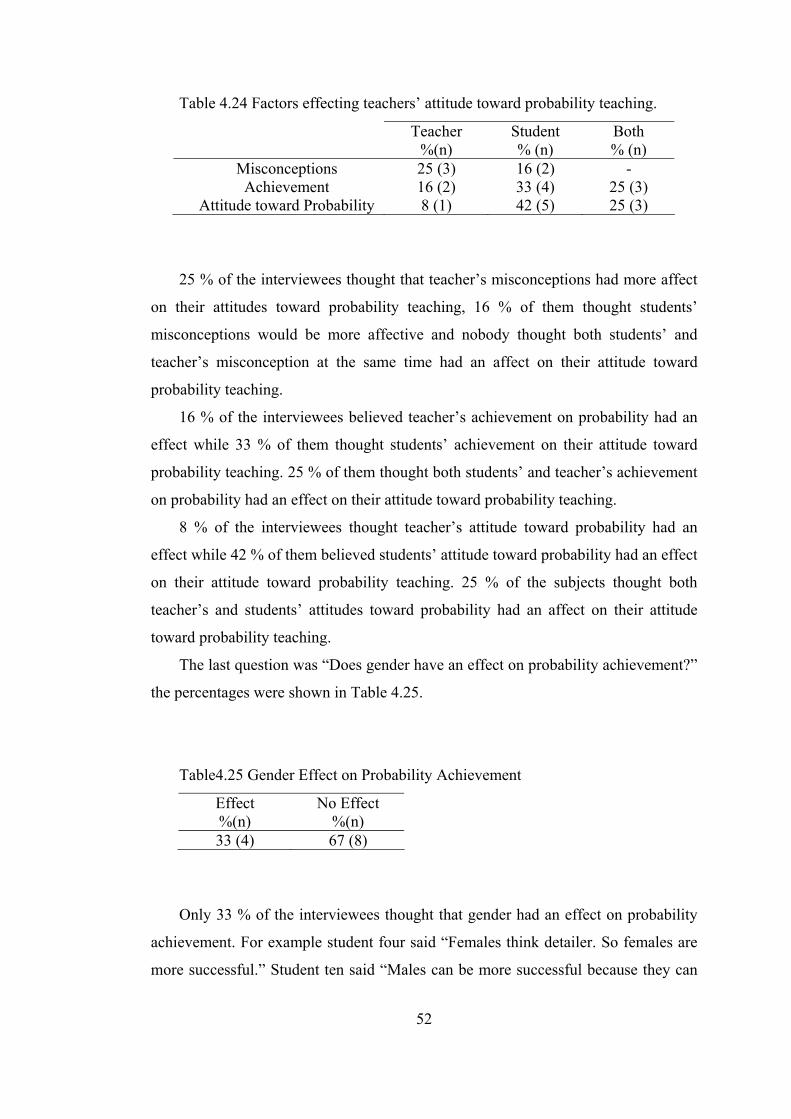
52
Table 4.24 Factors effecting teachers’ attitude toward probability teaching.
Teacher %(n)
Student % (n)
Both % (n)
Misconceptions 25 (3) 16 (2) - Achievement 16 (2) 33 (4) 25 (3)
Attitude toward Probability 8 (1) 42 (5) 25 (3)
25 % of the interviewees thought that teacher’s misconceptions had more affect
on their attitudes toward probability teaching, 16 % of them thought students’
misconceptions would be more affective and nobody thought both students’ and
teacher’s misconception at the same time had an affect on their attitude toward
probability teaching.
16 % of the interviewees believed teacher’s achievement on probability had an
effect while 33 % of them thought students’ achievement on their attitude toward
probability teaching. 25 % of them thought both students’ and teacher’s achievement
on probability had an effect on their attitude toward probability teaching.
8 % of the interviewees thought teacher’s attitude toward probability had an
effect while 42 % of them believed students’ attitude toward probability had an effect
on their attitude toward probability teaching. 25 % of the subjects thought both
teacher’s and students’ attitudes toward probability had an affect on their attitude
toward probability teaching.
The last question was “Does gender have an effect on probability achievement?”
the percentages were shown in Table 4.25.
Table4.25 Gender Effect on Probability Achievement
Effect %(n)
No Effect %(n)
33 (4) 67 (8)
Only 33 % of the interviewees thought that gender had an effect on probability
achievement. For example student four said “Females think detailer. So females are
more successful.” Student ten said “Males can be more successful because they can

53
see relationships easier and in probability there are events that need to see
relationships”. 67 % of the subjects thought that gender had no effect on probability
achievement. Student two said “I am sure when the same education is given,
everybody can understand with respect to their ability.” Student twelve said “I do not
believe. Probability is related with logic and logic is not affected by gender.”
54
CHAPTER 5
DISCUSSION, CONCLUSION AND RECOMMENDATIONS
In this chapter the results of this study will be discussed; conclusion and some
recommendations will be stated.
5.1 Discussion
The main purpose of this study was to investigate the factors affecting preservice
mathematics teachers’ decisions on probability teaching. The sub problems related
with the main problem were:
• How well can attitudes toward probability teaching are explained in terms of
gender, probability achievement, and attitudes toward probability?
• What are the preservice mathematics teachers’ misconceptions?
• How do preservice mathematics teachers’ experiences on probability affect
their view about teaching probability
The subjects were given PAT, PMT, APTS, and APS respectively. Then
according to the scores they got from APTS, 12 subjects were interviewed.
Many researchers have suggested that students come to teacher education
programs with previously constructed knowledge, beliefs, and values which may be a
help or a hindrance in learning new ideas (Adler, 1991; Britzman, 1986). This result
could be valid for the present study because according to the results of the interview,
almost all subjects had familiarity with probability before university Although most
of the subjects complained about the probability education before university and said
that they had difficulty in learning probability, nearly half of the subjects had a
55
positive attitude toward probability which could positively effected them learning
probability during their university education.
At university, mostly all the subjects complained about how probability was
thought. They found probability education insufficient for teaching in schools. For
example, student two said more visualization should take part in probability lessons
and added it was thought in a very abstract way; student nine said he did not
understand why he learnt probability and complained about using very much
formulas. Also in their study, Garfield and Ahlegen (1988) found that students
developed distaste for probability because it was thought in a highly abstract and
formal way.
The results of the interview also showed that the experience preservice
mathematics teachers had with probability during university could have an effect on
their decisions about teaching probability. This result was supported by Professional
Standards for Teaching Mathematics, which stated that teachers were influenced by
the teaching they see and experience (NCTM, 1991). In other words, teachers’ own
experiences had a profound impact of their knowledge of, beliefs about, and attitudes
toward mathematics, and teaching which implied great importance for student
teachers’ experiences in teacher education programs.
A closer look at probability course experience at university alone was quite
revealing. Many subjects met with probability in statistics and probability lesson,
some subjects were thought probability only in mathematics course and only a small
amount of subjects met with probability in development of instructional material. For
example, student six complained about monotony of probability lessons and added
that both at lycee and university they did the same things. Only less than half of the
subjects did study about probability and they found it insufficient. And many of them
did not do any study about probability. It could be said that they possessed an
insufficient level of understanding necessary for probability teaching. As a result,
most of the subjects thought they were insufficient about teaching probability and
some were afraid to teach probability, some thought teaching probability was hard
and only a few of them believed that probability was an important subject. These
results were consistent with the evidence indicating that preservice mathematics
56
teachers possessed an insufficient level of conceptual understanding for teaching
mathematics (Brown, Cooney & Jones, 1990; Post, Hare, Behr & Lesh, 1991).
That the experience preservice teachers had during learning of probability could
have an affect on their decisions about teaching probability .was consistent with the
regression results of the analysis in which we deduced that preservice mathematics
teachers’ attitude toward probability had a significant effect on their attitude toward
probability teaching. According to the regression equation, attitude toward
probability accounted for 54.8 % of the variance in their attitude toward probability
teaching.
Although gender and probability achievement of the subjects were excluded
from the regression equation, which means that gender and probability achievement
had no significant affect on probability teaching, most of the subjects said their
attitudes toward probability were affected by probability achievement. For example
student two said that to be successful motivated him positively. Also some of them
thought that their achievement would affect their attitude toward probability teaching
whereas some said that students’ achievement would affect their attitude toward
probability teaching. And some other subjects believed both students’ and their
achievement would affect their decision on teaching probability. So it could be
concluded as both their achievement and students’ achievement could affect their
attitude toward probability teaching.
Beside probability achievement, gender was the other independent variable that
was excluded from the regression equation. Many subjects thought that gender had
no effect on probability achievement. They also thought that their achievement could
affect their attitude toward probability teaching. So it could be said that gender
would not affect their attitude toward probability teaching.
Another factor that could affect probability teaching of preservice mathematics
teachers is misconceptions. From the interview results, it could be seen that many
subjects thought teacher was the main reason for the occurrence of misconceptions.
For example, student seven said teacher should think in detail then should reflect it to
students and added that when something was missing it was very hard to fill the
gaps. Fortunately, being aware of teachers’ important role in the occurrence of
misconceptions, most of the subjects were aware of their own misconceptions and
57
many of them believed they had always misconceptions. As an example, student four
said “The topics about probability in primary school and lycee I could not understand
did not change in university. I still could not understand them.”
Consistent with the interview results, from the results misconception test we
used, it could be seen that both males and females had misconceptions in simple and
compound events, sample size, conjunction fallacy, and effect of time axis. Only
females had a high amount of misconception in equiprobability bias. This result was
consistent with the results of the study conducted by Yıldız and Bulut (2002). In their
study they used a 26 item misconception test and found that preservice mathematics
teachers had misconceptions. In his study, Mut (2003) studied with students grade
levels from 5 to 10. He found that females had equiprobability bias misconception
more frequent than males. In his study, he also concluded that the frequencies of all
misconception types varied across grade levels, the percentages of students who
received instruction on probability in the school were higher than those who did not
received instruction in terms of misconceptions on Effect of Sample Size and Time
Axis Fallacy and the other misconception types were more frequent among students
who did not receive a certain instruction on probability than the students who
received a certain instruction probability before his study.
Also from the interview results, it could be seen that some of the subjects
thought that teachers’ misconceptions were the important factor that could affect
their attitude toward probability teaching and a few of them thought students’
misconceptions would affect their attitude toward probability.
The results of this study showed that the experience preservice mathematics
teachers had with probability before and during the university education has a direct
affect on their decisions about teaching probability.
Another result that could be reached from the interview was related with
preservice teachers’ decisions on how to teach probability as inservice teachers. The
interviewees were asked to think themselves as inservice teachers and explain how
they would teach probability. Half of the subjects mentioned about the importance of
material used. They said that they would use solid materials in teaching probability.
Consistent with preservice mathematics teachers’ plans about teaching probability, in
their studies, Fennal (1982) advised using newspapers, Show (1984) advised using
58
spinners, Bruni and Silverman (1986) mentioned about using wooden or plastic
cubes or different kinds of beans, and also Bright (1989) advised using simulations
of rolling dice, flipping coins, or spinning a wheel.
In the interview, some subjects also talked about using different methods would
be helpful for teaching probability. Lappan and Winter (1980) pointed out that
teaching through concrete experiments held much more promise than teaching
through traditional methods.
Some subjects at the present study emphasized the importance of using daily life
examples. They also thought teaching probability without formulas would be better.
Some of them mentioned the importance of student centered education. This may
supported by Burns (1983). He suggested that probability concepts should be
included in elementary mathematics instruction by using student centered classroom
activities.
As a result it could be said that although preservice mathematics teachers
complained about insufficient level of understanding conceptual knowledge of
probability for teaching, they seemed to have different plans to teach probability
effectively.
As a summary, there are some factors affecting preservice mathematics teachers’
decisions on probability teaching. These factors were preservice mathematics
teachers’ attitude toward probability, probability achievement, and misconceptions.
They believed that gender would have no affect on their decision on probability
teaching. They had different plans of teaching probability.
5.2 Conclusion
In the light of above findings obtained, the following conclusions could be
stated:
• Mostly all of the subjects had familiarity with probability before university.
• Mostly half of the subjects had a positive attitude toward probability before
university.
59
• At university, mostly all the subjects complained about how probability was
thought.
• Preservice mathematics teachers found probability education insufficient for
teaching in university.
• Experience preservice mathematics teachers had with probability during
university could have an effect on their decisions about teaching probability.
• Many subjects met with probability in statistics and probability lesson.
• Some subjects were thought probability only in mathematics course.
• Only a small amount of subjects met with probability in development of
instructional material.
• It could be said that they possessed an insufficient level of understanding
necessary for probability teaching.
• Mathematics teachers’ attitude toward probability has a significant effect on
their attitude toward probability teaching.
• Both preservice mathematics teachers’ achievement and students’
achievement could affect their attitude toward probability teaching.
• Gender would not affect their attitude toward probability teaching.
• Many subjects thought that teacher was the main reason for misconception to
occur.
• Both males and females had misconceptions in simple and compound events,
sample size, conjunction fallacy, and effect of time axis.
• Only females had a high amount of misconception in equiprobability bias.
• Some of the subjects thought that teachers’ misconceptions were the
important factor that could affect their attitude toward probability teaching.
• The experience preservice mathematics teachers have with probability before
and during the university education has a direct affect on their decisions about
teaching probability.
• They seemed to have different plans to teach probability effectively.
60
5.3 Recommendations
In this section some recommendations for teacher education and for further
studies will be given.
5.3.1 Recommendations for Teacher Education
Teacher educators should take time to consider the following suggestions for
improving the competence of preservice mathematics teachers on probability and
instruction on probability:
• Be aware of preservice teachers needs related to probability teaching as a
inservice teacher.
• Provide various opportunity for using instructional materials and
techniques.
• Provide them with alternative models for teaching/learning probability
• Connect advanced probability content knowledge learnt in university
with the knowledge needed for classroom.
• Add probability courses on how to teach probability affectively.
• Give opportunities to preservice mathematics teachers to study with how
probability can be thought in material production lessons.
• Help them integrate their probability knowledge into instructional
practice.
• Satisfy them not only by teaching how to carry out probabilistic
procedure but also make them understand the logic behind probability.
• Probe for potential misconceptions in preservice mathematics teachers by
using carefully chosen examples in order to make them meaningful.
• Lead them gain experience about conflicts between their own intuitions
and particular types of thinking in stochastic situations.
61
5.3.2 Recommendations for Further Research
This subject requires more detailed researchers. First of all the sample size must
be increased in further studies. To be able to talk about Turkey overall, subjects from
different geographical regions should be selected. To have more detailed opinion
about preservice teachers’ decisions on probability teaching, the investigation
process should be laid in time i.e. from the first class of university to the fourth class.
Also a larger sample of interviewees should be used. This would increase the
validity of the responses. By doing this, the research will provide more accurate
information.
The present study contributes to find the factors effecting preservice
mathematics teachers’ decisions on probability teaching. Further researches are
needed to continue the investigation.
62
REFERENCES
Barnett, V. (1988). Statistical Consultancy-A basis for teaching and research. In R.
Davidson, & J. Swift (Eds.)., The proceedings of the second International
Conference on Teaching Statistic. Victoria B.C.: University of Victoria
Bar-On, E. and Or-Bach, R. (1988). Programming Math: A new Approach in
Introducing Probability to Less Able Pupils, Journal of Mathematics Education
Science Technology 19(2), 281-297.
Barz, T.J. (1970). A study of to ways of presenting probability and statistics at the
college level. Unpublished doctoral dissertation, Columbia University
Begg, A. & Edwards, R. Teachers Ideas About Teaching Statistics. University of
Waikato, New Zeland.
Beyth-Maron, R., and Dekel, S. (1983). A curriculum to improve thinking under
uncertainty. Instructional Science, 12, 67-82.
Bright, G. W., 1989. Probability Simulations. Arithmetic Teacher, 36, 9, pp.16-18.
Bruni, J.V. and Silverman, H.J., 1986. Developing Concepts in Probability and
Statistics- and Much More. Arithmetic Teacher, 30, 6, pp.34-37.
Bulut, S. (1994). The Effects of Different Teaching Methods and Gender on
Probability Achievement and Attitudes toward Probability. Unpublished Doctoral
Dissertation, Middle East Technical University, Ankara.
63
Bulut, S. and Ersoy, Y. (1993). An Investigation on Prospective Mathematics
Teachers’ Attitude Toward Probability: Abstract of ICME-7, Quebec, Canada/
Unpublished Research Report.
Bulut, S., Yetkin, İ.E. & Kazak, S. (2002). Matematik Öğretmen Adaylarını Olasılık
Başarısı, Olasılık ve Matematiğe Yönelik Tutumlarının Cinsiyete Göre İncelenmesi.
Hacettepe Üniversitesi Eğitim Fakültesi Dergisi, 22, 21-28.
Burns, M. Put Some Probability in Your Classroom, Arithmetic Teacher, 30, 7, pp-
21-22.
Cankoy, O. (1989). Difference between Traditional Method and Mathematics
Instruction in terms of Achievement Related to a Probability Unit. Unpublished
Master Thesis, Middle East Technical University, Ankara.
Carpenter, T.P., Corbitt, M.K., Kepner, H.S., Linquist, M.M. and Reys, E.R.,(1981).
What are the Chances of your Students Knowing Probability? Mathematics Teacher,
73, 342-344.
Champagne, A., Klopfer, L., & Gunstone, R. (1982). Cognitive research and the
design of science instruction. Educational Psychologist, 17, 31-53.
Cobb, G. (1991). Teaching Statistics: More Data, Less Lecturing, Amstat News,
182(1), 4.
Cobb, G. (1993). Reconsidering Statistics Education: A National Science Foundation
Conference, Journal of Statistics Education [Online], 1(1).
(www.amstat.org/publications/jse/v1n1/cobb.html)
delMas, R.C., & Bart, W.M. (1987). The role of an evaluation exercise in the
resolution of misconceptions of probability. Paper presented at the Annual meeting
of the American Educational Research Association.
64
delMas, R.C., & Bart, W.M. (1989). The role of an evaluation exercise in the
resolution of misconceptions of probability. Focus on Learning Problems in
Mathematics, 11, 3, 39-53.
Department of Education and Science and the Welsh Office (1991). National
Curriculum: Mathematics for Ages 5 to16, in G.A.Jones, C.AThornton, Langrall,
C.W. & Mogill, T.A. (1996). Using Children Probabilistic Thinking to Inform
Instruction, Proceeding, PME 20, Valenca, 3, 137-144.
Dusek, J.B. and Hill, K.T. (1970). Probability Learning as a Function of Sex of the
Subject, Test Anxiety, and Percentage of Reinforcement. Developmental
Psychology,3(2),195-207.
Falk, R. (1988). Conditional probabilities: Insides and difficulties. In R. Davidson, &
J. Swift (Eds.)., The Proceedings of the Second International Conference on
Teaching Statistics. Victoria, B.C: University of Victoria.
Fennel, S., 1982. The Newspaper: A Source for Applications in Mathematics.
Arithmetic Teacher, 30, 2, pp. 22-26.
Fischbein, E. (1975) The Intuitive Sources of Probabilistic Thinking in Children.
Dortrecht, The Netherlands: Reidel.
Fischbein, E. (1987) Intuition in Science and Mathematics. Dortrecht, The
Netherlands: Reidel.
Fischbein, E., & Gazit, A. (1984). Does the teaching of probability improve
probabilistic intuitions? Educational Studies in Mathematics, 15, 1-24.
Fischbein, E., Nello, M.S. & Marino, M.S. (1991). Factors Affecting Probabilistic
Judgment in Children and Adolescents. Educational Studies in Mathematics, 22,
523-549.
65
Fischbein, E., & Schnarch, D. (1997). The Evolution with Age of Probabilistic,
Intuitively Based Misconception, Educational Studies in Mathematics, 29, 97-105
Garfield, J.B. (1988). Obstacles to effective teaching of probability and statistics.
Paper presented at the Research Presession of the National Council of Teachers of
Mathematics 66th Annual Meeting, Chicago.
Garfield, J. & Ahlegren, A. (1988). Difficulties in Learning Basic Concepts in
Probability and Statistic: Implication for Research, Journal for Research in
Mathematics Education, 19(1), 44-63.
Garfield, J. & Ahlegren, A. (1988a). Difficulties in Learning Basic Concepts in
Probability and Statistic: Implication for Research, Journal for Research in
Mathematics Education, 19, 44-63.
Garfield, J. & Ahlegren, A. (1988b). Difficulties in Learning Basic Concepts in
Probability and Statistic: In R. Davidson & J. Swift (Eds.), The Proceedings of the
Second International Conference on Teaching Statistics. Victoria B.C: University of
Victoria.
Green, D. R. (1979). The Chance and Probability Concepts Projects. Teaching
Statistics, 1(3), 66-71.
Green, D. R. (1982). Probability Concepts in 11-16 Year Old Pupils, Loughborough
University, UK: Centre for Advancement of Mathematical Education in Technology,
40 p.
Green, D. R. (1983a). A Survey of Probability Concepts in 3000 Pupils aged 11-16
years. In D.R. Grey, P. Holmes, V. Barnett, & G.M Consitable (Eds.), Proceedings
of the First International Conference on Teaching Statistics, 766-783. Sheffield, UK:
Teaching Statistics Trust.
66
Green, D. R. (1983b). School Pupils’ Probability Concepts. Teaching Statistics, 5(2),
34-42.
Green, D. R. (1987). Probability Concept. Putting Research into Practice. Teaching
Statistics, 9(1), 8-14.
Green, D. R. (1988). Children’s understandings of Randomness: Report of survey of
1600 children aged 7-11 years. In R. Davidson & J. Swift (Eds.), The Proceedings of
the Seconds International Conference on Teaching Statistics. Victoria, B.C:
University of Victoria.
Halpern, N. (1987). Teaching Probability-Some Legal Applications. Mathematics
Teacher, 80,150,153.
Halpern, D. (1996). Thought and Knowledge (3rd ed.), Mahwah, NJ: Lawrence
Erlbaum Associates.
Hana, G., (1986). Sex Differences in the Mathematics Achievement of 8th Graders in
Ontario. Journal of Research in Mathematiccs Education, 17,231-237.
Hawkins, A., & Kapadia, R.(1984). Children’s conceptions of probability: A
psychological and pedagogical review. Educational Studies in Mathematics, 15, 349-
377
Hogg, R.V. (1992) Towards Lean and Lively Courses in Statistics, in Statistics for
the Twenty-First Century, MAA Notes Number 26, eds. F. Gordon and S. Gordon,
Washington D.C.: The Mathematics Association of America, 3-13.
Hope, J.A. & Kelly, I.W. (1983). Common Difficulties with Probabilistic Reasoning.
Mathematics Teacher, 76, 565-570.
67
Jones, G.A., Langrall, C.W., Thornton, C.A. & Mogill, A.T. (1997) A framework
For Assesing and Nurturing Young Children’s Thinking in Probability. Educational
Studies in Mathematics, 32, 101-125.
Jones, G.A., Langrall, C.W., Thornton, C.A. & Mogill, A.T. (1999). Students’
Probabilistic Thinking in Instruction. Journal for Research in Mathematics
Education, 30(5), 487-519.
Kahneman, D., Slovic, P., & Tversky, A. (1982). Judgment under uncertainty:
Heuristics and biases. Cambridge: Cambridge University Press.
Kapadia, R. (1985). A brief survey of research on probabilistic notions. In A. Bell, B.
Low, & J. Kilpatrick (Eds.), Theory, research and practice in mathematical
education 261-265. Nottingham, UK: Shell Center for Mathematical Education.
Kimball, M.M. (1989). A new perspective on women’s math achievement.
Psychological Bulletin, 105,2,198-214.
Koirala, H.P. (1996). Preservice Teachers’ use of Everyday experiences in solving
probability problems. Presented at the Annual Meeting of American Educational
Research Association, New York City.
Konold, C. (1983). Conceptions about probability: Reality between a rock and a hard
place. (Doctoral dissertation, University of Massachusetts,1983). Dissertation
Abstracts International, 43, 4179B.
Konold, C. (1989). Informal Conception of Probability, Cognition and Instruction,
6(1), 59-98.
Konold, C. (1991). Understanding students’ beliefs about probability. In E.von
Glasersfelt (Ed.), Radical Constructivism in Mathematics Education, 139-156.
Holland: Kluwer.
68
Konold, C., Pollatsek, A., Well, A., Lohmeier, J., Libson, A. (1993). Inconsistencies
in Students’ Reasoning about Probability. Journal for Research in Mathematics
Education, 24(5), 392-414.
Kreitler, S., Zigler, E. & Kreitler, H. (1983). The effects of Memory and Abstractive
Integration on Children’s Probability Learning. Child Development, 54,1487-1496.
Lappan, G. and Winter, M.J., 1980. Probability Simulations in Middle School.
Mathematics Teacher, 83, pp-446-449.
Leder, G.C. (1992). Mathematics and gender: Changing perspectives. In D.A.
Grouws (Ed.), Handbook of Research on Mathematics Education (pp. 597-622).
New York: Macmillan.
Lee, Hea-Jin, 1999. ED433219. ERIC Clearinghouse for Science Mathematics and
Environmental Education Colombus OH.
Levi, L. (2000). Gender equity in mathematics education. Teaching Children
Mathematics, 7,2,101.
Marshall, S.p.(1984). Sex differences in children’s mathematics achievement:
Solving computations and story problems. Journal of Educational Psychology,
76,2,194-204.
McDermott, L. (1984). Research on conceptual understanding of physics. Physics
Today, 37, 24-32.
Mestre, J. (1987, Summer). Why should mathematics and science teachers be
interested in cognitive research findings? Academic Connections, pp. 3-5, 8-11. New
York: The College Board.
69
Morran, J. D. and McCullars, J.C. (19799). Reward and Number Choices in
Children’s Probability Learning: an Attempt to Reconcile Conflicting Findings.
Journal of Experimental Child Psychology, 27,575-596.
Mosteller, F. (1967). What has happened to Probability in the High School?
Mathematics Teacher, 60, 824-831.
Mut, A.İ. (2004). Investigation of students’ misconceptions. Unpublished Master
Thesis, Middle East Technical University, Ankara.
National Council of Teachers of Mathematics (1989). Curriculum and Evaluation
Standards for School Mathematics. Reston, Va.: NCTM.
National Research Council (1989). Everybody Counts. Washington, D.C.: National
Academy Press.
Obremski, T.E. (1981).The statistics odds room. In A.P. Shulte (Ed.), Teaching
Statistics and Probability. Reston, VA: National Council of Teachers of
Mathematics.
Pfannkuch, M., and Brown, M.C. (1996). Building on and Challenging Students’
Intuitions about Probability: Can we improve undergraduate learning? Journal of
Statistics Education, 4(1).
Piaget, J., & Inhelder, B. (1951). La Genesse de l’Idẻe de Hazard chez l’Enfant.
Paris: Presse Universitaire de France.
Piaget, J., & Inhelder, B. (1975). The origin of the idea of chance in children.
London: Routledge & Kegan Paul.
Resnick,L.R. (1983) Mathematics and science learning: A new conception. Science,
220, 477-478
70
Roberts, H. V. (1992). Student-Conducted Projects in Introductory Statistics
Courses, in Statistics for the Twenty-First Century, MAA Notes, (Number 26), eds.
F. Gordon and S. Gordon. Washington D.C.: The Mathematical Association of
America, 109-121.
Scheaffer, R. L. (1992). Data, Discernment and Decisions: An Empirical Approach
to Introductory Statistic, in Statistics for the Twenty-First Century, MAA Notes
(Number 26), eds. F. Gordon and S. Gordon, Washington D.C.: The Mathematics
Association of America, 69-82.
Scholz, R.W., & Bentrup, A. (1984). Reconsidering the base rate fallacy: New data
and conceptual issues. ( The Stochastic Thinking Project Report No. 1). Bielefeld,
FRG: University of Bielefeld.
Sgoustas-Emch, S.A. & Johnson, C.J. (1998). Is Journal writing an effective method
of reducing anxiety towards statistics? Journal of Instructional Psychology, 25, 49-
57.
Shaughnessy, J.M. (1977). Misconceptions of Probability: An experiment with a
small group, actively based, model building approach to introductory probability at
the college level. Educational Studies in Mathematics, 8, 285-316.
Shaughnessy, J.M. (1992). Research in Probability and Statistics: Reflections and
Directions. In D.A. Grouws (1992). Handbook of Research on Mathematics
Teaching and Learning, 465-494. New York: Macmillan Publishing Com
Snell, J. L. (1992). CHANCE: Case Studies of Current Chance Issues, in Statistics
for the Twenty-First Century, MAA Notes (Number 26), eds. F. Gordon and S.
Gordon, Washington D.C.: The Mathematical Association of America, 281-297.
Snell, J. L. (1994). Take a Chance on CHANCE, [Online].
(www.dartmouth.edu/~chance/course/Articles/ume.html)
71
Thompson, A.G. (1992). Teachers’ beliefs and conceptions: A synthesis of the
research. In D. A. Grouws (Ed.), Handbook of Research on Mathematics Teaching
and Learning: A project of the NCTM (pp.127-146). New York: Macmillian.
Tversky, A., & Kahneman, D. (1974). Judgments under uncertainty: Heuristics and
biases. Science, 185, 1124-1131.
Yıldız, B.T.,& Bulut, S. (2002). Orta Öğretim Matematik Öğretmen Adaylarının
Olasılıkla İlgili Kavram Yanılgılarının İncelenmesi. V. Ulusal Fen Bilimleri ve
Matematik Eğitim Kongresi, Ankara, 256.
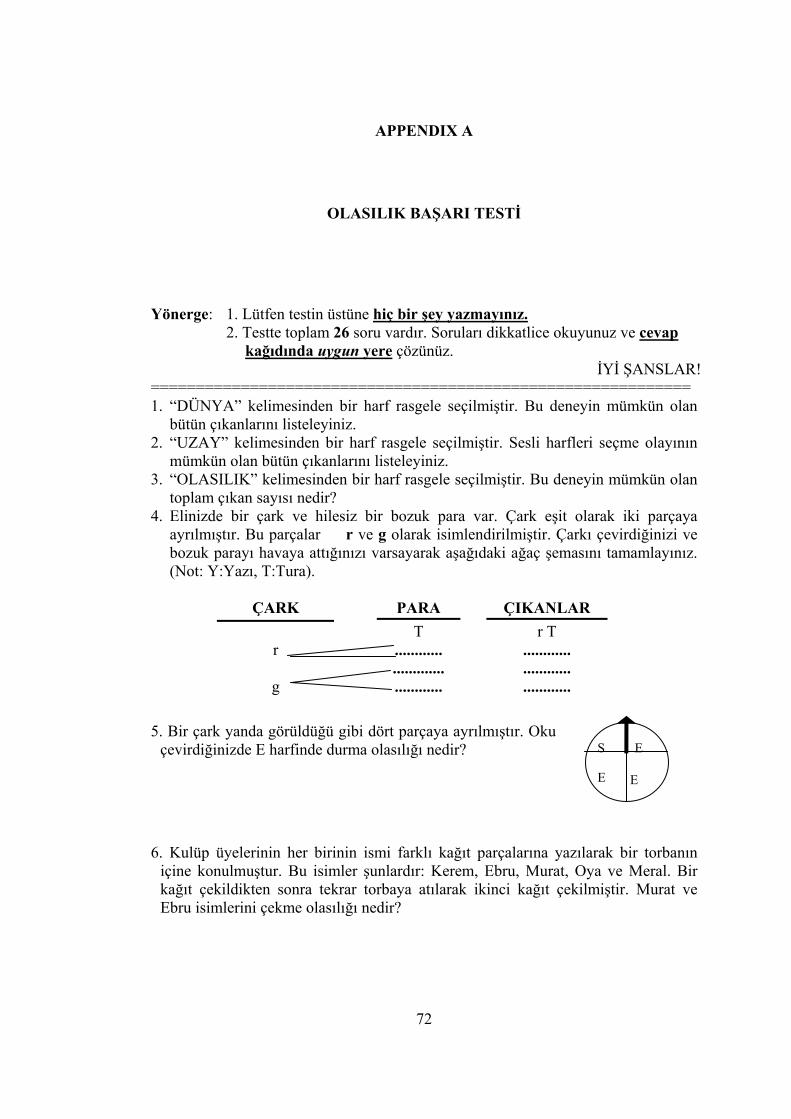
72
APPENDIX A
OLASILIK BAŞARI TESTİ
Yönerge: 1. Lütfen testin üstüne hiç bir şey yazmayınız. 2. Testte toplam 26 soru vardır. Soruları dikkatlice okuyunuz ve cevap
kağıdında uygun yere çözünüz. İYİ ŞANSLAR!
============================================================ 1. “DÜNYA” kelimesinden bir harf rasgele seçilmiştir. Bu deneyin mümkün olan
bütün çıkanlarını listeleyiniz. 2. “UZAY” kelimesinden bir harf rasgele seçilmiştir. Sesli harfleri seçme olayının
mümkün olan bütün çıkanlarını listeleyiniz. 3. “OLASILIK” kelimesinden bir harf rasgele seçilmiştir. Bu deneyin mümkün olan
toplam çıkan sayısı nedir? 4. Elinizde bir çark ve hilesiz bir bozuk para var. Çark eşit olarak iki parçaya
ayrılmıştır. Bu parçalar r ve g olarak isimlendirilmiştir. Çarkı çevirdiğinizi ve bozuk parayı havaya attığınızı varsayarak aşağıdaki ağaç şemasını tamamlayınız. (Not: Y:Yazı, T:Tura).
ÇARK PARA ÇIKANLAR
T r T r ............ ............ ............. ............ g ............ ............
5. Bir çark yanda görüldüğü gibi dört parçaya ayrılmıştır. Oku çevirdiğinizde E harfinde durma olasılığı nedir?
6. Kulüp üyelerinin her birinin ismi farklı kağıt parçalarına yazılarak bir torbanın içine konulmuştur. Bu isimler şunlardır: Kerem, Ebru, Murat, Oya ve Meral. Bir kağıt çekildikten sonra tekrar torbaya atılarak ikinci kağıt çekilmiştir. Murat ve Ebru isimlerini çekme olasılığı nedir?
S
E
E
E
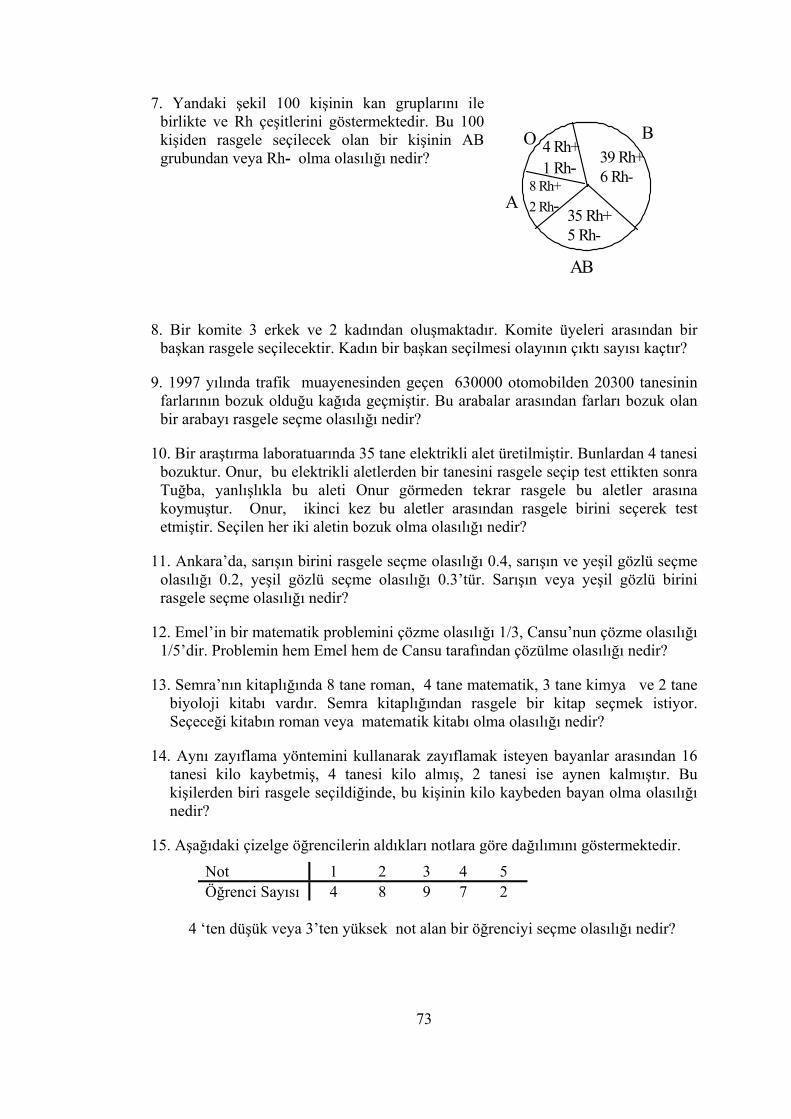
73
7. Yandaki şekil 100 kişinin kan gruplarını ile birlikte ve Rh çeşitlerini göstermektedir. Bu 100 kişiden rasgele seçilecek olan bir kişinin AB grubundan veya Rh- olma olasılığı nedir?
8. Bir komite 3 erkek ve 2 kadından oluşmaktadır. Komite üyeleri arasından bir başkan rasgele seçilecektir. Kadın bir başkan seçilmesi olayının çıktı sayısı kaçtır?
9. 1997 yılında trafik muayenesinden geçen 630000 otomobilden 20300 tanesinin farlarının bozuk olduğu kağıda geçmiştir. Bu arabalar arasından farları bozuk olan bir arabayı rasgele seçme olasılığı nedir?
10. Bir araştırma laboratuarında 35 tane elektrikli alet üretilmiştir. Bunlardan 4 tanesi bozuktur. Onur, bu elektrikli aletlerden bir tanesini rasgele seçip test ettikten sonra Tuğba, yanlışlıkla bu aleti Onur görmeden tekrar rasgele bu aletler arasına koymuştur. Onur, ikinci kez bu aletler arasından rasgele birini seçerek test etmiştir. Seçilen her iki aletin bozuk olma olasılığı nedir?
11. Ankara’da, sarışın birini rasgele seçme olasılığı 0.4, sarışın ve yeşil gözlü seçme olasılığı 0.2, yeşil gözlü seçme olasılığı 0.3’tür. Sarışın veya yeşil gözlü birini rasgele seçme olasılığı nedir?
12. Emel’in bir matematik problemini çözme olasılığı 1/3, Cansu’nun çözme olasılığı 1/5’dir. Problemin hem Emel hem de Cansu tarafından çözülme olasılığı nedir?
13. Semra’nın kitaplığında 8 tane roman, 4 tane matematik, 3 tane kimya ve 2 tane biyoloji kitabı vardır. Semra kitaplığından rasgele bir kitap seçmek istiyor. Seçeceği kitabın roman veya matematik kitabı olma olasılığı nedir?
14. Aynı zayıflama yöntemini kullanarak zayıflamak isteyen bayanlar arasından 16 tanesi kilo kaybetmiş, 4 tanesi kilo almış, 2 tanesi ise aynen kalmıştır. Bu kişilerden biri rasgele seçildiğinde, bu kişinin kilo kaybeden bayan olma olasılığı nedir?
15. Aşağıdaki çizelge öğrencilerin aldıkları notlara göre dağılımını göstermektedir.
Not 1 2 3 4 5 Öğrenci Sayısı 4 8 9 7 2
4 ‘ten düşük veya 3’ten yüksek not alan bir öğrenciyi seçme olasılığı nedir?
4 Rh+ 1 Rh-
8 Rh+ 2 Rh-
39 Rh+ 6 Rh-
35 Rh+ 5 Rh-
A
AB
O B
74
16. Bir yarışmada Erkut’un kazanma olasılığı 1/3 ve Suat’ın kazanma olasılığı ise 1/7dir. Erkut’un veya Suat’ın bu yarışı kazanma olasılığı nedir? (Not: Erkut ve Suat aynı anda kazanamaz.)
Yönerge: Aşağıda verilen her bir olayın çeşitlerini belirleyeceksiniz. (Not: Olay çeşitleri (bağımsız, bağımlı, ayrık, ayrık olmayan, kesin, imkansız ) bir ya da birden fazla kullanıldığı gibi hiç de kullanılmayabilir.)
17. “Gelecek yıl 29 Ekimde Cumhuriyet Bayramı olacaktır.” Olayın çeşidi nedir?
18.“Bir fabrikada yılda 1 milyon televizyon üretilmektedir. Bunların 5000 tanesinin arızalı olduğunu varsayınız. Test etmek için bu üretilen televizyonlardan biri seçilmiş ve test edildikten sonra tekrar rasgele televizyonlar arasına konulmuştur. Bu işlemden sonra tekrar rasgele televizyonlardan biri seçilip test edilmiştir.” Olayın çeşidi nadir?
19.“Bir kişi içinde “w” harfi olan bir ayda doğmuştur.”.Olayın çeşidi nedir?
20. “Bir araştırmada 3 yaşında bir çocuk ya da ilkokul 5. Sınıf öğrenci olan bir çocuk seçilmek isteniyor”. Olayın çeşidi nedir
21.“Bir bilgisayar programı 1 ve 5 arasındaki rakamları kullanarak, seçtiği rakamı tekrar seçmeden iki basamaklı sayılar üretmektedir.” Olayın çeşiti nedir
******* YÖNERGE: 22-24. soruları okuyunuz. Evet veya hayır olarak
cevaplarken nedenlerini de yazınız. ************
22 Torbaya 5 pembe(p), 4 yeşil (y) ve 2 mavi (m) top konulmuştur. Torbaya bakmadan 4 tane top aynı anda çekilmektedir. {m, m, p, y, y} bu deneyin bir olayı olabilir mi? Neden?
23.5/3 bir olayın olma olasılığı olabilir mi? Neden?
24.11 tane kart şu şekilde numaralandırılmıştır: 1, 2, 4, 6, 7, 8, 9, 12, 14, 15, ve 20. Bunlar bir kutuya konulmuştur. Bunlardan 4 tanesi aynı zamanda kutuya bakılmaksızın çekilmiştir. {7’nin karesi} bu deneyin bir örnek noktası olabilir mi? Neden?
******** YÖNERGE 25-26 sorulardaki cümleleri dikkatli okuyunuz ve
boşlukları uygun bir şekilde doldurunuz. *********
25. Olasılık değerleri ............. ve ............ arasında değişmektedir.
26.2/9 olasılık oranında, “2” ........................... sayısıdır.
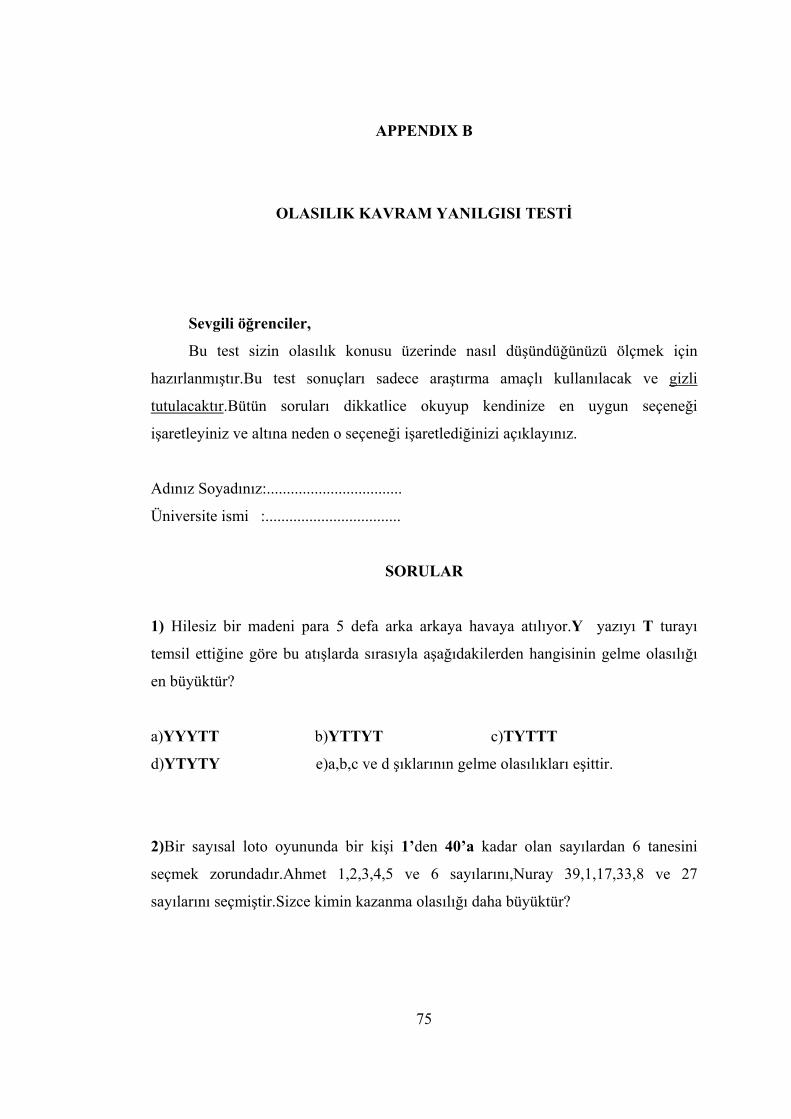
75
APPENDIX B
OLASILIK KAVRAM YANILGISI TESTİ
Sevgili öğrenciler,
Bu test sizin olasılık konusu üzerinde nasıl düşündüğünüzü ölçmek için
hazırlanmıştır.Bu test sonuçları sadece araştırma amaçlı kullanılacak ve gizli
tutulacaktır.Bütün soruları dikkatlice okuyup kendinize en uygun seçeneği
işaretleyiniz ve altına neden o seçeneği işaretlediğinizi açıklayınız.
Adınız Soyadınız:..................................
Üniversite ismi :..................................
SORULAR
1) Hilesiz bir madeni para 5 defa arka arkaya havaya atılıyor.Y yazıyı T turayı
temsil ettiğine göre bu atışlarda sırasıyla aşağıdakilerden hangisinin gelme olasılığı
en büyüktür?
a)YYYTT b)YTTYT c)TYTTT
d)YTYTY e)a,b,c ve d şıklarının gelme olasılıkları eşittir.
2)Bir sayısal loto oyununda bir kişi 1’den 40’a kadar olan sayılardan 6 tanesini
seçmek zorundadır.Ahmet 1,2,3,4,5 ve 6 sayılarını,Nuray 39,1,17,33,8 ve 27
sayılarını seçmiştir.Sizce kimin kazanma olasılığı daha büyüktür?
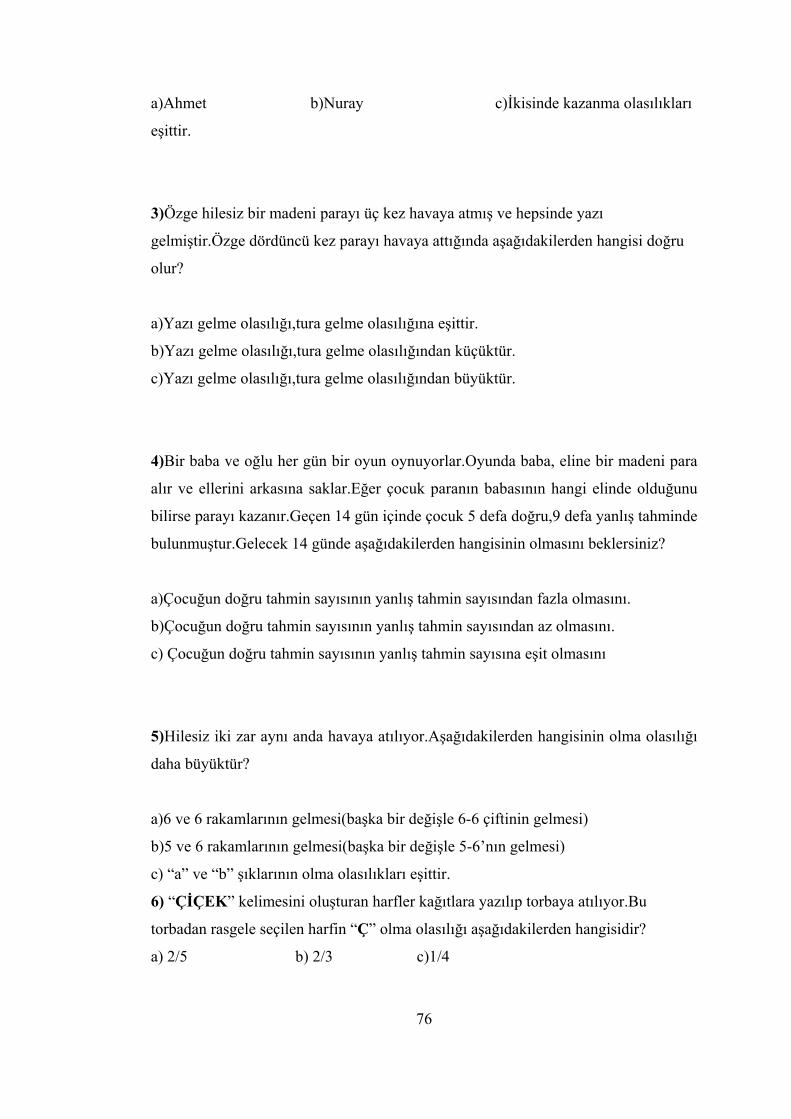
76
a)Ahmet b)Nuray c)İkisinde kazanma olasılıkları
eşittir.
3)Özge hilesiz bir madeni parayı üç kez havaya atmış ve hepsinde yazı
gelmiştir.Özge dördüncü kez parayı havaya attığında aşağıdakilerden hangisi doğru
olur?
a)Yazı gelme olasılığı,tura gelme olasılığına eşittir.
b)Yazı gelme olasılığı,tura gelme olasılığından küçüktür.
c)Yazı gelme olasılığı,tura gelme olasılığından büyüktür.
4)Bir baba ve oğlu her gün bir oyun oynuyorlar.Oyunda baba, eline bir madeni para
alır ve ellerini arkasına saklar.Eğer çocuk paranın babasının hangi elinde olduğunu
bilirse parayı kazanır.Geçen 14 gün içinde çocuk 5 defa doğru,9 defa yanlış tahminde
bulunmuştur.Gelecek 14 günde aşağıdakilerden hangisinin olmasını beklersiniz?
a)Çocuğun doğru tahmin sayısının yanlış tahmin sayısından fazla olmasını.
b)Çocuğun doğru tahmin sayısının yanlış tahmin sayısından az olmasını.
c) Çocuğun doğru tahmin sayısının yanlış tahmin sayısına eşit olmasını
5)Hilesiz iki zar aynı anda havaya atılıyor.Aşağıdakilerden hangisinin olma olasılığı
daha büyüktür?
a)6 ve 6 rakamlarının gelmesi(başka bir değişle 6-6 çiftinin gelmesi)
b)5 ve 6 rakamlarının gelmesi(başka bir değişle 5-6’nın gelmesi)
c) “a” ve “b” şıklarının olma olasılıkları eşittir.
6) “ÇİÇEK” kelimesini oluşturan harfler kağıtlara yazılıp torbaya atılıyor.Bu
torbadan rasgele seçilen harfin “Ç” olma olasılığı aşağıdakilerden hangisidir?
a) 2/5 b) 2/3 c)1/4
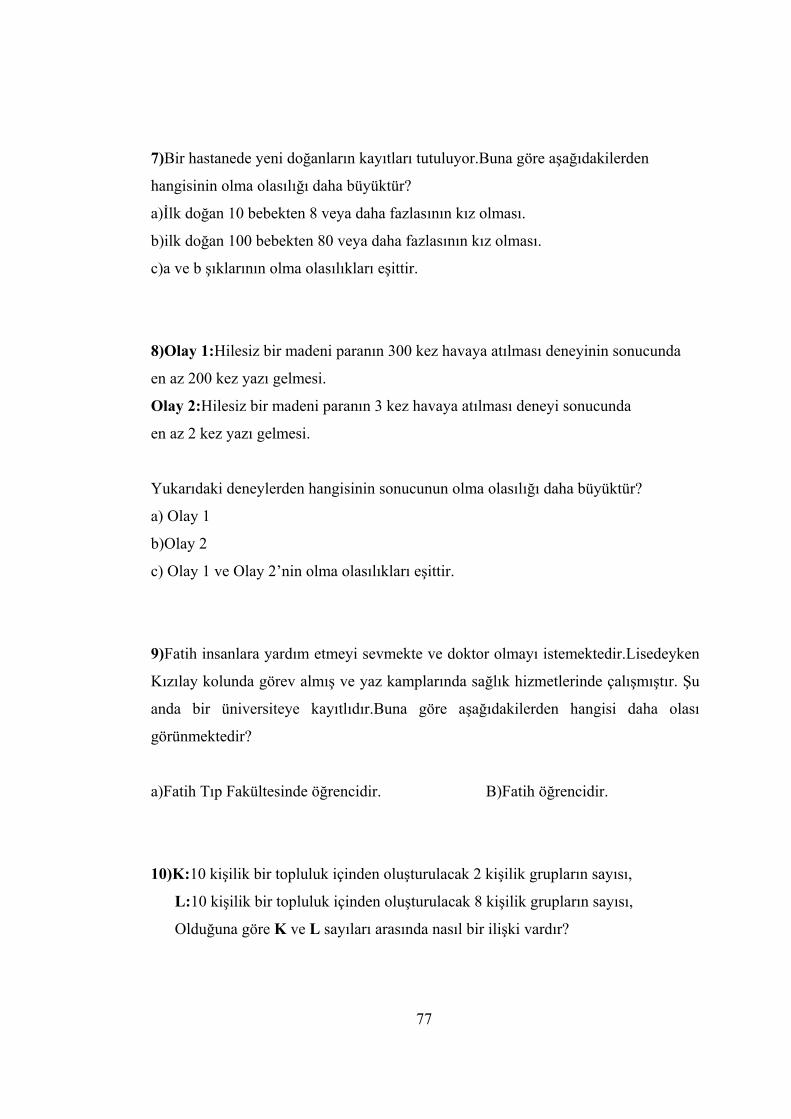
77
7)Bir hastanede yeni doğanların kayıtları tutuluyor.Buna göre aşağıdakilerden
hangisinin olma olasılığı daha büyüktür?
a)İlk doğan 10 bebekten 8 veya daha fazlasının kız olması.
b)ilk doğan 100 bebekten 80 veya daha fazlasının kız olması.
c)a ve b şıklarının olma olasılıkları eşittir.
8)Olay 1:Hilesiz bir madeni paranın 300 kez havaya atılması deneyinin sonucunda
en az 200 kez yazı gelmesi.
Olay 2:Hilesiz bir madeni paranın 3 kez havaya atılması deneyi sonucunda
en az 2 kez yazı gelmesi.
Yukarıdaki deneylerden hangisinin sonucunun olma olasılığı daha büyüktür?
a) Olay 1
b)Olay 2
c) Olay 1 ve Olay 2’nin olma olasılıkları eşittir.
9)Fatih insanlara yardım etmeyi sevmekte ve doktor olmayı istemektedir.Lisedeyken
Kızılay kolunda görev almış ve yaz kamplarında sağlık hizmetlerinde çalışmıştır. Şu
anda bir üniversiteye kayıtlıdır.Buna göre aşağıdakilerden hangisi daha olası
görünmektedir?
a)Fatih Tıp Fakültesinde öğrencidir. B)Fatih öğrencidir.
10)K:10 kişilik bir topluluk içinden oluşturulacak 2 kişilik grupların sayısı,
L:10 kişilik bir topluluk içinden oluşturulacak 8 kişilik grupların sayısı,
Olduğuna göre K ve L sayıları arasında nasıl bir ilişki vardır?
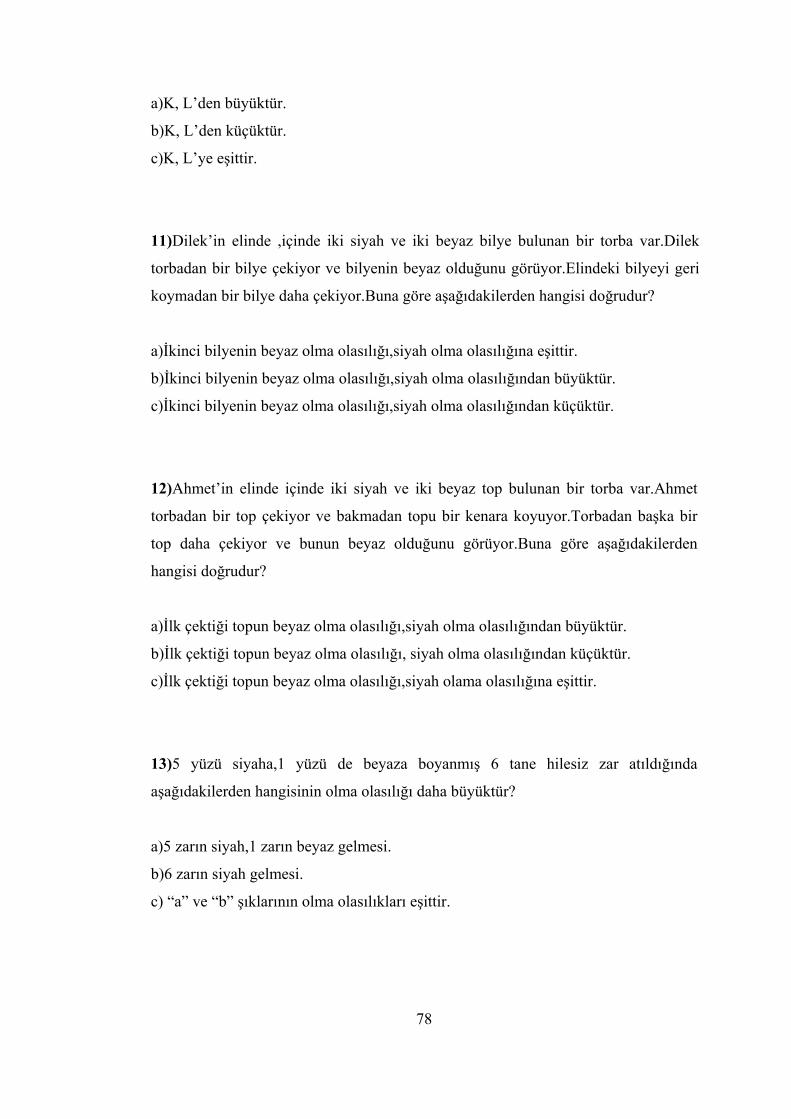
78
a)K, L’den büyüktür.
b)K, L’den küçüktür.
c)K, L’ye eşittir.
11)Dilek’in elinde ,içinde iki siyah ve iki beyaz bilye bulunan bir torba var.Dilek
torbadan bir bilye çekiyor ve bilyenin beyaz olduğunu görüyor.Elindeki bilyeyi geri
koymadan bir bilye daha çekiyor.Buna göre aşağıdakilerden hangisi doğrudur?
a)İkinci bilyenin beyaz olma olasılığı,siyah olma olasılığına eşittir.
b)İkinci bilyenin beyaz olma olasılığı,siyah olma olasılığından büyüktür.
c)İkinci bilyenin beyaz olma olasılığı,siyah olma olasılığından küçüktür.
12)Ahmet’in elinde içinde iki siyah ve iki beyaz top bulunan bir torba var.Ahmet
torbadan bir top çekiyor ve bakmadan topu bir kenara koyuyor.Torbadan başka bir
top daha çekiyor ve bunun beyaz olduğunu görüyor.Buna göre aşağıdakilerden
hangisi doğrudur?
a)İlk çektiği topun beyaz olma olasılığı,siyah olma olasılığından büyüktür.
b)İlk çektiği topun beyaz olma olasılığı, siyah olma olasılığından küçüktür.
c)İlk çektiği topun beyaz olma olasılığı,siyah olama olasılığına eşittir.
13)5 yüzü siyaha,1 yüzü de beyaza boyanmış 6 tane hilesiz zar atıldığında
aşağıdakilerden hangisinin olma olasılığı daha büyüktür?
a)5 zarın siyah,1 zarın beyaz gelmesi.
b)6 zarın siyah gelmesi.
c) “a” ve “b” şıklarının olma olasılıkları eşittir.
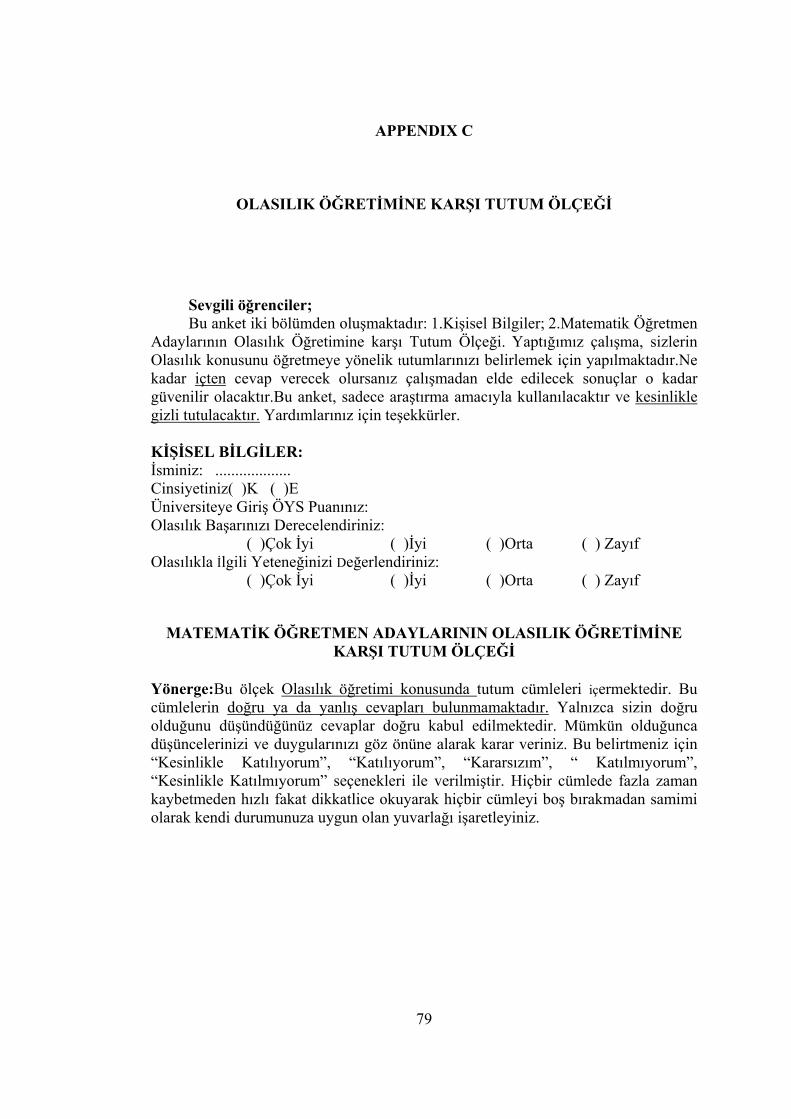
79
APPENDIX C
OLASILIK ÖĞRETİMİNE KARŞI TUTUM ÖLÇEĞİ
Sevgili öğrenciler; Bu anket iki bölümden oluşmaktadır: 1.Kişisel Bilgiler; 2.Matematik Öğretmen
Adaylarının Olasılık Öğretimine karşı Tutum Ölçeği. Yaptığımız çalışma, sizlerin Olasılık konusunu öğretmeye yönelik tutumlarınızı belirlemek için yapılmaktadır.Ne kadar içten cevap verecek olursanız çalışmadan elde edilecek sonuçlar o kadar güvenilir olacaktır.Bu anket, sadece araştırma amacıyla kullanılacaktır ve kesinlikle gizli tutulacaktır. Yardımlarınız için teşekkürler. KİŞİSEL BİLGİLER: İsminiz: ................... Cinsiyetiniz( )K ( )E Üniversiteye Giriş ÖYS Puanınız: Olasılık Başarınızı Derecelendiriniz: ( )Çok İyi ( )İyi ( )Orta ( ) Zayıf Olasılıkla İlgili Yeteneğinizi Değerlendiriniz: ( )Çok İyi ( )İyi ( )Orta ( ) Zayıf
MATEMATİK ÖĞRETMEN ADAYLARININ OLASILIK ÖĞRETİMİNE KARŞI TUTUM ÖLÇEĞİ
Yönerge:Bu ölçek Olasılık öğretimi konusunda tutum cümleleri içermektedir. Bu cümlelerin doğru ya da yanlış cevapları bulunmamaktadır. Yalnızca sizin doğru olduğunu düşündüğünüz cevaplar doğru kabul edilmektedir. Mümkün olduğunca düşüncelerinizi ve duygularınızı göz önüne alarak karar veriniz. Bu belirtmeniz için “Kesinlikle Katılıyorum”, “Katılıyorum”, “Kararsızım”, “ Katılmıyorum”, “Kesinlikle Katılmıyorum” seçenekleri ile verilmiştir. Hiçbir cümlede fazla zaman kaybetmeden hızlı fakat dikkatlice okuyarak hiçbir cümleyi boş bırakmadan samimi olarak kendi durumunuza uygun olan yuvarlağı işaretleyiniz.
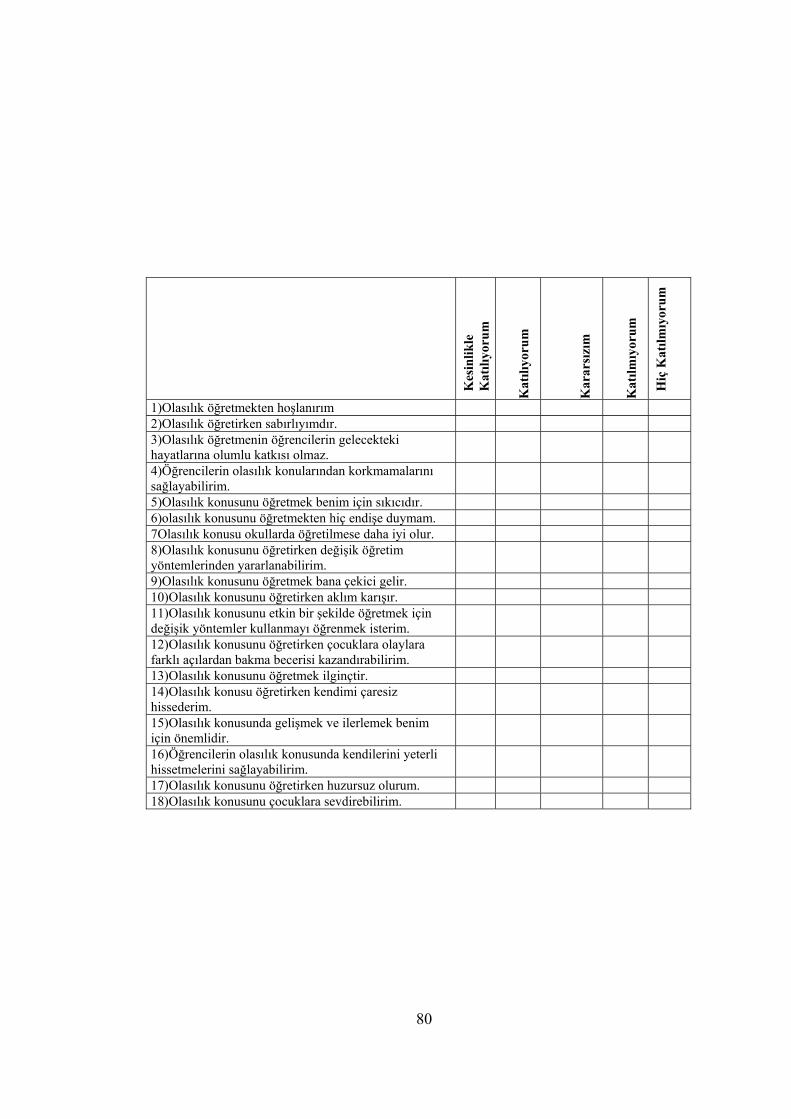
80
Kes
inlik
le
Katılı
yoru
m
Katılı
yoru
m
Kar
arsı
zım
Katılmıy
orum
Hiç
Katılmıy
orum
1)Olasılık öğretmekten hoşlanırım 2)Olasılık öğretirken sabırlıyımdır. 3)Olasılık öğretmenin öğrencilerin gelecekteki hayatlarına olumlu katkısı olmaz.
4)Öğrencilerin olasılık konularından korkmamalarını sağlayabilirim.
5)Olasılık konusunu öğretmek benim için sıkıcıdır. 6)olasılık konusunu öğretmekten hiç endişe duymam. 7Olasılık konusu okullarda öğretilmese daha iyi olur. 8)Olasılık konusunu öğretirken değişik öğretim yöntemlerinden yararlanabilirim.
9)Olasılık konusunu öğretmek bana çekici gelir. 10)Olasılık konusunu öğretirken aklım karışır. 11)Olasılık konusunu etkin bir şekilde öğretmek için değişik yöntemler kullanmayı öğrenmek isterim.
12)Olasılık konusunu öğretirken çocuklara olaylara farklı açılardan bakma becerisi kazandırabilirim.
13)Olasılık konusunu öğretmek ilginçtir. 14)Olasılık konusu öğretirken kendimi çaresiz hissederim.
15)Olasılık konusunda gelişmek ve ilerlemek benim için önemlidir.
16)Öğrencilerin olasılık konusunda kendilerini yeterli hissetmelerini sağlayabilirim.
17)Olasılık konusunu öğretirken huzursuz olurum. 18)Olasılık konusunu çocuklara sevdirebilirim.
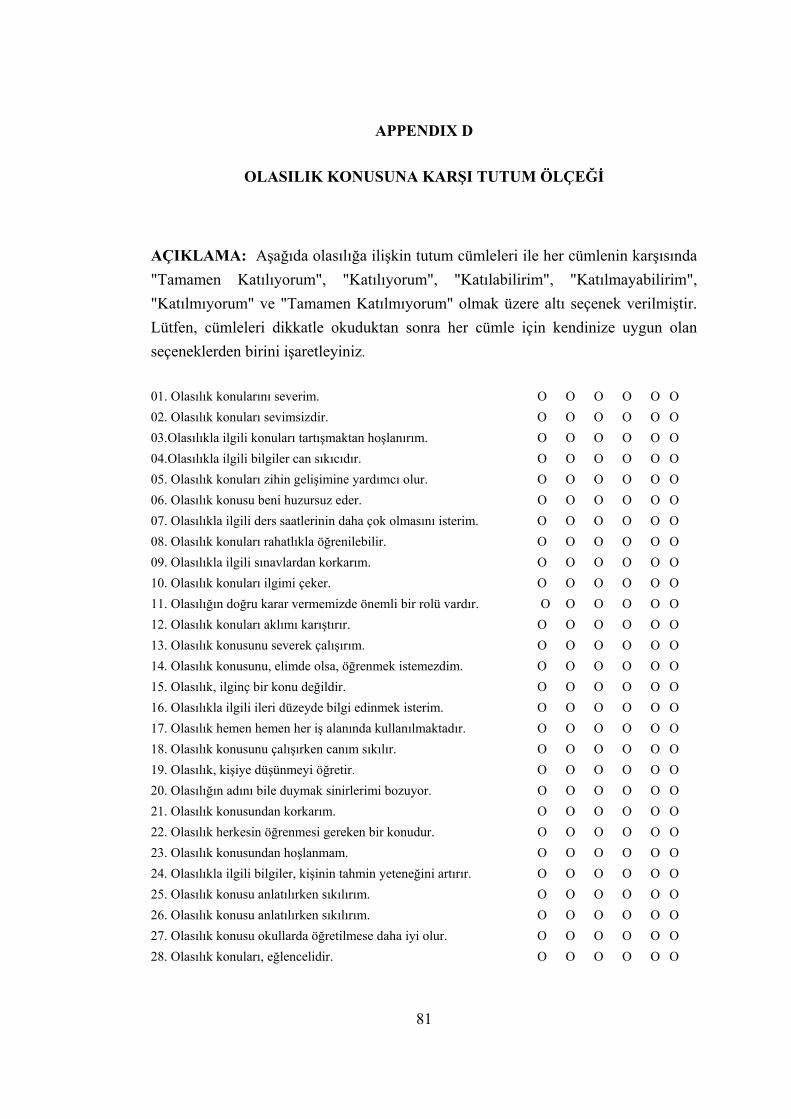
81
APPENDIX D
OLASILIK KONUSUNA KARŞI TUTUM ÖLÇEĞİ
AÇIKLAMA: Aşağıda olasılığa ilişkin tutum cümleleri ile her cümlenin karşısında "Tamamen Katılıyorum", "Katılıyorum", "Katılabilirim", "Katılmayabilirim", "Katılmıyorum" ve "Tamamen Katılmıyorum" olmak üzere altı seçenek verilmiştir. Lütfen, cümleleri dikkatle okuduktan sonra her cümle için kendinize uygun olan seçeneklerden birini işaretleyiniz.
01. Olasılık konularını severim. O O O O O O 02. Olasılık konuları sevimsizdir. O O O O O O 03.Olasılıkla ilgili konuları tartışmaktan hoşlanırım. O O O O O O 04.Olasılıkla ilgili bilgiler can sıkıcıdır. O O O O O O 05. Olasılık konuları zihin gelişimine yardımcı olur. O O O O O O 06. Olasılık konusu beni huzursuz eder. O O O O O O 07. Olasılıkla ilgili ders saatlerinin daha çok olmasını isterim. O O O O O O 08. Olasılık konuları rahatlıkla öğrenilebilir. O O O O O O 09. Olasılıkla ilgili sınavlardan korkarım. O O O O O O 10. Olasılık konuları ilgimi çeker. O O O O O O 11. Olasılığın doğru karar vermemizde önemli bir rolü vardır. O O O O O O 12. Olasılık konuları aklımı karıştırır. O O O O O O 13. Olasılık konusunu severek çalışırım. O O O O O O 14. Olasılık konusunu, elimde olsa, öğrenmek istemezdim. O O O O O O 15. Olasılık, ilginç bir konu değildir. O O O O O O 16. Olasılıkla ilgili ileri düzeyde bilgi edinmek isterim. O O O O O O 17. Olasılık hemen hemen her iş alanında kullanılmaktadır. O O O O O O 18. Olasılık konusunu çalışırken canım sıkılır. O O O O O O 19. Olasılık, kişiye düşünmeyi öğretir. O O O O O O 20. Olasılığın adını bile duymak sinirlerimi bozuyor. O O O O O O 21. Olasılık konusundan korkarım. O O O O O O 22. Olasılık herkesin öğrenmesi gereken bir konudur. O O O O O O 23. Olasılık konusundan hoşlanmam. O O O O O O 24. Olasılıkla ilgili bilgiler, kişinin tahmin yeteneğini artırır. O O O O O O 25. Olasılık konusu anlatılırken sıkılırım. O O O O O O 26. Olasılık konusu anlatılırken sıkılırım. O O O O O O 27. Olasılık konusu okullarda öğretilmese daha iyi olur. O O O O O O 28. Olasılık konuları, eğlencelidir. O O O O O O
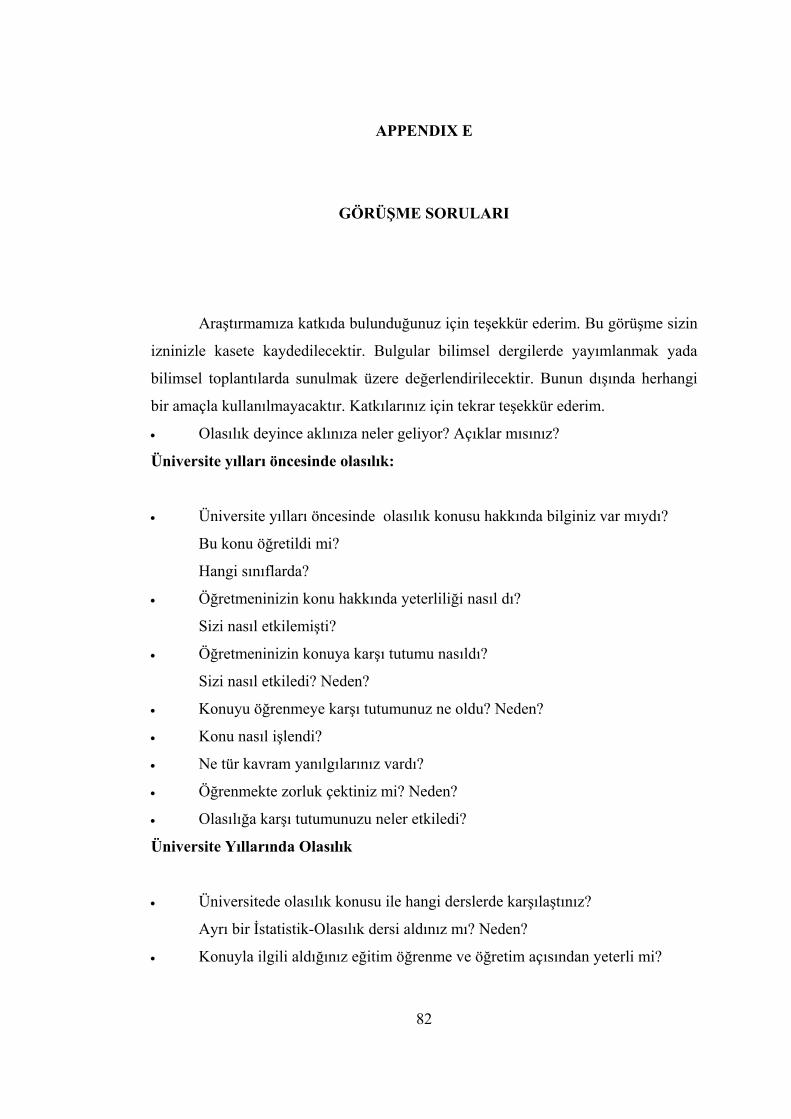
82
APPENDIX E
GÖRÜŞME SORULARI
Araştırmamıza katkıda bulunduğunuz için teşekkür ederim. Bu görüşme sizin
izninizle kasete kaydedilecektir. Bulgular bilimsel dergilerde yayımlanmak yada
bilimsel toplantılarda sunulmak üzere değerlendirilecektir. Bunun dışında herhangi
bir amaçla kullanılmayacaktır. Katkılarınız için tekrar teşekkür ederim.
• Olasılık deyince aklınıza neler geliyor? Açıklar mısınız?
Üniversite yılları öncesinde olasılık:
• Üniversite yılları öncesinde olasılık konusu hakkında bilginiz var mıydı?
Bu konu öğretildi mi?
Hangi sınıflarda?
• Öğretmeninizin konu hakkında yeterliliği nasıl dı?
Sizi nasıl etkilemişti?
• Öğretmeninizin konuya karşı tutumu nasıldı?
Sizi nasıl etkiledi? Neden?
• Konuyu öğrenmeye karşı tutumunuz ne oldu? Neden?
• Konu nasıl işlendi?
• Ne tür kavram yanılgılarınız vardı?
• Öğrenmekte zorluk çektiniz mi? Neden?
• Olasılığa karşı tutumunuzu neler etkiledi?
Üniversite Yıllarında Olasılık
• Üniversitede olasılık konusu ile hangi derslerde karşılaştınız?
Ayrı bir İstatistik-Olasılık dersi aldınız mı? Neden?
• Konuyla ilgili aldığınız eğitim öğrenme ve öğretim açısından yeterli mi?
83
Nasıl olmasını isterdiniz? Neden?
• Bu konu matematikten ayrı düşünülebilir mi? Neden?
• Aldığın öğretim metotları ve materyal geliştirme dersinde olasılık konusu ile
ilgili çalışma yaptınız mı?
Yeterlimiydi? Neden?
Nasıl olmasını isterdiniz? Neden?
• Üniversitede aldığınız eğitim konuya karşı tutumunuzu nasıl etkiledi? Neden?
• Başarınız nasıldı? Neden?
• Başarınız konuya karşı tutumunuzu nasıl etkiledi? Neden?
• Sizce kavram yanılgıları neden oluşmakta?
• Kavram yanılgılarınız farkında mısınız?
Daha önceki kavram yanılgılarınız devam ediyor mu? Neden?
• Kavram yanılgılarınızla başarınız arasıda nasıl bir ilişki var? Neden?
Üniversite Sonrası Öğretmen Gözüyle Olasılık
• Üniversiteyi bitiriyorsunuz. Bir öğretmen olarak olasılık konusunu
müfredattaki yeri nedir?
Hangi seviyelerde öğretiliyor?
Olasılık için ayrılan zaman yeterli mi? Neden?
Olasılık konusu hangi kavramları kapsıyor?
Olasılık ilgili içerik yeterli mi? Neden?
• Bir öğretmen olarak olasılığı nasıl öğretmeyi düşünüyorsunuz?
Öğretim tekniklerinin farkında mısınız?
• Olasılık konusunu öğretme hakkında ne düşünüyorsunuz? Neden?
• Konuyu öğretmekle ilgili tutumunuzu neler etkiler?
Öğrencilerinizin mi yoksa sizin kavram yanılgılarınız mı daha etkili?
Öğrencilerinizin mi yoksa sizin başarınız mı daha etkili?
Öğrencilerinizin olasılığa karşı tutumumu yoksa sizin tutumunuz mu daha
etkili?
• Sizce cinsiyetin olasılık başarısına etkisi var mı?