Embed Size (px)
Citation preview
Factors Affecting the Choices of Coping Strategies for Climate Extremes: The C ase of Farmers in the Nile Basin of Ethiopia
Temesgen Tadesse DeressaPostdoctoral Research Fellow, Center for Environmental Economics and Policy for Africa,
Department of Agricultural Economics and Rural Development, University of PretoriaEmail: [email protected]
Claudia RinglerInternational Food Policy Research Institute
Senior Research Fellow, Environment Production and Technology Division
Rashid M. HassanDirector, Center for Environmental Economics and Policy for Africa, Department of Agricultural
Economics and Rural Development, University of Pretoria
August 2010
i i
Contents
1. Background.…………………………………………………….…...……….........................2
2. Climate systems in Ethiopia.............................................................................. 4
3. Climate Risk Management and Coping in Ethiopia ................................ ................ 12
4. Empirical Model........................................................................................... 14
5. Study area .................................................................................................. 16
6. Data sources................................ ................................ ................................ 18
7. Empirical specification of model variables........................................................... 25
8. Model results and discussion................................ ................................ ............ 26
10. References................................ ................................ ................................ 35
Deleted: 25
iii
Tables
T able 1: Traditional climatic zones and their physical characteristics................................. . 5
T able 2: Chronology of the Effect of Drought/Famine in Ethiopia (1965-2009).................... 10
T able 3: Climate predictions for 2050 and 2100 (Changes from a 1961- 1990 base for SRES... 11
T able 4: Distribution of sampled villages................................................................... 19
T able 5: Basic household characteristics of the surveyed farmers..................................... 20
T able 6: Basic assets of the respondents................................ ................................ .... 20
T able 7: Access to basic services and infrastructure ...................................................... 21
T able 8: Annual average temperature and rainfall across the surveyed ............................... 22
T able 9: Major shocks encountered by surveyed farmers................................ ................ 22
T able 10: Effects of shocks on surveyed farmers.......................................................... 23
T able 11: Description of coping strategies.................................................................. 25
T able 12: Description of independent variables ........................................................... 25
T able 13 Parameter estimates of the multinomial logit of climate coping strategies model....... 30
T able 14: Marginal effects from the multinomial logit of climate coping strategies model ....... 32
Figures
Figure 1: Agro-ecological zones of Ethiopia ................................................................ 7
Figure 2: year to year variability of annual rainfall and trend over Ethiopia expressed in
normalized deviation (compared to 1971-2000 normal) .................................................. 9
Figure 3: Percent share of Agricult ure GDP................................ ................................ . 9
Figure 4: Survey districts along with their agro-ecological settings in the Nile Basin of Ethiopia
...................................................................................................................... 17
Figure 5: Coping strategies to major environmental shocks............................................. 23
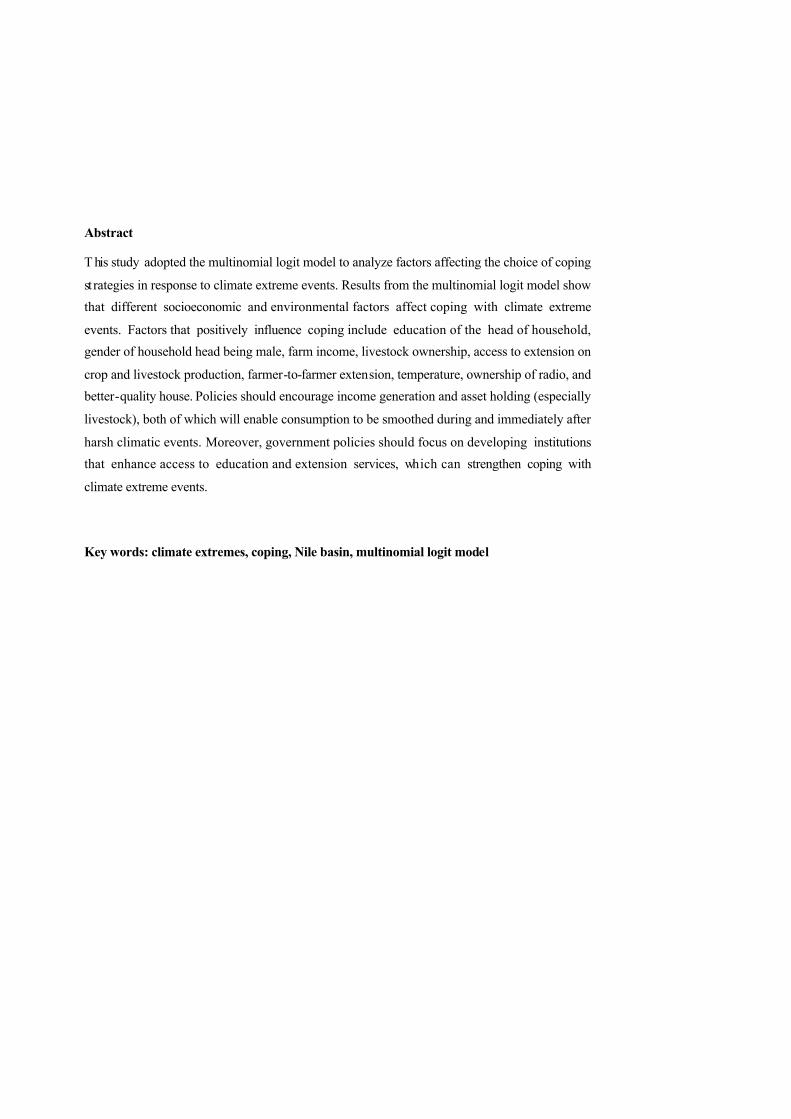
Abstract
T his study adopted the multinomial logit model to analyze factors affecting the choice of coping
st rategies in response to climate extreme events. Results from the multinomial logit model show
that different socioeconomic and environmental factors affect coping with climate extreme
events. Factors that positively influence coping include education of the head of household,
gender of household head being male, farm income, livestock ownership, access to extension on
crop and livestock production, farmer-to-farmer extension, temperature, ownership of radio, and
better-quality house. Policies should encourage income generation and asset holding (especially
livestock), both of which will enable consumption to be smoothed during and immediately after
harsh climatic events. Moreover, government policies should focus on developing institutions
that enhance access to education and extension services, which can strengthen coping with
climate extreme events.
Key words: climate extremes, coping, Nile basin, multinomial logit model
2
1. Background
Ethiopia is challenged by both social and natural problems. The main social problem is poverty.
Approximately 85 percent of the total population lives under the international poverty line
(MoFED 2007), and the country’s human development index (HDI) is 0.406, ranking 169 out of
177 countries (UNDP 2008). Poverty in the country is associated with high population growth, a
low level of institutional and infrastructural setups, and a low level of technology employed,
especially in the agricultural sector, which dominates the country’s economy (Admassie and
Adenew 2007). The country’s main environmental problem is the recurrent droughts. Because
the country’s agriculture mainly depends on rainfall, drought highly affects agricultural
production and the livelihood of the farming population. Droughts in Ethiopia can shrink
household farm production by up to 90 percent of a normal year output (World Bank 2003) and
lead to the death of livestock and human beings.
T he recorded history of drought in Ethiopia dates back to 250 B.C. Since then, droughts have
occurred in different parts of the country at different times (Webb, von Braun, and Yohannes
1994). Studies show that the frequency of drought has increased over the past few decades,
especially in the lowlands (Lautze et al. 2003; NMS 2007). Floods and hailstorms are two other
natural extreme events that affect Ethiopian farmers, though they are not pronounced as is the
case of drought.
In response to the recurrent droughts and related environmental calamities, farmers in Ethiopia
have developed different coping strategies. Belay et al. (2005, MoFED (2007), and Devereux
and Guenther (2007) all identified main coping strategies employed by farmers during climate
extreme events, especially drought. For instance, a country-level study conducted by the
Ethiopia’s Ministry of Finance and Economic Development (MoFED 2007) on the ability of
farmers to cope with shocks revealed that the main coping strategies include sale of animals (40
percent), loan from relatives (18 percent), sale of crop outputs (14 percent), and own cash (9
percent. Although informative, factors affecting the choice of any of or the combinations of
coping methods were not clearly identified .Knowledge of the factors dictating the use of coping
methods would assist in targeting intervention windows toward effective coping mechanisms to
reduce the harmful impacts of climatic extremes. Therefore, the main objective of this paper is to
3
identify and analyze the factors affecting the choice of coping mechanisms for climate extreme
events by taking the case of Ethiopia’s Nile basin.
Section 2 describes Ethiopia’s climatic systems. Section 3 presents a review of literature on
climatic risk management and coping strategies. Methodological approach, study area, and data
are presented in Section 4. Section 5 discusses the results of the analysis, and Section 6
concludes and gives policy recommendations.
4
2. Climate Systems in Ethiopia
2.1 Agroecological Features of Ethiopia
T he climate of Ethiopia is mainly controlled by the seasonal migration of the Intertropical
Convergence Zone (ITCZ), which follows the position of the sun relative to Earth and the
associated atmospheric circulation, in conjunction with the country’s complex topography
(NMSA 2001). There are different ways of classifying Ethiopia’s climatic systems, including the
traditional, the Köppen, the Thornthwaite, the rainfall regime, and the agroclimatic zone
classification systems (Yohannes 2003).
T he most commonly used classification systems are the traditional and the agroecological zones
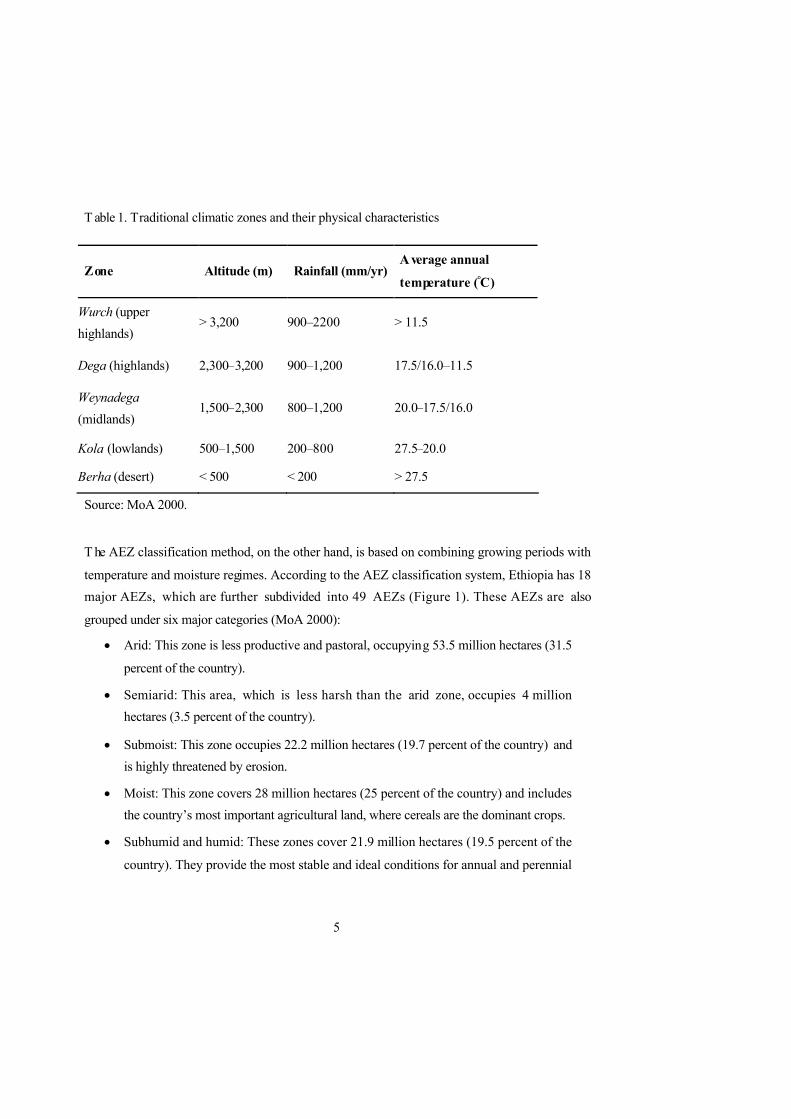
(AEZs). According to the traditional classification system, which mainly relies on altitude and
temperature, Ethiopia has five climatic zones (Table 1).
5
T able 1. Traditional climatic zones and their physical characteristics
Zone Altitude (m) Rainfall (mm/yr)A verage annual
temperature (°C)
Wurch (upper
highlands)> 3,200 900–2200 > 11.5
Dega (highlands) 2,300–3,200 900–1,200 17.5/16.0–11.5
Weynadega
(midlands)1,500–2,300 800–1,200 20.0–17.5/16.0
Kola (lowlands) 500–1,500 200–800 27.5–20.0
Berha (desert) < 500 < 200 > 27.5
Source: MoA 2000.
T he AEZ classification method, on the other hand, is based on combining growing periods with
temperature and moisture regimes. According to the AEZ classification system, Ethiopia has 18
major AEZs, which are further subdivided into 49 AEZs (Figure 1). These AEZs are also
grouped under six major categories (MoA 2000):
Arid: This zone is less productive and pastoral, occupying 53.5 million hectares (31.5
percent of the country).
Semiarid: This area, which is less harsh than the arid zone, occupies 4 million
hectares (3.5 percent of the country).
Submoist: This zone occupies 22.2 million hectares (19.7 percent of the country) and
is highly threatened by erosion.
Moist: This zone covers 28 million hectares (25 percent of the country) and includes
the country’s most important agricultural land, where cereals are the dominant crops.
Subhumid and humid: These zones cover 21.9 million hectares (19.5 percent of the
country). They provide the most stable and ideal conditions for annual and perennial

6
crops and are home to the remaining forest and wildlife. These zones also have the
most biological diversity.
Perhumid: This zone covers about 1 million hectares (close to 1 percent of the
country) and is suited for perennial crops and forests.
7
Figure 1. Ethiop ia’s agroecological zones
Source: IFPRI, CSA, and EDRI 2006.
8
Over these diverse AEZs, mean annual rainfall and temperature vary widely, ranging from about
2,000 millimeters over some pocket areas in the southwest to less than 250 millimeters over the
Afar lowlands in the northeast and Ogaden in the southeast. Mean annual temperature varies
from about 10 degrees Celsius over the high tablelands of the northwest, central, and southeast to
about 35 degrees Celsius on the northeastern edges.
2.2 Past Trends of Climate in Ethiopia
In addition to var iations in different parts of the country, the Ethiopian climate is also
characterized by a history of climate extremes, such as drought and flood, and increasing
temperature and decreasing precipitation trends. The history of climate extremes, especially
drought, is not a new phenomenon in Ethiopia. Recorded history of drought in Ethiopia dates
back to 250 B.C., and since then droughts have occurred in different parts of the country at
different times (Webb et al. 1994). Even though there has been a long history of drought, studies
show that the frequency of drought has increased over the past few decades, especially in the
lowlands (Lautze et al. 2003; NMS 2007).
Studies also indicate that temperature and precipitation have been changing over time. According
to NMS (2007), annual minimum temperature has been increasing by about 0.37 degrees Celsius
every 10 years over the past 55 years. The country’s average annual rainfall has recently shown a
very high level of variability, even though the trend has remained more or less constant (NMS
2007). For the past 55 years, some years have been characterized by dry rainfall conditions,
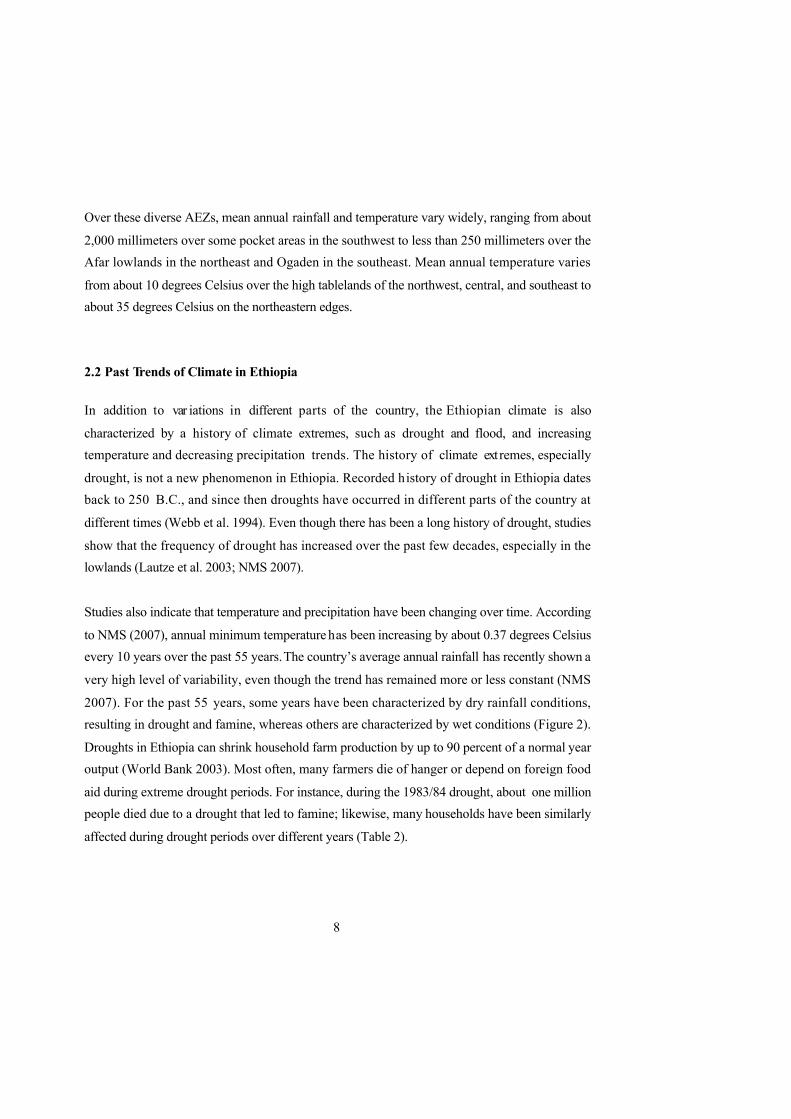
resulting in drought and famine, whereas others are characterized by wet conditions (Figure 2).
Droughts in Ethiopia can shrink household farm production by up to 90 percent of a normal year
output (World Bank 2003). Most often, many farmers die of hanger or depend on foreign food
aid during extreme drought periods. For instance, during the 1983/84 drought, about one million
people died due to a drought that led to famine; likewise, many households have been similarly
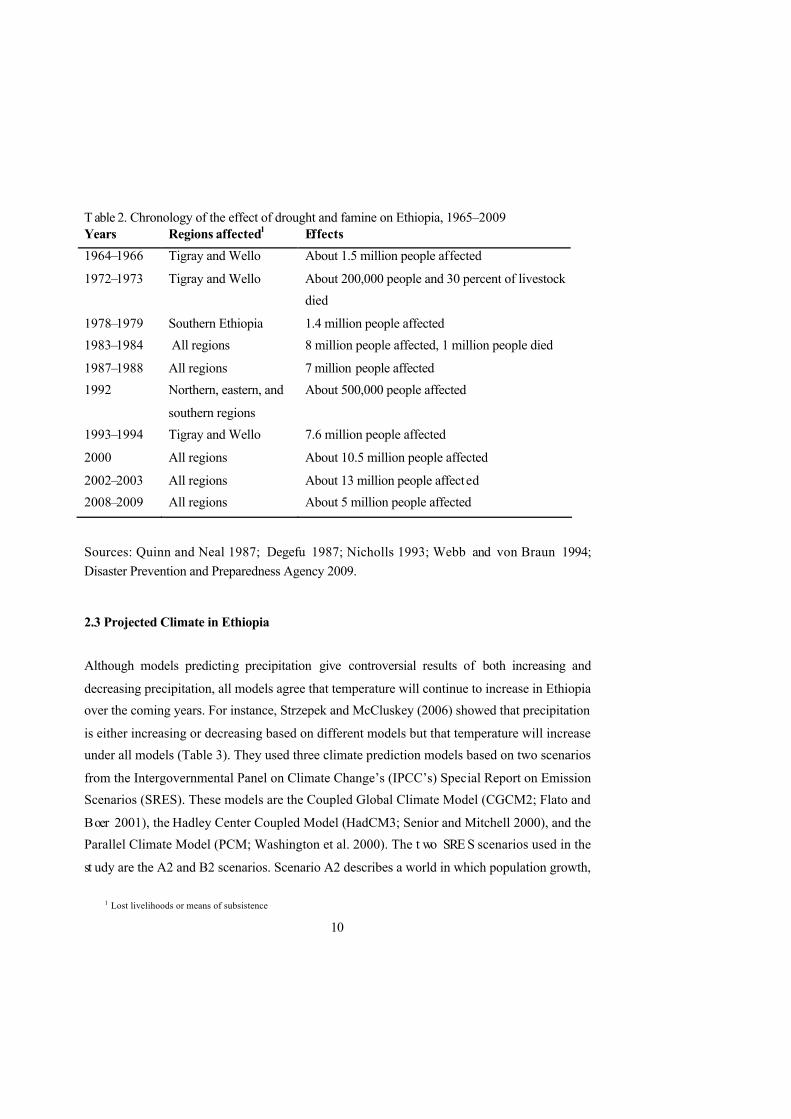
affected during drought periods over different years (Table 2).
9
Figure 2. Year-to-year variability and trends of annual rainfall over Ethiopia, expressed in normalized deviation (compared with 1971–2000 normal)
Source: NMS 2007.
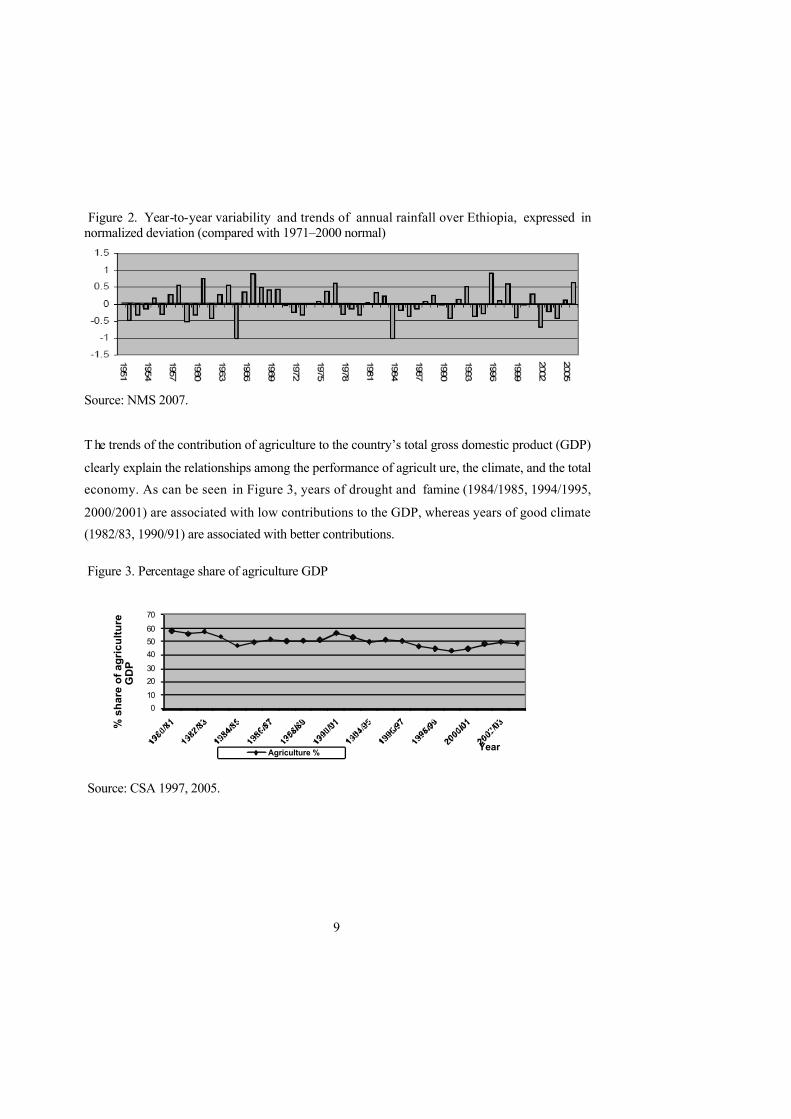
T he trends of the contribution of agriculture to the country’s total gross domestic product (GDP)
clearly explain the relationships among the performance of agricult ure, the climate, and the total
economy. As can be seen in Figure 3, years of drought and famine (1984/1985, 1994/1995,
2000/2001) are associated with low contributions to the GDP, whereas years of good climate
(1982/83, 1990/91) are associated with better contributions.
Figure 3. Percentage share of agriculture GDP
0
10
20
30
40
50
60
70
% s
ha
re o
f a
gri
cu
ltu
re
GD
P
YearAgriculture %
Source: CSA 1997, 2005.
10
T able 2. Chronology of the effect of drought and famine on Ethiopia, 1965–2009Years Regions affected1 Effects
1964–1966 Tigray and Wello About 1.5 million people affected
1972–1973 Tigray and Wello About 200,000 people and 30 percent of livestock
died
1978–1979 Southern Ethiopia 1.4 million people affected
1983–1984 All regions 8 million people affected, 1 million people died
1987–1988 All regions 7 million people affected
1992 Northern, eastern, and
southern regions
About 500,000 people affected
1993–1994 Tigray and Wello 7.6 million people affected
2000 All regions About 10.5 million people affected
2002–2003 All regions About 13 million people affected
2008–2009 All regions About 5 million people affected
Sources: Quinn and Neal 1987; Degefu 1987; Nicholls 1993; Webb and von Braun 1994;
Disaster Prevention and Preparedness Agency 2009.
2.3 Projected Climate in Ethiopia
Although models predicting precipitation give controversial results of both increasing and
decreasing precipitation, all models agree that temperature will continue to increase in Ethiopia
over the coming years. For instance, Strzepek and McCluskey (2006) showed that precipitation
is either increasing or decreasing based on different models but that temperature will increase
under all models (Table 3). They used three climate prediction models based on two scenarios
from the Intergovernmental Panel on Climate Change’s (IPCC’s) Special Report on Emission
Scenarios (SRES). These models are the Coupled Global Climate Model (CGCM2; Flato and
Boer 2001), the Hadley Center Coupled Model (HadCM3; Senior and Mitchell 2000), and the
Parallel Climate Model (PCM; Washington et al. 2000). The t wo SRE S scenarios used in the
st udy are the A2 and B2 scenarios. Scenario A2 describes a world in which population growth,
1 Lost livelihoods or means of subsistence
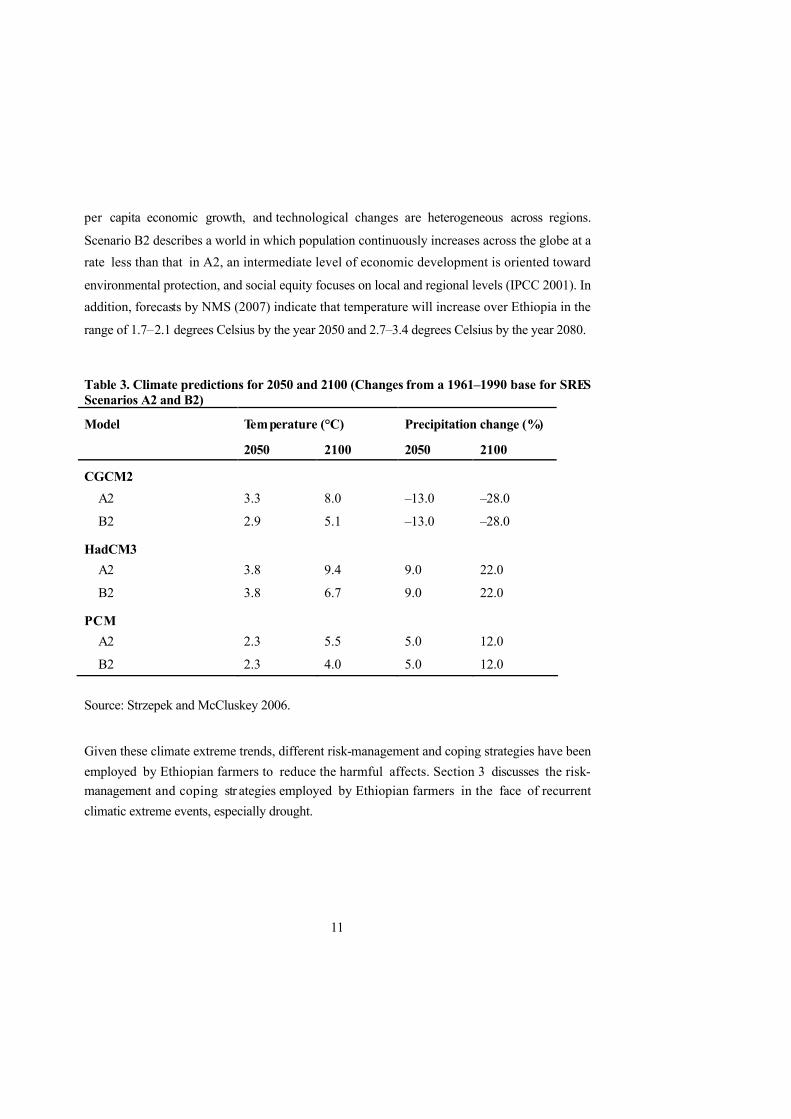
11
per capita economic growth, and technological changes are heterogeneous across regions.
Scenario B2 describes a world in which population continuously increases across the globe at a
rate less than that in A2, an intermediate level of economic development is oriented toward
environmental protection, and social equity focuses on local and regional levels (IPCC 2001). In
addition, forecasts by NMS (2007) indicate that temperature will increase over Ethiopia in the
range of 1.7–2.1 degrees Celsius by the year 2050 and 2.7–3.4 degrees Celsius by the year 2080.
Table 3. Climate predictions for 2050 and 2100 (Changes from a 1961–1990 base for SRES Scenarios A2 and B2)
Temperature (°C) Precipitation change (%)Model
2050 2100 2050 2100
CGCM2
A2
B2
3.3
2.9
8.0
5.1
–13.0
–13.0
–28.0
–28.0
HadCM3
A2
B2
3.8
3.8
9.4
6.7
9.0
9.0
22.0
22.0
PCM
A2
B2
2.3
2.3
5.5
4.0
5.0
5.0
12.0
12.0
Source: Strzepek and McCluskey 2006.
Given these climate extreme trends, different risk-management and coping strategies have been
employed by Ethiopian farmers to reduce the harmful affects. Section 3 discusses the risk-
management and coping str ategies employed by Ethiopian farmers in the face of recurrent
climatic extreme events, especially drought.
12
3. Climate Risk Management and Coping in Ethiopia
Both household- and public-level climate risk management through mitigation and coping
practices are undertaken to reduce the damages from climate change. Risk-mitigation strategies
at household levels include diversifying crops, mixing crop and livestock production, keeping
multiple species of livestock, and joining rotating credit groups.
Coping strategies at the household level include selling productive assets, selling livestock and
agricultural products, reducing current investment and consumption, employing child labor,
temporarily or permanently migrating, mortgaging land, and using interhousehold transfers and
loans. A country-level study conducted by MoFED (2007) on the ability of farmers to cope with
shocks revealed that the main coping strategies include sale of animals (40 percent), loan from
relatives (18 percent), sale of crop outputs (14 percent), and own cash (9 percent).
Public-level risk-mitigation st rategies include water harvesting, conserving and managing
resources, irrigating, partaking in voluntary resettlement programs, using household extension
packages or agroecological packages, and joining productive safety net programs. There are also
the new pilot studies on weather-indexed drought insurance and commodity exchange programs.
Coping st rategies include free food distribution (mainly from food aid) and food-for-work
programs (MoFED 2007 Devereux and Guenther 2007). Food aid has become one of the most
important coping strategies for fighting drought and famine. For instance, Ethiopia required
about 896,963 metric tons of food aid during the 2000/01 drought and about US$455 million
worth of food aid during the 2008/09 drought (Disaster Prevention and Preparedness Agency
2009).
Even though they are very important for vulnerability reduction, both the household- and public-
level risk-mitigation and coping strategies have not been fully effective. Household risk-
management strategies are ineffective mainly because they achieve partial insurance at a very
high cost. These strategies are localized and are limited in scope. In addition, informal insurances

13
marginalize the most vulnerable and have high hidden costs (World Bank 2003). The limitations
of public risk-management strategies include limitation of coverage, weak institutional linkages
among stakeholders who deal with risk management, poor early warning mechanisms, and
dependence on foreign sources for food aid (World Bank 2003, Devereux and Guenther 2007).
14
4. Empirical Model
T he multinomial logit (MNL) model is used to analyze the determinants of farmers’ choice of
coping st rategies in Ethiopia’s Nile basin. This model can be used to analyze crop
(K ur ukulasuriya and Mendelsohn 2008; Hassan and Nhemachena 2008) and livestock (Seo and
Mendelsohn 2008) choices as methods for adapting to the negative impacts of climate change.
T he advantages of the MNL are that it permits the analysis of decisions across more than two
categories, allowing the determination of choice probabilities for different categories (Madalla
1983; Wooldridge 2002) and that it is computationally simple (Tse 1987).
T o describe the MNL model, let y denote a random variable taking on the values {1,2…J} for a
positive integer J , and let x denote a set of conditioning variables. In this case, y denotes
adaptation options or categories, and x contains different household, institutional, and
environmental attributes. The question is how cetirus paribus changes in the elements of x affect
the response probabilities JjxjyP ....,2,1),/( . Because the probabilities must sum to unity,
)/( xjyP is determined once we know the probabilities for Jj ...,2 .
Let x be a K1 vector with first -element unity. The MNL model has response probabilities
1
( | ) exp( ) / 1 exp( ), 1,.....J
j hh
P y j x x x j J
, (1)
where B j i s K ×1, j=2…J.
For this study, there are seven coping strategies or response probabilities:
1.Did nothing
2.Sold livestock
3.Sold livestock and borrowed from relatives
4.Sold livestock and ate less
5.Sold livestock and engaged in food for work
6.Depended on food aid and liquidated other assets
7.Participated in off-farm opportunities
Unbiased, consistent parameter estimates of the MNL model in equation (1) require the
15
assumption of independence of irrelevant alternatives (IIA) to hold. More specifically, the IIA
assumption requires that the probability of using a certain adaptation method by a given
household must be independent of the probability of choosing another adaptation method (that is,
P j/Pk is independent of the remaining probabilities). The premise of the IIA assumption is the
independent and homoscedastic disturbance terms of the basic model in equation (1).
T he parameter estimates of the MNL model only provide the direction of the effect of the
independent var iables on the dependent (response) variable; estimates represent neither the
actual magnitude of change nor the probabilities. Differentiating equation (1) with respect to the
explanatory variables provides marginal effects of the explanatory variables, given as
1
1
( )J
jj jk j jk
Jk
PP P
x
.(2)
T he marginal effects, or marginal probabilities, are functions of the probability itself. They
measure the expected change in probability of a particular choice being made with respect to a
unit change in an independent variable from the mean (Green 2000).
16
5. Study Area
T he Nile basin of Ethiopia was chosen as the study area for this research. This region extends
over about 358,889 square kilometers, which is equivalent to 34 percent of Ethiopia’s total
geographic area. About 40 percent of the country’s population lives in this basin, which covers
six different regional states of Ethiopia in different proportions—38 percent of the total land area
of Amhara, 24 percent of Oromia, 15 percent of Benishangul-Gumuz, 11 percent of Tigray, 7
percent of Gambella, and 5 percent of Southern Nations, Nationalities, and People’s Region
(SNNPR) (MoWR 1998).
T he three major rivers in the basin are Abay River, originating from the central highlands; the
T ekezé River, originating from the northwestern parts of the country; and the Baro-Akobo River,
which originates from the southwestern part of the country. The total annual surface runoff of the
three rivers is estimated at 80.83 billion cubic meters per year, which amounts to nearly 74
percent of all water supplied by Ethiopia’s 12 river basins (MoWR 1998).
T he survey households in Ethiopia’s Nile basin fall under three of the country’s five traditional
agroecological settings. For instance, Bereh Aleltu district is located in dega (highland), whereas
Wonbera and Limu districts are located in kola (lowland) and weynadega (midland)
agroecological zones, respectively. Figure 4 displays the survey districts with their
agroecological classifications.
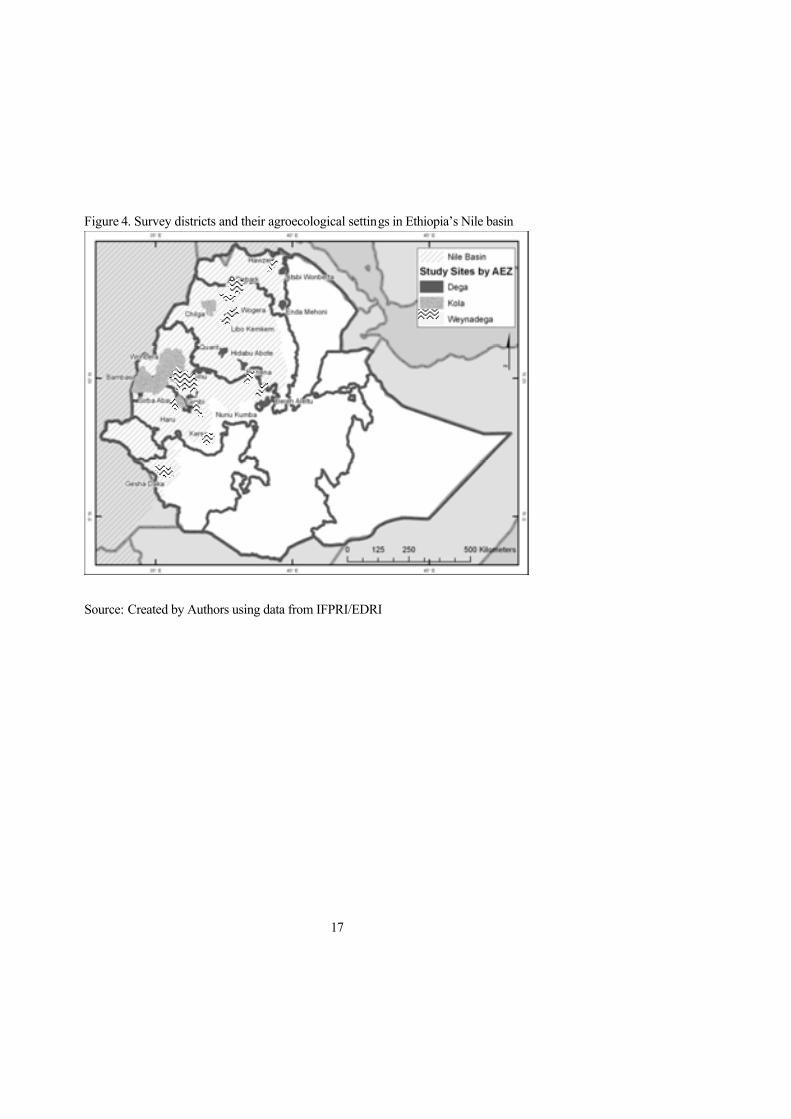
17
Figure 4. Survey districts and their agroecological settings in Ethiopia’s Nile basin
Source: Created by Authors using data from IFPRI/EDRI
18
6. Data Sources
T he data used for this study were obtained from a household survey of farmers during the
2004/05 production year in Ethiopia’s Nile basin. The Internat ional Food Policy Research
Institute (IFPRI), in collaboration with the Ethiopian Development Research Institute (EDRI),
conducted this cross-section survey. Sample districts were purposely selected to include different
attributes of the basin, including traditional typology of agroecological zones in the country,
degree of irrigation activity (percentage of cultivated land), average annual rainfall, rainfall
variability, and vulnerability (food aid–dependent population).
Peasant administrations from each district were also purposely selected to include households
that irrigate their farms. One peasant administration was selected from each district, so that there
were 20 districts and 20 peasant administrations. The inclusion of peasant administrations, which
included farmers irrigating their farms, led to the selection of 162 villages (gots). Fifty farmers
were randomly selected from each peasant association, making the total number of households
interviewed 1,000. Of the 20 districts surveyed, three districts were found in Tigray, six in
Amhara, seven in Oromia, three in Benishangul-Gumuz, and one in SNNPR. Table 4
summarizes the distributions of sampled villages.
Collected data covered include household characteristic, incidence of different climatic and other
shocks over the past five years, food aid, land tenure, machinery ownership, rainfed and irrigated
agriculture, livestock production, access to credit, access to market and access to extension,
expenditure on food, income, perceptions of climate change, adaptation options, and social
capital. Moreover, temperature and rainfall data for the surveyed seasons were obtained from a
global climate database developed by the University of East Anglia (Mitchell and Jones 2005).
6.1. Selected Socioeconomic and Climatic Conditions in the Study Districts
6.1.1 Household Characteristics
Family size in the study was generally high, with an average of 6.13 persons. The average age of
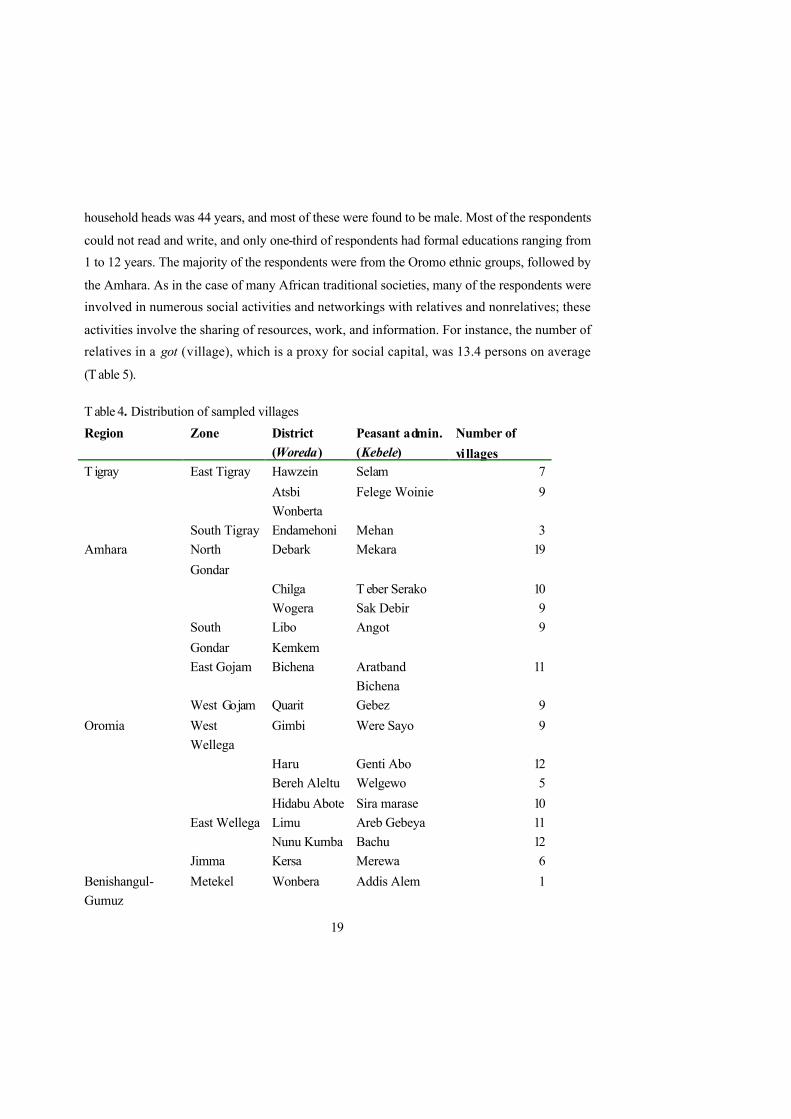
19
household heads was 44 years, and most of these were found to be male. Most of the respondents
could not read and write, and only one-third of respondents had formal educations ranging from
1 to 12 years. The majority of the respondents were from the Oromo ethnic groups, followed by
the Amhara. As in the case of many African traditional societies, many of the respondents were
involved in numerous social activities and networkings with relatives and nonrelatives; these
activities involve the sharing of resources, work, and information. For instance, the number of
relatives in a got (village), which is a proxy for social capital, was 13.4 persons on average
(T able 5).
T able 4. Distribution of sampled villages
Region Zone District
(Woreda)
Peasant admin.
(Kebele)
Number of
vi llages
T igray East Tigray Hawzein Selam 7
Atsbi
Wonberta
Felege Woinie 9
South Tigray Endamehoni Mehan 3
Amhara North
Gondar
Debark Mekara 19
Chilga T eber Serako 10
Wogera Sak Debir 9
South
Gondar
Libo
Kemkem
Angot 9
East Gojam Bichena Aratband
Bichena
11
West Gojam Quarit Gebez 9
Oromia West
Wellega
Gimbi Were Sayo 9
Haru Genti Abo 12
Bereh Aleltu Welgewo 5
Hidabu Abote Sira marase 10
East Wellega Limu Areb Gebeya 11
Nunu Kumba Bachu 12
Jimma Kersa Merewa 6
Benishangul-
Gumuz
Metekel Wonbera Addis Alem 1
20
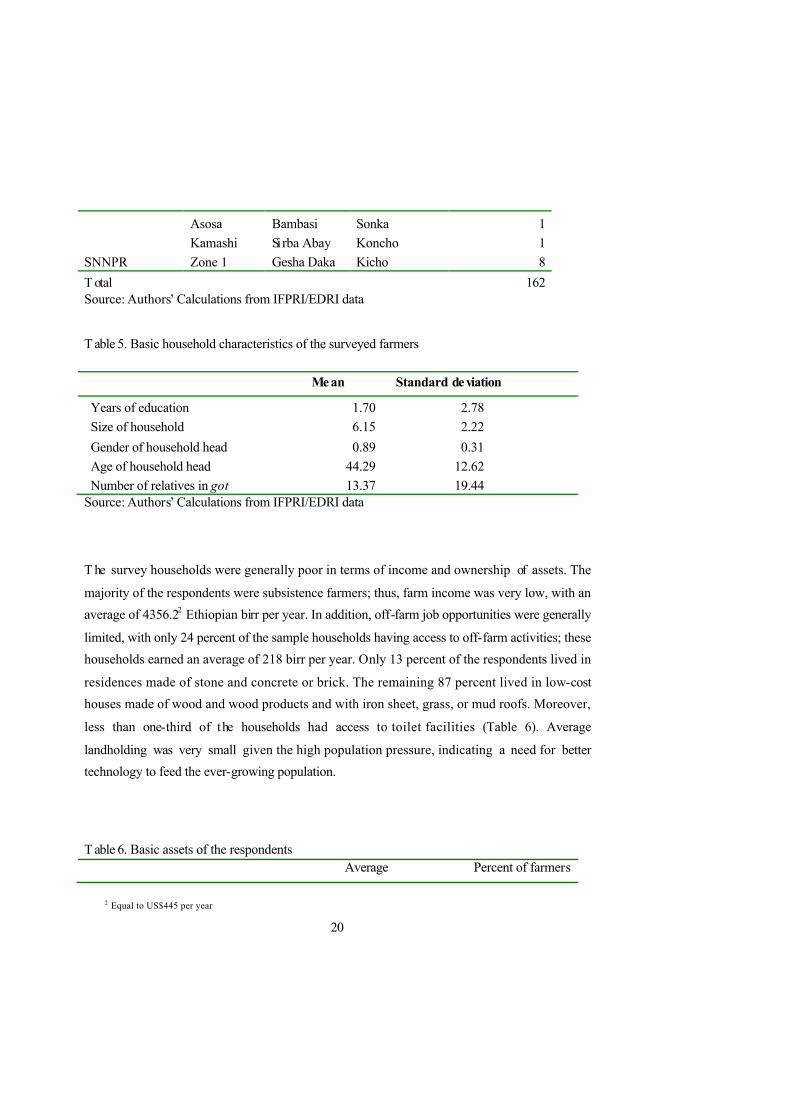
Asosa Bambasi Sonka 1
Kamashi Sirba Abay Koncho 1
SNNPR Zone 1 Gesha Daka Kicho 8
T otal 162Source: Authors’ Calculations from IFPRI/EDRI data
T able 5. Basic household characteristics of the surveyed farmers
Mean Standard deviation
Years of education
Size of household
Gender of household head
Age of household head
Number of relatives in got
1.70
6.15
0.89
44.29
13.37
2.78
2.22
0.31
12.62
19.44Source: Authors’ Calculations from IFPRI/EDRI data
T he survey households were generally poor in terms of income and ownership of assets. The
majority of the respondents were subsistence farmers; thus, farm income was very low, with an
average of 4356.22 Ethiopian birr per year. In addition, off-farm job opportunities were generally
limited, with only 24 percent of the sample households having access to off-farm activities; these
households earned an average of 218 birr per year. Only 13 percent of the respondents lived in
residences made of stone and concrete or brick. The remaining 87 percent lived in low-cost
houses made of wood and wood products and with iron sheet, grass, or mud roofs. Moreover,
less than one-third of the households had access to toilet facilities (Table 6). Average
landholding was very small given the high population pressure, indicating a need for better
technology to feed the ever-growing population.
T able 6. Basic assets of the respondents
Average Percent of farmers
2 Equal to US$445 per year
21
Farm income (Ethiopian birr) 4356.20
Nonfarm income (Ethiopian birr) 218.00
Access to off-farm employment 24.00
Access to good-quality houses 13.00
Access to toilet facilities 31.20
Landholding (hectares) 2. 02
Source: Authors’ Calculations from IFPRI/EDRI data
Given that subsistence and mixed-crop livestock production system is the dominant production
system, livestock keeping was common among the surveyed farmers. Livestock keeping is
important in substance agriculture, as it serves as the source of power for traction, food, and soil
management, in addition to providing fertilizer (manure). Therefore, about 95 percent of the
surveyed households own livestock.
Basic services and infrastructure were generally poor in the surveyed districts, as is the case with
the rest of the country. For instance, about half of the respondents had access to agricultural
extensions, and less than a quarter had access to credit facilities. Although about half of the
surveyed farmers had access to landline telephone, only a few had access to electricity. In
addition, these farmers were far scattered and so remote that they had to travel long distances to
reach input and output markets (Table 7).
T able 7. Access to basic services and infrastructure
Percent of respondents Average
Access to agricultural extension 55.00
Access to formal/informal credit 22.00
Access to landline telephone 47.40
Access to electricity 17.80
Distance to input markets (km) 5. 61
Distance to output markets (km) 5. 70
Source: Authors’ Calculations from IFPRI/EDRI data
22
6.1.2 Climatic Conditions, Shocks, and Coping Strategies
As described in the previous section, the survey districts were located in thee agroecological
settings that differ in many attributes. Two of the major attributes that characterize the
differences are temperature and rainfall. As expected, the kola agroecological zone is the hottest
and driest, whereas dega is the wettest and coolest. Table 8 describes the average temperature
and precipitation across agroecological settings.
T able 8. Annual average temperature and rainfall across the surveyed agroecologies
Agroecological zone Average
temperature
Average rainfall
Kola 22.00 93.42
Weynadega 17.70 113.84
Dega 17.30 119.10
T otal 18.63 111.44
Source: Authors’ Calculations from IFPRI/EDRI data
T he surveyed households also reported having encountered many environmental shocks, namely,
drought, flood, and hailstorms. The percentages of households that reported droughts, floods, and
hailstorms over the prior five years were 31 percent, 12 percent and 18 percent, respectively
(T able 9). T he relatively high frequency of drought-affected households is consistent with
Ethiopia being a drought-prone country. These shocks resulted in a variety of reported losses,
primarily consisting of crop yield declines and asset–income losses (Table 10). The majority of
farmers did nothing to respond to these shocks, mainly due to their poverty.
T able 9. Major shocks encountered by surveyed farmers
Shock Number of farmers Percent of
farmers
Drought 380 31.0
Hailstorm 225 18.3
23
Flood 142 11.6
Animal disease 112 9.1
Pest damage to crops before
harvest
84 6.8
Illness of family member 71 5.8
Source: Authors’ Calculations from IFPRI/EDRI data
T able 10. Effects of shocks on surveyed farmers
Result Number of
farmers
Percent of
farmersDecline in crop yield 403 32.8
Loss of assets 213 17.4Loss of income 201 16.4
Food insecurity/shortage 140 11.4
Death of livestock 128 10.4Decline in consumption 124 10.1Source: Authors’ Calculations from IFPRI/EDRI data
In general, most of the surveyed farmers who reported experiencing shocks over the past five
years sold livestock to cope. This result suggests that in addition to serving as a source of power
for farming and manure for fertilizing soil, livestock can also serve as assets and insurance
against shocks (Yirga 2007). The other coping strategies included borrowing from relatives,
eating less, depending on food aid and food-for- work progr ams, and looking for off-farm
employment. Figure 5 describes the types of coping strategies employed under different climatic
shocks by percentage of farmers who used a coping strategy.
Figure 5. Coping strategies to major environmental shocks
24
0.0
5.0
10.0
15.0
20.0
25.0
30.0
35.0
40.0
45.0
50.0
Drought Flood Hailstorm
Perc
en
t
Did nothing Sold livestock Borrowed from relatives
Received food aid Participated in food for work Sought off-farm employment
Ate less Applied soil conservation schemes
Source: Created by Authors using data from IFPRI/EDRI
25
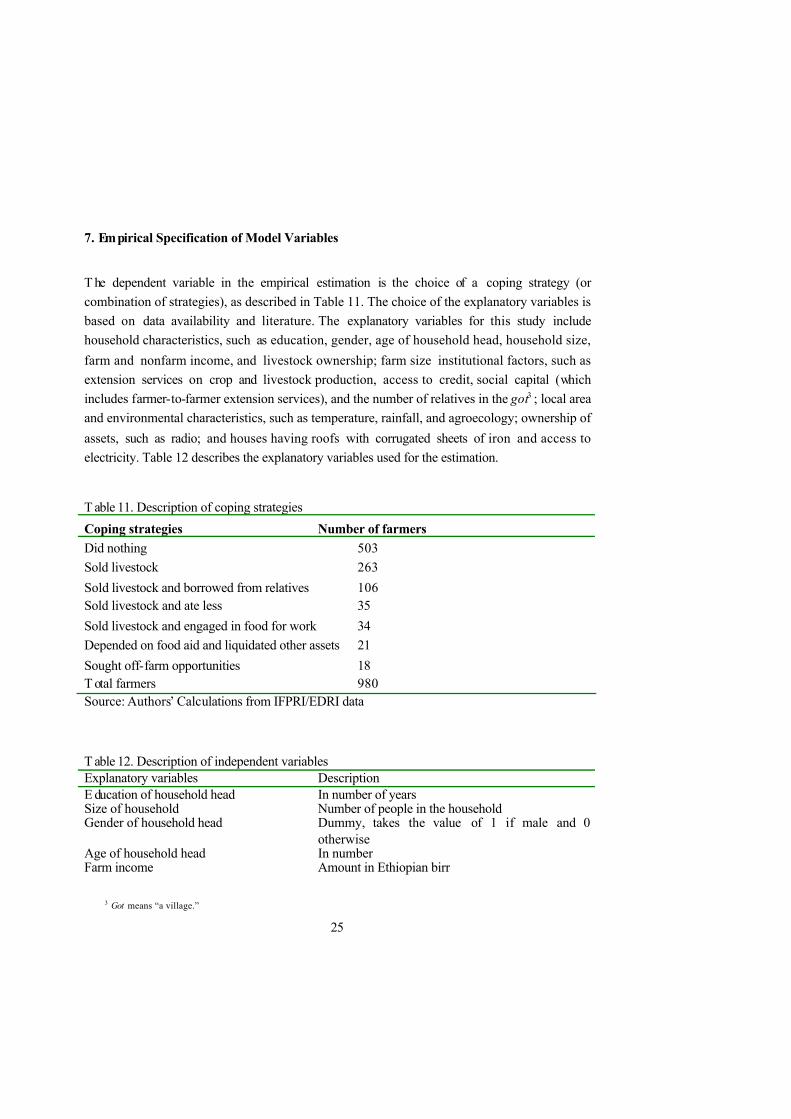
7. Empirical Specification of Model Variables
T he dependent variable in the empirical estimation is the choice of a coping strategy (or
combination of strategies), as described in Table 11. The choice of the explanatory variables is
based on data availability and literature. The explanatory variables for this study include
household characteristics, such as education, gender, age of household head, household size,
farm and nonfarm income, and livestock ownership; farm size institutional factors, such as
extension services on crop and livestock production, access to credit, social capital (which
includes farmer-to-farmer extension services), and the number of relatives in the got3 ; local area
and environmental characteristics, such as temperature, rainfall, and agroecology; ownership of
assets, such as radio; and houses having roofs with corrugated sheets of iron and access to
electricity. Table 12 describes the explanatory variables used for the estimation.
T able 11. Description of coping strategies
Coping strategies Number of farmers
Did nothing 503
Sold livestock 263
Sold livestock and borrowed from relatives 106
Sold livestock and ate less 35
Sold livestock and engaged in food for work 34
Depended on food aid and liquidated other assets 21
Sought off-farm opportunities 18
T otal farmers 980
Source: Authors’ Calculations from IFPRI/EDRI data
T able 12. Description of independent variables Explanatory variables DescriptionE ducation of household head In number of years Size of household Number of people in the householdGender of household head Dummy, takes the value of 1 if male and 0
otherwiseAge of household head In number Farm income Amount in Ethiopian birr
3 Got means “a village.”
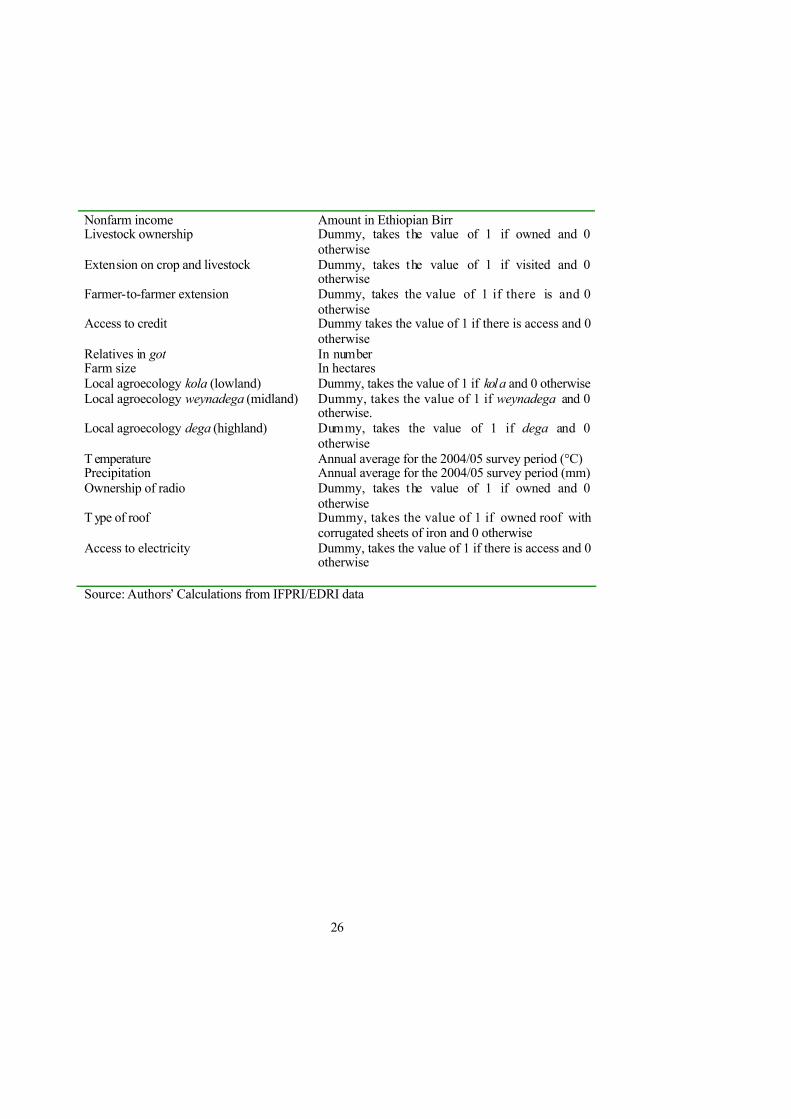
26
Nonfarm income Amount in Ethiopian BirrLivestock ownership Dummy, takes the value of 1 if owned and 0
otherwiseExtension on crop and livestock Dummy, takes the value of 1 if visited and 0
otherwiseFarmer-to-farmer extension Dummy, takes the value of 1 if there is and 0
otherwiseAccess to credit Dummy takes the value of 1 if there is access and 0
otherwiseRelatives in got In numberFarm size In hectaresLocal agroecology kola (lowland) Dummy, takes the value of 1 if kola and 0 otherwiseLocal agroecology weynadega (midland) Dummy, takes the value of 1 if weynadega and 0
otherwise.Local agroecology dega (highland) Dummy, takes the value of 1 if dega and 0
otherwiseT emperature Annual average for the 2004/05 survey period (°C)Precipitation Annual average for the 2004/05 survey period (mm)Ownership of radio Dummy, takes the value of 1 if owned and 0
otherwise T ype of roof Dummy, takes the value of 1 if owned roof with
corrugated sheets of iron and 0 otherwise Access to electricity Dummy, takes the value of 1 if there is access and 0
otherwise
Source: Authors’ Calculations from IFPRI/EDRI data
27
8. Model Results and Discussion
T he estimation of the multinomial logit model for this study was undertaken by normalizing one
category, which is normally referred to as the reference state or the base category. In this
analysis, the first category (“did nothing”) is the reference state.
T he results of the MNL model indicate that different socioeconomic and environmental factors
affect the ability to cope with different climate extreme events. These factors include gender of
household head being male, age of household head (which approximates experience), farm
income, farm size, livestock ownership, extension on crop and livestock production, farmer-to-
farmer extension, local agroecology kola, local agroecology weynadega, temperature, and
precipitation (Table 13).
As explained earlier, the parameter estimates of the MNL model provide only the direction of the
effect of the independent variables on the dependent (response) variable; they do not represent
actual magnitude of change or probabilities. Thus, the marginal effects from the MNL, which
measure the expected change in probability of a particular choice being made with respect to a
unit change in an independent variable, are reported and discussed. In all cases, the estimated
coefficients should be compared with the base category of doing nothing in response to climate
extreme events. Table 14 presents the marginal effects, along with the levels of statistical
significance.
Results show that education of the head of household, having a male head of household, age of
the head of household, farm income, livestock ownership, access to extension services, farmer-
to-farmer extension, temperature, ownership of radio, and better-quality houses positively
influence the use of one, or a combination, of the coping strategies identified by farmers. Results
also show that nonfarm income, farm size, local agroecology kola, and precipitation negatively
affect the use of one, or a combination, of the coping strategies.
28
As the marginal values show (Table 14), increasing the education of the household head by one
unit increases the probability of selling livestock as a copying strategy by 1.2 percent. Livestock
ownership is an indicator of wealth in rural Africa (Langyintuo 2005). Studies show that
education is also positively related to wealth (Filmer and Pritchett 1999). M ale-headed
households have a higher probability of selling livestock and borrowing from relatives as coping
st rategies during climate extreme events than do female-headed households. For instance, male-
headed households have 16.5 percent more probability of selling livestock only and 5 percent
more probability of selling livestock and borrowing from relatives than do female-headed
households. Moreover, the age of the household head positively influences selling livestock,
whereas farm income positively influences selling livestock and eating less during climate
extreme events.
Nonfarm income is negatively related to depending on food aid and liquidating other assets as
coping strategies. This shows that farmers who have off-farm incomes do not depend on food aid
and do not sell their assets at times of climate extreme events. This result implies the need for
creating off-farm job opportunities for farming communities to better enable them to cope. In
addition, farm size is negatively related to selling livestock and borrowing from relatives. This
result could be because farmers with larger land sizes are also wealthier farmers who can depend
on other sources, such as savings, than on selling livestock and borrowing from relatives.
Livestock ownership significantly increases selling livestock only and the combination of
borrowing from relatives and selling livestock as coping strategies to climate extreme events. As
the marginal values indicate, increasing the ownership of livestock by one unit increases the
probability of selling livestock only and the combination of borrowing from relatives and selling
livestock as coping strategies by 21 percent and 5 percent, respectively. Access to extensions on
crop and livestock production increases the probability of selling livestock and borrowing from
relatives and of selling livestock and eating less as coping strategies. On the other hand, access to
credit is negatively related with off-farm opportunities as a coping strategy, perhaps because
farmers who can afford to borrow have less incentive to work off farm.
29
Farmer-to-farmer extension positively influences selling of livestock and borrowing from
relatives as coping mechanisms during climate extreme events. Moreover, increasing
temperature positively influences selling livestock and borrowing from relatives and selling
livestock and engaging in a food-for- work program. On the other hand, precipitation negatively
influences selling livestock only, selling livestock and eating less, and selling livestock and
engaging in a food-for-work program. These results are inline with the fact that Ethiopia is a
drought-prone country and that increasing precipitation relives farmers from constraints by
drought. Ownership of radio and better-quality houses are indicators of wealth in rural Africa
(Langyintuo 2005; Vyas and Kumaranayake 2006), meaning that wealthier farmers can better
cope. Thus, owning a radio increases the probability of selling livestock and borrowing from
relatives, whereas having a better-quality house increases the probability of selling livestock and
eating less as coping strategies during climate extreme events in Ethiopia’s Nile basin.
30
T able 13. Parameter estimates of the multinomial logit model of climate cop ing strategies
Explanatory variables Sold livestock
Sold livestock
and borrowed
from relatives
Sold livestock
and ate less
Sold livestock
and engaged in food for
work
Dependedon food aid
and liquidated
other assets
Sought off-farm
opportunities
Education of household head
1.057 0.991 0.909 0.970 0.968 1.065
(0.143) (0.869) (0.429) (0.755) (0.755) (0.543)Size of household 1.036 1.002 1.118 0.857 0.939 1.153
(0.433) (0.976) (0.286) (0.225) (0.590) (0.285)Gender of household head
3.066** 2.740* 1.604 6.605 2.098 0.753
(0.003) (0.038) (0.513) (0.092) (0.358) (0.741)Age of household head 1.024** 1.013 1.012 0.959 1.004 1.006
(0.004) (0.238) (0.551) (0.079) (0.850) (0.819)Farm income 1.000 1.000 1.000* 1.000* 1.000 1.000
(0.194) (0.679) (0.021) (0.034) (0.219) (0.851)Nonfarm income 1.000 1.000 1.000 0.999 0.998 1.000
(0.113) (0.611) (0.471) (0.082) (0.240) (0.875)Farm size 0.843 0.736* 0.840 1.184 0.773 0.812
(0.054) (0.023) (0.430) (0.365) (0.302) (0.488)Livestock ownership 4.555*** 2.988* 2.401 1.970 0.924 0.420
(0.001) (0.046) (0.292) (0.446) (0.925) (0.224)Extension on crop and livestock
2.333*** 3.141*** 6.271** 3.847* 1.421 2.850
(0.001) (0.001) (0.009) (0.037) (0.560) (0.146)Access to credit 1.436 1.281 1.234 0.282 1.089 0.000
(0.112) (0.425) (0.694) (0.127) (0.888) (1.000)Farmer-to-farmer extension
2.508*** 2.957** 2.712 10.054*** 2.157 2.140
31
(0.000) (0.002) (0.082) (0.001) (0.231) (0.278)Relatives in got 0.998 1.002 0.999 1.005 0.967 0.991
(0.715) (0.789) (0.899) (0.613) (0.294) (0.594)Local agroecology kola 0.596 0.079*** 0.525 0.015** 0.274 0.658
(0.118) (0.000) (0.412) (0.003) (0.147) (0.699)Local agroecology weynadega
0.935 0.604 0.437 0.142** 0.468 0.959
(0.803) (0.150) (0.177) (0.001) (0.256) (0.955)T emperature 1.176 1.398* 1.373 2.411** 1.577* 0.600*
(0.050) (0.011) (0.130) (0.001) (0.020) (0.033)Precip itation 0.980*** 0.987** 0.961*** 0.944*** 0.984 0.983
(0.000) (0.004) (0.000) (0.000) (0.073) (0.107)Ownership of radio 0.999 1.797 0.890 1.597 0.581 0.280
(0.997) (0.109) (0.839) (0.448) (0.455) (0.110)Typ e of roof 1.094 0.940 3.030 1.103 1.571 0.836
(0.713) (0.852) (0.063) (0.866) (0.481) (0.806)Access to electricity 1.069 1.060 1.159 0.783 2.125 0.839
(0.761) (0.846) (0.760) (0.627) (0.227) (0.776)Constant 0.004*** 0.000*** 0.000* 0.000** 0.000* 3051.708
(0.001) (0.000) (0.028) (0.005) (0.015) (0.087)Observations 791Ll –831.109chi2 410.318Source: Authors’ Calculations from IFPRI/EDRI data
Notes: p-values in parentheses; * p < 0.05, ** p < 0.01, *** p < 0.001
32
T able 14. Marginal effects from the multinomial logit model of climate cop ing strategies
Explanatory variables Sold livestock
Sold livestock
and borrowed
from relatives
Sold livestock
and ate less
Sold livestock
and engaged in food for
work
Dependedon food aid
and liquidated
other assets
Sought off-farm
opportunities
Did nothing
Education of household head 0.01205* –0.00201 –0.00152 –0.00017 –0.00069 2.87E-07 –0.00766
(0.096) (0.638) (0.358) (0.645) (0.654) (1.00) (0.983)Size of household 0.007147 –0.00077 0.001418 –0.00066 –0.0011 7.54E-07 –0.00604
(0.992) (0.997) (0.979) (0.262) (0.530) (1.00) (0.996)Gender of household head 0.1649*** 0.047853** 0.001825 0.003644 0.00523 –4.5E-06 –0.22345
(0.000) (0.050) (0.989) (0.152) (0.555) (1.00) (0.987)Age of household head 0.004448*** 0.000483 5.73E-05 –0.0002 –6.3E-05 –1.3E-08 –0.00473***
(0.005) (0.584) (0.834) (0.141) (0.833) (1.00) (0.008)Farm income –5.11E-06 9.78E-07 1.09E-06** 3.50E-07 6.16E-07 6.96E-11 2.08E-06
(0.113) (0.477) (0.025) (0.118) (0.234) (1.00) (0.990)Nonfarm income –3E-05 3.45E-06 –1.20E-06 –4.33E-06 –3.6E-05* 9.03E-10 0.000068
(0.283) (0.991) (0.750) (0.189) (0.083) (1.00) (0.980)Farm size –0.02508 –0.02068* –0.00129 0.001004 –0.00266 –7.2E-07 0.048704**
(0.980) (0.053) (0.980) (0.250) (0.483) (1.00) (0.013)Livestock ownership 0.207831*** 0.049425* 0.00566 0.00106 –0.00822 –1.3E-05 –0.25574
(0.000) (0.054) (0.980) (0.991) (0.993) (1.00) (0.994)Extension on crop and livestock 0.128329 0.068309*** 0.020306** 0.003763 –0.00034 3.7E-06 –0.22037***
(0.980) (0.008) (0.041) (0.200) (0.998) (1.00) (0.000)Access to credit 0.072185 0.012029 0.001271 –0.00403 –0.00052 –0.01292** –0.06802
(0.115) (0.638) (0.864) (0.146) (0.952) 0.029 (0.182)
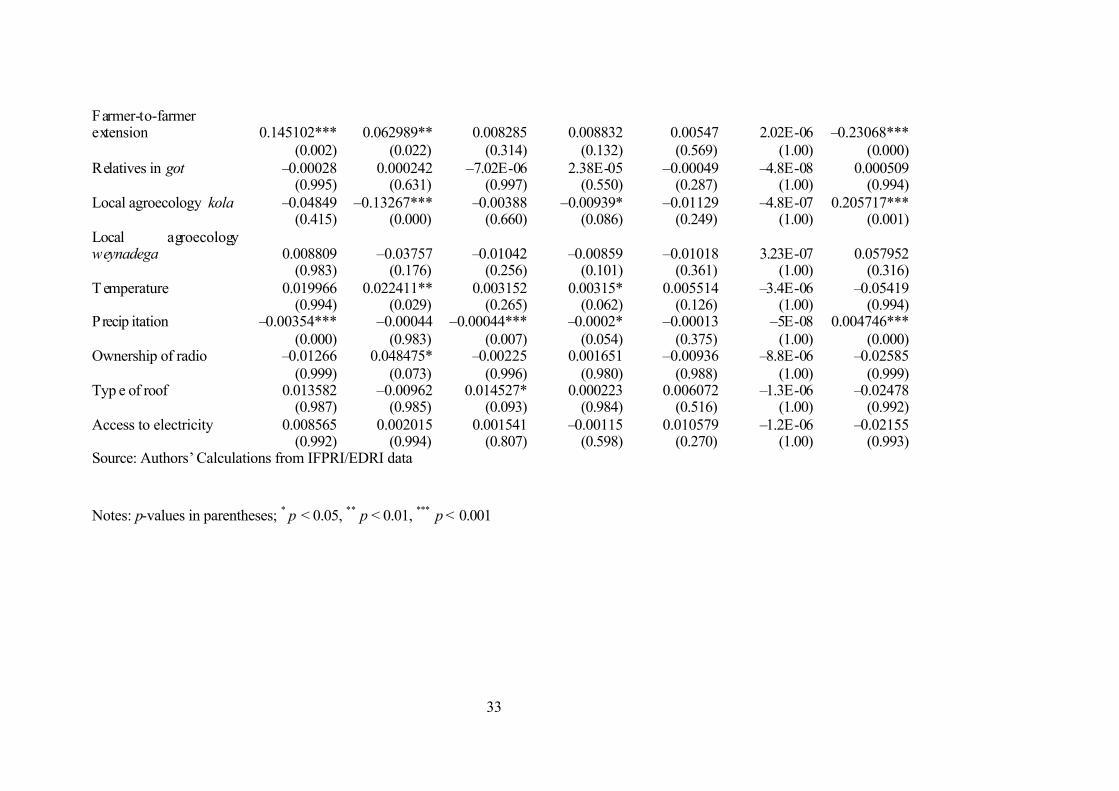
33
Farmer-to-farmer extension 0.145102*** 0.062989** 0.008285 0.008832 0.00547 2.02E-06 –0.23068***
(0.002) (0.022) (0.314) (0.132) (0.569) (1.00) (0.000)Relatives in got –0.00028 0.000242 –7.02E-06 2.38E-05 –0.00049 –4.8E-08 0.000509
(0.995) (0.631) (0.997) (0.550) (0.287) (1.00) (0.994)Local agroecology kola –0.04849 –0.13267*** –0.00388 –0.00939* –0.01129 –4.8E-07 0.205717***
(0.415) (0.000) (0.660) (0.086) (0.249) (1.00) (0.001)Local agroecology weynadega 0.008809 –0.03757 –0.01042 –0.00859 –0.01018 3.23E-07 0.057952
(0.983) (0.176) (0.256) (0.101) (0.361) (1.00) (0.316)T emperature 0.019966 0.022411** 0.003152 0.00315* 0.005514 –3.4E-06 –0.05419
(0.994) (0.029) (0.265) (0.062) (0.126) (1.00) (0.994)Precip itation –0.00354*** –0.00044 –0.00044*** –0.0002* –0.00013 –5E-08 0.004746***
(0.000) (0.983) (0.007) (0.054) (0.375) (1.00) (0.000)Ownership of radio –0.01266 0.048475* –0.00225 0.001651 –0.00936 –8.8E-06 –0.02585
(0.999) (0.073) (0.996) (0.980) (0.988) (1.00) (0.999)Typ e of roof 0.013582 –0.00962 0.014527* 0.000223 0.006072 –1.3E-06 –0.02478
(0.987) (0.985) (0.093) (0.984) (0.516) (1.00) (0.992)Access to electricity 0.008565 0.002015 0.001541 –0.00115 0.010579 –1.2E-06 –0.02155
(0.992) (0.994) (0.807) (0.598) (0.270) (1.00) (0.993)Source: Authors’ Calculations from IFPRI/EDRI data
Notes: p-values in parentheses; * p < 0.05, ** p < 0.01, *** p < 0.001
34
9. Conclusions and Policy Implications
Ethiopia is one of the poorest countries in the world, with the majority of its population living
under the poverty line. One of the major reasons for this high poverty is the dependence of the
economy on agriculture, which has failed to meet the growing food demands of the population
and left the nation dependent on food aid. Although many factors contribute to the poor
performance of the agricultural sector, poor climatic conditions, in particular recurrent droughts,
are the major contributors. Moreover, the past trends of climate change and climate variability,
which hinder agricultural production, are expected to sustain in the future, which indicates that
the country’s agriculture must cope with further warming, low rainfall patterns, and frequent
climate extremes (such as drought and flood).
T he multinomial logit (MNL) model was used to analyze the determinants of farmers’ choice of
coping strategies based on data obtained from a household survey of farmers during the 2004/05
production year in the country’s Nile basin region. Results from the MNL model show that
different socioeconomic and environmental factors affect coping with climate extreme events.
Factors that positively influence coping include education of the head of the household, gender
of household head being male, farm income, livestock ownership, access to extension on crop
and livestock production, farmer-to-farmer extension, temperature, ownership of radio, and
better-quality homes.
Policies should encourage income generation and asset holding, especially livestock, both of
which will enable consumption smoothing during and immediately after harsh climatic events.
Moreover, government policies should focus on the provision of agroecology- based technology
packages and the strengthening of productive safety net programs to support coping.
Government policies and investment strategies that support the provision of and access to
education, extension services on crop and livestock production, and information on climate and
coping measures are necessary to better cope with climate change. In addition, policy
interventions that encourage informal social net works (financially or materially) can promote
group discussions and better information flows, thus enhancing the ability to cope with climate
change.
35
References
Admassie, A., and B. Adenew. 2007. Stakeholders’ perceptions of climate change and adaptation
st rategies in Ethiopia. EEA Research Report . A ddis Ababa: Ethiopian Economic Association.
Belay, K., F. Beyene, and W. Manig. 2005. Coping with drought among pastoral and agro-
pastoral communities in eastern Ethiopia. Journal of Rural Development 28: 185–210.
CSA (Central Statistics Authority). 1997. The Federal Democratic Republic of Ethiopia
st atistical abstract. Addis Ababa, Ethiopia.
________. 2005. The Federal Democratic Republic of Ethiopia statistical abstract. Addis Ababa,
Ethiopia.
Degefu, W. 1987. Some aspects of meteorological drought in Ethiopia. In Drought and Hunger
in Africa, ed. M. H. Glantz . Cambridge: Cambridge University Press.
Devereux, S., and B. Guenther. 2007. Social protection and agriculture in Ethiopia. Country case
st udy paper prepared for a review commissioned by the Food and Agriculture Organization on
Social Protection and Support to Small Farmer Development.
<http://www.fao.org/es/esa/pdf/workshop_0108_ethiopia.pdf>. Accessed May 2009.
Disaster Prevention and Preparedness Agency. 2009. Humanitarian requirements: Joint
government and humanitarian partners’ document. Addis Ababa: Government of Ethiopia
Flato, G. M., and G. J. Boer. 2001. Warming asymmetry in climate change simulations.
Geophysical Research Letters 28(1): 195–198.
Filmer, D. & Pritchett, L.H. 2001. Estimating wealth effects without expenditure data or tears:
An application to educational enrollments of India. Demography, 38(1):115–132.
Green, W. H. 2000. Econometric analysis. 4th ed. Upper Saddle River, N.J.: Prentice-Hall.
Hassan, R., and C. Nhemachena. 2008. Determinants of African farmers’ strategies for adapting
to climate change: Multinomial choice analysis. African Journal of Agricultural and Resource
Economics 2(1): 83–104.
36
IFPRI, CSA and EDRI (International Food Policy Research Institute, Central St atistics
Authority, and Ethiopian Development Research Institute). 2006. Atlas of the Ethiopian rural
economy. <http://www.ifpri.org/pubs/books/oc54.asp>.
IPCC (Intergovernmental Panel on Climate Change). 2001. Climate change: The scientific basis.
<http://www.ipcc.ch/>. Accessed June 7, 2008.
Kurukulasuriya, P and and Mendelsohn,R. 2008. Crop switching as a strategy for adapting to
climate change. African Journal of Agricultural and Resource Economics 2(1): 105–125.
Langyintuo, A. S. 2005. Maize production systems for Zimbabwe: Setting indicators for impact
assessment and targeting. Research project on Strengthening Seed Marketing Incentives in
Southern Africa to Increase Impact of Maize Breeding. Harare, Zimbabwe: International Maize
and Wheat Improvement Center (CIMMYT).
Lautze S., Y. Aklilu, A. Raven-Roberts, H. Young, G. Kebede, and J. Learning. 2003. Risk and
vulnerability in Ethiopia: Learning from the past, responding to the present, preparing for the
future. Report for the U.S. Agency for International Development. Addis Ababa, Ethiopia.
Madalla, G. 1983. Limited dependent and qualitative variables in econometrics. Cambridge: Cambridge University Press.
Mitchell, T. D., and P. D. Jones. 2005. An improved method of constructing a database of
monthly climate observations and associated high-resolution grids. International Journal of
Climatology 25(6): 693–712.
MoA (Ministry of Agriculture). 2000. Agro-ecological zonations of Ethiopia. Addis Ababa,
Ethiopia.
MoFED (Ministry of Finance and Economic Development). 2007. E thiopia: Building on
progress: A plan for accelerated and sustained development to end poverty (PASDEP). Annual
Progress Report. Addis Ababa, Ethiopia.
MoWR (Ministry of Water Resources). 1998. Tekeze River basin integrated development master
plan project. Executive Summary. Addis Ababa.
37
Nicholls, N. 1993. What are the potential contributions of El Niño? Southern oscillation research
to early warning of potential acute food-deficit situations. In Workshop on Usable Science: Food
Security, Early Warning and El Niño, ed. M. H. Glantz. Boulder, Col.: National Center for
Atmospheric Research.
NMS (National Meteorological Services). 2007. Climate Change National Adaptation Program
of Action (NAPA) of Ethiopia. Addis Ababa, Ethiopia.
NMSA (National Meteorological Services Agency). 2001. Initial national communication of
Ethiopia to the United Nations Framework Convention on Climate Change (UNFCCC). Addis
Ababa, Ethiopia.
Quinn, W. H., and V. T. Neal. 1987. El Niño occurrences over the past four and half centuries.
Journal of Physical Research 92(1): 14449–14461.
Senior, C. A., and J. F. Mitchell. 2000. The time dependence of climate sensitivity. Geophysical
Research Letters 27(17): 2685–2688.
Seo, N., and R. Mendelsohn. 2008. Animal husbandry in Africa: Climate change impacts and
adaptations. African Journal of Agricultural and Resource Economics 2(1): 65–82.
Strzepek, K., and A. McCluskey. 2006. District level hydro-climatic time series and scenario
analysis to assess the impacts of climate change on regional water resources and agriculture in
Africa. CEEPA Discussion Paper 13. Pretoria, South Africa: Center for Environmental
Economics and Policy in Africa, University of Pretoria.
T se, Y. K. 1987. A diagnostic test for the multinomial logit model. Journal of Business and Economic Statistics 5(2): 283–286.
UNDP (United Nations Development Program). 2008. Human development r eport.
<http://hdrstats.undp.org/countries/country_fact_sheets/cty_fs_ETH.html>. Accessed June 2009.
Vyas, S., and L. Kumaranayake. 2006. Constructing socioeconomic status indices: How to use
principal component analysis. Health Policy and Planning 21(6): 459–468.
38
Washington, W. M., J. W. Weatherly, G. A. Meehl, A. J. Semtner Jr., T. W. Bettge, A. P. Craig, W. G. Strand Jr., J. Arblaster, V. B. Wayland, R. James, and Y. Zhang. 2000. Parallel Climate Model (PCM): Control and transient scenarios. Climate Dynamics 16: 755–774.
Webb, P., and J. von Braun. 1994. Famine and food security in Ethiopia: Lessons for Africa.
Chichester, U.K.: John Wiley & Sons.
Wooldridge, J. M. 2002. Econometric analysis of cross section and panel data. Cambridge,
Mass.: MIT Press.
World Bank. 2003. Ethiopia: Risk and vulnerability assessment. Draft report.
Yirga, C. T. 2007. The dynamics of soil degradation and incentives for optimal management in
central highlands of Ethiopia. Unpublished PhD thesis, University of Pretoria, South Africa.
Yohannes, G. 2003. Ethiopia in view of the National Adaptation Program of Action. Addis
Ababa, Ethiopia: National Meteorological Services Agency.
Formatted: German(Germany)