Embed Size (px)
Citation preview
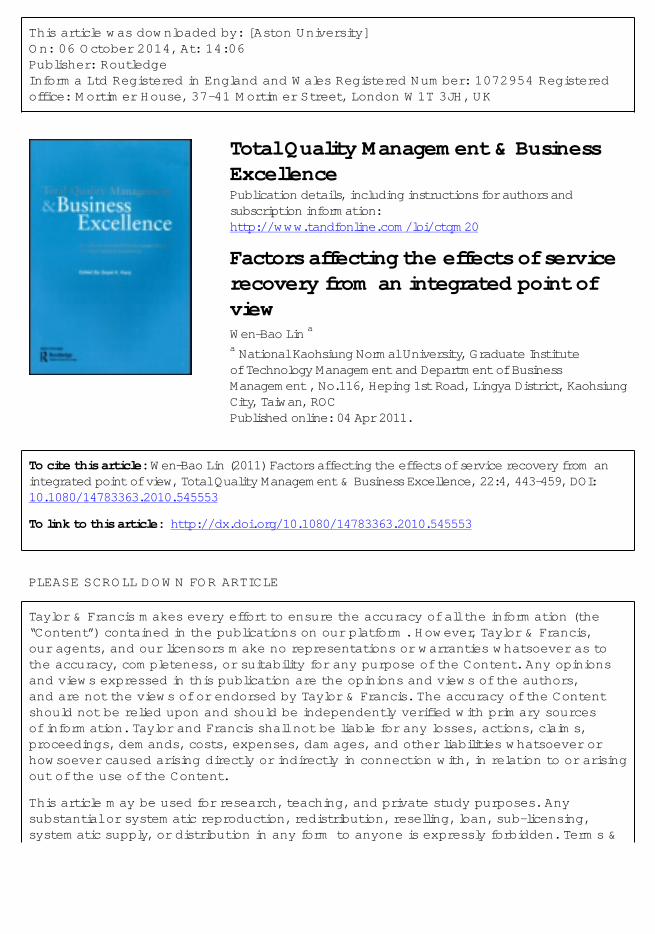
This article was downloaded by: [Aston University]On: 06 October 2014, At: 14:06Publisher: RoutledgeInforma Ltd Registered in England and Wales Registered Number: 1072954 Registeredoffice: Mortimer House, 37-41 Mortimer Street, London W1T 3JH, UK
Total Quality Management & BusinessExcellencePublication details, including instructions for authors andsubscription information:http://www.tandfonline.com/loi/ctqm20
Factors affecting the effects of servicerecovery from an integrated point ofviewWen-Bao Lin aa National Kaohsiung Normal University, Graduate Instituteof Technology Management and Department of BusinessManagement , No.116, Heping 1st Road, Lingya District, KaohsiungCity, Taiwan, ROCPublished online: 04 Apr 2011.
To cite this article: Wen-Bao Lin (2011) Factors affecting the effects of service recovery from anintegrated point of view, Total Quality Management & Business Excellence, 22:4, 443-459, DOI:10.1080/14783363.2010.545553
To link to this article: http://dx.doi.org/10.1080/14783363.2010.545553
PLEASE SCROLL DOWN FOR ARTICLE
Taylor & Francis makes every effort to ensure the accuracy of all the information (the“Content”) contained in the publications on our platform. However, Taylor & Francis,our agents, and our licensors make no representations or warranties whatsoever as tothe accuracy, completeness, or suitability for any purpose of the Content. Any opinionsand views expressed in this publication are the opinions and views of the authors,and are not the views of or endorsed by Taylor & Francis. The accuracy of the Contentshould not be relied upon and should be independently verified with primary sourcesof information. Taylor and Francis shall not be liable for any losses, actions, claims,proceedings, demands, costs, expenses, damages, and other liabilities whatsoever orhowsoever caused arising directly or indirectly in connection with, in relation to or arisingout of the use of the Content.
This article may be used for research, teaching, and private study purposes. Anysubstantial or systematic reproduction, redistribution, reselling, loan, sub-licensing,systematic supply, or distribution in any form to anyone is expressly forbidden. Terms &

Conditions of access and use can be found at http://www.tandfonline.com/page/terms-and-conditions
Dow
nloa
ded
by [
Ast
on U
nive
rsity
] at
14:
06 0
6 O
ctob
er 2
014
Factors affecting the effects of service recovery from an integratedpoint of view
Wen-Bao Lin∗
National Kaohsiung Normal University, Graduate Institute of Technology Management andDepartment of Business Management, No.116, Heping 1st Road, Lingya District, KaohsiungCity, Taiwan, ROC
This study discusses three aspects of service recovery: the corporate leadershipstyle, employee self-efficacy, and manager-subordinate interaction. Employees ofservice-oriented industries were selected as the population, and stratified randomsampling was adopted to collect samples in four major metropolitan areas in Taiwan:Taipei, Kaohsiung, Taichung and Tainan. Empirical results showed thattransformational leadership, compared with paternalistic leadership, has positive andsignificant effect on the service recovery performance; high self-efficacyemployees, compared with low self-efficacy ones, have a positive and significanteffect on the service recovery performance; and relationship commitment value has apositive and significant effect on the service recovery performance. The main featureof the study is the combination of linear multivariate analysis with a non-linear fuzzyneural network model in the analysis, an approach rarely found in previous studies.Management implications are also proposed.
Keywords: service recovery performance; leadership; self-efficacy
Introduction
Although much research has focused on service recovery, most of it is based on the post-
service error point of view (Harris, Grewal, Mohr, & Bernhardt, 2006; Patterson, Cowley,
& Prasongsukarn, 2006; Sparts & McColl-Kennedy, 2001). However, the importance of
proactive approach has been highlighted, especially for the service industry, in which it
is more difficult than in manufacturing to establish competitive advantages (de Jong &
de Ruyter, 2004).
Previous studies of ‘service recovery’ have arrived at several broad understandings.
First, they emphasise post-service failure. In terms of the selection and utilisation of recov-
ery strategy, Smith, Bolton, & Wanger (1999) argued that the action of service recovery
affects customer satisfactions, while Boulding, Kalra, Staelin, and Zeithaml (1993)
stressed that if service failure occurs earlier, lower customer satisfaction will be perceived,
because a satisfactory service experience is not obtained. Mattila (2001) surveyed different
service recovery approaches of various industries and found that different approaches
would result in different outcomes. In hair-styling, for example, one effective approach
is the apology and substantial compensation, which has a positive impact on the recovery
of customer satisfaction and loyalty. Second, the literature tends to take a natural, conven-
tional view: it discusses the types and causes of service failure, and subsequent actions.
Service failure may be divided into progress failure and outcome failure. The former
ISSN 1478-3363 print/ISSN 1478-3371 online
# 2011 Taylor & Francis
DOI: 10.1080/14783363.2010.545553
http://www.informaworld.com
∗Email: [email protected]
Total Quality Management
Vol. 22, No. 4, April 2011, 443–459
Dow
nloa
ded
by [
Ast
on U
nive
rsity
] at
14:
06 0
6 O
ctob
er 2
014
refers to the failure of service that occurs in the process of service delivery, while the latter
refers to customer dissatisfaction that occurs after service delivery, because expectations
are not met or commitments not fulfilled (Hoffman, Kelley, & Rotalsky, 1995; Smith et al.,
1999). Third, the literature also discusses other variables that affect customer recovery
satisfaction, such as the impact of cultural differences on customer recovery satisfaction.
Tax, Brown, and Chandrashekaran (1998) observed that customers had differentiated
recognition of fairness when evaluating outcome fairness, procedural fairness and interac-
tional fairness. Wong (2004) surveyed consumers in the US, Singapore and Australia and
discussed the impact of service recovery actions in different cultural value systems. The
empirical results showed that in Singapore, customer satisfaction can be increased after
receiving an apology, while in the others, service encounters can be increased if substantial
compensation actions are taken. Mattila and Patterson (2004) compared the impact of
cultural factors in service recovery on fairness and satisfaction in South Asian countries
and the US. The empirical results indicated that recovery actions can induce American
consumers to perceive fairness.
This study investigates aspects of service recovery hitherto ignored in the literature.
The majority of previous studies have focused more on customer perception (Harris
et al., 2006; Webster & Sundaram, 1998), recognition of fairness (Mattilia & Patterson,
2004; Tax et al., 1998) or different hierarchical culture (Mattila & Patterson, 2004; Patter-
son et al., 2006; Winsted, 1997) and manager leadership style. Second, though there have
been studies on the comparison of service recovery difference across various regions, most
of these studies have focused on western countries. This study is designed to discuss the
service industry in Taiwan, a diverse, multi-ethnic island with a dominant Chinese cultural
majority. The managerial implications derived will thus be significant for firms operating
in a globalised economy. Third, previous studies have investigated a single factor or aspect
of service recovery, such as the impact, interference or mediating effect of culture or fair-
ness factors on service recovery actions. Few studies have explored internal management
mechanisms, such as motivation.
Given this, the current study aims to explore service recovery from three aspects: cor-
porate management, employee, and manager-subordinate interaction. First of all, from the
perspective of corporate management control, how do leadership style and motivation of
managers influence service recovery actions? Secondly, from the perspective of employ-
ee’s self-efficacy, to what the extent does self-efficacy influence service recovery perform-
ance? Moreover, the study will also discuss one of the key variables of relationship
marketing – relationship commitment and its impact on service recovery performance.
Lastly, using an approach totally different from the conventional critical incidents
technique (CIT), this study will also try to combine linear multivariate analysis and
non-linear fuzzy neural network model, to interpret recognition of service failure and
utilisation of service recovery strategies (Chung-Herrera, Goldschmidt, & Doug, 2004;
Lewis & Syprakopoulos, 2001; Natalia & Barbara, 2004).
Literature
The Western management style places emphasis on the scientific methodology and empiri-
cism, while the Chinese management style pursues macro-harmony under the influence of
the philosophy of Daoism and Confucianism. Many researchers have devoted themselves
to the study of Chinese management styles and concluded that Chinese management and
leadership is completely different from the Western one and defined such common style in
Greater Chinese societies as ‘paternalistic leadership’ (Redding, 1990; Westwood, 1997).
444 W.-B. Lin
Dow
nloa
ded
by [
Ast
on U
nive
rsity
] at
14:
06 0
6 O
ctob
er 2
014
Paternalistic leadership, similar to fatherhood, is characterised by clear and powerful
authority, caring, consideration of subordinates, and moral leadership, and theoretically
includes three important aspects: leadership of authority, leadership of mercy and leader-
ship of morality (Farh & Cheng, 2000). The main difference between western leadership
and paternalistic leadership lies in cultural backgrounds, one is based on western cultures
and the other on Chinese culture. Since 1970s, Chinese paternalistic leadership has drawn
attentions of researchers and some preliminary models and analysis were also established
(Cheng, Chou, Huang, Wu, & Farh, 2004; Farh & Cheng, 2000; Farh, Leung, & Law,
1998; House, Wright, & Aditya, 1997). It was empirically verified in later studies of entre-
preneurial management, military, school and non-profit organisations. Many comparative
studies on the Western and Chinese leadership styles have also been published, too (Hamil-
ton, 1990; House et al., 1997). Cheng et al. (2004) pointed out that being obliging to sub-
ordinates would cause a positive impact on the relationship and affective trust between
management and subordinate but have no significant effect on work performance. Although
authority may ruin the relationship and affective trust between management and the subor-
dinate and increase an employee’s intention of resignation, compliance can enhance the
work performance of employee. In contrast to paternalistic leadership, transformational
leadership can induce employees’ commitment and contribution to organisational
mission and objectives (Yukl, 1998). Liao and Chuang (2007) discussed how transforma-
tional leadership affects the service performance of employees and their findings indicated
that hierarchical transformational leadership has a positive impact on an employee’s
service performance.
In conclusion, both paternalistic leadership and transformational leadership have a
positive impact on employee’s service performance. Therefore, after a service failure
has occurred, the post-incident service performance relies not only on the timely treatment
of employees but also on the leadership style and talent of the manager. Farh and Cheng
(2000) surveyed in Taiwan and empirically showed that the talent of manager has signifi-
cant influence and a mediating effect on an employee’s service performance. This finding
is quite different from past arguments that dependence by the employee on a manager has
significant impact on job performance (Chou, Cheng, & Jen, 2005). Bass and Avolio
(1993) also mentioned that transformational leadership could motivate employees to
achieve expected performance and meet external environmental dynamics. As a result,
transformational leadership should have more significant influence on an employee than
paternalistic leadership.
H1: Instead of paternalistic leadership, transformational leadership has positive influence onthe service recovery performance of employee.
In spite of many past studies discussing the factors affecting employee performance,
organisational factors, such as training method, motivation type, and self-efficacy can
also influence the result. McDonald and Siegall (1992), for example, probed into the
job satisfaction, commitment and job quality of 205 technicians who experienced techno-
logical evolution. Crant (2000) proposed four constructs which influence employees’
behaviours. These constructs are: positive personality, individual initiative, self-efficacy
of the role, and ability to sustain change. Self-efficacy means the self-belief of those
who influence their functioning to manage incidents (Appelbaum & Hare, 1996). Hartline,
Maxham III, and Mckee (2000) argued that enterprises need to set up an organisational
structure for the manager to empower their subordinates if an enterprise expects employ-
ees to have customer-orientated behaviours, so that the organisation can evaluate each
employee’s performance based on the defined behaviour. Hartline and Ferrell (1996)
Total Quality Management 445
Dow
nloa
ded
by [
Ast
on U
nive
rsity
] at
14:
06 0
6 O
ctob
er 2
014
mentioned that appropriate empowerment of employees allows them to deal with their
own job flexibly and also relieve the stress of assignment. According to Ahmed and
Rafiq (1998), empowerment influences an employee’s job satisfaction, customer orien-
tation and service quality. Therefore, if employees are empowered, their attitude and beha-
viours can be changed to satisfy customers’ needs, as expected by the organisation and
customers. Renn and Fedor (2001) proposed that self-efficacy is the factor that affects
the setting of objectives and is also an indirect determinant of the job quality and employee
performance. From a psychological point of view, motivation influences one’s attitude and
attitude influences one’s behaviour. When an employee encounters service failure, in
addition to a soft attitude, timely response, pre-job training, self-efficacy of an employee
are key factors for an employee’s positive behaviours.
H2: Compared with low self-efficacy employee, high self-efficacy employee has positiveinfluence on employee’s service recovery performance.
Generally speaking, there are two ways to motivate, material (external) and non-
material (internal). Davenport and Prusak (1998), for example, argued that substantial
and spiritual motivation were essential and had to be direct to be effective. Osterlo, and
Frey (2000) compared internal and external motivation and pointed out: (1) it is difficult
and unattractive for employees to change the content of internal motivation since its focus
is placed on intangible and spiritual aspects; (2) the content of internal motivation can not
drive employees to work hard. Amabile (1996, 1998) mentioned that these methods are
only effective if employees regarded them as valuable. Monetary reward is only part of
the total motivation and how much reward is considered sufficient is arbitrarily determined
by the management, and according to trial and error. Maybe the best motivation is com-
posed of recognition and monetary reward. Based on the literature stated above, the motiv-
ation suggested in the study is also composed of material and non-material rewards. From
the management point of view, different types of motivation can be appropriately applied
to in different kinds of context. If, for example, the material motivation can instantly result
in the high performance of an employee and a prompt feedback mechanism was essential,
then material motivation can often be quite effective. On the other hand, if employee
satisfaction is based on the completion of assignment and self-challenge or self-realisation,
non-monetary motivation is probably the way to inspire the morale of employees
(Amabile, 1998; Lin, 2007).
Although each type of motivation has its features and applicable contexts, various
needs and characteristics of employee make up a great challenge. To identify individual
variation of employees, utilisation of objectives and performance, links between reward
and performance, fairness of motivation system, all of those could be the indirect
factors that influence the job performance of employees. However, if service failure
occurs, it requires urgent and smooth treatment. Therefore, the employee’s ability to man-
agement crisis and provide solutions will rely on the thoroughness and professionalism of
training provided by the organisation. In addition, whether the organisation has established
a motivation system is an important driving factor affecting the job performance of
employees. Compared with medium-to-top management, primary-level and first-linear
employees desire more material motivation, their income is low and they are able to
meet physical and safety/security needs.
H3: Compared with non-material motivation, material motivation could be positive impact onthe service recovery performance of employee.
446 W.-B. Lin
Dow
nloa
ded
by [
Ast
on U
nive
rsity
] at
14:
06 0
6 O
ctob
er 2
014
Relationship commitment was not only a common variable but also one of the important
variables for prediction model in relationship marketing (Morgan & Hunt, 1994; Kim,
Kim, Kim, & Kang, 2008; Rusbult, 1983). So far, there is no conclusion regarding
whether it was an antecedent variable. For example, some studies regarded commitment
as business to business. In another example, the antecedent variable of the solid relation-
ship is between seller and distribution agent (Johnston & Bonoma, 1981; Leuthesser &
Kohli,1995). Bejou and Palmer (1998) argued that commitment is the instrument for
the customer to verify corporate response to service failure. The effect of the employee’s
service recovery actions depends on the extent of relationship built between employee and
customer. However, in Rod, Ashill, and Carruthers (2008) survey on large-size govern-
mental officials, they not only discuss the impact of role conflict, role ambiguity, role over-
head on service recovery performance but, also, the influence of service recovery
performance on the organisational commitment and job satisfaction. From the relationship
point of view, relationship marketing focused more on customer service than transactional
marketing. Although previous studies have placed the focus on the context of distribution
structure (Moorman, Zaltman, & Deshpande, 1992; Morgan & Hunt,1994), such as the
relationship between seller and distributor, Gruen (1995) mentioned that commitment is
one of the key factors that determine whether business partners can interact closely in a
highly relationship-oriented service industry. From an internal marketing view, no
matter of approaching corporate by affective or calculative, it still has positive influence
on an employee’s job performance. Therefore, it can be concluded that the maintenance to
the customer can not only influence the service recovery actions but also differentiate
relationship marketing from transactional marketing.
H4: Relationship marketing has positive influence on service recovery actions.
Methodology
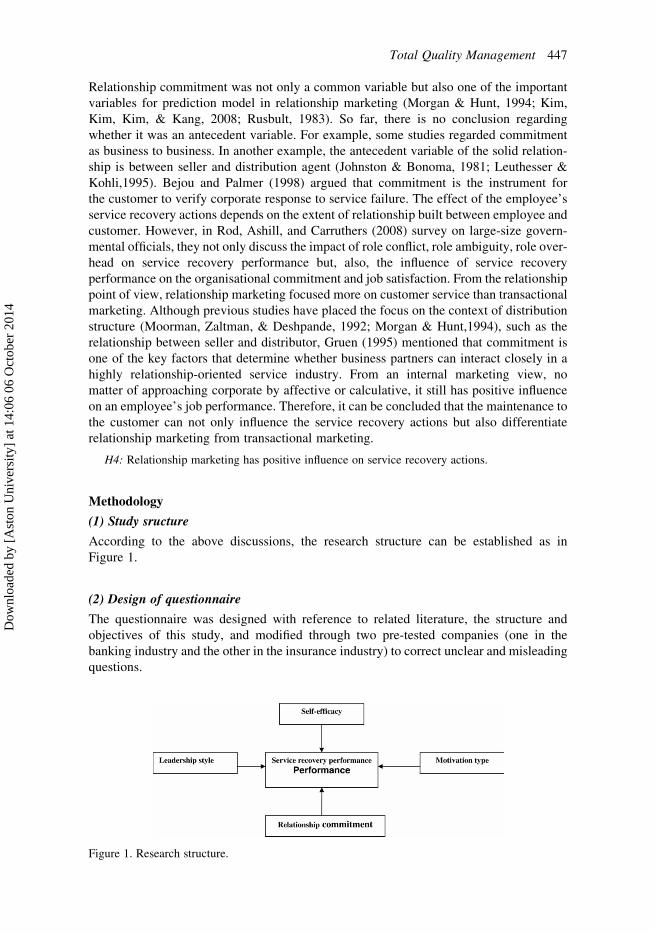
(1) Study sructure
According to the above discussions, the research structure can be established as in
Figure 1.
(2) Design of questionnaire
The questionnaire was designed with reference to related literature, the structure and
objectives of this study, and modified through two pre-tested companies (one in the
banking industry and the other in the insurance industry) to correct unclear and misleading
questions.
Figure 1. Research structure.
Total Quality Management 447
Dow
nloa
ded
by [
Ast
on U
nive
rsity
] at
14:
06 0
6 O
ctob
er 2
014
(3) The definition and measurement of variables
The following variables were measured by a 7-point Likert Scale.
(a) Self-efficacy: according to Bandura (1986), self-efficacy is ‘the perception of indi-
vidual to organization or individual performance of assigned action’. The interviewed
employees whose scores of each question under 3.5 were classified into the low self-effi-
cacy group and those with scores above 3.5 were placed in the high self-efficacy group.
(b) Leadership style: two types of leadership style were discussed in the study, pater-
nalistic leadership and transformational leadership. Paternalistic leadership (Farh &
Cheng, 2000), similar to fatherhood, is characterised by authority and consideration of
subordinates; while transformational leadership (Conger, 1999; Jung & Avolio, 2000)
means that the leader will build relationships with the subordinates through communi-
cation, encouragement, caring and action.
(c) Motivation type: based on the classification of Osterloh and Frey (2000) motivation
can be divided into material (external) and non-material (internal). Material motivation
refers to monetary or substantial reward, while non-material motivation means spiritual
or oral recognition or praise.
(d) Relationship commitment: according to Bejou and Palmer (1998), it is the effort
made to maintain relationship with customers.
(e) Performance of service recovery: as suggested by Boshoff and Allen (2000) and
Babakus, Yavas, Karatepe, and Avci (2003), it is the performance of service recovery
actions that employees recognise as effective.
(4) Sampling method and analysis
The surveyed banking and insurance companies can be classified as service-based compa-
nies. Due to a limited number of branches of the bank, the entire population was surveyed.
However, the surveyed insurance company has many branches in almost each region on
the island, so stratified random sampling was applied. According to regional population,
700 copies of the questionnaire were distributed to the insurance branches in four metro-
polises (Taipei, Kaohsiung, Taichung and Tainan) by the ratio 2:1:1:1. The questionnaires
were delivered by service providers to their customers, and in order to increase the
response rate, questionnaires were also delivered via email or websites and followed via
telephone. Excluding invalid responses, a total of 143 and 205 valid copies were collected
from the insurance and banking company. The return rate was 27.8%. In this study, 35
questions were used to measure variables that did meet the criterion. The profile of the
sample was listed in details in Table 1. In addition, to ensure that the returned samples
are representative of the population, two methods were applied. Firstly, the profiles of
the companies were compared to find out if there was significant difference between the
Table 1. The profile of sampled companies.
Feature Classification Copies returned Percentage
Industry Insurance 143 41.09%Banking 205 58.91%
Years of company established Under 10 years (including) 105 30.17%Above 10 years 243 69.83%
Years of employment Under 5 years (including) 194 55.75%6–10 years 76 21.84%
Above 11 years 78 22.41%
448 W.-B. Lin
Dow
nloa
ded
by [
Ast
on U
nive
rsity
] at
14:
06 0
6 O
ctob
er 2
014
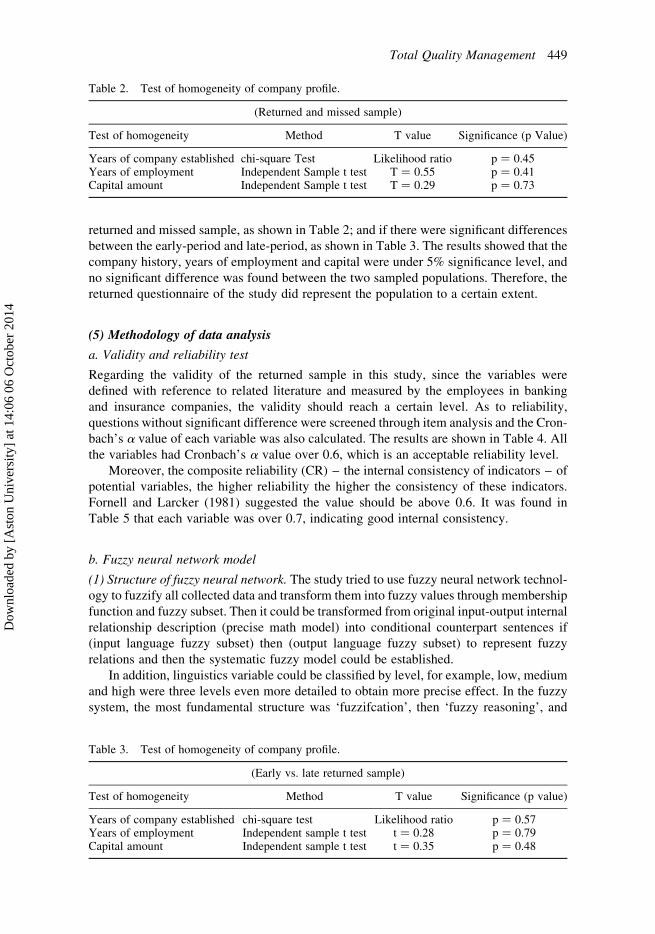
returned and missed sample, as shown in Table 2; and if there were significant differences
between the early-period and late-period, as shown in Table 3. The results showed that the
company history, years of employment and capital were under 5% significance level, and
no significant difference was found between the two sampled populations. Therefore, the
returned questionnaire of the study did represent the population to a certain extent.
(5) Methodology of data analysis
a. Validity and reliability test
Regarding the validity of the returned sample in this study, since the variables were
defined with reference to related literature and measured by the employees in banking
and insurance companies, the validity should reach a certain level. As to reliability,
questions without significant difference were screened through item analysis and the Cron-
bach’s a value of each variable was also calculated. The results are shown in Table 4. All
the variables had Cronbach’s a value over 0.6, which is an acceptable reliability level.
Moreover, the composite reliability (CR) – the internal consistency of indicators – of
potential variables, the higher reliability the higher the consistency of these indicators.
Fornell and Larcker (1981) suggested the value should be above 0.6. It was found in
Table 5 that each variable was over 0.7, indicating good internal consistency.
b. Fuzzy neural network model
(1) Structure of fuzzy neural network. The study tried to use fuzzy neural network technol-
ogy to fuzzify all collected data and transform them into fuzzy values through membership
function and fuzzy subset. Then it could be transformed from original input-output internal
relationship description (precise math model) into conditional counterpart sentences if
(input language fuzzy subset) then (output language fuzzy subset) to represent fuzzy
relations and then the systematic fuzzy model could be established.
In addition, linguistics variable could be classified by level, for example, low, medium
and high were three levels even more detailed to obtain more precise effect. In the fuzzy
system, the most fundamental structure was ‘fuzzifcation’, then ‘fuzzy reasoning’, and
Table 2. Test of homogeneity of company profile.
(Returned and missed sample)
Test of homogeneity Method T value Significance (p Value)
Years of company established chi-square Test Likelihood ratio p ¼ 0.45Years of employment Independent Sample t test T ¼ 0.55 p ¼ 0.41Capital amount Independent Sample t test T ¼ 0.29 p ¼ 0.73
Table 3. Test of homogeneity of company profile.
(Early vs. late returned sample)
Test of homogeneity Method T value Significance (p value)
Years of company established chi-square test Likelihood ratio p ¼ 0.57Years of employment Independent sample t test t ¼ 0.28 p ¼ 0.79Capital amount Independent sample t test t ¼ 0.35 p ¼ 0.48
Total Quality Management 449
Dow
nloa
ded
by [
Ast
on U
nive
rsity
] at
14:
06 0
6 O
ctob
er 2
014
eventually ‘fuzzy judgment’. The fuzzy neural network was exactly the same both in
input/output and the fuzzy system, and its internal weights or parameters, could be modi-
fied through learning. Moreover, it could automatically generate appropriate membership
functions and fuzzy rules through certain learning algorithms. These membership func-
tions and fuzzy rules could generate non-linear models of the system after finishing modi-
fication. Illustrated by two inputs and one output of fuzzy neural model, more input and
output could be expanded through this model. Its structure was shown in Figure 2.
1. Layer 1: Input layer
Input units: I(1)l = X1, i = 1, 2
Onput units: O(1)ij = I(1)i , i = 1, 2; j = 1, 2,L, n
2. Layer 2: Linguistic term layer
The utilisation of the first layer by Gaussian function to derive the membership function
Input units: I(2)ij =(O(1)
ij − aij)2
b2ij
, i = 1, 2 : j = 1, 2,L, n
Onput units: O(2)ij = mAij
= exp(I(2)ij ), i = 1, 2; j = 1, 2,L, n)
were, respectively, the centre and the width parameters of the Gaussian function.
3. Layer 3: Rule layer
The layer was to reason its application of each rule in rule set
Input units: I(3)(j−l)n+1 = O(2)ij O(2)
2l , j = 1, 2;L, n : l = 1, 2,L, n
Onput units: O(3)i = mi = I(3)i , i = 1, 2;L,m(= n2)
4. Layer 4: Output layer
Input units: I(4) =∑m
p=1
O(3)p Wp
Output units: O(4) = m∗ = I(4)∑m
p=1 O(3)p
Based on the structure above, the typical rule could be rewritten as:
if X1 is mA1l and X1 is mA1l then W1 = K1
K1 = constant(zero-order Sugeno fuzzy model) constant
or
K1 = p × X1 + q × X2 + r (first - order Sugeno fuzzy model, p,q,r are all constants)
Table 4. Reliaility test of the variables.
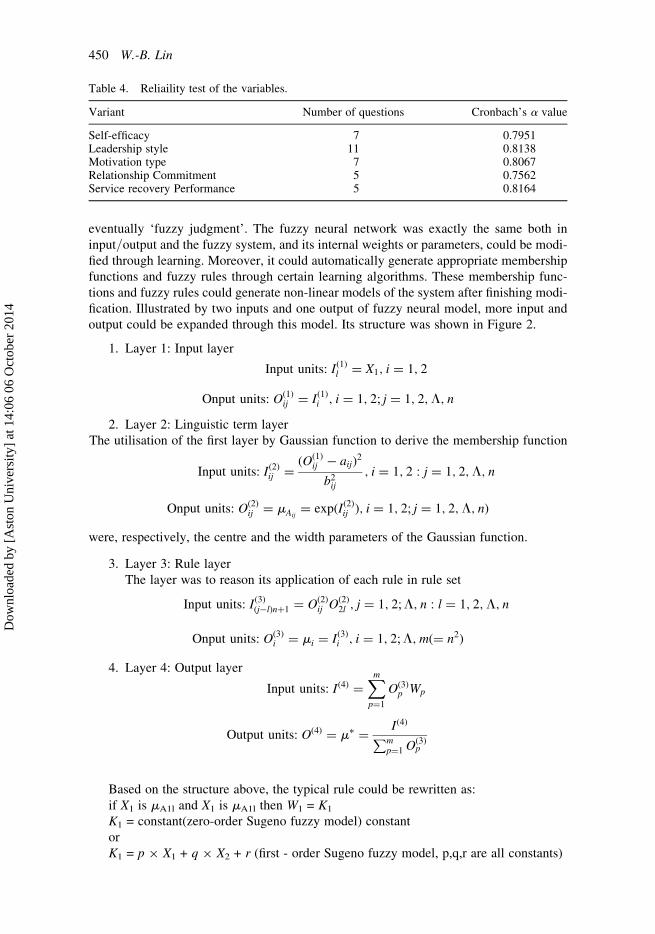
Variant Number of questions Cronbach’s a value
Self-efficacy 7 0.7951Leadership style 11 0.8138Motivation type 7 0.8067Relationship Commitment 5 0.7562Service recovery Performance 5 0.8164
450 W.-B. Lin
Dow
nloa
ded
by [
Ast
on U
nive
rsity
] at
14:
06 0
6 O
ctob
er 2
014
Table 5. The validity and reliability test.
Variable Mean (SD)Factorloading T value SD (LR)
Variable measured
Self-efficacy 3.56 (0.68) When I decide to do something, I will do it immediately (X1) 0.79 11.56 0.39 0.805I am confident that I can put a plan into practical (X2) 0.76 9.87 0.46I will still insist on completing what I am fond of (X3) 0.81 12.64 0.32I am a highly self-independent teammate (X4) 0.82 11.41 0.26I usually can achieve the major goals set by myself (X5) 0.76 13.58 0.26I prevent myself from encountering hard contexts (X6) 0.79 11.08 0.31I have no confidence in my ability to fulfill tasks (X7) 0.71 12.36 0.29
Motivation type 3.82 (0.61) Value material reward and use it to inspire morale (X8) 0.80 10.26 0.28 0.825Set monetary incentive system for those solution proposals (X9) 0.83 9.52 0.32Emphasise the important of incentive system for morale encouragement (X10) 0.82 11.54 0.41The company performance bonus is higher than others (X11) 0.84 10.63 0.26The employee evaluation stresses on the improvement of job quality (X12) 0.78 11.28 0.48The recognition of solution proposals is through official award ceremony (X13) 0.76 12.69 0.36One of the self job-expectation of employee is harmony with colleagues (X14) 0.71 9.68 0.29
Leadership style 3.51 (0.48) The manager assisted each subordinate to satisfy his/her needs (X15) 0.84 11.56 0.39 0.813The manager sympathised with the feeling of employee experiencing the service
error (X16)0.85 10.59 0.41
The manager’s behaviour inspired the team spirit (X17) 0.86 11.68 0.29The manager proposed expected goals and ideas and headed for the goals (X18) 0.76 10.58 0.35The manager encouraged us to work for the future mission of the company (X19) 0.71 11.87 0.44The manager made use of chances to share his opinions and hope to share them
with others (X20)0.82 10.84 0.26
In meetings, the manager mostly made the final decisions (X21) 0.85 9.84 0.35When task could not be fulfilled, the manager would asked me to explain (X22) 0.83 11.58 0.42The manager would criticise my negligence over something I was supposed to
achieve (X23)0.79 12.64 0.36
The manager could teach by personal example (X24) 0.75 9.84 0.45The manager evaluated my job performance benchmark by his/her personal
criteria (X25)0.69 9.45 0.36
(Continued)
To
tal
Qu
ality
Ma
na
gem
ent
45
1
Dow
nloa
ded
by [
Ast
on U
nive
rsity
] at
14:
06 0
6 O
ctob
er 2
014
Table 5. Continued.
Variable Mean (SD)Factorloading T value SD (LR)
Variable measured
Relationship commitment 3.74 (0.72) The company patiently listened to the voices of each employee (X26) 0.82 10.56 0.26 0.826The company consulted employees’ opinions for customer service (X27) 0.84 11.28 0.38I valued my service performance in the company very much (X28) 0.86 10.46 0.42Overall, the company was trustworthy (X29) 0.81 11.54 0.32I thought the company paid attention to maintaining good relationship with
employees (X30)0.84 10.89 0.34
Service recoveryperformance
2.43 (0.58) I did not think that I did not know what to do on service recovery (Y1) 0.79 12.39 0.16 0.796The customers who experienced service recovery delivered by me never left with
unsolved issue (Y2)0.81 10.05 0.34
The customers who experienced service recovery delivered by me came moreoften than before (Y3)
0.82 11.59 0.39
I could make unsatisfied customers change their views and become satisfied (Y4) 0.76 11.46 0.21I did a good job [on service recovery] all the time (Y5) 0.81 9.65 0.26
Note: SD ¼ standard deviation; LR ¼ level of reliability.
45
2W
.-B.
Lin
Dow
nloa
ded
by [
Ast
on U
nive
rsity
] at
14:
06 0
6 O
ctob
er 2
014

As to the learning algorithm, the back propagation of the steepest descent method and
least squares estimation of learning algorithm in rule set were exercised respectively in this
study.
The proceeding steps of the study:
(1) A total of 348 copies of the questionnaire were returned.
(2) Each input and output variable was defined and the numbers of membership func-
tions were decided.
(3) Proceeded the training of fuzzy neural model, One epoch is identified after every
completion of 348 copies of data. During the period, the parameters would be
updated to obtain optimised membership function and rule set.
After the training, the fuzzy neural model could be obtained. The influence of the input
variable on the output variable could be tested. Since there was only one input variable on
one output variable, except for tested variable couple, other variables were kept constant.
(The mean of 348 copies were applied to have the least influence of the controlled variables.)
c. The reason of selecting fuzzy neural network model
The reason for applying the non-linear fuzzy neural network model in the study was to
decrease variables to input the initial input value of fuzzy neural network conveniently.
The application of the non-linear approach could more precisely understand the interaction
relationship among variables. White (1989) stressed that fuzzy neural network model can
identify the types and relationship of data and the application in multiple variable analysis.
Secondly, fuzzy neural network model is a comprehensive and well developed model, for
prediction, classification and uncertain behaviour system. Its advantages are as follows: (1)
sufficiently approaching any given non-linear function, like the sampling of the study, a
high non-linear function; (2) all qualitative and quantitative information distributed in
balance in the epochs of network, with strong error-tolerance and flexibility; (3) paralleled
distribution enabling speedy and massive algorithm and applicable to complex non-linear
systems in business administration; (4) less pre-setting effort is required, only the data of
Figure 2. The network structure of fuzzy neural network.
Total Quality Management 453
Dow
nloa
ded
by [
Ast
on U
nive
rsity
] at
14:
06 0
6 O
ctob
er 2
014
input and output layer and input system are required to obtain the relationship among
variables.
Empirical results
Firstly, Hypothesis 1 was to discuss the relationship between leadership style and service
recovery performance. Based on the empirical results of fuzzy neural network model, each
input variable had low and high two membership functions while the rule set was applied
by the zero-order sugeno fuzzy model. After 158-time and 169-time of learning circula-
tion, the average testing errors were 0.2016 and 0.1874 respectively, and the testing
results shown in Figure 3(a) and 3(b), were: ‘†’ refers to the tested data of input
variant; while ‘V’ refers to the output data calculated by fuzzy neural network model. It
could be indicated on the figure that the distribution of ‘transformational leadership’
and ‘service recovery performance’ were quite close in terms of significantly positive
relation while ‘paternalistic leadership’ and ‘ervice recovery performance’ did not have
consistent distribution. Therefore, H1 was supported.
Secondly, Hypothesis 2 was to discuss the relationship between the different levels of
self-efficacy of employee and service recovery performance. Based on the empirical
results of fuzzy neural network model, each input variable had low and high two member-
ship functions while the rule set was applied by zero-order sugeno fuzzy model. After 109-
time and 126-time of learning circulation, the average testing error were 0.1865 and
0.1674 respectively, and the testing results, shown in Figure 4(a) and 4(b), were: ‘†’
denotes the tested data of input variable, while ‘V’ refers to the output data calculated
by fuzzy neural network model. It could be discovered from the figure that the distribution
of ‘high self-efficacy employee’ and ‘service recovery performance’ were quite close in
terms of a significantly positive relation while ‘low self-efficacy employee’ and ‘service
recovery performance’ did not have a consistent distribution. Therefore, it could be
concluded that H2 was supported.
Thirdly, the sample method could be applied to test H3. Based on the empirical results
of fuzzy neural network model, after 216-time and 245-time of learning circulation, the
average testing error were 0.2049 and 0.1863 respectively, and the testing results shown
in Figure 5(a) and 5(b), were: ‘†’ denotes the tested data of input variable while ‘V’
indicates the output data calculated by the fuzzy neural network model. It could be
discovered from the figure that no matter the distribution of ‘material motivation type’
or ‘non-material motivation type’, the relationship of either of them and ‘service recovery
performance’ were not distributed consistently in terms of no significant correlation.
Therefore, H3 was not supported.
Figure 3. The input variants and membership functions of leadership style and service recoveryperformance.
454 W.-B. Lin
Dow
nloa
ded
by [
Ast
on U
nive
rsity
] at
14:
06 0
6 O
ctob
er 2
014
Based on the empirical results of fuzzy neural network model, after 175-time of learn-
ing circulation, the average testing error was 0.1811, and the testing results were shown in
Figure 6. It could be discovered that the distribution of ‘relationship commitment’ and
‘service recovery performance’ were quite similar in terms of significantly positive
relation. Therefore, it could be concluded that H4 was supported.
Conclusions and suggestions
In this study, multiple variable analysis and fuzzy neural network model were applied to the
proposed hypothesis. The results can be concluded as followed: (1) The supported H1
Figure 4. The input variants and membership functions of self-efficacy of employee and servicerecovery performance.
Figure 6. The input variants and membership functions of relationship commitment and servicerecovery performance.
Figure 5. The input variants and membership functions of motivation type and service recoveryperformance.
Total Quality Management 455
Dow
nloa
ded
by [
Ast
on U
nive
rsity
] at
14:
06 0
6 O
ctob
er 2
014
indicated that the corporate management should emphasise on creating an employee-caring
working environment and listening to the opinions and feeling of employees. The impli-
cation behind the findings was that the working population in the service industry in
Taiwan is gradually increasing and the demand of higher education is also growing, as
seen in western countries. Therefore, applying Y-theory to recover service contexts may
improve the employee’s ability of crisis management and lead to a positive effect on
service recovery performance; (2) Moreover, the study agreed with the views of Shea
and Howell (2000) and Sue-Chan and Ong (2002) that employees could be inspired
through self-efficacy, resulting in better agreement in the job and themselves inducing posi-
tive impact on the job performance; (3) Regarding the in-significant-relationship between
motivation type and service recovery performance, the implication could be explained as
follows: firstly, in special context of service recovery incidence, the instinct of responsible
or aggressive employee was to solve the problem caused by service failure incident. There-
fore, it is necessary to establish policies for service recovery or provide more training
courses on urgent crisis management; (4) In the service industry, more attention should
be paid to marketing and post-sales services of the value chain in medium-to-down
stream. From the perspective of relationship marketing, to maintain close relationships
with customers is also one of the key objectives of a business operation. Although the
views of this study coincide with the ‘relationship’ highlighted by Rod et al. (2008),
what Rod et al. (2008) emphasised was the performance of service recovery (regarded as
an independent variable) and its impact of organisation commitment was different from
the performance of service recovery as the independent variable in the study. Also, the
focus of the objectives of the employee role on the impact of the performance of service
recovery was different from three aspects of approach: leadership style of manager,
employee, and manager-subordinate interaction relationship; (5) The empirical results of
this study reflects the importance of the employee’s role for the performance of service
recovery and argues the urgency of improving the self-efficacy of the employee since
customer’s perception of post-service recovery matters in the treatment of employees at
the moment of truths.
Moreover, the features of the study is as follows: (1) Although the same results were
derived through the statistical model or non-linear fuzzy neural network model, the
application of fuzzy neural network model could not only more precisely measure the
relationship among variables but also have less limitations of assumptions, so it is more
applicable to business administration; (2) The study probed into various views inside an
organisation, including management, employee and manager-subordinate factors of influ-
encing the performance of service recovery in terms of the proactive and preventive
internal organisational aspects improving the ways of treatment of service recovery,
which is quite different from the views of consumer. Most previous studies were based
on Western companies (Maxham III, 2001; Patterson et al., 2006), while this study
focused on service industries in Taiwan to interpret the relationship between employee
and service recovery.
The directions for future researchers are suggested as follows: (1) other factors that
may affect service recovery, such as types of training, policies of service recovery, can
be investigated to construct a more complete models; (2) the result of different hypotheses
by different models can be compared. For example, the application of structural equation
modeling and fuzzy neural network model can be compared or the difference of variables
can be tested to discuss the reasons of the results.
The limitations of the study are summarised as follows: (1) although we do not have
large numbers of banking and insurance companies in Taiwan, there are still many kinds of
456 W.-B. Lin
Dow
nloa
ded
by [
Ast
on U
nive
rsity
] at
14:
06 0
6 O
ctob
er 2
014
service-orientated industries. There may be more variations of empowerment. Therefore,
if variables such as company size, familism, authority type and organisational climate
were included, different implications could be derived; (2) a standard sampling method
was applied in the study to collected 348 valid copies. Yet, too many questions were
involved, leading to a low return rate. For fuzzy neural network model, a sample size
over 100 copies is suggested. In spite of meeting the criterion in this study, improving
the times of circulation might reduce the high error rate issue. It is suggested that
further studies might try different calculation models and induce the intention of respon-
dents to effectively increase the return rate and then improve the accuracy of results; (3)
This study was based on a cross-sectional research method to discuss the antecedents of
service recovery performance, so it is suggested that a time-series approach can be
applied. Maybe the results could better reflect employees response to service failure.
References
Ahmed, P.K., & Rafiq, M. (1998). A customer-oriented framework for empowering service employ-ees. Journal of Services Marketing, 12(5), 379–394.
Amabile, T.M. (1996). Creativity in context: Update to the social psychology of creativity. Boulder,CO: Westview Press.
Amabile, T.M. (1998). How to kill creativity. Harvard Business Review, 76(5), 76–88.Appelbaum, S.H., & Hare, A. (1996). Self-efficacy as a mediator of goal setting and performance.
Journal of Managerial Psychology, 11(3), 33–47.Babakus, E., Yavas, U., Karatepe, O.M., & Avci, T. (2003). The effect of management commitment
to service quality on employees’ affective and performance outcomes. Journal of theAcademy of Marketing Science, 31(3), 272–286.
Bandura, A. (1986). Social foundations of thought and action: A social cognitive theory. EnglewoodCliffs, NJ: Prentice-Hall.
Bass, B.M., & Avolio, B.J. (1993). Transformational leadership: A response to critiques. In M.M.Chemers & R. Ayman (Eds.), Leadership theory and research: Perspectives and directions(pp. 21–35). San Diego, CA: Academic Press.
Bejou, D., & Palmer, A. (1998). Service failure and loyalty: An exploratory empirical study of airlinecustomers. Journal of Services Marketing, 12(1), 7–22.
Boshoff, C., & Allen, J. (2000). The influence of selected antecedent on frontline staff’s perceptionsof service performance. International Journal of Service Industry Management, 11(1), 63–90.
Boulding, W., Kalra, A., Staelin, R., & Zeithaml, V.A. (1993). A dynamic process model of servicequality: From expectations to behavioral intentions. Journal of Marketing Research, 3, 7–27.
Cheng, B.S., Chou, L.F., Huang, M.P., Wu, T.Y., & Farh, J.L. (2004). Paternalistic leadership andsubordinate reverence: Establishing a leadership model in Chinese organizations. AsiaJournal of Social Psychology, 7(1), 89–117.
Chou, L.F., Cheng, B.S., & Jen, C.K. (2005). The contingent model of paternalistic leadership:Subordinate dependence and leader competence. Paper presented at annual meeting ofAcademy of Management, Hawaii, USA.
Chung-Herrera, B.G., Goldschmidt, N., & Doug, H.K. (2004). Customer and employee views ofcritical service incidents. Journal of Services Marketing, 18(4), 241–254.
Conger, J.A. (1999). Charismatic and transformational leadership in organizations: An insider per-spective on these developing streams of research. Leadership Quarterly, 10(2), 145–179.
Crant, M.J. (2000). Proactive behavior in organizations. Journal of Management, 26(3), 435–462.Davenport, T.H., & Prusak, L. (1998). Working knowledge: How organization manage what they
know. Harvard Business School Press.de Jong, A., & de Ruyter, K. (2004). Adaptive versus proactive behavior in service recovery: The
role of self-managing teams. Decision Sciences, 35(3), 457–491.Farh, J.L., & Cheng, B.S. (2000). A cultural analysis of paternalistic leadership in Chinese organiz-
ations. In J.T. Li., A.S. Tsui, & E. Weldon (Eds.), Management and organizations in theChinese context (pp. 38–49). London: Macmillan.
Farh, J.L., Leung, F., & Law, K. (1998). On the cross-cultural validity of Holland’s model of voca-tional choices in Hong Kong. Journal of Vocational Behavior, 52, 425–440.
Total Quality Management 457
Dow
nloa
ded
by [
Ast
on U
nive
rsity
] at
14:
06 0
6 O
ctob
er 2
014
Fornell, C., & Larcker, D.F. (1981). Evaluating structural equation models with unobservable vari-ables and measurement error: A comment. Journal of Marketing Research, 18(3), 375–381.
Hamilton, G.G. (1990). Patriarchy, patrimonialism and filial piety: A comparison of China andWestern Europe. British Journal of Sociology, 41(1), 77–104.
Harris, K.E., Grewal, D., Mohr, L.A., & Bernhardt, K.L. (2006). Consumer responses to servicerecovery strategies: The moderating role of online versus offline environment. Journal ofBusiness Research, 59(4), 425–431.
Hartline, M.D., & Ferrell, O.C. (1996). The management of customer-contact employees: An empiri-cal investigation. Journal of Marketing, 60(4), 52–70.
Hartline, M.D., Maxham III, J.G., & McKee, D.O. (2000). Corridors of influence in the dissemina-tion of customer-oriented strategy to customer contact service employees. Journal ofMarketing, 64, 35–50.
Hoffman, K.D., Kelley, S.W., & Rotalsky, H.M. (1995). Tracking service failure and employeerecovery efforts. Journal of Services Marketing, 9(2), 49–61.
House, R.J., Wright, N.S., & Aditya, R.N. (1997). Cross-cultural research on organizational leader-ship: A critical analysis and a proposed theory. In P.C. Earley & M. Erez (Eds.), New perspec-tives on international industrial/organizational psychology (pp. 535–625). San Francisco:New Lexington Press.
Johnston, W.J., & Bonoma, T.V. (1981). The buying center: Structure and interaction patterns.Journal of Marketing, 45, 143–156.
Jung, D.I., & Avolio, B.J. (2000). Opening the black box: An experimental investigation of the med-iating effects of trust and value congruence on transformational and transactional leadership.Journal of Organizational Behavior, 21(4), 949–946.
Kim, K.H., Kim, K.S., Kim, D.Y., & Kang, S.H. (2008). Brand equity in hospital marketing. Journalof Business Research, 61, 75–82.
Leuthesser, L., & Kohli, K.A. (1995). Relationship behavior in business markets: Implication forrelationship management. Journal of Business Research, 34, 221–233.
Lewis, B., & Syprakopoulos, R. (2001). Transaction or relationship marketing: Determinants of stra-tegic choices. Journal of Marketing Management, 17(4), 449–464.
Liao, H., & Chuang, A. (2007). Transforming service employees and climate: A multilevel, multi-source and examination of transformational leadership in building long-term service relation-ships. Journal of Applied Psychology, 92(4), 1006–1019.
Lin, W.-B. (2007). The exploration factors of affecting knowledge sharing – the case of Taiwan’shigh-tech industry. Expert Systems with Applications, 35(3), 661–676.
Mattila, A.S. (2001). The effectiveness of service recovery in a multi-industry setting. The Journal ofService Marketing, 15(6), 583–596.
Mattila, A.S., & Patterson, P.G. (2004). The impact of culture on consumers’ perceptions of servicerecovery efforts. Journal of Retailing, 80, 196–206.
Maxham III, J.G. (2001). Service recovery’s influence on consumer satisfaction, positive word-of-mouth and purchase intentions. Journal of Business Research, 54, 11–24.
McDonald, T., & Siegall, M. (1992). The effects of technological self-efficacy and job focus on jobperformance, attitude and withdrawal behaviors. Journal of Psychology, 126(5), 465–475.
Moorman, C., Zaltman, G., & Deshpande, R. (1992). Relationships between providers and users ofmarket research. Journal of Marketing Research, 29(3), 314–329.
Morgan, R.M., & Hunt, S.D. (1994). The commitment-trust theory of relationship marketing.Journal of Marketing, 29, 20–38.
Natalia, L., & Barbara, R.L. (2004). Service recovery in the airline industry: A cross-cultural com-parison of the attitudes and behaviors of British and Italian front-line personnel. ManagingService Quality, 14(1), 11–25.
Osterloh, M., & Frey, B.S. (2000). Motivation, knowledge transfer and organizational forms.Organization Science, 11(5), 538–550.
Patterson, P.G., Cowley, E., & Prasongsukarn, K. (2006). Service failure recovery: The moderatingimpact of individual-level cultural value orientation on perceptions of justice. InternationalJournal of Research in Marketing, 23(3), 263–277.
Redding, S.G. (1990). The spirit of Chinese capitalism. Berlin: Walter de Gruyter.Renn, RW., & Fedor, D.B. (2001). Development and field test of a feedback seeking, self-efficacy
and goal setting model of work performance. Journal of Management, 27, 563–583.
458 W.-B. Lin
Dow
nloa
ded
by [
Ast
on U
nive
rsity
] at
14:
06 0
6 O
ctob
er 2
014
Rod, M., Ashill, N., & Carruthers, J. (2008). The relationship between job demand stressors, servicerecovery performance and job outcomes in a state-owned enterprise. Journal of Retailing andConsumer Services, 15, 22–31.
Rusbult, C.E. (1983). A longitudinal test of the investment model: The development and deterio-ration of satisfaction and commitment in heterosexual involvements. Journal of Personalityof Social Psychology, 45, 101–117.
Shea, C.M., & Howell, J.M. (2000). Efficacy-performance spirals: An empirical test. Journal ofManagement, 26(4), 791–812.
Smith, A.K., Bolton, R.N., & Wanger, J. (1999). A model of customer satisfaction with serviceencounters involving failure and recovery. Journal of Marketing Research, 36, 356–372.
Sparts, B.A., & McColl-Kennedy, J.R. (2001). Justice strategy options for increased satisfaction in aservices recovery setting. Journal of Business Research, 54(3), 209–218.
Sue-Chan, C., & Ong, M. (2002). Goal assignment and performance: Assessing the mediating rolesof goal commitment and self-efficacy and the moderating role of power distance.Organizational Behavior and Human Decision Processes, 89(2), 1140–1161.
Tax, S.S., Brown, S.W., & Chandrashekaran, M. (1998). Recovering and learning from servicefailure. Sloan Management Review, 40(1), 75–88.
Webster, C., & Sundaram, D.S. (1998). Service consumption criticality in failure recovery. Journalof Business Research, 41(2), 153–159.
Westwood, R.I. (1997). Harmony and patriarchy: The culture basis for ‘paternalistic headship’among the oversea Chinese. Organization Studies, 18, 445–480.
White, H. (1989). Some asymptotic results for learning in single hidden layer feed-forward networkmodels. Journal of the American Statistical Association, 84, 1003–1013.
Winsted, K.F. (1997). The service experience in two cultures: A behavioral perspective. Journal ofRetailing, 73(3), 337–360.
Wong, N.Y. (2004). The role of culture in the perception of service recovery. Journal of BusinessResearch, 57, 957–963.
Yukl, G.A. (1998). Leadership in organizations (4th ed.). Englewood Cliffs, NJ: Prentice-Hall.
Total Quality Management 459
Dow
nloa
ded
by [
Ast
on U
nive
rsity
] at
14:
06 0
6 O
ctob
er 2
014