Embed Size (px)
Citation preview

Report No. 404
FACTORS AFFECTING THE FORMATION OF FATS, OILS, AND GREASE
DEPOSITS IN SEWER SYSTEMS
and
FATE OF FOG DEPOSIT FORMING PRECURSORS IN SEWER SYSTEMS
By
Francis de los Reyes
Joel J. Ducoste
Department of Civil, Construction, and Environmental Engineering
North Carolina State University
Raleigh, North Carolina
February 2012
UNC-WRRI-404
FACTORS AFFECTING THE FORMATION OF FATS, OILS, AND GREASE
DEPOSITS IN SEWER SYSTEMS
and
FATE OF FOG DEPOSIT FORMING PRECURSORS IN SEWER SYSTEMS
By
Francis de los Reyes, Joel J. Ducoste
Department of Civil, Construction, and Environmental Engineering
North Carolina State University
Raleigh, North Carolina
The research on which this report is based was supported by funds from the U.S.
Department of the Interior, U.S. Geological Survey, the Water Resources Research
Institute of The University of North Carolina, and the Urban Water Consortium.
The views and conclusions contained in this document are those of the authors and
should not be interpreted as necessarily representing the official policies, either expressed
or implied, of the U.S. Government, the Water Resources Research Institute of The
University of North Carolina, or the State of North Carolina.
This report fulfills the requirements for a project completion report of the Water
Resources Research Institute of The University of North Carolina. The authors are solely
responsible for the content and completeness of the report.
WRRI Project No. 50390
February 14, 2012

2
ABSTRACT
Factors Affecting the Formation of Fats, Oils, and Grease Deposits in Sewer Systems and
Fate of FOG Deposit Forming Precursors in Sewer Systems
This Final Report combines the reports for the two WRRI projects, as they are related, and being
conducted by the same research team (PIs, grad student and undergraduate assistants). The
objective of the first project was to quantify the effects of kitchen wastewater characteristics on
fat, oil, and grease (FOG) deposit formation mechanism and rate. The objective of the second
project was to test the hypothesis that FOG formation in sewers is caused via a saponification-
like reaction involving major chemical precursors: free fatty acids, a metal cation, and surfactant.
Thus, the overall goal of the combined projects was to determine the mechanism(s) of FOG
deposit formation in sewer lines, and to elucidate the role of various factors in the deposit
phenomenon, with the end-goal of understanding how to control sewer line blockages due to
FOG formation.
The projects used a variety of techniques and methods to achieve these goals. Initial experiments
were aimed at exploring the interplay of various hypothesized factors, such as oil type, calcium,
potassium, and attachment surface (e.g., concrete coupons), and were conducted in batch tests
using a jar apparatus. In parallel, a pipe loop system simulating a sewer line was constructed.
These experiments were designed to induce the formation of FOG deposits in lab-scale. After
many attempts, FOG deposits were formed in a batch system using grease interceptor (GI)
effluent from a restaurant. To our knowledge, this is the first time that FOG deposits have been
formed under lab conditions. FTIR analysis showed that the FOG deposits were metallic salts of
fatty acid as revealed by comparisons with FOG deposits collected from sewer lines and pure
calcium soaps. Based on the data, we proposed that the formation of FOG deposits occurs from
the aggregation of excess calcium compressing the double layer of free fatty acid micelles, and a
saponification reaction between aggregated calcium and free fatty acids.
Subsequent batch tests explored the role and possible sources of calcium, the role of the type of
attachment surface, the role of free fatty acids, and the role of surfactants. The nature of FOG
deposits from different types of free fatty acids was also explored, and we showed that the type
of free fatty acid influenced the nature of the saponification reaction and the characteristics of the
FOG deposit, indicating that the type of food from grease interceptors will determine the type of
FOG deposits in downstream sewer lines. Pipe loop experiments outfitted with coupons of
different sewer lining material confirmed the saponification reaction mechanism. Taken
together, the data resulted in a proposed mechanism for how FOG deposits form in sewer lines
and how each of the required components in the reaction can be present in the grease
interceptor/sewer environment. These results increase our understanding of the FOG blockage
phenomenon, and indicate new avenues for how to monitor and control restaurant effluent to
minimize FOG deposit formation. The results also have implications for GI material choice and
construction.

3
ACKNOWLEDGEMENTS
We would like to thank the NC Water Resources Research Institute for funding of this project.
We would like to thank Donald Smith of the Town of Cary with assistance in the collection of
grease interceptor effluent. We acknowledge the cooperation of several food service
establishments in the Town of Cary. We are grateful for the assistance of Mahbuba Iasmin and
the support of undergraduate researchers Michael Carpenter and Andrew Jarman. We
acknowledge our colleague Tarek Aziz for helpful discussions on FOG, and the research
collaboration with colleagues Lisa Dean of the Department of Food Science, and Simon Lappi of
the Department of Chemistry, both at NC State University.
4
1. INTRODUCTION
As the numbers and density of commercial food preparation and serving facilities increase, so do
the amounts of fats, oils and grease (FOG) that are routinely discharged into sewer collection
systems. Of the estimated tens of thousands of sanitary sewer overflows (SSOs) that occur each
year in the United States, approximately 48% are due to line blockages, of which 47% are related
to FOG deposits that constrict the cross-sectional access of pipe (EPA, 2004). SSOs are not only
unlawful releases of untreated wastewater into the waters of the United States; they also
introduce significant amounts of environmentally detrimental nutrients into river segments
already plagued with algal blooms. Grease-related SSOs resulted in the discharge of about
114,000 m3 (30 million gal) of wastewater, which not only introduced pollutants to the
environment, but also exposed the public to pathogens (EPA, 2004). The raw sewage in SSOs
contains pathogenic bacteria, viruses, protozoa, helminths and other organisms. SSOs may
impact drinking water sources, affect the public through recreational or direct exposure, affect
shellfish harvested from areas contaminated by sewage, lead to fish kills, or lead to outbreaks of
toxic algae or dinoflagellates. In North Carolina, an estimated 15,000 SSOs occur annually,
costing hundreds of thousands of dollars in cleanup and line unclogging (Town of Cary website).
Despite the central role that FOG deposits play in SSOs, very little is known about the
mechanisms of FOG deposit formation in sanitary sewers.
Examination of the physical properties and chemistry of FOG deposit samples from 23 cities
around the United States (Keener et al., 2008) showed that FOG deposits display an adhesive
character, have a grainy, sandstone-like texture and high yield strength. In addition, 16 of 19
FOG deposit samples (84%) contained greater than 50% lipid content, with the primary lipid
being palmitic, a saturated fat and 85% of FOG deposit samples contained calcium as the
primary metal, with average concentrations of 4255 mg/L (Keener et al., 2008). The
preferential accumulation of fats and calcium further suggests that FOG deposits may be metallic
salts of fatty acids and chemical saponification may be responsible for their formation (Keener et
al., 2008). Calcium ions are naturally present in domestic and industrial wastewater and high
levels of free fatty acids have been found in wastewater due to processes such as food frying
(Canakci, 2007). Additionally, calcium may be released from biologically induced concrete
corrosion (Okabe et al., 2007; O’Connell et al., 2010; Bielefeldt et al., 2010). While the
saponification process may be a plausible explanation for the formation of these deposits due to
their chemical constituents and physical structure, proof for this mechanism requires additional
data, including the actual formation of FOG deposits under saponification condition.
The project represents one of the first direct efforts to test a mechanistic explanation of FOG
deposit formation in sewer collection systems. To the PIs’ knowledge, there is no other research
group that is comprehensively investigating FOG deposit formation, and no other group has
reported recreation of FOG deposits in batch conditions. A fundamental understanding of FOG
deposit formation is necessary if rational and science-based regulations are to be adopted by
municipalities and cities in NC and all over the world. Most of the municipal ordinances are
based on empirical or anecdotal evidence; it is not clear, for example, if release of less than 200
mg/L oil and grease does not lead to deposit formation downstream. This lack of fundamental

5
information on the actual levels of FOG deposit precursors has led to many misconceptions (e.g.,
on the role of food solids, or the effectiveness of commercially available additives). Such
information will guide municipalities, as pretreatment managers formulate and implement
strategies to maintain a sustainable sewer collection system in high density metropolitan cities
that are experiencing significant growth and alleviate the potential environmental and public
health harm from FOG related SSOs. Overall, it is hoped that the results will assist utilities in
better meeting Clean Water Act requirements, provide reliable service to their constituents, and
improve the protection of source water and watersheds. The project results have been
disseminated through conferences, and the research has resulted in 1 paper published, with two
more in preparation. The project has led to one PhD Dissertation (Xia He).

6
2. MATERIALS AND METHODS
2.1. Formation of FOG deposits under laboratory conditions.
Batch tests were performed using a jar-test apparatus (Phipps & Bird JarTesterTM
, Figure 1). In
each beaker, 1L of sample was added and mixed with calcium chloride salt (CaCl2.2H2O) at
varying concentrations. Samples included water with various additions of different kinds of oil
(vegetable oil, bacon fat, lard, beef fat). In addition, grease interceptor (GI) effluent from a
steakhouse in Cary, NC was collected and used as the source of free fatty acids. The mixing
speed was set at 20 rpm and operated continuously at 20°C for 10 days. On day 10 of the
reaction process, the solution in each beaker was filtered through a wet-strengthened qualitative
filter paper (>25 m) using a vacuum pump to collect formed FOG deposits. The filter paper
with the FOG deposits was then dried at 105 C overnight, and the concentration of FOG deposit
was determined as total suspended solids (APHA, 1998). Vegetable oil (canola) mixed with the
same amount of calcium chloride and exposed to the same conditions as the GI effluent samples
was used as control.
Figure 1. Jar tester used for batch experiments
2.2. Sampling of FOG deposits in full scale field sewer lines. Three FOG deposit samples from sanitary sewer lines in Cary, NC were obtained to compare
their chemical makeup with the FOG deposit formed in the lab. One FOG deposit sample was
from an apartment area, one sample from a food service establishment, and one sample was from
a commercial, food service and retail area of a shopping center. Samples were placed on ice and
stored in the lab at 4°C.
2.3. Fatty acid profile. Samples of the deposits were directly saponified and converted to fatty acid methyl esters
according to AOCS Ce 2-66 (Firestone, 2004) and analyzed using gas chromatography (GC). In

7
brief, 0.5 to 1.0 grams of sample were weighed in triplicate into glass screw topped tubes. Each
tube was spiked with 0.5 mg tridecanoin (C13:0) in ethanol to serve as an internal standard. One
mL of 0.5 N NaOH in methanol was added to each and the tubes were heated for 10 min at 85oC
in a water bath. After cooling, 1 mL of 14% boron trifluoride in methanol was added to each
tube. The tubes were recapped, vortexed, and returned to the water bath for 10 min. After
cooling, 1 mL of water, followed by 1 mL of hexane was added to each tube. The tubes were
vortexed at top speed for 30 sec and then allowed to stand to form layers. The top (organic)
layer containing the fatty acid methyl esters was removed and dried over sodium sulfate. The
fatty acid methyl esters were analyzed using a Perkin Elmer Autosystem XL GC (Sheldon, CT)
fitted with a capillary BPX-070 column (SGE Inc., Austin, TX). The column length was 30 m
with an internal diameter of 0.25 mm and a film thickness of 0.25 m. The temperature gradient
was 60oC with a 2 min hold time, increased at 4
oC per min to 180
oC and then increased at 10
oC
to a final temperature of 235oC. The run time was 27.7 min. The carrier gas used was helium at
a flow rate of 40 psi. The injection was split at 150 mL/min. The results were reported as
percent of the total fatty acids based on peak areas as per the official method (AOCS Ce 1f-96)
(Firestone, 2004) and the total fatty acids were calculated based on the ratio of internal standard
to the fatty acid peaks present when compared to a standard mixture (Kel Fir Fame 5 Standard
Mix, Matreya, Pleasant Gap, PA). The standard mixture of fatty acid methyl esters was run with
each sample set to determine retention times and recoveries.
2.4. Calcium analysis. Calcium concentration was determined using a Perkin Elmer 2000 inductively-coupled plasma
optical emission spectrometer (ICP-OES). A solid sample was placed in acid-washed porcelain
crucible, and then put into muffle furnace, ramping up the temperature 100oC every hour until
500oC was reached. The sample was maintained at 500
oC for 16 hours. After cooling the
sample, 2 mL deionized water was used to rinse residue toward the center of the crucible. 4 mL
of 6N HCl was then added, and the sample was heated on a hot plate at 95oC for 45 minutes until
the sample was completely dry. The sample was then cooled and another 4 mL of 6N HCl was
added to the sample with subsequent warming on the hot plate for 15 minutes. After cooling, the
acid solution was filtered through a Whatman filter paper into a 25 mL glass volumetric flask
and brought to the volume with deionized water. The sample was then analyzed by ICP-OES for
calcium. Since the FOG deposit formed in the lab was attached to the filter paper, both filter
paper and FOG deposit were simultaneously digested. The calcium concentration in the FOG
deposit was determined by subtracting the calcium concentration of filter paper (0.034 mg). The
liquid sample was diluted 10-fold with 1% HCl and 1% HNO3. After dilution, the liquid sample
was analyzed by ICP-OES.
2.5. Formation of calcium soap. An alkali hydrolysis of the vegetable (or animal) fats similar to
the method used by Poulenat et al. (2003) was performed to produce calcium soap at room
temperature since the average temperature in the sanitary sewer collection system was observed
to be 5 to 25°C (Ducoste et al., 2008). Calcium chloride (9.8%wt) was added to a solution of
sodium hydroxide (0.6%wt) and de-ionized water (14.9%wt). The solution was allowed to cool
to the room temperature (22 °C). The oil fat (Pure Wesson Canola Oil, ConAgra Foods, Omaha,
74.7%wt) at room temperature was gradually added and mixed to the solution. The mixture was
8
stirred at 450 rpm using a Stir-Pak Laboratory Mix Impeller (Cole Parmer, 23-2300 rpm). The
calcium soap sample for FTIR analysis from the batch reactor was collected after four hours of
mixing.
2.6. Fourier transform infrared (FTIR) spectrometer analysis. FTIR analysis was performed
for the FOG deposit sample created in the lab, a calcium soap developed from calcium chloride
and canola oil, three FOG deposit samples from the sewer collection systems, pure lard, and
three pure fatty acids (palmitic acid, oleic acid and linoleic acid). Infrared absorption spectra of
these samples were determined with a Digilab FTS-6000 Fourier Transform Infrared (FTIR)
spectrometer using a mounted crystalline Zinc Selenide attenuated total internal reflection (ATR)
sampling attachment (Pike Technologies inc., MIRacleTM
Single Reflection ATR). The infrared
light is focused onto the photodiode of a liquid nitrogen-cooled, wide band mercury-cadmium-
telluride (MCT) detector with a linearized normal spectral response of 450 to 7000 cm-1
. The
spectra were converted into absorbance units by taking the negative of the log ratio of a sample
spectrum to that of an air spectrum. The data were then computed with a data processing
programs (Microcal Origin, v7.0, Microcal Software Inc., Northampton, MA.).
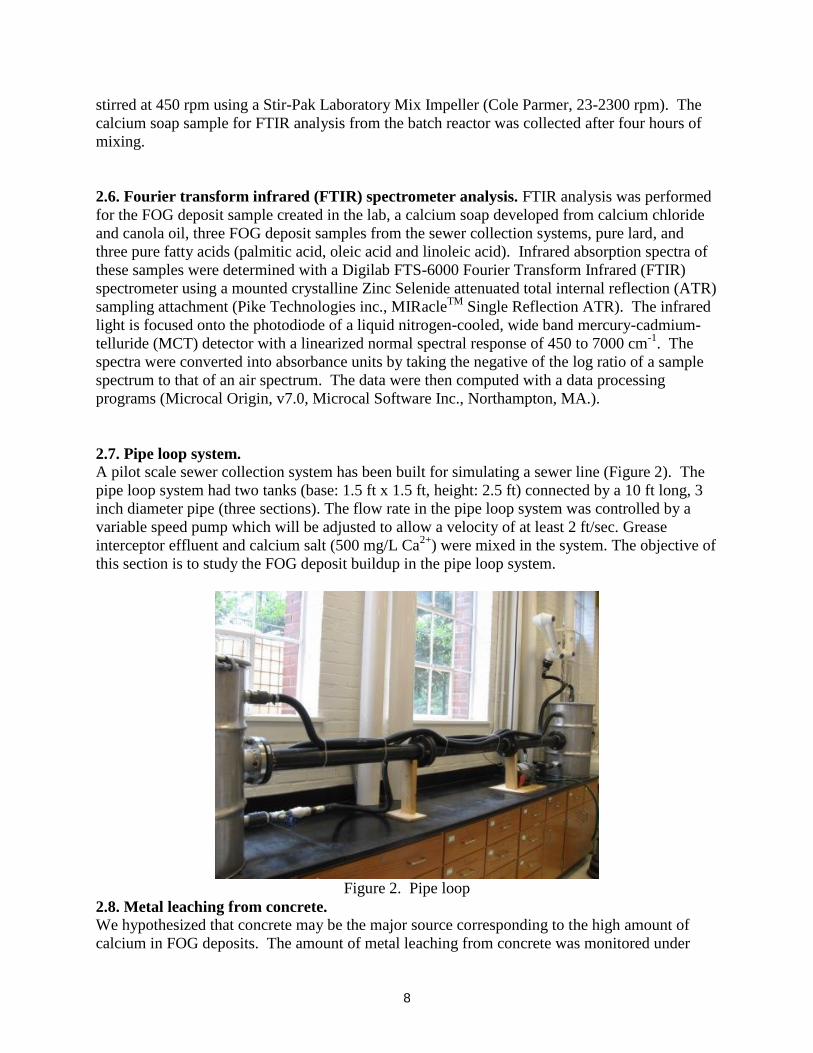
2.7. Pipe loop system. A pilot scale sewer collection system has been built for simulating a sewer line (Figure 2). The
pipe loop system had two tanks (base: 1.5 ft x 1.5 ft, height: 2.5 ft) connected by a 10 ft long, 3
inch diameter pipe (three sections). The flow rate in the pipe loop system was controlled by a
variable speed pump which will be adjusted to allow a velocity of at least 2 ft/sec. Grease
interceptor effluent and calcium salt (500 mg/L Ca2+
) were mixed in the system. The objective of
this section is to study the FOG deposit buildup in the pipe loop system.
Figure 2. Pipe loop
2.8. Metal leaching from concrete. We hypothesized that concrete may be the major source corresponding to the high amount of
calcium in FOG deposits. The amount of metal leaching from concrete was monitored under

9
different pH conditions. Concrete specimens were placed in deionized water with different pH as
shown in Figure 3. The pH was maintained by adding sulfuric acid and sodium hydroxide for 3
weeks. Half of the concrete specimen was put in grease interceptor at pH 3, 4, 5, 6, 7 and 8.
Grease interceptor effluent without a concrete specimen was used as control. The pH was
maintained by sulfuric acid and sodium hydroxide for 3 weeks.
Figure 3. Metal leaching from concrete in deionized water at pH 3, 4, 5, 6, 7, 8
2.9. Effect of Surfactant.
Here, we tested the hypothesis that surfactants may serve as a source of free fatty acids for the
saponification reaction. Various amounts of surfactants (0, 0.3, and 0.7 ml) as well as varying
levels of calcium were added into 1 L batch tests.

10
3. RESULTS AND DISCUSSION
3.1. FOG Deposit Formation.
3.1.1. Formation of FOG deposits in lab-scale
We have achieved the formation of FOG deposits using GI effluent, under laboratory conditions.
To our knowledge, this is the first time that this has been achieved. This study and the related
components are reported in the paper: He, X., M. Iasmin, L. Dean, S. Lappi, J. J. Ducoste and F.
L. de los Reyes III (2011) Evidence for How Fat, Oil, and Grease (FOG) Deposits Form in
Sewer Lines. Environmental Science and Technology, 45(10): 4385-4391. The white pinpoint
particles started to form at day 2, with the size of the particles increasing until its maximum
observed size was achieved at day 7. No solids were formed in the control beaker, which
contained calcium, and the vegetable oil. The vegetable oil was observed on the surface at all
times within the control beaker. These results are consistent with the hypothesis that in the
absence of free fatty acid, calcium salt will not react to form a FOG deposit.
(a) (b)
Figure 4. FOG deposits formed under laboratory conditions. (a) Photo was taken at day 10 when
free fatty acids reacted with calcium salt in 1L beaker; (b) Close-up of FOG deposit particles.
3.1.2. Comparison with natural FOG deposits
Similar fatty acid profiles (Table 1) were found in FOG deposit samples (R1, R2, R3) formed in
the lab and FOG deposit samples taken from sewer lines (apartment, shopping center 1 and
shopping center 2). Saturated fat was the major component and palmitic was the primary
saturated fatty acid in all FOG deposit samples, consistent with the results of Keener et al.
(2008). Monounsaturated fat was the second major component in all FOG deposit samples.
Although the percentages of monounsaturated fat in FOG deposit samples from sewer lines were
higher than those of the deposits formed in the lab, low percentages (around 10%) of
monounsaturated fat in FOG deposits were observed in 12 FOG deposits from sewer lines
(Keener et al., 2008). Oleic was the primary monounsaturated fat in the FOG deposits formed in
the lab and in those collected in the apartment area and shopping center 1. In addition, linoleic

11
was the primary polyunsaturated fat in all FOG deposit samples. A similar polyunsaturated
component was also found in the FOG deposits analyzed by Keener et al. (2008).
Table 1. Fatty acid composition of FOG deposits
Sample
Total
fata
(g/g)
Saturated
fatb
(%)
Primary
saturated
fat
Mono-
unsaturated fatc
(%)
Primary mono-
unsaturated fat
Poly-
unsaturated fatd
(%)
Primary poly-
unsaturated fat
R1e 0.344 78.8 Palmitic 9.8 Oleic 0.8 Linoleic
R2 0.255 57.5 Palmitic 9.0 Oleic 0.6 Linoleic
R3 0.18 70.6 Palmitic 14.0 Oleic 0.7 Linoleic
Apartment 0.261 56.5 Palmitic 38.3 Oleic &
palmitoleic 1.0 Linoleic
Shopping
center 1 0.393 38.7 Palmitic 37.2 Oleic 15.3 Linoleic
Shopping
center 2 0.489 64.7 Palmitic 31.7 Palmitoleic 0.6 Linoleic
a Total fat content was calculated from 1 g FOG deposit sample
b Saturated fat is shown in percentage of the total fat
c Monounsaturated fat is shown in percentage of total fat
d Polyunsaturated fat is shown in percentage of total fa
e R1, R2, and R3 samples had 50, 400, and 750 mg/L, respectively
As additional calcium concentration was increased from 50 mg/L to 750 mg/L, the resulting
FOG deposit weight also increased (Table 2). Total fat in the FOG deposit increased from R1 to
R2, indicating that additional calcium reacted with surplus free fatty acids. Total fat, however,
remained constant at 23 mg from R2 to R3, suggesting that although more calcium was added,
no more free fatty acids were available to react with calcium.
Calcium was also measured in FOG deposits formed in the lab (Table 2). From R1 to R3,
increasing levels of calcium led to higher calcium levels measured in the FOG deposits. The
concentrations of calcium in the laboratory FOG deposits were similar to the calcium
concentration from the apartment area but higher compared to those in the shopping center FOG
deposits. The fatty acid composition was quite similar between the lab-formed FOG deposits
and deposits collected from the sanitary sewer lines (Table 2). In addition, the results show high
calcium concentration in all FOG deposits formed in the lab and the FOG deposits collected
from the apartment area and shopping center 2. The total fat to calcium ratio is higher in FOG
deposit samples collected from shopping centers than those formed under laboratory conditions,
which may have been caused by different reaction conditions such as the finite amount of
available free fatty acids to react with excess calcium under lab batch conditions. The FOG
deposits from the shopping centers, however, were the result of long-term reactions with higher
concentrations of available free fatty acids that were continuously discharged from food service
establishments. However, with the same fatty acid substrate (GI effluent), in R2 and R3, the
total fat concentration remained at 23 mg, but the total fat to calcium ratio decreased from 5.16
in R2 to 3.67 in R3. The decreased ratio suggests that there may be other processes aside from
saponification that led to accumulation of calcium within these deposits.
The results in Table 2 suggest that there may be two processes involved in FOG deposit
formation. In the first process, calcium tends to accumulate around fatty acid micelles due to a

12
DLVO type process (i.e., compression of charged double layer) due to the slightly negative
carboxylic end of the free fatty acids. In the second process, free fatty acids react with calcium
to form calcium based fatty acid salts through a saponification reaction. The slightly negative
carboxylic ends of unreacted free fatty acids continue to attract positive calcium ions, since the
saponification reaction may be slow compared to the transport of calcium ions towards the solid
deposit (i.e., a reaction limited process) (Poulenat et al., 2003). Due to the slower saponification
reaction, it is hypothesized that more calcium than the stoichiometric amount needed for
saponification would accumulate in the deposit. Research is needed, however, to confirm the
involvement of a double layer compression process along with a saponification reaction to create
solid FOG deposits in sewer lines.
Table 2. Calcium and total fat amounts in FOG deposits
Sample
FOG deposit
weight
(mg)
Calcium in FOG
deposit (mg)
Total fat in FOG
deposit (mg)
Total fat/
calcium
(mg/mg)
Calcium/
FOG deposit
(mg/mg)
R1a 52.6 2.15 18.07 8.40 0.0409
R2 93.5 4.61 23.81 5.16 0.0493
R3 123.5 6.06 22.23 3.67 0.0491
Apartment 415.2 21.35 108.16 5.07 0.0514
Shopping center
1 145.5 0.13 57.22 438.42 0.0009
Shopping center
2 143.5 1.78 70.10 39.41 0.0124
a R1, R2, and R3 samples had Ca
2+ concentrations of 50, 400, and 750 mg/L, respectively
3.1.3. Evidence of saponification To prove that FOG deposit formation is the result of a saponification reaction between free fatty
acids and metal ions such as calcium, Fourier transform infrared (FTIR) spectrometry was used.
FTIR is a simple and powerful technique that is widely applied to determine oil and grease in
water (Ferrer and Romero, 2002; Lucena et al., 2006; Daghbouche et al., 1997; Romero and
Ferrer, 1999), oily materials in different chemical processes (Tsutsui et al., 2007; Vlachos et al,
2006; Tang et al., 2008; Kuligowski et al., 2010 ), trans fat in food (Mossoba et al, 2007; Walker
et al., 2007), and fatty acids and fatty acid salts (Gasperini et al., 2007; Luo et al., 2007; Notter et
al., 2008). If the saponification hypothesis is correct, then the calcium soap should be detected in
the FOG deposit. In the infrared spectra, when free fatty acids react with calcium salt and the
“hard” metallic salts of fatty acids (soaps) is formed, the carbonyl group stretching vibration at
1745 cm-1
of triacylglycerols (TAG) disappears and three characteristic calcium soap bands
appear: (i) the carboxylate ion symmetric stretching vibration, 1 at 1422 cm-1
; (ii) the
carboxylate ion asymmetric stretching vibration, 2 at 1577 cm-1
; and (iii) the metal-oxygen bond
vibration at 665 cm-1
(Koga et al., 1960). Poulenat et al. (2003) identified four regions that can
be attributed to the formation of calcium soaps: region 1: 4000-3000 cm-1
; region 2: 1800-1350
cm-1
; region 3: 1350-1180 cm-1
and additional side band near 720 cm-1
; region 4: near 670 cm-1
.
There are four regions that can be attributed to the formation of calcium soaps: region 1: 4000-
3000 cm-1
, the band has been associated with O-H stretching vibration of hydrated water; region

13
2: 1800-1350 cm-1
, two modes of vibration, attributed to the carboxylate group of the fatty acid
metallic salt; region 3: 1350-1180 cm-1
and additional side band near 720 cm-1
, the spectral
region of the aliphatic chains is sensitive to the crystallization of soap; region 4: near 670 cm-1
,
the calcium-oxygen bond absorption band at 665 cm-1
. Overall, the strong similarity between
FOG deposit and calcium soap infrared spectra, particularly the four absorption bands of
Poulenat et al. (2003) suggest that FOG deposit is likely a metallic salt of fatty acid made of
calcium and formed as a result of saponification. The question then is whether FOG deposits
from actual sewer lines have similar spectral profiles as with the pure calcium soap and the lab-
scale FOG deposits, and in addition, if these spectral signatures differ in pure fatty acids or lipid
samples.
Figure 5. Baseline corrected infrared spectra of FOG deposit formed in the lab and calcium soap

14
3.1.4. Infrared spectra of FOG deposits from sewer lines.
The infrared spectra of three FOG deposit samples are shown in Figure 6. The FOG deposit
sample from the apartment area has a strong infrared spectral similarity to the FOG deposits
formed in the lab. The absorption bands in four characteristic parts of the calcium soap were
present in the FOG deposit sample from the apartment area, including the broad band at around
3400 cm-1
(region 1), the disappearance of absorption band at 1745 cm-1
and appearance of two
absorption bands of 1 and three absorption bands of 2 (region 2), the singlet at 722 cm-1
(region
3) and the calcium-oxygen band at 665 cm-1
(region 4). The FOG deposits from shopping
centers 1 and 2 display some similarity but differ from the lab FOG deposit and apartment area
samples. All samples displayed the absorption bands from characteristic regions 1, 3 and 4 in
their infrared spectra. Significant differences, however, were noted in region 2 (1800-1350 cm-
1). In this region, although the absorption band at 1745 cm
-1 was not present, two strong
intensity absorption bands appeared at around 1700 cm-1
. Absorption bands at 1577 cm-1
and
1541 cm-1
were observed in 2 from shopping center 2 but only 1541 cm-1
was observed in 2
from shopping center 1. Three other bands at 1462, 1430 and 1411 cm-1
appeared in both
shopping center samples.
The differences noted in region 2 could be attributed to other materials accumulating in the FOG
deposit, which led to the overlap of other absorption bands. In particular, the calcium-oxygen
bond was present in region 4, but unlike the lab-scale and apartment area FOG deposit samples,
the peak of the broad band was not at 665 cm-1
but at 680 cm-1
. It is likely that other materials
accumulating in the FOG deposit affected the appearance of absorption bands. As discussed
earlier, a large amount of fatty acids accumulated in shopping center FOG deposits. It is likely
that the accumulation of fatty acids or unsaturated oil such as canola affected the appearance of
absorption bands since a number of different food service establishments that potentially
discharge a wide variety of lipid contents are present in the shopping center.

15
Figure 6. Baseline corrected infrared spectra of three FOG deposit samples from sewer lines
3.1.5. Infrared spectra of pure fatty acids and fat.
Three dominant fatty acids measured in the FOG deposits (palmitic, oleic and linoleic) were
subjected to FTIR analysis (Figure 7). In the region of 1800-1350 cm-1
(region 2), for palmitic
acid, a single strong intensity band was found at 1690 cm-1
. Three other bands also appeared in

16
the palmitic acid spectrum at 1470, 1430 and 1411 cm-1
. For oleic acid, a single strong intensity
band was located at 1704 cm-1
with three other bands located at 1464, 1430 and 1411 cm-1
. The
linoleic acid spectrum also displayed a single strong intensity band at 1704 cm-1
with three other
bands observed at 1460, 1430 and 1411 cm-1
.
The three strong intensity bands at 1690 cm-1
, 1704 cm-1
, 1704 cm-1
, from palmitic, oleic and
linoleic respectively, may account for the two strong intensity bands observed near 1700 cm-1
in
shopping center FOG deposit samples. The three bands located at 1464, 1430 and 1411 cm-1
in
the shopping center FOG deposits are very similar in position to the three bands observed in the
oil standards. There were no bands located at 1577 and 1541 cm-1
. However, the weak intensity
bands at 1577 and 1541 cm-1
were observed in the FOG deposits. The results of the fatty acid
spectra appear to support the hypothesis that five characteristic bands of calcium soap are present
but with weak intensities and are masked by the bands attributed to the accumulation of fatty
acids. In the region at around 670 cm-1
, palmitic had an absorption band at 680 cm-1
, while oleic
and linoleic had shoulders at 680 cm-1
. These differences in peaks for the fatty acids investigated
could explain why the spectral peak of FOG deposits from shopping centers was at 680 cm-1
instead of 665 cm-1
as suggested by Poulenat et al. (2003).
Lard or an equivalent saturated fat is another possible candidate accumulating in the FOG
deposit as it solidifies at room temperature. The infrared spectrum of lard is displayed in Figure
8. In the region of 1800-1350 cm-1
, a strong intensity absorption band was located at 1731 cm-1
instead of near 1700 cm-1
. No absorption band was observed at or near 670 cm-1
. Consequently,
lard was not likely one of the materials that accumulated in the shopping center FOG deposits.
Therefore, the FOG deposit from the apartment area is likely the product of saponification
reaction as is the lab-scale FOG deposit. However, the FOG deposits from the shopping centers
are not only the products of the reaction between free fatty acids and calcium but also contained
un-reacted fatty acids such as palmitic, oleic and linoleic acids. These un-reacted free fatty acids
may likely draw calcium and other cations towards the solid FOG deposit matrix based on the
effects of van der Waals attraction and electrostatic repulsion (DLVO theory). However, more
research needs to be performed to prove this additional mechanism of drawing calcium towards
the FOG deposit.

17
Figure 7. Baseline corrected infrared spectra of palmitic, oleic and linoleic acid

18
Figure 8. Baseline corrected infrared spectrum of lard
FTIR analysis demonstrated a strong similarity between the lab-scale FOG deposit and calcium
soap as shown in their infrared spectra, particularly in the absorption bands of four characteristic
regions previously identified for calcium soap. Analysis of these four infrared spectral band
regions indicated that FOG deposits are likely metallic salts of fatty acid made of calcium and
formed as a result of saponification. However, the difference among FOG deposit samples, such
as different total fat to calcium ratios and appearance of additional bands due to the un-reacted
fatty acids (e.g., palmitic, oleic and linoleic), indicated that some FOG deposits are not only
formed by the reaction between free fatty acids and a metal but are also aggregates made of
excess calcium or fatty acids based on DLVO theory. Although the spectral peak positions of
the different samples analyzed in this study are not significantly shifted, peak intensities were
different. It is possible that the different FOG sources may have gone through oxidative changes
(i.e., become more oxygenated), causing the fatty acid salt to contain more polar that lead to
band shifts as well as changes in intensity. In addition, changes in intensity could be the result of
different FOG source concentrations. Nonetheless, the results of this study shed light on the
formation mechanisms of FOG deposits, and will ultimately lead to an improved understanding
of possible measures to prevent FOG deposit from forming and blocking sewer lines.
3.2. Metal leaching from concrete.
We hypothesized that concrete may be the major source corresponding to the high amount of
calcium in FOG deposits. The amount of metal leaching from concrete was monitored under
different pH conditions. Concrete specimens were placed in deionized water with different pH
as shown in Figure 3. The pH was maintained by adding sulfuric acid and sodium hydroxide for
3 weeks.
High amounts of calcium were leached under acid conditions. Even under base condition
(pH=8), 50 mg/L calcium was leached from concrete (Figure 9). The amounts of potassium, iron

19
and magnesium were also measured. Compared to calcium, these concentrations are much lower
(Figures 10, 11, 12).
0
50
100
150
200
250
300
350
400
450
0 3 6 9 12 15 18 21 24
Calcium(mg/L)
Time(d)
Calciumleachingfromconcrete
pH=3
pH=4
pH=5
pH=6
pH=7
pH=8
Figure 9. Calcium leaching from concrete at different pH in deionized water
0
5
10
15
20
25
30
35
40
45
0 3 6 9 12 15 18 21 24
Potassium(mg/L)
Time(d)
Potassiumleachingfromconcrete
pH=3
pH=4
pH=5
pH=6
pH=7
pH=8
Figure 10. Potassium leaching from concrete at different pH in deionized water

20
0
0.2
0.4
0.6
0.8
1
1.2
1.4
1.6
0 3 6 9 12 15 18 21 24
Iron(mg/L)
Time(d)
Ironleachingfromconcrete
pH=3
pH=4
pH=5
pH=6
pH=7
pH=8
Figure 11. Iron leaching from concrete at different pH in deionized water
0
2
4
6
8
10
12
0 3 6 9 12 15 18 21 24
Magnesium(mg/L)
Time(d)
Magnesiumleachingfromconcrete
pH=3
pH=4
pH=5
pH=6
pH=7
pH=8
Figure 12. Magnesium leaching from concrete at different pH in deionized water
Half of the concrete specimen was put in grease interceptor at pH 3, 4, 5, 6, 7 and 8 (Figure 13).
Grease interceptor effluent without concrete specimen was used as control. The pH was
maintained by sulfuric acid and sodium hydroxide for 3 weeks.

21
Figure 13. Metal leaching from concrete in grease interceptor effluent
Compared to deionized water, a high similarity of metal leaching was found in grease interceptor
effluent (Table 3).
TABLE 3. Metal leaching from concrete in grease interceptor effluent after 3 weeks
Ca (mg/L) K (mg/L) Fe (mg/L) Mg (mg/L)
GI effluent 7.99 6.12 0.376 2.89
B(pH=3) 389 37.3 0.832 12.1
B(pH=4) 138 36.1 0.056 4.12
B(pH=5) 96.8 34.5 0.032 3.04
B(pH=6) 98.5 34.4 0.047 2.96
B(pH=7) 60.5 36.6 0.060 2.90
B(pH=8) 53.4 40.2 0.102 3.01
B(GI only) 8.70 6.57 0.151 2.85
3.3. The effect of oil in FOG deposit formation
Since FOG deposits are formed at the water level, oil may play an important role in the surface
reaction to form FOG deposit. In other words, free oil acts as a surface collector for the reaction
to occur. To test this, 0.3g soybean oil was added to 1 liter GI effluent with 400 mg/L calcium in
the solution. After mixing for a few days, a white thin solid layer was formed on the surface
(Figure 14). The FTIR result (Figure 15) indicates that the white thin solid is soap.

22
Figure 14. White solids were formed on the surface

23
Figure 15. Baseline corrected infrared spectra of calcium soap and white solid formed on surface
The concrete block was put into the beaker with soybean oil, GI effluent and 400 mg/L Ca2+
.
White solid was first found to grow on concrete surface (Figure 16), also found on solution
surface, glass wall and at the bottom of beaker (Figure 17).

24
Figure 16. FOG deposit formed on concrete surface
Figure 17. FOG deposit formed on glass wall, solution surface and at the bottom of beaker
FTIR analysis shows that the solid that grew on concrete surface is soap (Figure 18). The solids
collected from the glass wall and solution surface were also products if saponification (Figures
19, 20). Though brown particles were formed in the solution, they are not soap. But the white
solid formed at the bottom of beaker is soap as shown in Figure 21.

25
Figure 18. Baseline corrected infrared spectra of calcium soap and solid on concrete surface

26
Figure 19. Baseline corrected infrared spectra of calcium soap and solid on glass wall

27
Figure 20. Baseline corrected infrared spectra of calcium soap and solid on solution surface

28
Figure 21. Baseline corrected infrared spectra of calcium soap, brown particles in solution and
white particles at the bottom
Previous data showed that there is no solid formed on the concrete surface when the concrete
block was put into GI effluent with calcium salt. With the addition of oil, soap is formed on the

29
concrete surface. Thus, either (1) oil was hydrolyzed, and free fatty acids were produced and
then reacted with calcium; or (2) free fatty acids from GI effluent were partitioned into oil and
reacted with calcium on the surface.
To test hypothesis (1), oil was added to calcium salt solution, and pH was adjusted. The results
are shown in Table 4 and Figure 22.
Table 4. The observation of solid formation under different pH condition
Observation
Oil + CaCl2, no pH adjustment No white solid was formed after 32 days
mixing
Oil + CaCl2, pH=8 White solid was found at day 32.
Oil + CaCl2, pH=9 White solid was found at day 29.
No pH adjustment pH=8 pH=9
Figure 22. Oil and calcium salt solution
Based on FTIR, the white solids found in pH=8 and pH=9 are the same (Figure 23). The
difference between oil and white solid is the appearance of calcium and O-H bound in white
solid. However, the white solid is not soap as it lacks the peaks in two characteristic regions of
soap.

30
Figure 23. Baseline corrected infrared spectra of soybean oil, white solid formed in pH=8 and
pH=9
From the results discussed above, the free fatty acids that reacted with calcium were not from
hydrolysis of oil but from the GI effluent. Free fatty acids from GI effluent were first partitioned
into oil and then reacted with calcium. The partitioning process was demonstrated by adding
palmitic acid to the mixture of water and oil. All palmitic acid was partitioned into oil layer
(Figure 24).

31
Figure 24. Palmitic acid partition into oil
3.4. Effect of free fatty acid types
When a concrete block was put into the system with oil, GI effluent (source of free fatty acids)
and calcium salt, a FOG deposit was formed on the concrete surface. Therefore, there are five
major elements to form FOG deposits in sewer systems: free fatty acids, FOG, Ca2+
, the sewer
pipe material, and water. Concrete is a widely used pipe material in sewer systems as well as a
source of calcium released into wastewater. To investigate the mechanism of FOG deposit
formation in sewer lines, experiments were carried out focusing on four elements: FOG (soybean
oil), free fatty acids (palmitic acid, oleic acid, linoleic acid), concrete, and water.
3.4.1. Concrete, FOG and water
When oil was added to a beaker with just concrete, no solid was formed on the concrete surface,
as shown in Figure 25.

32
Figure 25. Oil and concrete
3.4.2. Concrete, FOG and free fatty acid
When water was not present in the reaction, no solid was formed on the concrete surface, even
though palmitic acid was added (Figure 26).
Figure 26. Palmitic acid, oil and concrete

33
3.4.3. Concrete, free fatty acid and water
When oil was not added, although palmitic acid congregated on the concrete surface (Figure 27),
the aggregate is not soap.
Figure 27. Palmitic acid, water and concrete
3.4.4. Concrete, FOG, water and free fatty acids
3.4.4.1. Palmitic acid
The concrete block was placed into the mixture of palmitic acid, oil and water. There were 0.25
g palmitic acid, 25 ml oil and 75 ml H2O in beaker 1, and 1 g palmitic acid, 25 ml oil and 75 ml
H2O in beaker 2. Solid formation was observed on the concrete surface within 2 days. After
mixing for 24 days, in beaker 1 with 0.25 g palmitic acid (Figure 28), white solid was formed in
solution, and more solid was formed on the concrete surface. In beaker 2 with 1 g palmitic acid,
as shown in Figure 29, a higher amount of solid was formed on the concrete surface compared to
the concrete block in beaker 1.

34
Figure 28. Solid formed in solution and concrete surface when concrete block was put
into a mixture of 0.25 g palmitic acid, 25 ml oil and 75 ml H2O
Figure 29. Solid formed in solution and on the concrete surface when concrete block
was put into a mixture of 1 g palmitic acid, 25 ml oil and 75 ml H2O
3.4.4.2. Oleic acid
The concrete block was placed into the mixture of 0.25 g oleic acid, oil and water. After mixing
for 24 days, solid was formed in solution and on the concrete surface as shown in Figure 30.
35
Figure 30. Solid formed in solution and on the concrete surface when concrete block
was put into a mixture of 0.25 g oleic acid, oil and water
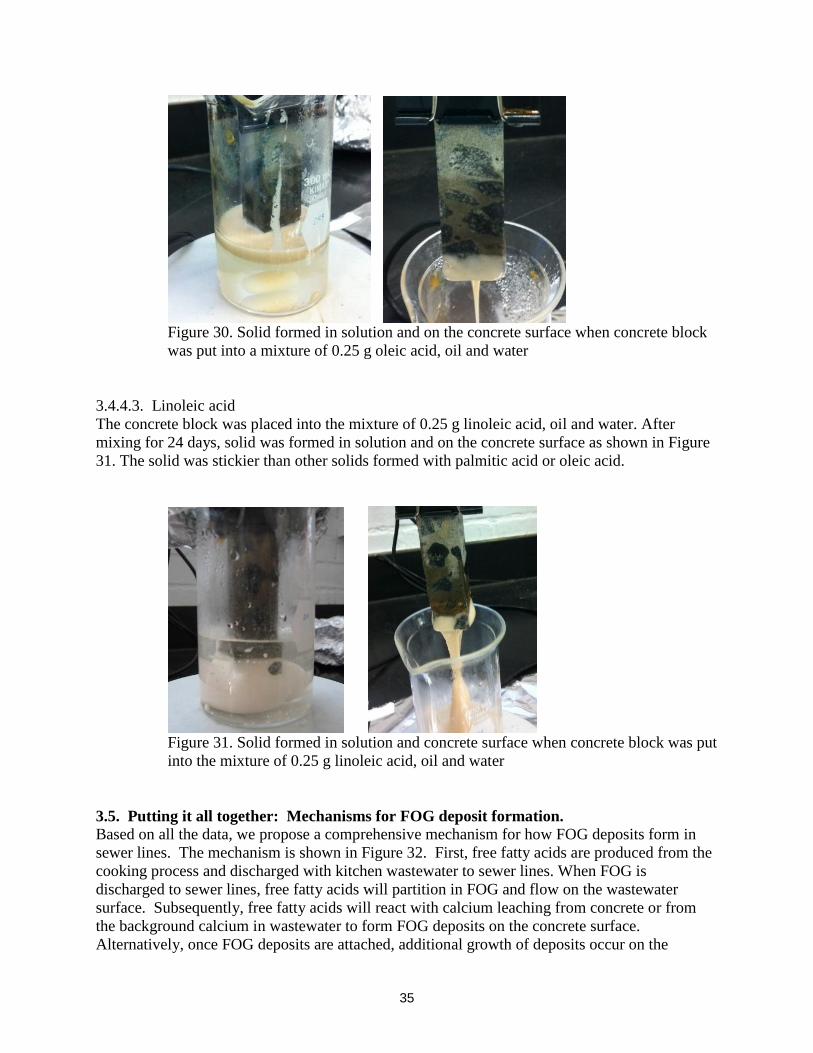
3.4.4.3. Linoleic acid
The concrete block was placed into the mixture of 0.25 g linoleic acid, oil and water. After
mixing for 24 days, solid was formed in solution and on the concrete surface as shown in Figure
31. The solid was stickier than other solids formed with palmitic acid or oleic acid.
Figure 31. Solid formed in solution and concrete surface when concrete block was put
into the mixture of 0.25 g linoleic acid, oil and water
3.5. Putting it all together: Mechanisms for FOG deposit formation.
Based on all the data, we propose a comprehensive mechanism for how FOG deposits form in
sewer lines. The mechanism is shown in Figure 32. First, free fatty acids are produced from the
cooking process and discharged with kitchen wastewater to sewer lines. When FOG is
discharged to sewer lines, free fatty acids will partition in FOG and flow on the wastewater
surface. Subsequently, free fatty acids will react with calcium leaching from concrete or from
the background calcium in wastewater to form FOG deposits on the concrete surface.
Alternatively, once FOG deposits are attached, additional growth of deposits occur on the

36
concrete surface. The sticky solid formed after saponification, as shown in Figures 28 to 31, will
congregate and adsorb free fatty acids, calcium and debris in wastewater to build up the FOG
deposit around concrete pipe.
Figure 32. Overall mechanism of FOG deposit formation
3.6. Effect of surfactants
3.6.1. Surfactant as source of fatty acids
Here, we tested the hypothesis that surfactants may serve as a source of free fatty acids for the
saponification reaction. No solid was formed with additional calcium at 500 mg/l and 0.7 ml of
additional detergents as shown in Figure 33. Therefore, it is unlikely that surfactants are a source
of free fatty acids for the saponification process.

37
Figure 33. The mixture of surfactant and calcium chloride
3.6.2. Effect of surfactant in FOG deposit formation and adhesion
Another hypothesis is that surfactants could prevent free fatty acids from reacting with calcium.
Surfactants have the propensity to form micelles in water. When micelles form in the water, their
tails form a core that can encapsulate the oil and lipids, and their heads form an outer shell that
maintains favorable contact with water and prevent the lipids from reacting with calcium in the
water. A factorial experiment with calcium and surfactant was performed according to the
following table:
Table 5. Effect of surfactant experiment
Beaker # GI effluent
(liter)
Calcium
(mg/l)
Detergent
(ml)
1 1 500 0.7
2 1 500 0.3
3 1 500 0
4 1 250 0.7
5 1 250 0.3
6 1 250 0

38
Figure 34. Beaker #1 to #6 from right to left at the beginning
Figure 35. Beaker #1 to #6 from right to left after 5 days
After 5 days, in beaker 3 (no detergent was added), the solution was clear as the FOG deposit
sunk to the bottom. In beaker 2, with 0.3 ml detergent, the FOG deposit particles that sank to the
bottom were smaller than the ones in beaker 3, and the solution was cloudier. In beaker 1, with
0.7 ml detergent, almost no FOG deposits sank to the bottom. The particles were the smallest as
pinpoint particles and the solution was the cloudiest. The same phenomenon was observed in
beakers 4 to 6. Thus, the results supported the hypothesis that surfactant could be considered as
an inhibitor preventing the formation of FOG deposits.

39
Very small amounts of FOG deposits adhered to PVC coupons in all beakers. The PVC coupon
in beaker #3 had more FOG deposits than the PVC coupons in beakers #2 and #1. The PVC
coupon in beaker #6 had more FOG deposits than the PVC coupons in beaker #5 and #4 (shown
in Figure 36).
.
Figure 36. Adhesion of FOG deposits to PVC coupon
3.7. Pipe loop system
A pilot scale sewer collection system was designed and constructed to allow simulation of a
sewer line as shown in Figure 3. The pipe loop system had two tanks (base: 1.5 ft x 1.5 ft, height:
2.5 ft) connected by a 10 ft long, 3 inch diameter pipe (broken in three sections). The flow rate in
the pipe loop system was controlled by a variable speed pump which allowed adjustment of
velocity, which was set to be at least 2 ft/sec. Grease interceptor effluent and calcium salt (500
mg/L Ca2+)
were mixed in the system.
3.7.1. Cast iron pipe
After 40 days, deposits were formed in the cast iron pipe as shown in Figure 37. Iron was an
interfering factor as most of the deposit was rust. Metal analysis showed that the amount of iron
in the deposits was much higher than calcium and the percentage of total fat in the deposit was
low (~ 0.2% ) (Table 6).

40
Figure 37. Deposits were formed in cast iron pipe loop system
Table 6. Metal and total fat analysis of deposit formed in the cast iron pipe loop system
Pipe sections Metal analysis Total fat
(%) Ca
(10000mg/kg)
Fe
(10000mg/kg)
K (mg/kg) Mg (mg/kg)
1 9.32 56.72 2548 1047 0.23
2 9.63 54.54 4008 1030 0.29
3 9.05 52.05 3009 963 0.25
3.7.2. PVC pipe
PVC pipe was used instead of cast iron pipe to prevent the interference with iron (Figure 38).
FIGURE 38. PVC pipe loop system

41
After 40 days, deposits were formed as shown in Figure 39. Although PVC pipe was used, the
color of the deposit was still brown. Metal analysis showed that a high amount of iron was still
found in the deposit (Table 7), presumably from other iron components in the system. Compared
to the cast iron pipe loop system, the amount of iron in the PVC pipe loop system was lower, and
the total fat percentage in the deposit was higher.
FIGURE 39. Deposits were formed in PVC pipe loop system
Table 7. Metal and total fat analysis of deposit formed in the PVC pipe loop system
Pipe sections Metal analysis Total fat
(%) Ca
(10000mg/kg)
Fe
(10000mg/kg)
K (mg/kg) Mg (mg/kg)
1 6.25 30.59 419 392 2.41
2 9.42 32.54 567 367 2.30
3 7.41 32.67 567 398 3.07
To prevent the interference with iron, a new pump was installed in the pipe loop system to
remove possible interference of iron (Figure 40). Three concrete blocks were placed in the PVC
pipe (Figure 41). Soybean oil was also added to the system, and the system was operated for 40
days. The results show that FOG deposits were formed on the concrete blocks, and that these
deposits were products of saponification, as determined by FTIR.

42
Figure 40. Pipe loop system with a new pump
Figure 41. Three concrete blocks placed in PVC pipe

43
4. SUMMARY AND CONCLUSIONS
A combination of batch tests, pipe loop studies, and physical-chemical characterization,
including FTIR, has led to a mechanistic understanding of how FOG deposits form in sewer
lines, and the role of various factors in formation of deposits. The mechanism (first shown in
Figure 32) is reshown here. First, free fatty acids are produced from the cooking process and
discharged with kitchen wastewater to sewer lines. When FOG is discharged to sewer lines, free
fatty acids will partition in FOG and flow on the wastewater surface. Subsequently, free fatty
acids will react with calcium leaching from concrete or with the background calcium in
wastewater (due to hardness) to form FOG deposits on the concrete surface. Alternatively, once
FOG deposits are attached, additional growth of deposits occur on the concrete surface. The
sticky solid formed after saponification will congregate and adsorb free fatty acids, calcium and
debris in wastewater to build up the FOG deposit around concrete pipe. Surfactants appear to
inhibit FOG deposit formation. While various details of some of the pathways still need to be
elucidated, we believe we have adequate evidence for the primary pathways. These results are
significant, in that for the first time, a comprehensive explanation for FOG formation has been
offered, and supported by batch and pipe loop studies. We believe that knowing the mechanism
for FOG formation in sewer lines can lead to: (1) tests that can indicate the tendency of a
particular effluent to for FOG deposits; (2) preventive technologies, including better GI design
and maintenance; (3) impacts on utility procedures and municipal codes pertaining to FOG
release from restaurants and food service establishments.

44
5. RECOMMENDATIONS
The proposed overall mechanism reveals several interesting questions. First, it is apparent that
free fatty acids, and not the free oil, is the primary reactant in the saponification reaction. It
appears that the type of free fatty acid determines the structure (e.g., stickiness, hardness) of the
FOG deposit. Thus, some types of food will contribute to a more problematic FOG deposit than
other food types. How this will result in operation and or monitoring of specific food service
establishments is an interesting question. For example, if certain types of food/cuisines are
known to have high levels of a specific fatty acid, will those food service establishments be
subject to more stringent monitoring or regulations? This appears to be a challenging regulatory
situation, and more research is necessary to confirm these results and understand the underlying
mechanisms. Second, the release of calcium from concrete (or calcium arising from hardness in
wastewater) needs to be examined in detail. It is plausible that microbial activity not only assists
in hydrolysis of oil to free fatty acids, but also may play a role in inducing concrete corrosion.
The low pH in GIs (as a result of fermentation and acidification processes) also plays a role.
Known sulfur oxidizing and sulfate reducing bacteria play a role in crown corrosion of sewers,
and may also be important factors in releasing calcium from concrete. Third, other reactions,
e.g., the formation of free radicals, may also assist in oil rancidification processes. These free
radicals can occur from various reactions that may also be present in the GI and sewer
environment.
We thus recommend further studies on these processes, to further deepen our knowledge of in
situ processes in sewer lines. It appears that deducing the rates of reactions in situ is still
problematic. Camera studies are needed, but there are methodological issues that need to be
addressed. Finally, a FOG deposit formation potential test appears to be also a difficult
challenge. However, monitoring personnel such as pretreatment staff of municipalities will find
a simple test useful to perform in the field, to determine the most likely hot spots for sewer
overflows in sewer networks. The complex nature of the FOG deposit formation process makes
the formulation of a simple test very challenging, and perhaps prone to misinterpretation.
However, as we learn more about the process, we are optimistic that such a test is still possible in
the future.

45
6. REFERENCES
APHA. Standard methods for the examination of water and wastewater, 18th
ed. American Public
Health Association, Washington DC. 1998.
Bielefeldt, A.; Gutierrez-Padilla, MGD.; Ovtchinnikov, S.; Silverstein, J.; Hernandez, M.
Bacterial Kinetics of Sulfer Oxidizing Bacteria and their Biodeterioration Rates of Concrete
Sewer Pipe Samples, J Env. Eng. ASCE, 2010, 136(7), 731-738.
Canakci, M. The potential of restaurant waste lipids as biodiesel feedstocks. Bioresource
Technology, 2007, 98, 183-190.
Daghbouche,Y.; Garrigues,S.; Morales-Rubio, A.; de la Guardia, M. Evaluation of extraction
alternatives for Fourier transform infrared spectrometric determination of oil and greases in
water. Analytica Chimica Acta. 1997, 345, 161-171.
Ducoste, J. J.; Keener, K. M.; Groninger, J. W.; Holt, L. M. Fats, roots, oils, and grease (FROG)
in centralized and decentralized systems. Water Environment Research Foundation (WERF).
2008.
EPA. "Report to Congress: Impacts and Control of CSOs and SSOs." Environmental Protection
Agency. 2004.
Ferrer, N.; Romero, M. T. Fourier transform infrared spectroscopy and solid phase extraction
applied to the determination of oil and grease in water matrices. Microchim. Acta, 2002, 140, 35-
39.
Firestone, D.; editor. Official Methods and Recommended Practices of the American Oil
Chemists Society. 5th edition, Champaign, IL., American Oil Chemists Society. 2004.
Gasperini, G.; Fusari, E.; Bella, L. D.; Bondioli, P. Classification of feeding fats by FTIR
spectroscopy. Eur. J. Lipid Sci. Technol. 2007, 109, 673-681.
Keener, K. M.; Ducoste, J. J.; Holt, L. M. Properties influencing fat, oil and grease deposit
formation. Water Environ. Res. 2008, 80, 2241-2246.
Koga, Y.; Matuura, R. Studies on the structure of metal soaps. Mem. Fac. Kyushu Univ., series
C. 1960, 4, 1-62
Kuligowski, J.; Quintas, G.; Garrigues, S.; de la Guardia, M. Direct determination of
polymerized triglycerides in deep-frying olive oil by attenuated total reflectance-Fourier
transform infrared spectroscopy using partial least squares regression. Anal Bioanal Chem. 2010,
397, 861-869.
Lucena, R.; Cardenas, S.; Gallego, M.; Valcarcel, M. ATR-FTIR membrane-based sensor for the
simultaneous determination of surfactant and oil total indices in industrial degreasing baths.
Analyst. 2006, 131, 415-421.

46
Luo, M.; Guan, P.; Liu, W. The identification of several saturated fatty acids and their salts by
means of infrared spectrometry. Spectroscopy and Spectral Analysis. 2007, 27, 250-253.
Mehrotra, K. N.; Upadhyaya, S. K. Physical-chemical studies on calcium soaps. Recl. Trav.
Chim Pays-Bas. 1987, 106, 625-627.
Mehrotra, K.N.; Rawat, M.K. Physico-chemical studies on Manganese soaps in solid state,
Colloid and Polymer Science, 1992, 270, 1232-1236.
Mossoba, M. M.; Milosevic, V.; Milosevic, M.; Kramer, J. K. G.; Azizian, H. Determination of
total trans fats and oils by infrared spectroscopy for regulatory compliance. Anal Bioanal Chem.
2007, 389, 87-92.
Notter, S. J.; Stuart, B. H.; Rowe, R.; Langlois, N. The initial changes of fat deposits during the
decomposition of human and pig remains. J Forensic Sci. 2008, 54, 195-201.
O’Connell, M.; McNally, C.; Richardson, M.G. Biochemical attack on concrete in wastewater
applications: A state of the art review, Cement & Concrete Composites, 2010, 32, 479–488.
Okabe, S.; Odagiri, M.; Ito, T.; Hisashi, S. Succession of Sulfur Oxidizing Bacteria in the
Microbial Community on Corrosding Concrete in Sewer Systems, Applied and Environmental
Microbiology, 2007, 73(3), 971-980.
Poulenat, G.; Sentenac, S.; Mouloungui, Z. Fourier-transform infrared spectra of fatty acid salts-
Kinetics of high-oleic sunflower oil saponification. Journal of Surfactants and Detergents, 2003,
6, 305-310.
Romero, M. T.; Ferrer, N. Determination of oil and grease by solid phase extraction and infrared
spectroscopy. Analytica Chimica Acta. 1999, 395, 77-84.
Tang, H.; De Guzman, R. C.; Salley, S. O.; Ng, K. Y. S. Formation of insolubles in palm oil-,
yellow grease-, and soybean oil-based biodiesel blends after cold soaking at 4°C. J Am Oil Chem
Soc. 2008, 85, 1173-1182.
Town of Cary Website.
http://www.townofcary.org/Departments/Public_Works_and_Utilities/Sewer/Fats__Oils_and_Gr
ease_Control.htm (accessed July 2011).
Tsutsui, T.; Natsuhara, M.; Yamada, K.; Tanizawa, Y. Oily grime formed on hard surfaces of
kitchen appliances: chemical composition and oxidation mechanism. J Surfact Deterg. 2007, 10,
53-59.
van de Voort, F.R.; Ismail, A.A.; Sedman, J.; Emo, G. Monitoring the oxidation of edible oils by
fourier transform infrared spectroscopy, J. AOCS. 1994, 71(3), 243.
Vlachos, N.; Skopelitis, Y.; Psaroudaki, M.; Konstantinidou, V.; Chatzilazarou, A. and Tegou, E.
Applications of Fourier transform-infrared spectroscopy to edible oils. Analytica Chimica Acta.
2006, 573-574, 459-465.

47
Walker, E. B.; Davies, D. R.; Campbell, M. Quantitative measurement of trans-fats by infrared
spectroscopy. Journal of Chemical Education. 2007, 7-84, 1162-1164.

48
APPENDIX 1.
LIST OF ABBREVIATIONS
FOG – Fat, oil and grease
FTIR – Fourier Transform Infrared
GI – Grease Interceptor
SSO – Sanitary sewer oveflow

49
APPENDIX 2.
Papers
1. He, X., M. Iasmin, L. Dean, S. Lappi, J. J. Ducoste and F. L. de los Reyes III (2011).
Evidence for How Fat, Oil, and Grease (FOG) Deposits Form in Sewer Lines.
Environmental Science and Technology, 45(10): 4385-4391.
2. He, X., M. Iasmin, L. Dean, S. Lappi, F. L. de los Reyes III, and J. J. Ducoste (in
preparation). Pathways to FOG Deposit Formation in Sewer Lines. To be submitted to
Environmental Science and Technology.
Dissertation
He, X. Fats, Oils, and Grease (FOG) Deposit Formation: Characterization of Grease Interceptors
and Elucidation of Formation Mechanisms (2011) PhD Dissertation, North Carolina State
University
Conference Papers
1. *He, X., F. L. de los Reyes III, and J. J. Ducoste (2012) Corrosion-Induced FOG Deposit
Formation in Sewer Collection Systems. To be submitted to 85th
Water Environment
Federation Annual Conference and Exposition (WEFTEC 2010), New Orleans, LA. Oct.
2-6, 2012.
2. He, X., M. Iasmin, L. Dean, S. Lappi, J. J. Ducoste and F. L. de los Reyes III (2011)
How do FOF deposits form in sewer lines? NC American WaterWorks
Association/Water Environment Association Annual Conference, November 14-17,
Concord, NC. (First Place Winner, Poster Contest)
3. He, X., M. Carpenter, and F. L. de los Reyes III (2009) Characterization of Grease
Interceptors for Removing Fats, Oils, and Grease (FOG) in Sewer Systems. NC
American WaterWorks Association/Water Environment Association Annual Conference,
November 15-18, Raleigh, NC.
4. *He, X., and F. L. de los Reyes III (2010) Microbial Ecology of Grease Interceptors for
Removing Fats, Oils, and Grease (FOG) in Sewer Lines. 83rd
Water Environment
Federation Annual Conference and Exposition (WEFTEC 2010), New Orleans, LA. Oct.
2-6, 2010.
5. He, X., M. Carpenter, and F. L. de los Reyes III (2010) Microbial and Chemical
Characterization of Grease Interceptors for Removing Fats, Oils, and Grease (FOG) in
Sewer Systems. IWA Leading Edge Technology Conference, Phoenix, AZ. June 2-4,
2010.


![Shakti oils-fats[1]](https://img.pdfslide.net/doc/110x75/55a0d8121a28ab59748b47a8/shakti-oils-fats1.jpg)