Embed Size (px)
Citation preview

Introduction
There are many categories of factors that contribute to poor health, and these include biology, individual behavior, social environment, physical environment, and health services [1]. Recent focus in public health has been on reducing racial/ethnic disparities in health by addressing disparities in social factors, which include age, race, income, and level of education [2].
Within Connecticut, disparities in health behaviors and outcomes in the Black/African American
Factors Associated with Health Disparities Among Black/African American Women in Connecticut Carol L. Stone,1 and Lisa Davis,2 using anonymous responses from randomly selected adult volunteers in Connecticut Placed on web September, 2014
Page 1
OBJECTIVES: This study identified health behaviors and outcomes in the adult female Black/
African American population of Connecticut with significant disparities relative to their White
counterparts, and determined the degree to which the health behaviors and outcomes could be
explained by age and social factors of health. METHODS: Multivariate logistic regression was
performed on eight health behaviors and outcomes with significant risk differences (p < 0.01)
between adult women in the Black/African American and White populations. Data were
obtained from the Connecticut Behavioral Risk Factor Surveillance System 2011 and 2012
surveys, combined (n=8,561). Covariates considered in the regression models included race,
age, income, level of education, insurance status, and overweight/obesity. RESULTS: Race as
a covariate made an insignificant contribution to the regression model (p 0.05) for four of the
eight indicators studied, when age, income, overweight/obesity, insurance status, and/or
educational level were included in the regression model. The contribution of race to the
regression was weakened in the remaining four health indicators. CONCLUSIONS: These data
suggest that disparities in health among adult Black/African American women of Connecticut
can be fully or partly explained by factors such as age, income, educational level, insurance
status, or overweight/obesity.
population have been reported with data from the Connecticut Behavioral Risk Factor Surveillance System (CT BRFSS) [3]. Disparity information has also been included in a recent statewide health assessment prepared by the Connecticut Department of Public Health [4], and is an overarching priority in the State Health Improvement Plan [5]. Indicators of health equity are also included in each topic area of the state’s coordinated chronic disease plan [6].
Although the CT BRFSS has been used to study health disparities, disparities among the subpopulation of adult Black/African American women have not been studied in Connecticut. This report describes the results of a study to identify health indicators and social factors from the CT BRFSS with significant disparities among adult women in the Black/African American population, and to investigate the
1 To whom Correspondence should be addressed: Carol Stone, PhD, MPH, MAS, MA, Health Statistics and Surveillance Section, Connecticut Department of Public Health, 410 Capitol Avenue, Hartford, Connecticut 06134, [email protected] (860-509-7147). 2 Lisa Davis, RN, BSN, Deputy Commissioner, Commissioner’s Office, Connecticut Department of Public Health, 410 Capitol Avenue, Hartford, Connecticut 06134, [email protected] (860-509-7101).
Connecticut State Department of Public Health

Page 2
degree to which age and social factors can explain the health disparities. The results show that health indicators with strong disparities among Black/African American women can be either fully or partly explained by age and social factors of health.
Methods
Data Selection and Variable Construction
Data from Connecticut were obtained from the CT BRFSS coordinator [7]. Each year, CDC works with states to ensure the highest possible data quality, and assigns for each survey response a weight that permits generalization to state populations, using a methodology previously described [8,9]. The CT-BRFSS is an anonymous landline/cell phone population-based survey of randomly selected adult (18 years and older) citizen volunteers that monitors the health and well-being of state residents.
Data presented in this study were obtained from questions in the CT BRFSS during calendar years 2011 and 2012, combined. Analysis was conducted on health indicators for which two years of consecutive data exist in the dataset. Data available for only a single year, such as cancer screening, high blood pressure, cardiovascular disease, falls, nutrition, and physical activity were not evaluated.
Health indicators selected for study exhibited statistically significant disparities between Black/African American and White women, when evaluated by risk differences at the 99% confidence level. Percent prevalence and weighted frequencies generally exhibited coefficient of variation values that were less than 10%, and no health indicator used in the study had a coefficient of variation greater
than 15%.
Race, irrespective of ethnicity, was self-reported by respondents among the following options to the question, “Which one or more of the following would you say is your race?”: White, Black or African American, American Indian or Alaska Native, Asian, Pacific Islander, Other, Don’t know/Not sure, Refused. In this report, those who self-reported as White were identified as White, and those who self-reported as Black or African American were identified as Black/African American.
Age groups were developed from single age responses, and income groups were obtained from categories of less then $10,000, $10,000-$14,999, $15,000-$19,999, $20,000-$24,999, $25,000-$34,999, $35,000-$49,999, $50,000-$75,000, less than $100,000 and $100,000 or more. Body-mass-index (BMI) was used to determine overweight/obesity (BMI at least 25.0), and BMI was calculated from self-reported height and weight without shoes. Family status was determined by responses to the question “How many children less than 18 years of age live in your household?” Current job status was selected among the following options, “employed for wages, self-employed, out of work for one year or more, out of work for less than one year, a homemaker, a student, retired, unable to work, and refused. Respondents who rerepdorted that they are a homemaker, student, retired, or unable to work were categorized as not in the workforce. Home owners were determined from responses to the question, “Do you own or rent your home?”, with options of own, rent, other arrangement, don’t know/not sure, or refused. No health insurance status was determined by a response of “None” to the question, “Are you currently covered by any
Connecticut State Department of Public Health

of 8,561 responses were analyzed as non-missing responses.
Data Analysis
Covariates used in the logistic regression analysis were race (White (reference group), or Black/African American); age (18-34 years old (reference group), 35-54 years old, or at least 55 years old); annual household income from all sources (less than $35,000, or at least $35,000 (reference group); highest grade or year of school completed (less than a high school degree, or at least a high school degree (reference group); overweight/obesity (overweight or obese, or not overweight/obese (reference group)); and insurance status (with health insurance (reference group), or without health insurance).
Unadjusted odds ratios for selected health indicators were estimated among those with a significant risk difference between Black/African American and White women. The unadjusted odds ratios were significant at the 99% confidence level (data not shown). These unadjusted odds ratios were then compared with the odd ratios that resulted when controlled for multiple covariates. Goodness-of-fit by Wald statistic for the full adjusted regression models improved relative to the unadjusted regression models that resulted when only race was included as a covariate, but the ratios, based on F-statistics, were not significant (p 0.05).
Each covariate of the multivariate logistic regression was evaluated for its contribution to the regression model by Wald statistic at the 95% and 99% confidence levels, which provided a measure of the covariate strength to the regression model. Covariates that did
of the following types of health insurance or health coverage plans?”
Poor health outcomes were evaluated by responses to the following questions: “During the past 30 days, for about how many days did poor physical or mental health keep you from doing your usual activities, such as self-care, work, or recreation?”, “Has a doctor, nurse, or other health professional EVER told you that you had asthma?”, “Has a doctor, nurse, or other health professional EVER told you that you have diabetes?” (excludes women with gestational diabetes), “How old were you when you were told you have diabetes?”, and “Has a doctor, nurse, or other health professional EVER told you that you have some form of arthritis, rheumatoid arthritis, gout, lupus, or fibromyalgia?”.
Risk behaviors were determined from responses to these questions: “About how long has it been since you last visited a doctor for a routine checkup?”, Have you ever had a pneumonia shot?, During the past 12 months, have you had either a seasonal flu shot or a seasonal flu vaccine that was sprayed in your nose?”, During the past month, other than your regular job, did you participate in any physical activities or exercises such as running, calisthenics, golf, gardening, or walking for exercise?”, and “How often to you use seat belts when you drive or ride in a car?”.
A total of 15,610 adult residents responded to the CT BRFSS in 2011 and 2012. Of these, 9,357 responses were from women at least 18 years of age. Among adult women, 7,751 were reportedly White, and 810 were reportedly Black/African American. Female respondents of other races and male respondents were coded as missing. A total
Page 3
Connecticut State Department of Public Health
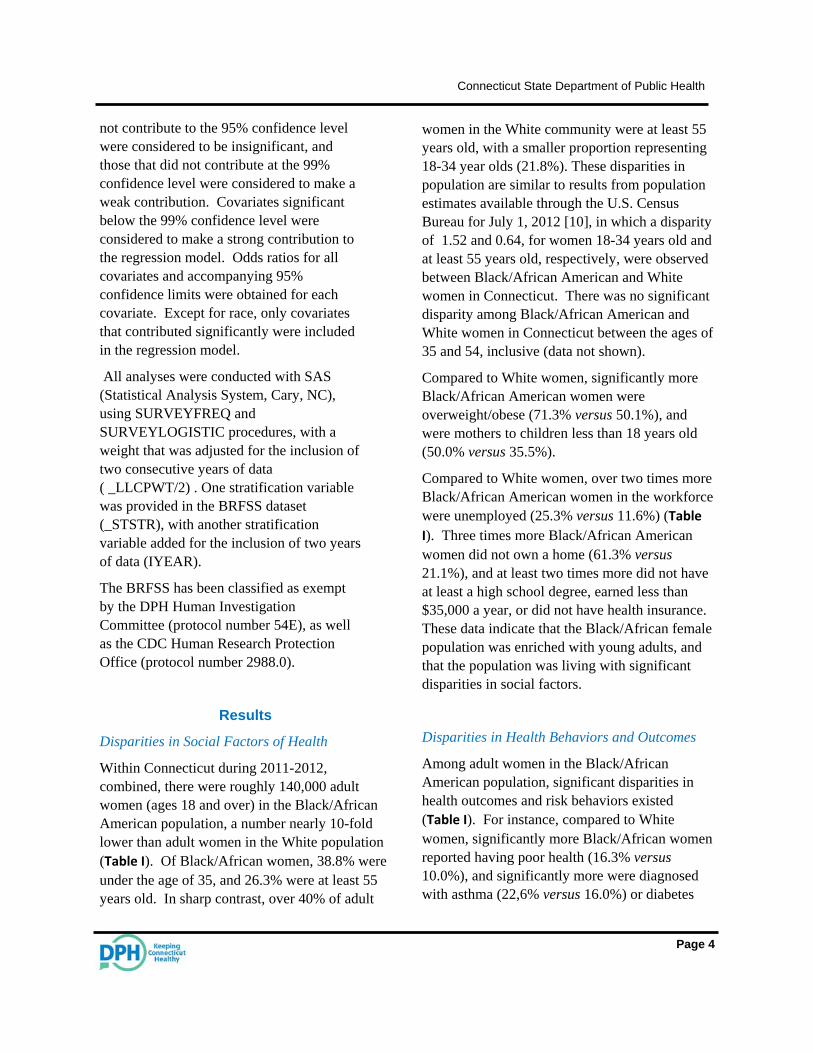
women in the White community were at least 55 years old, with a smaller proportion representing 18-34 year olds (21.8%). These disparities in population are similar to results from population estimates available through the U.S. Census Bureau for July 1, 2012 [10], in which a disparity of 1.52 and 0.64, for women 18-34 years old and at least 55 years old, respectively, were observed between Black/African American and White women in Connecticut. There was no significant disparity among Black/African American and White women in Connecticut between the ages of 35 and 54, inclusive (data not shown).
Compared to White women, significantly more Black/African American women were overweight/obese (71.3% versus 50.1%), and were mothers to children less than 18 years old (50.0% versus 35.5%).
Compared to White women, over two times more Black/African American women in the workforce were unemployed (25.3% versus 11.6%) (Table I). Three times more Black/African American women did not own a home (61.3% versus 21.1%), and at least two times more did not have at least a high school degree, earned less than $35,000 a year, or did not have health insurance. These data indicate that the Black/African female population was enriched with young adults, and that the population was living with significant disparities in social factors.
Disparities in Health Behaviors and Outcomes
Among adult women in the Black/African American population, significant disparities in health outcomes and risk behaviors existed (Table I). For instance, compared to White women, significantly more Black/African women reported having poor health (16.3% versus 10.0%), and significantly more were diagnosed with asthma (22,6% versus 16.0%) or diabetes
not contribute to the 95% confidence level were considered to be insignificant, and those that did not contribute at the 99% confidence level were considered to make a weak contribution. Covariates significant below the 99% confidence level were considered to make a strong contribution to the regression model. Odds ratios for all covariates and accompanying 95% confidence limits were obtained for each covariate. Except for race, only covariates that contributed significantly were included in the regression model.
All analyses were conducted with SAS (Statistical Analysis System, Cary, NC), using SURVEYFREQ and SURVEYLOGISTIC procedures, with a weight that was adjusted for the inclusion of two consecutive years of data ( _LLCPWT/2) . One stratification variable was provided in the BRFSS dataset (_STSTR), with another stratification variable added for the inclusion of two years of data (IYEAR).
The BRFSS has been classified as exempt by the DPH Human Investigation Committee (protocol number 54E), as well as the CDC Human Research Protection Office (protocol number 2988.0).
Results
Disparities in Social Factors of Health
Within Connecticut during 2011-2012, combined, there were roughly 140,000 adult women (ages 18 and over) in the Black/African American population, a number nearly 10-fold lower than adult women in the White population (Table I). Of Black/African women, 38.8% were under the age of 35, and 26.3% were at least 55 years old. In sharp contrast, over 40% of adult
Page 4
Connecticut State Department of Public Health

Page 5
(13.2% versus 7.6%). Among women diagnosed with diabetes, significantly more Black/African American women received the diagnosis before 50 years of age (51.7% versus 35.8%). Significantly more never had a pneumonia vaccine (75.4% versus 67.8%), had no flu shot in the past year (68.1% versus 44.6%), had no recreational exercise in the past month (35.1% versus 23.2%), and did not always wear a seat belt (22.2% versus 28.7%). Significantly fewer women in the Black/African American population were diagnosed with arthritis or other autoimmune condition, however (22.2% versus 28.7%), and reported no health checkup in the past two years (4.7% versus 11.4%).
Contribution of Race to Health Disparities
Among the risk behaviors and poor health outcomes that have significant disparities among Black/African American women, all also had significant unadjusted odds ratios (OR; Table II, Table III). For instance, compared to White adult women, Black/African adult women were nearly two times more likely to be diagnosed with diabetes (OR = 1.84; 95% CI: 1.37, 2.48), to receive no recreational exercise in the past month (OR = 1.79; 95% CI: 1.23, 2.49), to report poor health (OR = 1.75; 95% CI: 1.23, 2.49), or to have had no flu shot in the past year (OR = 1.72; 95% CI: 1.38, 2.14). Black/African American women were also significantly more likely to not always
Connecticut State Department of Public Health

Page 6
wear a seat belt (OR = 1.64; 95% CI: 1.08, 2.49), or to have been diagnosed with asthma (OR = 1.53; 95% CI: 1.20, 1.96). All unadjusted odds ratios for race contributed significantly to the regression model (p < 0.05), and all but one (Don’t always wear a seat belt)
contributed strongly to the model (p < 0.01).
When age was included in the regression model, the odds ratio observed for Black/African American women who do not always wear a seat belt was reduced from 1.64 (95% CI: 1.08, 2.49) to 1.47 (95% CI: 0.98, 2.20; Table II, Table III), a
Connecticut State Department of Public Health

Page 7
wear a seat belt (OR = 0.56; 95% CI: 0.40, 0.78). Women less than 34 years old were also 1.8 times less likely than women at least 55 years old to not always wear a seat belt (OR = 0.57; 95% CI: 0.42, 0.77). Although age contributed weakly to the regression model (Wald p-values of 0.021 and
statistically insignificant value that also no longer contributed significantly to the regression model (Wald p-value from 0.02 to 0.60). Age was the predominant factor for this risk behavior, in which women less than 34 years old were 1.8 times more likely than women 35-54 years old to not always
Connecticut State Department of Public Health

Page 8
0.002 in the unadjusted model to 0.103 in the adjusted model. Age, income and overweight/obesity contributed significantly to the regression model (Wald p-value < 0.05), and all but ages 35-54 years old contributed strongly to the regression model (p < 0.01).
Compared to White women, although Black/African American women were significantly less likely to be diagnosed with arthritis or other autoimmune condition, this disparity was eliminated when age was included in the regression model (Table II). The odds ratio for race increased from 0.71 (95% CI: 0.57, 0.88) to 1.03 (95% CI: 0.81, 1.32), and became insignificant to the regression model (Wald p-value = 0.79). Age, on the other hand, was a significant contributor. Women 35-54 years old were over four times more likely to be diagnosed with arthritis or other autoimmune condition than women less than 35 years old (95% CI: 2.74, 6.03), and women at least 55 years old were 17 times more likely to be diagnosed with arthritis or other autoimmune condition than women less than 35 years old (95% CI: 11.6, 24.9).
When age, education, and insurance status were included in the regression model, the disparity among Black/African American women seen with obtaining a flu shot in the past year was reduced from 1.72 (95% CI: 1.38, 2.14) to 1.36 (1.08, 1.71). The contribution of race to the regression remained significant (Wald p-value = 0), and the odds ratio was also significant (OR=1.36; 95% CI: 1.08, 1.71), however, age and social factors of health also contributed significantly to the model. Women with no health insurance were 2.9 times more likely to have no flu shot in the past year than women with health insurance (95% CI: 2.12, 3.88), and women with less than a high school degree were 1.5 times (95% CI: 1.11, 1.95) more likely to have no flu shot than women with at least a high school degree. Women less than 35 years of age
0.018, for women 35-54 years old and at least 55 years old, respectively), the contribution of age was significant (p < 0.05).
When age, income and overweight/obesity were included in the regression model, the odds ratio for Black/African American women who reported poor health in the past month was reduced from 1.75 (95% CI: 1.23, 2.49) to 1.41 (95% CI: 0.93, 2.12), and the contribution of race to the regression model became insignificant (Table II). Age, income, and overweight/obesity contributed significantly to the regression model (Wald p-values of < 0.05). Women 35-54 years old were 2.8 times more likely to report poor health than women less than 35 years of age (95% CI: 1.64, 4.69) and women at least 55 years of age were 3.1 times more likely to report poor health (95% CI: 1.87, 5.08). Women with incomes less than $35,000 were three times more likely to report poor health than women with higher incomes (OR = 3.31; 95% CI: 2.48, 4.42), and women who were overweight or obese were two times more likely to report poor health (OR = 1.49; 95% CI: 1.49, 2.69).
The disparity among Black/African women observed with asthma was reduced to insignificance when age and income were included in the regression model (Table II). The odds ratio for race decreased from 1.53 (95% CI: 1.20, 1.96) to 1.30 (95% CI: 0.98, 1.72), a value statistically insignificant. Significant odds ratios were observed with age, in which women 35-54 years old were 1.4 times less likely to be diagnosed with asthma than women less than 35 years of age (OR = 0.70; 95% CI: 0.53, 0.92), and women at least 55 years old were 1.6 times less likely to be diagnosed with asthma (OR = 0.64; 95% CI: 0.49, 0.84). Women with household incomes less than $35,000 were 1.4 times more likely to be diagnosed with asthma than women with higher incomes (95% CI: 1.18, 1.76). The Wald p-value for race changed from
Connecticut State Department of Public Health

were 1.4 times less likely to have a flu shot than women 35-54 years old (OR = 0.74; 95% CI: 0.59, 0.92), and were 2.6 times less likely to have a flu shot than women at least 55 years old (OR = 0.39; 95% CI: 0.32, 0.48).
Similarly, the disparity in no recreational activity in the past month that was observed among Black/African American women in the unadjusted regression model was reduced when age, income, overweight/obesity, and education were included in the model (Table III). The race disparity in diabetes was reduced when age, income, and overweight/obesity were included in the model (Table II). Although the odds ratios remained significant for race, the contribution with both health indicators was reduced. For both indicators, income and overweight/obesity were a significant contributor to the regression models. Overweight/obesity was a particularly strong contributor to the regression model for diabetes, in which women who were overweight or obese were 3.8 times more likely to have diabetes (95% CI: 2.88, 5.10), compared to women who were not overweight or obese. Women with household incomes less than $35,000 were roughly two times more likely to either have no recreational activity in the past month (95% CI: 1.65, 2.37), or to have diabetes (95% CI: 1.60, 2.56).
Among the health indicators with significant disparities among Black/African American women, arthritis or other autoimmune condition had a reverse disparity. Black/African American women were 2.5 less likely to have had no checkup in the past two years was than White women (OR = 0.38; 95% CI: .026, 0.57). Race was a strong contributor to the unadjusted regression model (Wald p-value < 0.001). When age and insurance status were added to the regression model, race remained a strong contributor in the adjusted regression model (Wald p-value < 0.001), and the odds ratio for race was shifted toward increased disparity (OR = 0.27; 95% CI: 0.17, 0.41). Age and insurance
Connecticut State Department of Public Health
status contributed strongly to the regression model, in which women 18-34 years old were nearly two times less likely to have had a checkup than women at least 55 years old (OR = 0.54; 95% CI: 0.40, 0.72), and women without health insurance were over five times less likely to have had a checkup than those with health insurance (OR = 5.25; 95% CI: 3.96, 7.00).
Discussion
The results of this study suggest that, relative to White adult women at least 18 years of age, disparities among Black/African American women for seat belt use, poor health, asthma diagnosis, and arthritis or other autoimmune condition can be completely explained by age, income and/or overweight/obesity (Table IV). Disparities in other health indicators can be partially explained by these socioeconomic factors of health, as well as educational level and/or insurance status.
The data suggest that age-appropriate strategies in the Black/African American population to improve social factors would reduce disparities in health behaviors and outcomes (Table IV). In particular, strategies to increase health awareness among Black/African American women less than 34 years old could have a large impact on risk behaviors such as seat belt use, obtaining seasonal flu vaccines, and receiving medical checkups. Strategies to treat asthma could also be focused on a younger demographic. Women at least 35 years old are at increased risk of diabetes, and more likely to receive no recreational exercise in the past month and report poor health at least 14 days in past month. Strategies focused on this age demographic could health to reduce disparities.
In addition to age, poverty is a significant factor in diagnosed asthma and diabetes (Table IV), as well as poor health and a lack of recreational exercise. Strategies to improve poverty through job creation and minimum wage increases among Black/
Page 9

African American women could help to reduce disparities in these health indicators.
Other factors that contributed to disparities among Black/African women in Connecticut were overweight/obesity, educational status, and insurance status. (Table IV). Strategies such as improving access to affordable and healthy foods, and providing opportunities to encourage a culture of lifelong learning could reduce disparities in health indicators. With implementation of the Affordable Care Act, insurance coverage could also reduce disparities among Black/African American women.
Women in the Black/African American population are significantly more likely to receive regular checkups than their White counterparts (95% versus 89%; Table I). As insurance status changes with implementation of Affordable Care Act, therefore, it is anticipated that greater access to health care will lead to better health outcomes for women in the Black/African American community. It is also possible, however, that the greater frequency of medical check-ups observed
Connecticut State Department of Public Health
among Black/African American women is for follow-up care among those with chronic conditions. The indicator also cannot distinguish if Black/African American women are receiving comparable care relative to White women, and quality of medical and preventive care among Black/African American women needs further study.
Using Connecticut data from the BRFSS for 2011 and 2012, combined, the contribution of race to the logistic regression model was not significant with four of the eight health indicators studied when other factors, such as age, income, overweight/obesity, educational level, and insurance status were included in the model (Table IV). Race remained significant with the remaining four health indicators. Factors such as eating habits, access to health care and safe sidewalks, geographic region of residence, and employment status were not studied. These factors could be significant contributors to health indicators such as diabetes, recreational exercise, and whether a flu vaccine or checkup was obtained. Other unknown factors may also
Page 10

contribute to disparities among Black/African American women.
The lack of significance for race as a factor with some of the health indicators studied may be related to statistical power. The size of the dataset used in this study allowed for significant covariates to be identified in the logistic regression model, but improvement in goodness-of-fit measures were not significant in the presence of these covariates. It is possible that the insignificant contribution of race to the regression model in the presence of other factors is due to the limited statistical power. Combining additional years of CT BRFSS data may provide added statistical power to more fully explore the degree to which disparities among Black/African American women in Connecticut can be explained by social factors of health.
This study was limited to two consecutive years of data, and important indicators of health, such as cancer screening behavior, actions to control high blood pressure, and heart disease were not studied. Further research is needed to more fully understand how race and social factors are related to a broad range of health indicators.
This study was conducted to understand health disparities among Black/African adult women in Connecticut, and men in the state were not studied for disparities in health. Studies are needed to more fully understand how health disparities affect Black/African American men in Connecticut. The study was also conducted of race disparities, without regard for ethnicity. Additional studies are needed to understand health disparities within other race groups, including both the English-speaking and Spanish-speaking Hispanic/Latino population.
Sources of bias to which this study are subject include: 1) nonresponse bias, 2) recall bias, and 3) selection bias. This survey depends on anonymous responses from citizen volunteers, and all questions within the survey are voluntary and,
Connecticut State Department of Public Health
therefore, subject to nonresponse bias. The survey is offered within a 20-25 minute time period, with some questions asking respondents to remember events one or two years before the interview. Also, although the survey sampling methodology selects respondents at random, participation in the survey is voluntary.
In summary, this report demonstrates that disparities in health behaviors and outcomes exist among Black/African American women in Connecticut, and that these disparities can be at least partly explained by age, income, overweight/obesity, educational level, and insurance status. The data suggest that strategies to reduce disparities among Black/African American women should be focused on women across the lifespan, but especially on younger women. Strategies to increase income and educational level, reduce overweight/obesity, and increase access to health insurance should also help to reduce health disparities among Black/African American women.
Acknowledgements
The authors acknowledge the contribution of state BRFSS coordinator Diane Aye, and feedback from Margaret Hynes within DPH. Work by C. Stone on this project was funded by the Connecticut State Title V Maternal and Child Health Block Grant (grant number B04MC25330), the Connecticut Behavioral Risk Factor Surveillance System (grant number 5U58SO000003), and the Connecticut Preventive Health and Health Services Block Grant (grant number B01-DP009008).
References
1. Centers for Disease Control and Prevention (2014) Social Determinants of Health: Definitions (http://www.cdc.gov/socialdeterminants/Definitions.html), accessed on June 24, 2014.
Page 11
2. Centers for Disease Control and Prevention (2014) Social Determinants of Health (http://www.cdc.gov/socialdeterminants), accessed on June 24, 2014.
3. Connecticut Department of Public Health (2014) Health Risk Behaviors in Connecticut: Results of the 2012 Connecticut Risk Factor Surveillance System, Connecticut Department of Public health, Hartford, Connecticut (http://www.ct.gov/dph/lib/dph/hisr/pdf/brfss2012_ct_report.pdf), accessed on June 24, 2014.
4. Connecticut Department of Public Health (2014) Healthy Connecticut 2020. 1: State Health Assessment, Hartford, CT (http://www.ct.gov/dph/lib/dph/state_health_planning/sha-ship/hct2020/hct2020_state_hlth_assmt_032514.pdf), accessed on June 25, 2014.
5. Connecticut Department of Public Health (2014) Healthy Connecticut 2020. 2: State Health Improvement Plan, Hartford, CT (http://www.ct.gov/dph/lib/dph/state_health_planning/sha-ship/hct2020/hct2020_state_hlth_impv_032514.pdf), accessed on June 25, 2014.
6. Connecticut Department of Public Health (2014) Live Healthy Connecticut, A Coordinated Chronic Disease Prevention and Health Promotion Plan.
Connecticut State Department of Public Health
Hartford, CT (http://www.ct.gov/dph/lib/dph/state_health_planning/dphplans/chron_dis_coord_plan__april_2014.pdf), accessed on June 25, 2014.
7. Connecticut Behavioral Risk Factor Surveillance System (CT-BRFSS): Connecticut Department of Public Health; (http://www.ct.gov/dph/brfss), accessed on June 24, 2014.
8. Behavioral Risk Factor Surveillance System (BRFSS): Centers for Disease Control and Prevention, Atlanta, GA; (http://www.cdc.gov/brfss/), accessed on June 24, 2014.
9. Centers for Disease Control and Prevention: Behavioral Risk Factor Surveillance system: Weighting the Data (http://www.cdc.gov/brfss/annual_data/2012/pdf/Weighting%20the%20Data_webpage%20content%2020130709.pdf), accessed on June 24, 2014.
10. U.S. Census Bureau (2013) Annual estimates of the resident population by sex, age, race alone or in combination, and Hispanic origin for the United States and States: April 1, 2010 to July 1, 2012, Population Division (Table PIPASR5H; http://factfinder2.census.gov/faces/nav/jsf/pages/index.xhtml), accessed on July 14, 2014.
Page 12
Suggested Citation: Stone, C, Davis, L (2014) Factors associated with health disparities among Black/African American women in Connecticut, Connecticut Department of Public Health, Hartford, Connecticut.
This document can be viewed at http://www.ct.gov/dph/BRFSS