Embed Size (px)
Citation preview
Factors Influencing the Response Rate in Social Question &Answering Behavior
Zhe Liu and Bernard J. Jansen College of Information Sciences and Technology
The Pennsylvania State University University Park, Pennsylvania 16802
[email protected], [email protected]
ABSTRACT With the increasing growth and popularity of social networking sites, social question and answering has become a venue for individuals to seek and share information. This study evaluates eleven extrinsic factors that may influence the response rate in social question and answering. These factors include the number of followers, the frequency of posting, the number of at-mentioned recipients, whether or not a question contains any at-mentioned verified account, unverified account, hashtag, emoticon, expression of gratitude, repeated punctuation and interjections, as well as the topic and the posting time period of a question. We collected and analyzed over 10,000 questions from Sina Weibo. Eight out of all eleven features were found to significantly predict the number of responses received. We believe that our study is of significant value in providing insights for the design and development of future social question and answering tools, as well as enhancing the collaboration among social network users in supporting social information seeking activities.
Author Keywords Social search; Social Q&A; Social network; Information seeking; Weibo
ACM Classification Keywords H.5.3
INTRODUCTION Social networking sites (SNS), such as Facebook, Twitter, and Google+ have become popular in the recent decade. With their unique design, SNS have grown rapidly and become an important medium for people to build or maintain their social relationships. Daily, hundreds of millions of new pieces of content are posted by SNS users and shared with both their immediate networks and the larger Web community [1, 20]. This makes SNS remarkable resources for the real-time information seeking. Social search is the process of finding information online with the assistance of social resources [9]. Among various ways of
conducting social search (e.g., reference help online, post questions on Q & A sites or forums etc.), posting questions to one’s friends or followers on SNS attracts much researcher attention due to the popularity, simplicity and convenience of SNS. Also, besides relying on traditional information seeking resources, including search engines, online catalogs, IMs or emails, people have begun increasingly using SNS to satisfy their information needs. They accustomed to asking and answering questions on SNS. This information seeking process is known as social question and answering (Q&A). Examples include: Does anybody know who won the NBA playoff game last night? Where can I find a tattoo artist that’s good at 3D tattoos? Any recommendation for the cheapest place to get Polaroid 600 film?, etc.
Although social Q&A has a number of advantages, especially in terms of time and effort, it also has the defect of no guaranteed responses. In general, only 23% of questions posted on Twitter receive a response [5], which is only 1/3 of the response rate of professional Q&A sites. This might be due to multiple reasons, including the fairly casual nature of SNS and the huge volume of data being posted every second, as well as SNS’s unique design of real-time updates. All of these may lead to some of the interrogative posts to be buried in a sea of updated comment streams.
Our research aim is to investigate possible ways of increasing the social response rate. In this work, our research question is: What are the extrinsic factors that influence individuals to share their knowledge by replying others’ questions posted on SNS?
We limit our scope to extrinsic factors, given the existence of literature focusing on factors from both social and cognitive perspectives in knowledge sharing [19, 22]. In this work, we evaluated eleven factors via hypothesis testing in order to understand whether or not these factors impact the number of answers received. By understanding factors that underlie people’s willingness to share their knowledge, our results can provide useful design implications for future social Q&A tools and can improve the low response rate in SNS. The data we use in this study are question posts collected from Sina Weibo, which is the most popular micro-blogging site in China at the time of the study. We analyzed the relationships among all eleven
Permission to make digital or hard copies of all or part of this work for personal or classroom use is granted without fee provided that copies are not made or distributed for profit or commercial advantage and that copies bear this notice and the full citation on the first page. To copy otherwise, or republish, to post on servers or to redistribute to lists, requires prior specific permission and/or a fee. CSCW ’13, February 23–27, 2013, San Antonio, Texas, USA. Copyright 2013 ACM 978-1-4503-1331-5/13/02...$15.00.
Q&A February 23–27, 2013, San Antonio, TX, USA
1263
factors and the question response rate by conducting a multiple regression. We found eight of the eleven features have either positive or negative effect on a question’s response rate.
Although a number of works have been done on the topic of social search [6, 7, 8, 9, 10, 11], few of them have focused on the perspective of response rate. This is also one of the first published studies of social Q&A on the Chinese site, Weibo, although we also expect our findings to inform behaviors on other social network mediums too. Based on our findings, design implications can be developed to improve SNS and to enhance human collaboration when using SNS to address their information needs.
In the rest of this paper, we provide a brief review of related major studies that have been done previously. In section 3, we introduce our research questions and hypotheses. Following, in section 4, we explain our analysis method, including data collection, pre-processing, and modeling process. We then present our data analysis results, including a detailed explanation of factors that are significantly related to the response rate of an interrogative post. Finally, we conclude our work with discussion on our findings and design implications based on our results in Section 6.
RELATED WORK Given that social search combines the characteristics of both social network and professional Q&A, studies from those two areas are relevant to our work. Next, we will introduce those related works from the perspectives of both question asking and question answering.
Question Asking As an emerged concept, the expectation is that social search has potential as an alternative to traditional information seeking tools (e.g. search engines, online catalogs, and professional question-and-answering sites). A number of studies have been conducted from the question asker’s perspective exploring the motivations and patterns of current social Q&A experience.
Morris et al. [9] surveyed 624 social network users concerning their reasons for choosing social networks as the platform for Q&A. The results indicated that people search socially primarily due to their trust in friends over trust in strangers. Other than that, specific audience, weak beliefs on search engine performances, and non-urgent information needs also accounted for the reasons people turn to social networks to seek information. To further examine the factors that influence users' adoption of social search, the researchers also conducted another user study [10] and confirmed that seeking information on social networks can provide more personalized answers with higher response quality.
In addition to motivations, other research has been conducted to understand the taxonomy of questions asked on SNS. Through their analysis of 100 question tweets, Efron and Winget [7] found that Twitter users use their
social network to satisfy their information needs by asking both factual and impersonal opinion questions to their friends online. Based on their findings, the authors proposed a taxonomy of questions asked under the microblogging environment. Evans and Chi [8] conducted their study using Broder’s [12] proposed taxonomy of traditional search (transactional, navigational, and informational). The authors presented a social search model of user activities before, during, and after search and proved the value of social interactions in information seeking tasks. Utilizing naturally collected tweets from Twitter, Paul et al. [11] assessed whether or not Twitter is a good place for asking questions. By analyzing question tweets, the authors found that rhetorical questions were the most popular form of questions asked, followed by questions seeking for factual knowledge.
Question Answering Although social search has been studied from the perspective of the question asker, limited work has been done from the standpoint of the answerer. Given the low response rate demonstrated in social search [5], many researchers turned their research focus to professional and other Q&A sites to explore the secret of high quality and high quantity response. Adamic et al. [14] in their work used Yahoo! Answer to understand patterns demonstrated in knowledge sharing activities. By clustering forum categories according to their content characteristics, the authors found a strong association between user’s entropy (the broadness of user’s focus) and the rating of the answers. Harper et al. [15] conducted field experiments utilizing multiple online Q&A sites and found that fee-driven sites, such as Google Answers received higher quality answers than other online but free sites. They also conclude in another study [18] that answer quality can be affected by both intrinsic factors and extrinsic factors, such as perceived ownership of information and reputation. Besides studies targeting on the answers, there are also other works studying the quality of responses by identifying the answerer’s level of expertise in certain area [16, 17].
In addition to studies investigating answer qualities, there are also a few works focusing on the perspective of response quantity. Teevan et al. [13] conducted a user study in which participants are asked to search the Web while simultaneously posing a question on the same topic to their social network. By comparing the differences between traditional search and social search, the authors found that about half of the subjects received responses from their network before completing their search, which demonstrate the feasibility of using SNS for information seeking.. By performing statistical analysis based on real tweets, Paul et al. [11] noted that the majority of questions received no response on Twitter. They also found that among those few interrogative tweets with answers, the response rate is strongly related with some of the characteristics of the question askers, such as the size of their networks.
Q&A February 23–27, 2013, San Antonio, TX, USA
1264
Although studies exploring response qualities on social search are insightful, there are even more basic issues that need to be addressed before we could move to that stage. Despite findings from Teevan et al.’s [19] and Paul et al.’s [11] studies, we still know very little about what happens when SNS users see their friend’s or follower’s questions online. What drives them to provide their response for knowledge sharing purpose? What deters them from responding? Given the very low response rate of Q&A on SNS currently [11], we believe that without a more comprehensive evaluation of factors affecting whether or not a question will be answered, SNS’s power in social information seeking may never be achieved.
VARIABLES AND RESEARCH MODEL To answer those research questions, we establish a framework on the basis of our own experience and previous literatures. We address eleven factors in our proposed model, with each variable associated with a hypothesis, testing its influence on the response rate under the social Q&A context. For better understanding of features covered in this study, we proceed with a detailed description of all eleven factors for later analysis.
1. Number of followers One’s “number of followers” has long been investigated as a possible indictor of the person’s influence in spreading information to effective readers [23]. Given that questions posted on one’s SNS can only be seen by his/her followers/friends, we assume that the more followers a questioner has the more responses he/she could expect to receive. Consistent with our assumption, Paul et al. [11] concluded in their study that the probability of receiving a response is intrinsically associated with the questioner’s number of followers. Souza et al. [39] further supported such a significant relationship through their computational investigation. Based on the results from these studies, we therefore propose our first hypothesis:
Hypothesis 1. The number of responses will be higher for questioners with more followers.
2. Frequency of posting (per day) Besides a large number of followers, a high posting frequency can also to some extent identify an online influencer [33]. Thus, it might have positive impact on the response rate of social Q&A as well. However, based on our own experience and past literatures, posting too much mundane information on one’s social network may cause negative physiological consequences to audience and result in an information fatigue syndrome [34]. People may become uninterested in reading the messages posted by followees who disclose too much information [35]. Both Sibona et al. [31] and Kwak et al. [32] also demonstrated in their studies that people “unfriend” those who post too frequently about unimportant topics or mundane details of their lives. All the above arguments lead to the following hypothesis:
Hypothesis 2. The number of responses will be lower for questioners with higher frequency of posting.
3. Number of at-mentions The at-mention feature of SNS enables users to directly reference others by putting an @ symbol before their screen names. According to Huberman et al. [45], this feature is widely adopted by Twitter users, with about 25.4% of all daily tweets being directed ones. At-mention has been proved as a strong predictor of information diffusion [37], as well as a significant factor in enlarging the visibility of a post and helping initiate responses and conversations [36]. The presence of such an effect was shown in both Comarela et al. [38] and de Souza et al.’s [39] studies. This leads to the following hypothesis:
Hypothesis 3. The number of responses will be higher for questions with higher number of at-mentions.
4. At-mention verified account Verified account in SNS allows highly sought individuals or organizations in diversified areas to be verified as high-quality sources of information. Contrary to those general users, verified accounts tend to have more followers and thus be more influential on information diffusion and persuasion [21]. After at-mention those verified accounts, questioners would expect to get their questions retweeted by those influencers to receive more answers. To examine the effect of the verified account under the social Q&A context, the following hypothesis is set:
Hypothesis 4. The number of responses will be higher for questions with verified account at-mentioned.
5. At-mention general account General accounts are the users not being verified by SNS services. Compared to directing messages to verified accounts, at-mentioning general accounts usually express some kind of close or familiar relationships and can be treated as an indicator of mutual trust [40]. Given the mutual familiarity, direct question to one’s general followers/friends guarantees the visibility of the question, and even the probability of getting a response. Thus we propose hypothesis 5:
Hypothesis 5. The number of responses will be higher for questions with general account at-mentioned.
6. Hashtag Hashtags is the way SNS categorize posts according to specific keywords or topics. Hashtag’s values in grouping conversations and information diffusion [27] have been well studied. Rossi et al. [24] investigated the hashtag-based conversations and found that the adoption of hashtags breakthrough the restriction of the social network structure and made conversations based on non-reciprocal following relationships possible. Based on their findings, we suppose users can enlarge the visibility of their questions with the adoption of hashtrags, and thus get a higher possibility of getting responses. The following hypothesis is formulated:
Q&A February 23–27, 2013, San Antonio, TX, USA
1265
Hypothesis 6. The number of responses will be higher for questions that include hashtag.
7. Emoticon Emoticons are graphic representations of facial expressions that SNS users can embed in their post. Previous literature [41, 42] suggested that in compensation of the lack of social nonverbal cues, people tend to use more emoticons in computer-mediated communications. In that way they can better maintain their social presence and therefore be more engaged in social interactions. Besides, emoticons can also be used to draw the attentions from the recipients [25]. So we propose our hypothesis 7
Hypothesis 7. The number of responses will be higher for questions that include emoticon.
8. Repeated punctuations and interjections As mentioned in [43, 26], repetition regardless of length limitations indicates the important role it plays in communicating one’s social meanings to the others. Without adding any verbal information to the message, repeated punctuation and interjections are considered more often as an emphasis of the communicated emotion. Therefore, we expect a positive relationship between it and the response rate:
Hypothesis 8. The number of responses will be higher for questions that include repeated punctuations and interjections
9. Expression of gratitude As a well-studied motivation behind prosocial behaviors, many literatures [44, 2] have affirmed the significant effect of gratitude expressions on social exchange. It is believed that through both agentic and communal mechanisms, gratitude expressions can enhance the helper’s feelings of self-efficacy and social worth, and thus encourage them to engage in prosocial behaviors [57]. So our hypothesis 9 is phrased as follows:
Hypothesis 9. The number of responses will be higher for questions that include expression of gratitude.
10. Topical category Given that expertise is usually context dependent. We naturally assume that the response rate for questions can be different across various topical categories. Several literatures support our assumption. Both focusing on the topical categorization of interrogative tweets, [7,9] presented significant differences on the number of questions posted across categories. Another study [3] proved such topical variance in people’s knowledge sharing behavior, indicating that certain categories tend to attract more answers than the others. To examine this assumption, the following hypothesis is set:
Hypothesis 10. Questions within certain topical categories will receive higher number of response than the others.
11. Posting time period
Several previous studies, in both traditional search [28] and social Q&A [29], addressed significant changes in SNS post volumes along the day. Beitzel et al. [28] indicated in their work a significant variance in the frequency of information seeking across different time period of a day. Paul et al. [11] later showed the influence of posting time on Social Q&A response rate, given that tweets posted during peak hours can easily get buried in a sea of Twitter streams after a while. This lead us to believe that picking the right time to ask one’s question may be important to getting a high response rate. So we hypothesize that:
Hypothesis 11. Questions posted within certain time period of a day will receive higher number of responses than the others.
METHODS
Data Set In this study, we collected data from China’s largest microblogging site, Sina Weibo. Launched in 2009, Weibo attracted nearly 30 million users within only three years, with a current average of 10 million Weibo statuses published every day [30], at the time of the study. Weibo essentially adopts the same operating concept and provides very similar functions to its users as Twitter.
The main reason to select Sina Weibo over Twitter as the data source in our study is because of its more user-friendly replying mechanism. Rather than mixing the replying tweets to different topics all together, Weibo’s threaded comment feature obviously makes the responding process not only simpler, but it si also more organized. It can be seen in Figure 1, with Weibo user’s replying and displaying actions all done in one section. Weibo’s reply function makes the social feedback process much easier for its users, and thus could be a better source for studies focusing on the behaviors of social response.
In addition, another consideration that we chose Weibo in this study is because of its richer content. Due to the fact that Chinese characters are logograms rather than phonograms, the same number of Chinese characters can convey more information than English letters. Therefore, with the same 140-character limit, Weibo users can post much more elaborated questions and answers compared to Twitter users.
Using Weibo Search API, we collected 15,000 Weibo questions (published between September 1st 2011 and April 10th 2012), together with all their replies in a ten-day period from April 20th 2011. In this process, we adopted keywords with information seeking purpose, including “anybody know”(有没有人知道), “anybody can tell” (有没有人能告诉) and “almighty Weibo” (万能的微博, a well-known Weibo terminology, used to express one’s desperate needs for help and information), plus question mark (?). Modified snowball sampling method was conducted to
Q&A February 23–27, 2013, San Antonio, TX, USA
1266

identify those above keywords used for the task of question extraction.
Criterion Variable As we indicated in our hypotheses, the dependent variable is the response rate of each question. To control the effect of the time available to response on our dependent variable, we intentionally left a ten-day period (April 10th 2012 to April 20th 2012) for collecting the responses. Given the ten days gap and 97% of the replies to question tweets happen within an hour [3], we believed varied response time would not impact the number of replies collected. In addition, given the conversational nature of Weibo interactions, in this study we only counted replies made by distinct answerers. In other words, only one response would be counted even though an answerer might comment more than once regarding the same question.
Figure 1: Layout of Weibo Replying
Predictor Variables
Number of follower, Frequency of posting. Both features are from the perspective of the questioners. Number of follower can be directly derived from the Weibo API returns, whereas posting frequency needs to be calculated by dividing the total number of posts by the total number of days on Weibo from the first day of registration. We eliminated cases with zero number of followers or followees, given considerations of Weibo spammer bots.
Number of at-mentions, At-mention verified account, At-mention general account, Hashtag. All four features were extracted using regular expressions that matched the occurrence of Weibo specific symbols (e.g., @, #). Identities of the users being at-mentioned were verified through Weibo’s User Search API. Besides the number of at-mentions, the other three variables were all binary coded, with the presence of the feature coded as 1, and the absence of it coded as 0.
Emoticon, Repeated punctuation and interjections, Gratitude expression. We extracted all three variables based on predefined patterns and coded in a binary manner (presence or absence). A full list of official Weibo emoticons was first derived from the Weibo API and was then used to match each of the collected questions. The remaining two features were both extracted in the similar
manner, with the former using a defined list consisting of repeated punctuation (e.g., !!!!, ????, ……, etc.) and Chinese interjections, including “啊”, “呀”, “哇”, “吧” (all have no actual meaning) and “急” (means urgent), and the latter using a list of gratitude words and phrases. All predefined patterns identified above were based on our observed frequencies of their occurrence based on analysis of user behavior on Weibo. Topical category. We employed a categorization method by automatically submitting each of the collected questions into Baidu Zhidao (http://zhidao.baidu.com/) and retrieving their returned classifications. As the most famous professional Q&A site, Baidu Zhidao has a comprehensive hierarchical taxonomy of 14 main categories and a number of corresponding sub-categories within each main category (Figure 2). The most frequently occurred main category on the first returned page would be assigned to the question as its topic.
Figure 2: Layout of Baidu Zhidao
Among all 14 categories defined by Baidu Zhidao, we found that only 9 of them occurred quite often in our dataset, covering more than 92% of the interrogative posts crawled. Given the infrequency of questions from the other 5 categories, we discarded that data, reserving for future analysis. We didn’t want those special cases to affect our prediction results. Also, even if we keep those infrequently asked questions, given their small percentage of occurrence, our results could not be impactful. We then dummy coded this category feature into nine dummy variables.
Posting time period. Posting timestamp can also be directly derived from the API returned results. W divided the posting timestamp into four categories of equal durations, including: nights (0:01AM - 6:00AM), morning (06:01AM – 12:00PM), afternoon (12:01PM – 6:00PM) and evening (6:01PM – 12:00AM), as inspired by findings from previous studies [46, 47]. As a categorical predictor, posting time period is also dummy coded for later analysis.
Data Analysis Given the criterion variables for all of our eleven hypotheses, we adopted a multiple linear regression analysis to test all hypotheses simultaneously. Before we conducted the regression analysis, multicollinearity was checked by examining the bivariate correlations across all
Q&A February 23–27, 2013, San Antonio, TX, USA
1267

predictor variables. As none of the values in the bivariate correlation matrix exceeded the recommended value of 0.7 [4], our data suggested a lack of multicollinearity among independent variables in the multiple linear regression models. Given the highly skewed distribution of all our numerical variables, we used a log-transformation to normalize the data. All categorical predictor variables were dummy coded. We employed SPSS for the analysis. The p-value was set at 0.05 to be statistically significant.
RESULTS Descriptive Statistics Descriptive statistics for all variables in this study are reported in Table 1. Overall, the 13,818 interrogative Weibo posts that we used in this study generated 30,705 responses, receiving on average 2.22 unique replies from distinct respondents. 33.3% of the Weibo questions get responses from at least one answerer, and 2.0% of them received 10 or more replies. In general, approximately 84.0% of the total questions got responses of 5 or less, which forms the ‘long tail’ in the dataset as shown in Figure 3.
Multiple Regression Model Results of our multiple regression analysis are listed in Table 2. The overall model of question response rate on Weibo is significantly predicted (F20, 13797 = 157.33, p < .001). All eleven proposed predictor variables, taken together, accounted for roughly 19% of the total variance. Although R-square value is not high, the significance F-value and the results of the beta-coefficients all indicate that our propose predictor variables have significant relevance with the question response rate on Weibo. Given that all eleven features studied in this work are all extrinsic factors that may have impact on people’s social Q&A behavior. Without inclusion of any intrinsic determinant, we believed a relatively lower R-square value in our model is reasonable.
Figure 3: Distribution of response numbers
In addition to an overall assessment of the prediction model, we also tested our proposed hypotheses by examining the p-values and the beta-coefficients associated with each of the predictor variables. We found no statistical evidence to support Hypothesis 5, 8 and 9, with their p-values greater than .05, which indicated that both the adoption of at-mentions on general accounts, the usage of repeated
punctuations, interjections, and gratitude expression in one’s question could not significantly affect its response rate on Weibo.
Although Hypotheses 4 and 6 demonstrated significant statistical correlation between the response rate and the at-mention of verified account and the usage of hashtag, they still can not be accepted given that the sign of their coefficient is the opposite of what we have hypothesized. Therefore, we concluded that among all eleven assumptions, only hypotheses 1 (number of followers), 2 (frequency of posting), 3 (number of at-mentions), 7 (emoticons), 10 (topical category), and 11 (posting time period) are supported given our results.
Variable Mean Median Standard Deviation
Number of followers 1882.39 408.00 13543.012 Frequency of posting 5.31 3.00 16.091 Number of @mentions 0.47 0.01 1.402 Number of responses 2.22 2.00 3.398
Variable Frequency Percent @mention verified account Yes. ( =1) No. ( =0)
1793 12025
12.98% 87.02%
@mention general account Yes. ( =1) No. ( =0)
1462 12356
10.58% 89.42%
Hashtag Yes. ( =1) No. ( =0)
878 12940
6.35% 93.65%
Emoticon Yes. ( =1) No. ( =0)
4522 9296
32.73% 67.27%
Repeated punc and interj Yes. ( =1) No. ( =0)
2446 11372
17.70% 82.30%
Gratitude expression Yes. ( =1) No. ( =0)
6510 7308
47.11% 52.89%
Topical category Region. ( =0) Life. ( =1) Entertainment. ( =2) Society. ( =3) Health. ( =4) Education. ( =5) Computer. ( =6) Commerce. ( =7) Electronics. ( =8)
2683 2076 2424 453 1662 1520 1783 511 706
19.42% 15.02% 17.54% 3.28% 12.03% 11.00% 12.90% 3.70% 5.11%
Posting time 0:00 AM – 06:00 AM (= 1) 06:01 AM – 12:00 PM(= 2) 12:01 PM – 18:00 PM (= 3) 18:01 PM – 23:59 PM (= 0)
2132 3711 3779 4196
15.43% 26.86% 27.35% 30.37%
Table 1: Descriptive statistics for predictor and criterion variables
Q&A February 23–27, 2013, San Antonio, TX, USA
1268
Features Impacting the Response Rate Through the analysis of multiple regression, we successfully tested our proposed hypotheses and determined features with significant impact on the response rate. It only provides us general indication of their associations. To better understand those associations, more in-depth analyses was then conducted for each individual feature. Relevant patterns were documented and are further discussed in the following section.
Feature Coefficient P-value
Constant - .19 < .001* Number of follower .21 < .001* Frequency of posting - .14 < .001* Number of @mention .20 < .001* @mention verified account - .33 < .001* @mention general account .03 < .39 Hashtag - .184 < .001* Emoticon .10 < .001* Repeated punc and interj .03 .06 Gratitude expression .01 .19 Topical category Life - Region Entertainment - Region Society - Region Health - Region Education - Region Computer - Region Commerce - Region
Electronics - Region
− -.0366 - .626 - .37
- .432 - .609 - .226 - .135 -.083
− < .001* < .001*
.574 < .001*
< .001* .029* .132 .170
Posting time 0:00-06:00AM - 18:01– 23:59PM 06:01-12:00PM - 18:01– 23:59PM 12:01-18:00PM - 18:01– 23:59PM
− - .139 .002 .060
− .018* .963 .217
F20, 13797 = 157.33 < .001* R2 = .186 Adjusted R2 = .185
Table 2: Multiple Regression Model Results
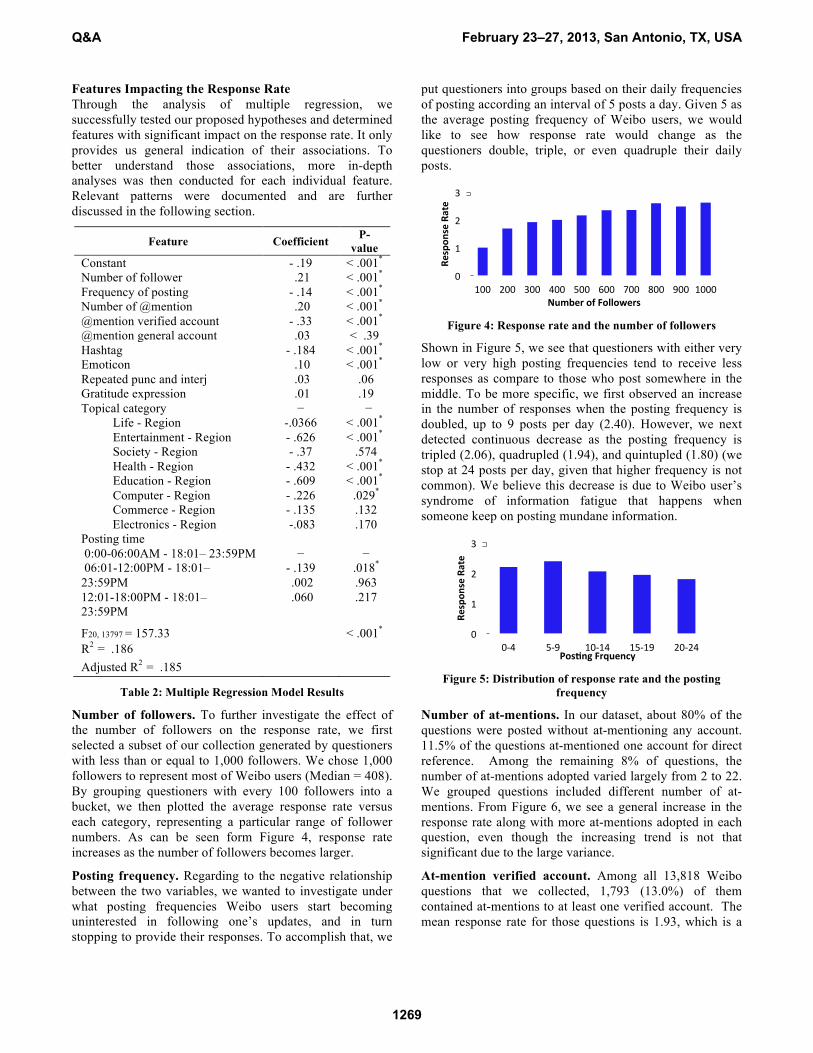
Number of followers. To further investigate the effect of the number of followers on the response rate, we first selected a subset of our collection generated by questioners with less than or equal to 1,000 followers. We chose 1,000 followers to represent most of Weibo users (Median = 408). By grouping questioners with every 100 followers into a bucket, we then plotted the average response rate versus each category, representing a particular range of follower numbers. As can be seen form Figure 4, response rate increases as the number of followers becomes larger.
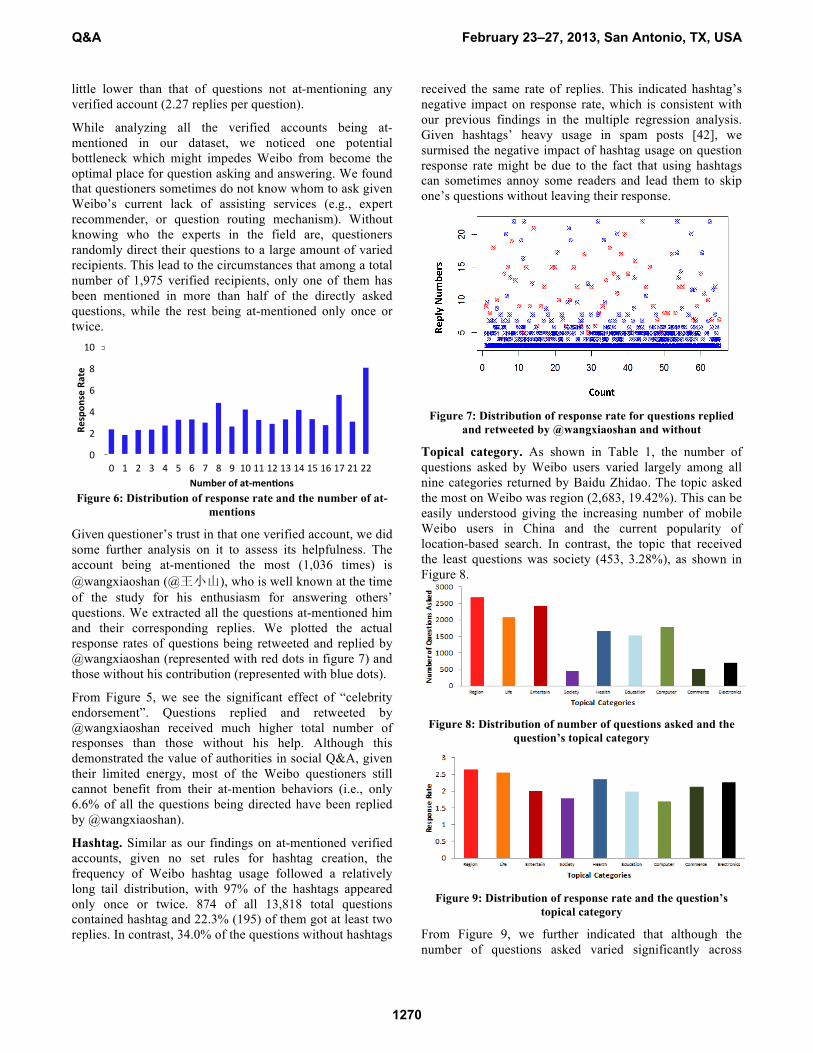
Posting frequency. Regarding to the negative relationship between the two variables, we wanted to investigate under what posting frequencies Weibo users start becoming uninterested in following one’s updates, and in turn stopping to provide their responses. To accomplish that, we
put questioners into groups based on their daily frequencies of posting according an interval of 5 posts a day. Given 5 as the average posting frequency of Weibo users, we would like to see how response rate would change as the questioners double, triple, or even quadruple their daily posts.
Figure 4: Response rate and the number of followers
Shown in Figure 5, we see that questioners with either very low or very high posting frequencies tend to receive less responses as compare to those who post somewhere in the middle. To be more specific, we first observed an increase in the number of responses when the posting frequency is doubled, up to 9 posts per day (2.40). However, we next detected continuous decrease as the posting frequency is tripled (2.06), quadrupled (1.94), and quintupled (1.80) (we stop at 24 posts per day, given that higher frequency is not common). We believe this decrease is due to Weibo user’s syndrome of information fatigue that happens when someone keep on posting mundane information.
Figure 5: Distribution of response rate and the posting
frequency
Number of at-mentions. In our dataset, about 80% of the questions were posted without at-mentioning any account. 11.5% of the questions at-mentioned one account for direct reference. Among the remaining 8% of questions, the number of at-mentions adopted varied largely from 2 to 22. We grouped questions included different number of at-mentions. From Figure 6, we see a general increase in the response rate along with more at-mentions adopted in each question, even though the increasing trend is not that significant due to the large variance.
At-mention verified account. Among all 13,818 Weibo questions that we collected, 1,793 (13.0%) of them contained at-mentions to at least one verified account. The mean response rate for those questions is 1.93, which is a
0
1
2
3
100 200 300 400 500 600 700 800 900 1000
Respon
se Rate
Number of Followers
0
1
2
3
0-‐4 5-‐9 10-‐14 15-‐19 20-‐24
Respon
se Rate
Pos4ng Frquency
Q&A February 23–27, 2013, San Antonio, TX, USA
1269
little lower than that of questions not at-mentioning any verified account (2.27 replies per question).
While analyzing all the verified accounts being at-mentioned in our dataset, we noticed one potential bottleneck which might impedes Weibo from become the optimal place for question asking and answering. We found that questioners sometimes do not know whom to ask given Weibo’s current lack of assisting services (e.g., expert recommender, or question routing mechanism). Without knowing who the experts in the field are, questioners randomly direct their questions to a large amount of varied recipients. This lead to the circumstances that among a total number of 1,975 verified recipients, only one of them has been mentioned in more than half of the directly asked questions, while the rest being at-mentioned only once or twice.
Figure 6: Distribution of response rate and the number of at-mentions
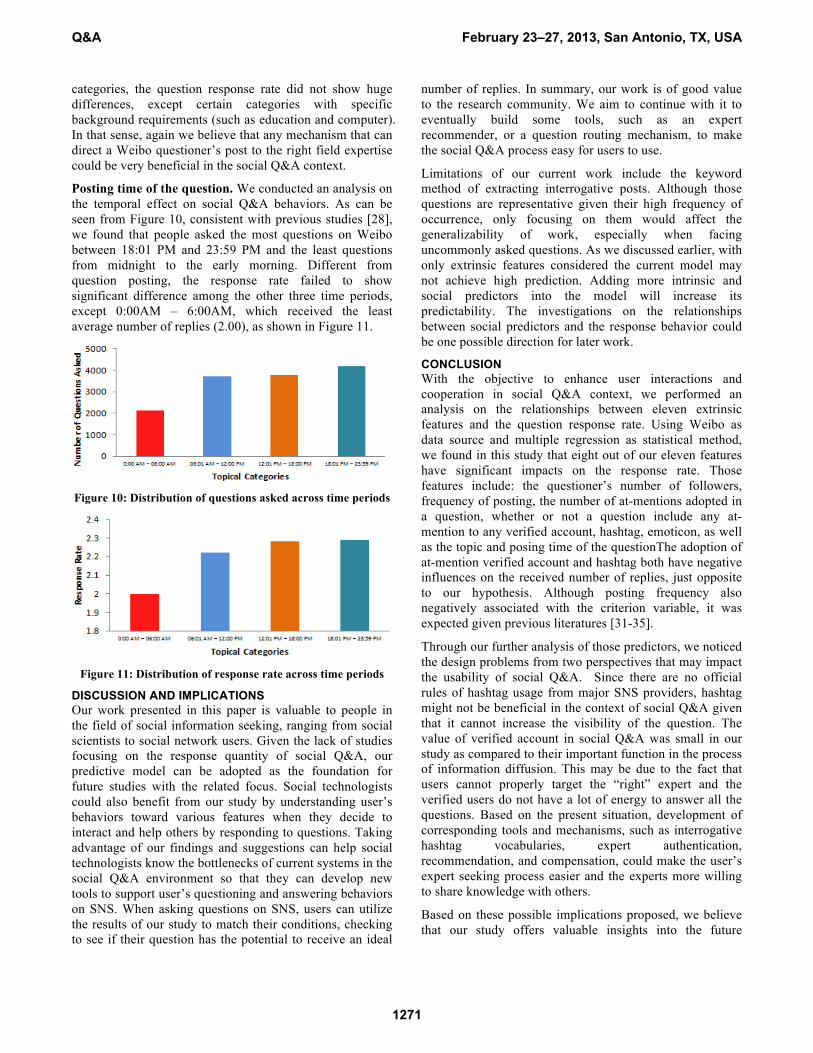
Given questioner’s trust in that one verified account, we did some further analysis on it to assess its helpfulness. The account being at-mentioned the most (1,036 times) is @wangxiaoshan (@王小山), who is well known at the time of the study for his enthusiasm for answering others’ questions. We extracted all the questions at-mentioned him and their corresponding replies. We plotted the actual response rates of questions being retweeted and replied by @wangxiaoshan (represented with red dots in figure 7) and those without his contribution (represented with blue dots).
From Figure 5, we see the significant effect of “celebrity endorsement”. Questions replied and retweeted by @wangxiaoshan received much higher total number of responses than those without his help. Although this demonstrated the value of authorities in social Q&A, given their limited energy, most of the Weibo questioners still cannot benefit from their at-mention behaviors (i.e., only 6.6% of all the questions being directed have been replied by @wangxiaoshan).
Hashtag. Similar as our findings on at-mentioned verified accounts, given no set rules for hashtag creation, the frequency of Weibo hashtag usage followed a relatively long tail distribution, with 97% of the hashtags appeared only once or twice. 874 of all 13,818 total questions contained hashtag and 22.3% (195) of them got at least two replies. In contrast, 34.0% of the questions without hashtags
received the same rate of replies. This indicated hashtag’s negative impact on response rate, which is consistent with our previous findings in the multiple regression analysis. Given hashtags’ heavy usage in spam posts [42], we surmised the negative impact of hashtag usage on question response rate might be due to the fact that using hashtags can sometimes annoy some readers and lead them to skip one’s questions without leaving their response.
Figure 7: Distribution of response rate for questions replied
and retweeted by @wangxiaoshan and without
Topical category. As shown in Table 1, the number of questions asked by Weibo users varied largely among all nine categories returned by Baidu Zhidao. The topic asked the most on Weibo was region (2,683, 19.42%). This can be easily understood giving the increasing number of mobile Weibo users in China and the current popularity of location-based search. In contrast, the topic that received the least questions was society (453, 3.28%), as shown in Figure 8.
Figure 8: Distribution of number of questions asked and the
question’s topical category
Figure 9: Distribution of response rate and the question’s
topical category
From Figure 9, we further indicated that although the number of questions asked varied significantly across
0
2
4
6
8
10
0 1 2 3 4 5 6 7 8 9 10 11 12 13 14 15 16 17 21 22
Respon
se Rate
Number of at-‐men4ons
Q&A February 23–27, 2013, San Antonio, TX, USA
1270
categories, the question response rate did not show huge differences, except certain categories with specific background requirements (such as education and computer). In that sense, again we believe that any mechanism that can direct a Weibo questioner’s post to the right field expertise could be very beneficial in the social Q&A context.
Posting time of the question. We conducted an analysis on the temporal effect on social Q&A behaviors. As can be seen from Figure 10, consistent with previous studies [28], we found that people asked the most questions on Weibo between 18:01 PM and 23:59 PM and the least questions from midnight to the early morning. Different from question posting, the response rate failed to show significant difference among the other three time periods, except 0:00AM – 6:00AM, which received the least average number of replies (2.00), as shown in Figure 11.
Figure 10: Distribution of questions asked across time periods
Figure 11: Distribution of response rate across time periods
DISCUSSION AND IMPLICATIONS Our work presented in this paper is valuable to people in the field of social information seeking, ranging from social scientists to social network users. Given the lack of studies focusing on the response quantity of social Q&A, our predictive model can be adopted as the foundation for future studies with the related focus. Social technologists could also benefit from our study by understanding user’s behaviors toward various features when they decide to interact and help others by responding to questions. Taking advantage of our findings and suggestions can help social technologists know the bottlenecks of current systems in the social Q&A environment so that they can develop new tools to support user’s questioning and answering behaviors on SNS. When asking questions on SNS, users can utilize the results of our study to match their conditions, checking to see if their question has the potential to receive an ideal
number of replies. In summary, our work is of good value to the research community. We aim to continue with it to eventually build some tools, such as an expert recommender, or a question routing mechanism, to make the social Q&A process easy for users to use.
Limitations of our current work include the keyword method of extracting interrogative posts. Although those questions are representative given their high frequency of occurrence, only focusing on them would affect the generalizability of work, especially when facing uncommonly asked questions. As we discussed earlier, with only extrinsic features considered the current model may not achieve high prediction. Adding more intrinsic and social predictors into the model will increase its predictability. The investigations on the relationships between social predictors and the response behavior could be one possible direction for later work.
CONCLUSION With the objective to enhance user interactions and cooperation in social Q&A context, we performed an analysis on the relationships between eleven extrinsic features and the question response rate. Using Weibo as data source and multiple regression as statistical method, we found in this study that eight out of our eleven features have significant impacts on the response rate. Those features include: the questioner’s number of followers, frequency of posting, the number of at-mentions adopted in a question, whether or not a question include any at-mention to any verified account, hashtag, emoticon, as well as the topic and posing time of the questionThe adoption of at-mention verified account and hashtag both have negative influences on the received number of replies, just opposite to our hypothesis. Although posting frequency also negatively associated with the criterion variable, it was expected given previous literatures [31-35].
Through our further analysis of those predictors, we noticed the design problems from two perspectives that may impact the usability of social Q&A. Since there are no official rules of hashtag usage from major SNS providers, hashtag might not be beneficial in the context of social Q&A given that it cannot increase the visibility of the question. The value of verified account in social Q&A was small in our study as compared to their important function in the process of information diffusion. This may be due to the fact that users cannot properly target the “right” expert and the verified users do not have a lot of energy to answer all the questions. Based on the present situation, development of corresponding tools and mechanisms, such as interrogative hashtag vocabularies, expert authentication, recommendation, and compensation, could make the user’s expert seeking process easier and the experts more willing to share knowledge with others.
Based on these possible implications proposed, we believe that our study offers valuable insights into the future
Q&A February 23–27, 2013, San Antonio, TX, USA
1271
development of social search systems or tools that can make good use of those features as introduced in this study.
REFERENCES 1. Twitter.numbers.
http://blog.twitter.com/2011/03/numbers.html. 2. Tsang, J. –A., Gratitude and prosocial behaviour: An
experimental test of gratitude. Cognition & Emotion (2006), 20, 138–148.
3. Yang, J., & Wei, X. Seeking and offering expertise across categories: A sustainable mechanism works for baidu knows. Proceeding of ICWSM (2009).
4. Slinker, B. K., & Glantz, S. A. Multiple regression for physiological data analysis: the problem of multicollinearity. American Journal of Physiology-Regulatory, Integrative and Comparative Physiology (1985), 249(1), R1-R12.
5. Sysomos. Replies and Retweets on Twitter. http://sysomos.com/insidetwitter/engagement/
6. Dent, K., & Paul, S. Through the twitter glass: Detecting questions in micro-text. In Workshop on Analyzing Microtext at the 25th AAAI Conference on Artificial Intelligence (2011).
7. Efron, M., & Winget, M. Questions are content: a taxonomy of questions in a microblogging environment. Proceedings of the American Society for Information Science and Technology (2010), 47(1), 1-10.
8. Evans, B. M., & Chi, E. H. Towards a model of understanding social search. In Proceedings of the 2008 ACM conference on Computer supported cooperative work (2008), pp. 485-494. ACM.
9. Morris, M. R., Teevan, J., & Panovich, K. What do people ask their social networks, and why?: a survey study of status message q&a behavior. In Proceedings of the 28th international conference on Human factors in computing systems (2010), pp. 1739-1748. ACM.
10. Morris, M. R., Teevan, J., & Panovich, K. A comparison of information seeking using search engines and social networks. In Proceedings of the Fourth International AAAI Conference on Weblogs and Social Media (2010).
11. Paul, S. A., Hong, L., & Chi, E. H. Is twitter a good place for asking questions? a characterization study. In Proceedings of ICWSM’11 (2011).
12. Broder, A. A taxonomy of web search. In ACM Sigir forum (2012), 36(2), pp. 3-10. ACM.
13. Teevan, J., Morris, M. R., & Panovich, K. Factors Affecting Response Quantity, Quality, and Speed for Questions Asked via Social Network Status Messages. In Proceedings of ICWSM’11(2011).
14. Adamic, L. A., Zhang, J., Bakshy, E., & Ackerman, M. S. Knowledge sharing and yahoo answers: everyone knows something. In Proceedings of the 17th international conference on World Wide Web (2008), pp. 665-674. ACM.
15. Harper, F. M., Raban, D., Rafaeli, S., & Konstan, J. A. Predictors of answer quality in online Q&A sites. In Proceeding of the twenty-sixth annual SIGCHI conference on Human factors in computing systems (2008), pp. 865-874. ACM.
16. Kleinberg, J. M. Authoritative sources in a hyperlinked environment. Journal of the ACM (JACM) (1999), 46(5), 604-632.
17. Guo, J., Xu, S., Bao, S., & Yu, Y. Tapping on the potential of q&a community by recommending answer providers. In Proceedings of the 17th ACM conference on Information and knowledge management (2008), pp. 921-930. ACM.
18. Raban, D., & Harper, F. Motivations for answering questions online. New Media and Innovative Technologies (2008).
19. Chow, W. S., & Chan, L. S. Social network, social trust and shared goals in organizational knowledge sharing. Information & Management (2008), 45(7), 458-465.
20. Jansen, B. J., Zhang, M., Sobel, K., & Chowdury, A. Twitter power: Tweets as electronic word of mouth. Journal of the American society for information science and technology (2009), 60(11), 2169-2188.
21. Bentwood, J. Distributed Influence: Quantifying the Impact of Social Media. Hentet den (2008), 15.
22. Lin, M. J. J., Hung, S. W., & Chen, C. J. Fostering the determinants of knowledge sharing in professional virtual communities. Computers in Human Behavior (2009), 25(4), 929-939.
23. Cha, M., Haddadi, H., Benevenuto, F., & Gummadi, K. P. Measuring user influence in twitter: The million follower fallacy. In Proceeding of 4th international aaai conference on weblogs and social media (2010), 14(1), p8.
24. Rossi, L., & Magnani, M. Conversation Practices and Network Structure in Twitter. In Sixth International AAAI Conference on Weblogs and Social Media (2012).
25. Kriplean, T., Toomim, M., Morgan, J., Borning, A., & Ko, A. Is this what you meant?: promoting listening on the web with reflect. In Proceedings of the 2012 ACM annual conference on Human Factors in Computing Systems (2012), pp. 1559-1568. ACM.
26. Suh, B., Hong, L., Pirolli, P., & Chi, E. H. Want to be retweeted? large scale analytics on factors impacting retweet in twitter network. In Proceeding of IEEE Second International Conference on Social Computing (2010), pp. 177-184. IEEE.
27. Huang, J., Thornton, K. M., & Efthimiadis, E. N..Conversational tagging in twitter. In Proceedings of the 21st ACM conference on Hypertext and hypermedia (2010), pp. 173-178. ACM.
28. Beitzel, S. M., Jensen, E. C., Chowdhury, A., Frieder, O., & Grossman, D. Temporal analysis of a very large topically categorized web query log. Journal of the American Society for Information Science and Technology (2007), 58(2), 166-178.
29. PCOline, Sina Weibo Statistics http://pcedu.pconline.com.cn/softnews/yejie/1205/2782402.html
30. Granovetter, M. S. The strength of weak ties. American journal of sociology (1973), 1360-1380.
31. Sibona, C., & Walczak, S. Unfriending on Facebook: Friend request and online/offline behavior analysis. In Proceeding of 44th Hawaii International Conference (2011), pp. 1-10. IEEE.
32. Kwak, H., Chun, H., & Moon, S. Fragile online relationship: a first look at unfollow dynamics in twitter. In Proceedings of the 2011 annual conference on Human factors in computing systems (2011), pp. 1091-1100. ACM.
Q&A February 23–27, 2013, San Antonio, TX, USA
1272
33. Reynolds, W. N., Weber, M. S., Farber, R. M., Corley, C., Cowell, A. J., & Gregory, M. Social media and social reality. In Proceeding of 2010 IEEE International Conference on Intelligence and Security Informatics (2010), pp. 221-226. IEEE
34. Gelter, H. Friluftsliv as slow and peak experiences in the transmodern society. In Proceedings from Ibsen Jubliee Friluftsliv Conference (2009). North Trøndelag University College.
35. Oulasvirta, A., Lehtonen, E., Kurvinen, E., & Raento, M. Making the ordinary visible in microblogs. Personal and ubiquitous computing (2010), 14(3), 237-249.
36. Vega, E., Parthasarathy, R., & Torres, J. Where are my tweeps?: Twitter Usage at Conferences. Paper, Personal Information Management class, Virginia Polytechnic Institute and State University (2010).
37. Yang, J., & Counts, S. Predicting the speed, scale, and range of information diffusion in twitter. In Proceeding of ICWSM (201).
38. Comarela, G., Crovella, M., Almeida, V., & Benevenuto, F. Understanding factors that affect response rates in twitter. In Proceedings of the 23rd ACM conference on Hypertext and social media (2012) pp. 123-132. ACM
39. de Souza, C., de Magalhães, J., de Costa, E., & Fechine, J. Predicting potential responders in twitter: a query routing algorithm. Computational Science and Its Applications–ICCSA (2012), pp714-729.
40. Lumbreras, A., and Gavalda, R. Applying trust metrics based on user interactions to recommendation in social networks. In Social Knowledge Discovery and Utilization Workshop (2012).
41. Lo, S. K. (2008). The nonverbal communication functions of emoticons in computer-mediated communication. CyberPsychology & Behavior, 11(5), 595-597
42. Walther, J. B., & D’Addario, K. P. The impacts of emoticons on message interpretation in computer-mediated communication. Social Science Computer Review (2001), 19(3), 324-347
43. Kalman, Y. M., & Gergle, D., CMC Cues Enrich Lean Online Communication: The Case of Letter and Punctuation Mark Repetitions, (2010).
44. Bartlett, M. Y., & DeSteno, D. (2006). Gratitude and Prosocial Behavior Helping When It Costs You. Psychological Science, 17(4), 319-325.
45. Huberman, B. A., Romero, D. M., & Wu, F. Social networks that matter: Twitter under the microscope. First Monday, 14(1). (2008).
46. Demirbas, M., Bayir, M. A., Akcora, C. G., Yilmaz, Y. S., & Ferhatosmanoglu, H. Crowd-sourced sensing and collaboration using twitter. In Proceeding of 2010 IEEE International Symposium on World of Wireless Mobile and Multimedia Networks (2010), pp. 1-9. IEEE.
47. Wakamiya, S., Lee, R., & Sumiya, K. Crowd-based urban characterization: extracting crowd behavioral patterns in urban areas from twitter. In Proceedings of the 3rd ACM SIGSPATIAL International Workshop on Location-Based Social Networks (2011), p10. ACM.
Q&A February 23–27, 2013, San Antonio, TX, USA
1273


![Factors influencing[1]](https://img.pdfslide.net/doc/110x75/54be1c8d4a795948378b4597/factors-influencing1.jpg)